understanding consumption behavior: evidence from
TRANSCRIPT

American Economic Journal: Economic Policy 2017, 9(1): 137–153 https://doi.org/10.1257/pol.20130426
137
Understanding Consumption Behavior: Evidence from Consumers’ Reaction to Shopping Vouchers†
By Kamhon Kan, Shin-Kun Peng, and Ping Wang*
This paper advances our understanding of consumption behavior using the 2009 Taiwan Shopping Voucher Program. This program was universal and well publicized, and its payment to each individual was medium-sized. Based on survey data, it is found that the marginal propensity to consume is about one quarter, which is comparable to findings obtained by previous studies on consumers’ response to fiscal stimulus payments. Further, vendors’ discounts for voucher users played a significant role in boosting the effectiveness of the program. (JEL D12, E21, E62)
This paper revisits the question of consumer response to temporary, anticipated income changes by examining how consumers in Taiwan responded to the 2009
Taiwan Shopping Voucher Program, a US$2.57 billion fiscal stimulus. This pol-icy—undertaken in response to the financial crisis of 2008—has parallels to recent tax rebates in the United States and shopping coupon program in Japan. Although the Taiwanese program’s form of payment was in vouchers, consumers could in effect save them by using the vouchers for planned spending, thus yielding “cash equivalence” arguably similar to tax rebates. Many vendors responded to the pro-gram with various promotions to induce consumers to use their vouchers. The uni-versal coverage, the vouchers’ relatively short expiration period and the secondary market trades, as well as promotions by vendors make the program a distinctive policy experiment for studying consumption behavior.
* Kan: Institute of Economics, Academia Sinica, 128, Section 2, Academia Road, Taipei, Taiwan 11529, and Graduate Institute of Industrial Economics, National Central University (e-mail: [email protected]); Peng: Institute of Economics, Academia Sinica, 128, Section 2, Academia Road, Taipei, Taiwan 11529, and Department of Economics, National Taiwan University (e-mail: [email protected]); Wang: Department of Economics, Washington University in St. Louis, One Brookings Drive, St. Louis, MO 63130, Federal Reserve Bank of St. Louis, and NBER (e-mail: [email protected]). We thank Ying-Hwa Chang and Ruoh-Rong Yu for invaluable assistance in designing the questionnaire and the implementation of the survey, as well as Esther Duflo, Sebastian Galiani, Chang-Tai Hsieh, Ted Miguel, and Chung-Shu Wu, and participants of the 2009 Applied Micro-Economics/Econometrics Conference at Korea University, the 2010 Association of Public Economic Theory Conference, the 2011 North American Summer Meetings of the Econometric Society, and a seminar at Korea University, for helpful comments and suggestions. Financial support from Academia Sinica and the National Science Council (NSC96-2415-H-001-010-MY3, NSC98-2911-H-001-001) that enabled this international collaboration is grate-fully acknowledged. Kamhon Kan thanks the Ministry of Science and Technology for financial support through grant 102-2410-H-001-002-MY3. Needless to say, the usual disclaimer applies. Please address correspondence to Ping Wang.
† Go to https://doi.org/10.1257/pol.20130426 to visit the article page for additional materials and author disclosure statement(s) or to comment in the online discussion forum.

138 AmEricAn Economic JournAL: Economic PoLicy FEBruAry 2017
We conducted a survey to collect individual data through telephone interviews held 3 to 4.5 months after the implementation of the program and 4 months before the expiration of the vouchers. The survey was particularly designed to analyze the specific features of the program by soliciting information on whether the purchases made using vouchers were planned and whether there was additional out-of-pocket spending. In particular, the survey was designed to address the following questions:
• Towhatextentdidthevouchersgenerateunplannedspendingusingthevouch-ers and additional out-of-pocket spending?
• Wouldthepurchaseshavebeenmadeintheabsenceofshoppingvouchersorthe promotions and discounts by vendors?
• Howwasthespendinginthevoucherprogramdistributedacrossdifferentcon-sumption categories?
Our empirical strategy follows closely the work by Sahm, Shapiro, and Slemrod (2010), focusing on a variety of cross tabulations relating consumption behavior to an array of income, financial, and demographic variables. Additionally, the pro-portion of spending using shopping vouchers was evaluated to compute the mar-ginal propensity to consume (MPC). We found that shopping vouchers of value $1 generated $0.24 of unplanned spending. Although the validity period of the vouchers was short, our estimates are comparable to those obtained by previous studies on tax rebates. We found that compared to other respondents, those using the vouchers on necessities rather than durables and services had a significantly lower MPC and less out-of-pocket expenditure; and those who were younger, were better educated or were more optimistic, or had higher family income or more vouchers on hand, or had experienced a rise in family income showed a higher MPC.
Our findings imply that the results of previous studies on consumers’ responses to fiscal stimulus payments are robust. Our results also suggest that for a temporary boost in private consumption, shopping vouchers as a fiscal stimulus instrument are almost as effective as tax rebates in the forms of checks or electronic fund transfers, and more effective than reductions in income tax withholding.
I. Taiwan’s Shopping Voucher Program
Taiwan’s economy was severely affected by the financial tsunami in the fall 2008. In response to this global economic slowdown, many countries introduced fiscal stimuli, in addition to rate cuts and liquidity injection. Fiscal stimulus plans adopted by the G20 countries amounted to 0.5 percent , 1.5 percent , and 1.1 percent of their GDP (PPP weighted average) in 2009, 2010, and 2011, respectively.
Due to its heavy dependence on exports, Taiwan was severely affected by this world-wide recession: its GDP during the fourth quarter of 2008 contracted by 8.36 percent year-on-year. To boost up aggregate demand, the Taiwanese govern-ment launched a NT $500 billion (US $15.38 billion) fiscal stimulus package imple-mented in 2009–2012, which was about 1.01 percent of Taiwan’s annual GDP in 2008. The Shopping Voucher Program was a major part of this package with the

VoL. 9 no. 1 139Kan et al.: Understanding ConsUmption Behavior
total amount distributed being NT $83.51 billion (approximately US$ 2.57 billion), which was about 0.68 percent of Taiwan’s GDP in 2008.
Timing.—The program was approved on December 5, 2008, and immediately announced. The vouchers were disbursed from January 18, 2009. The vouchers expired on September 30, 2009. The shopping vouchers were distributed in several waves. During the first wave, eligible recipients could collect their shopping vouch-ers at specific locations on January 18, 2009. In the second wave, the vouchers could be collected at any post office branch between February 7 and April 30. More than 91 percent of eligible recipients collected their shopping vouchers on the first day of issuance. If there were a significant proportion of respondents who had not used (or planned the usage of) the vouchers, then the MPC estimation could have been biased, because it would be based on early users whose behavior might not be repre-sentative. Thus, the fact that most individuals have already redeemed or planned the usage implies that this potential bias is modest.
Eligibility and Amount.—The program was universal, entitling all citizens (inclu-sive of children) of Taiwan born before March 31, 2009, to shopping vouchers worth NT $3,600 (US $110 ) of two denominations, consisting of six NT$500 bills and three NT$200 bills.
Form of Payment.—Because shopping vouchers are physical in form, similar to the case with Japan’s Shopping Coupon Program and the 2001 US tax rebates paid in checks, the form of payment was highly visible.
Special Features.—The vouchers could not be cashed and change was not allowed for purchases of smaller denominations. However, the vouchers were interpersonally transferable and could be used for purchasing all kinds of goods and services and at registered and nonregistered businesses,1 except the following: (i) public utilities (e.g., water and electricity); (ii) loan principal/interest, bank fees and credit card bills; (iii) purchases of stocks, corporate bonds, warrants, benefi-ciary certificates, insurance policies, and other financial products; and (iv) fines, statutory penalties, taxes, fees payable to the government, premium for social insur-ance programs, and labor insurance premiums. In response to this consumption stimulus, many Taiwanese vendors put forth various promotions and discounts to induce consumers to spend beyond the value of their vouchers and make purchases of unplanned items. (See Table A1 in online Appendix D for a short list of some representative vendors’ promotions and discounts targeted at voucher users.) It was reported that to take advantage of such voucher-tied promotions, some individuals paid a premium to buy vouchers using cash, with the relative price of the vouchers to currency exceeding one. These promotions broke the cash equivalence nature of
1 Only merchants with a valid business registration were able to redeem the vouchers at banks. Nonetheless, in practice, nonregistered businesses also accepted vouchers and used them to purchase goods or services from registered businesses.
140 AmEricAn Economic JournAL: Economic PoLicy FEBruAry 2017
shopping vouchers, making this program a distinctive policy experiment to study how consumers respond to such types of fiscal stimulus.
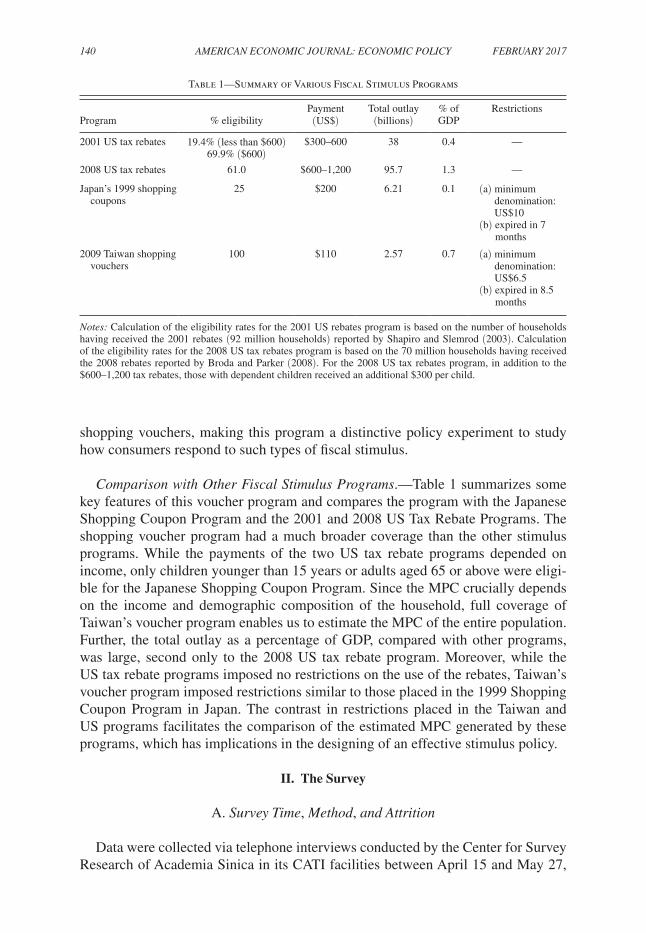
comparison with other Fiscal Stimulus Programs.—Table 1 summarizes some key features of this voucher program and compares the program with the Japanese Shopping Coupon Program and the 2001 and 2008 US Tax Rebate Programs. The shopping voucher program had a much broader coverage than the other stimulus programs. While the payments of the two US tax rebate programs depended on income, only children younger than 15 years or adults aged 65 or above were eligi-ble for the Japanese Shopping Coupon Program. Since the MPC crucially depends on the income and demographic composition of the household, full coverage of Taiwan’s voucher program enables us to estimate the MPC of the entire population. Further, the total outlay as a percentage of GDP, compared with other programs, was large, second only to the 2008 US tax rebate program. Moreover, while the US tax rebate programs imposed no restrictions on the use of the rebates, Taiwan’s voucher program imposed restrictions similar to those placed in the 1999 Shopping Coupon Program in Japan. The contrast in restrictions placed in the Taiwan and US programs facilitates the comparison of the estimated MPC generated by these programs, which has implications in the designing of an effective stimulus policy.
II. The Survey
A. Survey Time, method, and Attrition
Data were collected via telephone interviews conducted by the Center for Survey Research of Academia Sinica in its CATI facilities between April 15 and May 27,
Table 1—Summary of Various Fiscal Stimulus Programs
Payment Total outlay % of RestrictionsProgram % eligibility (US$) (billions) GDP
2001 US tax rebates 19.4% (less than $600) $300–600 38 0.4 — 69.9% ($600)2008 US tax rebates 61.0 $600–1,200 95.7 1.3 —
Japan’s 1999 shopping coupons
25 $200 6.21 0.1 (a) minimum denomination: US$10
(b) expired in 7 months
2009 Taiwan shopping vouchers
100 $110 2.57 0.7 (a) minimum denomination: US$6.5
(b) expired in 8.5 months
notes: Calculation of the eligibility rates for the 2001 US rebates program is based on the number of households having received the 2001 rebates (92 million households) reported by Shapiro and Slemrod (2003). Calculation of the eligibility rates for the 2008 US tax rebates program is based on the 70 million households having received the 2008 rebates reported by Broda and Parker (2008). For the 2008 US tax rebates program, in addition to the $600–1,200 tax rebates, those with dependent children received an additional $300 per child.

VoL. 9 no. 1 141Kan et al.: Understanding ConsUmption Behavior
2009.2,3 The statistics released by the government (Council for Economic Planning and Development) indicated that more than 99 percent of eligible recipients col-lected their shopping vouchers at the start of the survey.
The unit of analysis for the survey was the individual (rather than the house-hold), and the sample frame comprised all adults (i.e., aged 18 or above) with a telephone at their residence. The targeted sample size was 4,000, and actual num-ber of interviews completed was 3,832. In all, 28,000 calls were made, of which 15,922 (56.87 percent) were not completed because of reasons such as the num-bers were not in service, the calls were not answered, the calls were answered by a fax machine or an answering machine, and the lines were busy. Among the 12,077 (43.13 percent) answered calls, 1,888 (15.63 percent) reached nonresidential units, 4,816 (17.20 percent) were refused, and 1,095 did not reach the within-household sampled individuals (absent at the time).4 The refusal rate was 19.79 percent (Table A2 in online Appendix D).
Each completed interview required an average of 19 minutes and 17 seconds (survey questionnaire in online Appendix A). Among these 3,832 respondents, all had collected their vouchers; 3,345 had reported having shopping vouchers at their disposal;5 3,309 reported nonmissing values on shopping voucher usage; and 3,187 had partially or fully used their shopping vouchers. To solicit information about how interviewees used their shopping vouchers, we asked what items they had pur-chased. After excluding respondents who reported “don’t know” or refused to report on the items they purchased, we identified 2,910 respondents for further analysis.
B. General Spending Pattern Questions
Respondents were asked whether they had used their vouchers on any of 14 cat-egories of items. Ideally, respondents should have been asked about the nature and amount of spending on each of the 14 categories. However, this was not practical for telephone interviews since respondents could discontinue the interview or may not respond seriously if the questions are too difficult to answer. Therefore, we grouped the items into four broad categories and asked about the nature and total amount spent on three of these categories. The four broader categories were largely consis-tent with those of the Survey of Family income and Expenditure (SFIE) conducted by the Directorate-General of Budget, Accounting, and Statistics (DGBAS), Taiwan, R.O.C.: (A) necessities, (B) durables, (c) services, and ⟨D⟩ others. To determine the value of spending on the categories (A) – (c) and the total value of shopping vouch-ers used, we asked the respondents to select a range within which the actual amount
2 By the time our survey was conducted, more than 99 percent of the vouchers had been distributed. At the time when the survey was conducted a majority of vouchers were either redeemed or planned for usage already.
3 A caveat of our one-time survey methodology is that we are not able to analyze the dynamics of spending pat-terns. However, a majority (more than 90 percent) of vouchers were used by the time of the survey. This is compa-rable to previous studies. For example, in Sahm, Shapiro, and Slemrod (2010), about 86 percent were spent within the first 3 months, whereas the comparable figure in Hsieh, Shimizutani, and Hori (2010) was about 80 percent.
4 A specific member of a sampled household was selected by the interviewer using a randomly assigned respon-dent selection table. This is similar to the University of Michigan’s Survey of Consumers.
5 Respondents were asked whether their vouchers were at their own disposal or given to their household mem-bers or others. See question Q6 in online Appendix A.

142 AmEricAn Economic JournAL: Economic PoLicy FEBruAry 2017
fell. For category (D) , most of the spending, such as tuition, rents, and medicine, was planned and was therefore excluded from the MPC calculation.
C. income, Financial conditions, and Demographics
Additionally, respondents were asked whether they had labor income in the previous month and if they did, then how much, including wages, bonuses, over-time payments, and other labor incomes. Respondents were also asked about their spousal income. The average monthly family labor income of the respondents was NT$31,614, which is similar to the average two-person monthly household labor income of NT$27,930 reported by the 2009 SFIE.
Table 2 presents the summary statistics of the data of 2,910 respondents who had used at least some of their shopping vouchers on hand and provided valid responses on their usage. Notably, about 15.5 percent and 25.7 percent of the respondents had completed elementary school or lower and four-year college or above, respectively ( 10.2 percent and 23.0 percent , respectively, in 2009 SFIE). Thus, our respondents had slightly better education than the average Taiwanese individual. Our sample had an age structure similar to that noted in 2009 SFIE: 12.92 percent were aged 29 or younger, 21.54 percent were 30–39, and 65.55 percent were aged 40 or older. The corresponding figures in the 2009 SFIE were 16.06 percent, 22.53 percent, and 61.41 percent. Thus, overall, our sample was reasonably representative.
D. Special Features
Vendor Promotions.—As discussed in Section I, many vendors introduced pro-motions as incentive for consumers to purchase more than planned.
out-of-Pocket Spending.—Respondents were asked whether the total amount spent exceeded the value of their vouchers and if “yes,” how much. The need for out-of-pocket spending could be any of the following: (i) the vouchers were of fixed denominations of NT$200 and NT$500 and the indivisibility led to extra spending or (ii) the value of the items purchased exceeded that of the vouchers required top-ping up.
III. Empirical Evidence
In this section, we compute the MPC and examine the MPC and the spending pat-terns using cross tabulations of survey responses. (See Tables A6 and A7 of online Appendix D for multivariate analysis results, which suggest that including controls does not alter the main findings.)
A. Distribution of Survey respondents in Spending Patterns
Most respondents purchased groceries (56.4 percent) and household necessities (62.7 percent), and 70.3 percent of them purchased either or both these items. More than half of the respondents used their vouchers on durables. While the percentage

VoL. 9 no. 1 143Kan et al.: Understanding ConsUmption Behavior
of respondents purchasing toys and books is small (9.7 percent), whereas those pur-chasing apparel (33.2 percent) and consumer durables (29.0 percent) are compara-ble. Slightly less than a quarter of the respondents spent the vouchers on services. Only 16.0 percent of them used vouchers for other purposes (details in Table A3 in online Appendix D).
To understand the nature of spending the vouchers, we analyzed whether the pur-chase would have been made even without the shopping vouchers (questions Q12_1, Q13_1, and Q14_1) and whether the items purchased were more or less expensive than the amounts they had intended to spend (questions Q12_2, Q13_2, and Q14_2). Descriptive statistics of the responses to the questions, provided in Table 3, indicate that the items purchased were mostly planned. Interestingly, excluding spending for mixed reasons, only 10.6 percent and 5.9 percent , respectively, of the items in the necessities category were purchased because of the availability of the shopping vouchers and vendors’ discounts (i.e., unplanned). The corresponding figures for durables were 26.6 percent and 9.7 percent , and those for services 24.0 percent and 16.8 percent , respectively.
Further, many respondents indicated a mixed nature of items purchased in the three categories (i.e., indicated (4) in questions Q12_1, Q13_1, and Q14_1). We used the responses to questions Q12_2, Q13_2, and Q14_2 regarding whether the purchased items were more or less expensive than the planned amount to determine the nature of these purchases. Only respondents who indicated that their purchases were induced by the availability of shopping vouchers, vendors’ promotions/dis-counts, or mixed reasons were required to answer this question. The purchases made by respondents giving a definitive answer to questions Q12_2, Q13_2, and Q14_2
Table 2—Summary Statistics
Respondent characteristic Mean
Age Age ≤ 29 0.129Aged 30–39 0.215Aged 40–49 0.288Aged 50–59 0.191
Aged 60 or above 0.177
Education Elementary school (elementary school or below) 0.155High school (junior or senior high school) 0.588
College (college or above) 0.257
Married Yes 0.707
Have young children ( <18 ) Yes 0.425
Female Yes 0.573
Economy in 2010 Optimistic about Taiwan’s economy 0.109Neither optimistic, nor pessimistic 0.636
Pessimistic 0.149Don’t know 0.102
Income increased in 2009? Yes (respondent with nonzero labor income) 0.220
Family income Missing 0.246
No income 0.356Respondent and spouse’s total labor income (monthly, in ten thousand TWD) 3.161
Observations 2,910
note: Based on all individuals who have used shopping vouchers and provided valid responses to the usage of their shopping vouchers.

144 AmEricAn Economic JournAL: Economic PoLicy FEBruAry 2017
(i.e., (1) “more expensive,’’ (2) “less expensive,’’ or (3) “about the same’’) were likely to be planned.
Table 3 shows, based on answers to questions Q12_2, Q13_2, and Q14_2, 19.5 percent , 37.4 percent , and 43.9 percent of the respondents purchased items in the categories of necessities, durables, and services because of the availability of vouchers or discounts. These figures are slightly higher than those indicating that the purchases were made because of the availability of shopping vouchers and ven-dors’ promotions combined (respondents indicating (2) or (3) to questions Q12_1, Q13_1 and Q14_1 being 16.9 percent , 35.6 percent , and 40.4 percent , respectively). This implies that the majority of the respondents who indicated a mixed nature of purchases would have made those purchases.
Most of the respondents, who gave a definitive answer to questions Q12_2, Q13_2, and Q14_2, indicated that the prices of the items purchased were about the same as those originally planned (68.1 percent , 46.1 percent , and 44.0 percent , respectively, among respondents who purchased items in the categories of necessi-ties, durables, and services, respectively). This implies that they did not purchase better quality items than originally planned. The proportions of respondents report-ing purchase of more expensive items (i.e., with better quality) than planned were low: only 2.3 percent , 2.9 percent , and 6.8 percent, respectively, for the three cate-gories. This indicates that the availability of vouchers did not induce consumers to upgrade the quality of the purchases that were planned.
Respondents were asked how much they spent out-of-pocket when using their shopping vouchers. The majority of our respondents ( 84.6 percent ) had spent extra money, but not in very large amounts. Among those who spent out-of-pocket money, only slightly over 20 percent spent more than NT $4, 000 out-of-pocket. (See Table A4 in online Appendix D for the frequency distribution of out-of-pocket spending.)
Table 3—The Nature of Purchases Using Shopping Vouchers
Nature of purchases Necessities Durables Services Overall
Panel A. Were the purchases originally planned? (Questions Q12_1, Q13_1, and Q14_1 in the questionnaire.)(1) Would have purchased even without shopping vouchers 0.681 0.498 0.469 0.564(2) Purchased due to shopping vouchers 0.105 0.258 0.246 0.194(3) Purchased due to discounts 0.064 0.097 0.158 0.103(4) Purchased as originally planned and also because of having
shopping vouchers and discounts0.151 0.145 0.128 0.158
Panel B. Were the items purchased more or less expensive than originally planned? (Questions Q12_2, Q13_2, and Q14_2 in the questionnaire. Respondents answering (1) or (4) to questions Q12_1, Q13_1, and Q14_1 were asked.)(1) More expensive than originally planned 0.023 0.029 0.068 0.040(2) Less expensive than originally planned 0.102 0.136 0.072 0.124(3) About the same 0.681 0.461 0.440 0.546(4) Don’t know/others 0.026 0.018 0.016 0.026(5) Question skipped 0.169 0.356 0.404 0.963
notes: The numbers in the first three columns are are based on respondents who have used shopping vouchers to purchase items in a given category. Numbers in the fourth column (Overall) are based on all respondents who have used shopping vouchers to purchase necessities, durables, or services, and the percentage refers to the respondents who indicated a particular response in any of the categories. A respondent would skip a question on whether or not the purchased items were more or less expensive than originally planned (Q12_2, Q13_2, or Q14_2) if the pur-chases in the relevant category were not planned.

VoL. 9 no. 1 145Kan et al.: Understanding ConsUmption Behavior
Further analysis of what determines voucher spending helps us better understand consumer reaction to shopping vouchers. Cross tabulation of socioeconomic charac-teristics and the spending share in each category of spending is presented in Table 4. Information on voucher spending for other uses (i.e., category (D) ) was not col-lected in the survey. Its share was backed out from the spending shares of the other three broad categories. Table 4 shows that our sample respondents spent most of their vouchers on necessities (48.6 percent) and the least on services (8.6 percent) and other items (8.3 percent).
B. computing the marginal Propensity to consume
We then computed the MPC when using the vouchers (see equation (1)).
(1) mPc = ∑ j=A, B, c
u j × v j _ V ,
where v j denotes the midpoint of the range of spending on a particular category of consumption indicated by a respondent; u j is a binary variable indicating whether the spending was induced by the availability of vouchers; and u j equals 0 if a respon-dent indicates the items would have been purchased even without receiving the shopping vouchers, using information from answers to questions Q12_1, Q13_1, Q14_1, Q12_2, Q13_2, and Q14_2 (Table 3). Notably, because vouchers could not be saved, those remaining unused would be eventually spent; therefore, we consid-ered the total value of vouchers used, rather than received, as the base for computing the MPC.
The sample averages of our MPC estimates are provided in Table 5. In column 1 of Table 5, the estimates show that 0.243 of the voucher spending was new.6,7,8 In reference to our MPC estimate of 0.243, the effectiveness of Taiwan’s voucher program is slightly weaker than that of the 2001 and 2008 US tax rebate programs, which yielded implied MPC estimates of 0.34–0.372 and 0. 3–0.35, respectively (Shapiro and Slemrod 2003 and 2009). Our estimates are, however, comparable to those obtained for the US reduction in withholding and the MPC estimates of 0.2–0.4 obtained by Johnson, Parker, and Souleles (2006) for the 2001 US tax rebates program.
Taiwan’s program was not more effective than the US rebate programs despite being well publicized. Sahm, Shapiro, and Slemrod (2012) examined the impact
6 The reader is referred to our working paper Kan, Peng, and Wang (2016) with an Appendix containing econo-metric analysis with interval regression to account for the discreteness of the amounts of voucher spending that yields very similar MPC estimates, thereby reconfirming our findings in Table 5.
7 Some estimates of the MPC exceed unity, probably because of recall/reporting error. To see how this error affects our estimates, we make the following adjustments to obtain an alternative set of estimates: (i) Use the sum of the reported voucher spending as the total voucher spending for respondents who reported having used no vouchers on other items (category (D ) ) ; (ii) Drop the observation when a respondent reported having spent on category (D) (others) and the sum of the estimates of voucher spending on necessities, durables, and service is greater than the estimate of total voucher spending. The MPC estimates, reported in Table A5 in online Appendix D, show that the correction does not make a difference.
8 Our results on MPC are consistent with the aggregate data on retail sales. By counterfactual analysis, we find that the program raised the aggregate cumulated retail sales growth rate by 10.02 percent over the first 4 months of 2009.

146 AmEricAn Economic JournAL: Economic PoLicy FEBruAry 2017
Table 4—Share of Spending on Different Categories of Consumption and Demographic Variables
Spending share
Necessities Durables Service Others(1) (2) (3) (4)
Sample average 0.486 0.345 0.086 0.083(0.008) (0.007) (0.004) (0.004)
Age Below 30 0.378 0.457 0.099 0.066
(0.021) (0.021) (0.012) (0.011) 30–39 0.448 0.381 0.108 0.064
(0.015) (0.015) (0.009) (0.008) 40–49 0.473 0.358 0.084 0.086
(0.013) (0.013) (0.007) (0.008) 50–59 0.521 0.311 0.075 0.093
(0.018) (0.017) (0.009) (0.011) 60 and above 0.604 0.227 0.065 0.104
(0.019) (0.017) (0.010) (0.0013) p -value = 0.000 p -value = 0.000 p -value = 0.006 p -value = 0.021
Education Elementary school 0.672 0.184 0.035 0.109
(0.020) (0.016) (0.008) (0.014) High school 0.484 0.348 0.083 0.085
(0.009) (0.009) (0.005) (0.006) College 0.387 0.427 0.122 0.064
(0.014) (0.015) (0.009) (0.008) p -value = 0.000 p -value = 0.000 p -value = 0.000 p -value = 0.005
Family income No income 0.556 0.293 0.067 0.084
(0.013) (0.012) (0.064) (0.008) First quartile 0.489 0.366 0.056 0.090
(0.024) (0.023) (0.010) (0.014) Second and third 0.488 0.368 0.067 0.077 quartiles (0.017) (0.017) (0.008) (0.009) Fourth quartile 0.369 0.415 0.130 0.086
(0.020) (0.022) (0.014) (0.013) Income missing 0.453 0.352 0.106 0.088 (0.015) (0.015) (0.009) (0.009)
p -value = 0.000 p -value = 0.000 p -value = 0.000 p -value = 0.717Income increased in 2009? Yes 0.459 0.365 0.080 0.097
(0.015) (0.015) (0.008) (0.009) No 0.493 0.340 0.088 0.079
(0.009) (0.008) (0.005) (0.005) p -value = 0.052 p -value = 0.146 p -value = 0.352 p -value = 0.074
Vouchers on hand Below NT$4,000 0.505 0.333 0.070 0.093
(0.013) (0.012) (0.006) (0.007) NT$4,001–$16,000 0.475 0.345 0.102 0.078
(0.010) (0.010) (0.006) (0.006) Above $16,001 0.459 0.392 0.082 0.067
(0.020) (0.020) (0.009) (0.010) p -value = 0.077 p -value = 0.046 p -value = 0.001 p -value = 0.107
Economy in 2010 Optimistic 0.478 0.347 0.086 0.090
(0.023) (0.022) (0.012) (0.014) Similar as 2009 0.463 0.365 0.095 0.077
(0.009) (0.009) (0.005) (0.005) Pessimistic 0.501 0.331 0.074 0.094
(0.020) (0.019) (0.010) (0.012) Don’t know/refuse 0.622 0.233 0.048 0.097
(0.026) (0.023) (0.010) (0.017) p -value = 0.000 p -value = 0.000 p -value = 0.000 p -value = 0.462
notes: Sample means are reported. Standard errors are in parentheses. p-value is for the F-test of equality means.

VoL. 9 no. 1 147Kan et al.: Understanding ConsUmption Behavior
of forms of stimulus payment in the 2008 and 2009 US programs and found that the visibility of the payments influences a program’s effectiveness in generating new spending. The lower MPC generated by Taiwan’s voucher program may be attributed to consumers in Taiwan being more frugal than those in the United States, as exemplified by the higher personal savings rate in Taiwan (21.21 percent versus 7.2 percent in the United States in 2012). Moreover, although Japan’s savings rate (19 percent in 2012) is similar to that in Taiwan, its Shopping Coupon Program generated a lower MPC than Taiwan’s program.
It would be worthwhile to determine how important vendors’ discounts were in encouraging spending, and what the net effect of shopping vouchers per se was. To this end, we computed another estimate of the MPC under a hypothetical scenario where there were no discounts by vendors or shops. For this, we assumed a respon-dent’s spending on a category as planned if he/she indicated that the spending was made due to discounts.9 The results are shown in column 2 of Table 5. In the absence of discounts, the MPC dropped by 7.82 percentage points to 0.164. This suggests that the vendors’ promotions played an important role in boosting the effectiveness of the voucher program and that had the government launched a tax rebate program, instead of the shopping voucher program, the effectiveness would have been much lower. (See online Appendix C for an analysis of how the voucher program affects retail sales.)
We next examined how the MPC varies with respondents’ demographic and eco-nomic characteristics. Column 1 of Table 6 shows that those who were younger and better educated had a significantly higher MPC. However, even though those who were optimistic about the economy in 2010 and those who had more vouchers on hand had a higher MPC, the differences are not statistically significant. Moreover, the MPC is irresponsive to family income or an increase in family income.
Columns 2 and 3 of Table 6 report the MPC conditional on whether any purchase using vouchers was induced by vendors’ discounts (i.e., respondents indicating (3) or (4) in answering Q12_2, Q13_2, or Q14_2). Respondents having used any vouchers because of discounts have a much higher MPC. Moreover, the variations in
9 Some respondents’ purchases using shopping vouchers were for mixed reasons (i.e., induced by shopping vouchers or discounts, or originally planned). While we are able to determine whether these purchases were origi-nally planned, we are not able to determine whether these unplanned purchases were induced by shopping vouchers or discounts. For respondents who used shopping vouchers with mixed reasons and whose purchases were most likely unplanned, we assume that their purchases were not induced by discounts. By doing so, the impact of dis-counts may be underestimated. This bias is likely to be very small though because there is only a very small propor-tion of respondents whose purchases were most likely unplanned among respondents who used shopping vouchers with mixed reasons. See Table 3 and related discussions.
Table 5—Marginal Propensity to Consume
mPc mPc (excluding effects of discounts)(1) (2)
Estimate 0.243 0.164(0.007) (0.006)
Observations 2,910 2,910
note: Standard errors are in parentheses.

148 AmEricAn Economic JournAL: Economic PoLicy FEBruAry 2017
Table 6—Marginal Propensity to Consume and Demographic Variables
mPc
Induced by discounts Not induced by discounts(1) (2) (3)
Unconditional mean 0.243 0.351 0.200(0.007) (0.014) (0.008)
Age Below 30 0.339 0.510 0.259
(0.022) (0.040) (0.026) 30–39 0.262 0.357 0.219
(0.015) (0.029) (0.018) 40–49 0.229 0.305 0.198
(0.013) (0.025) (0.015) 50–59 0.208 0.299 0.172
(0.016) (0.033) (0.018) 60 and above 0.203 0.336 0.168
(0.018) (0.044) (0.019) p -value = 0.000 p -value = 0.000 p -value = 0.012
Education Elementary school 0.211 0.278 0.198
(0.020) (0.050) (0.021) High school 0.240 0.329 0.203
(0.009) (0.018) (0.011) College 0.266 0.414 0.194
(0.015) (0.027) (0.016) p -value = 0.059 p -value = 0.010 p -value = 0.895
Family income No income 0.236 0.359 0.197
(0.013) (0.028) (0.014) First quartile 0.252 0.764 0.193
(0.024) (0.049) (0.023) Second and third 0.256 0.342 0.223 quartiles (0.017) (0.033) (0.019) Fourth quartile 0.245 0.351 0.193
(0.021) (0.039) (0.024) Income missing 0.225 0.322 0.178 (0.014) (0.027) (0.016)
p -value = 0.408 p -value = 0.602 p -value = 0.565Income increased in 2009? Yes 0.249 0.312 0.222
(0.015) (0.029) (0.018) No 0.241 0.363 0.193
(0.008) (0.017) (0.009) p -value = 0.635 p -value = 0.134 p -value = 0.139
Vouchers on hand Below NT$4,000 0.237 0.396 0.189
(0.012) (0.027) (0.012) NT$4,001–$16,000 0.241 0.315 0.207
(0.010) (0.019) (0.012) Above $16,001 0.270 0.369 0.215
(0.021) (0.036) (0.025) p -value = 0.353 p -value = 0.036 p -value = 0.452
Economy in 2010 Optimistic 0.250 0.343 0.200
(0.023) (0.038) (0.028) Similar as 2009 0.251 0.351 0.209
(0.009) (0.018) (0.010) Pessimistic 0.212 0.376 0.160
(0.018) (0.042) (0.019) Don’t know/refuse 0.229 0.336 0.203
(0.024) (0.060) (0.026) p -value = 0.328 p -value = 0.752 p -value = 0.331
notes: Sample means are reported. Numbers in column 2 are the averages for respondents indicating that their use of vouchers on necessities, durables or services was induced by discounts for voucher users. Numbers in column 3 are those for respondents not induced by discounts. Standard errors are in parentheses. p -value is for the F -test of equality of means.
VoL. 9 no. 1 149Kan et al.: Understanding ConsUmption Behavior
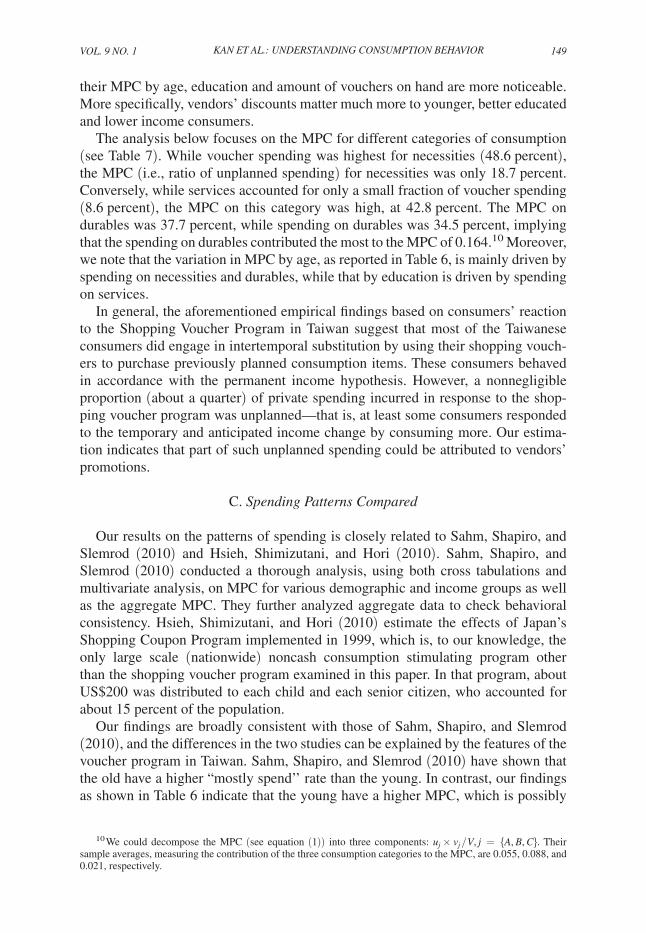
their MPC by age, education and amount of vouchers on hand are more noticeable. More specifically, vendors’ discounts matter much more to younger, better educated and lower income consumers.
The analysis below focuses on the MPC for different categories of consumption (see Table 7). While voucher spending was highest for necessities (48.6 percent), the MPC (i.e., ratio of unplanned spending) for necessities was only 18.7 percent. Conversely, while services accounted for only a small fraction of voucher spending (8.6 percent), the MPC on this category was high, at 42.8 percent. The MPC on durables was 37.7 percent, while spending on durables was 34.5 percent, implying that the spending on durables contributed the most to the MPC of 0.164.10 Moreover, we note that the variation in MPC by age, as reported in Table 6, is mainly driven by spending on necessities and durables, while that by education is driven by spending on services.
In general, the aforementioned empirical findings based on consumers’ reaction to the Shopping Voucher Program in Taiwan suggest that most of the Taiwanese consumers did engage in intertemporal substitution by using their shopping vouch-ers to purchase previously planned consumption items. These consumers behaved in accordance with the permanent income hypothesis. However, a nonnegligible proportion (about a quarter) of private spending incurred in response to the shop-ping voucher program was unplanned—that is, at least some consumers responded to the temporary and anticipated income change by consuming more. Our estima-tion indicates that part of such unplanned spending could be attributed to vendors’ promotions.
C. Spending Patterns compared
Our results on the patterns of spending is closely related to Sahm, Shapiro, and Slemrod (2010) and Hsieh, Shimizutani, and Hori (2010). Sahm, Shapiro, and Slemrod (2010) conducted a thorough analysis, using both cross tabulations and multivariate analysis, on MPC for various demographic and income groups as well as the aggregate MPC. They further analyzed aggregate data to check behavioral consistency. Hsieh, Shimizutani, and Hori (2010) estimate the effects of Japan’s Shopping Coupon Program implemented in 1999, which is, to our knowledge, the only large scale ( nationwide) noncash consumption stimulating program other than the shopping voucher program examined in this paper. In that program, about US $200 was distributed to each child and each senior citizen, who accounted for about 15 percent of the population.
Our findings are broadly consistent with those of Sahm, Shapiro, and Slemrod (2010), and the differences in the two studies can be explained by the features of the voucher program in Taiwan. Sahm, Shapiro, and Slemrod (2010) have shown that the old have a higher “mostly spend’’ rate than the young. In contrast, our findings as shown in Table 6 indicate that the young have a higher MPC, which is possibly
10 We could decompose the MPC (see equation (1)) into three components: u j × v j / V, j = { A, B, c} . Their sample averages, measuring the contribution of the three consumption categories to the MPC, are 0.055, 0.088, and 0.021, respectively.

150 AmEricAn Economic JournAL: Economic PoLicy FEBruAry 2017
Table 7—MPC on Different Categories of Consumption and Demographic Variables
mPc (proportion of unplanned spending)Necessities Durables Services
(1) (2) (3)Unconditional mean 0.187 0.377 0.428
(0.009) (0.012) (0.019)Age Below 30 0.308 0.449 0.467
(0.031) (0.031) (0.052) 30–39 0.200 0.403 0.412
(0.019) (0.024) (0.036) 40–49 0.158 0.356 0.423
(0.015) (0.021) (0.033) 50–59 0.175 0.342 0.402
(0.019) (0.028) (0.049) 60 and above 0.157 0.333 0.484
(0.019) (0.036) (0.064) p -value = 0.000 p -value = 0.029 p -value = 0.759
Education Elementary school 0.170 0.414 0.344
(0.021) (0.043) (0.085) High school 0.186 0.373 0.455
(0.011) (0.015) (0.024) College 0.203 0.377 0.390
(0.019) (0.022) (0.033) p -value = 0.792 p -value = 0.416 p -value = 0.023
Family income No income 0.190 0.386 0.388
(0.014) (0.022) (0.036) First quartile 0.216 0.404 0.400
(0.029) (0.037) (0.070) Second and third 0.205 0.404 0.420 quartiles (0.020) (0.026) (0.047) Fourth quartile 0.168 0.336 0.462
(0.026) (0.031) (0.049) Income missing 0.173 0.345 0.408 (0.018) (0.024) (0.037)
p -value = 0.795 p -value = 0.301 p -value = 0.366Income increased in 2009? Yes 0.186 0.385 0.415
(0.018) (0.024) (0.042) No 0.187 0.375 0.432
(0.010) (0.014) (0.022) p -value = 0.975 p -value = 0.723 p -value = 0.728
Vouchers on hand Below NT$4,000 0.189 0.375 0.434
(0.014) (0.020) (0.037) NT$4,001–$16,000 0.173 0.396 0.411
(0.012) (0.017) (0.025) Above $16,001 0.228 0.323 0.481
(0.026) (0.029) (0.049) p -value = 0.121 p -value = 0.107 p -value = 0.429
Economy in 2010 Optimistic 0.206 0.328 0.533
(0.027) (0.034) (0.058) Similar as 2009 0.188 0.388 0.440
(0.011) (0.014) (0.023) Pessimistic 0.164 0.356 0.299
(0.021) (0.031) (0.049) Don’t know/refuse 0.193 0.404 0.387
(0.029) (0.050) (0.089) p -value = 0.792 p -value = 0.416 p -value = 0.023
notes: Sample means are reported. Standard errors are in parentheses. p -value is for the F -test of equality of means.

VoL. 9 no. 1 151Kan et al.: Understanding ConsUmption Behavior
because the young may be more susceptible to promotions by vendors. Similar to the findings of Sahm, Shapiro, and Slemrod (2010), our results showed no statistically significant relationship between income/financial conditions and MPC. However, the more educated, who were better informed about promotions and discounts, were likely to spend on unplanned items. Also similar to Sahm, Shapiro, and Slemrod (2010), the more optimistic ones have a higher MPC than the pessimistic ones.
Our results (Table 7) are similar to those reported by Hsieh, Shimizutani, and Hori (2010), who reported modest MPC estimates, in some cases close to zero, on nondurables/services and values of 0.1–0.2 on semi-durables. Similar to their findings, we noted a higher MPC on durables than nondurables (necessities in our study). In contrast, our MPC is by and large higher than the comparable figures in Hsieh, Shimizutani, and Hori (2010). Our MPC on necessities is almost one-fifth and that on services is more than two-fifths. Our higher MPC estimates are likely due to the effect of promotions by vendors, which also enhanced the visibility of the vouchers and further boosted up consumers’ propensity to spend.
D. comparison to Previous Studies
Our paper is related to a new branch of the literature that examines how con-sumers react to large or small changes in anticipated income, focusing on esti-mating the MPC. Souleles (2002) analyzes US consumers’ responses to President Reagan’s pre-announced tax cuts in 1982 and 1983 and obtains an unusually high MPC of 0.9 , albeit with large standard errors. Using credit card data, Gross and Souleles (2002) have shown that while those close to the limits (i.e., more likely to be liquidity constrained) responded more sensitively to credit supply, those well below the limits still had a significantly positive MPC, with the average MPC being about 0.10–0.14.
Using the Consumer Expenditure Survey (CEX), Johnson, Parker, and Souleles (2006) noted that in 2001 households spent 20–40 percent of their tax rebates on nondurables within three months and about two-thirds cumulatively within six months. On investigating consumers’ responses to the US tax rebates in 2001, Agarwal, Liu, and Souleles (2007) utilized credit card data and noted that con-sumers initially saved the rebates by increasing their credit card payments, but afterward spent about 40 percent of the rebates cumulatively over 9 months; the stimulated spending amounts were higher for those who were liquidity-constrained (although the estimates are mostly statistically insignificant, making it difficult for them to draw clear-cut inferences). By regressing personal consumption expen-diture on its lag, the disposable personal income without the tax rebates, and the amount of tax rebates, Taylor (2009) noted that the MPC is small and statistically insignificant.
It is interesting to compare our findings with those obtained by Shapiro and Slemrod (2003, 2009). In their investigations, Shapiro and Slemrod examined the response of consumers’ spending to the US tax rebates in 2001 and 2008, respectively, using survey techniques (the Survey of Consumers). Considering the “mostly spend” responses to the US tax rebates in 2001 ( $300 / $600 for single/married, or about 1.5 percent of median annual income), Shapiro and Slemrod

152 AmEricAn Economic JournAL: Economic PoLicy FEBruAry 2017
noted that the aggregate MPC is in the range of 0.34–0.372. In response to the more recent 2008 US tax rebates ( $600 / $1,200 for single/married), the aggregate MPC estimates were between 0.30 and 0.35 . Our MPC exclusive of the effect of discounts is about 0.164, which is lower than the one-third figure found by Shapiro and Slemrod.
Overall, the findings in previous studies suggest that at least some consumers do respond to predictable changes in income, especially when such changes are irregular and small. Apart from the early study by Souleles (2002) and the recent work by Taylor (2009), the MPC estimates fall within the range of 0.12 to 0.48 . Our paper contributes to this important line of research by examining the shopping voucher program in Taiwan that was universal to all citizens. While the program led to an irregular, medium-sized change in income, it may not be cash-equivalent due to the endogenous vendors’ responses with various promotions. Our MPC estimates from the shopping vouchers are almost comparable to those reported by Shapiro and Slemrod (2003, 2009).
IV. Conclusion
We investigated consumers’ responses to the Taiwan Shopping Voucher Program and found them to be sizable. An important implication is that consum-ers responded to the program with a sizable allocation to unplanned spending, distributed unequally among different consumption categories. We found that the unplanned spending using vouchers is partly due to vendors’ promotions. In par-ticular, in the absence of discounts, the MPC dropped by about one-third. This emphasizes a major role played by vendors’ promotions in amplifying the impact of the voucher program.
Our MPC estimates are comparable to those obtained by previous studies on tax rebates. For example, Shapiro and Slemrod (2003, 2009) reported MPC of 0.34–0.372 and 0.30–0.35, respectively, for the 2001 and 2008 US tax rebates. The substantial effect of Taiwan’s shopping vouchers on unplanned consumption is attributed to vendors’ discounts for shopping voucher users. If the effect of ven-dors’ discounts was excluded, then the MPC would be 0.164 only, consistent with the study by Hsieh, Shimizutani, and Hori (2010) on Japan’s Shopping Coupon Program.
Our study does have some limitations. First, the primary purpose of the sur-vey was not to study issues concerning financial constraints since it is likely that consumers in the Great Recession may have experienced a very different finan-cial status as compared to other years. As a result, we do not investigate possible differential responses by consumers in the face of financial constraints. Instead, we sought to evaluate the effect of financial constraints on consumption behavior based on respondents’ earnings. Since this study is based on cross-sectional data, it may be more informative to use longitudinal data for the analysis. However, given the short validity period of the shopping vouchers, very high frequency panel surveys would be required to generate meaningful data, which are obviously difficult, if not impossible, to conduct, given the highly intensive nature of our questionnaires.

VoL. 9 no. 1 153Kan et al.: Understanding ConsUmption Behavior
REFERENCES
Agarwal, Sumit, Chunlin Liu, and Nicholas S. Souleles. 2007. “The Reaction of Consumer Spending and Debt to Tax Rebates—Evidence from Consumer Credit Data.” Journal of Political Economy 115 (6): 986–1019.
Broda, Christian, and Jonathan A. Parker. 2008. “The Impact of the 2008 Tax Rebates on Consumer Spending: Preliminary Evidence.” Unpublished.
Gross, David B., and Nicholas S. Souleles. 2002. “Do Liquidity Constraints and Interest Rates Matter for Consumer Behavior? Evidence from Credit Card Data.” Quarterly Journal of Economics 117 (1): 149–85.
Hsieh, Chang-Tai, Satoshi Shimizutani, and Masahiro Hori. 2010. “Did Japan’s shopping coupon pro-gram increase spending?” Journal of Public Economics 94 (7–8): 523–29.
Johnson, David S., Jonathan A. Parker, and Nicholas S. Souleles. 2006. “Household Expenditure and the Income Tax Rebates of 2001.” American Economic review 96 (5): 1589–1610.
Kan, Kamhon, Shin-Kun Peng, and Ping Wang. 2016. “Understanding Consumption Behavior: Evi-dence from Consumers’ Reaction to Shopping Vouchers.” Academia Sinica Institute of Economics Working Paper.
Kan, Kamhon, Shin-Kun Peng, and Ping Wang. 2017. “Understanding Consumption Behavior: Evi-dence from Consumers’ Reaction to Shopping Vouchers: Dataset.” American Economic Journal: Economic Policy. https://doi.org/10.1257/pol.20130426.
Sahm, Claudia R., Matthew D. Shapiro, and Joel Slemrod. 2010. “Household Response to the 2008 Tax Rebate: Survey Evidence and Aggregate Implications.” In Tax Policy and the Economy, Vol. 24, edited by Jeffrey R. Brown, 69–110. Chicago: University of Chicago Press.
Sahm, Claudia R., Matthew D. Shapiro, and Joel Slemrod. 2012. “Check in the Mail or More in the Paycheck: Does the Effectiveness of Fiscal Stimulus Depend on How It Is Delivered?” American Economic Journal: Economic Policy 4 (3): 216–50.
Shapiro, Matthew D., and Joel Slemrod. 2003. “Consumer Response to Tax Rebates.” American Eco-nomic review 93 (1): 381–96.
Shapiro, Matthew D., and Joel Slemrod. 2009. “Did the 2008 Tax Rebates Stimulate Spending?” American Economic review 99 (2): 374–79.
Souleles, Nicholas S. 2002. “Consumer response to the Reagan tax cuts.” Journal of Public Econom-ics 85 (1): 99–120.
Taylor, John B. 2009. “The Lack of an Empirical Rationale for a Revival of Discretionary Fiscal Pol-icy.” American Economic review 99 (2): 550–55.

This article has been cited by:
1. Yoshihiko Kadoya, Mostafa Saidur Rahim Khan, Tomomi Yamane. 2020. Government’s StimulusProgram to Boost Consumer Spending: A Case of Discount Shopping Coupon Scheme in Japan.Sustainability 12:9, 3906. [Crossref]
2. Fu-Chuan Lai. 2019. Special feature in honor of Shin-Kun Peng. Asia-Pacific Journal of RegionalScience 3:3, 757-759. [Crossref]
3. Jonathan A. Parker, Nicholas S. Souleles. 2019. Reported Effects versus Revealed-PreferenceEstimates: Evidence from the Propensity to Spend Tax Rebates. American Economic Review:Insights 1:3, 273-290. [Abstract] [View PDF article] [PDF with links]
4. Jonathan A. Parker, Nicholas S. Souleles. 2018. Reported Effects vs. Revealed-PreferenceEstimates: Evidence From the Propensity to Spend Tax Rebates. SSRN Electronic Journal .[Crossref]
5. Jonathan A. Parker, Nicholas S. Souleles. 2017. Reported Preference vs. Revealed Preference:Evidence from the Propensity to Spend Tax Rebates. SSRN Electronic Journal . [Crossref]
6. Andrea Neri, Concetta Rondinelli, Filippo Scoccianti. 2017. Household Spending Out of a TaxRebate: Italian ''80 Tax Bonus'. SSRN Electronic Journal . [Crossref]