understanding contribution by media mix and lifetime value · to guide marketing spend towards...
TRANSCRIPT

Understanding Contribution by Media Mix and
Lifetime Value Presented by: Travis Seaton, Senior Vice President, CohereOne and
Elisa Berger, Ph.D. Principal, Cross Country Computer
April 24, 2019

To Spend the Right $ to Acquire Based upon Payback Tolerance
To Guide Marketing Spend towards Vehicles with Greatest ROI (individual channels or combined)
To Identify Early Indicators of Customer Value to Guide Contact Strategy Based on Potential
Marketers need to do more with less….
LTV helps balance short-term returns with long-term profit potential.
2Lifetime Value Allows Marketers…
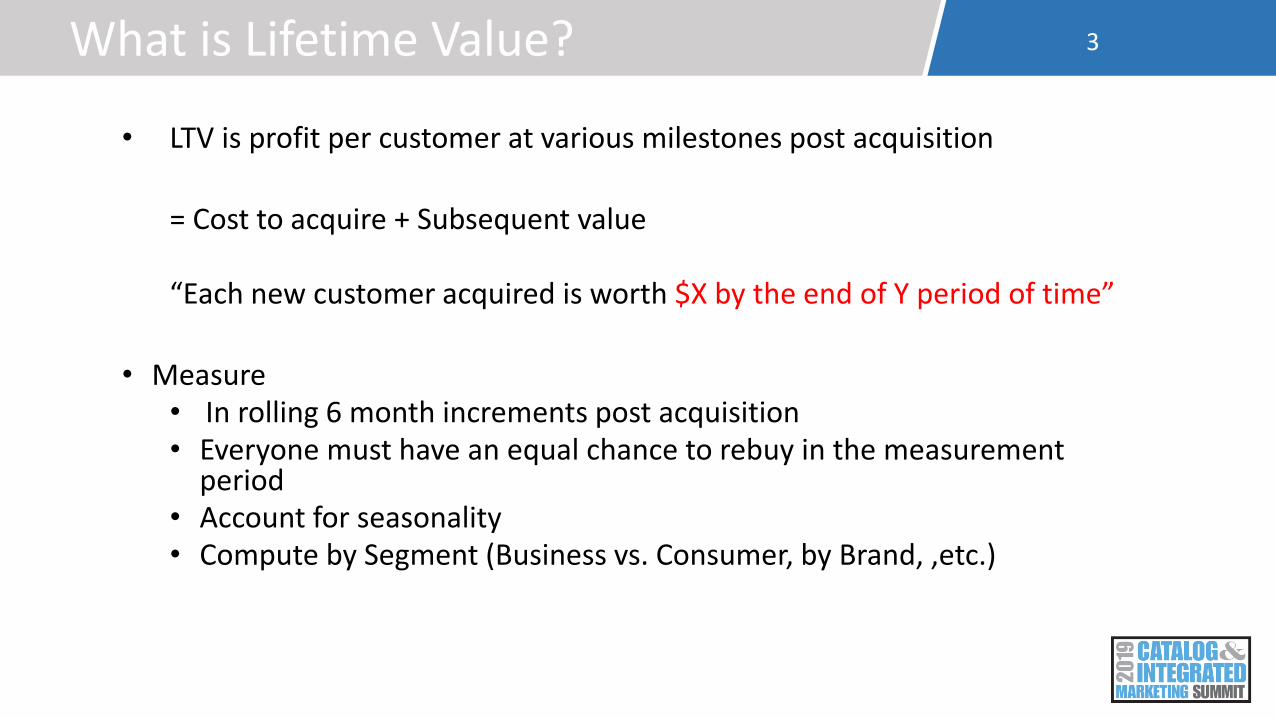
• LTV is profit per customer at various milestones post acquisition
= Cost to acquire + Subsequent value
“Each new customer acquired is worth $X by the end of Y period of time”
• Measure• In rolling 6 month increments post acquisition• Everyone must have an equal chance to rebuy in the measurement
period• Account for seasonality• Compute by Segment (Business vs. Consumer, by Brand, ,etc.)
3What is Lifetime Value?

• Who has a lifetime to wait for payback?
• The end of the customer lifecycle is difficult to measure
• Use actual purchase behavior vs. projecting based upon assumptions and future value of money
4LTV vs. NTV
Months Since
Last Purchase
Annual
Rebuy Rate
0-12 Months 37.4%
13-24 Months 14.1%
25-36 Months 8.5%
37-48 Months 5.8%
49-60 Months 3.6%
61-72 Months 2.1%
73-84 Months 1.7%
85-96 Months 1.3%
97-108 Months 1.1%
109+ Months 0.7%
Total 38.6%
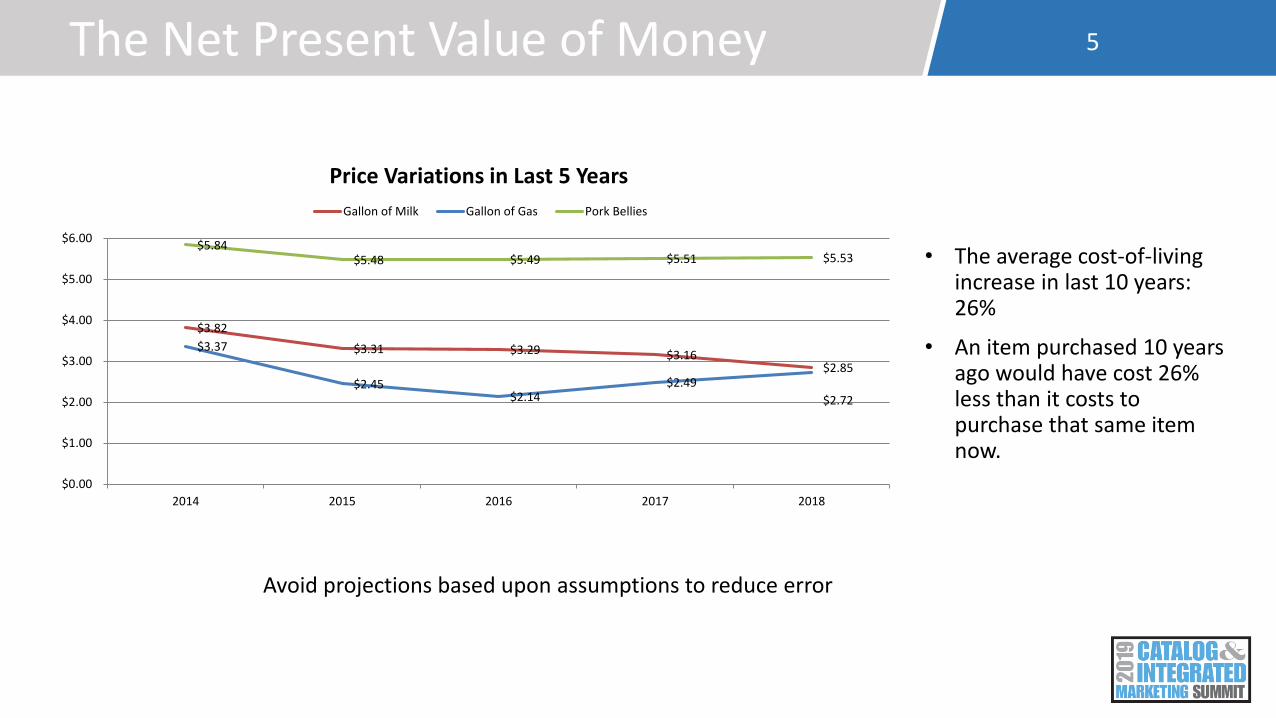
• The average cost-of-living increase in last 10 years: 26%
• An item purchased 10 years ago would have cost 26% less than it costs to purchase that same item now.
5The Net Present Value of Money
$3.82
$3.31 $3.29 $3.16 $2.85
$3.37
$2.45 $2.14
$2.49
$2.72
$5.84 $5.48 $5.49 $5.51 $5.53
$0.00
$1.00
$2.00
$3.00
$4.00
$5.00
$6.00
2014 2015 2016 2017 2018
Price Variations in Last 5 Years
Gallon of Milk Gallon of Gas Pork Bellies
Avoid projections based upon assumptions to reduce error

Transaction level data: (purchase date, dollar, source, channel, brand)
Direct mail matchback data: Order ID, Campaign ID, allocated source, date, dollar
Email targeted group (date email acquired, promotional status)
Online Source/Medium Data (Order ID, Source, Medium, Date)
Remarketing information: % with email address, # of times emailed per month, cost per email, # of times new customers mailed in first year, online advertising costs
Metrics to compute Contribution
Return Rate
Cancel Rate
Cost of Goods
Initial Mail Cost
Email costs
Fulfillment Cost
List Cost for Prospects, Modeling Costs for Housefile
Other metrics to get to net profit
6Minimum Data Requirements

If you have access to actual data great, otherwise, use formulas to estimate costs
Promotional history
Return
COGs
Search before you buy data
7Nice to Have – but no deal breaker

8Determine Attribution Source
Cell #
# of
Media Media Mix
1 1 Catalog/Direct Mail Only
2 1 Email Targetable Only
3 1 CPC Only
4 1 Google "None" Only
5 1 Email Only
6 1 Retargeting Only
7 1 Referral Only
8 1 Affiliate Only
9 1 CSE Only
10 2 Catalog/Direct Mail + CPC
11 2 Catalog/Direct Mail + None
12 2 Catalog/Direct Mail + Email
13 2 Catalog/Direct Mail + Retargeting
14 2 Catalog/Direct Mail + Referral
15 2 Catalog/Direct Mail + Affiliate
16 2 Catalog/Direct Mail + CSE
17 2 Catalog/Direct Mail + Email Targetable
18 2 Email +Email Targetable
19 2 Retargeting + Email Targetable
20 2 Referral + Email Targetable
21 2 Affiliate + Email Targetable
22 2 CSE + Email Targetable
Cell #
# of
Media Media Mix
23 3 Google "None" + Email Targetable
24 3
Catalog/Direct Mail + CPC + Email
Targetable
25 3
Catalog/Direct Mail + None + Email
Targetable
26 3
Catalog/Direct Mail + Email + Email
Targetable
27 3
Catalog/Direct Mail + Retargeting +
Email Targetable
28 3
Catalog/Direct Mail + Referral + Email
Targetable
29 3
Catalog/Direct Mail + Affiliate + Email
Targetable
30 3
Catalog/Direct Mail + CSE + Email
Targetable
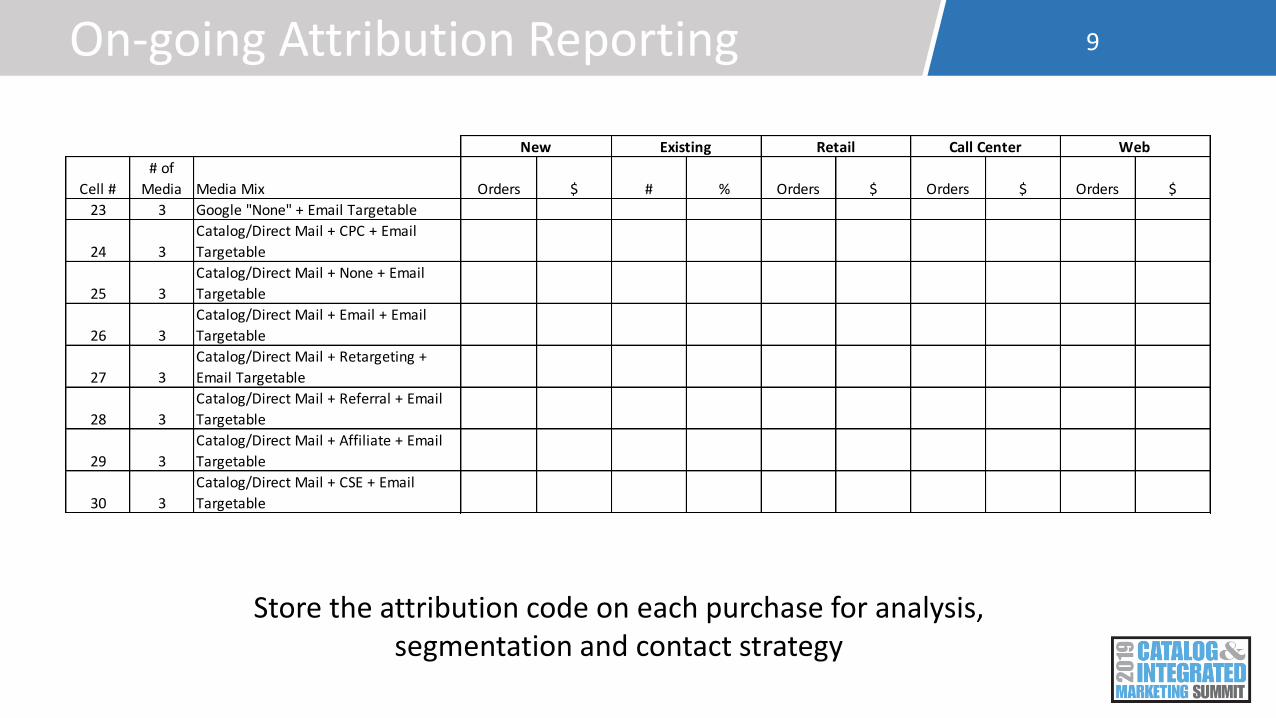
9On-going Attribution Reporting
Cell #
# of
Media Media Mix Orders $ # % Orders $ Orders $ Orders $
23 3 Google "None" + Email Targetable
24 3
Catalog/Direct Mail + CPC + Email
Targetable
25 3
Catalog/Direct Mail + None + Email
Targetable
26 3
Catalog/Direct Mail + Email + Email
Targetable
27 3
Catalog/Direct Mail + Retargeting +
Email Targetable
28 3
Catalog/Direct Mail + Referral + Email
Targetable
29 3
Catalog/Direct Mail + Affiliate + Email
Targetable
30 3
Catalog/Direct Mail + CSE + Email
Targetable
New Existing Retail Call Center Web
Store the attribution code on each purchase for analysis, segmentation and contact strategy

Identify all new buyers in a one year time frame
Identify first purchase attributes: first purchase dollar, first purchase date, first purchase source and channel
Compute subsequent value in rolling 6 month increments from individual acquisition date
Combine cost to acquire with subsequent value to obtain near term value in 6 month increments from first purchase up to 5 years.
10Methodology

11Lifetime Value Calculation
• LTV can be generated by:
• Original List Source/Attribution Source
• 1st product category• 1st dollar • 1st month• Demographic or
Firmographic attributes
• Site vs. Contact (B2B)
New Buyers Acquired in 2018
Catalog/Direct Mail
+ Pay Per Click
% of New
Buyers
Catalog
Prospecting Only
% of New
Buyers
New Buyers Acquired 7,052 16% 23,431 54%
Initial
Contribution
per New Buyer
Initial
Contribution
per New Buyer
Initial Contribution upon Acquisition $59,746 $8 -$56,942 -$2
12 Month NTV
Subsequent Orders 3,314 15,230
Order Rate 47% 65%
Average Orders per Repeat Buyer 1.8 1.8
Net # of Repeat Buyers 1,875 8,618
Net # of Repeat Buyers 27% 37%
Gross Revenue $192,238 $883,349
Returns $23,069 $106,002
Fulf illment Cost $4 per order $13,258 $60,921
COGs $50,751 $233,204
Net Profit before Promotional Costs $105,161 $483,222
Direct Mail Costs $17,489 $58,109
Email Costs $3,385 $11,247
Online Advertising $9,612 $44,167
Cum Subsequent Profit $74,675 $369,699
Cumulative Profit (includes 1st purchase) $134,421 $312,757
Cum Subsequent Value per New Buyer $11 $16
Near Term Value $19 $13

12Value Tapers off with Time
New Buyers Acquisition 6 Month 12 Month 18 Month 24 Month 30 Month 36 Month 42 Month 48 Month 54 Months60 Months
2012 $108 $133 $144 $154 $162 $175 $187 $201 $212 $226 $235
2013 $113 $138 $151 $165 $179 $195 $209 $222 $230
2014 $117 $148 $165 $181 $194 $207 $214
2015 $126 $161 $177 $190 $198
2016 $127 $160 $169
Avg $118 $148 $161 $172 $183 $193 $203 $211 $221 $226 $235

13Lifetime Value Trends
$0
$50
$100
$150
$200
$250
Acquisition 6 Month 12 Month 18 Month 24 Month 30 Month 36 Month 42 Month 48 Month 54 Months 60 Months
2012 2013 2014 2015 2016
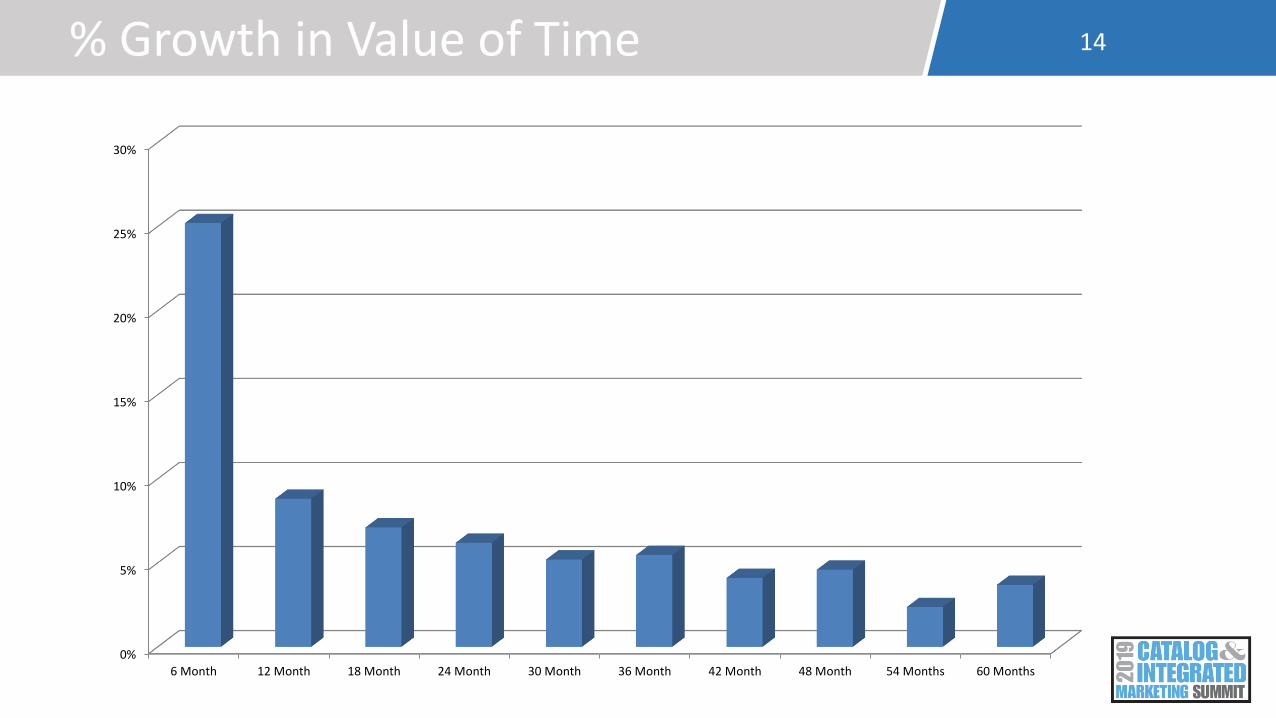
14% Growth in Value of Time
0%
5%
10%
15%
20%
25%
30%
6 Month 12 Month 18 Month 24 Month 30 Month 36 Month 42 Month 48 Month 54 Months 60 Months

LTV is just one piece of the puzzle. You need to understand where your revenue is coming from and plan/react accordingly.
15Beyond LTV

16What Can You Expect from Your Housefile?
Months Since Last
Purchase
Beginning
Inventory as of Jan 1
for the year
Rebuy
Rate
Orders /
Buyer
Gross
Demand/Buyer AOV
New 250,000 1.02 $501 $489
0-12 Month 500,000 24.97% 1.24 $605 $486
In-active Subtotal 1,372,500 5.02% 1.00 $521 $521
13-24 Month 300,000 10.53% 1.01 $517 $515
25-36 250,000 6.77% 0.99 $545 $551
37-48 240,000 4.41% 1.02 $535 $523
49-60 190,000 3.13% 0.97 $500 $516
61-72 150,000 2.47% 0.99 $511 $517
73-84 130,000 2.11% 0.96 $430 $450
85-96 112,000 1.46% 0.98 $481 $490
97-108 500 1.55% 0 $0 $0
Total 1,872,500 10.35% 1.4 $552 $394
Year end provides an annual view of each metric for projection. Monthly provides YTD trends so you can react.

17Plan Based upon Goals & Expectations
Year end provides an annual view of each metric for projection. Monthly provides YTD trends so you can react.
Segment Starting Count
Expected
Rebuy
Rate
Projected
Buyers in
CY
Expected $ per
Buyer
Projected
Revenue
from
Existing
Buyers
12 mo 500,000 25.0% 124,850 $605 $75,485,732
13+ 1,372,500 5.02% 68,900 $521 $35,864,825
1,872,500 193,750 $111,350,557
2019 Status
Quo
2019 10%
Growth
2019 20%
Growth
Total $ $229,123,989 $252,036,387 $274,948,786
New Buyer Revenue $117,773,432 $140,685,830 $163,598,229
Avg $ per New $501 $501 $501
New buyers 235,000 280,718 326,437
status quo 119% 139%

Case Studies
Why NTV/LTV is Critical

19Media Mix Attribution– Client
Single contact value➢ Catalog by far the highest, with email strong as well➢ CSE and Retargeting have the lowest value
Media Mix Acquisition12 Month
Demand
12 Month
Net Cont
Catalog Only $80 $207 $207
Email Only $97 $152 $152
CPC Only $68 $100 $100
Website Direct Load Only $78 $113 $113
Email Click to Buy Only $95 $135 $135
Retargeting Only $59 $92 $92
Affiliate Only $79 $108 $108
CSE Only $69 $86 $86
Organic Only $72 $105 $105
Other Only $62 $80 $80

Media Mix Acquisition 12 Month 12 Month
Net Cont
Catalog + CPC $67 $95 $95
Catalog + Website Direct Load $62 $92 $92
Catalog + Email Click to Buy $71 $95 $95
Catalog + Retargeting $54 $79 $79
Catalog + Affiliate $60 $81 $81
Catalog + CSE $93 $164 $164
Catalog + Organic $64 $92 $92
Catalog + Other $98 $122 $122
Catalog + Email $96 $155 $155
PPC + Email $79 $119 $119
Email Click to Buy + Email $89 $143 $143
Retargeting + Email $68 $114 $114
Affiliate + Email $85 $117 $117
CSE + Email $75 $115 $115
Website Direct Load + Email $88 $139 $139
Organic + Email $80 $123 $123
Other + Email $76 $103 $103
20Media Mix Attribution– Client
Multiple contact value➢ Catalog in combinations with CSE or Email is the strongest combo➢ Catalog in combination with Affiliate or Retargeted the weakest combo
➢ Catalog in combinations with Email and CSE or Affiliate is the strongest combo
Media Mix Acquisition 12 Month 12 Month
Net Cont
Catalog + CPC + Email $76 $110 $110
Catalog + Website Direct Load + Email $65 $88 $88
Catalog + Email Click to Buy + Email $54 $84 $84
Catalog + Retargeting + Email $63 $90 $90
Catalog + Affiliate + Email $104 $131 $131
Catalog + CSE + Email $104 $131 $131
Catalog + Organic + Email $73 $115 $115
Catalog + Other + Email $109 $141 $141

21Last Click Attribution – Client
Total customer value calculated by source➢ Initial contribution may look poor, but future value will change the dynamics➢ Use total value to determine where to invest marketing expenditures
Acquisition Source 12M Demand MarginAcquisition
Cost/ContMarketing Cost 12 Month Value
Catalog $97 $49 ($12) $7.60 $29.10
Email $46 $23 $1 $7.60 $16.47
Affiliate $33 $17 ($4) $7.60 $4.90
Direct Load $42 $21 $0 $7.60 $13.55
Social $43 $22 $5 $7.60 $18.90
Unknown Web $44 $22 $0 $7.60 $14.40
SEM Non Brand $27 $14 $14 $7.60 $20.10
SEM Brand $53 $26 $16 $7.60 $34.84
SEO Non Brand $40 $20 $10 $7.60 $22.27
SEO Brand $47 $23 $13 $7.60 $28.66
Offline $135 $68 $0 $7.60 $59.90

22Housefile Value Changes – Client
If mix of acquisition is changed the value of your active file changes
➢ Same number of customers acquired annually
➢ Value of initial demand declines
➢ Value of 12 month value declines
➢ Double Whammy!
Allocated
Promo
12M 1st Time
Custs
1st Order
Demand
Subsequent
12M Orders
Subsequent
12M Demand
Orders/New
Customer
Demand/New
CustomerCatalog 8,052 $980,932 6,870 $736,306 0.85 $91Direct Load 3,172 $320,984 1,732 $148,074 0.55 $47Affiliate 840 $70,194 363 $27,788 0.43 $33Email 5,919 $509,909 3,606 $271,311 0.61 $46SEO Non Brand 5,062 $464,011 2,499 $222,122 0.49 $44SEM Non Brand 7,665 $630,009 2,976 $234,823 0.39 $31SEO Brand 358 $38,547 235 $20,401 0.66 $57SEM Brand 5,714 $597,809 3,269 $300,042 0.57 $53Web Unk 2,751 $259,327 1,703 $141,772 0.62 $52Misc 1,476 $139,787 1,275 $200,115 0.86 $136Grand Total 41,009 $4,011,508 24,528 $2,302,754 0.60 $56
Allocated
Promo
12M 1st Time
Custs
1st Order
Demand
Subsequent
12M Orders
Subsequent
12M Demand
Orders/New
Customer
Demand/New
CustomerCatalog 4,831 $588,559 4,122 $441,783 0.85 $91Direct Load 3,172 $320,984 1,732 $148,074 0.55 $47Affiliate 966 $80,723 417 $31,956 0.43 $33Email 7,103 $611,890 4,327 $325,573 0.61 $46SEO Non Brand 5,568 $510,412 2,749 $244,334 0.49 $44SEM Non Brand 9,045 $743,411 3,512 $277,091 0.39 $31SEO Brand 358 $38,547 235 $20,401 0.66 $57SEM Brand 5,714 $597,809 3,269 $300,042 0.57 $53Web Unk 2,751 $259,327 1,703 $141,772 0.62 $52Misc 1,476 $139,787 1,275 $200,115 0.86 $136Grand Total 41,009 $3,891,449 23,341 $2,131,142 0.57 $52
January 2016 - December 2016
January 2017 - December 2017

23Customer Value Changes – Client
If mix of acquisition is changed the value of your active file changes
➢ Next year value of customer file automatically reduced
➢ Following January will experience an 8% reduction in customer performance all things equal
➢ If mailing a catalog, active buyer $/B would be down when comparing YOY because of change in value of customer
Customers Jan Apr Jul Oct Jan
Catalog 8,052 $196,057 $196,057 $196,057 $196,057 $196,057
Direct Load 3,172 $36,584 $36,584 $36,584 $36,584 $36,584
Affiliate 840 $6,930 $6,930 $6,930 $6,930 $6,930
Email 5,919 $62,603 $62,603 $62,603 $62,603 $62,603
SEO Non Brand 5,062 $54,417 $54,417 $54,417 $54,417 $54,417
SEM Non Brand 7,665 $84,315 $84,315 $84,315 $84,315 $84,315
SEO Brand 358 $2,452 $2,452 $2,452 $2,452 $2,452
SEM Brand 5,714 $75,548 $75,548 $75,548 $75,548 $75,548
Web Unk 2,751 $27,332 $27,332 $27,332 $27,332 $27,332
Misc 1,476 $17,170 $17,170 $17,170 $17,170 $17,170
$563,406 $563,406 $563,406 $563,406 $563,406
Customers Jan Apr Jul Oct Jan
Catalog 4,831 $117,629 $117,629 $117,629 $117,629 $117,629
Direct Load 3,172 $36,584 $36,584 $36,584 $36,584 $36,584
Affiliate 966 $7,970 $7,970 $7,970 $7,970 $7,970
Email 7,103 $75,125 $75,125 $75,125 $75,125 $75,125
SEO Non Brand 5,568 $59,856 $59,856 $59,856 $59,856 $59,856
SEM Non Brand 9,045 $99,495 $99,495 $99,495 $99,495 $99,495
SEO Brand 358 $2,452 $2,452 $2,452 $2,452 $2,452
SEM Brand 5,714 $75,548 $75,548 $75,548 $75,548 $75,548
Web Unk 2,751 $27,332 $27,332 $27,332 $27,332 $27,332
Misc 1,476 $17,170 $17,170 $17,170 $17,170 $17,170
$519,160 $519,160 $519,160 $519,160 $519,160 -8%
Sales for illustrative purposes
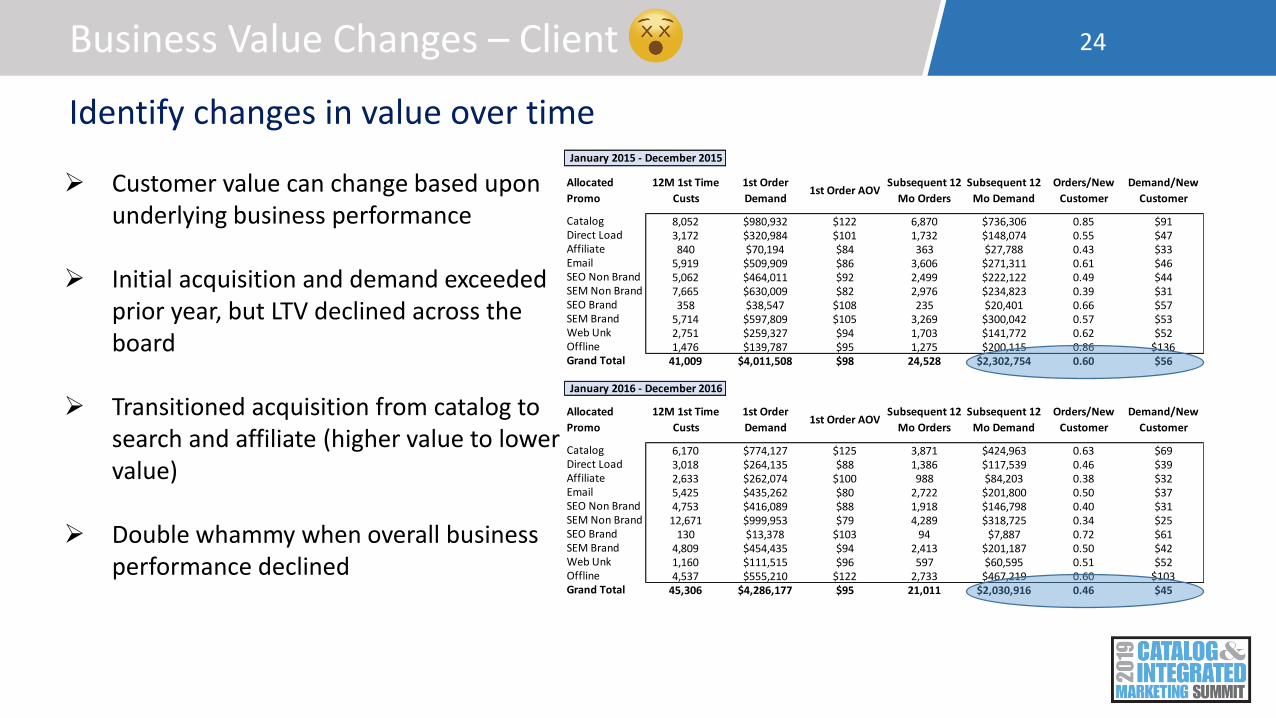
24Business Value Changes – Client
Identify changes in value over time
➢ Customer value can change based upon underlying business performance
➢ Initial acquisition and demand exceeded prior year, but LTV declined across the board
➢ Transitioned acquisition from catalog to search and affiliate (higher value to lower value)
➢ Double whammy when overall business performance declined
Allocated
Promo
12M 1st Time
Custs
1st Order
Demand1st Order AOV
Subsequent 12
Mo Orders
Subsequent 12
Mo Demand
Orders/New
Customer
Demand/New
Customer
Catalog 8,052 $980,932 $122 6,870 $736,306 0.85 $91Direct Load 3,172 $320,984 $101 1,732 $148,074 0.55 $47Affiliate 840 $70,194 $84 363 $27,788 0.43 $33Email 5,919 $509,909 $86 3,606 $271,311 0.61 $46SEO Non Brand 5,062 $464,011 $92 2,499 $222,122 0.49 $44SEM Non Brand 7,665 $630,009 $82 2,976 $234,823 0.39 $31SEO Brand 358 $38,547 $108 235 $20,401 0.66 $57SEM Brand 5,714 $597,809 $105 3,269 $300,042 0.57 $53Web Unk 2,751 $259,327 $94 1,703 $141,772 0.62 $52Offline 1,476 $139,787 $95 1,275 $200,115 0.86 $136Grand Total 41,009 $4,011,508 $98 24,528 $2,302,754 0.60 $56
Allocated
Promo
12M 1st Time
Custs
1st Order
Demand1st Order AOV
Subsequent 12
Mo Orders
Subsequent 12
Mo Demand
Orders/New
Customer
Demand/New
Customer
Catalog 6,170 $774,127 $125 3,871 $424,963 0.63 $69Direct Load 3,018 $264,135 $88 1,386 $117,539 0.46 $39Affiliate 2,633 $262,074 $100 988 $84,203 0.38 $32Email 5,425 $435,262 $80 2,722 $201,800 0.50 $37SEO Non Brand 4,753 $416,089 $88 1,918 $146,798 0.40 $31SEM Non Brand 12,671 $999,953 $79 4,289 $318,725 0.34 $25SEO Brand 130 $13,378 $103 94 $7,887 0.72 $61SEM Brand 4,809 $454,435 $94 2,413 $201,187 0.50 $42Web Unk 1,160 $111,515 $96 597 $60,595 0.51 $52Offline 4,537 $555,210 $122 2,733 $467,219 0.60 $103Grand Total 45,306 $4,286,177 $95 21,011 $2,030,916 0.46 $45
January 2015 - December 2015
January 2016 - December 2016

25Understanding NTV Ramifications
Important considerations in the budgeting process
➢ If significant changes in marketing expenditures by promotion source are taking place, know the short term and long term ramifications
➢ If transitioning expenditure from a higher value source to a lower value source, understand the need for increased performance • i.e $100 in Catalog expenditure = $350 SEM Non Brand expenditure to “break
even”
➢ Adjust performance expectations based upon prior year acquisition mix
• i.e. Catalog $/B decrease of 8% on active buyers as covered in prior slide
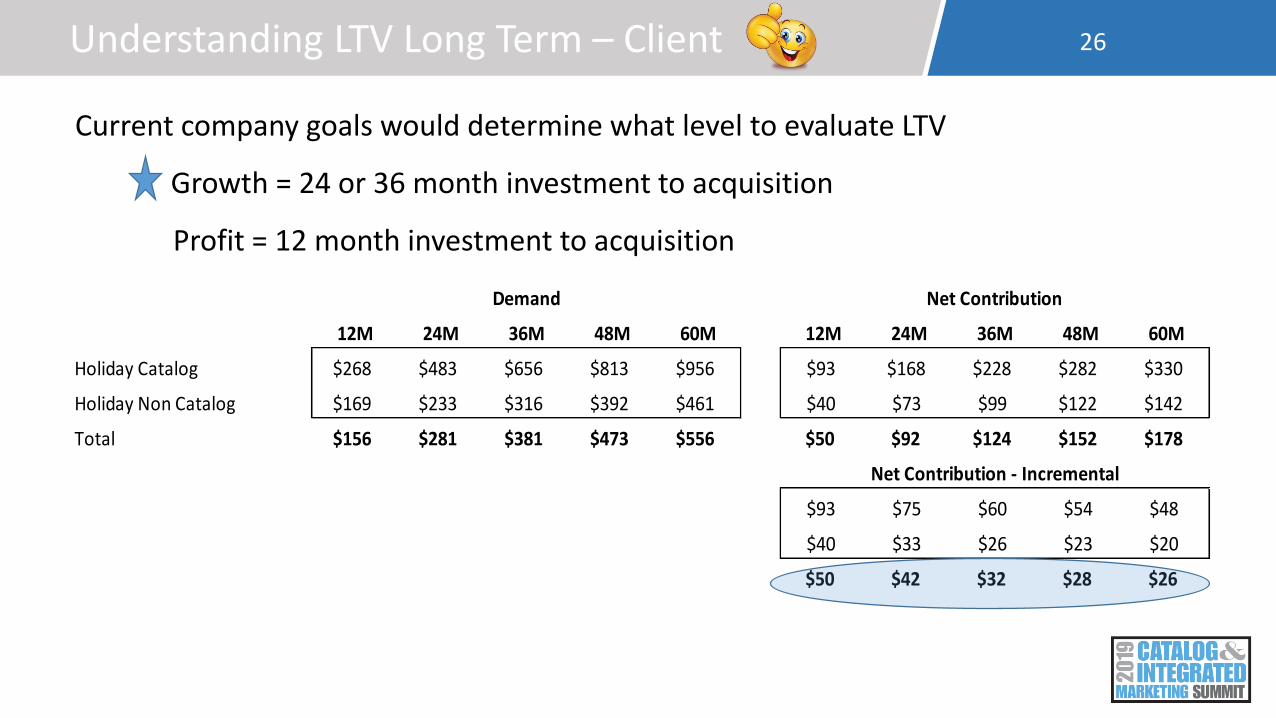
26Understanding LTV Long Term – Client
Current company goals would determine what level to evaluate LTV
Growth = 24 or 36 month investment to acquisition
Profit = 12 month investment to acquisition
12M 24M 36M 48M 60M 12M 24M 36M 48M 60M
Holiday Catalog $268 $483 $656 $813 $956 $93 $168 $228 $282 $330
Holiday Non Catalog $169 $233 $316 $392 $461 $40 $73 $99 $122 $142
Total $156 $281 $381 $473 $556 $50 $92 $124 $152 $178
$93 $75 $60 $54 $48
$40 $33 $26 $23 $20
$50 $42 $32 $28 $26
Demand Net Contribution
Net Contribution - Incremental

27Understanding LTV Seasonality – Client
Value will vary by seasonality and depth of marketing
➢Expand acquisition efforts where value is high
➢Understand ramifications of changes in marketing
-
2,000
4,000
6,000
8,000
10,000
12,000
14,000
$0
$50
$100
$150
$200
$250
$300
1 2 3 4 5 6 7 8 9 10 11 12
2016 Acquisition
Print 12M Net Value Digital 12M Net Value Digital Cust Acquired Print Cust Acquired
Elisa Berger, Ph.D.
631-851-4214
28
Thank You!
Travis Seaton
657.363.8694