understanding data for beginners school community council training october 2013
TRANSCRIPT
Understanding Data for BeginnersSchool Community Council TrainingOctober 2013
Why we use data
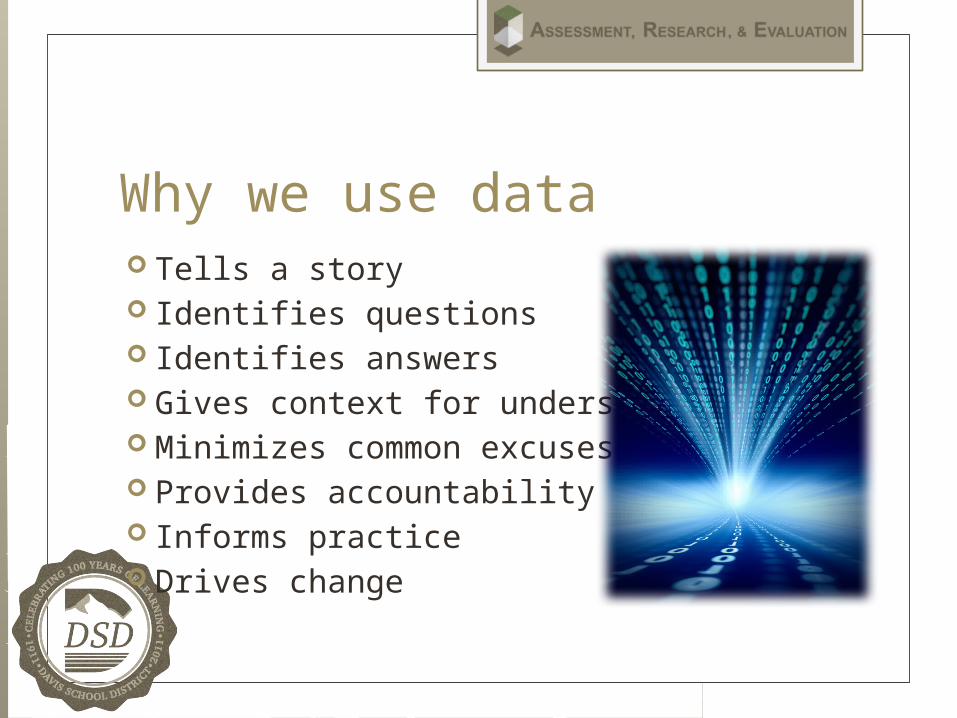
Why we use data Tells a story Identifies questions Identifies answers Gives context for understanding Minimizes common excuses Provides accountability Informs practice Drives change
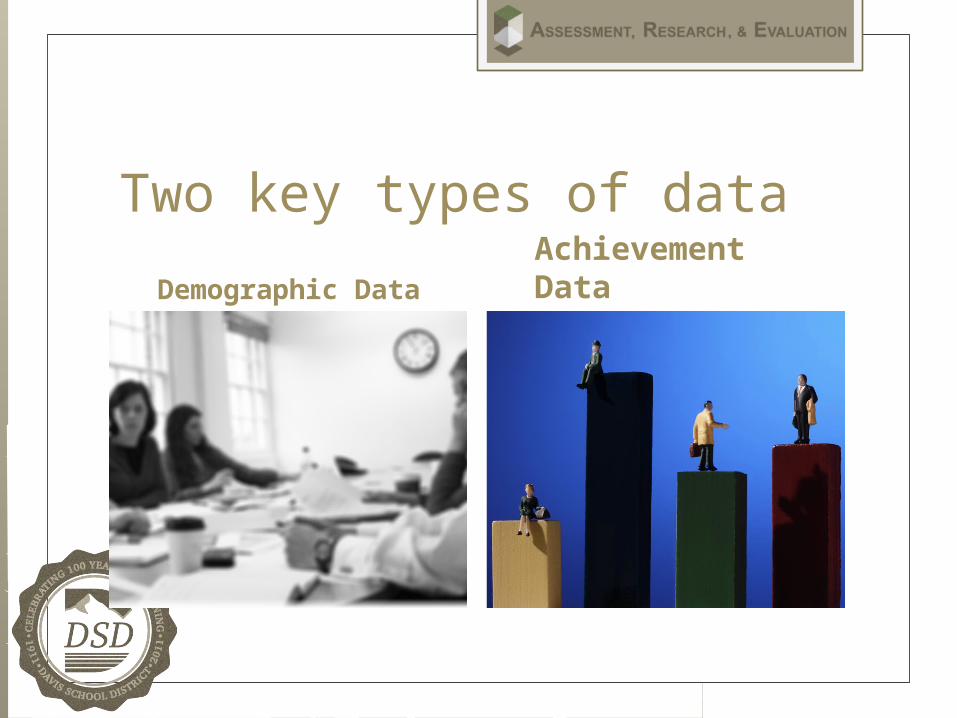
Two key types of data
Demographic DataAchievement Data
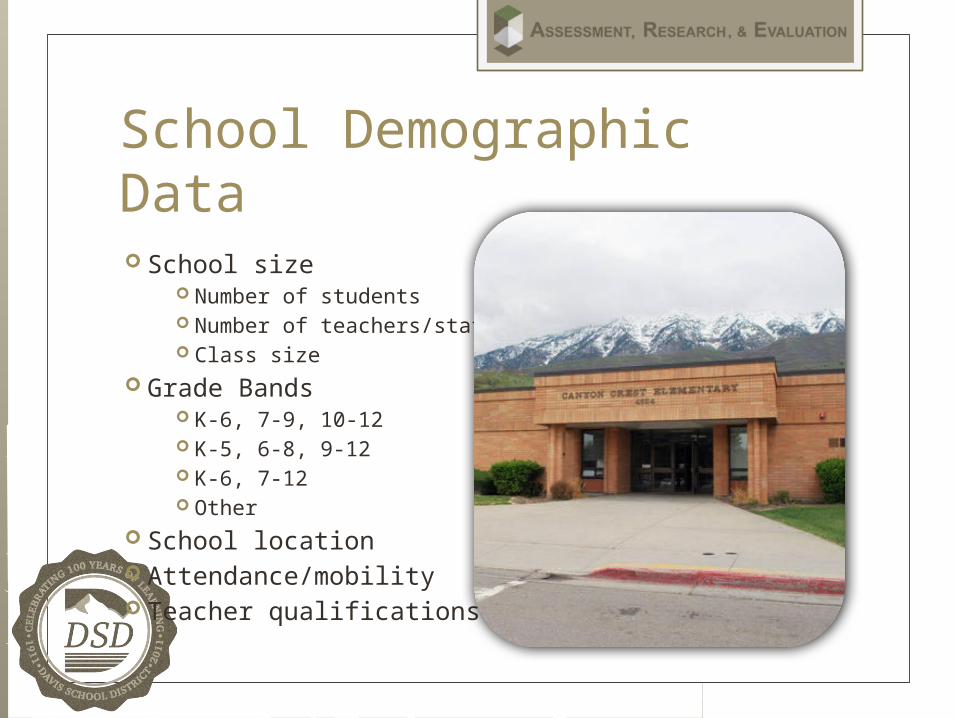
School Demographic Data School size
Number of students Number of teachers/staff Class size
Grade Bands K-6, 7-9, 10-12 K-5, 6-8, 9-12 K-6, 7-12 Other
School location Attendance/mobility Teacher qualifications
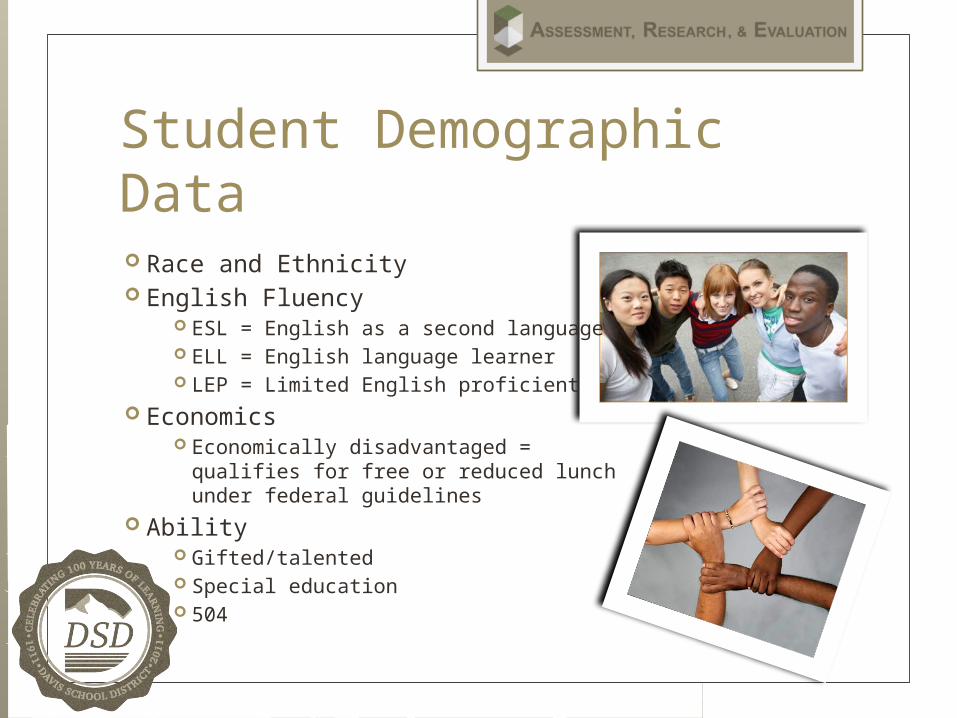
Student Demographic Data Race and Ethnicity English Fluency
ESL = English as a second language ELL = English language learner LEP = Limited English proficient
Economics Economically disadvantaged =
qualifies for free or reduced lunch under federal guidelines
Ability Gifted/talented Special education 504
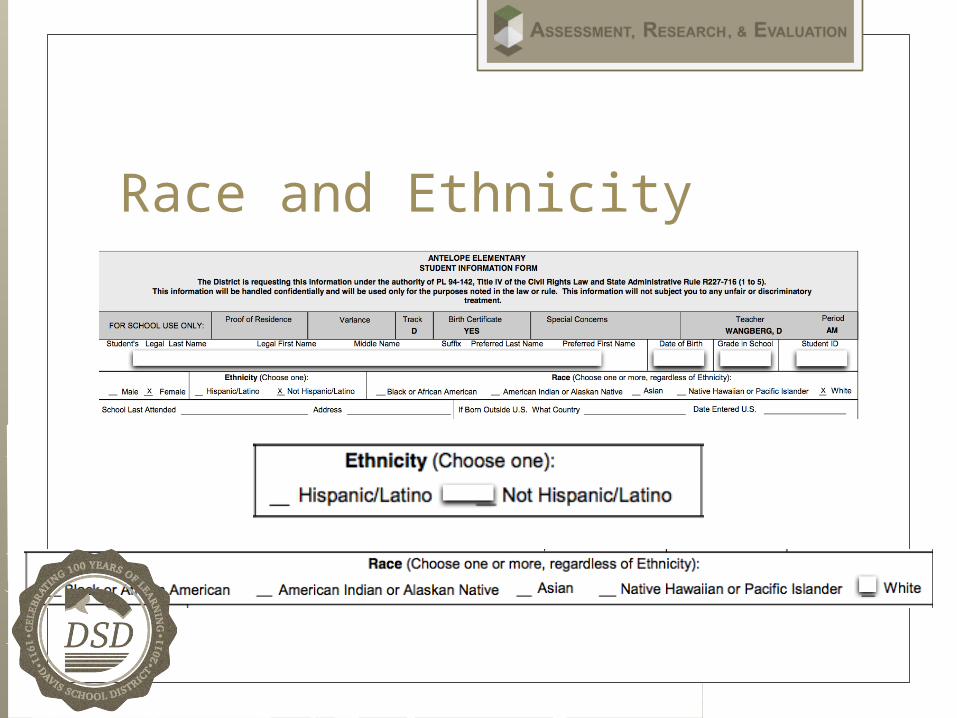
Race and Ethnicity
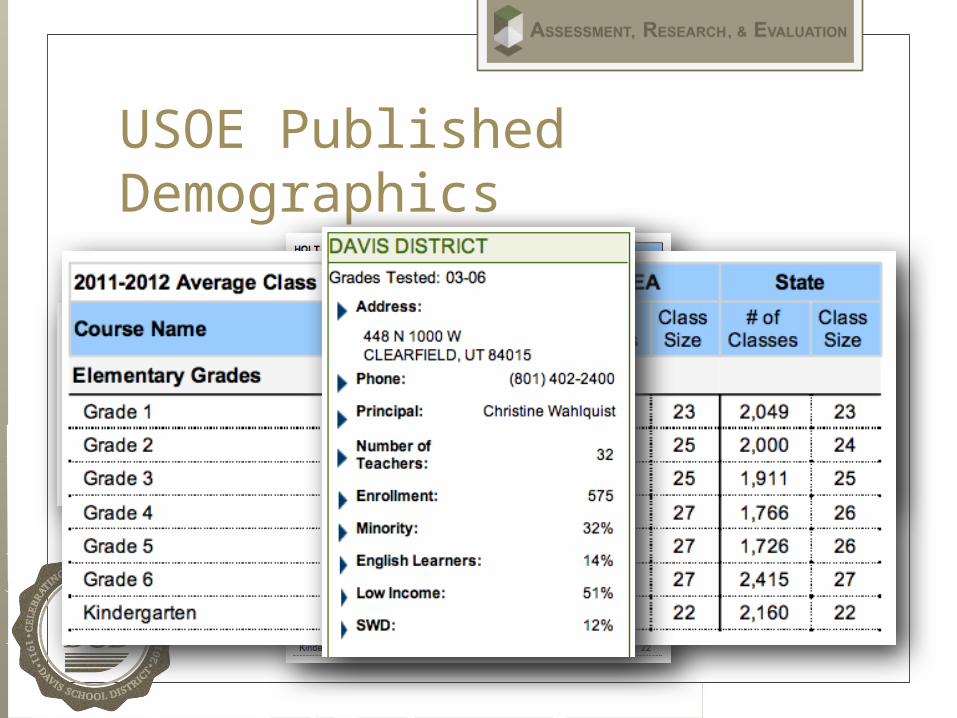
USOE Published Demographics
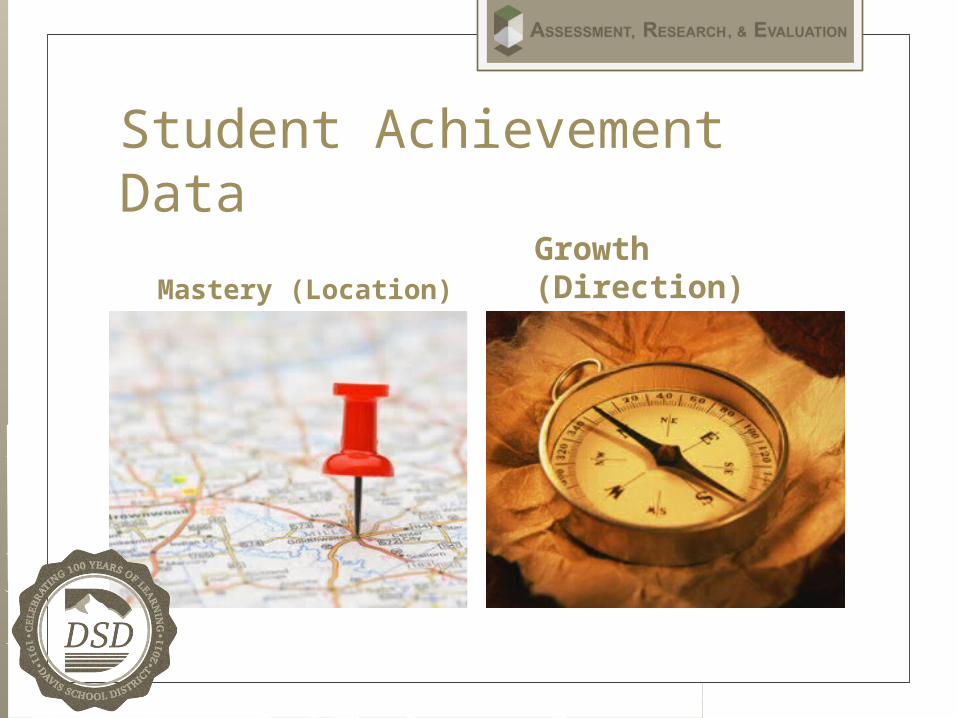
Student Achievement Data
Mastery (Location)Growth (Direction)
Mastery Data (State) State Testing
Criterion Referenced Tests (CRT) Grades 3-12 Language Arts, Math, and Science
Direct Writing Assessment (DWA) Grades 5 & 8 Writing
DIBELS Grades 1-3 Reading
UALPA Grades K-12 English Language Proficiency
Mastery Data (Davis District) District Testing
Criterion Referenced Tests (CRT) Grades 1-2 Language Arts and Math
Kindergarten Assessment Language Arts and Math
DIBELS Grades K-6 Reading
Other Assessments District common assessments School common assessments
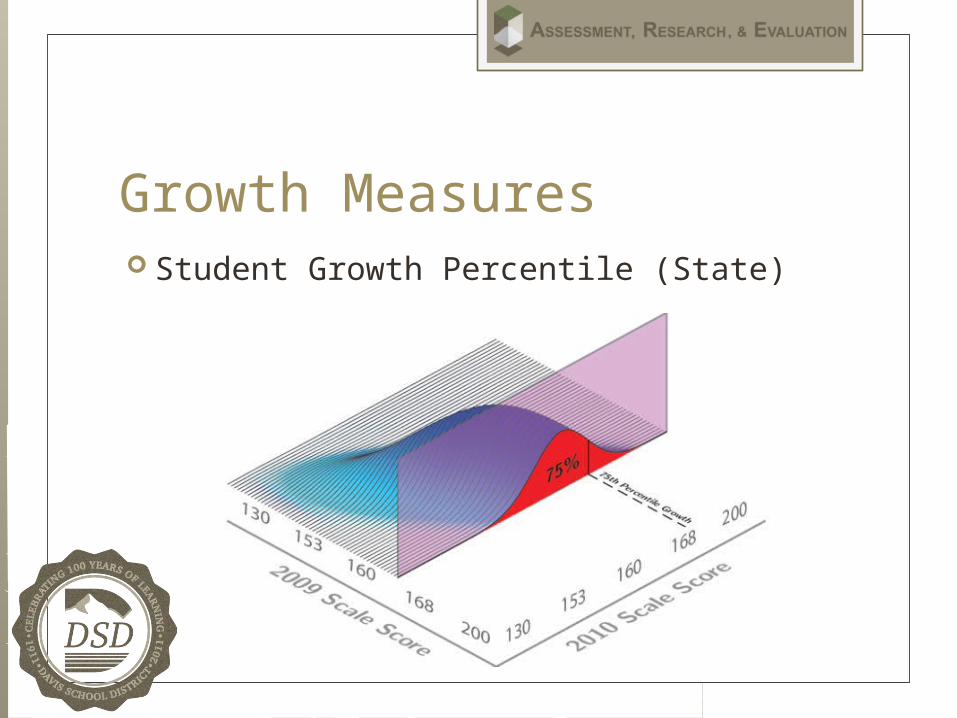
Growth Measures Student Growth Percentile (State)
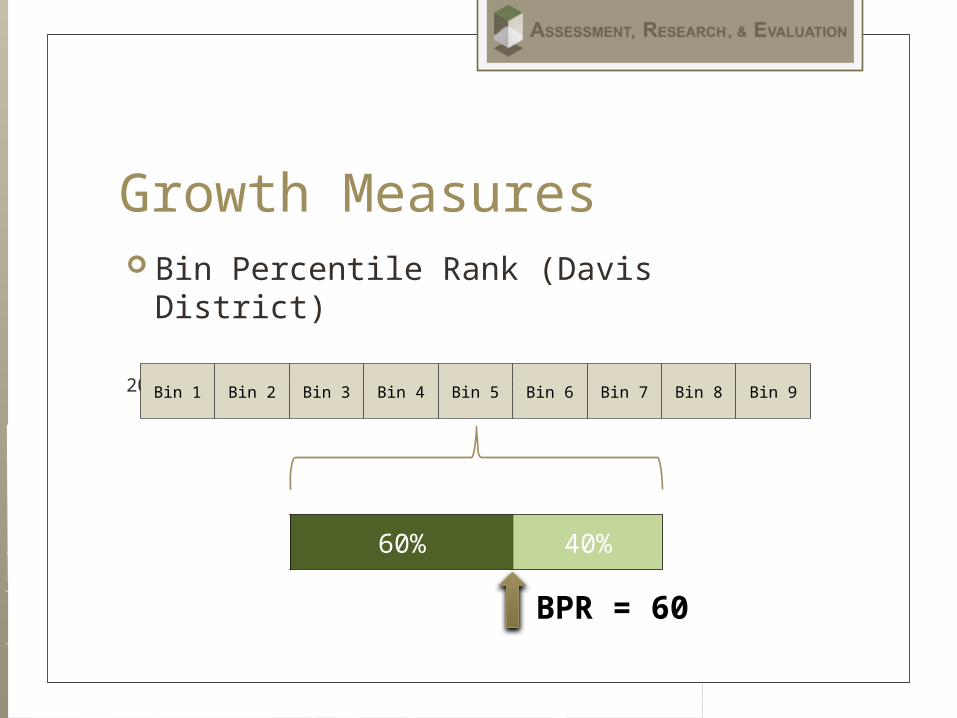
Growth Measures Bin Percentile Rank (Davis District)
2011 Test Scores (or 2009-2011 score history)
2012 Test Scores
Bin 1 Bin 2 Bin 3 Bin 4 Bin 5 Bin 6 Bin 7 Bin 8 Bin 9
Lowest Bin 5 Highest60% 40%
BPR = 60
College and Career Readiness Data
Graduation Rate New federal formula
AP Credit Concurrent
Enrollment International
Baccalaureate ACT Scores
School Environment Data State Measures
SHARP surveys Accreditation
District Measures Indicators of School
Quality (ISQ) Parent/student surveys
of teachers (classroom environment)
Parent/student surveys of principals (school environment)
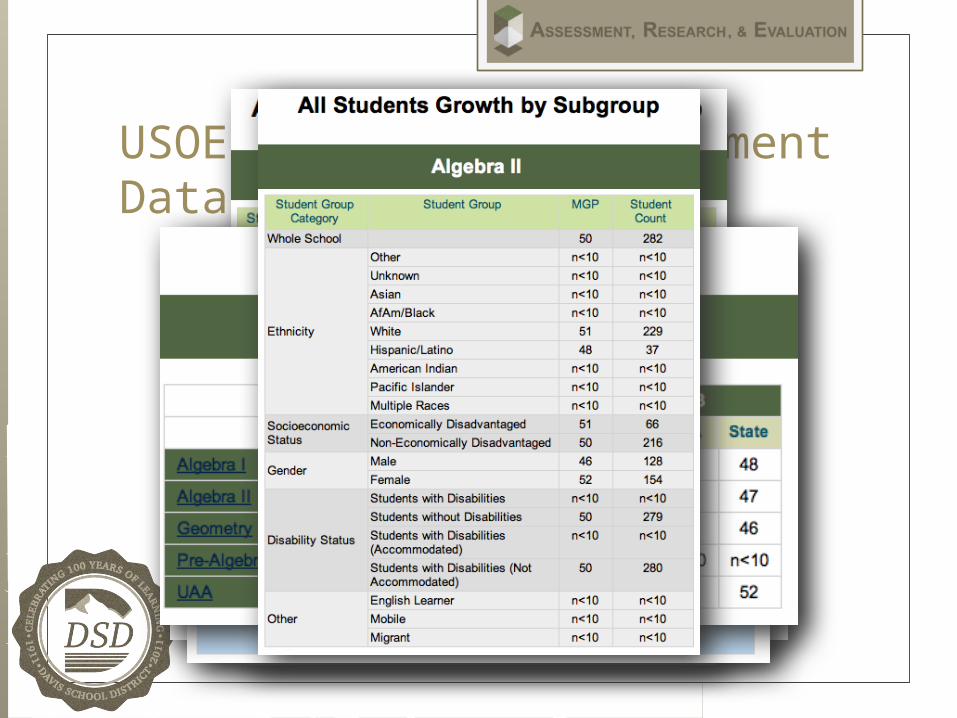
USOE Published Achievement Data
Things to Remember Data only tells part of
the whole story. We should look for
trends not snapshots. Data generates more
questions than answers.
Data must be well understood in order to generate conclusions.