understanding estimation of emission from land and forest
TRANSCRIPT

Understanding Estimation of Emission
From Land and Forest Fires in Indonesia 2015
Ministry of Environment and Forestry - Republic of Indonesia

I. Context
Forest and land �re is an important environmental factor at global/regional/national/local scales in�uencing vegetation dynamics, carbon stock, land cover change and being an important source of GHGs emissions into the atmosphere. During 2015, land and forest �res occurred in many countries in the world, start from Latin America, North America, Africa, and Eastern Europe to Southeast Asia and Australia. Due to the phenomenon of El Nino that brings extreme drought along the equator, most of the �res in 2015 concentrated over the equator (Figure 1). El Nino typically reduce rainfall, cause serious droughts and increase temperatures. Those are conditions that easily trigger �res.
Figure 1. The �res detected by MODIS on board the Terra and Aqua satellites over a 10-day period (November 7-16, 2015) ( ).http://rapid�re.sci.gsfc.nasa.gov/�remaps/
Indonesia also severely affected by the land and forest �res 2015. This Info Brief provides understanding on the context, methods and accounting of emission resulted from land and forest �res (karlahut) in Indonesia 2015. The information were derived from scienti�c workshop held in Jakarta on 16 November 2015 featuring scientists from relevant ministry, academic, and practitioner related to forestry and land sector. The purpose of this info brief is to provide public with understanding on how emissions from karlahut in Indonesia have been estimated, to provide decision makers understanding on the extent to which the information on karlahut emission can be used as the basis for decision making processes. The info brief is also meaning to shed light onto further work needed to improve emission estimation from karlahut especially from peat �re.
II. Land and Forest Fires (karlahut) in Indonesia
The 2015 land and forest �res (karlahut) in Indonesia came to the attention of many people, nationally and globally due to its tremendous impacts. The direct impacts are including severe smog and haze, widespread health impacts, disruption of education, diverted and canceled �ights, biodiversity loss, greenhouse gases emission (e.g. WRI, 2015; Posko DJPPI 2015), and problem of transboundary-haze (e.g. Jones, 2006; Deutsche Welles, 2015; Posko DJPPI 2015). Escalated by El-Nino effects, Karlahut in Indonesia in 2015 spread-out almost all over the country, with mostly concentrated in the island of Sumatera, Kalimantan and Papua where peatlands are located (Figure 2).

Figure 2. Karlahut in Indonesia indicated by MODIS hotspot distribution from July to October 2015 (LAPAN, 2015) ( ). http://modis-catalog.lapan.go.id/monitoring/
Karlahut in Indonesia 2015 become worsened as it occurred over peatlands. Indonesia has a massive tropical peatland areas, estimated around 14.9 Million ha, and concentrated in three major islands: Sumatera, Kalimantan and Papua (Ritung et al. 2011) or 49.7% of peat hydrological unit (Kesatuan Hidrologis Gambut) area (DG of Planology MoEF, 2015). Peatland is area with a high carbon soil content that can burn easily under low moisture conditions. In a normal condition, the peat ecosystem consists of 90% water and 10% organic matter (Wahyunto, 2006; Hooijer, 2015), so the decrease of peat water content would increase the risk for �res and smoldering peat. Fires on peat are affecting above ground biomass and the peat soil, in which the later depends on peat water table. Dried peat would easily smoldering when meet a very high temperature. These smoldering peat can burn undetected, as it moves below the surface and can cause a very devastating �res when it comes to the surface (E Burns 2008 commissioned by G. Reid, Rein et al 2009).
Data and analysis from the period of February to October 28 2015 was used to estimate areas and emissions from land and forest �res (Karlahut) in Indonesia 2015. A number of institutions/agencies have published estimated emission that from 0.8 to 1.9 Gt CO2-e. Those are including Ministry of Environment and Forestry (KLHK/MoEF), Indonesian National Institute of Aeronautics and Space (LAPAN), Global Fire Emission Database (GFED), and former REDD+ Agency. Each of these institutions use different type of satellite such as MODIS (Terra and Aqua), Landsat 7 ETM+/LDCM 8 and SPOT, as well as different technique. Section 3 reviewed the data, approach and methodology used by different institution in estimating emission from karlahut 2015.
To obtain a comprehensive picture of karlahut in Indonesia, especially with the presence of peat, burned peat, and peat emission, the selected data, method and analyses employed was further generated into peat and mineral soil (Figure 3). In the �gure 3, although the burned area (in thousand hectares) on mineral soil is wider than the one on peat soil (3a), emissions from peat �res is much higher than the one from mineral soil (3b).

Figure 3. (a) Burned area on peat and mineral soil for forested and non-forested area; (b) The associated emission for peat and mineral soil for the same land cover classes.
Data analysis at provincial level reveals that majority of the karlahut on peat occurred in South Sumatera and Central Kalimantan, followed by Riau and Jambi. While karlahut on mineral soil occurred mostly in Papua, South Kalimantan and West Kalimantan. Yet, the emission was dominated by only karlahut in the two provinces: South Sumatera and Central Kalimantan (Figure 4).
a
b

Figure 4. Karlahut on peat and mineral soil for several Provinces in Indonesia
Figure 5. Emission from karlahut on peat and mineral soil for several Provinces in Indonesia
III. Estimating the Emission of Karlahut
As stated in previous sections, four approaches that have been used to estimate emissions from land and forest �res (Karlahut) in Indonesia 2015 were assessed. Those are approaches used by global �re emission database (GFED) ( ) and three other approaches that http://www.global�redata.org/index.htmlspeci�c for calculating 2015 �res emission by Indonesian institutions namely: Approach 1 by Ministry of Environment and Forestry (MoEF), approach 2 by LAPAN and approach 3 by the former REDD+ Agency, as seen in Table 1. The approach 2 and 3 were only focused on estimating burned area (burn scar mapping), and was not speci�cally used to calculate emission from karlahut. Approach 1 was done not merely for estimating the burnt area, but also estimating the �res' emission. Detail about the four approaches were explained in Table 1.

Table 1. Approaches used by different institutions to estimate the emission of Karhutla in Indonesia
Approach Data Used Method/Period Remarks Burnt Area(Ha)
Estimated Emission
(Gt CO2 e)Uncertainty
(1) MoEF Landsat imagery 7 ETM+ / LDCM 8 with 30 meters resolution
Point density analysis to indicate the clustered MODIS hotspot, combined with manual Interpretation on Landsat imagery
Assessment period February 1 � October 28 2015
Emission has been distinguished between emission from the AGB and the peat soil
2,640,049 0.8 - 1.1 �) + 10% (AD)
(2) LAPAN MODIS 250 meters resolution; additional crosscheck using SPOT imagery
Digital Normalize Burn Scar Ratio
Assessment period from June 1 � October 31/September, 2015
The work was focused on mapping burnt scar area
2,385,112 0.8 (used the EF that employed in approach 1 and document FREL)
+ 15% (AD)
(3) Method developed by REDD+ Agency and used in document FREL/BUR
MODIS burned area estimated from number of hotspot detected by gridded 1x1 km
Hotspot selected were based on >80% threshold, and overlaid by 1x1km grid; If there are hotspot found within a grid, it's assumed that 75% of the area grid was burned
Method was used in FREL and BUR; Emission has been distinguished between emission from the AGB and the peat; the work was focused on mapping burn scar area
2.131.991 NA NA
(4) GFED MODIS burned area, fuel consumption based on biogeochemical model
The estimation was based on number of active �re and annual emission from 1997 � 2014; Assessment period July 1 � November 11, 2015
The work was from GFED
NA 1.9 >25% (total emission)
Annotation:�) An averaged peat depth assumed to be burnt for estimating peat emission factor was 33 cm based on the following �ndings. �e burned peat depth was assumed to be based on peat water table. Critical water table on peat during a long dry season, which tend to be burnt, is 40 cm (Putera and Hayasaka, 2011). Ballhorn et al. (2009), who's done his research on burned peat depth in Indonesia states that the average e�ective thickness of peat burned is 33 cm. His result was close to the similar research done by Couwenberg et al. (2009) that indicated the average e�ective thickness of peat burned in South East Asia is 34 cm. �e 33 cm burned peat depth is categorized as moderate peat �re.

Beside the data used, method developed, results and uncertainty embedded that elaborated in Table 1, advantages and disadvantages of each approach can be seen in Table 2.
Table 2. Advantages and disadvantages for each approach by various institutions
Approach Advantages Disadvantages Annotation
(1) MoEF · Minimizing probable error by point density analysis
· Gives more detail information that based on Landsat 30 meters spatial resolution
· Results provided in area calculation (DA) that later could be spatially analyzed using related emission factor (EF) to estimate the emission
· Semi manual technique· Time consuming and labor intensive· Problem of cloud, haze and thick
heavy smoke in the tropic
Provided at 1:250.000 scale and should not be used for mapping higher than 1:100.000.scale
Result presented in vector (line) data format
(2) LAPAN · Systematic approach that can be employed for frequent operational application
· More an automatic approach
· Results are in area estimates.· Detected hotspot depends on the
con�dence level used for MODIS hotspot
· The smallest size of the burned area can be detected is 6.25 ha. Smaller burned area (<6.25 ha) may be expressed as 6.25 ha area wide (over-estimate).
· Problem of clouds and thick smoke.· Need to combine with data of
higher resolution (Landsat, SPOT) to produce more detailed information
Provided at maximum 1:500.000 scale
Result presented in raster format (pixel based)
Need to be tested for operational use in the future
(3) Method developed by REDD+ Agency and used in document FREL/BUR
· Simple and faster than other methods
· More an automatic approach
· Results are in area estimates.· Detected hotspot depends on the
con�dence level used for MODIS hotspot
· Could missed some detail information due to threshold selected
· Need to combine with data of higher resolution (Landsat, SPOT) to produce more detailed information
Provided at maximum 1:500.000 scale
Result presented in raster format (pixel based)
(4) GFED · Worldwide approach, fast enough and systematically employed for all over the world
· More an automatic approach that based on models
· Likely to be online over the internet
· Results are directly in emission estimates.
· Likely having a very rough estimate with a high uncertainty (+25%)
· A better estimation on emission is available, at least, a year after the �res
· Model approach that depends on input data available
Provided in a very rough scale
Result presented in raster format (pixel based)
Annotation: �e fourth approach is rather out of country's capability to process, it's a result from http://www.global�redata.org/

IV. Understanding the MoEF approach
Among the four approaches described in earlier sections, the MoEF approach (approach 1) was the most elaborated approach in estimating emission of Karhutla 2015 in Indonesia. Detail explanation on data/method and advantages/disadvantages from Table 1 and Table 2 can be seen as follows:
1. The data selection is based on higher resolution of satellite imagery (Landsat, both Landsat 7 ETM+ and LDCM 8, with 30 m spatial resolution). The Landsat data is easily downloaded-able from or with no/low-cost.http://glovis.usgs.gov/ http://earthexplorer.usgs.gov/
2. Although the optical Landsat data are mostly disturbed by the presence of haze and smoke, the existence of area burnt was previously detected by point (MODIS hotspot) density analysis. This step minimizes effort for downloading unnecessary Landsat scenes.
3. MODIS data ( ) is free but the 250 and 500 https://�rms.modaps.eosdis.nasa.gov/download/spatial resolution may overestimating area burned that only based on the MODIS hotspot. Approach 2 and 3 are mostly based on MODIS.
4. MODIS hotspot is sensitive to threshold (con�dence level) that selected. So that several observations using threshold limit of below and above 80% should be elaborated to capture the existence of active �re. Approach 1 can eliminate this problem as Landsat will be the main data used for delineating the area burnt.
5. Polygons for burned area for approach 1 generated based on manual delineation technique, which is best for more detailed burned area mapping. Results are provided in vector format and used for data activity (DA) that can easily be analyzed using other thematic data available using GIS software. The method used in approach 1 is consistent to the Indonesia's NFMS.
It should be understood that despite of the most advantageous of approach 1, yet problem of labor intensive and time consuming (Table 2) in estimating burned area may need further consideration for future needs. For this reason, the approach 2 and 3 would be an alternative to develop and improve for future works. In general, there are some approaches available to provide data activity (DA) in term of burned area (hectare). The challenges are mostly from emission factor (EF) that in this Info Brief generated from two approaches: one provided by IPCC (2013), and the other was based on the National Forest Inventory (NFI) and additional researches. The later EF was selected as it was generated from extensive operational (of�cial) inventory data, and as explained in detail on the Forest Reference Emission Level (FREL) and Biennial Update Report (BUR) documents.
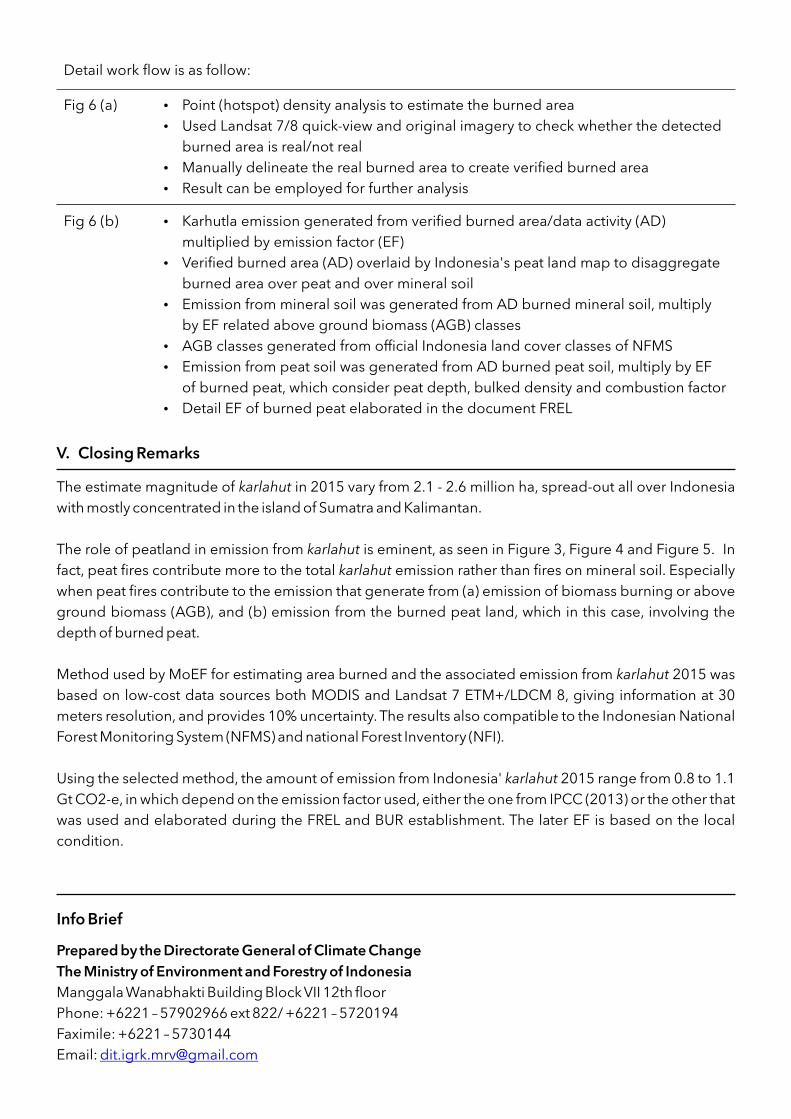
The general MoEF method employed can be seen in Figure 6, consists of (a) method used for generating burned area (data activity) and (b) method for estimating the emission from karlahut, especially over the peat.
Figure 6. (a) General method used to estimate the emission of Indonesian karlahut 2015; (b) Method to generate the activity data.
a b
V. Closing Remarks
The estimate magnitude of karlahut in 2015 vary from 2.1 - 2.6 million ha, spread-out all over Indonesia with mostly concentrated in the island of Sumatra and Kalimantan.
The role of peatland in emission from karlahut is eminent, as seen in Figure 3, Figure 4 and Figure 5. In fact, peat �res contribute more to the total karlahut emission rather than �res on mineral soil. Especially when peat �res contribute to the emission that generate from (a) emission of biomass burning or above ground biomass (AGB), and (b) emission from the burned peat land, which in this case, involving the depth of burned peat.
Method used by MoEF for estimating area burned and the associated emission from karlahut 2015 was based on low-cost data sources both MODIS and Landsat 7 ETM+/LDCM 8, giving information at 30 meters resolution, and provides 10% uncertainty. The results also compatible to the Indonesian National Forest Monitoring System (NFMS) and national Forest Inventory (NFI).
Using the selected method, the amount of emission from Indonesia' karlahut 2015 range from 0.8 to 1.1 Gt CO2-e, in which depend on the emission factor used, either the one from IPCC (2013) or the other that was used and elaborated during the FREL and BUR establishment. The later EF is based on the local condition.
Detail work �ow is as follow:
Fig 6 (a) Point (hotspot) density analysis to estimate the burned area Used Landsat 7/8 quick-view and original imagery to check whether the detected
burned area is real/not real Manually delineate the real burned area to create veri�ed burned area Result can be employed for further analysis
Fig 6 (b) Karhutla emission generated from veri�ed burned area/data activity (AD) multiplied by emission factor (EF)
Veri�ed burned area (AD) overlaid by Indonesia's peat land map to disaggregate burned area over peat and over mineral soil
Emission from mineral soil was generated from AD burned mineral soil, multiply by EF related above ground biomass (AGB) classes
AGB classes generated from of�cial Indonesia land cover classes of NFMS Emission from peat soil was generated from AD burned peat soil, multiply by EF
of burned peat, which consider peat depth, bulked density and combustion factor Detail EF of burned peat elaborated in the document FREL
Info Brief
Prepared by the Directorate General of Climate ChangeThe Ministry of Environment and Forestry of IndonesiaManggala Wanabhakti Building Block VII 12th �oorPhone: +6221 � 57902966 ext 822/ +6221 � 5720194Faximile: +6221 � 5730144Email: [email protected]