understanding recent change in the bering strait...prior data show can quantify physical fluxes,...
TRANSCRIPT

1
Understanding Recent Change in
the Bering Strait
Prior funding from NSF, ONR, NOAA-RUSALCA, and collaborations with T.Weingartner, K.Aagaard,
R.Lindsay, & T.Whitledge. Thanks to J.Johnson, D.Leech, S.Danielson, K.Runciman, C.Ferriz, W.Ermold,
M.Schmidt &crews of the Alpha Helix, Laurier, Sever, Lavrentiev, Khromov, & Norseman2
NSF-AON project, with
co-PIs: An Nguyen and Patrick Heimbach MIT/Univ of Texas Austin
Collaborators: Julie Raymond-Yakoubian, Kawerak, Inc
Cecilia Peralta-Ferriz, University of Washington
Rebecca Woodgate
University of Washington

2
Understanding Recent Change in
the Bering Strait
Quantifying Change (in a useful way)
Understanding what is driving that change
3
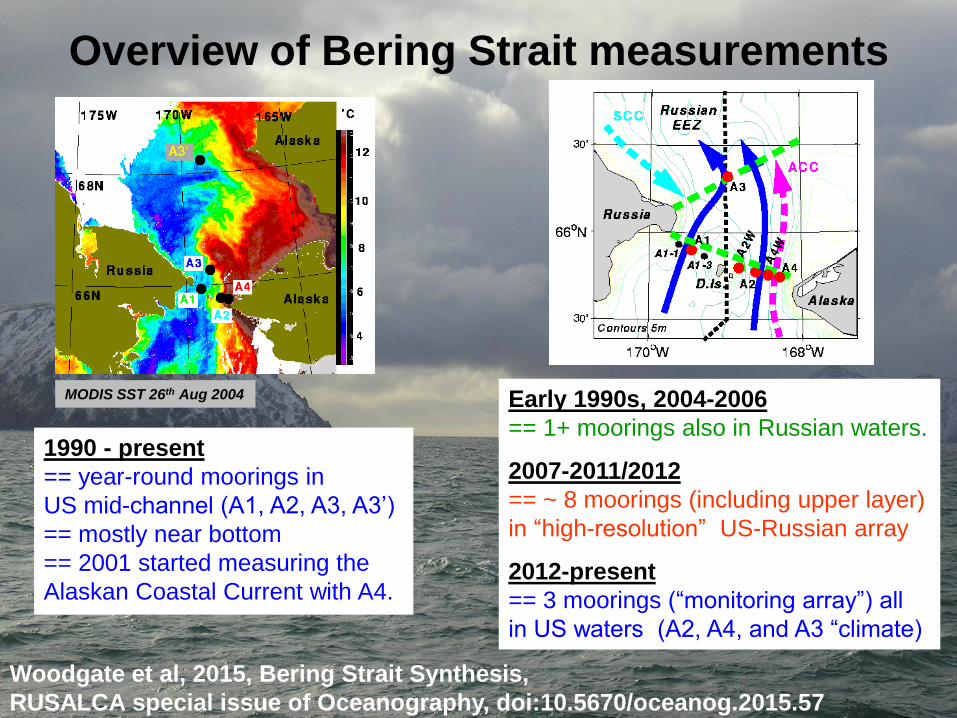
Overview of Bering Strait measurements
1990 - present
== year-round moorings in
US mid-channel (A1, A2, A3, A3’)
== mostly near bottom
== 2001 started measuring the
Alaskan Coastal Current with A4.
Early 1990s, 2004-2006
== 1+ moorings also in Russian waters.
2007-2011/2012
== ~ 8 moorings (including upper layer)
in “high-resolution” US-Russian array
2012-present
== 3 moorings (“monitoring array”) all
in US waters (A2, A4, and A3 “climate)
MODIS SST 26th Aug 2004
Woodgate et al, 2015, Bering Strait Synthesis,
RUSALCA special issue of Oceanography, doi:10.5670/oceanog.2015.57

The 3-mooring scheme for the Bering Strait throughflow
Prior data show can quantify physical fluxes, using only 3 US moorings A2,A3,A4
Velocity
- well correlated at all sites
Temperature & salinity
- A3 (climate site, black) is a
useful average of channel flows,
i.e., A1 (blue) & A2 (red)
(Can infer A1 properties to ~
0.1ºC and 0.2psu from A3 & A2)
Must also measure A4,
Alaskan Coastal Current (ACC)
~ 1/3rd of total heat flux
~ 1/4 of total freshwater flux
Alaska
Russia
66N
170W
SST
26 Aug 2004
ºC
12
10
8
6
4
A2
(ACC) (SCC)
Mean Flow
A4
A2
A1
A3

5
Continuing Increases in Bering Strait fluxes
Apart from 2012, volume transport increasing (now > 1Sv)
Modest warming (step change 2001-2002), possible freshening (if include 1991)
- with increased volume yields significant increases in Heat & Freshwater fluxes
Record freshwater fluxes (> 3500km3/yr)
No significant trends in the (shorter) A4 (ACC) timeseries
Relative to T Bering Strait
waters exit Arctic(freezing)
Relative to 34.8psu,
“mean” salinity of Arctic
Focus on A3 (blue)
A4 (ACC) (red)

6
Seasonality of the Bering Strait
Woodgate et al, 2005, GRL
Temperature Seasonality
- warm in summer
- freezing temp in winter
Salinity Seasonality
- high in winter (ice formation)
- freshening (ice melt, rivers, ACC)
- fall mixing of surface freshwaters
Grey=climatology
Colors = individual years
Transport Seasonality
- high in summer
- weak in winter
(stronger southward winds)
7
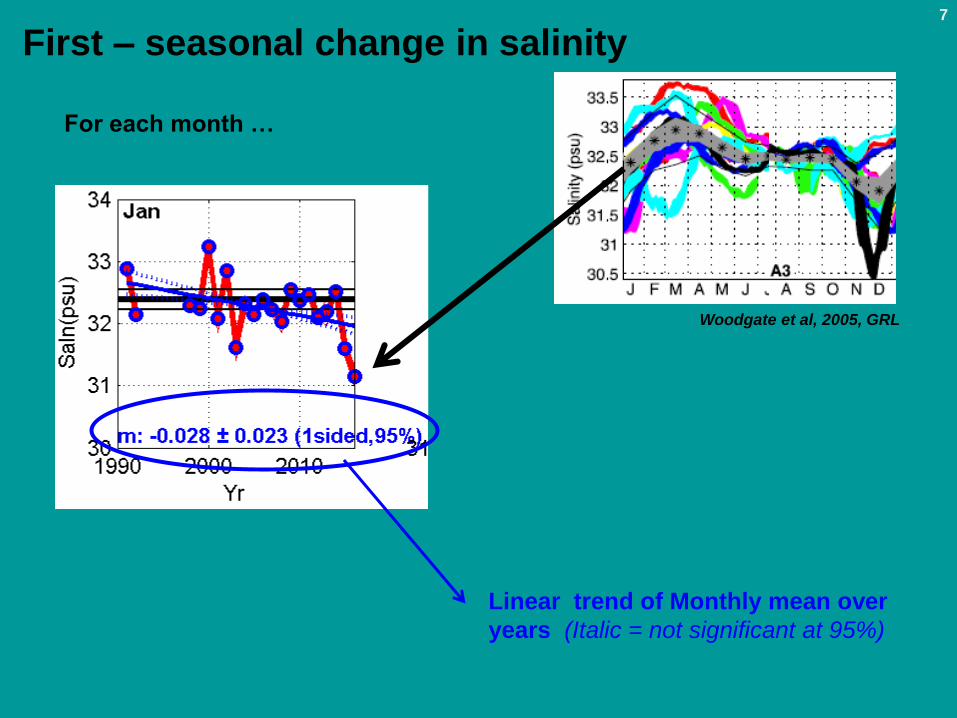
First – seasonal change in salinity
For each month …
Linear trend of Monthly mean over
years (Italic = not significant at 95%)
Woodgate et al, 2005, GRL

8
Trends in Salinity in different seasons
Statistical significant
freshening in winter/spring
Summarize those trends
by month for different periods
- blue 1990-2016
- green 1998-2016
- red 2000-2016
Only SOME months have
significant trend

9
Trends in Temperature in different seasons
Statistical significant (just)
- warming in June
- freezing pt warming in winter
Summarize those trends
by month for different periods
- blue 1990-2016
- green 1998-2016
- red 2000-2016

10
Summarize those trends
by month for different periods
- blue 1990-2016
- green 1998-2016
- red 2000-2016
Trends in Velocity in different seasons
Statistical significant
flow increase in summer

11
Grey=climatology
Colors = individual years
Change in S cycle Less ice formation?
Earlier ice melt?
More river water?
Warming, esp in
early summer Earlier arrival of warm
waters
Increasing flow in
summer
Trends in different seasons

12
Summer (May and Oct) transports significantly correlated
with annual mean transports
Monthly mean explains ??
of annual mean variance
Jan ~ 40% Feb ~ 2%
Mar ~ 17%
Apr ~ 7%
May ~ 60% Jun ~ 41%
Jul ~ 44%
Aug ~ 35% Sep ~ 17%
Oct ~ 50% Nov ~ 6%
Dec ~ 7%

13
Summer (May and Oct) transports significantly correlated
with annual mean transports
Monthly mean explains ??
of annual mean variance
Jan ~ 40% Feb ~ 2%
Mar ~ 17%
Apr ~ 7%
May ~ 60% Jun ~ 41%
Jul ~ 44%
Aug ~ 35% Sep ~ 17%
Oct ~ 50% Nov ~ 6%
Dec ~ 7%
Reconstruction (color) of
annual mean (black)

14
JGR 2015
Date of sea-ice retreat in the Chukchi
- strongly (r~0.8) with April-June Bering Strait Heat Flux
- better correlated with Bering Strait than with other temp/radiation terms

15
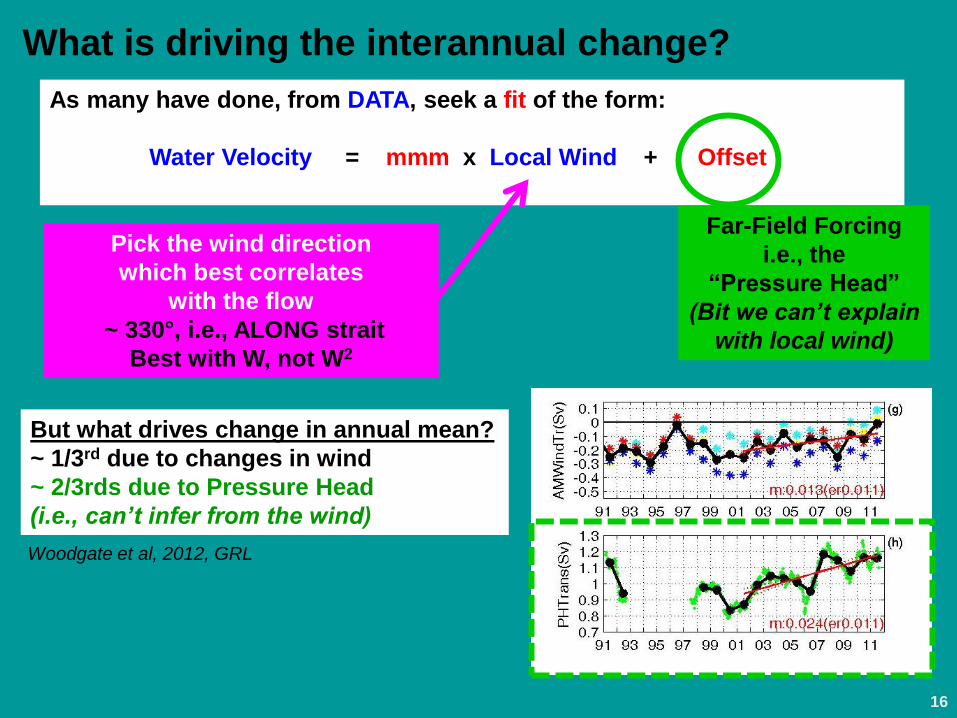
What is driving the interannual change?
As many have done, from DATA we seek a fit of the form:
Water Velocity = mmm x Local Wind + Offset
Far-Field Forcing
i.e., the
“Pressure Head”
(Bit we can’t explain
with local wind)
Pick the wind direction
which best correlates
with the flow
~ 330°, i.e., ALONG strait
best with velocity, not (velocity)2
Coachman & Aagaard, 1981,
Aagaard et al, 1985,
Woodgate et al, 2012
Woodgate, et al, 2005, DSR
Does very well, r~ 0.8, on 6hrly timescale
16
As many have done, from DATA, seek a fit of the form:
Water Velocity = mmm x Local Wind + Offset
Far-Field Forcing
i.e., the
“Pressure Head”
(Bit we can’t explain
with local wind)
Pick the wind direction
which best correlates
with the flow
~ 330°, i.e., ALONG strait
Best with W, not W2
But what drives change in annual mean?
~ 1/3rd due to changes in wind
~ 2/3rds due to Pressure Head
(i.e., can’t infer from the wind)
Woodgate et al, 2012, GRL
What is driving the interannual change?

17
More years, more moorings …
Satisfying (if perhaps not unexpected) agreement between moorings
Sizeable interannual variabiity
“Pressure Head”
Far Field Forcing
Based on fit
within 1year long
moving window
A3=black A3 scaled = grey
A1=blue
A2=red
A4=magenta

18
More years, more moorings
“Pressure Head” (PH)
Far Field Forcing
Water Velocity
=
mmm x Local Wind
+
Offset (PH)
mmm
Wind-Water
Coupling
Based on fit
within 1year long
moving window
Significant variability in mmm
(Smaller than PH change,
but still substantial)
Interannual and Seasonal
A3=black A3 scaled = grey
A1=blue
A2=red
A4=magenta

19
Return to Seasonality of Fit For each month, fit for
Water Velocity
=
mmm x Local Wind
+
Offset
mmm, Wind coupling
offset, PH
Not much seasonality in PH,
but STRONG seasonality in
strength of wind coupling
(and in correlation of wind with
water velocity)
Is this:
- ice-ocean coupling
- pressure head dominance
… or .. unreliable winds?

20
“Atmospheric Depression”
Compare: NCEP, JRA, ERA1 and observed winds at Bering Strait (Wales)
Hmm - all have a seasonal cycle
- all weak in summer, … but
large discrepancies in details.
Along
Strait
Wind
Cross
Strait
Wind
Wind
Speed

21
Return to Seasonality of Fit For each month, fit for
Water Velocity
=
mmm x Local Wind
+
Offset
mmm, Wind coupling
offset, PH
Not much seasonality in PH,
but STRONG seasonality in
strength of wind coupling
(and in correlation of wind with
water velocity)
Is this:
- ice-ocean coupling
- pressure head dominance
… or .. unreliable winds?

22
Summer (May and Oct) transports significantly correlated
with annual mean transports
Monthly mean explains ??
of annual mean variance
Jan ~ 40% Feb ~ 2%
Mar ~ 17%
Apr ~ 7%
May ~ 60% Jun ~ 41%
Jul ~ 44%
Aug ~ 35% Sep ~ 17%
Oct ~ 50% Nov ~ 6%
Dec ~ 7%
Reconstruction (color) of
annual mean (black)

23
And if seek wind coupling and PH terms by month ..
and look for significant interannual trends
offset, PH
mmm, Wind coupling
Increased coupling in winter
(more mobile ice??)
Increasing trend in PH over
almost all months

24
What IS this pressure head forcing? Satellite measured (GRACE)
Ocean Bottom Pressure
anomalies
– monthly means (2005-2010) (Peralta-Ferriz et al, in prep)
zoomed out to Pacific-Arctic

25
Look to model for guidance
Satellite measured (GRACE) Ocean Bottom
Pressure anomalies – monthly means (2005-2012) (Peralta-Ferriz et al, in prep)
ECCO2 Ocean Bottom Pressure and SSH
anomalies – monthly means (2005-2012) (Peralta-Ferriz et al, in prep – model results from An Nguyen)

Model (Adjoint) studies to test driving mechanisms
m3s-1 / ms-1 m3s-1 / ms-1 –2 months –1 months
Sensitivity of northward transport FBE
to northward wind vN
∂FBE ∂vN(x,y,-t) =
An Nguyen, Rebecca Woodgate, Patrick Heimbach

27
Some warming in early summer
Some freshening in midwinter
Velocity increases in most non-winter months
= Transports (vol, heat, freshwater) all increasing
= Mostly driven by SUMMER transport
changes
= Summer best measure of far field
(60% annual mean variance)
= Increases due to Pressure Head/Far
Field, not wind
= Adjoint and OBP to study far field
= A new seasonal climatology?