understanding sea level using real data - windows · pdf filethe reproduction of this lesson...
TRANSCRIPT
Summary Five lessons at increasing
levels of sophistication
incorporate real data from
NOAA to help students
understand how sea level is
measured and monitored
Grade Level 6 - 8
Aligned to National Standards
in Mathematics Science and
Geography See page 8
This curriculum module was developed for the NOAA Ocean Data Education (NODE) Project by Caroline Joyce and Todd Viola under a contract with the National Marine Sanctuary Foundation and in collaboration with these offices of the National Oceanic and Atmospheric Administration National Marine Sanctuary Program National Estuarine Research Reserve System and National Oceanographic Data Center
Permission is hereby granted for the reproduction of this lesson without alteration and on the condition that the acknowledgment above is cited
Understanding Sea Level Using Real Data
Table of Contents
Introduction2
Sea Level Basics2
Lesson Overview5
Using the Technology7
National Education Standards8
Reading Sea Surface Height Data11Monthly Average Sea Surface Height Deviation November 199316Monthly Average Sea Surface Height Deviation November 199517
Finding the Mean18Finding the Mean23Graph Your Results25
Reading Tide Data26What Causes Tides31Looking at Tide Data32Practice Reading Tide Data33
Measuring Storm Effects35Research Project Determining Storm Surge Height38Data Log Sheet40
Designing Your Own Investigation41Research Project Designing Your Own Investigation43Data Log Sheet44
Web Links For links to helpful Web sites
about Sea Level visit
wwwdataintheclassroomorg
Introduction
Sea level is an interesting topic which is particularly relevant in the
context of climate change and the prospect for long-term sea level rise
Data from the last hundred years already show a trend of rising sea level
around the world
Sea level or sea surface height is also a good topic to study using real
data because of the interesting data sets that are available at different
scales Satellite data gives a global view while a network of monitoring
stations and buoys provide long-term data at specific locations around
the United States Many of these different observation systems from
satellites and ground stations are part of the US Ocean and Coastal
Observing System
Studying sea surface height also provides good linkages with middle
school mathematics curricula and standards Charts of sea surface height
data are excellent examples of the use of mathematical mean or average
Through these activities students will learn how to interpret real data
that is measured relative to an historical mean
Sea Level Basics The ocean is not flat Water as a fluid is influenced by many forces that
determine its shape and thus the height of the sea around the globe
These forces include winds tides glacier melt density and gravity the
effects of which compound to determine water height around the globe at
any point in time In mathematical terms scientists studying sea level
must isolate and measure the effects of these different forces and then
add them together
One tool scientists use to measure sea level is satellite altimetry Radar
instruments onboard orbiting satellites bounce radar waves off the ocean
surface The satellite instruments record the time it takes for the radar
wave to bounce back to the satellite This measurement enables scientists
Understanding Sea Level Using Real Data 2
to calculate the distance from the satellite to the surface very accurately
(to about 2 cm or 1 in)
In order for satellite altimetry to work scientists must know precisely
where the satellite is traveling in its orbit Earth-based stations help
monitor the satellites path for this purpose Also the Earths ocean is not
shaped like a perfect sphere of water The shape of the Earths crust
causes natural variations in the height of the oceans surface around the
globe Scientists must have very good measurements and models of these
variations so they can account for them when interpreting the satellite
data Only by subtracting the known variations in the oceans height can
scientists measure changes in height caused by other factors they are
interested in studying such as tides winds and currents
The sea-surface height is the difference between the satellitersquos altitude relative to thereference ellipsoid and the altimeter rangeImage copyright CNES (httpwwwcnesfr) Used with permission
Understanding Sea Level Using Real Data 3
Satellites are not the only tools for measuring water levels The National
Oceanic and Atmospheric Administration (NOAA) has developed long-
term data sets of local tide measurements from an array of permanent
monitoring stations around the United States Over the years the
technology for recording tides has changed from early mechanical
recorders to modern acoustic and electronic devices Today this network
of monitoring stations records tide measurements electronically every six
minutes at over 250 stations around the country The data is transmitted
to NOAA headquarters via satellite where it is processed archived and
made available online
In the case of both satellite altimetry and NOAA tide monitoring stations
water level data is frequently reported relative to an average or
ldquoexpectedrdquo height based on historical data For this reason
understanding the concept of a mean or average is important to
interpreting water level data at any scale Understanding and calculating
a mean is a skill that is developed and carried through the activities in
this module
Understanding Sea Level Using Real Data 4
Scaled Levels
5 Invention
4 Interactivity
3 Adaptation
2 Adoption
1 Entry
Online Tools
Satellite altimetry data is
available at
wwwdataintheclassroomorg
A simple interactive model to
help visualize rising and
falling water along a
coastline
Lesson Overview This curriculum incorporates a scaled approach to learning Each module
offers activities at five different levels of student interaction sometimes
referred to as Entry Adoption Adaptation Interactivity and Invention
The early levels are very directed and teacher driven They are important
first steps however when learning something new The levels of
Adaptation through Invention are more student directed and open up
opportunities to design lessons featuring student inquiry
The levels serve a dual purpose They are designed to engage students in
increasingly sophisticated modes of understanding and manipulation of
data They are also intended to help you as a teacher familiarize
yourself with online tools for accessing data and to provide you with
models for integrating the use of real data into your classroom practice1
These activities utilize technology in several ways First the
dataintheclassroomorg Web site offers a simple gateway to access real
data on water levels Two data sources are used satellite altimetry and
local tide data These data are available in other places on the Internet
but through dataintheclassroomorg students can use a simple user-
friendly interface to access data in a way that directly supports these
activities
In addition to accessing data the Web site includes an interactive tide
model to help students picture the effects of rising and falling water
levels More information on the use of this model is found in activities at
Levels 2 3 and 4
1 For more information about the research behind this approach consult these papers
Dwyer D C Rwgstaff C amp Shanholtz J H (1990) Teacher beliefs and practices Part I Pattern of change ACOT Report 8 Cupertino CAApple Classroom of Tomorrow Advanced Technology Group Apple Computer Inc
Bransford JD Goin L Hasselbring TS Kinzer CK Sherwood RD amp Williams SM (1999) Learning with technology Theoretical and empirical perspectives Peabody Journal of Education 5-26
Understanding Sea Level Using Real Data 5
The chart below illustrates the five levels of this module Understanding
Sea Level Using Real Data
2
Invention Designing Your Own Investigation 5 Students will design their own plan to answer a research question They will describe how they will use data and consider the limitations of the data
Interactivity Measuring Storm Effects Using what 4 they learned about typical tide measurements at a location students will investigate and measure what happens to water height during a storm event
Adaptation Reading Tide Data Students will apply their 3 skill calculating the mean to real tide data in order to characterize the typical tide behavior at a selected location
Adoption Finding the Mean Students will generate some sample data using a simple model of the ocean Using these data they will compute values for mean and deviation in order to understand how real data is reported
Entry Reading Sea Surface Height Data Students will learn how to 1 read maps of global sea surface height deviation (SSHD) based on satellite altimetry and relate what they see to simple hands-on demonstrations of forces that influence sea surface height Teacher-led discussion and activity
The levels provide a natural opportunity for you to adapt and customize
the curriculum module as needed For example if students already have
experience with the topic you may find that you can skip the entry level
activities
Understanding Sea Level Using Real Data 6
Using the Technology Using technology in conjunction with classroom lessons presents some
challenges Because this curriculum demonstrates strategies for using
real scientific data available on the Internet it assumes that you and your
students will have access to the Internet at some point during the
investigation However because the level and availability of Internet
access varies widely from setting to setting you may need to adapt the
activities to suit your particular situation To help you the activities are
designed with flexibility in mind
For example
When access to real data is needed the Preparation section
describes steps that can be performed outside of class Data and
results can be saved for use in class
Data can be accessed through the dataintheclassroomorg Web
site using special forms that have been designed for this project
While it is recommended that you familiarize yourself with how
to access data using these tools the early lessons also contain
blackline masters of important maps graphs and other data
products which can be used in settings where live Internet
access is not available
An important outcome of these activities especially at the higher
levels is for students to learn how to access and manipulate data
themselves In the ideal case students will access the Internet
individually or in groups in order to generate maps and graphs
using real data In settings where this is not possible the
curriculum provides student masters which can be reproduced
and used in class To fully explore the questions posed in the
highest level activities however students in these settings will
need to access the Internet in a library or computer center outside
of class
Understanding Sea Level Using Real Data 7
Nat
ion
al E
du
cati
on S
tan
dar
ds
Thi
s cu
rric
ulum
mod
ule
is a
lign
ed w
ith
the
natio
nal e
duca
tion
sta
ndar
ds in
sci
ence
mat
h a
nd g
eogr
aphy
for
gra
des
5-8
The
tabl
e be
low
pre
sent
s a
list
of
core
sta
ndar
ds c
over
ed a
t the
dif
fere
nt a
ctiv
ity
leve
ls T
hese
sta
ndar
ds-b
ased
act
ivit
ies
are
desi
gned
to b
e ea
sily
inte
grat
ed in
to p
re-e
xist
ing
scho
ol s
cien
ce
and
mat
h cu
rric
ula
not
as
ldquoadd
ons
rdquo bu
t as
way
s to
enh
ance
exi
stin
g st
anda
rds-
driv
en c
urri
cula
by
usin
g re
al-t
ime
data
The
sta
ndar
ds th
at s
uppo
rt th
is
curr
icul
um f
acil
itat
e le
arni
ng b
y ha
ving
stu
dent
s pr
acti
ce u
sing
rea
l-ti
me
data
wit
hin
the
cont
ext o
f a
vari
ety
of s
tand
ards
- an
d in
quir
y-ba
sed
acti
viti
es
Mat
hem
atic
s2
Geo
gra
ph
y3 S
cien
ce4
Lev
el 1
U
se ta
bles
map
s a
nd g
raph
s to
des
crib
e si
tuat
ions
U
se th
e ch
arac
teri
stic
s f
unct
ions
and
ap
plic
atio
ns o
f sa
tell
ite-
prod
uced
imag
es a
nd
mod
els
Tech
nolo
gy is
ess
enti
al to
sci
ence
bec
ause
it
prov
ides
inst
rum
ents
and
tech
niqu
es th
at
enab
le o
bser
vati
ons
of o
bjec
ts a
nd
phen
omen
a th
at a
re o
ther
wis
e un
obse
rvab
le
due
to s
uch
fact
ors
as d
ista
nce
and
loca
tion
Phy
sica
l Sta
ndar
d C
onte
nt S
tand
ard
B
Inte
ract
ions
of
Ene
rgy
and
Mat
ter
Wav
es o
n w
ater
hav
e en
ergy
and
can
tran
sfer
ene
rgy
whe
n th
ey in
tera
ct w
ith
mat
ter
Lev
el 2
U
se o
bser
vati
ons
abou
t the
dif
fere
nces
be
twee
n tw
o di
ffer
ent c
hara
cter
isti
cs o
n th
e ba
ses
of m
aps
his
togr
ams
box
plo
ts a
nd
scat
ter
plot
s
Sel
ect a
nd u
se a
ppro
pria
te s
tati
stic
al
met
hods
to a
naly
ze d
ata
by f
indi
ng u
sing
an
d in
terp
reti
ng m
easu
res
of c
ente
r an
d sp
read
inc
ludi
ng th
e m
ean
Use
vis
uali
zati
on s
pati
al r
easo
ning
and
m
odel
ing
to s
olve
pro
blem
s
Use
men
tal m
odel
s to
iden
tify
the
loca
tion
s of
cer
tain
phy
sica
l fea
ture
s on
map
s to
mar
k m
ajor
oce
an c
urre
nts
win
d pa
tter
ns s
ea
leve
l dev
iati
ons
and
cli
mat
e re
gion
s on
a
map
Tech
nolo
gy is
ess
enti
al to
sci
ence
bec
ause
it
prov
ides
inst
rum
ents
and
tech
niqu
es th
at
enab
le o
bser
vati
ons
of o
bjec
ts a
nd
phen
omen
a th
at a
re o
ther
wis
e un
obse
rvab
le
due
to s
uch
fact
ors
as d
ista
nce
and
loca
tion
2
Nat
iona
l Cou
ncil
of
Teac
hers
of
Mat
hem
atic
s (
2001
) P
rinc
iple
s an
d St
anda
rds
for
Scho
ol M
athe
mat
ics
Was
hing
ton
DC
3
G
eogr
aphy
Edu
cati
on S
tand
ards
Pro
ject
(19
94)
Geo
grap
hy fo
r Li
fe
The
Nat
iona
l Geo
grap
hy S
tand
ards
Was
hing
ton
DC
N
atio
nal G
eogr
aphi
c So
ciet
y C
omm
itte
e on
Res
earc
h an
d E
xplo
rati
on
4
Nat
iona
l Aca
dem
y of
Sci
ence
s (
1996
) N
atio
nal S
cien
ce E
duca
tion
Sta
ndar
ds
Was
hing
ton
DC
N
atio
nal A
cade
my
Pre
ss
Und
erst
andi
ng S
ea L
evel
Usi
ng R
eal D
ata
8
Mat
hem
atic
s G
eog
rap
hy
Sci
ence
Lev
el 3
D
evel
op a
nd u
se ta
bles
gra
phs
and
rul
es to
de
scri
be a
sit
uati
on
App
ly te
chni
ques
too
ls a
ndo
r fo
rmul
as to
de
term
ine
mea
sure
men
ts to
use
as
com
mon
be
nchm
arks
fro
m w
hich
to s
elec
t app
ropr
iate
m
etho
ds f
or e
stim
atin
g m
easu
rem
ents
Use
men
tal m
odel
s to
iden
tify
loca
tion
s of
ce
rtai
n ph
ysic
al f
eatu
res
on m
aps
or p
lots
to
mar
k m
ajor
oce
an c
urre
nts
tide
s a
nd
land
form
s
Ear
th-S
pace
Sci
ence
All
stu
dent
s sh
ould
de
velo
p an
und
erst
andi
ng o
f th
e E
arth
and
S
olar
Sys
tem
Phy
sica
l Sta
ndar
d C
onte
nt S
tand
ard
B
Mot
ion
and
For
ces
Gra
vita
tion
is a
un
iver
sal f
orce
that
eac
h m
ass
exer
ts o
n an
y ot
her
mas
s T
he s
tren
gth
of th
e gr
avit
atio
nal
attr
acti
ve f
orce
bet
wee
n tw
o m
asse
s is
pr
opor
tion
al to
the
mas
ses
and
inve
rsel
y pr
opor
tion
al to
the
squa
re o
f th
e di
stan
ce
betw
een
them
Lev
el 4
S
olve
pro
blem
s th
at a
rise
in m
athe
mat
ics
and
othe
r co
ntex
ts C
reat
e an
d us
e re
pres
enta
tion
s to
org
aniz
e r
ecor
d a
nd
com
mun
icat
e m
athe
mat
ical
idea
s
Exp
lain
how
phy
sica
l pro
cess
es h
elp
to
shap
e fe
atur
es a
nd p
atte
rns
on th
e E
arth
rsquos
surf
ace
as
exem
plif
ied
by b
eing
abl
e to
co
mpa
re a
nd in
terp
ret m
aps
and
char
ts to
ex
plai
n ho
w p
hysi
cal p
roce
sses
aff
ect
feat
ures
of
the
Ear
thrsquos
sur
face
Tech
nolo
gy is
ess
enti
al to
sci
ence
bec
ause
it
prov
ides
inst
rum
ents
and
tech
niqu
es th
at
enab
le o
bser
vati
ons
of o
bjec
ts a
nd
phen
omen
a th
at a
re o
ther
wis
e un
obse
rvab
le
due
to s
uch
fact
ors
as d
ista
nce
and
loca
tion
Lev
el 5
A
pply
and
ada
pt a
var
iety
of
appr
opri
ate
stra
tegi
es to
sol
ve p
robl
ems
Id
enti
fy th
e co
ndit
ions
that
cau
se c
hang
es in
cl
imat
e an
d th
e co
nseq
uent
eff
ects
on
ocea
n le
vels
Tech
nolo
gy is
ess
enti
al to
sci
ence
bec
ause
it
prov
ides
inst
rum
ents
and
tech
niqu
es th
at
enab
le o
bser
vati
ons
of o
bjec
ts a
nd
phen
omen
a th
at a
re o
ther
wis
e un
obse
rvab
le
due
to f
acto
rs s
uch
as d
ista
nce
siz
e an
d lo
cati
on
Und
erst
andi
ng S
ea L
evel
Usi
ng R
eal D
ata
9
Ocean Literacy Essential Principles This curriculum module also supports the following Essential Principles
of Ocean Sciences5
1 The Earth has one big ocean with many features
d Sea level is the average height of the ocean relative to the
land taking into account the differences caused by tides
Sea level changes as plate tectonics cause the volume of the
ocean basins and the height of the land to change It changes
as the ice caps on land melt or grow It also changes as sea
water expands and contracts when ocean water warms and
cools
2 The ocean and life in the ocean shape the features of the Earth
b Sea level changes over time have expanded and contracted
continental shelves created and destroyed inland seas and
shaped the land surface
5 Ocean Literacy Network (2005) Ocean Literacy - The Essential Principles of Ocean Sciences K-12 Washington DC
Understanding Sea Level Using Real Data 10
Level 1 Entry Reading Sea Surface Height Data
Summary Grade Level 6-8
Teaching Time 45 minutes
Activities
Read satellite maps of sea
surface height deviation
Relate map readings to
demonstrations of
different forces that
influence sea level
deviation
Vocabulary Sea surface height deviation
(SSHD) ndash the height of the sea
surface above or below some
reference point
Pascalrsquos Principle ndash a principle
that states that pressure applied
to an enclosed liquid at rest is
transmitted undiminished to
every portion of the liquid and to
the walls of the closed
container
Satellite altimetry ndash a
technique for measuring sea
surface height using radar
instruments traveling on orbiting
satellites
Objective Students will learn how to read maps of global sea surface height
deviation (SSHD) based on satellite altimetry and relate what they see to
simple hands-on demonstrations of different forces that influence sea
surface height This is a teacher-led discussion and activity
Background Researchers believe that sea level worldwide is presently rising Over the
last 100 years global sea level has risen about 15 cm (6 in) and recently
the rate of rise has increased6 To study this phenomenon scientists need
to make good measurements of the sea surface height around the world
One tool they use is satellite altimetry which allows them to look at a
snapshot of SSHD around the world SSHD is the difference between the
height of the sea surface and the expected average height based on
historical data The scale for SSHD data is measured in meters above and
below the average (or mean) value for a given location
Looking at an SSHD map one sees immediately that sea level is not the
same everywhere Sea surface continually fluctuates due to natural
forces such as the trade winds tides waves glacier melts density and
gravity
6 Bindoff NL J Willebrand V Artale A Cazenave J Gregory S Gulev K Hanawa C Le Queacutereacute S Levitus Y Nojiri CK Shum LD Talley and A Unnikrishnan (2007) Observations Oceanic Climate Change and Sea Level In Climate Change 2007 The Physical Science Basis Contribution of Working Group I to the Fourth Assessment Report of the Intergovernmental Panel on Climate Change [Solomon S D Qin M Manning Z Chen M Marquis KB Averyt M Tignor and HL Miller (eds)] Cambridge United Kingdom and New York NY USA Cambridge University Press pp 409-410
Understanding Sea Level Using Real Data 11
Preparation
To Display If you have access to a computer and projector you can display a color
version of Monthly Average Sea Surface Height Deviation for November
1993 (shown at left) Use the following steps
1 Visit wwwdataintheclassroomorg and find the Sea Level
Generate this image at module
wwwdataintheclassroomorg
2 Follow the link to ldquoSatellite Datardquo
3 Using the form select the date 16-Nov-1993
4 Click the ldquoGet Datardquo button
5 Save the map image to your local computer On a PC right-click
with the mouse and select ldquoSave asrdquo On a Mac hold down the
Ctrl key and click with the mouse
Alternatively you can make a transparency of this map for display using
an overhead projector Copy the Teacher Master on page 16
Tip Prepare the materials you will need for the demonstrations If you do not
have a waterproof lab surface to work on you should prepare and store For best results use these materials in a large plastic tub to catch spills elongated balloons but not
the professional twist Fill a long balloon with water from a tap Do not fill it too full balloons used for making
The balloon must be allowed to stretch and change shape when animal sculptures
handled without breaking
Fill a clear-glass baking dish with water until the water is about 1
cm (frac12 in) deep Add a few drops of blue food coloring and stir
to mix the color
Understanding Sea Level Using Real Data 12
Procedure
Materials 1 Display the Monthly Average Sea Surface Height Deviation map
for November 1993 on an overhead or computer screen Explain Computer or overhead
projector the key features of the map
Map image saved to your The map shows a global view of sea surface height deviation computer or
transparency of Teacher (SSHD) The color scale indicates the difference in meters
Master above or below the average height for a given location
Long balloon x axis = longitude degrees east and west
Ruler y axis = latitude degrees north and south of the Equator Clear-glass baking dish
Straws 2 Ask the students the following series of questions
Water
Blue food coloring a) Do you think the ocean is flat
Copies of Student
Master Accept any answer
b) Do you think sea surface height is the same all over the
planet
Accept any answer Students may refer to color key to
explain differences in height
c) Can water change its shape Give examples
Accept any answer For example students may observe that
water changes shape in different containers
3 Next explain that you will do two demonstrations to show how
water is a fluid with certain characteristics The first
demonstration uses a water balloon
4 Show the students a long balloon filled with water Tell students
that the balloon containing the water is a simple model of the
ocean Lay the balloon on a flat surface Take a ruler and
Understanding Sea Level Using Real Data 13
measure the height of the balloon three inches from each end of
the balloon and in the middle The heights should be roughly
equal Explain that the water in the balloon is at rest
5 Next push down gently on the middle of the balloon with your
hand and then measure the height of the balloon 5 cm (2 in)
from each end of the balloon and in the middle The water height
should rise on the ends and decrease in the middle
6 Ask the students if any water was lost or if it just took a new
shape
Answer It took a new shape
7 Explain that the model demonstrates how water can rise or fall in
the ocean as well as in a balloon When sea level falls in one
location it rises in another Next push down on one side of the
balloon to cause the water to rise on the opposite end Ask
students what type of natural forces can make the water in the
ocean rise or fall
Possible answers wind weight of a glacier gravity tides or
atmospheric pressure systems (such as a low or high pressure
system)
8 Explain that water is a fluid and that a physicist named Pascal
stated the following important principle Pressure applied to an
enclosed liquid [balloon or the ocean] at rest is transmitted to
every portion of the liquid and to the walls of a closed container
9 Set up the next demonstration which uses a straw to imitate the
effect of wind blowing across the surface of the ocean Place the
glass baking dish with colored water on the overhead projector
Understanding Sea Level Using Real Data 14
10 Next take a straw and gently blow across the surface of the
water Ask students what they see
Answer Darker colored bands or waves moving across the dish
11 Next blow harder through the straw and ask students what they
observe The side of the dish farthest away from where you blew
from the straw should be a darker blue Ask students why they
think this is so
Answer There may be more water piled up on the opposite side
of the dish
Explain that the wind can push water around in the ocean
causing water to pile up on top of resting water This results in
greater sea surface height in some locations
12 Assign students to examine the Monthly Average Sea Surface
Height Deviation map for November 1995 and answer the
questions on the sheet
Answers Student answers will vary according to locations
chosen Students should be able to explain SSHD by describing
the possible effects of wind glacier height gravity tides or
atmospheric pressure systems
Understanding Sea Level Using Real Data 15
Teac
her
Mas
ter
Mon
thly
Ave
rage
Sea
Su
rfac
e H
eigh
t D
evia
tion
Nov
emb
er 1
993 U
nder
stan
ding
Sea
Lev
el U
sing
Rea
l Dat
a 16
Stu
dent
Mas
ter
Mon
thly
Ave
rage
Sea
Su
rfac
e H
eigh
t D
evia
tion
Nov
emb
er 1
995
Qu
esti
ons
1
Cir
cle
thre
e pl
aces
on
the
map
whe
re th
e m
easu
red
sea
surf
ace
heig
ht d
evia
tion
is m
ore
than
02
met
ers
abov
e or
bel
ow a
vera
ge
2
Rec
ord
the
appr
oxim
ate
latit
ude
and
long
itude
of
each
loca
tion
you
cho
se
3
Usi
ng th
e co
lor
key
rec
ord
the
sea
surf
ace
heig
ht d
evia
tion
at e
ach
loca
tion
you
cho
se
4
Exp
lain
wha
t mig
ht b
e ha
ppen
ing
at o
ne o
f yo
ur lo
cati
ons
In
your
exp
lana
tion
ref
er to
the
ball
oon
and
win
d de
mon
stra
tion
s yo
u sa
w in
cla
ss
Und
erst
andi
ng S
ea L
evel
Usi
ng R
eal D
ata
17
Level 2 Adoption Finding the Mean
Summary Grade Level 6 - 8
Teaching Time 45 minutes
Activities
Use a balloon model to
generate water level data
Compute a mean value
from the data
Use an online tide model
to illustrate changing
water level along a
coastline
Vocabulary Data ndashany information obtained
by observing andor measuring
Mean ndashthe arithmetic average of
a set of numbers It is found by
adding all the values in the set
and dividing the sum by the total
number of values
Deviation ndash the difference
between one data value in a set
and the mean value for that set
Objectives Students will generate some water level data using a balloon as a simple
model Students will calculate the mean and make a chart of their data
By understanding how to report data in terms of deviations from the
mean students will be prepared to interpret real sea level data from
different sources
Background The Earths oceans are not shaped like a perfect sphere of water Factors
such as the shape of the Earths crust variations in the planets
gravitational field winds and currents cause natural variations in the
height of the oceans surface around the globe Because of these natural
variations and the fact that the oceans themselves are always in motion
it is difficult to give measurements of sea surface height in absolute
terms Instead scientists measure the difference between the oceans
height and the expected or average height at any given location
Understanding the concept of a mean or average is important to
interpreting water level data at any scale Satellite-derived sea surface
height data and local tide gauge data are both reported as deviations from
an expected or mean height
Understanding Sea Level Using Real Data 18
Preparation Familiarize yourself with the online tide model so that you can
demonstrate it to the class The purpose of the interactive tide model is to
help students see the effects of typical changes in water level It is a
simple model but it can be programmed with values students derive
from real data in order to help them visualize how different factors
influence water level
Use of the tide model is optional in this activity but if you have a
computer and projector the applet is a helpful tool for illustrating and
discussing changing water level along a coastline
1 Visit wwwdataintheclassroomorg and find the Sea Level
module
2 Follow the link to ldquoTide Modelrdquo
3 In this activity you will be using the model to help illustrate how
water levels constantly change To program the model to show a
typical tidal change look for the line of controls labeled Tide
Understanding Sea Level Using Real Data 19
4 Enter 12 meters in the box labeled Max Height Change
See an Example A sample spreadsheet
showing a graph of water
height data is available at
wwwdataintheclassroomorg
5 Click the Play button to start the model The model will illustrate
the changing water level height in two ways first as an
animation of water rising and falling along the image of the
coastline and second as an animated graph showing the change
in water level over time The image and graph are synchronized
You can pause the model and enter different numbers to change
the water level behavior
Prepare the other materials you will need If you do not have a
waterproof lab surface to work on you should prepare and store these
materials in a large plastic tub to catch spills
Fill a long balloon with water from a tap Do not fill it too full The
balloon must be allowed to stretch and change shape when handled
without breaking
In this activity students will be asked to create data tables and simple
graphs using water height data they find on the Internet If you prefer
students may also use spreadsheet software such as Microsoft Excel to
help them with these tasks This is optional however
Understanding Sea Level Using Real Data 20
Materials Computer or overhead
projector
Long balloon
Water
Plastic tub or basin
Ruler
Paper and marker
Copies of Student Master
Finding the Mean
Copies of Student Master
Graph Your Results
Procedure 1 Display the online tide model on your computer or projector
Program the model with a tidal change of 12 meters as described
in the Preparation section on page 20
2 Ask students about the rising or falling water level If it is always
moving how do you get a general measurement for the water
level at a location How can you tell if a change in the water
level is large or small
Answer You compute an average or mean to describe the height
Then you can compare your measurements to the mean
3 Explain to the students that they will generate some sample
water level data using a balloon as a simple model of the ocean
in order to calculate the mean Select two students to gather data
to be used by the class
4 Have the two students perform steps 1 through 5 on the Student
Master Finding the Mean while the class follows along One
student can apply pressure to the balloon while the other
measures height data Ask all of the students in the class to
record this collected data on their own copies of the Master
5 Have all students perform step 6 on the Master They can
compute the mean of the water height data by following the
instructions
6 Have all students complete step 7 to calculate how much each
data point deviates from the mean
Understanding Sea Level Using Real Data 21
7 Ask students to complete the questions on the Master
Why are some deviation values greater than zero and some less
than zero
Answer Some height measurements are higher than average and
some are lower than average
What does it mean when a deviation value is negative
Answer It means the height measured at that point is lower than
average or less than the mean height at that point
Relate what you just learned to the color scale on the satellite
SSHD map
Answer The warm (reds and yellows) colors represent areas
where the water level is higher than average White or pale areas
represent areas where the water level is roughly the same as the
average Cool colors (blues and purples) represent areas where
the water level is lower than average
8 Finally students should graph their results following the
instructions on the Student Master Graph Your Results If they
are using spreadsheet software students may need guidance on
setting up their spreadsheet and graphs
Understanding Sea Level Using Real Data 22
Student Master
Finding the Mean Sea surface height is sometimes reported as the height difference relative to an expected or average height at
any given location In this activity you will use a balloon as a simple model of the ocean in order to collect
some data
1 Place a sheet of paper across the bottom of a waterproof plastic tub or basin Lay a balloon filled with
water across the paper
2 Sea surface height data is reported as the height difference relative to an expected or average height at
any given location Choose a location along the length of the balloon Use a marker to mark that
location next to the balloon on the paper at the bottom of the basin
3 With the balloon sitting undisturbed stand the ruler at the mark you made on the paper Measure the
height of the balloon at the mark in centimeters and record the height on the data sheet
4 Now apply pressure somewhere on the balloon so that its shape changes While pressing on the
balloon measure the height at the mark on the paper and record the height on the data sheet
5 Repeat step 4 at least three times Each time vary the pressure put on the balloon You can put
pressure on a different spot or vary the amount of pressure you apply Each time record the height on
the data sheet
Understanding Sea Level Using Real Data 23
6 Next compute the mean for the data collected
The mean is equal to the sum of all the
measurements divided by the number of
measurements recorded
mean height = sum of height measurements number of measurements
7 Once you have the mean calculate how much
each data point deviates from that mean To do
this subtract the mean from each height
measurement recorded Write the results in the
column marked Deviation
deviation = height measurement - mean height
Answer the following questions
Measure- Height (- Mean) Deviation ment
1
2
3
4
5
6
Total
Mean
1 Why are some deviation values greater than zero and some less than zero
2 What does it mean when a deviation value is negative
3 Relate what you just learned to the color scale on the satellite SSHD map
Understanding Sea Level Using Real Data 24
Student Master
Graph Your Resultsw
ater
hei
ght i
n ce
ntim
eter
s (c
m)
16
15
14
13
12
11
10
9
8
7
6
5
4
3
2
1
1 2 3 4 5 6
Measurements
Make a bar graph of the height data gathered from the balloon model Using the grid above draw a bar to
represent each height measurement you recorded
Next draw a horizontal line on the grid to represent the mean height you calculated
How are the height deviations you calculated represented on your bar chart
Understanding Sea Level Using Real Data 25
Level 3 Adaptation Reading Tide Data
Summary Grade Level 6-8
Teaching Time
Two 45 minute periods
Activities
Generate charts of real tide
data
Use tide model to help
visualize tide effects
Vocabulary Gravity ndash the force of attraction
that causes objects on Earth to
fall to the center of the Earth
Tide ndash periodic rising and falling
of the sea surface that results
from gravitational attraction of
the Moon and the Sun acting on
the rotating Earth
Tidal period ndash elapsed time
between successive high waters
and low waters
Mean low water (MLW) ndash a
reference point for measuring
tide heights based on historical
data MLW is the average water
height observed at low tide
during a 19-year period
Objective Students will go online to generate charts of real tide data Students will
apply their skill calculating the mean to real tide data in order to
characterize typical tide behavior at a selected location
Background Tides are generated by the gravitational attraction of the Moon and Sun
on the oceanrsquos waters Because the Moon is much closer to the Earth than
is the Sun its impact on ocean tides is larger despite the Suns greater
mass The gravitational pull of the Moon causes water to bulge away
from the Earth at the point closest to the Moon At the same time
centrifugal force causes a similar bulge on the opposite side of the Earth
As the Earth spins on its axis different parts of Earths surface move
through these tidal bulges resulting in a cycle of high and low tides
around the globe7
The Sun also plays a role in producing tides As the Moon orbits the
Earth its position relative to the Earth and Sun changes Sometimes the
Moon and Sun are lined up with the Earth and the resulting gravitational
pull of both bodies causes higher tides These are called spring tides and
they occur during full and new Moon phases During quarter Moon
phases when the Moon and Sun are not in line with the Earth lower
neap tides are produced
Tides do not occur with the same frequency and magnitude everywhere
Tides influence the rise and fall of water both in the open ocean and
along the coasts although that rise and fall can be much more
pronounced near land which can have an amplifying effect
7 Sverdrup K amp Armbrust E V (2008) An Introduction to the Worlds Oceans 9th ed McGraw-Hill p 284
Understanding Sea Level Using Real Data 26
Curriculum Link You can use this activity to
supplement other material in
your middle school physical
science curriculum
particularly material dealing
with tides and the
gravitational pull of the Moon
To Display
Generate this image at
wwwdataintheclassroomorg
NOAA has developed long-term data sets of local tide measurements
from an array of permanent monitoring stations around the United States
Over the years the technology for recording tides has changed from
early mechanical recorders to modern acoustic and electronic devices
Today this network of monitoring stations records tide measurements
electronically every six minutes at over 250 stations around the country
The data is transmitted to NOAA headquarters via satellite where it is
processed archived and made available online
Preparation Familiarize yourself with using the dataintheclassroomorg Web site to
generate charts from tide data
1 Visit wwwdataintheclassroomorg and find the Sea Level
module
2 Follow the link to ldquoTide Datardquo
3 Using the form select ldquoCape May NJrdquo from the list of recording
stations
4 Select a start date for the data you want to retrieve for example
08012007
5 Select an end date for example 08052007
6 Click the ldquoGet Datardquo button
7 Save the map image to your local computer On a PC right-click
with the mouse and select ldquoSave asrdquo On a Mac hold down the
Ctrl key and click with the mouse
Understanding Sea Level Using Real Data 27
Materials Procedure Computer or overhead 1 On an overhead projector display the Teacher Master What
projector Causes Tides Point out that tides are caused by the pull of Transparency of Teacher gravity between the Moon Sun and Earth Ask students to
Master What Causes indicate where the water has a bulge
Tides
Tide chart saved to your Answer The water bulges in alignment with the pull of the computer or transparency
Moonrsquos gravity of the Teacher Master
Looking at Tide Data Explain that because the Earth and Moon are relatively close to
Copies of Student one another in space the force of gravity between them is strong
Master Practice Reading The gravitational pull of the Moon causes water to bulge away
Tide Data from the Earth as it tries to move toward the Moon This effect
Rulers moves around the globe as the Earth and the Moon move
relative to each other
2 Display the tide chart from Cape May NJ (either from the file
saved on your computer or using a transparency of the Teacher
Master Looking at Tide Data) Describe features of the chart
The y-axis on the chart shows the height of the water relative
to the mean low water (MLW) Mean low water is a
reference point used by scientists for measuring tide heights
based on historical data MLW is the average water height
observed at low tide during a 19-year period
The x-axis shows the date and time of the water level
observations Look carefully at the time scale In the
example shown on the Master the x-axis is labeled every 20
hours
Along the y-axis the measurement from the lowest point to
the highest point in each tide cycle is the change in water
level due to the tide
Along the x-axis the measurement between consecutive low
tides or consecutive high tides is the period of the tidal cycle
Understanding Sea Level Using Real Data 28
Online Tool
Use the tide model to
visualize students data Visit
wwwdataintheclassroomorg
3 Explain that students will go online to generate tide charts for
themselves using real data Their task is to measure the tide
height change and period from data collected at a monitoring a
station
4 If you have not done so in earlier activities use a computer and
projector to demonstrate how to use the dataintheclassroomorg
Web site to generate graphs of tide data Refer to the Preparation
steps described on page 27
5 Students will need to access the Internet to generate and save
data maps and graphs Depending on the setting this can be done
in a computer lab or assigned as homework assuming students
have access to the Internet at a library or computer center
Students should follow the instructions on the Student Master
and record their data and calculations on the table provided
6 When students have finished gathering data and making
calculations conclude the activity with a demonstration to help
students visualize their data Follow the procedure on page 19 to
display the online tide model
Ask for a volunteer to enter his or her data into the model Look
for the line of controls labeled Tide Enter the averages he or she
calculated from the box on the data sheet labeled Max Height
Change
Click the Play button to start the model The model will illustrate
the changing water level height in two ways first as an
animation of water rising and falling along the image of the
coastline and second as an animated graph showing the change
in water level over time The image and graph are synchronized
You can stop the model and enter different numbers to change
the behavior
Understanding Sea Level Using Real Data 29
Assessment Rubric In assessing student performance consider how students approached
collecting their tide data and what calculations they made based on the
data
Successful student work may include
Correct use of the y-axis to measure height changes and the x-
axis to measure time intervals
A selection of data from a selected station during several
different periods of time
Calculation of the average low tide height high tide height and
height change using data from different time periods
A working definition of a mean or average
A working definition of relative height change or deviation
Depending on the measuring station and time period selected the tide
data chart may look different than the example charts provided in these
pages Students may encounter multiple small highs and lows that they
may find difficult to interpret Be prepared to guide students through the
process of making their measurements on more complicated tide charts
Understanding Sea Level Using Real Data 30
Teac
her
Mas
ter
Wh
at C
ause
s T
ides
Uni
form
wat
er le
vel
The
gra
vita
tiona
l pul
l of
the
Moo
n ca
uses
wat
er
to b
ulge
aw
ay f
rom
the
Ear
th a
t the
poi
nt
clos
est t
o th
e M
oon
Moo
n
Ear
th
At t
he s
ame
time
cen
trifu
gal f
orce
cau
ses
a si
mila
r bu
lge
on th
e op
posi
te s
ide
of th
e E
arth
Ada
pted
fro
m S
verd
rup
K amp
Arm
brus
t E
V (
2008
) A
n In
trod
ucti
on to
the
Wor
lds
Oce
ans
9th
ed
McG
raw
-Hil
l F
igur
e 11
5 p
284
Moo
n im
age
NA
SA
Und
erst
andi
ng S
ea L
evel
Usi
ng R
eal D
ata
31
Teac
her
Mas
ter
Loo
kin
g at
Tid
e D
ata
Alo
ng th
e y-
axis
the
mea
sure
men
t fro
m th
e lo
wes
t poi
nt to
the
high
est
Alo
ng th
e x-
axis
the
mea
sure
men
t bet
wee
n co
nsec
utiv
e lo
w ti
des
or
poin
t in
each
cyc
le is
the
tida
l cha
nge
in w
ater
leve
l co
nsec
utiv
e hi
gh ti
des
is th
e ti
me
peri
od o
f th
e ti
dal c
ycle
Und
erst
andi
ng S
ea L
evel
Usi
ng R
eal D
ata
32
Student Master
Practice Reading Tide Data Water level around the globe is always changing as a result of many factors One of those factors is the effect
of tides caused by the gravitational attraction of the Moon In this activity you will use charts of real tide
data like the one shown below to research tides in a specific location Your goal is to describe the typical
height change and period of the tidal change
1 Visit wwwdataintheclassroomorg and find the Sea Level module
2 Follow the link to ldquoTide Datardquo
3 Choose a location you wish to study and write the name on your data sheet Using the form on the
Web site select the location from the list of recording stations
4 Select a start and end date for the data you wish to retrieve Be sure to retrieve data over a period of at
least several days so that you can see a number of tide cycles
5 Click the ldquoGet Datardquo button
6 If you have access to a printer print a copy of the tide data chart Otherwise save a copy to your
computer so that you can refer to it later On a PC right-click with the mouse and select ldquoSave asrdquo
On a Mac hold down the Ctrl key and click with the mouse
Understanding Sea Level Using Real Data 33
7 Look at the chart and see if you can identify a pattern of low and high tides Choose a point on the
chart that represents a low tide Use the scale on the y-axis to determine the relative height of the
water at that point Record the approximate time and the relative water height on your data sheet
8 Now find the point that represents the next high tide and record the relative height of the water then
9 Calculate the difference between the water height at high and low tides This is the height change
Record this change on your data sheet
10 Next choose two points on the chart that represent consecutive low or consecutive high tides Use the
time scale on the x-axis to determine the time period of the tide cycle Record the period on your data
sheet
Do you think the measurements you just made provide a good description of the tides at this location
Hint Make measurements using data from the same location at other times to see if the tides are different
Once you have made several measurements can you make calculations to find the average height
change and period from the data you collected
Data Sheet
Station Name
Date Time (Approx) Low Tide High Tide Tide Height Tide CycleHeight Height Change Period
08022007 2000 0 m 175 m 175 m 12 hrs
Understanding Sea Level Using Real Data 34
Level 4 Interactivity Measuring Storm Effects
Summary Grade Level 6-8
Teaching Time
Two 45 minute periods
Activities
Get water height data for
storm events
Create a research plan
using real data
Use interactive tide model
to visualize storm effects
Vocabulary Storm tide ndash a storm surge
event that takes place along the
coast which produces
exceptionally high water A
storm tide is generated by
storm wind stress and low
atmospheric pressure Storm
surges are made even higher
when associated with high tide
and shallow depths
Objective Using what they learned about typical tide measurements at a location
students will investigate and measure what happens to water height
during a storm event
Background Storms can have a big impact on local water levels in coastal areas A
storm surge happens when water is pushed toward the shore by high
powered winds from a storm such as a hurricane The storm interacts
with the normal tide to create a storm tide that can increase the normal
water height by 4 to 5 meters (15 feet) or more These events can cause
extreme flooding in coastal areas Most coastlines in the United States
are only 3 meters (10 feet) or less above mean sea level which means
that storms can be very dangerous for people who live near the coast8
During this lesson students are asked to answer a research question
How do storm events impact water levels at a coastal location To
accomplish this task students must take the calculations they made in the
last activity and use them as a baseline to evaluate the tide heights
observed during a storm
8 Ross A R(1995) Introduction to Oceanography New York Harper Collins p 230
Understanding Sea Level Using Real Data 35
Materials Procedure Computer or overhead 1 On an overhead projector display a news report from a recent
projector storm Copies of Student
Master Research Project Explain that water level is affected by lots of different factors Determining Storm Surge not just tides and that these factors actually compound or add Height together
Copies of Student
Master Data Log Sheet 2 Explain that students will continue the investigation of water Rulers
level from the last activity This time they will go online to look
at data related to storms Their task is to make a research plan
using real data to describe the effects of storms on coastal water
levels Their goal is to determine the additional effect a storm
can have on water height
3 Students will need to access the Internet to generate and save
data maps and graphs Depending on the setting this can be done
in a computer lab or assigned as homework assuming students
have access to the Internet at a library or computer center
Students should follow the instructions on the Student Master
Research Project Determining Storm Surge Height and record
their data and calculations on the table provided
4 When students have finished gathering data and making
calculations conclude the activity with a demonstration to help
students visualize their data Follow the procedure on page 19 to
display the online tide model
Ask for a volunteer to enter his or her data into the model Look
for the line of controls labeled Storm The student should enter
the storm surge height and duration he or she calculated in the
boxes from the Data Log Sheet labeled Max Height Change
Click the Play button to start the model You can stop the model
and enter different numbers to change the behavior
Understanding Sea Level Using Real Data 36
Assessment Rubric In assessing student performance consider how students approached
collecting their tide data and what calculations they made based on the
data
Successful student work may include
Correct use of the y-axis to measure height changes and the x-
axis to measure time intervals
A selection of data from a selected station during several
different periods of time In particular students should attempt to
determine how long the storm impacted the area ndash from when the
storm effect was first seen to when it went away
Determine the maximum high tide recorded during the storm
Calculation of the difference between the maximum high tide
and the average high tide they found in the last activity
A working definition of a mean or average
A working definition of relative height change or deviation
Understanding Sea Level Using Real Data 37
Student Master
Research Project Determining Storm Surge Height You are joining a team of scientists who are studying the effects of storms along the US coast Your task is to
pick a storm event for a coastal location and design a research plan to help you gather data about the water
height before during and after the storm You already know something about the typical or average water
height in the area due to tides Your goal now is to determine the additional effect a storm can have on water
height Once your plan is accepted you are to carry out your data collection analyze it and report your
findings to the team
Planning your project
1 Form a hypothesis before designing your investigation
Research question How do storm events impact water levels at my coastal location
Hypothesis Storms produce a surge which raises water levels above what would normally occur
during a typical tide cycle
2 Design a plan to test your hypothesis and answer your research question
What do you need
a) More information Do you need more information about specific storm events and their effects
b) Specific data When you go online to collect data what dates will you look at and what charts
will you generate
3 Go online and get data
a) Visit wwwdataintheclassroomorg and find the Sea Level module
b) Follow the link to ldquoTide Datardquo
c) Choose a location you wish to study and write the name on your data sheet Using the form on
the Web site select the location from the list of recording stations
d) Search Internet news and weather sources for information about storms that impacted the area
near your station Identify a storm event to investigate and take note of the date of the storm
Understanding Sea Level Using Real Data 38
e) Using the form on the Web site select start and end dates around the time of the storm event you
found
f) Click the ldquoGet Datardquo button
g) If you have access to a printer print a copy of the tide data chart Otherwise save a copy to your
computer so that you can refer to it later On a PC right-click with the mouse and select ldquoSave
asrdquo On a Mac hold down the Ctrl key and click with the mouse
4 Use the Data Log Sheet to keep a record of the data you select so you can refer to it later
5 Analyze the data
a) What were the highest and lowest tides recorded during the storm event
b) How did the tides during the storm compare with the average high and low tides you calculated
for this station previously
c) Calculate the different between the highest tide measured during the storm and the average high
tide for the area
d) Can you use the data to determine how long the storm impacted the area
6 Draw conclusions
Write down what you learned from your investigation Use your data to help you decide if your
hypothesis was supported
Understanding Sea Level Using Real Data 39
Student Master
Data Log Sheet
Station Name
Date Time (Approx) Low Tide Height
High TideHeight
Tide HeightChange
Tide CyclePeriod
Understanding Sea Level Using Real Data 40
Level 5 Invention Designing Your Own Investigation
Summary Grade Level 6-8
Teaching Time
Two 45 minute periods
Activity
Design an investigation
using real data to examine
a hypothesis
Web Links For links to long-term sea
level trend data visit
wwwdataintheclassroomorg
Objective Students will apply what they have learned to consider sea level data on
a larger scale To do this students will design their own plan to answer a
research question using real data
Background Students have used real data to begin to understand changes in water
levels Most of the work has been an examination of how sea level
changes on a relatively small scale ndash at a single location or station and
over a very short period of time Now it is time for students to examine
sea level on a larger scale by developing their own investigation using
real data
Students should be encouraged to develop their own research questions
and hypotheses for this activity In general questions that lead them to
considering changes in water level on a larger scale will provide a good
starting point Here are some examples of questions
Research questions
Do changes in water level have the same impact everywhere on Earth
How is sea surface height changing over time
Students choosing to look at changes in sea level over time will naturally
consider the prospect of long-term sea level rise due to climate change It
may not be easy for students to detect and interpret long-term trends
using the kinds of data tools and analysis available to them However
links to long-term trend analyses are available and students can be
challenged to apply what they have learned about reading and
understanding data to interpret these long-term data products
Understanding Sea Level Using Real Data 41
Procedure
Materials 1 Distribute the Student Master Research Project Designing Your
Own Investigation and Student Master Data Log Sheet Copies of Student
Master Research Project 2 Guide student selection of a research question (or allow students
Designing Your Own to make up their own) that is appropriate to their academic Investigation
Copies of Student experience Review student hypotheses to make sure they are
Master Data Log Sheet appropriate and that students will be able to support or disprove
Student access to them using the kinds of data they will have available
computers with Internet
connections 3 Have students design a research project to answer the question
4 Check each research project plan before students begin to see if
it is in keeping with the question and the resources available
5 Assign students to use the tools at wwwdataintheclassroomorg
to access the data they need
6 When students complete their research provide time for them to
present their findings
7 Use the student presentations as an opportunity to relate this
investigation to the current news and debate about global climate
change Ask From your own experience looking at real data
how do these data relate to the question of global climate
change
Understanding Sea Level Using Real Data 42
Student Master
Research Project Designing Your Own Investigation
Planning your project
1 Develop a research question Then form a hypothesis to investigate
Be sure to review your hypothesis with your teacher before you begin
Research question
Hypothesis
2 Design a plan to test your hypothesis and answer the research question
What do you need
a) More information
b) Specific data
3 Go online and get data
a) Visit wwwdataintheclassroomorg and find the Sea Level module
b) Follow the link to ldquoSatellite Datardquo or ldquoTide Datardquo
c) Using the form select the data and parameters you wish to look at
d) Click the ldquoGet Datardquo button
4 Use the Data Log Sheet to keep a record of the data you select so you can refer to it later
5 Analyze the data
6 Draw conclusions
Write down what you learned from your investigation Use your data to help you decide whether your
hypothesis is supported If your hypothesis is not supported think about other data you might need to
collect
Understanding Sea Level Using Real Data 43
Student Master
Data Log Sheet As you use the online data access form to select data about sea level keep a record of the parameters you
select on this data log sheet Your data log will help you remember and keep track of the data you have
looked at Consider whether each new piece of data helps support or disprove your hypothesis
Data set Region Station Dates Notes
Understanding Sea Level Using Real Data 44
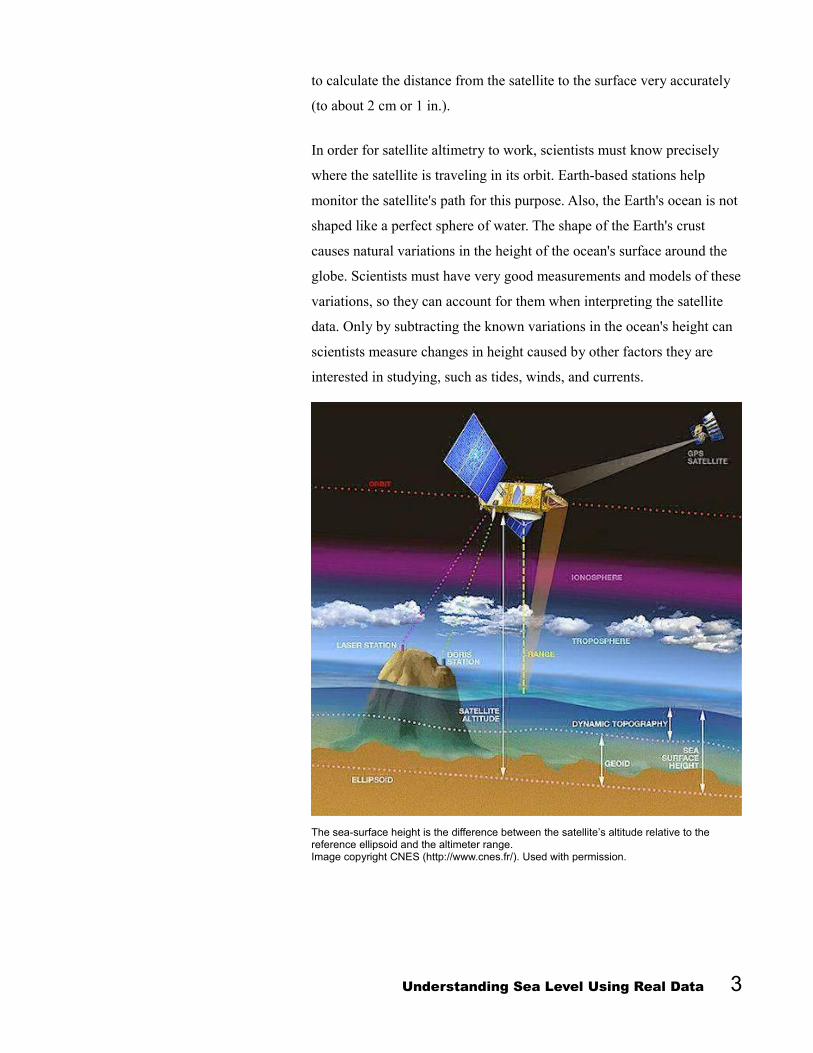
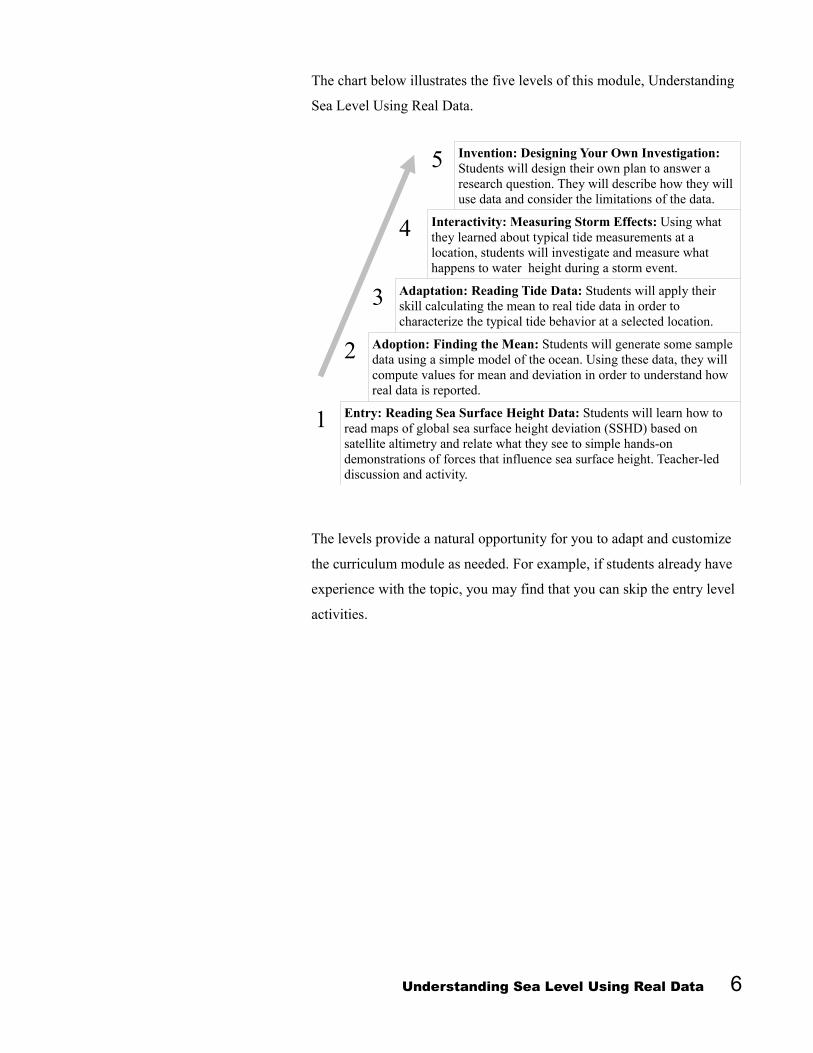
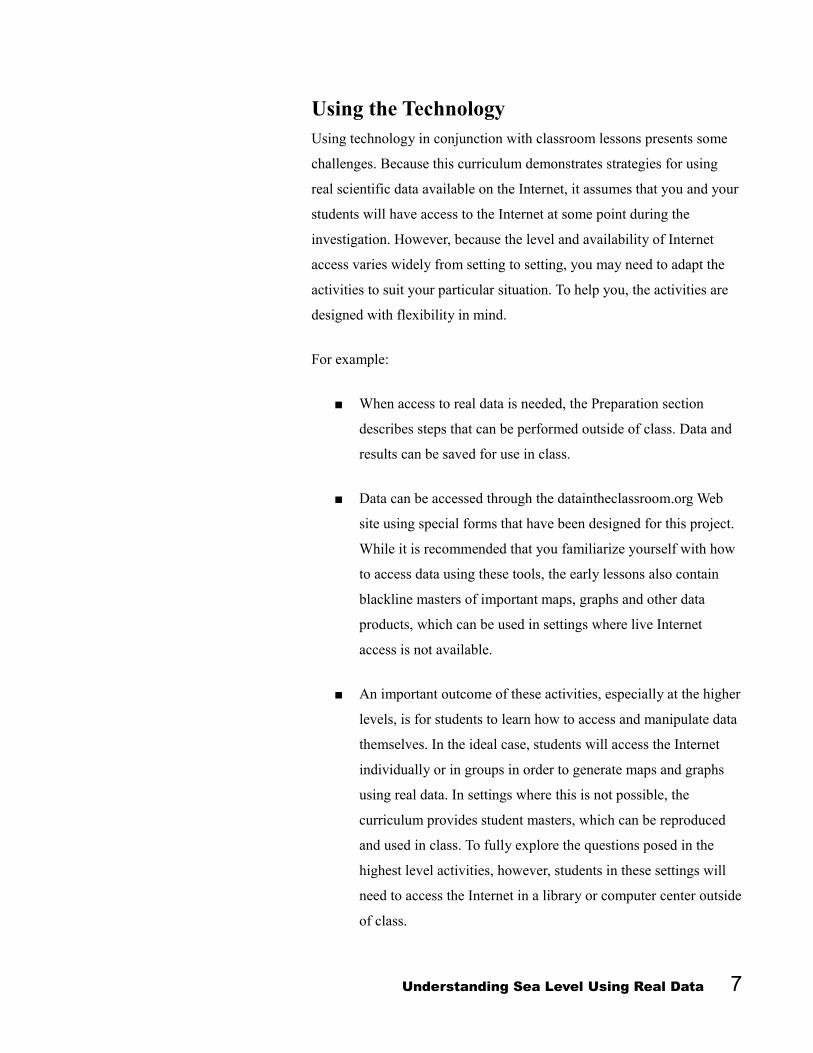
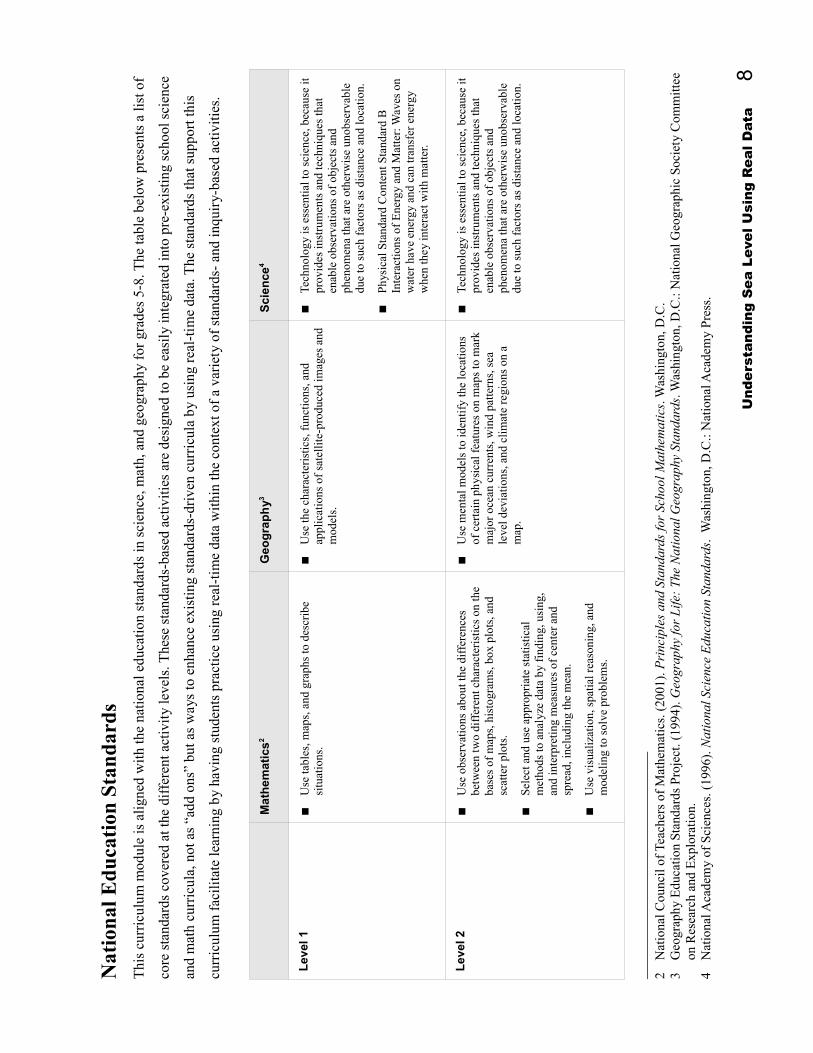
Nat
ion
al E
du
cati
on S
tan
dar
ds
Thi
s cu
rric
ulum
mod
ule
is a
lign
ed w
ith
the
natio
nal e
duca
tion
sta
ndar
ds in
sci
ence
mat
h a
nd g
eogr
aphy
for
gra
des
5-8
The
tabl
e be
low
pre
sent
s a
list
of
core
sta
ndar
ds c
over
ed a
t the
dif
fere
nt a
ctiv
ity
leve
ls T
hese
sta
ndar
ds-b
ased
act
ivit
ies
are
desi
gned
to b
e ea
sily
inte
grat
ed in
to p
re-e
xist
ing
scho
ol s
cien
ce
and
mat
h cu
rric
ula
not
as
ldquoadd
ons
rdquo bu
t as
way
s to
enh
ance
exi
stin
g st
anda
rds-
driv
en c
urri
cula
by
usin
g re
al-t
ime
data
The
sta
ndar
ds th
at s
uppo
rt th
is
curr
icul
um f
acil
itat
e le
arni
ng b
y ha
ving
stu
dent
s pr
acti
ce u
sing
rea
l-ti
me
data
wit
hin
the
cont
ext o
f a
vari
ety
of s
tand
ards
- an
d in
quir
y-ba
sed
acti
viti
es
Mat
hem
atic
s2
Geo
gra
ph
y3 S
cien
ce4
Lev
el 1
U
se ta
bles
map
s a
nd g
raph
s to
des
crib
e si
tuat
ions
U
se th
e ch
arac
teri
stic
s f
unct
ions
and
ap
plic
atio
ns o
f sa
tell
ite-
prod
uced
imag
es a
nd
mod
els
Tech
nolo
gy is
ess
enti
al to
sci
ence
bec
ause
it
prov
ides
inst
rum
ents
and
tech
niqu
es th
at
enab
le o
bser
vati
ons
of o
bjec
ts a
nd
phen
omen
a th
at a
re o
ther
wis
e un
obse
rvab
le
due
to s
uch
fact
ors
as d
ista
nce
and
loca
tion
Phy
sica
l Sta
ndar
d C
onte
nt S
tand
ard
B
Inte
ract
ions
of
Ene
rgy
and
Mat
ter
Wav
es o
n w
ater
hav
e en
ergy
and
can
tran
sfer
ene
rgy
whe
n th
ey in
tera
ct w
ith
mat
ter
Lev
el 2
U
se o
bser
vati
ons
abou
t the
dif
fere
nces
be
twee
n tw
o di
ffer
ent c
hara
cter
isti
cs o
n th
e ba
ses
of m
aps
his
togr
ams
box
plo
ts a
nd
scat
ter
plot
s
Sel
ect a
nd u
se a
ppro
pria
te s
tati
stic
al
met
hods
to a
naly
ze d
ata
by f
indi
ng u
sing
an
d in
terp
reti
ng m
easu
res
of c
ente
r an
d sp
read
inc
ludi
ng th
e m
ean
Use
vis
uali
zati
on s
pati
al r
easo
ning
and
m
odel
ing
to s
olve
pro
blem
s
Use
men
tal m
odel
s to
iden
tify
the
loca
tion
s of
cer
tain
phy
sica
l fea
ture
s on
map
s to
mar
k m
ajor
oce
an c
urre
nts
win
d pa
tter
ns s
ea
leve
l dev
iati
ons
and
cli
mat
e re
gion
s on
a
map
Tech
nolo
gy is
ess
enti
al to
sci
ence
bec
ause
it
prov
ides
inst
rum
ents
and
tech
niqu
es th
at
enab
le o
bser
vati
ons
of o
bjec
ts a
nd
phen
omen
a th
at a
re o
ther
wis
e un
obse
rvab
le
due
to s
uch
fact
ors
as d
ista
nce
and
loca
tion
2
Nat
iona
l Cou
ncil
of
Teac
hers
of
Mat
hem
atic
s (
2001
) P
rinc
iple
s an
d St
anda
rds
for
Scho
ol M
athe
mat
ics
Was
hing
ton
DC
3
G
eogr
aphy
Edu
cati
on S
tand
ards
Pro
ject
(19
94)
Geo
grap
hy fo
r Li
fe
The
Nat
iona
l Geo
grap
hy S
tand
ards
Was
hing
ton
DC
N
atio
nal G
eogr
aphi
c So
ciet
y C
omm
itte
e on
Res
earc
h an
d E
xplo
rati
on
4
Nat
iona
l Aca
dem
y of
Sci
ence
s (
1996
) N
atio
nal S
cien
ce E
duca
tion
Sta
ndar
ds
Was
hing
ton
DC
N
atio
nal A
cade
my
Pre
ss
Und
erst
andi
ng S
ea L
evel
Usi
ng R
eal D
ata
8
Mat
hem
atic
s G
eog
rap
hy
Sci
ence
Lev
el 3
D
evel
op a
nd u
se ta
bles
gra
phs
and
rul
es to
de
scri
be a
sit
uati
on
App
ly te
chni
ques
too
ls a
ndo
r fo
rmul
as to
de
term
ine
mea
sure
men
ts to
use
as
com
mon
be
nchm
arks
fro
m w
hich
to s
elec
t app
ropr
iate
m
etho
ds f
or e
stim
atin
g m
easu
rem
ents
Use
men
tal m
odel
s to
iden
tify
loca
tion
s of
ce
rtai
n ph
ysic
al f
eatu
res
on m
aps
or p
lots
to
mar
k m
ajor
oce
an c
urre
nts
tide
s a
nd
land
form
s
Ear
th-S
pace
Sci
ence
All
stu
dent
s sh
ould
de
velo
p an
und
erst
andi
ng o
f th
e E
arth
and
S
olar
Sys
tem
Phy
sica
l Sta
ndar
d C
onte
nt S
tand
ard
B
Mot
ion
and
For
ces
Gra
vita
tion
is a
un
iver
sal f
orce
that
eac
h m
ass
exer
ts o
n an
y ot
her
mas
s T
he s
tren
gth
of th
e gr
avit
atio
nal
attr
acti
ve f
orce
bet
wee
n tw
o m
asse
s is
pr
opor
tion
al to
the
mas
ses
and
inve
rsel
y pr
opor
tion
al to
the
squa
re o
f th
e di
stan
ce
betw
een
them
Lev
el 4
S
olve
pro
blem
s th
at a
rise
in m
athe
mat
ics
and
othe
r co
ntex
ts C
reat
e an
d us
e re
pres
enta
tion
s to
org
aniz
e r
ecor
d a
nd
com
mun
icat
e m
athe
mat
ical
idea
s
Exp
lain
how
phy
sica
l pro
cess
es h
elp
to
shap
e fe
atur
es a
nd p
atte
rns
on th
e E
arth
rsquos
surf
ace
as
exem
plif
ied
by b
eing
abl
e to
co
mpa
re a
nd in
terp
ret m
aps
and
char
ts to
ex
plai
n ho
w p
hysi
cal p
roce
sses
aff
ect
feat
ures
of
the
Ear
thrsquos
sur
face
Tech
nolo
gy is
ess
enti
al to
sci
ence
bec
ause
it
prov
ides
inst
rum
ents
and
tech
niqu
es th
at
enab
le o
bser
vati
ons
of o
bjec
ts a
nd
phen
omen
a th
at a
re o
ther
wis
e un
obse
rvab
le
due
to s
uch
fact
ors
as d
ista
nce
and
loca
tion
Lev
el 5
A
pply
and
ada
pt a
var
iety
of
appr
opri
ate
stra
tegi
es to
sol
ve p
robl
ems
Id
enti
fy th
e co
ndit
ions
that
cau
se c
hang
es in
cl
imat
e an
d th
e co
nseq
uent
eff
ects
on
ocea
n le
vels
Tech
nolo
gy is
ess
enti
al to
sci
ence
bec
ause
it
prov
ides
inst
rum
ents
and
tech
niqu
es th
at
enab
le o
bser
vati
ons
of o
bjec
ts a
nd
phen
omen
a th
at a
re o
ther
wis
e un
obse
rvab
le
due
to f
acto
rs s
uch
as d
ista
nce
siz
e an
d lo
cati
on
Und
erst
andi
ng S
ea L
evel
Usi
ng R
eal D
ata
9
Ocean Literacy Essential Principles This curriculum module also supports the following Essential Principles
of Ocean Sciences5
1 The Earth has one big ocean with many features
d Sea level is the average height of the ocean relative to the
land taking into account the differences caused by tides
Sea level changes as plate tectonics cause the volume of the
ocean basins and the height of the land to change It changes
as the ice caps on land melt or grow It also changes as sea
water expands and contracts when ocean water warms and
cools
2 The ocean and life in the ocean shape the features of the Earth
b Sea level changes over time have expanded and contracted
continental shelves created and destroyed inland seas and
shaped the land surface
5 Ocean Literacy Network (2005) Ocean Literacy - The Essential Principles of Ocean Sciences K-12 Washington DC
Understanding Sea Level Using Real Data 10
Level 1 Entry Reading Sea Surface Height Data
Summary Grade Level 6-8
Teaching Time 45 minutes
Activities
Read satellite maps of sea
surface height deviation
Relate map readings to
demonstrations of
different forces that
influence sea level
deviation
Vocabulary Sea surface height deviation
(SSHD) ndash the height of the sea
surface above or below some
reference point
Pascalrsquos Principle ndash a principle
that states that pressure applied
to an enclosed liquid at rest is
transmitted undiminished to
every portion of the liquid and to
the walls of the closed
container
Satellite altimetry ndash a
technique for measuring sea
surface height using radar
instruments traveling on orbiting
satellites
Objective Students will learn how to read maps of global sea surface height
deviation (SSHD) based on satellite altimetry and relate what they see to
simple hands-on demonstrations of different forces that influence sea
surface height This is a teacher-led discussion and activity
Background Researchers believe that sea level worldwide is presently rising Over the
last 100 years global sea level has risen about 15 cm (6 in) and recently
the rate of rise has increased6 To study this phenomenon scientists need
to make good measurements of the sea surface height around the world
One tool they use is satellite altimetry which allows them to look at a
snapshot of SSHD around the world SSHD is the difference between the
height of the sea surface and the expected average height based on
historical data The scale for SSHD data is measured in meters above and
below the average (or mean) value for a given location
Looking at an SSHD map one sees immediately that sea level is not the
same everywhere Sea surface continually fluctuates due to natural
forces such as the trade winds tides waves glacier melts density and
gravity
6 Bindoff NL J Willebrand V Artale A Cazenave J Gregory S Gulev K Hanawa C Le Queacutereacute S Levitus Y Nojiri CK Shum LD Talley and A Unnikrishnan (2007) Observations Oceanic Climate Change and Sea Level In Climate Change 2007 The Physical Science Basis Contribution of Working Group I to the Fourth Assessment Report of the Intergovernmental Panel on Climate Change [Solomon S D Qin M Manning Z Chen M Marquis KB Averyt M Tignor and HL Miller (eds)] Cambridge United Kingdom and New York NY USA Cambridge University Press pp 409-410
Understanding Sea Level Using Real Data 11
Preparation
To Display If you have access to a computer and projector you can display a color
version of Monthly Average Sea Surface Height Deviation for November
1993 (shown at left) Use the following steps
1 Visit wwwdataintheclassroomorg and find the Sea Level
Generate this image at module
wwwdataintheclassroomorg
2 Follow the link to ldquoSatellite Datardquo
3 Using the form select the date 16-Nov-1993
4 Click the ldquoGet Datardquo button
5 Save the map image to your local computer On a PC right-click
with the mouse and select ldquoSave asrdquo On a Mac hold down the
Ctrl key and click with the mouse
Alternatively you can make a transparency of this map for display using
an overhead projector Copy the Teacher Master on page 16
Tip Prepare the materials you will need for the demonstrations If you do not
have a waterproof lab surface to work on you should prepare and store For best results use these materials in a large plastic tub to catch spills elongated balloons but not
the professional twist Fill a long balloon with water from a tap Do not fill it too full balloons used for making
The balloon must be allowed to stretch and change shape when animal sculptures
handled without breaking
Fill a clear-glass baking dish with water until the water is about 1
cm (frac12 in) deep Add a few drops of blue food coloring and stir
to mix the color
Understanding Sea Level Using Real Data 12
Procedure
Materials 1 Display the Monthly Average Sea Surface Height Deviation map
for November 1993 on an overhead or computer screen Explain Computer or overhead
projector the key features of the map
Map image saved to your The map shows a global view of sea surface height deviation computer or
transparency of Teacher (SSHD) The color scale indicates the difference in meters
Master above or below the average height for a given location
Long balloon x axis = longitude degrees east and west
Ruler y axis = latitude degrees north and south of the Equator Clear-glass baking dish
Straws 2 Ask the students the following series of questions
Water
Blue food coloring a) Do you think the ocean is flat
Copies of Student
Master Accept any answer
b) Do you think sea surface height is the same all over the
planet
Accept any answer Students may refer to color key to
explain differences in height
c) Can water change its shape Give examples
Accept any answer For example students may observe that
water changes shape in different containers
3 Next explain that you will do two demonstrations to show how
water is a fluid with certain characteristics The first
demonstration uses a water balloon
4 Show the students a long balloon filled with water Tell students
that the balloon containing the water is a simple model of the
ocean Lay the balloon on a flat surface Take a ruler and
Understanding Sea Level Using Real Data 13
measure the height of the balloon three inches from each end of
the balloon and in the middle The heights should be roughly
equal Explain that the water in the balloon is at rest
5 Next push down gently on the middle of the balloon with your
hand and then measure the height of the balloon 5 cm (2 in)
from each end of the balloon and in the middle The water height
should rise on the ends and decrease in the middle
6 Ask the students if any water was lost or if it just took a new
shape
Answer It took a new shape
7 Explain that the model demonstrates how water can rise or fall in
the ocean as well as in a balloon When sea level falls in one
location it rises in another Next push down on one side of the
balloon to cause the water to rise on the opposite end Ask
students what type of natural forces can make the water in the
ocean rise or fall
Possible answers wind weight of a glacier gravity tides or
atmospheric pressure systems (such as a low or high pressure
system)
8 Explain that water is a fluid and that a physicist named Pascal
stated the following important principle Pressure applied to an
enclosed liquid [balloon or the ocean] at rest is transmitted to
every portion of the liquid and to the walls of a closed container
9 Set up the next demonstration which uses a straw to imitate the
effect of wind blowing across the surface of the ocean Place the
glass baking dish with colored water on the overhead projector
Understanding Sea Level Using Real Data 14
10 Next take a straw and gently blow across the surface of the
water Ask students what they see
Answer Darker colored bands or waves moving across the dish
11 Next blow harder through the straw and ask students what they
observe The side of the dish farthest away from where you blew
from the straw should be a darker blue Ask students why they
think this is so
Answer There may be more water piled up on the opposite side
of the dish
Explain that the wind can push water around in the ocean
causing water to pile up on top of resting water This results in
greater sea surface height in some locations
12 Assign students to examine the Monthly Average Sea Surface
Height Deviation map for November 1995 and answer the
questions on the sheet
Answers Student answers will vary according to locations
chosen Students should be able to explain SSHD by describing
the possible effects of wind glacier height gravity tides or
atmospheric pressure systems
Understanding Sea Level Using Real Data 15
Teac
her
Mas
ter
Mon
thly
Ave
rage
Sea
Su
rfac
e H
eigh
t D
evia
tion
Nov
emb
er 1
993 U
nder
stan
ding
Sea
Lev
el U
sing
Rea
l Dat
a 16
Stu
dent
Mas
ter
Mon
thly
Ave
rage
Sea
Su
rfac
e H
eigh
t D
evia
tion
Nov
emb
er 1
995
Qu
esti
ons
1
Cir
cle
thre
e pl
aces
on
the
map
whe
re th
e m
easu
red
sea
surf
ace
heig
ht d
evia
tion
is m
ore
than
02
met
ers
abov
e or
bel
ow a
vera
ge
2
Rec
ord
the
appr
oxim
ate
latit
ude
and
long
itude
of
each
loca
tion
you
cho
se
3
Usi
ng th
e co
lor
key
rec
ord
the
sea
surf
ace
heig
ht d
evia
tion
at e
ach
loca
tion
you
cho
se
4
Exp
lain
wha
t mig
ht b
e ha
ppen
ing
at o
ne o
f yo
ur lo
cati
ons
In
your
exp
lana
tion
ref
er to
the
ball
oon
and
win
d de
mon
stra
tion
s yo
u sa
w in
cla
ss
Und
erst
andi
ng S
ea L
evel
Usi
ng R
eal D
ata
17
Level 2 Adoption Finding the Mean
Summary Grade Level 6 - 8
Teaching Time 45 minutes
Activities
Use a balloon model to
generate water level data
Compute a mean value
from the data
Use an online tide model
to illustrate changing
water level along a
coastline
Vocabulary Data ndashany information obtained
by observing andor measuring
Mean ndashthe arithmetic average of
a set of numbers It is found by
adding all the values in the set
and dividing the sum by the total
number of values
Deviation ndash the difference
between one data value in a set
and the mean value for that set
Objectives Students will generate some water level data using a balloon as a simple
model Students will calculate the mean and make a chart of their data
By understanding how to report data in terms of deviations from the
mean students will be prepared to interpret real sea level data from
different sources
Background The Earths oceans are not shaped like a perfect sphere of water Factors
such as the shape of the Earths crust variations in the planets
gravitational field winds and currents cause natural variations in the
height of the oceans surface around the globe Because of these natural
variations and the fact that the oceans themselves are always in motion
it is difficult to give measurements of sea surface height in absolute
terms Instead scientists measure the difference between the oceans
height and the expected or average height at any given location
Understanding the concept of a mean or average is important to
interpreting water level data at any scale Satellite-derived sea surface
height data and local tide gauge data are both reported as deviations from
an expected or mean height
Understanding Sea Level Using Real Data 18
Preparation Familiarize yourself with the online tide model so that you can
demonstrate it to the class The purpose of the interactive tide model is to
help students see the effects of typical changes in water level It is a
simple model but it can be programmed with values students derive
from real data in order to help them visualize how different factors
influence water level
Use of the tide model is optional in this activity but if you have a
computer and projector the applet is a helpful tool for illustrating and
discussing changing water level along a coastline
1 Visit wwwdataintheclassroomorg and find the Sea Level
module
2 Follow the link to ldquoTide Modelrdquo
3 In this activity you will be using the model to help illustrate how
water levels constantly change To program the model to show a
typical tidal change look for the line of controls labeled Tide
Understanding Sea Level Using Real Data 19
4 Enter 12 meters in the box labeled Max Height Change
See an Example A sample spreadsheet
showing a graph of water
height data is available at
wwwdataintheclassroomorg
5 Click the Play button to start the model The model will illustrate
the changing water level height in two ways first as an
animation of water rising and falling along the image of the
coastline and second as an animated graph showing the change
in water level over time The image and graph are synchronized
You can pause the model and enter different numbers to change
the water level behavior
Prepare the other materials you will need If you do not have a
waterproof lab surface to work on you should prepare and store these
materials in a large plastic tub to catch spills
Fill a long balloon with water from a tap Do not fill it too full The
balloon must be allowed to stretch and change shape when handled
without breaking
In this activity students will be asked to create data tables and simple
graphs using water height data they find on the Internet If you prefer
students may also use spreadsheet software such as Microsoft Excel to
help them with these tasks This is optional however
Understanding Sea Level Using Real Data 20
Materials Computer or overhead
projector
Long balloon
Water
Plastic tub or basin
Ruler
Paper and marker
Copies of Student Master
Finding the Mean
Copies of Student Master
Graph Your Results
Procedure 1 Display the online tide model on your computer or projector
Program the model with a tidal change of 12 meters as described
in the Preparation section on page 20
2 Ask students about the rising or falling water level If it is always
moving how do you get a general measurement for the water
level at a location How can you tell if a change in the water
level is large or small
Answer You compute an average or mean to describe the height
Then you can compare your measurements to the mean
3 Explain to the students that they will generate some sample
water level data using a balloon as a simple model of the ocean
in order to calculate the mean Select two students to gather data
to be used by the class
4 Have the two students perform steps 1 through 5 on the Student
Master Finding the Mean while the class follows along One
student can apply pressure to the balloon while the other
measures height data Ask all of the students in the class to
record this collected data on their own copies of the Master
5 Have all students perform step 6 on the Master They can
compute the mean of the water height data by following the
instructions
6 Have all students complete step 7 to calculate how much each
data point deviates from the mean
Understanding Sea Level Using Real Data 21
7 Ask students to complete the questions on the Master
Why are some deviation values greater than zero and some less
than zero
Answer Some height measurements are higher than average and
some are lower than average
What does it mean when a deviation value is negative
Answer It means the height measured at that point is lower than
average or less than the mean height at that point
Relate what you just learned to the color scale on the satellite
SSHD map
Answer The warm (reds and yellows) colors represent areas
where the water level is higher than average White or pale areas
represent areas where the water level is roughly the same as the
average Cool colors (blues and purples) represent areas where
the water level is lower than average
8 Finally students should graph their results following the
instructions on the Student Master Graph Your Results If they
are using spreadsheet software students may need guidance on
setting up their spreadsheet and graphs
Understanding Sea Level Using Real Data 22
Student Master
Finding the Mean Sea surface height is sometimes reported as the height difference relative to an expected or average height at
any given location In this activity you will use a balloon as a simple model of the ocean in order to collect
some data
1 Place a sheet of paper across the bottom of a waterproof plastic tub or basin Lay a balloon filled with
water across the paper
2 Sea surface height data is reported as the height difference relative to an expected or average height at
any given location Choose a location along the length of the balloon Use a marker to mark that
location next to the balloon on the paper at the bottom of the basin
3 With the balloon sitting undisturbed stand the ruler at the mark you made on the paper Measure the
height of the balloon at the mark in centimeters and record the height on the data sheet
4 Now apply pressure somewhere on the balloon so that its shape changes While pressing on the
balloon measure the height at the mark on the paper and record the height on the data sheet
5 Repeat step 4 at least three times Each time vary the pressure put on the balloon You can put
pressure on a different spot or vary the amount of pressure you apply Each time record the height on
the data sheet
Understanding Sea Level Using Real Data 23
6 Next compute the mean for the data collected
The mean is equal to the sum of all the
measurements divided by the number of
measurements recorded
mean height = sum of height measurements number of measurements
7 Once you have the mean calculate how much
each data point deviates from that mean To do
this subtract the mean from each height
measurement recorded Write the results in the
column marked Deviation
deviation = height measurement - mean height
Answer the following questions
Measure- Height (- Mean) Deviation ment
1
2
3
4
5
6
Total
Mean
1 Why are some deviation values greater than zero and some less than zero
2 What does it mean when a deviation value is negative
3 Relate what you just learned to the color scale on the satellite SSHD map
Understanding Sea Level Using Real Data 24
Student Master
Graph Your Resultsw
ater
hei
ght i
n ce
ntim
eter
s (c
m)
16
15
14
13
12
11
10
9
8
7
6
5
4
3
2
1
1 2 3 4 5 6
Measurements
Make a bar graph of the height data gathered from the balloon model Using the grid above draw a bar to
represent each height measurement you recorded
Next draw a horizontal line on the grid to represent the mean height you calculated
How are the height deviations you calculated represented on your bar chart
Understanding Sea Level Using Real Data 25
Level 3 Adaptation Reading Tide Data
Summary Grade Level 6-8
Teaching Time
Two 45 minute periods
Activities
Generate charts of real tide
data
Use tide model to help
visualize tide effects
Vocabulary Gravity ndash the force of attraction
that causes objects on Earth to
fall to the center of the Earth
Tide ndash periodic rising and falling
of the sea surface that results
from gravitational attraction of
the Moon and the Sun acting on
the rotating Earth
Tidal period ndash elapsed time
between successive high waters
and low waters
Mean low water (MLW) ndash a
reference point for measuring
tide heights based on historical
data MLW is the average water
height observed at low tide
during a 19-year period
Objective Students will go online to generate charts of real tide data Students will
apply their skill calculating the mean to real tide data in order to
characterize typical tide behavior at a selected location
Background Tides are generated by the gravitational attraction of the Moon and Sun
on the oceanrsquos waters Because the Moon is much closer to the Earth than
is the Sun its impact on ocean tides is larger despite the Suns greater
mass The gravitational pull of the Moon causes water to bulge away
from the Earth at the point closest to the Moon At the same time
centrifugal force causes a similar bulge on the opposite side of the Earth
As the Earth spins on its axis different parts of Earths surface move
through these tidal bulges resulting in a cycle of high and low tides
around the globe7
The Sun also plays a role in producing tides As the Moon orbits the
Earth its position relative to the Earth and Sun changes Sometimes the
Moon and Sun are lined up with the Earth and the resulting gravitational
pull of both bodies causes higher tides These are called spring tides and
they occur during full and new Moon phases During quarter Moon
phases when the Moon and Sun are not in line with the Earth lower
neap tides are produced
Tides do not occur with the same frequency and magnitude everywhere
Tides influence the rise and fall of water both in the open ocean and
along the coasts although that rise and fall can be much more
pronounced near land which can have an amplifying effect
7 Sverdrup K amp Armbrust E V (2008) An Introduction to the Worlds Oceans 9th ed McGraw-Hill p 284
Understanding Sea Level Using Real Data 26
Curriculum Link You can use this activity to
supplement other material in
your middle school physical
science curriculum
particularly material dealing
with tides and the
gravitational pull of the Moon
To Display
Generate this image at
wwwdataintheclassroomorg
NOAA has developed long-term data sets of local tide measurements
from an array of permanent monitoring stations around the United States
Over the years the technology for recording tides has changed from
early mechanical recorders to modern acoustic and electronic devices
Today this network of monitoring stations records tide measurements
electronically every six minutes at over 250 stations around the country
The data is transmitted to NOAA headquarters via satellite where it is
processed archived and made available online
Preparation Familiarize yourself with using the dataintheclassroomorg Web site to
generate charts from tide data
1 Visit wwwdataintheclassroomorg and find the Sea Level
module
2 Follow the link to ldquoTide Datardquo
3 Using the form select ldquoCape May NJrdquo from the list of recording
stations
4 Select a start date for the data you want to retrieve for example
08012007
5 Select an end date for example 08052007
6 Click the ldquoGet Datardquo button
7 Save the map image to your local computer On a PC right-click
with the mouse and select ldquoSave asrdquo On a Mac hold down the
Ctrl key and click with the mouse
Understanding Sea Level Using Real Data 27
Materials Procedure Computer or overhead 1 On an overhead projector display the Teacher Master What
projector Causes Tides Point out that tides are caused by the pull of Transparency of Teacher gravity between the Moon Sun and Earth Ask students to
Master What Causes indicate where the water has a bulge
Tides
Tide chart saved to your Answer The water bulges in alignment with the pull of the computer or transparency
Moonrsquos gravity of the Teacher Master
Looking at Tide Data Explain that because the Earth and Moon are relatively close to
Copies of Student one another in space the force of gravity between them is strong
Master Practice Reading The gravitational pull of the Moon causes water to bulge away
Tide Data from the Earth as it tries to move toward the Moon This effect
Rulers moves around the globe as the Earth and the Moon move
relative to each other
2 Display the tide chart from Cape May NJ (either from the file
saved on your computer or using a transparency of the Teacher
Master Looking at Tide Data) Describe features of the chart
The y-axis on the chart shows the height of the water relative
to the mean low water (MLW) Mean low water is a
reference point used by scientists for measuring tide heights
based on historical data MLW is the average water height
observed at low tide during a 19-year period
The x-axis shows the date and time of the water level
observations Look carefully at the time scale In the
example shown on the Master the x-axis is labeled every 20
hours
Along the y-axis the measurement from the lowest point to
the highest point in each tide cycle is the change in water
level due to the tide
Along the x-axis the measurement between consecutive low
tides or consecutive high tides is the period of the tidal cycle
Understanding Sea Level Using Real Data 28
Online Tool
Use the tide model to
visualize students data Visit
wwwdataintheclassroomorg
3 Explain that students will go online to generate tide charts for
themselves using real data Their task is to measure the tide
height change and period from data collected at a monitoring a
station
4 If you have not done so in earlier activities use a computer and
projector to demonstrate how to use the dataintheclassroomorg
Web site to generate graphs of tide data Refer to the Preparation
steps described on page 27
5 Students will need to access the Internet to generate and save
data maps and graphs Depending on the setting this can be done
in a computer lab or assigned as homework assuming students
have access to the Internet at a library or computer center
Students should follow the instructions on the Student Master
and record their data and calculations on the table provided
6 When students have finished gathering data and making
calculations conclude the activity with a demonstration to help
students visualize their data Follow the procedure on page 19 to
display the online tide model
Ask for a volunteer to enter his or her data into the model Look
for the line of controls labeled Tide Enter the averages he or she
calculated from the box on the data sheet labeled Max Height
Change
Click the Play button to start the model The model will illustrate
the changing water level height in two ways first as an
animation of water rising and falling along the image of the
coastline and second as an animated graph showing the change
in water level over time The image and graph are synchronized
You can stop the model and enter different numbers to change
the behavior
Understanding Sea Level Using Real Data 29
Assessment Rubric In assessing student performance consider how students approached
collecting their tide data and what calculations they made based on the
data
Successful student work may include
Correct use of the y-axis to measure height changes and the x-
axis to measure time intervals
A selection of data from a selected station during several
different periods of time
Calculation of the average low tide height high tide height and
height change using data from different time periods
A working definition of a mean or average
A working definition of relative height change or deviation
Depending on the measuring station and time period selected the tide
data chart may look different than the example charts provided in these
pages Students may encounter multiple small highs and lows that they
may find difficult to interpret Be prepared to guide students through the
process of making their measurements on more complicated tide charts
Understanding Sea Level Using Real Data 30
Teac
her
Mas
ter
Wh
at C
ause
s T
ides
Uni
form
wat
er le
vel
The
gra
vita
tiona
l pul
l of
the
Moo
n ca
uses
wat
er
to b
ulge
aw
ay f
rom
the
Ear
th a
t the
poi
nt
clos
est t
o th
e M
oon
Moo
n
Ear
th
At t
he s
ame
time
cen
trifu
gal f
orce
cau
ses
a si
mila
r bu
lge
on th
e op
posi
te s
ide
of th
e E
arth
Ada
pted
fro
m S
verd
rup
K amp
Arm
brus
t E
V (
2008
) A
n In
trod
ucti
on to
the
Wor
lds
Oce
ans
9th
ed
McG
raw
-Hil
l F
igur
e 11
5 p
284
Moo
n im
age
NA
SA
Und
erst
andi
ng S
ea L
evel
Usi
ng R
eal D
ata
31
Teac
her
Mas
ter
Loo
kin
g at
Tid
e D
ata
Alo
ng th
e y-
axis
the
mea
sure
men
t fro
m th
e lo
wes
t poi
nt to
the
high
est
Alo
ng th
e x-
axis
the
mea
sure
men
t bet
wee
n co
nsec
utiv
e lo
w ti
des
or
poin
t in
each
cyc
le is
the
tida
l cha
nge
in w
ater
leve
l co
nsec
utiv
e hi
gh ti
des
is th
e ti
me
peri
od o
f th
e ti
dal c
ycle
Und
erst
andi
ng S
ea L
evel
Usi
ng R
eal D
ata
32
Student Master
Practice Reading Tide Data Water level around the globe is always changing as a result of many factors One of those factors is the effect
of tides caused by the gravitational attraction of the Moon In this activity you will use charts of real tide
data like the one shown below to research tides in a specific location Your goal is to describe the typical
height change and period of the tidal change
1 Visit wwwdataintheclassroomorg and find the Sea Level module
2 Follow the link to ldquoTide Datardquo
3 Choose a location you wish to study and write the name on your data sheet Using the form on the
Web site select the location from the list of recording stations
4 Select a start and end date for the data you wish to retrieve Be sure to retrieve data over a period of at
least several days so that you can see a number of tide cycles
5 Click the ldquoGet Datardquo button
6 If you have access to a printer print a copy of the tide data chart Otherwise save a copy to your
computer so that you can refer to it later On a PC right-click with the mouse and select ldquoSave asrdquo
On a Mac hold down the Ctrl key and click with the mouse
Understanding Sea Level Using Real Data 33
7 Look at the chart and see if you can identify a pattern of low and high tides Choose a point on the
chart that represents a low tide Use the scale on the y-axis to determine the relative height of the
water at that point Record the approximate time and the relative water height on your data sheet
8 Now find the point that represents the next high tide and record the relative height of the water then
9 Calculate the difference between the water height at high and low tides This is the height change
Record this change on your data sheet
10 Next choose two points on the chart that represent consecutive low or consecutive high tides Use the
time scale on the x-axis to determine the time period of the tide cycle Record the period on your data
sheet
Do you think the measurements you just made provide a good description of the tides at this location
Hint Make measurements using data from the same location at other times to see if the tides are different
Once you have made several measurements can you make calculations to find the average height
change and period from the data you collected
Data Sheet
Station Name
Date Time (Approx) Low Tide High Tide Tide Height Tide CycleHeight Height Change Period
08022007 2000 0 m 175 m 175 m 12 hrs
Understanding Sea Level Using Real Data 34
Level 4 Interactivity Measuring Storm Effects
Summary Grade Level 6-8
Teaching Time
Two 45 minute periods
Activities
Get water height data for
storm events
Create a research plan
using real data
Use interactive tide model
to visualize storm effects
Vocabulary Storm tide ndash a storm surge
event that takes place along the
coast which produces
exceptionally high water A
storm tide is generated by
storm wind stress and low
atmospheric pressure Storm
surges are made even higher
when associated with high tide
and shallow depths
Objective Using what they learned about typical tide measurements at a location
students will investigate and measure what happens to water height
during a storm event
Background Storms can have a big impact on local water levels in coastal areas A
storm surge happens when water is pushed toward the shore by high
powered winds from a storm such as a hurricane The storm interacts
with the normal tide to create a storm tide that can increase the normal
water height by 4 to 5 meters (15 feet) or more These events can cause
extreme flooding in coastal areas Most coastlines in the United States
are only 3 meters (10 feet) or less above mean sea level which means
that storms can be very dangerous for people who live near the coast8
During this lesson students are asked to answer a research question
How do storm events impact water levels at a coastal location To
accomplish this task students must take the calculations they made in the
last activity and use them as a baseline to evaluate the tide heights
observed during a storm
8 Ross A R(1995) Introduction to Oceanography New York Harper Collins p 230
Understanding Sea Level Using Real Data 35
Materials Procedure Computer or overhead 1 On an overhead projector display a news report from a recent
projector storm Copies of Student
Master Research Project Explain that water level is affected by lots of different factors Determining Storm Surge not just tides and that these factors actually compound or add Height together
Copies of Student
Master Data Log Sheet 2 Explain that students will continue the investigation of water Rulers
level from the last activity This time they will go online to look
at data related to storms Their task is to make a research plan
using real data to describe the effects of storms on coastal water
levels Their goal is to determine the additional effect a storm
can have on water height
3 Students will need to access the Internet to generate and save
data maps and graphs Depending on the setting this can be done
in a computer lab or assigned as homework assuming students
have access to the Internet at a library or computer center
Students should follow the instructions on the Student Master
Research Project Determining Storm Surge Height and record
their data and calculations on the table provided
4 When students have finished gathering data and making
calculations conclude the activity with a demonstration to help
students visualize their data Follow the procedure on page 19 to
display the online tide model
Ask for a volunteer to enter his or her data into the model Look
for the line of controls labeled Storm The student should enter
the storm surge height and duration he or she calculated in the
boxes from the Data Log Sheet labeled Max Height Change
Click the Play button to start the model You can stop the model
and enter different numbers to change the behavior
Understanding Sea Level Using Real Data 36
Assessment Rubric In assessing student performance consider how students approached
collecting their tide data and what calculations they made based on the
data
Successful student work may include
Correct use of the y-axis to measure height changes and the x-
axis to measure time intervals
A selection of data from a selected station during several
different periods of time In particular students should attempt to
determine how long the storm impacted the area ndash from when the
storm effect was first seen to when it went away
Determine the maximum high tide recorded during the storm
Calculation of the difference between the maximum high tide
and the average high tide they found in the last activity
A working definition of a mean or average
A working definition of relative height change or deviation
Understanding Sea Level Using Real Data 37
Student Master
Research Project Determining Storm Surge Height You are joining a team of scientists who are studying the effects of storms along the US coast Your task is to
pick a storm event for a coastal location and design a research plan to help you gather data about the water
height before during and after the storm You already know something about the typical or average water
height in the area due to tides Your goal now is to determine the additional effect a storm can have on water
height Once your plan is accepted you are to carry out your data collection analyze it and report your
findings to the team
Planning your project
1 Form a hypothesis before designing your investigation
Research question How do storm events impact water levels at my coastal location
Hypothesis Storms produce a surge which raises water levels above what would normally occur
during a typical tide cycle
2 Design a plan to test your hypothesis and answer your research question
What do you need
a) More information Do you need more information about specific storm events and their effects
b) Specific data When you go online to collect data what dates will you look at and what charts
will you generate
3 Go online and get data
a) Visit wwwdataintheclassroomorg and find the Sea Level module
b) Follow the link to ldquoTide Datardquo
c) Choose a location you wish to study and write the name on your data sheet Using the form on
the Web site select the location from the list of recording stations
d) Search Internet news and weather sources for information about storms that impacted the area
near your station Identify a storm event to investigate and take note of the date of the storm
Understanding Sea Level Using Real Data 38
e) Using the form on the Web site select start and end dates around the time of the storm event you
found
f) Click the ldquoGet Datardquo button
g) If you have access to a printer print a copy of the tide data chart Otherwise save a copy to your
computer so that you can refer to it later On a PC right-click with the mouse and select ldquoSave
asrdquo On a Mac hold down the Ctrl key and click with the mouse
4 Use the Data Log Sheet to keep a record of the data you select so you can refer to it later
5 Analyze the data
a) What were the highest and lowest tides recorded during the storm event
b) How did the tides during the storm compare with the average high and low tides you calculated
for this station previously
c) Calculate the different between the highest tide measured during the storm and the average high
tide for the area
d) Can you use the data to determine how long the storm impacted the area
6 Draw conclusions
Write down what you learned from your investigation Use your data to help you decide if your
hypothesis was supported
Understanding Sea Level Using Real Data 39
Student Master
Data Log Sheet
Station Name
Date Time (Approx) Low Tide Height
High TideHeight
Tide HeightChange
Tide CyclePeriod
Understanding Sea Level Using Real Data 40
Level 5 Invention Designing Your Own Investigation
Summary Grade Level 6-8
Teaching Time
Two 45 minute periods
Activity
Design an investigation
using real data to examine
a hypothesis
Web Links For links to long-term sea
level trend data visit
wwwdataintheclassroomorg
Objective Students will apply what they have learned to consider sea level data on
a larger scale To do this students will design their own plan to answer a
research question using real data
Background Students have used real data to begin to understand changes in water
levels Most of the work has been an examination of how sea level
changes on a relatively small scale ndash at a single location or station and
over a very short period of time Now it is time for students to examine
sea level on a larger scale by developing their own investigation using
real data
Students should be encouraged to develop their own research questions
and hypotheses for this activity In general questions that lead them to
considering changes in water level on a larger scale will provide a good
starting point Here are some examples of questions
Research questions
Do changes in water level have the same impact everywhere on Earth
How is sea surface height changing over time
Students choosing to look at changes in sea level over time will naturally
consider the prospect of long-term sea level rise due to climate change It
may not be easy for students to detect and interpret long-term trends
using the kinds of data tools and analysis available to them However
links to long-term trend analyses are available and students can be
challenged to apply what they have learned about reading and
understanding data to interpret these long-term data products
Understanding Sea Level Using Real Data 41
Procedure
Materials 1 Distribute the Student Master Research Project Designing Your
Own Investigation and Student Master Data Log Sheet Copies of Student
Master Research Project 2 Guide student selection of a research question (or allow students
Designing Your Own to make up their own) that is appropriate to their academic Investigation
Copies of Student experience Review student hypotheses to make sure they are
Master Data Log Sheet appropriate and that students will be able to support or disprove
Student access to them using the kinds of data they will have available
computers with Internet
connections 3 Have students design a research project to answer the question
4 Check each research project plan before students begin to see if
it is in keeping with the question and the resources available
5 Assign students to use the tools at wwwdataintheclassroomorg
to access the data they need
6 When students complete their research provide time for them to
present their findings
7 Use the student presentations as an opportunity to relate this
investigation to the current news and debate about global climate
change Ask From your own experience looking at real data
how do these data relate to the question of global climate
change
Understanding Sea Level Using Real Data 42
Student Master
Research Project Designing Your Own Investigation
Planning your project
1 Develop a research question Then form a hypothesis to investigate
Be sure to review your hypothesis with your teacher before you begin
Research question
Hypothesis
2 Design a plan to test your hypothesis and answer the research question
What do you need
a) More information
b) Specific data
3 Go online and get data
a) Visit wwwdataintheclassroomorg and find the Sea Level module
b) Follow the link to ldquoSatellite Datardquo or ldquoTide Datardquo
c) Using the form select the data and parameters you wish to look at
d) Click the ldquoGet Datardquo button
4 Use the Data Log Sheet to keep a record of the data you select so you can refer to it later
5 Analyze the data
6 Draw conclusions
Write down what you learned from your investigation Use your data to help you decide whether your
hypothesis is supported If your hypothesis is not supported think about other data you might need to
collect
Understanding Sea Level Using Real Data 43
Student Master
Data Log Sheet As you use the online data access form to select data about sea level keep a record of the parameters you
select on this data log sheet Your data log will help you remember and keep track of the data you have
looked at Consider whether each new piece of data helps support or disprove your hypothesis
Data set Region Station Dates Notes
Understanding Sea Level Using Real Data 44
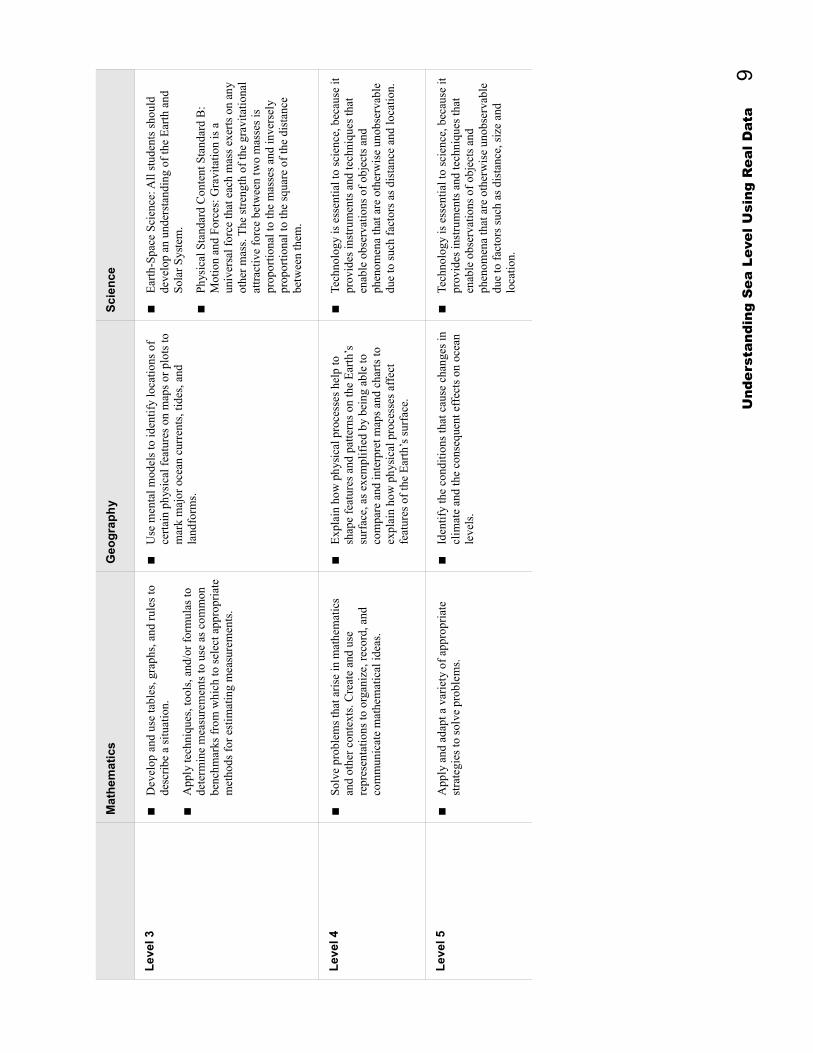
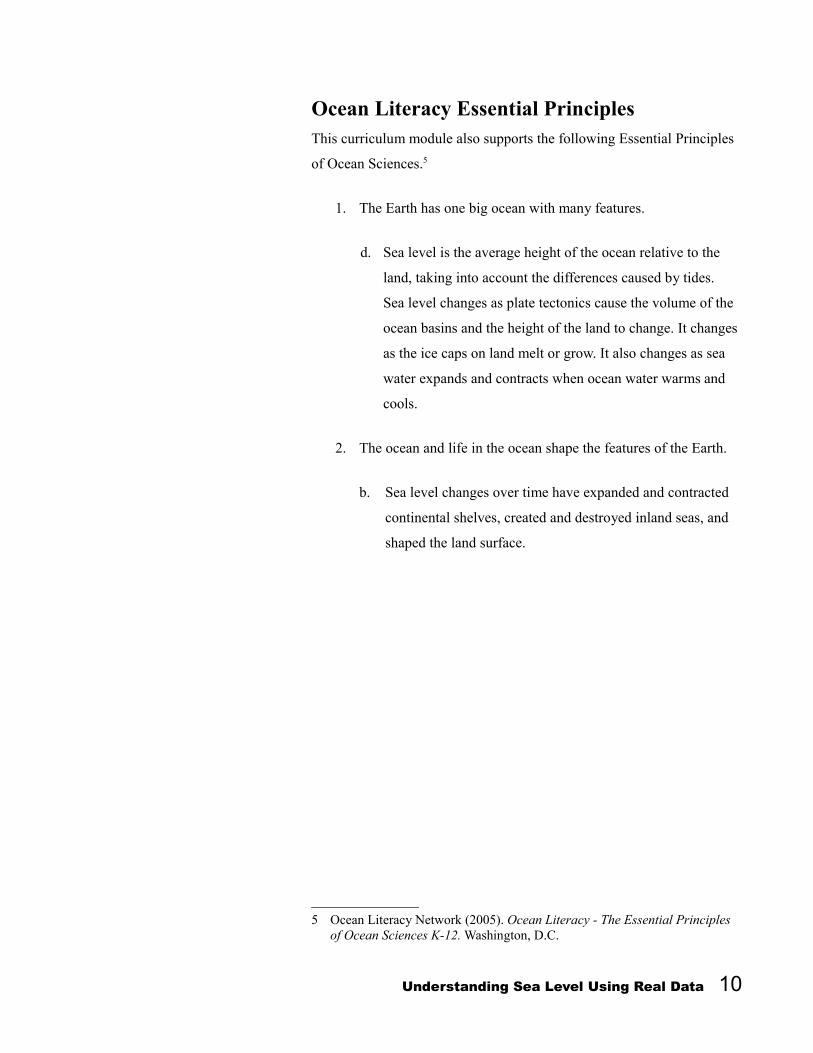
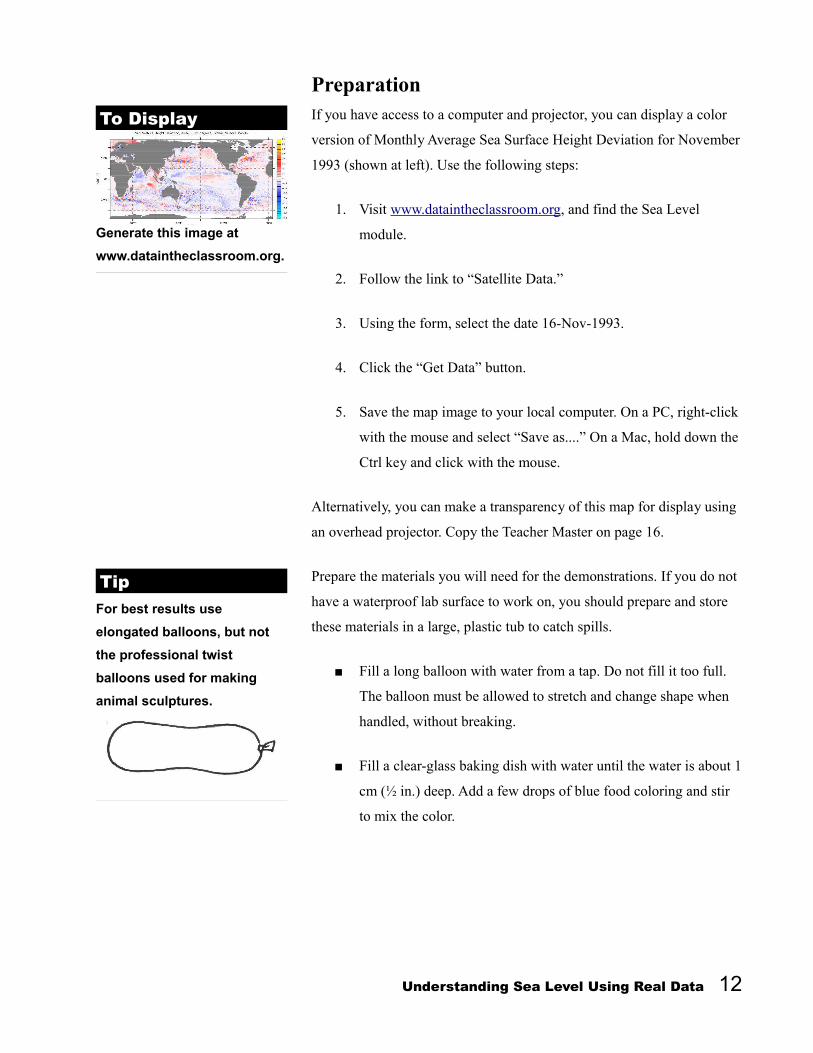
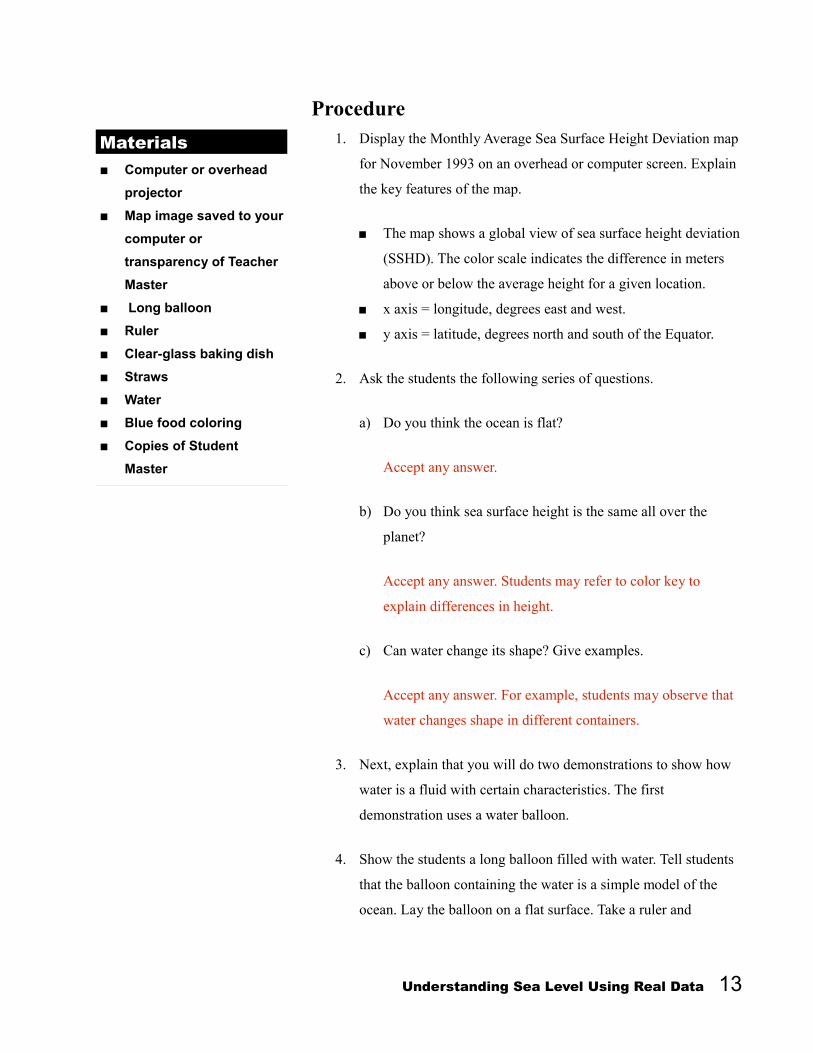
Procedure
Materials 1 Display the Monthly Average Sea Surface Height Deviation map
for November 1993 on an overhead or computer screen Explain Computer or overhead
projector the key features of the map
Map image saved to your The map shows a global view of sea surface height deviation computer or
transparency of Teacher (SSHD) The color scale indicates the difference in meters
Master above or below the average height for a given location
Long balloon x axis = longitude degrees east and west
Ruler y axis = latitude degrees north and south of the Equator Clear-glass baking dish
Straws 2 Ask the students the following series of questions
Water
Blue food coloring a) Do you think the ocean is flat
Copies of Student
Master Accept any answer
b) Do you think sea surface height is the same all over the
planet
Accept any answer Students may refer to color key to
explain differences in height
c) Can water change its shape Give examples
Accept any answer For example students may observe that
water changes shape in different containers
3 Next explain that you will do two demonstrations to show how
water is a fluid with certain characteristics The first
demonstration uses a water balloon
4 Show the students a long balloon filled with water Tell students
that the balloon containing the water is a simple model of the
ocean Lay the balloon on a flat surface Take a ruler and
Understanding Sea Level Using Real Data 13
measure the height of the balloon three inches from each end of
the balloon and in the middle The heights should be roughly
equal Explain that the water in the balloon is at rest
5 Next push down gently on the middle of the balloon with your
hand and then measure the height of the balloon 5 cm (2 in)
from each end of the balloon and in the middle The water height
should rise on the ends and decrease in the middle
6 Ask the students if any water was lost or if it just took a new
shape
Answer It took a new shape
7 Explain that the model demonstrates how water can rise or fall in
the ocean as well as in a balloon When sea level falls in one
location it rises in another Next push down on one side of the
balloon to cause the water to rise on the opposite end Ask
students what type of natural forces can make the water in the
ocean rise or fall
Possible answers wind weight of a glacier gravity tides or
atmospheric pressure systems (such as a low or high pressure
system)
8 Explain that water is a fluid and that a physicist named Pascal
stated the following important principle Pressure applied to an
enclosed liquid [balloon or the ocean] at rest is transmitted to
every portion of the liquid and to the walls of a closed container
9 Set up the next demonstration which uses a straw to imitate the
effect of wind blowing across the surface of the ocean Place the
glass baking dish with colored water on the overhead projector
Understanding Sea Level Using Real Data 14
10 Next take a straw and gently blow across the surface of the
water Ask students what they see
Answer Darker colored bands or waves moving across the dish
11 Next blow harder through the straw and ask students what they
observe The side of the dish farthest away from where you blew
from the straw should be a darker blue Ask students why they
think this is so
Answer There may be more water piled up on the opposite side
of the dish
Explain that the wind can push water around in the ocean
causing water to pile up on top of resting water This results in
greater sea surface height in some locations
12 Assign students to examine the Monthly Average Sea Surface
Height Deviation map for November 1995 and answer the
questions on the sheet
Answers Student answers will vary according to locations
chosen Students should be able to explain SSHD by describing
the possible effects of wind glacier height gravity tides or
atmospheric pressure systems
Understanding Sea Level Using Real Data 15
Teac
her
Mas
ter
Mon
thly
Ave
rage
Sea
Su
rfac
e H
eigh
t D
evia
tion
Nov
emb
er 1
993 U
nder
stan
ding
Sea
Lev
el U
sing
Rea
l Dat
a 16
Stu
dent
Mas
ter
Mon
thly
Ave
rage
Sea
Su
rfac
e H
eigh
t D
evia
tion
Nov
emb
er 1
995
Qu
esti
ons
1
Cir
cle
thre
e pl
aces
on
the
map
whe
re th
e m
easu
red
sea
surf
ace
heig
ht d
evia
tion
is m
ore
than
02
met
ers
abov
e or
bel
ow a
vera
ge
2
Rec
ord
the
appr
oxim
ate
latit
ude
and
long
itude
of
each
loca
tion
you
cho
se
3
Usi
ng th
e co
lor
key
rec
ord
the
sea
surf
ace
heig
ht d
evia
tion
at e
ach
loca
tion
you
cho
se
4
Exp
lain
wha
t mig
ht b
e ha
ppen
ing
at o
ne o
f yo
ur lo
cati
ons
In
your
exp
lana
tion
ref
er to
the
ball
oon
and
win
d de
mon
stra
tion
s yo
u sa
w in
cla
ss
Und
erst
andi
ng S
ea L
evel
Usi
ng R
eal D
ata
17
Level 2 Adoption Finding the Mean
Summary Grade Level 6 - 8
Teaching Time 45 minutes
Activities
Use a balloon model to
generate water level data
Compute a mean value
from the data
Use an online tide model
to illustrate changing
water level along a
coastline
Vocabulary Data ndashany information obtained
by observing andor measuring
Mean ndashthe arithmetic average of
a set of numbers It is found by
adding all the values in the set
and dividing the sum by the total
number of values
Deviation ndash the difference
between one data value in a set
and the mean value for that set
Objectives Students will generate some water level data using a balloon as a simple
model Students will calculate the mean and make a chart of their data
By understanding how to report data in terms of deviations from the
mean students will be prepared to interpret real sea level data from
different sources
Background The Earths oceans are not shaped like a perfect sphere of water Factors
such as the shape of the Earths crust variations in the planets
gravitational field winds and currents cause natural variations in the
height of the oceans surface around the globe Because of these natural
variations and the fact that the oceans themselves are always in motion
it is difficult to give measurements of sea surface height in absolute
terms Instead scientists measure the difference between the oceans
height and the expected or average height at any given location
Understanding the concept of a mean or average is important to
interpreting water level data at any scale Satellite-derived sea surface
height data and local tide gauge data are both reported as deviations from
an expected or mean height
Understanding Sea Level Using Real Data 18
Preparation Familiarize yourself with the online tide model so that you can
demonstrate it to the class The purpose of the interactive tide model is to
help students see the effects of typical changes in water level It is a
simple model but it can be programmed with values students derive
from real data in order to help them visualize how different factors
influence water level
Use of the tide model is optional in this activity but if you have a
computer and projector the applet is a helpful tool for illustrating and
discussing changing water level along a coastline
1 Visit wwwdataintheclassroomorg and find the Sea Level
module
2 Follow the link to ldquoTide Modelrdquo
3 In this activity you will be using the model to help illustrate how
water levels constantly change To program the model to show a
typical tidal change look for the line of controls labeled Tide
Understanding Sea Level Using Real Data 19
4 Enter 12 meters in the box labeled Max Height Change
See an Example A sample spreadsheet
showing a graph of water
height data is available at
wwwdataintheclassroomorg
5 Click the Play button to start the model The model will illustrate
the changing water level height in two ways first as an
animation of water rising and falling along the image of the
coastline and second as an animated graph showing the change
in water level over time The image and graph are synchronized
You can pause the model and enter different numbers to change
the water level behavior
Prepare the other materials you will need If you do not have a
waterproof lab surface to work on you should prepare and store these
materials in a large plastic tub to catch spills
Fill a long balloon with water from a tap Do not fill it too full The
balloon must be allowed to stretch and change shape when handled
without breaking
In this activity students will be asked to create data tables and simple
graphs using water height data they find on the Internet If you prefer
students may also use spreadsheet software such as Microsoft Excel to
help them with these tasks This is optional however
Understanding Sea Level Using Real Data 20
Materials Computer or overhead
projector
Long balloon
Water
Plastic tub or basin
Ruler
Paper and marker
Copies of Student Master
Finding the Mean
Copies of Student Master
Graph Your Results
Procedure 1 Display the online tide model on your computer or projector
Program the model with a tidal change of 12 meters as described
in the Preparation section on page 20
2 Ask students about the rising or falling water level If it is always
moving how do you get a general measurement for the water
level at a location How can you tell if a change in the water
level is large or small
Answer You compute an average or mean to describe the height
Then you can compare your measurements to the mean
3 Explain to the students that they will generate some sample
water level data using a balloon as a simple model of the ocean
in order to calculate the mean Select two students to gather data
to be used by the class
4 Have the two students perform steps 1 through 5 on the Student
Master Finding the Mean while the class follows along One
student can apply pressure to the balloon while the other
measures height data Ask all of the students in the class to
record this collected data on their own copies of the Master
5 Have all students perform step 6 on the Master They can
compute the mean of the water height data by following the
instructions
6 Have all students complete step 7 to calculate how much each
data point deviates from the mean
Understanding Sea Level Using Real Data 21
7 Ask students to complete the questions on the Master
Why are some deviation values greater than zero and some less
than zero
Answer Some height measurements are higher than average and
some are lower than average
What does it mean when a deviation value is negative
Answer It means the height measured at that point is lower than
average or less than the mean height at that point
Relate what you just learned to the color scale on the satellite
SSHD map
Answer The warm (reds and yellows) colors represent areas
where the water level is higher than average White or pale areas
represent areas where the water level is roughly the same as the
average Cool colors (blues and purples) represent areas where
the water level is lower than average
8 Finally students should graph their results following the
instructions on the Student Master Graph Your Results If they
are using spreadsheet software students may need guidance on
setting up their spreadsheet and graphs
Understanding Sea Level Using Real Data 22
Student Master
Finding the Mean Sea surface height is sometimes reported as the height difference relative to an expected or average height at
any given location In this activity you will use a balloon as a simple model of the ocean in order to collect
some data
1 Place a sheet of paper across the bottom of a waterproof plastic tub or basin Lay a balloon filled with
water across the paper
2 Sea surface height data is reported as the height difference relative to an expected or average height at
any given location Choose a location along the length of the balloon Use a marker to mark that
location next to the balloon on the paper at the bottom of the basin
3 With the balloon sitting undisturbed stand the ruler at the mark you made on the paper Measure the
height of the balloon at the mark in centimeters and record the height on the data sheet
4 Now apply pressure somewhere on the balloon so that its shape changes While pressing on the
balloon measure the height at the mark on the paper and record the height on the data sheet
5 Repeat step 4 at least three times Each time vary the pressure put on the balloon You can put
pressure on a different spot or vary the amount of pressure you apply Each time record the height on
the data sheet
Understanding Sea Level Using Real Data 23
6 Next compute the mean for the data collected
The mean is equal to the sum of all the
measurements divided by the number of
measurements recorded
mean height = sum of height measurements number of measurements
7 Once you have the mean calculate how much
each data point deviates from that mean To do
this subtract the mean from each height
measurement recorded Write the results in the
column marked Deviation
deviation = height measurement - mean height
Answer the following questions
Measure- Height (- Mean) Deviation ment
1
2
3
4
5
6
Total
Mean
1 Why are some deviation values greater than zero and some less than zero
2 What does it mean when a deviation value is negative
3 Relate what you just learned to the color scale on the satellite SSHD map
Understanding Sea Level Using Real Data 24
Student Master
Graph Your Resultsw
ater
hei
ght i
n ce
ntim
eter
s (c
m)
16
15
14
13
12
11
10
9
8
7
6
5
4
3
2
1
1 2 3 4 5 6
Measurements
Make a bar graph of the height data gathered from the balloon model Using the grid above draw a bar to
represent each height measurement you recorded
Next draw a horizontal line on the grid to represent the mean height you calculated
How are the height deviations you calculated represented on your bar chart
Understanding Sea Level Using Real Data 25
Level 3 Adaptation Reading Tide Data
Summary Grade Level 6-8
Teaching Time
Two 45 minute periods
Activities
Generate charts of real tide
data
Use tide model to help
visualize tide effects
Vocabulary Gravity ndash the force of attraction
that causes objects on Earth to
fall to the center of the Earth
Tide ndash periodic rising and falling
of the sea surface that results
from gravitational attraction of
the Moon and the Sun acting on
the rotating Earth
Tidal period ndash elapsed time
between successive high waters
and low waters
Mean low water (MLW) ndash a
reference point for measuring
tide heights based on historical
data MLW is the average water
height observed at low tide
during a 19-year period
Objective Students will go online to generate charts of real tide data Students will
apply their skill calculating the mean to real tide data in order to
characterize typical tide behavior at a selected location
Background Tides are generated by the gravitational attraction of the Moon and Sun
on the oceanrsquos waters Because the Moon is much closer to the Earth than
is the Sun its impact on ocean tides is larger despite the Suns greater
mass The gravitational pull of the Moon causes water to bulge away
from the Earth at the point closest to the Moon At the same time
centrifugal force causes a similar bulge on the opposite side of the Earth
As the Earth spins on its axis different parts of Earths surface move
through these tidal bulges resulting in a cycle of high and low tides
around the globe7
The Sun also plays a role in producing tides As the Moon orbits the
Earth its position relative to the Earth and Sun changes Sometimes the
Moon and Sun are lined up with the Earth and the resulting gravitational
pull of both bodies causes higher tides These are called spring tides and
they occur during full and new Moon phases During quarter Moon
phases when the Moon and Sun are not in line with the Earth lower
neap tides are produced
Tides do not occur with the same frequency and magnitude everywhere
Tides influence the rise and fall of water both in the open ocean and
along the coasts although that rise and fall can be much more
pronounced near land which can have an amplifying effect
7 Sverdrup K amp Armbrust E V (2008) An Introduction to the Worlds Oceans 9th ed McGraw-Hill p 284
Understanding Sea Level Using Real Data 26
Curriculum Link You can use this activity to
supplement other material in
your middle school physical
science curriculum
particularly material dealing
with tides and the
gravitational pull of the Moon
To Display
Generate this image at
wwwdataintheclassroomorg
NOAA has developed long-term data sets of local tide measurements
from an array of permanent monitoring stations around the United States
Over the years the technology for recording tides has changed from
early mechanical recorders to modern acoustic and electronic devices
Today this network of monitoring stations records tide measurements
electronically every six minutes at over 250 stations around the country
The data is transmitted to NOAA headquarters via satellite where it is
processed archived and made available online
Preparation Familiarize yourself with using the dataintheclassroomorg Web site to
generate charts from tide data
1 Visit wwwdataintheclassroomorg and find the Sea Level
module
2 Follow the link to ldquoTide Datardquo
3 Using the form select ldquoCape May NJrdquo from the list of recording
stations
4 Select a start date for the data you want to retrieve for example
08012007
5 Select an end date for example 08052007
6 Click the ldquoGet Datardquo button
7 Save the map image to your local computer On a PC right-click
with the mouse and select ldquoSave asrdquo On a Mac hold down the
Ctrl key and click with the mouse
Understanding Sea Level Using Real Data 27
Materials Procedure Computer or overhead 1 On an overhead projector display the Teacher Master What
projector Causes Tides Point out that tides are caused by the pull of Transparency of Teacher gravity between the Moon Sun and Earth Ask students to
Master What Causes indicate where the water has a bulge
Tides
Tide chart saved to your Answer The water bulges in alignment with the pull of the computer or transparency
Moonrsquos gravity of the Teacher Master
Looking at Tide Data Explain that because the Earth and Moon are relatively close to
Copies of Student one another in space the force of gravity between them is strong
Master Practice Reading The gravitational pull of the Moon causes water to bulge away
Tide Data from the Earth as it tries to move toward the Moon This effect
Rulers moves around the globe as the Earth and the Moon move
relative to each other
2 Display the tide chart from Cape May NJ (either from the file
saved on your computer or using a transparency of the Teacher
Master Looking at Tide Data) Describe features of the chart
The y-axis on the chart shows the height of the water relative
to the mean low water (MLW) Mean low water is a
reference point used by scientists for measuring tide heights
based on historical data MLW is the average water height
observed at low tide during a 19-year period
The x-axis shows the date and time of the water level
observations Look carefully at the time scale In the
example shown on the Master the x-axis is labeled every 20
hours
Along the y-axis the measurement from the lowest point to
the highest point in each tide cycle is the change in water
level due to the tide
Along the x-axis the measurement between consecutive low
tides or consecutive high tides is the period of the tidal cycle
Understanding Sea Level Using Real Data 28
Online Tool
Use the tide model to
visualize students data Visit
wwwdataintheclassroomorg
3 Explain that students will go online to generate tide charts for
themselves using real data Their task is to measure the tide
height change and period from data collected at a monitoring a
station
4 If you have not done so in earlier activities use a computer and
projector to demonstrate how to use the dataintheclassroomorg
Web site to generate graphs of tide data Refer to the Preparation
steps described on page 27
5 Students will need to access the Internet to generate and save
data maps and graphs Depending on the setting this can be done
in a computer lab or assigned as homework assuming students
have access to the Internet at a library or computer center
Students should follow the instructions on the Student Master
and record their data and calculations on the table provided
6 When students have finished gathering data and making
calculations conclude the activity with a demonstration to help
students visualize their data Follow the procedure on page 19 to
display the online tide model
Ask for a volunteer to enter his or her data into the model Look
for the line of controls labeled Tide Enter the averages he or she
calculated from the box on the data sheet labeled Max Height
Change
Click the Play button to start the model The model will illustrate
the changing water level height in two ways first as an
animation of water rising and falling along the image of the
coastline and second as an animated graph showing the change
in water level over time The image and graph are synchronized
You can stop the model and enter different numbers to change
the behavior
Understanding Sea Level Using Real Data 29
Assessment Rubric In assessing student performance consider how students approached
collecting their tide data and what calculations they made based on the
data
Successful student work may include
Correct use of the y-axis to measure height changes and the x-
axis to measure time intervals
A selection of data from a selected station during several
different periods of time
Calculation of the average low tide height high tide height and
height change using data from different time periods
A working definition of a mean or average
A working definition of relative height change or deviation
Depending on the measuring station and time period selected the tide
data chart may look different than the example charts provided in these
pages Students may encounter multiple small highs and lows that they
may find difficult to interpret Be prepared to guide students through the
process of making their measurements on more complicated tide charts
Understanding Sea Level Using Real Data 30
Teac
her
Mas
ter
Wh
at C
ause
s T
ides
Uni
form
wat
er le
vel
The
gra
vita
tiona
l pul
l of
the
Moo
n ca
uses
wat
er
to b
ulge
aw
ay f
rom
the
Ear
th a
t the
poi
nt
clos
est t
o th
e M
oon
Moo
n
Ear
th
At t
he s
ame
time
cen
trifu
gal f
orce
cau
ses
a si
mila
r bu
lge
on th
e op
posi
te s
ide
of th
e E
arth
Ada
pted
fro
m S
verd
rup
K amp
Arm
brus
t E
V (
2008
) A
n In
trod
ucti
on to
the
Wor
lds
Oce
ans
9th
ed
McG
raw
-Hil
l F
igur
e 11
5 p
284
Moo
n im
age
NA
SA
Und
erst
andi
ng S
ea L
evel
Usi
ng R
eal D
ata
31
Teac
her
Mas
ter
Loo
kin
g at
Tid
e D
ata
Alo
ng th
e y-
axis
the
mea
sure
men
t fro
m th
e lo
wes
t poi
nt to
the
high
est
Alo
ng th
e x-
axis
the
mea
sure
men
t bet
wee
n co
nsec
utiv
e lo
w ti
des
or
poin
t in
each
cyc
le is
the
tida
l cha
nge
in w
ater
leve
l co
nsec
utiv
e hi
gh ti
des
is th
e ti
me
peri
od o
f th
e ti
dal c
ycle
Und
erst
andi
ng S
ea L
evel
Usi
ng R
eal D
ata
32
Student Master
Practice Reading Tide Data Water level around the globe is always changing as a result of many factors One of those factors is the effect
of tides caused by the gravitational attraction of the Moon In this activity you will use charts of real tide
data like the one shown below to research tides in a specific location Your goal is to describe the typical
height change and period of the tidal change
1 Visit wwwdataintheclassroomorg and find the Sea Level module
2 Follow the link to ldquoTide Datardquo
3 Choose a location you wish to study and write the name on your data sheet Using the form on the
Web site select the location from the list of recording stations
4 Select a start and end date for the data you wish to retrieve Be sure to retrieve data over a period of at
least several days so that you can see a number of tide cycles
5 Click the ldquoGet Datardquo button
6 If you have access to a printer print a copy of the tide data chart Otherwise save a copy to your
computer so that you can refer to it later On a PC right-click with the mouse and select ldquoSave asrdquo
On a Mac hold down the Ctrl key and click with the mouse
Understanding Sea Level Using Real Data 33
7 Look at the chart and see if you can identify a pattern of low and high tides Choose a point on the
chart that represents a low tide Use the scale on the y-axis to determine the relative height of the
water at that point Record the approximate time and the relative water height on your data sheet
8 Now find the point that represents the next high tide and record the relative height of the water then
9 Calculate the difference between the water height at high and low tides This is the height change
Record this change on your data sheet
10 Next choose two points on the chart that represent consecutive low or consecutive high tides Use the
time scale on the x-axis to determine the time period of the tide cycle Record the period on your data
sheet
Do you think the measurements you just made provide a good description of the tides at this location
Hint Make measurements using data from the same location at other times to see if the tides are different
Once you have made several measurements can you make calculations to find the average height
change and period from the data you collected
Data Sheet
Station Name
Date Time (Approx) Low Tide High Tide Tide Height Tide CycleHeight Height Change Period
08022007 2000 0 m 175 m 175 m 12 hrs
Understanding Sea Level Using Real Data 34
Level 4 Interactivity Measuring Storm Effects
Summary Grade Level 6-8
Teaching Time
Two 45 minute periods
Activities
Get water height data for
storm events
Create a research plan
using real data
Use interactive tide model
to visualize storm effects
Vocabulary Storm tide ndash a storm surge
event that takes place along the
coast which produces
exceptionally high water A
storm tide is generated by
storm wind stress and low
atmospheric pressure Storm
surges are made even higher
when associated with high tide
and shallow depths
Objective Using what they learned about typical tide measurements at a location
students will investigate and measure what happens to water height
during a storm event
Background Storms can have a big impact on local water levels in coastal areas A
storm surge happens when water is pushed toward the shore by high
powered winds from a storm such as a hurricane The storm interacts
with the normal tide to create a storm tide that can increase the normal
water height by 4 to 5 meters (15 feet) or more These events can cause
extreme flooding in coastal areas Most coastlines in the United States
are only 3 meters (10 feet) or less above mean sea level which means
that storms can be very dangerous for people who live near the coast8
During this lesson students are asked to answer a research question
How do storm events impact water levels at a coastal location To
accomplish this task students must take the calculations they made in the
last activity and use them as a baseline to evaluate the tide heights
observed during a storm
8 Ross A R(1995) Introduction to Oceanography New York Harper Collins p 230
Understanding Sea Level Using Real Data 35
Materials Procedure Computer or overhead 1 On an overhead projector display a news report from a recent
projector storm Copies of Student
Master Research Project Explain that water level is affected by lots of different factors Determining Storm Surge not just tides and that these factors actually compound or add Height together
Copies of Student
Master Data Log Sheet 2 Explain that students will continue the investigation of water Rulers
level from the last activity This time they will go online to look
at data related to storms Their task is to make a research plan
using real data to describe the effects of storms on coastal water
levels Their goal is to determine the additional effect a storm
can have on water height
3 Students will need to access the Internet to generate and save
data maps and graphs Depending on the setting this can be done
in a computer lab or assigned as homework assuming students
have access to the Internet at a library or computer center
Students should follow the instructions on the Student Master
Research Project Determining Storm Surge Height and record
their data and calculations on the table provided
4 When students have finished gathering data and making
calculations conclude the activity with a demonstration to help
students visualize their data Follow the procedure on page 19 to
display the online tide model
Ask for a volunteer to enter his or her data into the model Look
for the line of controls labeled Storm The student should enter
the storm surge height and duration he or she calculated in the
boxes from the Data Log Sheet labeled Max Height Change
Click the Play button to start the model You can stop the model
and enter different numbers to change the behavior
Understanding Sea Level Using Real Data 36
Assessment Rubric In assessing student performance consider how students approached
collecting their tide data and what calculations they made based on the
data
Successful student work may include
Correct use of the y-axis to measure height changes and the x-
axis to measure time intervals
A selection of data from a selected station during several
different periods of time In particular students should attempt to
determine how long the storm impacted the area ndash from when the
storm effect was first seen to when it went away
Determine the maximum high tide recorded during the storm
Calculation of the difference between the maximum high tide
and the average high tide they found in the last activity
A working definition of a mean or average
A working definition of relative height change or deviation
Understanding Sea Level Using Real Data 37
Student Master
Research Project Determining Storm Surge Height You are joining a team of scientists who are studying the effects of storms along the US coast Your task is to
pick a storm event for a coastal location and design a research plan to help you gather data about the water
height before during and after the storm You already know something about the typical or average water
height in the area due to tides Your goal now is to determine the additional effect a storm can have on water
height Once your plan is accepted you are to carry out your data collection analyze it and report your
findings to the team
Planning your project
1 Form a hypothesis before designing your investigation
Research question How do storm events impact water levels at my coastal location
Hypothesis Storms produce a surge which raises water levels above what would normally occur
during a typical tide cycle
2 Design a plan to test your hypothesis and answer your research question
What do you need
a) More information Do you need more information about specific storm events and their effects
b) Specific data When you go online to collect data what dates will you look at and what charts
will you generate
3 Go online and get data
a) Visit wwwdataintheclassroomorg and find the Sea Level module
b) Follow the link to ldquoTide Datardquo
c) Choose a location you wish to study and write the name on your data sheet Using the form on
the Web site select the location from the list of recording stations
d) Search Internet news and weather sources for information about storms that impacted the area
near your station Identify a storm event to investigate and take note of the date of the storm
Understanding Sea Level Using Real Data 38
e) Using the form on the Web site select start and end dates around the time of the storm event you
found
f) Click the ldquoGet Datardquo button
g) If you have access to a printer print a copy of the tide data chart Otherwise save a copy to your
computer so that you can refer to it later On a PC right-click with the mouse and select ldquoSave
asrdquo On a Mac hold down the Ctrl key and click with the mouse
4 Use the Data Log Sheet to keep a record of the data you select so you can refer to it later
5 Analyze the data
a) What were the highest and lowest tides recorded during the storm event
b) How did the tides during the storm compare with the average high and low tides you calculated
for this station previously
c) Calculate the different between the highest tide measured during the storm and the average high
tide for the area
d) Can you use the data to determine how long the storm impacted the area
6 Draw conclusions
Write down what you learned from your investigation Use your data to help you decide if your
hypothesis was supported
Understanding Sea Level Using Real Data 39
Student Master
Data Log Sheet
Station Name
Date Time (Approx) Low Tide Height
High TideHeight
Tide HeightChange
Tide CyclePeriod
Understanding Sea Level Using Real Data 40
Level 5 Invention Designing Your Own Investigation
Summary Grade Level 6-8
Teaching Time
Two 45 minute periods
Activity
Design an investigation
using real data to examine
a hypothesis
Web Links For links to long-term sea
level trend data visit
wwwdataintheclassroomorg
Objective Students will apply what they have learned to consider sea level data on
a larger scale To do this students will design their own plan to answer a
research question using real data
Background Students have used real data to begin to understand changes in water
levels Most of the work has been an examination of how sea level
changes on a relatively small scale ndash at a single location or station and
over a very short period of time Now it is time for students to examine
sea level on a larger scale by developing their own investigation using
real data
Students should be encouraged to develop their own research questions
and hypotheses for this activity In general questions that lead them to
considering changes in water level on a larger scale will provide a good
starting point Here are some examples of questions
Research questions
Do changes in water level have the same impact everywhere on Earth
How is sea surface height changing over time
Students choosing to look at changes in sea level over time will naturally
consider the prospect of long-term sea level rise due to climate change It
may not be easy for students to detect and interpret long-term trends
using the kinds of data tools and analysis available to them However
links to long-term trend analyses are available and students can be
challenged to apply what they have learned about reading and
understanding data to interpret these long-term data products
Understanding Sea Level Using Real Data 41
Procedure
Materials 1 Distribute the Student Master Research Project Designing Your
Own Investigation and Student Master Data Log Sheet Copies of Student
Master Research Project 2 Guide student selection of a research question (or allow students
Designing Your Own to make up their own) that is appropriate to their academic Investigation
Copies of Student experience Review student hypotheses to make sure they are
Master Data Log Sheet appropriate and that students will be able to support or disprove
Student access to them using the kinds of data they will have available
computers with Internet
connections 3 Have students design a research project to answer the question
4 Check each research project plan before students begin to see if
it is in keeping with the question and the resources available
5 Assign students to use the tools at wwwdataintheclassroomorg
to access the data they need
6 When students complete their research provide time for them to
present their findings
7 Use the student presentations as an opportunity to relate this
investigation to the current news and debate about global climate
change Ask From your own experience looking at real data
how do these data relate to the question of global climate
change
Understanding Sea Level Using Real Data 42
Student Master
Research Project Designing Your Own Investigation
Planning your project
1 Develop a research question Then form a hypothesis to investigate
Be sure to review your hypothesis with your teacher before you begin
Research question
Hypothesis
2 Design a plan to test your hypothesis and answer the research question
What do you need
a) More information
b) Specific data
3 Go online and get data
a) Visit wwwdataintheclassroomorg and find the Sea Level module
b) Follow the link to ldquoSatellite Datardquo or ldquoTide Datardquo
c) Using the form select the data and parameters you wish to look at
d) Click the ldquoGet Datardquo button
4 Use the Data Log Sheet to keep a record of the data you select so you can refer to it later
5 Analyze the data
6 Draw conclusions
Write down what you learned from your investigation Use your data to help you decide whether your
hypothesis is supported If your hypothesis is not supported think about other data you might need to
collect
Understanding Sea Level Using Real Data 43
Student Master
Data Log Sheet As you use the online data access form to select data about sea level keep a record of the parameters you
select on this data log sheet Your data log will help you remember and keep track of the data you have
looked at Consider whether each new piece of data helps support or disprove your hypothesis
Data set Region Station Dates Notes
Understanding Sea Level Using Real Data 44

Teac
her
Mas
ter
Mon
thly
Ave
rage
Sea
Su
rfac
e H
eigh
t D
evia
tion
Nov
emb
er 1
993 U
nder
stan
ding
Sea
Lev
el U
sing
Rea
l Dat
a 16
Stu
dent
Mas
ter
Mon
thly
Ave
rage
Sea
Su
rfac
e H
eigh
t D
evia
tion
Nov
emb
er 1
995
Qu
esti
ons
1
Cir
cle
thre
e pl
aces
on
the
map
whe
re th
e m
easu
red
sea
surf
ace
heig
ht d
evia
tion
is m
ore
than
02
met
ers
abov
e or
bel
ow a
vera
ge
2
Rec
ord
the
appr
oxim
ate
latit
ude
and
long
itude
of
each
loca
tion
you
cho
se
3
Usi
ng th
e co
lor
key
rec
ord
the
sea
surf
ace
heig
ht d
evia
tion
at e
ach
loca
tion
you
cho
se
4
Exp
lain
wha
t mig
ht b
e ha
ppen
ing
at o
ne o
f yo
ur lo
cati
ons
In
your
exp
lana
tion
ref
er to
the
ball
oon
and
win
d de
mon
stra
tion
s yo
u sa
w in
cla
ss
Und
erst
andi
ng S
ea L
evel
Usi
ng R
eal D
ata
17
Level 2 Adoption Finding the Mean
Summary Grade Level 6 - 8
Teaching Time 45 minutes
Activities
Use a balloon model to
generate water level data
Compute a mean value
from the data
Use an online tide model
to illustrate changing
water level along a
coastline
Vocabulary Data ndashany information obtained
by observing andor measuring
Mean ndashthe arithmetic average of
a set of numbers It is found by
adding all the values in the set
and dividing the sum by the total
number of values
Deviation ndash the difference
between one data value in a set
and the mean value for that set
Objectives Students will generate some water level data using a balloon as a simple
model Students will calculate the mean and make a chart of their data
By understanding how to report data in terms of deviations from the
mean students will be prepared to interpret real sea level data from
different sources
Background The Earths oceans are not shaped like a perfect sphere of water Factors
such as the shape of the Earths crust variations in the planets
gravitational field winds and currents cause natural variations in the
height of the oceans surface around the globe Because of these natural
variations and the fact that the oceans themselves are always in motion
it is difficult to give measurements of sea surface height in absolute
terms Instead scientists measure the difference between the oceans
height and the expected or average height at any given location
Understanding the concept of a mean or average is important to
interpreting water level data at any scale Satellite-derived sea surface
height data and local tide gauge data are both reported as deviations from
an expected or mean height
Understanding Sea Level Using Real Data 18
Preparation Familiarize yourself with the online tide model so that you can
demonstrate it to the class The purpose of the interactive tide model is to
help students see the effects of typical changes in water level It is a
simple model but it can be programmed with values students derive
from real data in order to help them visualize how different factors
influence water level
Use of the tide model is optional in this activity but if you have a
computer and projector the applet is a helpful tool for illustrating and
discussing changing water level along a coastline
1 Visit wwwdataintheclassroomorg and find the Sea Level
module
2 Follow the link to ldquoTide Modelrdquo
3 In this activity you will be using the model to help illustrate how
water levels constantly change To program the model to show a
typical tidal change look for the line of controls labeled Tide
Understanding Sea Level Using Real Data 19
4 Enter 12 meters in the box labeled Max Height Change
See an Example A sample spreadsheet
showing a graph of water
height data is available at
wwwdataintheclassroomorg
5 Click the Play button to start the model The model will illustrate
the changing water level height in two ways first as an
animation of water rising and falling along the image of the
coastline and second as an animated graph showing the change
in water level over time The image and graph are synchronized
You can pause the model and enter different numbers to change
the water level behavior
Prepare the other materials you will need If you do not have a
waterproof lab surface to work on you should prepare and store these
materials in a large plastic tub to catch spills
Fill a long balloon with water from a tap Do not fill it too full The
balloon must be allowed to stretch and change shape when handled
without breaking
In this activity students will be asked to create data tables and simple
graphs using water height data they find on the Internet If you prefer
students may also use spreadsheet software such as Microsoft Excel to
help them with these tasks This is optional however
Understanding Sea Level Using Real Data 20
Materials Computer or overhead
projector
Long balloon
Water
Plastic tub or basin
Ruler
Paper and marker
Copies of Student Master
Finding the Mean
Copies of Student Master
Graph Your Results
Procedure 1 Display the online tide model on your computer or projector
Program the model with a tidal change of 12 meters as described
in the Preparation section on page 20
2 Ask students about the rising or falling water level If it is always
moving how do you get a general measurement for the water
level at a location How can you tell if a change in the water
level is large or small
Answer You compute an average or mean to describe the height
Then you can compare your measurements to the mean
3 Explain to the students that they will generate some sample
water level data using a balloon as a simple model of the ocean
in order to calculate the mean Select two students to gather data
to be used by the class
4 Have the two students perform steps 1 through 5 on the Student
Master Finding the Mean while the class follows along One
student can apply pressure to the balloon while the other
measures height data Ask all of the students in the class to
record this collected data on their own copies of the Master
5 Have all students perform step 6 on the Master They can
compute the mean of the water height data by following the
instructions
6 Have all students complete step 7 to calculate how much each
data point deviates from the mean
Understanding Sea Level Using Real Data 21
7 Ask students to complete the questions on the Master
Why are some deviation values greater than zero and some less
than zero
Answer Some height measurements are higher than average and
some are lower than average
What does it mean when a deviation value is negative
Answer It means the height measured at that point is lower than
average or less than the mean height at that point
Relate what you just learned to the color scale on the satellite
SSHD map
Answer The warm (reds and yellows) colors represent areas
where the water level is higher than average White or pale areas
represent areas where the water level is roughly the same as the
average Cool colors (blues and purples) represent areas where
the water level is lower than average
8 Finally students should graph their results following the
instructions on the Student Master Graph Your Results If they
are using spreadsheet software students may need guidance on
setting up their spreadsheet and graphs
Understanding Sea Level Using Real Data 22
Student Master
Finding the Mean Sea surface height is sometimes reported as the height difference relative to an expected or average height at
any given location In this activity you will use a balloon as a simple model of the ocean in order to collect
some data
1 Place a sheet of paper across the bottom of a waterproof plastic tub or basin Lay a balloon filled with
water across the paper
2 Sea surface height data is reported as the height difference relative to an expected or average height at
any given location Choose a location along the length of the balloon Use a marker to mark that
location next to the balloon on the paper at the bottom of the basin
3 With the balloon sitting undisturbed stand the ruler at the mark you made on the paper Measure the
height of the balloon at the mark in centimeters and record the height on the data sheet
4 Now apply pressure somewhere on the balloon so that its shape changes While pressing on the
balloon measure the height at the mark on the paper and record the height on the data sheet
5 Repeat step 4 at least three times Each time vary the pressure put on the balloon You can put
pressure on a different spot or vary the amount of pressure you apply Each time record the height on
the data sheet
Understanding Sea Level Using Real Data 23
6 Next compute the mean for the data collected
The mean is equal to the sum of all the
measurements divided by the number of
measurements recorded
mean height = sum of height measurements number of measurements
7 Once you have the mean calculate how much
each data point deviates from that mean To do
this subtract the mean from each height
measurement recorded Write the results in the
column marked Deviation
deviation = height measurement - mean height
Answer the following questions
Measure- Height (- Mean) Deviation ment
1
2
3
4
5
6
Total
Mean
1 Why are some deviation values greater than zero and some less than zero
2 What does it mean when a deviation value is negative
3 Relate what you just learned to the color scale on the satellite SSHD map
Understanding Sea Level Using Real Data 24
Student Master
Graph Your Resultsw
ater
hei
ght i
n ce
ntim
eter
s (c
m)
16
15
14
13
12
11
10
9
8
7
6
5
4
3
2
1
1 2 3 4 5 6
Measurements
Make a bar graph of the height data gathered from the balloon model Using the grid above draw a bar to
represent each height measurement you recorded
Next draw a horizontal line on the grid to represent the mean height you calculated
How are the height deviations you calculated represented on your bar chart
Understanding Sea Level Using Real Data 25
Level 3 Adaptation Reading Tide Data
Summary Grade Level 6-8
Teaching Time
Two 45 minute periods
Activities
Generate charts of real tide
data
Use tide model to help
visualize tide effects
Vocabulary Gravity ndash the force of attraction
that causes objects on Earth to
fall to the center of the Earth
Tide ndash periodic rising and falling
of the sea surface that results
from gravitational attraction of
the Moon and the Sun acting on
the rotating Earth
Tidal period ndash elapsed time
between successive high waters
and low waters
Mean low water (MLW) ndash a
reference point for measuring
tide heights based on historical
data MLW is the average water
height observed at low tide
during a 19-year period
Objective Students will go online to generate charts of real tide data Students will
apply their skill calculating the mean to real tide data in order to
characterize typical tide behavior at a selected location
Background Tides are generated by the gravitational attraction of the Moon and Sun
on the oceanrsquos waters Because the Moon is much closer to the Earth than
is the Sun its impact on ocean tides is larger despite the Suns greater
mass The gravitational pull of the Moon causes water to bulge away
from the Earth at the point closest to the Moon At the same time
centrifugal force causes a similar bulge on the opposite side of the Earth
As the Earth spins on its axis different parts of Earths surface move
through these tidal bulges resulting in a cycle of high and low tides
around the globe7
The Sun also plays a role in producing tides As the Moon orbits the
Earth its position relative to the Earth and Sun changes Sometimes the
Moon and Sun are lined up with the Earth and the resulting gravitational
pull of both bodies causes higher tides These are called spring tides and
they occur during full and new Moon phases During quarter Moon
phases when the Moon and Sun are not in line with the Earth lower
neap tides are produced
Tides do not occur with the same frequency and magnitude everywhere
Tides influence the rise and fall of water both in the open ocean and
along the coasts although that rise and fall can be much more
pronounced near land which can have an amplifying effect
7 Sverdrup K amp Armbrust E V (2008) An Introduction to the Worlds Oceans 9th ed McGraw-Hill p 284
Understanding Sea Level Using Real Data 26
Curriculum Link You can use this activity to
supplement other material in
your middle school physical
science curriculum
particularly material dealing
with tides and the
gravitational pull of the Moon
To Display
Generate this image at
wwwdataintheclassroomorg
NOAA has developed long-term data sets of local tide measurements
from an array of permanent monitoring stations around the United States
Over the years the technology for recording tides has changed from
early mechanical recorders to modern acoustic and electronic devices
Today this network of monitoring stations records tide measurements
electronically every six minutes at over 250 stations around the country
The data is transmitted to NOAA headquarters via satellite where it is
processed archived and made available online
Preparation Familiarize yourself with using the dataintheclassroomorg Web site to
generate charts from tide data
1 Visit wwwdataintheclassroomorg and find the Sea Level
module
2 Follow the link to ldquoTide Datardquo
3 Using the form select ldquoCape May NJrdquo from the list of recording
stations
4 Select a start date for the data you want to retrieve for example
08012007
5 Select an end date for example 08052007
6 Click the ldquoGet Datardquo button
7 Save the map image to your local computer On a PC right-click
with the mouse and select ldquoSave asrdquo On a Mac hold down the
Ctrl key and click with the mouse
Understanding Sea Level Using Real Data 27
Materials Procedure Computer or overhead 1 On an overhead projector display the Teacher Master What
projector Causes Tides Point out that tides are caused by the pull of Transparency of Teacher gravity between the Moon Sun and Earth Ask students to
Master What Causes indicate where the water has a bulge
Tides
Tide chart saved to your Answer The water bulges in alignment with the pull of the computer or transparency
Moonrsquos gravity of the Teacher Master
Looking at Tide Data Explain that because the Earth and Moon are relatively close to
Copies of Student one another in space the force of gravity between them is strong
Master Practice Reading The gravitational pull of the Moon causes water to bulge away
Tide Data from the Earth as it tries to move toward the Moon This effect
Rulers moves around the globe as the Earth and the Moon move
relative to each other
2 Display the tide chart from Cape May NJ (either from the file
saved on your computer or using a transparency of the Teacher
Master Looking at Tide Data) Describe features of the chart
The y-axis on the chart shows the height of the water relative
to the mean low water (MLW) Mean low water is a
reference point used by scientists for measuring tide heights
based on historical data MLW is the average water height
observed at low tide during a 19-year period
The x-axis shows the date and time of the water level
observations Look carefully at the time scale In the
example shown on the Master the x-axis is labeled every 20
hours
Along the y-axis the measurement from the lowest point to
the highest point in each tide cycle is the change in water
level due to the tide
Along the x-axis the measurement between consecutive low
tides or consecutive high tides is the period of the tidal cycle
Understanding Sea Level Using Real Data 28
Online Tool
Use the tide model to
visualize students data Visit
wwwdataintheclassroomorg
3 Explain that students will go online to generate tide charts for
themselves using real data Their task is to measure the tide
height change and period from data collected at a monitoring a
station
4 If you have not done so in earlier activities use a computer and
projector to demonstrate how to use the dataintheclassroomorg
Web site to generate graphs of tide data Refer to the Preparation
steps described on page 27
5 Students will need to access the Internet to generate and save
data maps and graphs Depending on the setting this can be done
in a computer lab or assigned as homework assuming students
have access to the Internet at a library or computer center
Students should follow the instructions on the Student Master
and record their data and calculations on the table provided
6 When students have finished gathering data and making
calculations conclude the activity with a demonstration to help
students visualize their data Follow the procedure on page 19 to
display the online tide model
Ask for a volunteer to enter his or her data into the model Look
for the line of controls labeled Tide Enter the averages he or she
calculated from the box on the data sheet labeled Max Height
Change
Click the Play button to start the model The model will illustrate
the changing water level height in two ways first as an
animation of water rising and falling along the image of the
coastline and second as an animated graph showing the change
in water level over time The image and graph are synchronized
You can stop the model and enter different numbers to change
the behavior
Understanding Sea Level Using Real Data 29
Assessment Rubric In assessing student performance consider how students approached
collecting their tide data and what calculations they made based on the
data
Successful student work may include
Correct use of the y-axis to measure height changes and the x-
axis to measure time intervals
A selection of data from a selected station during several
different periods of time
Calculation of the average low tide height high tide height and
height change using data from different time periods
A working definition of a mean or average
A working definition of relative height change or deviation
Depending on the measuring station and time period selected the tide
data chart may look different than the example charts provided in these
pages Students may encounter multiple small highs and lows that they
may find difficult to interpret Be prepared to guide students through the
process of making their measurements on more complicated tide charts
Understanding Sea Level Using Real Data 30
Teac
her
Mas
ter
Wh
at C
ause
s T
ides
Uni
form
wat
er le
vel
The
gra
vita
tiona
l pul
l of
the
Moo
n ca
uses
wat
er
to b
ulge
aw
ay f
rom
the
Ear
th a
t the
poi
nt
clos
est t
o th
e M
oon
Moo
n
Ear
th
At t
he s
ame
time
cen
trifu
gal f
orce
cau
ses
a si
mila
r bu
lge
on th
e op
posi
te s
ide
of th
e E
arth
Ada
pted
fro
m S
verd
rup
K amp
Arm
brus
t E
V (
2008
) A
n In
trod
ucti
on to
the
Wor
lds
Oce
ans
9th
ed
McG
raw
-Hil
l F
igur
e 11
5 p
284
Moo
n im
age
NA
SA
Und
erst
andi
ng S
ea L
evel
Usi
ng R
eal D
ata
31
Teac
her
Mas
ter
Loo
kin
g at
Tid
e D
ata
Alo
ng th
e y-
axis
the
mea
sure
men
t fro
m th
e lo
wes
t poi
nt to
the
high
est
Alo
ng th
e x-
axis
the
mea
sure
men
t bet
wee
n co
nsec
utiv
e lo
w ti
des
or
poin
t in
each
cyc
le is
the
tida
l cha
nge
in w
ater
leve
l co
nsec
utiv
e hi
gh ti
des
is th
e ti
me
peri
od o
f th
e ti
dal c
ycle
Und
erst
andi
ng S
ea L
evel
Usi
ng R
eal D
ata
32
Student Master
Practice Reading Tide Data Water level around the globe is always changing as a result of many factors One of those factors is the effect
of tides caused by the gravitational attraction of the Moon In this activity you will use charts of real tide
data like the one shown below to research tides in a specific location Your goal is to describe the typical
height change and period of the tidal change
1 Visit wwwdataintheclassroomorg and find the Sea Level module
2 Follow the link to ldquoTide Datardquo
3 Choose a location you wish to study and write the name on your data sheet Using the form on the
Web site select the location from the list of recording stations
4 Select a start and end date for the data you wish to retrieve Be sure to retrieve data over a period of at
least several days so that you can see a number of tide cycles
5 Click the ldquoGet Datardquo button
6 If you have access to a printer print a copy of the tide data chart Otherwise save a copy to your
computer so that you can refer to it later On a PC right-click with the mouse and select ldquoSave asrdquo
On a Mac hold down the Ctrl key and click with the mouse
Understanding Sea Level Using Real Data 33
7 Look at the chart and see if you can identify a pattern of low and high tides Choose a point on the
chart that represents a low tide Use the scale on the y-axis to determine the relative height of the
water at that point Record the approximate time and the relative water height on your data sheet
8 Now find the point that represents the next high tide and record the relative height of the water then
9 Calculate the difference between the water height at high and low tides This is the height change
Record this change on your data sheet
10 Next choose two points on the chart that represent consecutive low or consecutive high tides Use the
time scale on the x-axis to determine the time period of the tide cycle Record the period on your data
sheet
Do you think the measurements you just made provide a good description of the tides at this location
Hint Make measurements using data from the same location at other times to see if the tides are different
Once you have made several measurements can you make calculations to find the average height
change and period from the data you collected
Data Sheet
Station Name
Date Time (Approx) Low Tide High Tide Tide Height Tide CycleHeight Height Change Period
08022007 2000 0 m 175 m 175 m 12 hrs
Understanding Sea Level Using Real Data 34
Level 4 Interactivity Measuring Storm Effects
Summary Grade Level 6-8
Teaching Time
Two 45 minute periods
Activities
Get water height data for
storm events
Create a research plan
using real data
Use interactive tide model
to visualize storm effects
Vocabulary Storm tide ndash a storm surge
event that takes place along the
coast which produces
exceptionally high water A
storm tide is generated by
storm wind stress and low
atmospheric pressure Storm
surges are made even higher
when associated with high tide
and shallow depths
Objective Using what they learned about typical tide measurements at a location
students will investigate and measure what happens to water height
during a storm event
Background Storms can have a big impact on local water levels in coastal areas A
storm surge happens when water is pushed toward the shore by high
powered winds from a storm such as a hurricane The storm interacts
with the normal tide to create a storm tide that can increase the normal
water height by 4 to 5 meters (15 feet) or more These events can cause
extreme flooding in coastal areas Most coastlines in the United States
are only 3 meters (10 feet) or less above mean sea level which means
that storms can be very dangerous for people who live near the coast8
During this lesson students are asked to answer a research question
How do storm events impact water levels at a coastal location To
accomplish this task students must take the calculations they made in the
last activity and use them as a baseline to evaluate the tide heights
observed during a storm
8 Ross A R(1995) Introduction to Oceanography New York Harper Collins p 230
Understanding Sea Level Using Real Data 35
Materials Procedure Computer or overhead 1 On an overhead projector display a news report from a recent
projector storm Copies of Student
Master Research Project Explain that water level is affected by lots of different factors Determining Storm Surge not just tides and that these factors actually compound or add Height together
Copies of Student
Master Data Log Sheet 2 Explain that students will continue the investigation of water Rulers
level from the last activity This time they will go online to look
at data related to storms Their task is to make a research plan
using real data to describe the effects of storms on coastal water
levels Their goal is to determine the additional effect a storm
can have on water height
3 Students will need to access the Internet to generate and save
data maps and graphs Depending on the setting this can be done
in a computer lab or assigned as homework assuming students
have access to the Internet at a library or computer center
Students should follow the instructions on the Student Master
Research Project Determining Storm Surge Height and record
their data and calculations on the table provided
4 When students have finished gathering data and making
calculations conclude the activity with a demonstration to help
students visualize their data Follow the procedure on page 19 to
display the online tide model
Ask for a volunteer to enter his or her data into the model Look
for the line of controls labeled Storm The student should enter
the storm surge height and duration he or she calculated in the
boxes from the Data Log Sheet labeled Max Height Change
Click the Play button to start the model You can stop the model
and enter different numbers to change the behavior
Understanding Sea Level Using Real Data 36
Assessment Rubric In assessing student performance consider how students approached
collecting their tide data and what calculations they made based on the
data
Successful student work may include
Correct use of the y-axis to measure height changes and the x-
axis to measure time intervals
A selection of data from a selected station during several
different periods of time In particular students should attempt to
determine how long the storm impacted the area ndash from when the
storm effect was first seen to when it went away
Determine the maximum high tide recorded during the storm
Calculation of the difference between the maximum high tide
and the average high tide they found in the last activity
A working definition of a mean or average
A working definition of relative height change or deviation
Understanding Sea Level Using Real Data 37
Student Master
Research Project Determining Storm Surge Height You are joining a team of scientists who are studying the effects of storms along the US coast Your task is to
pick a storm event for a coastal location and design a research plan to help you gather data about the water
height before during and after the storm You already know something about the typical or average water
height in the area due to tides Your goal now is to determine the additional effect a storm can have on water
height Once your plan is accepted you are to carry out your data collection analyze it and report your
findings to the team
Planning your project
1 Form a hypothesis before designing your investigation
Research question How do storm events impact water levels at my coastal location
Hypothesis Storms produce a surge which raises water levels above what would normally occur
during a typical tide cycle
2 Design a plan to test your hypothesis and answer your research question
What do you need
a) More information Do you need more information about specific storm events and their effects
b) Specific data When you go online to collect data what dates will you look at and what charts
will you generate
3 Go online and get data
a) Visit wwwdataintheclassroomorg and find the Sea Level module
b) Follow the link to ldquoTide Datardquo
c) Choose a location you wish to study and write the name on your data sheet Using the form on
the Web site select the location from the list of recording stations
d) Search Internet news and weather sources for information about storms that impacted the area
near your station Identify a storm event to investigate and take note of the date of the storm
Understanding Sea Level Using Real Data 38
e) Using the form on the Web site select start and end dates around the time of the storm event you
found
f) Click the ldquoGet Datardquo button
g) If you have access to a printer print a copy of the tide data chart Otherwise save a copy to your
computer so that you can refer to it later On a PC right-click with the mouse and select ldquoSave
asrdquo On a Mac hold down the Ctrl key and click with the mouse
4 Use the Data Log Sheet to keep a record of the data you select so you can refer to it later
5 Analyze the data
a) What were the highest and lowest tides recorded during the storm event
b) How did the tides during the storm compare with the average high and low tides you calculated
for this station previously
c) Calculate the different between the highest tide measured during the storm and the average high
tide for the area
d) Can you use the data to determine how long the storm impacted the area
6 Draw conclusions
Write down what you learned from your investigation Use your data to help you decide if your
hypothesis was supported
Understanding Sea Level Using Real Data 39
Student Master
Data Log Sheet
Station Name
Date Time (Approx) Low Tide Height
High TideHeight
Tide HeightChange
Tide CyclePeriod
Understanding Sea Level Using Real Data 40
Level 5 Invention Designing Your Own Investigation
Summary Grade Level 6-8
Teaching Time
Two 45 minute periods
Activity
Design an investigation
using real data to examine
a hypothesis
Web Links For links to long-term sea
level trend data visit
wwwdataintheclassroomorg
Objective Students will apply what they have learned to consider sea level data on
a larger scale To do this students will design their own plan to answer a
research question using real data
Background Students have used real data to begin to understand changes in water
levels Most of the work has been an examination of how sea level
changes on a relatively small scale ndash at a single location or station and
over a very short period of time Now it is time for students to examine
sea level on a larger scale by developing their own investigation using
real data
Students should be encouraged to develop their own research questions
and hypotheses for this activity In general questions that lead them to
considering changes in water level on a larger scale will provide a good
starting point Here are some examples of questions
Research questions
Do changes in water level have the same impact everywhere on Earth
How is sea surface height changing over time
Students choosing to look at changes in sea level over time will naturally
consider the prospect of long-term sea level rise due to climate change It
may not be easy for students to detect and interpret long-term trends
using the kinds of data tools and analysis available to them However
links to long-term trend analyses are available and students can be
challenged to apply what they have learned about reading and
understanding data to interpret these long-term data products
Understanding Sea Level Using Real Data 41
Procedure
Materials 1 Distribute the Student Master Research Project Designing Your
Own Investigation and Student Master Data Log Sheet Copies of Student
Master Research Project 2 Guide student selection of a research question (or allow students
Designing Your Own to make up their own) that is appropriate to their academic Investigation
Copies of Student experience Review student hypotheses to make sure they are
Master Data Log Sheet appropriate and that students will be able to support or disprove
Student access to them using the kinds of data they will have available
computers with Internet
connections 3 Have students design a research project to answer the question
4 Check each research project plan before students begin to see if
it is in keeping with the question and the resources available
5 Assign students to use the tools at wwwdataintheclassroomorg
to access the data they need
6 When students complete their research provide time for them to
present their findings
7 Use the student presentations as an opportunity to relate this
investigation to the current news and debate about global climate
change Ask From your own experience looking at real data
how do these data relate to the question of global climate
change
Understanding Sea Level Using Real Data 42
Student Master
Research Project Designing Your Own Investigation
Planning your project
1 Develop a research question Then form a hypothesis to investigate
Be sure to review your hypothesis with your teacher before you begin
Research question
Hypothesis
2 Design a plan to test your hypothesis and answer the research question
What do you need
a) More information
b) Specific data
3 Go online and get data
a) Visit wwwdataintheclassroomorg and find the Sea Level module
b) Follow the link to ldquoSatellite Datardquo or ldquoTide Datardquo
c) Using the form select the data and parameters you wish to look at
d) Click the ldquoGet Datardquo button
4 Use the Data Log Sheet to keep a record of the data you select so you can refer to it later
5 Analyze the data
6 Draw conclusions
Write down what you learned from your investigation Use your data to help you decide whether your
hypothesis is supported If your hypothesis is not supported think about other data you might need to
collect
Understanding Sea Level Using Real Data 43
Student Master
Data Log Sheet As you use the online data access form to select data about sea level keep a record of the parameters you
select on this data log sheet Your data log will help you remember and keep track of the data you have
looked at Consider whether each new piece of data helps support or disprove your hypothesis
Data set Region Station Dates Notes
Understanding Sea Level Using Real Data 44
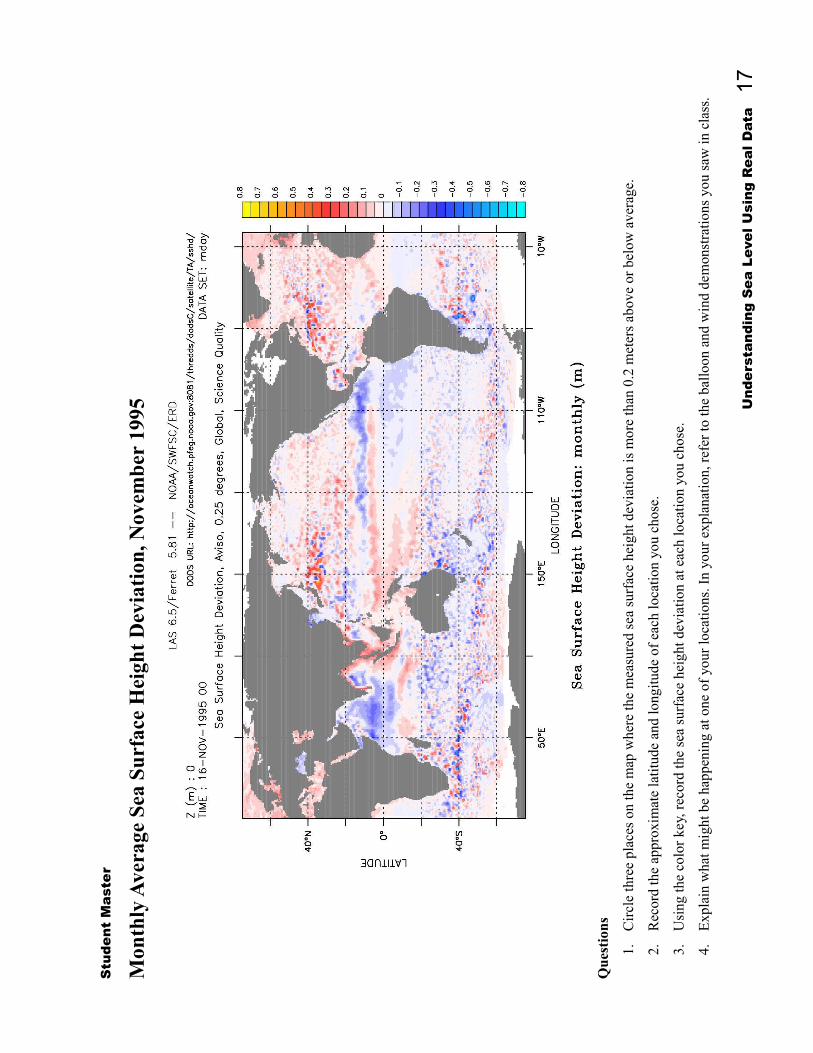
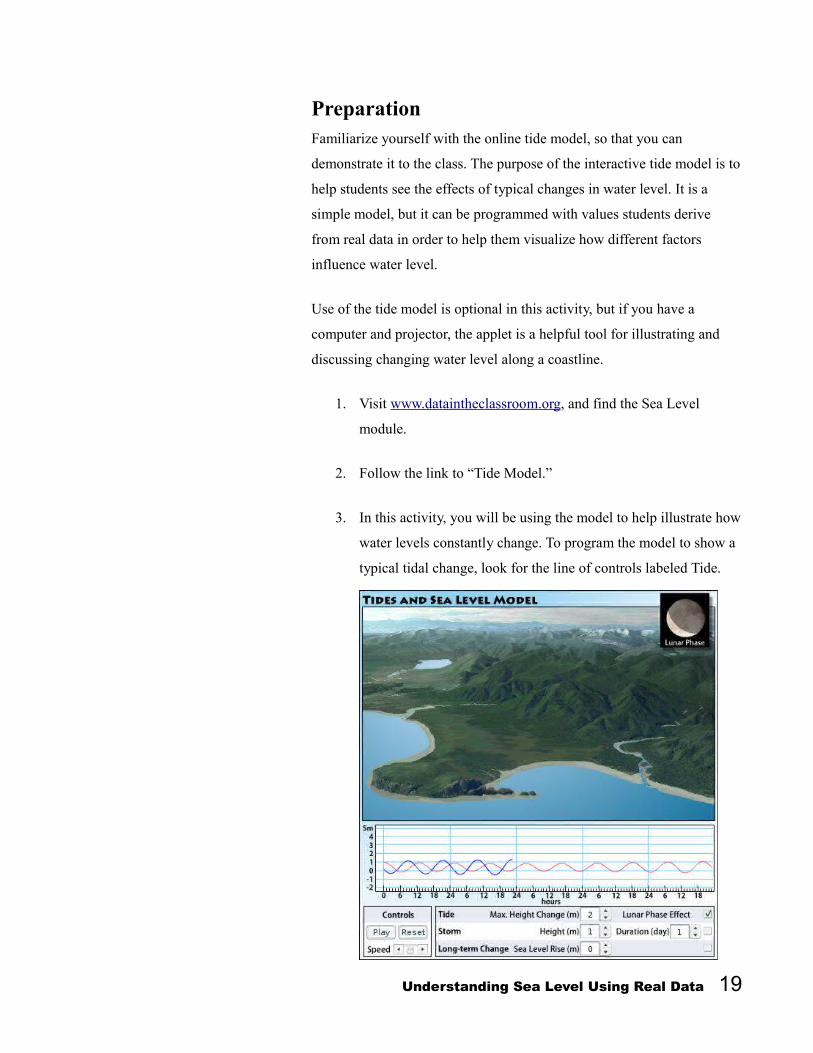
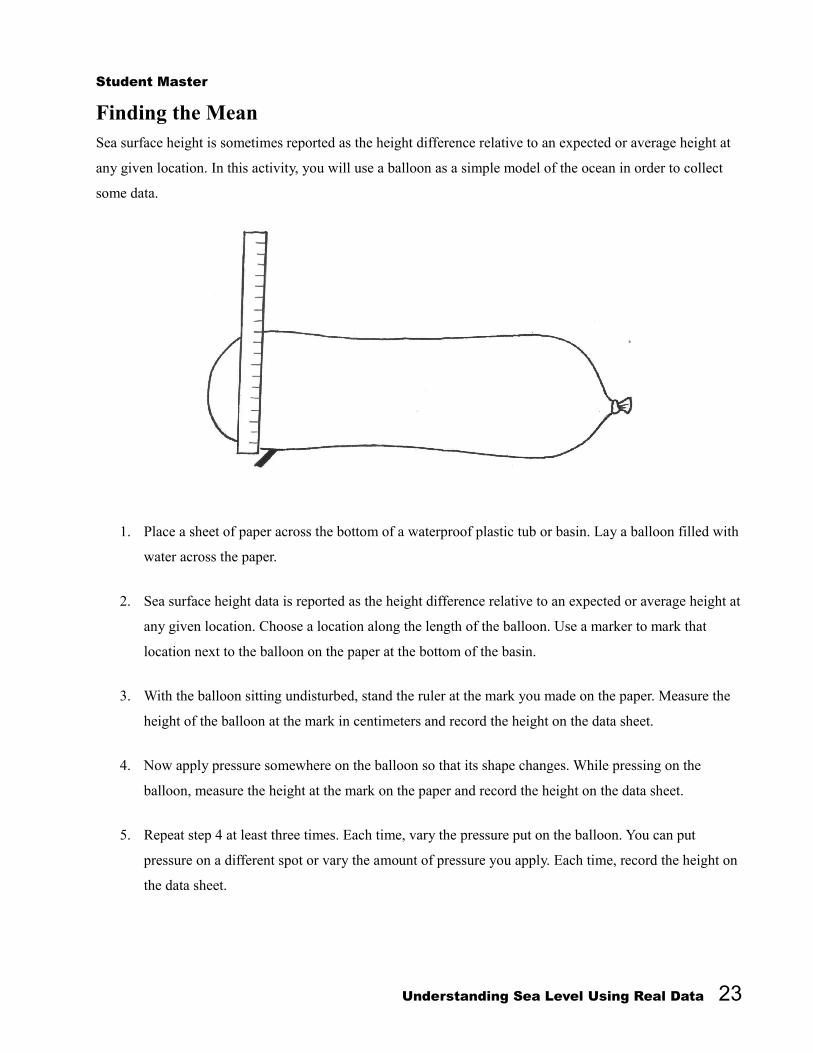
Student Master
Finding the Mean Sea surface height is sometimes reported as the height difference relative to an expected or average height at
any given location In this activity you will use a balloon as a simple model of the ocean in order to collect
some data
1 Place a sheet of paper across the bottom of a waterproof plastic tub or basin Lay a balloon filled with
water across the paper
2 Sea surface height data is reported as the height difference relative to an expected or average height at
any given location Choose a location along the length of the balloon Use a marker to mark that
location next to the balloon on the paper at the bottom of the basin
3 With the balloon sitting undisturbed stand the ruler at the mark you made on the paper Measure the
height of the balloon at the mark in centimeters and record the height on the data sheet
4 Now apply pressure somewhere on the balloon so that its shape changes While pressing on the
balloon measure the height at the mark on the paper and record the height on the data sheet
5 Repeat step 4 at least three times Each time vary the pressure put on the balloon You can put
pressure on a different spot or vary the amount of pressure you apply Each time record the height on
the data sheet
Understanding Sea Level Using Real Data 23
6 Next compute the mean for the data collected
The mean is equal to the sum of all the
measurements divided by the number of
measurements recorded
mean height = sum of height measurements number of measurements
7 Once you have the mean calculate how much
each data point deviates from that mean To do
this subtract the mean from each height
measurement recorded Write the results in the
column marked Deviation
deviation = height measurement - mean height
Answer the following questions
Measure- Height (- Mean) Deviation ment
1
2
3
4
5
6
Total
Mean
1 Why are some deviation values greater than zero and some less than zero
2 What does it mean when a deviation value is negative
3 Relate what you just learned to the color scale on the satellite SSHD map
Understanding Sea Level Using Real Data 24
Student Master
Graph Your Resultsw
ater
hei
ght i
n ce
ntim
eter
s (c
m)
16
15
14
13
12
11
10
9
8
7
6
5
4
3
2
1
1 2 3 4 5 6
Measurements
Make a bar graph of the height data gathered from the balloon model Using the grid above draw a bar to
represent each height measurement you recorded
Next draw a horizontal line on the grid to represent the mean height you calculated
How are the height deviations you calculated represented on your bar chart
Understanding Sea Level Using Real Data 25
Level 3 Adaptation Reading Tide Data
Summary Grade Level 6-8
Teaching Time
Two 45 minute periods
Activities
Generate charts of real tide
data
Use tide model to help
visualize tide effects
Vocabulary Gravity ndash the force of attraction
that causes objects on Earth to
fall to the center of the Earth
Tide ndash periodic rising and falling
of the sea surface that results
from gravitational attraction of
the Moon and the Sun acting on
the rotating Earth
Tidal period ndash elapsed time
between successive high waters
and low waters
Mean low water (MLW) ndash a
reference point for measuring
tide heights based on historical
data MLW is the average water
height observed at low tide
during a 19-year period
Objective Students will go online to generate charts of real tide data Students will
apply their skill calculating the mean to real tide data in order to
characterize typical tide behavior at a selected location
Background Tides are generated by the gravitational attraction of the Moon and Sun
on the oceanrsquos waters Because the Moon is much closer to the Earth than
is the Sun its impact on ocean tides is larger despite the Suns greater
mass The gravitational pull of the Moon causes water to bulge away
from the Earth at the point closest to the Moon At the same time
centrifugal force causes a similar bulge on the opposite side of the Earth
As the Earth spins on its axis different parts of Earths surface move
through these tidal bulges resulting in a cycle of high and low tides
around the globe7
The Sun also plays a role in producing tides As the Moon orbits the
Earth its position relative to the Earth and Sun changes Sometimes the
Moon and Sun are lined up with the Earth and the resulting gravitational
pull of both bodies causes higher tides These are called spring tides and
they occur during full and new Moon phases During quarter Moon
phases when the Moon and Sun are not in line with the Earth lower
neap tides are produced
Tides do not occur with the same frequency and magnitude everywhere
Tides influence the rise and fall of water both in the open ocean and
along the coasts although that rise and fall can be much more
pronounced near land which can have an amplifying effect
7 Sverdrup K amp Armbrust E V (2008) An Introduction to the Worlds Oceans 9th ed McGraw-Hill p 284
Understanding Sea Level Using Real Data 26
Curriculum Link You can use this activity to
supplement other material in
your middle school physical
science curriculum
particularly material dealing
with tides and the
gravitational pull of the Moon
To Display
Generate this image at
wwwdataintheclassroomorg
NOAA has developed long-term data sets of local tide measurements
from an array of permanent monitoring stations around the United States
Over the years the technology for recording tides has changed from
early mechanical recorders to modern acoustic and electronic devices
Today this network of monitoring stations records tide measurements
electronically every six minutes at over 250 stations around the country
The data is transmitted to NOAA headquarters via satellite where it is
processed archived and made available online
Preparation Familiarize yourself with using the dataintheclassroomorg Web site to
generate charts from tide data
1 Visit wwwdataintheclassroomorg and find the Sea Level
module
2 Follow the link to ldquoTide Datardquo
3 Using the form select ldquoCape May NJrdquo from the list of recording
stations
4 Select a start date for the data you want to retrieve for example
08012007
5 Select an end date for example 08052007
6 Click the ldquoGet Datardquo button
7 Save the map image to your local computer On a PC right-click
with the mouse and select ldquoSave asrdquo On a Mac hold down the
Ctrl key and click with the mouse
Understanding Sea Level Using Real Data 27
Materials Procedure Computer or overhead 1 On an overhead projector display the Teacher Master What
projector Causes Tides Point out that tides are caused by the pull of Transparency of Teacher gravity between the Moon Sun and Earth Ask students to
Master What Causes indicate where the water has a bulge
Tides
Tide chart saved to your Answer The water bulges in alignment with the pull of the computer or transparency
Moonrsquos gravity of the Teacher Master
Looking at Tide Data Explain that because the Earth and Moon are relatively close to
Copies of Student one another in space the force of gravity between them is strong
Master Practice Reading The gravitational pull of the Moon causes water to bulge away
Tide Data from the Earth as it tries to move toward the Moon This effect
Rulers moves around the globe as the Earth and the Moon move
relative to each other
2 Display the tide chart from Cape May NJ (either from the file
saved on your computer or using a transparency of the Teacher
Master Looking at Tide Data) Describe features of the chart
The y-axis on the chart shows the height of the water relative
to the mean low water (MLW) Mean low water is a
reference point used by scientists for measuring tide heights
based on historical data MLW is the average water height
observed at low tide during a 19-year period
The x-axis shows the date and time of the water level
observations Look carefully at the time scale In the
example shown on the Master the x-axis is labeled every 20
hours
Along the y-axis the measurement from the lowest point to
the highest point in each tide cycle is the change in water
level due to the tide
Along the x-axis the measurement between consecutive low
tides or consecutive high tides is the period of the tidal cycle
Understanding Sea Level Using Real Data 28
Online Tool
Use the tide model to
visualize students data Visit
wwwdataintheclassroomorg
3 Explain that students will go online to generate tide charts for
themselves using real data Their task is to measure the tide
height change and period from data collected at a monitoring a
station
4 If you have not done so in earlier activities use a computer and
projector to demonstrate how to use the dataintheclassroomorg
Web site to generate graphs of tide data Refer to the Preparation
steps described on page 27
5 Students will need to access the Internet to generate and save
data maps and graphs Depending on the setting this can be done
in a computer lab or assigned as homework assuming students
have access to the Internet at a library or computer center
Students should follow the instructions on the Student Master
and record their data and calculations on the table provided
6 When students have finished gathering data and making
calculations conclude the activity with a demonstration to help
students visualize their data Follow the procedure on page 19 to
display the online tide model
Ask for a volunteer to enter his or her data into the model Look
for the line of controls labeled Tide Enter the averages he or she
calculated from the box on the data sheet labeled Max Height
Change
Click the Play button to start the model The model will illustrate
the changing water level height in two ways first as an
animation of water rising and falling along the image of the
coastline and second as an animated graph showing the change
in water level over time The image and graph are synchronized
You can stop the model and enter different numbers to change
the behavior
Understanding Sea Level Using Real Data 29
Assessment Rubric In assessing student performance consider how students approached
collecting their tide data and what calculations they made based on the
data
Successful student work may include
Correct use of the y-axis to measure height changes and the x-
axis to measure time intervals
A selection of data from a selected station during several
different periods of time
Calculation of the average low tide height high tide height and
height change using data from different time periods
A working definition of a mean or average
A working definition of relative height change or deviation
Depending on the measuring station and time period selected the tide
data chart may look different than the example charts provided in these
pages Students may encounter multiple small highs and lows that they
may find difficult to interpret Be prepared to guide students through the
process of making their measurements on more complicated tide charts
Understanding Sea Level Using Real Data 30
Teac
her
Mas
ter
Wh
at C
ause
s T
ides
Uni
form
wat
er le
vel
The
gra
vita
tiona
l pul
l of
the
Moo
n ca
uses
wat
er
to b
ulge
aw
ay f
rom
the
Ear
th a
t the
poi
nt
clos
est t
o th
e M
oon
Moo
n
Ear
th
At t
he s
ame
time
cen
trifu
gal f
orce
cau
ses
a si
mila
r bu
lge
on th
e op
posi
te s
ide
of th
e E
arth
Ada
pted
fro
m S
verd
rup
K amp
Arm
brus
t E
V (
2008
) A
n In
trod
ucti
on to
the
Wor
lds
Oce
ans
9th
ed
McG
raw
-Hil
l F
igur
e 11
5 p
284
Moo
n im
age
NA
SA
Und
erst
andi
ng S
ea L
evel
Usi
ng R
eal D
ata
31
Teac
her
Mas
ter
Loo
kin
g at
Tid
e D
ata
Alo
ng th
e y-
axis
the
mea
sure
men
t fro
m th
e lo
wes
t poi
nt to
the
high
est
Alo
ng th
e x-
axis
the
mea
sure
men
t bet
wee
n co
nsec
utiv
e lo
w ti
des
or
poin
t in
each
cyc
le is
the
tida
l cha
nge
in w
ater
leve
l co
nsec
utiv
e hi
gh ti
des
is th
e ti
me
peri
od o
f th
e ti
dal c
ycle
Und
erst
andi
ng S
ea L
evel
Usi
ng R
eal D
ata
32
Student Master
Practice Reading Tide Data Water level around the globe is always changing as a result of many factors One of those factors is the effect
of tides caused by the gravitational attraction of the Moon In this activity you will use charts of real tide
data like the one shown below to research tides in a specific location Your goal is to describe the typical
height change and period of the tidal change
1 Visit wwwdataintheclassroomorg and find the Sea Level module
2 Follow the link to ldquoTide Datardquo
3 Choose a location you wish to study and write the name on your data sheet Using the form on the
Web site select the location from the list of recording stations
4 Select a start and end date for the data you wish to retrieve Be sure to retrieve data over a period of at
least several days so that you can see a number of tide cycles
5 Click the ldquoGet Datardquo button
6 If you have access to a printer print a copy of the tide data chart Otherwise save a copy to your
computer so that you can refer to it later On a PC right-click with the mouse and select ldquoSave asrdquo
On a Mac hold down the Ctrl key and click with the mouse
Understanding Sea Level Using Real Data 33
7 Look at the chart and see if you can identify a pattern of low and high tides Choose a point on the
chart that represents a low tide Use the scale on the y-axis to determine the relative height of the
water at that point Record the approximate time and the relative water height on your data sheet
8 Now find the point that represents the next high tide and record the relative height of the water then
9 Calculate the difference between the water height at high and low tides This is the height change
Record this change on your data sheet
10 Next choose two points on the chart that represent consecutive low or consecutive high tides Use the
time scale on the x-axis to determine the time period of the tide cycle Record the period on your data
sheet
Do you think the measurements you just made provide a good description of the tides at this location
Hint Make measurements using data from the same location at other times to see if the tides are different
Once you have made several measurements can you make calculations to find the average height
change and period from the data you collected
Data Sheet
Station Name
Date Time (Approx) Low Tide High Tide Tide Height Tide CycleHeight Height Change Period
08022007 2000 0 m 175 m 175 m 12 hrs
Understanding Sea Level Using Real Data 34
Level 4 Interactivity Measuring Storm Effects
Summary Grade Level 6-8
Teaching Time
Two 45 minute periods
Activities
Get water height data for
storm events
Create a research plan
using real data
Use interactive tide model
to visualize storm effects
Vocabulary Storm tide ndash a storm surge
event that takes place along the
coast which produces
exceptionally high water A
storm tide is generated by
storm wind stress and low
atmospheric pressure Storm
surges are made even higher
when associated with high tide
and shallow depths
Objective Using what they learned about typical tide measurements at a location
students will investigate and measure what happens to water height
during a storm event
Background Storms can have a big impact on local water levels in coastal areas A
storm surge happens when water is pushed toward the shore by high
powered winds from a storm such as a hurricane The storm interacts
with the normal tide to create a storm tide that can increase the normal
water height by 4 to 5 meters (15 feet) or more These events can cause
extreme flooding in coastal areas Most coastlines in the United States
are only 3 meters (10 feet) or less above mean sea level which means
that storms can be very dangerous for people who live near the coast8
During this lesson students are asked to answer a research question
How do storm events impact water levels at a coastal location To
accomplish this task students must take the calculations they made in the
last activity and use them as a baseline to evaluate the tide heights
observed during a storm
8 Ross A R(1995) Introduction to Oceanography New York Harper Collins p 230
Understanding Sea Level Using Real Data 35
Materials Procedure Computer or overhead 1 On an overhead projector display a news report from a recent
projector storm Copies of Student
Master Research Project Explain that water level is affected by lots of different factors Determining Storm Surge not just tides and that these factors actually compound or add Height together
Copies of Student
Master Data Log Sheet 2 Explain that students will continue the investigation of water Rulers
level from the last activity This time they will go online to look
at data related to storms Their task is to make a research plan
using real data to describe the effects of storms on coastal water
levels Their goal is to determine the additional effect a storm
can have on water height
3 Students will need to access the Internet to generate and save
data maps and graphs Depending on the setting this can be done
in a computer lab or assigned as homework assuming students
have access to the Internet at a library or computer center
Students should follow the instructions on the Student Master
Research Project Determining Storm Surge Height and record
their data and calculations on the table provided
4 When students have finished gathering data and making
calculations conclude the activity with a demonstration to help
students visualize their data Follow the procedure on page 19 to
display the online tide model
Ask for a volunteer to enter his or her data into the model Look
for the line of controls labeled Storm The student should enter
the storm surge height and duration he or she calculated in the
boxes from the Data Log Sheet labeled Max Height Change
Click the Play button to start the model You can stop the model
and enter different numbers to change the behavior
Understanding Sea Level Using Real Data 36
Assessment Rubric In assessing student performance consider how students approached
collecting their tide data and what calculations they made based on the
data
Successful student work may include
Correct use of the y-axis to measure height changes and the x-
axis to measure time intervals
A selection of data from a selected station during several
different periods of time In particular students should attempt to
determine how long the storm impacted the area ndash from when the
storm effect was first seen to when it went away
Determine the maximum high tide recorded during the storm
Calculation of the difference between the maximum high tide
and the average high tide they found in the last activity
A working definition of a mean or average
A working definition of relative height change or deviation
Understanding Sea Level Using Real Data 37
Student Master
Research Project Determining Storm Surge Height You are joining a team of scientists who are studying the effects of storms along the US coast Your task is to
pick a storm event for a coastal location and design a research plan to help you gather data about the water
height before during and after the storm You already know something about the typical or average water
height in the area due to tides Your goal now is to determine the additional effect a storm can have on water
height Once your plan is accepted you are to carry out your data collection analyze it and report your
findings to the team
Planning your project
1 Form a hypothesis before designing your investigation
Research question How do storm events impact water levels at my coastal location
Hypothesis Storms produce a surge which raises water levels above what would normally occur
during a typical tide cycle
2 Design a plan to test your hypothesis and answer your research question
What do you need
a) More information Do you need more information about specific storm events and their effects
b) Specific data When you go online to collect data what dates will you look at and what charts
will you generate
3 Go online and get data
a) Visit wwwdataintheclassroomorg and find the Sea Level module
b) Follow the link to ldquoTide Datardquo
c) Choose a location you wish to study and write the name on your data sheet Using the form on
the Web site select the location from the list of recording stations
d) Search Internet news and weather sources for information about storms that impacted the area
near your station Identify a storm event to investigate and take note of the date of the storm
Understanding Sea Level Using Real Data 38
e) Using the form on the Web site select start and end dates around the time of the storm event you
found
f) Click the ldquoGet Datardquo button
g) If you have access to a printer print a copy of the tide data chart Otherwise save a copy to your
computer so that you can refer to it later On a PC right-click with the mouse and select ldquoSave
asrdquo On a Mac hold down the Ctrl key and click with the mouse
4 Use the Data Log Sheet to keep a record of the data you select so you can refer to it later
5 Analyze the data
a) What were the highest and lowest tides recorded during the storm event
b) How did the tides during the storm compare with the average high and low tides you calculated
for this station previously
c) Calculate the different between the highest tide measured during the storm and the average high
tide for the area
d) Can you use the data to determine how long the storm impacted the area
6 Draw conclusions
Write down what you learned from your investigation Use your data to help you decide if your
hypothesis was supported
Understanding Sea Level Using Real Data 39
Student Master
Data Log Sheet
Station Name
Date Time (Approx) Low Tide Height
High TideHeight
Tide HeightChange
Tide CyclePeriod
Understanding Sea Level Using Real Data 40
Level 5 Invention Designing Your Own Investigation
Summary Grade Level 6-8
Teaching Time
Two 45 minute periods
Activity
Design an investigation
using real data to examine
a hypothesis
Web Links For links to long-term sea
level trend data visit
wwwdataintheclassroomorg
Objective Students will apply what they have learned to consider sea level data on
a larger scale To do this students will design their own plan to answer a
research question using real data
Background Students have used real data to begin to understand changes in water
levels Most of the work has been an examination of how sea level
changes on a relatively small scale ndash at a single location or station and
over a very short period of time Now it is time for students to examine
sea level on a larger scale by developing their own investigation using
real data
Students should be encouraged to develop their own research questions
and hypotheses for this activity In general questions that lead them to
considering changes in water level on a larger scale will provide a good
starting point Here are some examples of questions
Research questions
Do changes in water level have the same impact everywhere on Earth
How is sea surface height changing over time
Students choosing to look at changes in sea level over time will naturally
consider the prospect of long-term sea level rise due to climate change It
may not be easy for students to detect and interpret long-term trends
using the kinds of data tools and analysis available to them However
links to long-term trend analyses are available and students can be
challenged to apply what they have learned about reading and
understanding data to interpret these long-term data products
Understanding Sea Level Using Real Data 41
Procedure
Materials 1 Distribute the Student Master Research Project Designing Your
Own Investigation and Student Master Data Log Sheet Copies of Student
Master Research Project 2 Guide student selection of a research question (or allow students
Designing Your Own to make up their own) that is appropriate to their academic Investigation
Copies of Student experience Review student hypotheses to make sure they are
Master Data Log Sheet appropriate and that students will be able to support or disprove
Student access to them using the kinds of data they will have available
computers with Internet
connections 3 Have students design a research project to answer the question
4 Check each research project plan before students begin to see if
it is in keeping with the question and the resources available
5 Assign students to use the tools at wwwdataintheclassroomorg
to access the data they need
6 When students complete their research provide time for them to
present their findings
7 Use the student presentations as an opportunity to relate this
investigation to the current news and debate about global climate
change Ask From your own experience looking at real data
how do these data relate to the question of global climate
change
Understanding Sea Level Using Real Data 42
Student Master
Research Project Designing Your Own Investigation
Planning your project
1 Develop a research question Then form a hypothesis to investigate
Be sure to review your hypothesis with your teacher before you begin
Research question
Hypothesis
2 Design a plan to test your hypothesis and answer the research question
What do you need
a) More information
b) Specific data
3 Go online and get data
a) Visit wwwdataintheclassroomorg and find the Sea Level module
b) Follow the link to ldquoSatellite Datardquo or ldquoTide Datardquo
c) Using the form select the data and parameters you wish to look at
d) Click the ldquoGet Datardquo button
4 Use the Data Log Sheet to keep a record of the data you select so you can refer to it later
5 Analyze the data
6 Draw conclusions
Write down what you learned from your investigation Use your data to help you decide whether your
hypothesis is supported If your hypothesis is not supported think about other data you might need to
collect
Understanding Sea Level Using Real Data 43
Student Master
Data Log Sheet As you use the online data access form to select data about sea level keep a record of the parameters you
select on this data log sheet Your data log will help you remember and keep track of the data you have
looked at Consider whether each new piece of data helps support or disprove your hypothesis
Data set Region Station Dates Notes
Understanding Sea Level Using Real Data 44
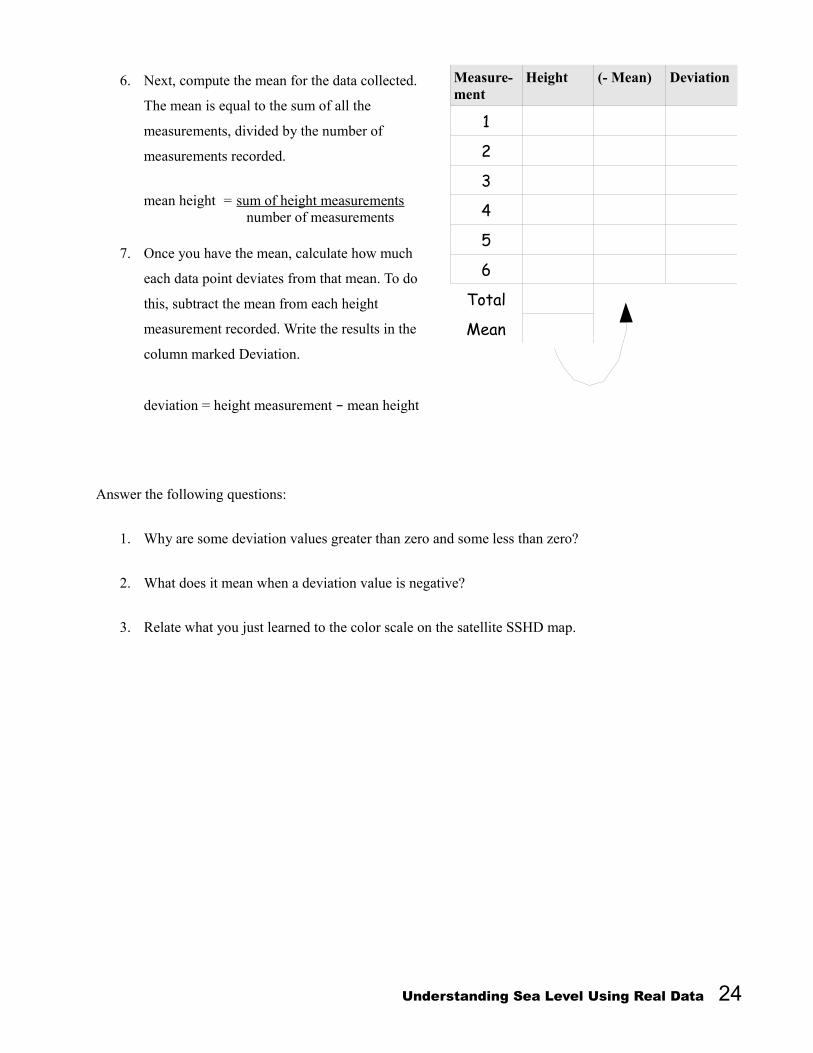
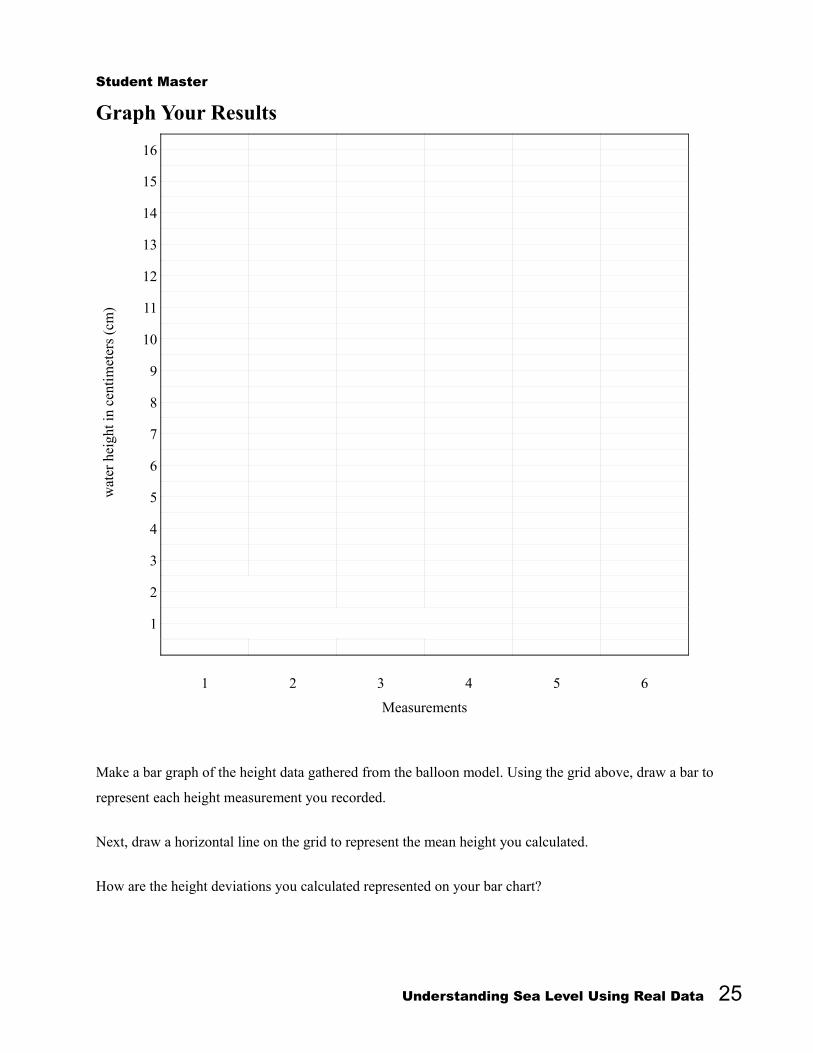
Student Master
Graph Your Resultsw
ater
hei
ght i
n ce
ntim
eter
s (c
m)
16
15
14
13
12
11
10
9
8
7
6
5
4
3
2
1
1 2 3 4 5 6
Measurements
Make a bar graph of the height data gathered from the balloon model Using the grid above draw a bar to
represent each height measurement you recorded
Next draw a horizontal line on the grid to represent the mean height you calculated
How are the height deviations you calculated represented on your bar chart
Understanding Sea Level Using Real Data 25
Level 3 Adaptation Reading Tide Data
Summary Grade Level 6-8
Teaching Time
Two 45 minute periods
Activities
Generate charts of real tide
data
Use tide model to help
visualize tide effects
Vocabulary Gravity ndash the force of attraction
that causes objects on Earth to
fall to the center of the Earth
Tide ndash periodic rising and falling
of the sea surface that results
from gravitational attraction of
the Moon and the Sun acting on
the rotating Earth
Tidal period ndash elapsed time
between successive high waters
and low waters
Mean low water (MLW) ndash a
reference point for measuring
tide heights based on historical
data MLW is the average water
height observed at low tide
during a 19-year period
Objective Students will go online to generate charts of real tide data Students will
apply their skill calculating the mean to real tide data in order to
characterize typical tide behavior at a selected location
Background Tides are generated by the gravitational attraction of the Moon and Sun
on the oceanrsquos waters Because the Moon is much closer to the Earth than
is the Sun its impact on ocean tides is larger despite the Suns greater
mass The gravitational pull of the Moon causes water to bulge away
from the Earth at the point closest to the Moon At the same time
centrifugal force causes a similar bulge on the opposite side of the Earth
As the Earth spins on its axis different parts of Earths surface move
through these tidal bulges resulting in a cycle of high and low tides
around the globe7
The Sun also plays a role in producing tides As the Moon orbits the
Earth its position relative to the Earth and Sun changes Sometimes the
Moon and Sun are lined up with the Earth and the resulting gravitational
pull of both bodies causes higher tides These are called spring tides and
they occur during full and new Moon phases During quarter Moon
phases when the Moon and Sun are not in line with the Earth lower
neap tides are produced
Tides do not occur with the same frequency and magnitude everywhere
Tides influence the rise and fall of water both in the open ocean and
along the coasts although that rise and fall can be much more
pronounced near land which can have an amplifying effect
7 Sverdrup K amp Armbrust E V (2008) An Introduction to the Worlds Oceans 9th ed McGraw-Hill p 284
Understanding Sea Level Using Real Data 26
Curriculum Link You can use this activity to
supplement other material in
your middle school physical
science curriculum
particularly material dealing
with tides and the
gravitational pull of the Moon
To Display
Generate this image at
wwwdataintheclassroomorg
NOAA has developed long-term data sets of local tide measurements
from an array of permanent monitoring stations around the United States
Over the years the technology for recording tides has changed from
early mechanical recorders to modern acoustic and electronic devices
Today this network of monitoring stations records tide measurements
electronically every six minutes at over 250 stations around the country
The data is transmitted to NOAA headquarters via satellite where it is
processed archived and made available online
Preparation Familiarize yourself with using the dataintheclassroomorg Web site to
generate charts from tide data
1 Visit wwwdataintheclassroomorg and find the Sea Level
module
2 Follow the link to ldquoTide Datardquo
3 Using the form select ldquoCape May NJrdquo from the list of recording
stations
4 Select a start date for the data you want to retrieve for example
08012007
5 Select an end date for example 08052007
6 Click the ldquoGet Datardquo button
7 Save the map image to your local computer On a PC right-click
with the mouse and select ldquoSave asrdquo On a Mac hold down the
Ctrl key and click with the mouse
Understanding Sea Level Using Real Data 27
Materials Procedure Computer or overhead 1 On an overhead projector display the Teacher Master What
projector Causes Tides Point out that tides are caused by the pull of Transparency of Teacher gravity between the Moon Sun and Earth Ask students to
Master What Causes indicate where the water has a bulge
Tides
Tide chart saved to your Answer The water bulges in alignment with the pull of the computer or transparency
Moonrsquos gravity of the Teacher Master
Looking at Tide Data Explain that because the Earth and Moon are relatively close to
Copies of Student one another in space the force of gravity between them is strong
Master Practice Reading The gravitational pull of the Moon causes water to bulge away
Tide Data from the Earth as it tries to move toward the Moon This effect
Rulers moves around the globe as the Earth and the Moon move
relative to each other
2 Display the tide chart from Cape May NJ (either from the file
saved on your computer or using a transparency of the Teacher
Master Looking at Tide Data) Describe features of the chart
The y-axis on the chart shows the height of the water relative
to the mean low water (MLW) Mean low water is a
reference point used by scientists for measuring tide heights
based on historical data MLW is the average water height
observed at low tide during a 19-year period
The x-axis shows the date and time of the water level
observations Look carefully at the time scale In the
example shown on the Master the x-axis is labeled every 20
hours
Along the y-axis the measurement from the lowest point to
the highest point in each tide cycle is the change in water
level due to the tide
Along the x-axis the measurement between consecutive low
tides or consecutive high tides is the period of the tidal cycle
Understanding Sea Level Using Real Data 28
Online Tool
Use the tide model to
visualize students data Visit
wwwdataintheclassroomorg
3 Explain that students will go online to generate tide charts for
themselves using real data Their task is to measure the tide
height change and period from data collected at a monitoring a
station
4 If you have not done so in earlier activities use a computer and
projector to demonstrate how to use the dataintheclassroomorg
Web site to generate graphs of tide data Refer to the Preparation
steps described on page 27
5 Students will need to access the Internet to generate and save
data maps and graphs Depending on the setting this can be done
in a computer lab or assigned as homework assuming students
have access to the Internet at a library or computer center
Students should follow the instructions on the Student Master
and record their data and calculations on the table provided
6 When students have finished gathering data and making
calculations conclude the activity with a demonstration to help
students visualize their data Follow the procedure on page 19 to
display the online tide model
Ask for a volunteer to enter his or her data into the model Look
for the line of controls labeled Tide Enter the averages he or she
calculated from the box on the data sheet labeled Max Height
Change
Click the Play button to start the model The model will illustrate
the changing water level height in two ways first as an
animation of water rising and falling along the image of the
coastline and second as an animated graph showing the change
in water level over time The image and graph are synchronized
You can stop the model and enter different numbers to change
the behavior
Understanding Sea Level Using Real Data 29
Assessment Rubric In assessing student performance consider how students approached
collecting their tide data and what calculations they made based on the
data
Successful student work may include
Correct use of the y-axis to measure height changes and the x-
axis to measure time intervals
A selection of data from a selected station during several
different periods of time
Calculation of the average low tide height high tide height and
height change using data from different time periods
A working definition of a mean or average
A working definition of relative height change or deviation
Depending on the measuring station and time period selected the tide
data chart may look different than the example charts provided in these
pages Students may encounter multiple small highs and lows that they
may find difficult to interpret Be prepared to guide students through the
process of making their measurements on more complicated tide charts
Understanding Sea Level Using Real Data 30
Teac
her
Mas
ter
Wh
at C
ause
s T
ides
Uni
form
wat
er le
vel
The
gra
vita
tiona
l pul
l of
the
Moo
n ca
uses
wat
er
to b
ulge
aw
ay f
rom
the
Ear
th a
t the
poi
nt
clos
est t
o th
e M
oon
Moo
n
Ear
th
At t
he s
ame
time
cen
trifu
gal f
orce
cau
ses
a si
mila
r bu
lge
on th
e op
posi
te s
ide
of th
e E
arth
Ada
pted
fro
m S
verd
rup
K amp
Arm
brus
t E
V (
2008
) A
n In
trod
ucti
on to
the
Wor
lds
Oce
ans
9th
ed
McG
raw
-Hil
l F
igur
e 11
5 p
284
Moo
n im
age
NA
SA
Und
erst
andi
ng S
ea L
evel
Usi
ng R
eal D
ata
31
Teac
her
Mas
ter
Loo
kin
g at
Tid
e D
ata
Alo
ng th
e y-
axis
the
mea
sure
men
t fro
m th
e lo
wes
t poi
nt to
the
high
est
Alo
ng th
e x-
axis
the
mea
sure
men
t bet
wee
n co
nsec
utiv
e lo
w ti
des
or
poin
t in
each
cyc
le is
the
tida
l cha
nge
in w
ater
leve
l co
nsec
utiv
e hi
gh ti
des
is th
e ti
me
peri
od o
f th
e ti
dal c
ycle
Und
erst
andi
ng S
ea L
evel
Usi
ng R
eal D
ata
32
Student Master
Practice Reading Tide Data Water level around the globe is always changing as a result of many factors One of those factors is the effect
of tides caused by the gravitational attraction of the Moon In this activity you will use charts of real tide
data like the one shown below to research tides in a specific location Your goal is to describe the typical
height change and period of the tidal change
1 Visit wwwdataintheclassroomorg and find the Sea Level module
2 Follow the link to ldquoTide Datardquo
3 Choose a location you wish to study and write the name on your data sheet Using the form on the
Web site select the location from the list of recording stations
4 Select a start and end date for the data you wish to retrieve Be sure to retrieve data over a period of at
least several days so that you can see a number of tide cycles
5 Click the ldquoGet Datardquo button
6 If you have access to a printer print a copy of the tide data chart Otherwise save a copy to your
computer so that you can refer to it later On a PC right-click with the mouse and select ldquoSave asrdquo
On a Mac hold down the Ctrl key and click with the mouse
Understanding Sea Level Using Real Data 33
7 Look at the chart and see if you can identify a pattern of low and high tides Choose a point on the
chart that represents a low tide Use the scale on the y-axis to determine the relative height of the
water at that point Record the approximate time and the relative water height on your data sheet
8 Now find the point that represents the next high tide and record the relative height of the water then
9 Calculate the difference between the water height at high and low tides This is the height change
Record this change on your data sheet
10 Next choose two points on the chart that represent consecutive low or consecutive high tides Use the
time scale on the x-axis to determine the time period of the tide cycle Record the period on your data
sheet
Do you think the measurements you just made provide a good description of the tides at this location
Hint Make measurements using data from the same location at other times to see if the tides are different
Once you have made several measurements can you make calculations to find the average height
change and period from the data you collected
Data Sheet
Station Name
Date Time (Approx) Low Tide High Tide Tide Height Tide CycleHeight Height Change Period
08022007 2000 0 m 175 m 175 m 12 hrs
Understanding Sea Level Using Real Data 34
Level 4 Interactivity Measuring Storm Effects
Summary Grade Level 6-8
Teaching Time
Two 45 minute periods
Activities
Get water height data for
storm events
Create a research plan
using real data
Use interactive tide model
to visualize storm effects
Vocabulary Storm tide ndash a storm surge
event that takes place along the
coast which produces
exceptionally high water A
storm tide is generated by
storm wind stress and low
atmospheric pressure Storm
surges are made even higher
when associated with high tide
and shallow depths
Objective Using what they learned about typical tide measurements at a location
students will investigate and measure what happens to water height
during a storm event
Background Storms can have a big impact on local water levels in coastal areas A
storm surge happens when water is pushed toward the shore by high
powered winds from a storm such as a hurricane The storm interacts
with the normal tide to create a storm tide that can increase the normal
water height by 4 to 5 meters (15 feet) or more These events can cause
extreme flooding in coastal areas Most coastlines in the United States
are only 3 meters (10 feet) or less above mean sea level which means
that storms can be very dangerous for people who live near the coast8
During this lesson students are asked to answer a research question
How do storm events impact water levels at a coastal location To
accomplish this task students must take the calculations they made in the
last activity and use them as a baseline to evaluate the tide heights
observed during a storm
8 Ross A R(1995) Introduction to Oceanography New York Harper Collins p 230
Understanding Sea Level Using Real Data 35
Materials Procedure Computer or overhead 1 On an overhead projector display a news report from a recent
projector storm Copies of Student
Master Research Project Explain that water level is affected by lots of different factors Determining Storm Surge not just tides and that these factors actually compound or add Height together
Copies of Student
Master Data Log Sheet 2 Explain that students will continue the investigation of water Rulers
level from the last activity This time they will go online to look
at data related to storms Their task is to make a research plan
using real data to describe the effects of storms on coastal water
levels Their goal is to determine the additional effect a storm
can have on water height
3 Students will need to access the Internet to generate and save
data maps and graphs Depending on the setting this can be done
in a computer lab or assigned as homework assuming students
have access to the Internet at a library or computer center
Students should follow the instructions on the Student Master
Research Project Determining Storm Surge Height and record
their data and calculations on the table provided
4 When students have finished gathering data and making
calculations conclude the activity with a demonstration to help
students visualize their data Follow the procedure on page 19 to
display the online tide model
Ask for a volunteer to enter his or her data into the model Look
for the line of controls labeled Storm The student should enter
the storm surge height and duration he or she calculated in the
boxes from the Data Log Sheet labeled Max Height Change
Click the Play button to start the model You can stop the model
and enter different numbers to change the behavior
Understanding Sea Level Using Real Data 36
Assessment Rubric In assessing student performance consider how students approached
collecting their tide data and what calculations they made based on the
data
Successful student work may include
Correct use of the y-axis to measure height changes and the x-
axis to measure time intervals
A selection of data from a selected station during several
different periods of time In particular students should attempt to
determine how long the storm impacted the area ndash from when the
storm effect was first seen to when it went away
Determine the maximum high tide recorded during the storm
Calculation of the difference between the maximum high tide
and the average high tide they found in the last activity
A working definition of a mean or average
A working definition of relative height change or deviation
Understanding Sea Level Using Real Data 37
Student Master
Research Project Determining Storm Surge Height You are joining a team of scientists who are studying the effects of storms along the US coast Your task is to
pick a storm event for a coastal location and design a research plan to help you gather data about the water
height before during and after the storm You already know something about the typical or average water
height in the area due to tides Your goal now is to determine the additional effect a storm can have on water
height Once your plan is accepted you are to carry out your data collection analyze it and report your
findings to the team
Planning your project
1 Form a hypothesis before designing your investigation
Research question How do storm events impact water levels at my coastal location
Hypothesis Storms produce a surge which raises water levels above what would normally occur
during a typical tide cycle
2 Design a plan to test your hypothesis and answer your research question
What do you need
a) More information Do you need more information about specific storm events and their effects
b) Specific data When you go online to collect data what dates will you look at and what charts
will you generate
3 Go online and get data
a) Visit wwwdataintheclassroomorg and find the Sea Level module
b) Follow the link to ldquoTide Datardquo
c) Choose a location you wish to study and write the name on your data sheet Using the form on
the Web site select the location from the list of recording stations
d) Search Internet news and weather sources for information about storms that impacted the area
near your station Identify a storm event to investigate and take note of the date of the storm
Understanding Sea Level Using Real Data 38
e) Using the form on the Web site select start and end dates around the time of the storm event you
found
f) Click the ldquoGet Datardquo button
g) If you have access to a printer print a copy of the tide data chart Otherwise save a copy to your
computer so that you can refer to it later On a PC right-click with the mouse and select ldquoSave
asrdquo On a Mac hold down the Ctrl key and click with the mouse
4 Use the Data Log Sheet to keep a record of the data you select so you can refer to it later
5 Analyze the data
a) What were the highest and lowest tides recorded during the storm event
b) How did the tides during the storm compare with the average high and low tides you calculated
for this station previously
c) Calculate the different between the highest tide measured during the storm and the average high
tide for the area
d) Can you use the data to determine how long the storm impacted the area
6 Draw conclusions
Write down what you learned from your investigation Use your data to help you decide if your
hypothesis was supported
Understanding Sea Level Using Real Data 39
Student Master
Data Log Sheet
Station Name
Date Time (Approx) Low Tide Height
High TideHeight
Tide HeightChange
Tide CyclePeriod
Understanding Sea Level Using Real Data 40
Level 5 Invention Designing Your Own Investigation
Summary Grade Level 6-8
Teaching Time
Two 45 minute periods
Activity
Design an investigation
using real data to examine
a hypothesis
Web Links For links to long-term sea
level trend data visit
wwwdataintheclassroomorg
Objective Students will apply what they have learned to consider sea level data on
a larger scale To do this students will design their own plan to answer a
research question using real data
Background Students have used real data to begin to understand changes in water
levels Most of the work has been an examination of how sea level
changes on a relatively small scale ndash at a single location or station and
over a very short period of time Now it is time for students to examine
sea level on a larger scale by developing their own investigation using
real data
Students should be encouraged to develop their own research questions
and hypotheses for this activity In general questions that lead them to
considering changes in water level on a larger scale will provide a good
starting point Here are some examples of questions
Research questions
Do changes in water level have the same impact everywhere on Earth
How is sea surface height changing over time
Students choosing to look at changes in sea level over time will naturally
consider the prospect of long-term sea level rise due to climate change It
may not be easy for students to detect and interpret long-term trends
using the kinds of data tools and analysis available to them However
links to long-term trend analyses are available and students can be
challenged to apply what they have learned about reading and
understanding data to interpret these long-term data products
Understanding Sea Level Using Real Data 41
Procedure
Materials 1 Distribute the Student Master Research Project Designing Your
Own Investigation and Student Master Data Log Sheet Copies of Student
Master Research Project 2 Guide student selection of a research question (or allow students
Designing Your Own to make up their own) that is appropriate to their academic Investigation
Copies of Student experience Review student hypotheses to make sure they are
Master Data Log Sheet appropriate and that students will be able to support or disprove
Student access to them using the kinds of data they will have available
computers with Internet
connections 3 Have students design a research project to answer the question
4 Check each research project plan before students begin to see if
it is in keeping with the question and the resources available
5 Assign students to use the tools at wwwdataintheclassroomorg
to access the data they need
6 When students complete their research provide time for them to
present their findings
7 Use the student presentations as an opportunity to relate this
investigation to the current news and debate about global climate
change Ask From your own experience looking at real data
how do these data relate to the question of global climate
change
Understanding Sea Level Using Real Data 42
Student Master
Research Project Designing Your Own Investigation
Planning your project
1 Develop a research question Then form a hypothesis to investigate
Be sure to review your hypothesis with your teacher before you begin
Research question
Hypothesis
2 Design a plan to test your hypothesis and answer the research question
What do you need
a) More information
b) Specific data
3 Go online and get data
a) Visit wwwdataintheclassroomorg and find the Sea Level module
b) Follow the link to ldquoSatellite Datardquo or ldquoTide Datardquo
c) Using the form select the data and parameters you wish to look at
d) Click the ldquoGet Datardquo button
4 Use the Data Log Sheet to keep a record of the data you select so you can refer to it later
5 Analyze the data
6 Draw conclusions
Write down what you learned from your investigation Use your data to help you decide whether your
hypothesis is supported If your hypothesis is not supported think about other data you might need to
collect
Understanding Sea Level Using Real Data 43
Student Master
Data Log Sheet As you use the online data access form to select data about sea level keep a record of the parameters you
select on this data log sheet Your data log will help you remember and keep track of the data you have
looked at Consider whether each new piece of data helps support or disprove your hypothesis
Data set Region Station Dates Notes
Understanding Sea Level Using Real Data 44
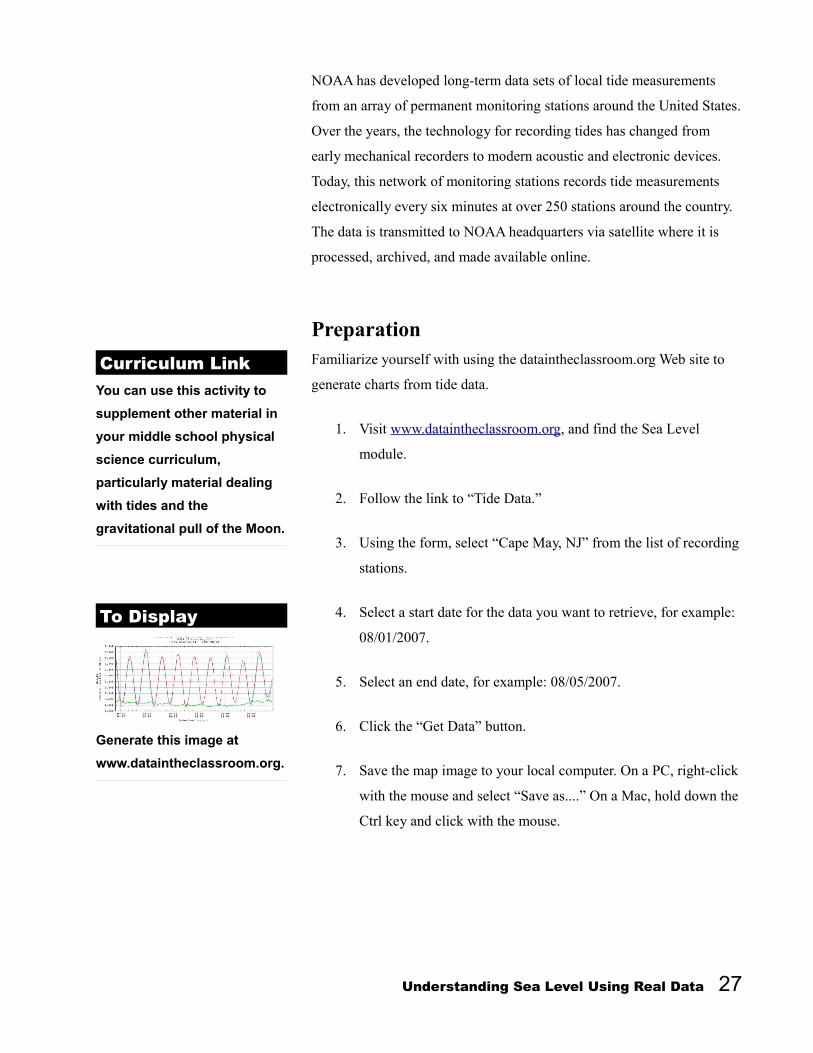
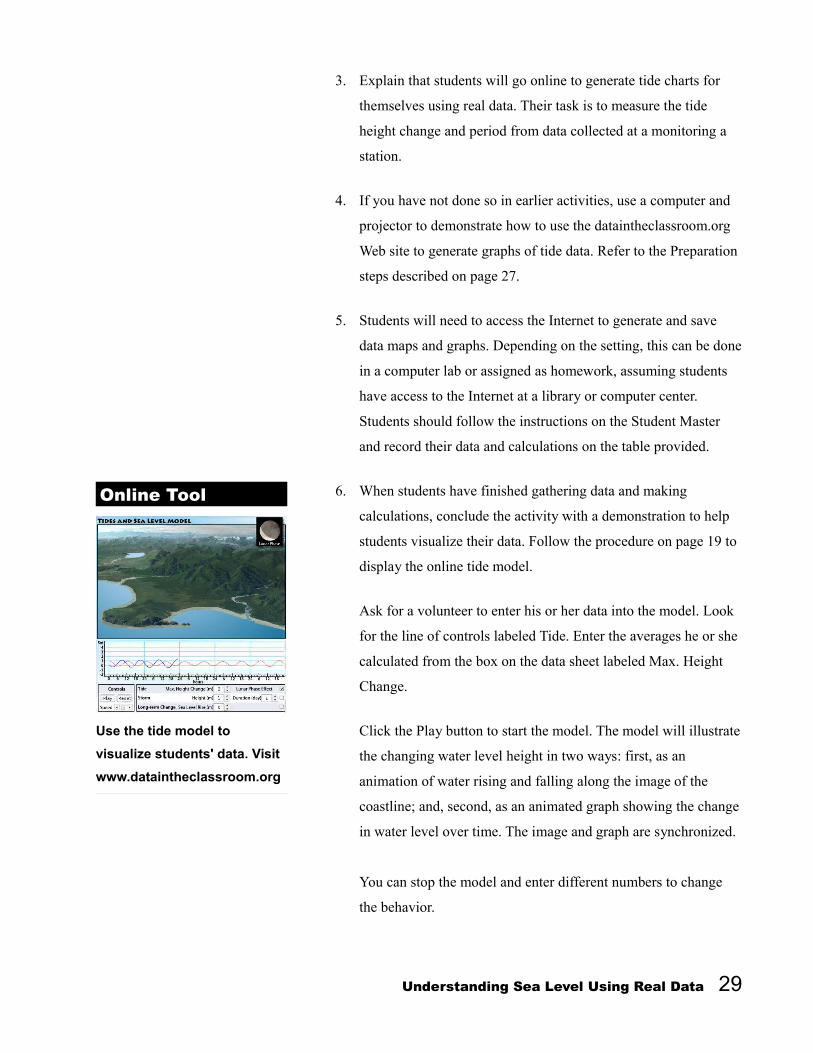

Assessment Rubric In assessing student performance consider how students approached
collecting their tide data and what calculations they made based on the
data
Successful student work may include
Correct use of the y-axis to measure height changes and the x-
axis to measure time intervals
A selection of data from a selected station during several
different periods of time
Calculation of the average low tide height high tide height and
height change using data from different time periods
A working definition of a mean or average
A working definition of relative height change or deviation
Depending on the measuring station and time period selected the tide
data chart may look different than the example charts provided in these
pages Students may encounter multiple small highs and lows that they
may find difficult to interpret Be prepared to guide students through the
process of making their measurements on more complicated tide charts
Understanding Sea Level Using Real Data 30
Teac
her
Mas
ter
Wh
at C
ause
s T
ides
Uni
form
wat
er le
vel
The
gra
vita
tiona
l pul
l of
the
Moo
n ca
uses
wat
er
to b
ulge
aw
ay f
rom
the
Ear
th a
t the
poi
nt
clos
est t
o th
e M
oon
Moo
n
Ear
th
At t
he s
ame
time
cen
trifu
gal f
orce
cau
ses
a si
mila
r bu
lge
on th
e op
posi
te s
ide
of th
e E
arth
Ada
pted
fro
m S
verd
rup
K amp
Arm
brus
t E
V (
2008
) A
n In
trod
ucti
on to
the
Wor
lds
Oce
ans
9th
ed
McG
raw
-Hil
l F
igur
e 11
5 p
284
Moo
n im
age
NA
SA
Und
erst
andi
ng S
ea L
evel
Usi
ng R
eal D
ata
31
Teac
her
Mas
ter
Loo
kin
g at
Tid
e D
ata
Alo
ng th
e y-
axis
the
mea
sure
men
t fro
m th
e lo
wes
t poi
nt to
the
high
est
Alo
ng th
e x-
axis
the
mea
sure
men
t bet
wee
n co
nsec
utiv
e lo
w ti
des
or
poin
t in
each
cyc
le is
the
tida
l cha
nge
in w
ater
leve
l co
nsec
utiv
e hi
gh ti
des
is th
e ti
me
peri
od o
f th
e ti
dal c
ycle
Und
erst
andi
ng S
ea L
evel
Usi
ng R
eal D
ata
32
Student Master
Practice Reading Tide Data Water level around the globe is always changing as a result of many factors One of those factors is the effect
of tides caused by the gravitational attraction of the Moon In this activity you will use charts of real tide
data like the one shown below to research tides in a specific location Your goal is to describe the typical
height change and period of the tidal change
1 Visit wwwdataintheclassroomorg and find the Sea Level module
2 Follow the link to ldquoTide Datardquo
3 Choose a location you wish to study and write the name on your data sheet Using the form on the
Web site select the location from the list of recording stations
4 Select a start and end date for the data you wish to retrieve Be sure to retrieve data over a period of at
least several days so that you can see a number of tide cycles
5 Click the ldquoGet Datardquo button
6 If you have access to a printer print a copy of the tide data chart Otherwise save a copy to your
computer so that you can refer to it later On a PC right-click with the mouse and select ldquoSave asrdquo
On a Mac hold down the Ctrl key and click with the mouse
Understanding Sea Level Using Real Data 33
7 Look at the chart and see if you can identify a pattern of low and high tides Choose a point on the
chart that represents a low tide Use the scale on the y-axis to determine the relative height of the
water at that point Record the approximate time and the relative water height on your data sheet
8 Now find the point that represents the next high tide and record the relative height of the water then
9 Calculate the difference between the water height at high and low tides This is the height change
Record this change on your data sheet
10 Next choose two points on the chart that represent consecutive low or consecutive high tides Use the
time scale on the x-axis to determine the time period of the tide cycle Record the period on your data
sheet
Do you think the measurements you just made provide a good description of the tides at this location
Hint Make measurements using data from the same location at other times to see if the tides are different
Once you have made several measurements can you make calculations to find the average height
change and period from the data you collected
Data Sheet
Station Name
Date Time (Approx) Low Tide High Tide Tide Height Tide CycleHeight Height Change Period
08022007 2000 0 m 175 m 175 m 12 hrs
Understanding Sea Level Using Real Data 34
Level 4 Interactivity Measuring Storm Effects
Summary Grade Level 6-8
Teaching Time
Two 45 minute periods
Activities
Get water height data for
storm events
Create a research plan
using real data
Use interactive tide model
to visualize storm effects
Vocabulary Storm tide ndash a storm surge
event that takes place along the
coast which produces
exceptionally high water A
storm tide is generated by
storm wind stress and low
atmospheric pressure Storm
surges are made even higher
when associated with high tide
and shallow depths
Objective Using what they learned about typical tide measurements at a location
students will investigate and measure what happens to water height
during a storm event
Background Storms can have a big impact on local water levels in coastal areas A
storm surge happens when water is pushed toward the shore by high
powered winds from a storm such as a hurricane The storm interacts
with the normal tide to create a storm tide that can increase the normal
water height by 4 to 5 meters (15 feet) or more These events can cause
extreme flooding in coastal areas Most coastlines in the United States
are only 3 meters (10 feet) or less above mean sea level which means
that storms can be very dangerous for people who live near the coast8
During this lesson students are asked to answer a research question
How do storm events impact water levels at a coastal location To
accomplish this task students must take the calculations they made in the
last activity and use them as a baseline to evaluate the tide heights
observed during a storm
8 Ross A R(1995) Introduction to Oceanography New York Harper Collins p 230
Understanding Sea Level Using Real Data 35
Materials Procedure Computer or overhead 1 On an overhead projector display a news report from a recent
projector storm Copies of Student
Master Research Project Explain that water level is affected by lots of different factors Determining Storm Surge not just tides and that these factors actually compound or add Height together
Copies of Student
Master Data Log Sheet 2 Explain that students will continue the investigation of water Rulers
level from the last activity This time they will go online to look
at data related to storms Their task is to make a research plan
using real data to describe the effects of storms on coastal water
levels Their goal is to determine the additional effect a storm
can have on water height
3 Students will need to access the Internet to generate and save
data maps and graphs Depending on the setting this can be done
in a computer lab or assigned as homework assuming students
have access to the Internet at a library or computer center
Students should follow the instructions on the Student Master
Research Project Determining Storm Surge Height and record
their data and calculations on the table provided
4 When students have finished gathering data and making
calculations conclude the activity with a demonstration to help
students visualize their data Follow the procedure on page 19 to
display the online tide model
Ask for a volunteer to enter his or her data into the model Look
for the line of controls labeled Storm The student should enter
the storm surge height and duration he or she calculated in the
boxes from the Data Log Sheet labeled Max Height Change
Click the Play button to start the model You can stop the model
and enter different numbers to change the behavior
Understanding Sea Level Using Real Data 36
Assessment Rubric In assessing student performance consider how students approached
collecting their tide data and what calculations they made based on the
data
Successful student work may include
Correct use of the y-axis to measure height changes and the x-
axis to measure time intervals
A selection of data from a selected station during several
different periods of time In particular students should attempt to
determine how long the storm impacted the area ndash from when the
storm effect was first seen to when it went away
Determine the maximum high tide recorded during the storm
Calculation of the difference between the maximum high tide
and the average high tide they found in the last activity
A working definition of a mean or average
A working definition of relative height change or deviation
Understanding Sea Level Using Real Data 37
Student Master
Research Project Determining Storm Surge Height You are joining a team of scientists who are studying the effects of storms along the US coast Your task is to
pick a storm event for a coastal location and design a research plan to help you gather data about the water
height before during and after the storm You already know something about the typical or average water
height in the area due to tides Your goal now is to determine the additional effect a storm can have on water
height Once your plan is accepted you are to carry out your data collection analyze it and report your
findings to the team
Planning your project
1 Form a hypothesis before designing your investigation
Research question How do storm events impact water levels at my coastal location
Hypothesis Storms produce a surge which raises water levels above what would normally occur
during a typical tide cycle
2 Design a plan to test your hypothesis and answer your research question
What do you need
a) More information Do you need more information about specific storm events and their effects
b) Specific data When you go online to collect data what dates will you look at and what charts
will you generate
3 Go online and get data
a) Visit wwwdataintheclassroomorg and find the Sea Level module
b) Follow the link to ldquoTide Datardquo
c) Choose a location you wish to study and write the name on your data sheet Using the form on
the Web site select the location from the list of recording stations
d) Search Internet news and weather sources for information about storms that impacted the area
near your station Identify a storm event to investigate and take note of the date of the storm
Understanding Sea Level Using Real Data 38
e) Using the form on the Web site select start and end dates around the time of the storm event you
found
f) Click the ldquoGet Datardquo button
g) If you have access to a printer print a copy of the tide data chart Otherwise save a copy to your
computer so that you can refer to it later On a PC right-click with the mouse and select ldquoSave
asrdquo On a Mac hold down the Ctrl key and click with the mouse
4 Use the Data Log Sheet to keep a record of the data you select so you can refer to it later
5 Analyze the data
a) What were the highest and lowest tides recorded during the storm event
b) How did the tides during the storm compare with the average high and low tides you calculated
for this station previously
c) Calculate the different between the highest tide measured during the storm and the average high
tide for the area
d) Can you use the data to determine how long the storm impacted the area
6 Draw conclusions
Write down what you learned from your investigation Use your data to help you decide if your
hypothesis was supported
Understanding Sea Level Using Real Data 39
Student Master
Data Log Sheet
Station Name
Date Time (Approx) Low Tide Height
High TideHeight
Tide HeightChange
Tide CyclePeriod
Understanding Sea Level Using Real Data 40
Level 5 Invention Designing Your Own Investigation
Summary Grade Level 6-8
Teaching Time
Two 45 minute periods
Activity
Design an investigation
using real data to examine
a hypothesis
Web Links For links to long-term sea
level trend data visit
wwwdataintheclassroomorg
Objective Students will apply what they have learned to consider sea level data on
a larger scale To do this students will design their own plan to answer a
research question using real data
Background Students have used real data to begin to understand changes in water
levels Most of the work has been an examination of how sea level
changes on a relatively small scale ndash at a single location or station and
over a very short period of time Now it is time for students to examine
sea level on a larger scale by developing their own investigation using
real data
Students should be encouraged to develop their own research questions
and hypotheses for this activity In general questions that lead them to
considering changes in water level on a larger scale will provide a good
starting point Here are some examples of questions
Research questions
Do changes in water level have the same impact everywhere on Earth
How is sea surface height changing over time
Students choosing to look at changes in sea level over time will naturally
consider the prospect of long-term sea level rise due to climate change It
may not be easy for students to detect and interpret long-term trends
using the kinds of data tools and analysis available to them However
links to long-term trend analyses are available and students can be
challenged to apply what they have learned about reading and
understanding data to interpret these long-term data products
Understanding Sea Level Using Real Data 41
Procedure
Materials 1 Distribute the Student Master Research Project Designing Your
Own Investigation and Student Master Data Log Sheet Copies of Student
Master Research Project 2 Guide student selection of a research question (or allow students
Designing Your Own to make up their own) that is appropriate to their academic Investigation
Copies of Student experience Review student hypotheses to make sure they are
Master Data Log Sheet appropriate and that students will be able to support or disprove
Student access to them using the kinds of data they will have available
computers with Internet
connections 3 Have students design a research project to answer the question
4 Check each research project plan before students begin to see if
it is in keeping with the question and the resources available
5 Assign students to use the tools at wwwdataintheclassroomorg
to access the data they need
6 When students complete their research provide time for them to
present their findings
7 Use the student presentations as an opportunity to relate this
investigation to the current news and debate about global climate
change Ask From your own experience looking at real data
how do these data relate to the question of global climate
change
Understanding Sea Level Using Real Data 42
Student Master
Research Project Designing Your Own Investigation
Planning your project
1 Develop a research question Then form a hypothesis to investigate
Be sure to review your hypothesis with your teacher before you begin
Research question
Hypothesis
2 Design a plan to test your hypothesis and answer the research question
What do you need
a) More information
b) Specific data
3 Go online and get data
a) Visit wwwdataintheclassroomorg and find the Sea Level module
b) Follow the link to ldquoSatellite Datardquo or ldquoTide Datardquo
c) Using the form select the data and parameters you wish to look at
d) Click the ldquoGet Datardquo button
4 Use the Data Log Sheet to keep a record of the data you select so you can refer to it later
5 Analyze the data
6 Draw conclusions
Write down what you learned from your investigation Use your data to help you decide whether your
hypothesis is supported If your hypothesis is not supported think about other data you might need to
collect
Understanding Sea Level Using Real Data 43
Student Master
Data Log Sheet As you use the online data access form to select data about sea level keep a record of the parameters you
select on this data log sheet Your data log will help you remember and keep track of the data you have
looked at Consider whether each new piece of data helps support or disprove your hypothesis
Data set Region Station Dates Notes
Understanding Sea Level Using Real Data 44
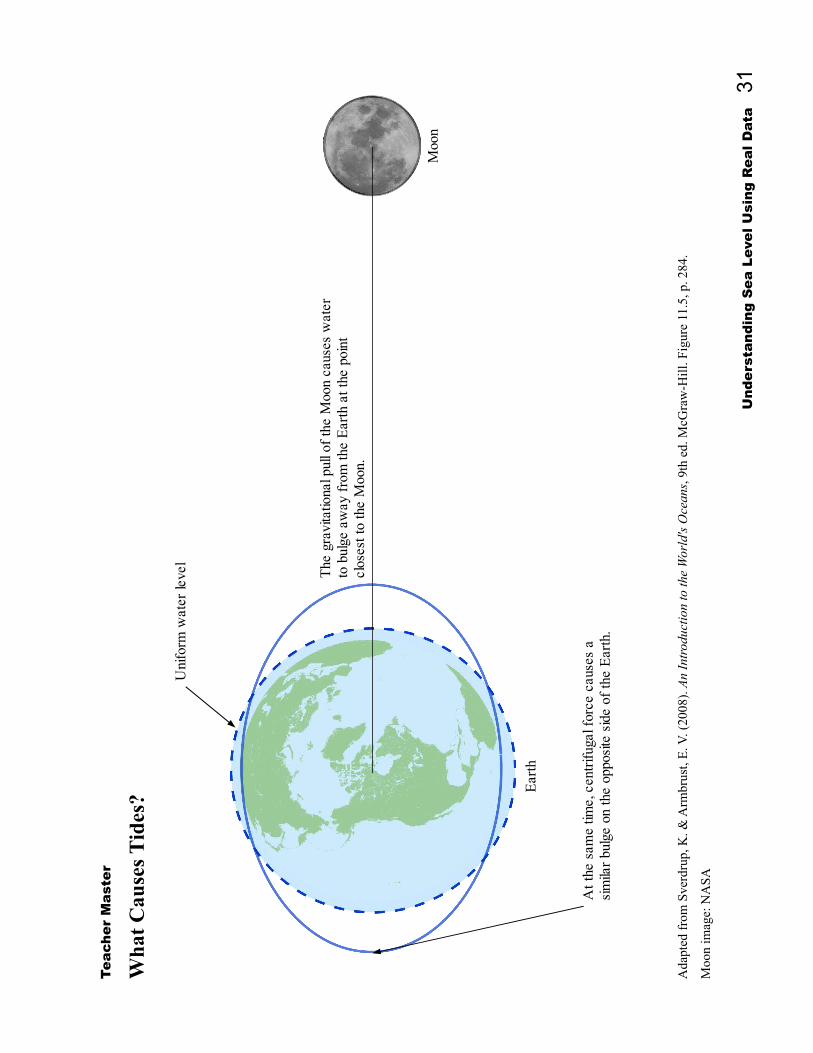
Teac
her
Mas
ter
Loo
kin
g at
Tid
e D
ata
Alo
ng th
e y-
axis
the
mea
sure
men
t fro
m th
e lo
wes
t poi
nt to
the
high
est
Alo
ng th
e x-
axis
the
mea
sure
men
t bet
wee
n co
nsec
utiv
e lo
w ti
des
or
poin
t in
each
cyc
le is
the
tida
l cha
nge
in w
ater
leve
l co
nsec
utiv
e hi
gh ti
des
is th
e ti
me
peri
od o
f th
e ti
dal c
ycle
Und
erst
andi
ng S
ea L
evel
Usi
ng R
eal D
ata
32
Student Master
Practice Reading Tide Data Water level around the globe is always changing as a result of many factors One of those factors is the effect
of tides caused by the gravitational attraction of the Moon In this activity you will use charts of real tide
data like the one shown below to research tides in a specific location Your goal is to describe the typical
height change and period of the tidal change
1 Visit wwwdataintheclassroomorg and find the Sea Level module
2 Follow the link to ldquoTide Datardquo
3 Choose a location you wish to study and write the name on your data sheet Using the form on the
Web site select the location from the list of recording stations
4 Select a start and end date for the data you wish to retrieve Be sure to retrieve data over a period of at
least several days so that you can see a number of tide cycles
5 Click the ldquoGet Datardquo button
6 If you have access to a printer print a copy of the tide data chart Otherwise save a copy to your
computer so that you can refer to it later On a PC right-click with the mouse and select ldquoSave asrdquo
On a Mac hold down the Ctrl key and click with the mouse
Understanding Sea Level Using Real Data 33
7 Look at the chart and see if you can identify a pattern of low and high tides Choose a point on the
chart that represents a low tide Use the scale on the y-axis to determine the relative height of the
water at that point Record the approximate time and the relative water height on your data sheet
8 Now find the point that represents the next high tide and record the relative height of the water then
9 Calculate the difference between the water height at high and low tides This is the height change
Record this change on your data sheet
10 Next choose two points on the chart that represent consecutive low or consecutive high tides Use the
time scale on the x-axis to determine the time period of the tide cycle Record the period on your data
sheet
Do you think the measurements you just made provide a good description of the tides at this location
Hint Make measurements using data from the same location at other times to see if the tides are different
Once you have made several measurements can you make calculations to find the average height
change and period from the data you collected
Data Sheet
Station Name
Date Time (Approx) Low Tide High Tide Tide Height Tide CycleHeight Height Change Period
08022007 2000 0 m 175 m 175 m 12 hrs
Understanding Sea Level Using Real Data 34
Level 4 Interactivity Measuring Storm Effects
Summary Grade Level 6-8
Teaching Time
Two 45 minute periods
Activities
Get water height data for
storm events
Create a research plan
using real data
Use interactive tide model
to visualize storm effects
Vocabulary Storm tide ndash a storm surge
event that takes place along the
coast which produces
exceptionally high water A
storm tide is generated by
storm wind stress and low
atmospheric pressure Storm
surges are made even higher
when associated with high tide
and shallow depths
Objective Using what they learned about typical tide measurements at a location
students will investigate and measure what happens to water height
during a storm event
Background Storms can have a big impact on local water levels in coastal areas A
storm surge happens when water is pushed toward the shore by high
powered winds from a storm such as a hurricane The storm interacts
with the normal tide to create a storm tide that can increase the normal
water height by 4 to 5 meters (15 feet) or more These events can cause
extreme flooding in coastal areas Most coastlines in the United States
are only 3 meters (10 feet) or less above mean sea level which means
that storms can be very dangerous for people who live near the coast8
During this lesson students are asked to answer a research question
How do storm events impact water levels at a coastal location To
accomplish this task students must take the calculations they made in the
last activity and use them as a baseline to evaluate the tide heights
observed during a storm
8 Ross A R(1995) Introduction to Oceanography New York Harper Collins p 230
Understanding Sea Level Using Real Data 35
Materials Procedure Computer or overhead 1 On an overhead projector display a news report from a recent
projector storm Copies of Student
Master Research Project Explain that water level is affected by lots of different factors Determining Storm Surge not just tides and that these factors actually compound or add Height together
Copies of Student
Master Data Log Sheet 2 Explain that students will continue the investigation of water Rulers
level from the last activity This time they will go online to look
at data related to storms Their task is to make a research plan
using real data to describe the effects of storms on coastal water
levels Their goal is to determine the additional effect a storm
can have on water height
3 Students will need to access the Internet to generate and save
data maps and graphs Depending on the setting this can be done
in a computer lab or assigned as homework assuming students
have access to the Internet at a library or computer center
Students should follow the instructions on the Student Master
Research Project Determining Storm Surge Height and record
their data and calculations on the table provided
4 When students have finished gathering data and making
calculations conclude the activity with a demonstration to help
students visualize their data Follow the procedure on page 19 to
display the online tide model
Ask for a volunteer to enter his or her data into the model Look
for the line of controls labeled Storm The student should enter
the storm surge height and duration he or she calculated in the
boxes from the Data Log Sheet labeled Max Height Change
Click the Play button to start the model You can stop the model
and enter different numbers to change the behavior
Understanding Sea Level Using Real Data 36
Assessment Rubric In assessing student performance consider how students approached
collecting their tide data and what calculations they made based on the
data
Successful student work may include
Correct use of the y-axis to measure height changes and the x-
axis to measure time intervals
A selection of data from a selected station during several
different periods of time In particular students should attempt to
determine how long the storm impacted the area ndash from when the
storm effect was first seen to when it went away
Determine the maximum high tide recorded during the storm
Calculation of the difference between the maximum high tide
and the average high tide they found in the last activity
A working definition of a mean or average
A working definition of relative height change or deviation
Understanding Sea Level Using Real Data 37
Student Master
Research Project Determining Storm Surge Height You are joining a team of scientists who are studying the effects of storms along the US coast Your task is to
pick a storm event for a coastal location and design a research plan to help you gather data about the water
height before during and after the storm You already know something about the typical or average water
height in the area due to tides Your goal now is to determine the additional effect a storm can have on water
height Once your plan is accepted you are to carry out your data collection analyze it and report your
findings to the team
Planning your project
1 Form a hypothesis before designing your investigation
Research question How do storm events impact water levels at my coastal location
Hypothesis Storms produce a surge which raises water levels above what would normally occur
during a typical tide cycle
2 Design a plan to test your hypothesis and answer your research question
What do you need
a) More information Do you need more information about specific storm events and their effects
b) Specific data When you go online to collect data what dates will you look at and what charts
will you generate
3 Go online and get data
a) Visit wwwdataintheclassroomorg and find the Sea Level module
b) Follow the link to ldquoTide Datardquo
c) Choose a location you wish to study and write the name on your data sheet Using the form on
the Web site select the location from the list of recording stations
d) Search Internet news and weather sources for information about storms that impacted the area
near your station Identify a storm event to investigate and take note of the date of the storm
Understanding Sea Level Using Real Data 38
e) Using the form on the Web site select start and end dates around the time of the storm event you
found
f) Click the ldquoGet Datardquo button
g) If you have access to a printer print a copy of the tide data chart Otherwise save a copy to your
computer so that you can refer to it later On a PC right-click with the mouse and select ldquoSave
asrdquo On a Mac hold down the Ctrl key and click with the mouse
4 Use the Data Log Sheet to keep a record of the data you select so you can refer to it later
5 Analyze the data
a) What were the highest and lowest tides recorded during the storm event
b) How did the tides during the storm compare with the average high and low tides you calculated
for this station previously
c) Calculate the different between the highest tide measured during the storm and the average high
tide for the area
d) Can you use the data to determine how long the storm impacted the area
6 Draw conclusions
Write down what you learned from your investigation Use your data to help you decide if your
hypothesis was supported
Understanding Sea Level Using Real Data 39
Student Master
Data Log Sheet
Station Name
Date Time (Approx) Low Tide Height
High TideHeight
Tide HeightChange
Tide CyclePeriod
Understanding Sea Level Using Real Data 40
Level 5 Invention Designing Your Own Investigation
Summary Grade Level 6-8
Teaching Time
Two 45 minute periods
Activity
Design an investigation
using real data to examine
a hypothesis
Web Links For links to long-term sea
level trend data visit
wwwdataintheclassroomorg
Objective Students will apply what they have learned to consider sea level data on
a larger scale To do this students will design their own plan to answer a
research question using real data
Background Students have used real data to begin to understand changes in water
levels Most of the work has been an examination of how sea level
changes on a relatively small scale ndash at a single location or station and
over a very short period of time Now it is time for students to examine
sea level on a larger scale by developing their own investigation using
real data
Students should be encouraged to develop their own research questions
and hypotheses for this activity In general questions that lead them to
considering changes in water level on a larger scale will provide a good
starting point Here are some examples of questions
Research questions
Do changes in water level have the same impact everywhere on Earth
How is sea surface height changing over time
Students choosing to look at changes in sea level over time will naturally
consider the prospect of long-term sea level rise due to climate change It
may not be easy for students to detect and interpret long-term trends
using the kinds of data tools and analysis available to them However
links to long-term trend analyses are available and students can be
challenged to apply what they have learned about reading and
understanding data to interpret these long-term data products
Understanding Sea Level Using Real Data 41
Procedure
Materials 1 Distribute the Student Master Research Project Designing Your
Own Investigation and Student Master Data Log Sheet Copies of Student
Master Research Project 2 Guide student selection of a research question (or allow students
Designing Your Own to make up their own) that is appropriate to their academic Investigation
Copies of Student experience Review student hypotheses to make sure they are
Master Data Log Sheet appropriate and that students will be able to support or disprove
Student access to them using the kinds of data they will have available
computers with Internet
connections 3 Have students design a research project to answer the question
4 Check each research project plan before students begin to see if
it is in keeping with the question and the resources available
5 Assign students to use the tools at wwwdataintheclassroomorg
to access the data they need
6 When students complete their research provide time for them to
present their findings
7 Use the student presentations as an opportunity to relate this
investigation to the current news and debate about global climate
change Ask From your own experience looking at real data
how do these data relate to the question of global climate
change
Understanding Sea Level Using Real Data 42
Student Master
Research Project Designing Your Own Investigation
Planning your project
1 Develop a research question Then form a hypothesis to investigate
Be sure to review your hypothesis with your teacher before you begin
Research question
Hypothesis
2 Design a plan to test your hypothesis and answer the research question
What do you need
a) More information
b) Specific data
3 Go online and get data
a) Visit wwwdataintheclassroomorg and find the Sea Level module
b) Follow the link to ldquoSatellite Datardquo or ldquoTide Datardquo
c) Using the form select the data and parameters you wish to look at
d) Click the ldquoGet Datardquo button
4 Use the Data Log Sheet to keep a record of the data you select so you can refer to it later
5 Analyze the data
6 Draw conclusions
Write down what you learned from your investigation Use your data to help you decide whether your
hypothesis is supported If your hypothesis is not supported think about other data you might need to
collect
Understanding Sea Level Using Real Data 43
Student Master
Data Log Sheet As you use the online data access form to select data about sea level keep a record of the parameters you
select on this data log sheet Your data log will help you remember and keep track of the data you have
looked at Consider whether each new piece of data helps support or disprove your hypothesis
Data set Region Station Dates Notes
Understanding Sea Level Using Real Data 44
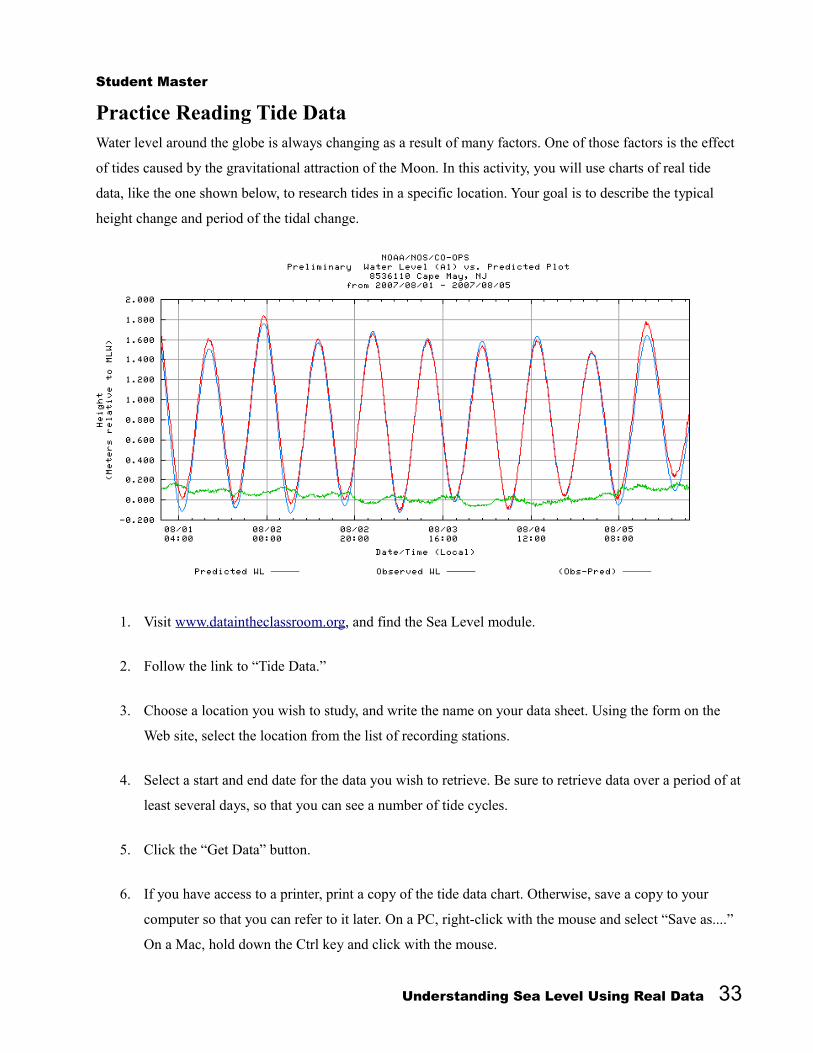
Student Master
Practice Reading Tide Data Water level around the globe is always changing as a result of many factors One of those factors is the effect
of tides caused by the gravitational attraction of the Moon In this activity you will use charts of real tide
data like the one shown below to research tides in a specific location Your goal is to describe the typical
height change and period of the tidal change
1 Visit wwwdataintheclassroomorg and find the Sea Level module
2 Follow the link to ldquoTide Datardquo
3 Choose a location you wish to study and write the name on your data sheet Using the form on the
Web site select the location from the list of recording stations
4 Select a start and end date for the data you wish to retrieve Be sure to retrieve data over a period of at
least several days so that you can see a number of tide cycles
5 Click the ldquoGet Datardquo button
6 If you have access to a printer print a copy of the tide data chart Otherwise save a copy to your
computer so that you can refer to it later On a PC right-click with the mouse and select ldquoSave asrdquo
On a Mac hold down the Ctrl key and click with the mouse
Understanding Sea Level Using Real Data 33
7 Look at the chart and see if you can identify a pattern of low and high tides Choose a point on the
chart that represents a low tide Use the scale on the y-axis to determine the relative height of the
water at that point Record the approximate time and the relative water height on your data sheet
8 Now find the point that represents the next high tide and record the relative height of the water then
9 Calculate the difference between the water height at high and low tides This is the height change
Record this change on your data sheet
10 Next choose two points on the chart that represent consecutive low or consecutive high tides Use the
time scale on the x-axis to determine the time period of the tide cycle Record the period on your data
sheet
Do you think the measurements you just made provide a good description of the tides at this location
Hint Make measurements using data from the same location at other times to see if the tides are different
Once you have made several measurements can you make calculations to find the average height
change and period from the data you collected
Data Sheet
Station Name
Date Time (Approx) Low Tide High Tide Tide Height Tide CycleHeight Height Change Period
08022007 2000 0 m 175 m 175 m 12 hrs
Understanding Sea Level Using Real Data 34
Level 4 Interactivity Measuring Storm Effects
Summary Grade Level 6-8
Teaching Time
Two 45 minute periods
Activities
Get water height data for
storm events
Create a research plan
using real data
Use interactive tide model
to visualize storm effects
Vocabulary Storm tide ndash a storm surge
event that takes place along the
coast which produces
exceptionally high water A
storm tide is generated by
storm wind stress and low
atmospheric pressure Storm
surges are made even higher
when associated with high tide
and shallow depths
Objective Using what they learned about typical tide measurements at a location
students will investigate and measure what happens to water height
during a storm event
Background Storms can have a big impact on local water levels in coastal areas A
storm surge happens when water is pushed toward the shore by high
powered winds from a storm such as a hurricane The storm interacts
with the normal tide to create a storm tide that can increase the normal
water height by 4 to 5 meters (15 feet) or more These events can cause
extreme flooding in coastal areas Most coastlines in the United States
are only 3 meters (10 feet) or less above mean sea level which means
that storms can be very dangerous for people who live near the coast8
During this lesson students are asked to answer a research question
How do storm events impact water levels at a coastal location To
accomplish this task students must take the calculations they made in the
last activity and use them as a baseline to evaluate the tide heights
observed during a storm
8 Ross A R(1995) Introduction to Oceanography New York Harper Collins p 230
Understanding Sea Level Using Real Data 35
Materials Procedure Computer or overhead 1 On an overhead projector display a news report from a recent
projector storm Copies of Student
Master Research Project Explain that water level is affected by lots of different factors Determining Storm Surge not just tides and that these factors actually compound or add Height together
Copies of Student
Master Data Log Sheet 2 Explain that students will continue the investigation of water Rulers
level from the last activity This time they will go online to look
at data related to storms Their task is to make a research plan
using real data to describe the effects of storms on coastal water
levels Their goal is to determine the additional effect a storm
can have on water height
3 Students will need to access the Internet to generate and save
data maps and graphs Depending on the setting this can be done
in a computer lab or assigned as homework assuming students
have access to the Internet at a library or computer center
Students should follow the instructions on the Student Master
Research Project Determining Storm Surge Height and record
their data and calculations on the table provided
4 When students have finished gathering data and making
calculations conclude the activity with a demonstration to help
students visualize their data Follow the procedure on page 19 to
display the online tide model
Ask for a volunteer to enter his or her data into the model Look
for the line of controls labeled Storm The student should enter
the storm surge height and duration he or she calculated in the
boxes from the Data Log Sheet labeled Max Height Change
Click the Play button to start the model You can stop the model
and enter different numbers to change the behavior
Understanding Sea Level Using Real Data 36
Assessment Rubric In assessing student performance consider how students approached
collecting their tide data and what calculations they made based on the
data
Successful student work may include
Correct use of the y-axis to measure height changes and the x-
axis to measure time intervals
A selection of data from a selected station during several
different periods of time In particular students should attempt to
determine how long the storm impacted the area ndash from when the
storm effect was first seen to when it went away
Determine the maximum high tide recorded during the storm
Calculation of the difference between the maximum high tide
and the average high tide they found in the last activity
A working definition of a mean or average
A working definition of relative height change or deviation
Understanding Sea Level Using Real Data 37
Student Master
Research Project Determining Storm Surge Height You are joining a team of scientists who are studying the effects of storms along the US coast Your task is to
pick a storm event for a coastal location and design a research plan to help you gather data about the water
height before during and after the storm You already know something about the typical or average water
height in the area due to tides Your goal now is to determine the additional effect a storm can have on water
height Once your plan is accepted you are to carry out your data collection analyze it and report your
findings to the team
Planning your project
1 Form a hypothesis before designing your investigation
Research question How do storm events impact water levels at my coastal location
Hypothesis Storms produce a surge which raises water levels above what would normally occur
during a typical tide cycle
2 Design a plan to test your hypothesis and answer your research question
What do you need
a) More information Do you need more information about specific storm events and their effects
b) Specific data When you go online to collect data what dates will you look at and what charts
will you generate
3 Go online and get data
a) Visit wwwdataintheclassroomorg and find the Sea Level module
b) Follow the link to ldquoTide Datardquo
c) Choose a location you wish to study and write the name on your data sheet Using the form on
the Web site select the location from the list of recording stations
d) Search Internet news and weather sources for information about storms that impacted the area
near your station Identify a storm event to investigate and take note of the date of the storm
Understanding Sea Level Using Real Data 38
e) Using the form on the Web site select start and end dates around the time of the storm event you
found
f) Click the ldquoGet Datardquo button
g) If you have access to a printer print a copy of the tide data chart Otherwise save a copy to your
computer so that you can refer to it later On a PC right-click with the mouse and select ldquoSave
asrdquo On a Mac hold down the Ctrl key and click with the mouse
4 Use the Data Log Sheet to keep a record of the data you select so you can refer to it later
5 Analyze the data
a) What were the highest and lowest tides recorded during the storm event
b) How did the tides during the storm compare with the average high and low tides you calculated
for this station previously
c) Calculate the different between the highest tide measured during the storm and the average high
tide for the area
d) Can you use the data to determine how long the storm impacted the area
6 Draw conclusions
Write down what you learned from your investigation Use your data to help you decide if your
hypothesis was supported
Understanding Sea Level Using Real Data 39
Student Master
Data Log Sheet
Station Name
Date Time (Approx) Low Tide Height
High TideHeight
Tide HeightChange
Tide CyclePeriod
Understanding Sea Level Using Real Data 40
Level 5 Invention Designing Your Own Investigation
Summary Grade Level 6-8
Teaching Time
Two 45 minute periods
Activity
Design an investigation
using real data to examine
a hypothesis
Web Links For links to long-term sea
level trend data visit
wwwdataintheclassroomorg
Objective Students will apply what they have learned to consider sea level data on
a larger scale To do this students will design their own plan to answer a
research question using real data
Background Students have used real data to begin to understand changes in water
levels Most of the work has been an examination of how sea level
changes on a relatively small scale ndash at a single location or station and
over a very short period of time Now it is time for students to examine
sea level on a larger scale by developing their own investigation using
real data
Students should be encouraged to develop their own research questions
and hypotheses for this activity In general questions that lead them to
considering changes in water level on a larger scale will provide a good
starting point Here are some examples of questions
Research questions
Do changes in water level have the same impact everywhere on Earth
How is sea surface height changing over time
Students choosing to look at changes in sea level over time will naturally
consider the prospect of long-term sea level rise due to climate change It
may not be easy for students to detect and interpret long-term trends
using the kinds of data tools and analysis available to them However
links to long-term trend analyses are available and students can be
challenged to apply what they have learned about reading and
understanding data to interpret these long-term data products
Understanding Sea Level Using Real Data 41
Procedure
Materials 1 Distribute the Student Master Research Project Designing Your
Own Investigation and Student Master Data Log Sheet Copies of Student
Master Research Project 2 Guide student selection of a research question (or allow students
Designing Your Own to make up their own) that is appropriate to their academic Investigation
Copies of Student experience Review student hypotheses to make sure they are
Master Data Log Sheet appropriate and that students will be able to support or disprove
Student access to them using the kinds of data they will have available
computers with Internet
connections 3 Have students design a research project to answer the question
4 Check each research project plan before students begin to see if
it is in keeping with the question and the resources available
5 Assign students to use the tools at wwwdataintheclassroomorg
to access the data they need
6 When students complete their research provide time for them to
present their findings
7 Use the student presentations as an opportunity to relate this
investigation to the current news and debate about global climate
change Ask From your own experience looking at real data
how do these data relate to the question of global climate
change
Understanding Sea Level Using Real Data 42
Student Master
Research Project Designing Your Own Investigation
Planning your project
1 Develop a research question Then form a hypothesis to investigate
Be sure to review your hypothesis with your teacher before you begin
Research question
Hypothesis
2 Design a plan to test your hypothesis and answer the research question
What do you need
a) More information
b) Specific data
3 Go online and get data
a) Visit wwwdataintheclassroomorg and find the Sea Level module
b) Follow the link to ldquoSatellite Datardquo or ldquoTide Datardquo
c) Using the form select the data and parameters you wish to look at
d) Click the ldquoGet Datardquo button
4 Use the Data Log Sheet to keep a record of the data you select so you can refer to it later
5 Analyze the data
6 Draw conclusions
Write down what you learned from your investigation Use your data to help you decide whether your
hypothesis is supported If your hypothesis is not supported think about other data you might need to
collect
Understanding Sea Level Using Real Data 43
Student Master
Data Log Sheet As you use the online data access form to select data about sea level keep a record of the parameters you
select on this data log sheet Your data log will help you remember and keep track of the data you have
looked at Consider whether each new piece of data helps support or disprove your hypothesis
Data set Region Station Dates Notes
Understanding Sea Level Using Real Data 44
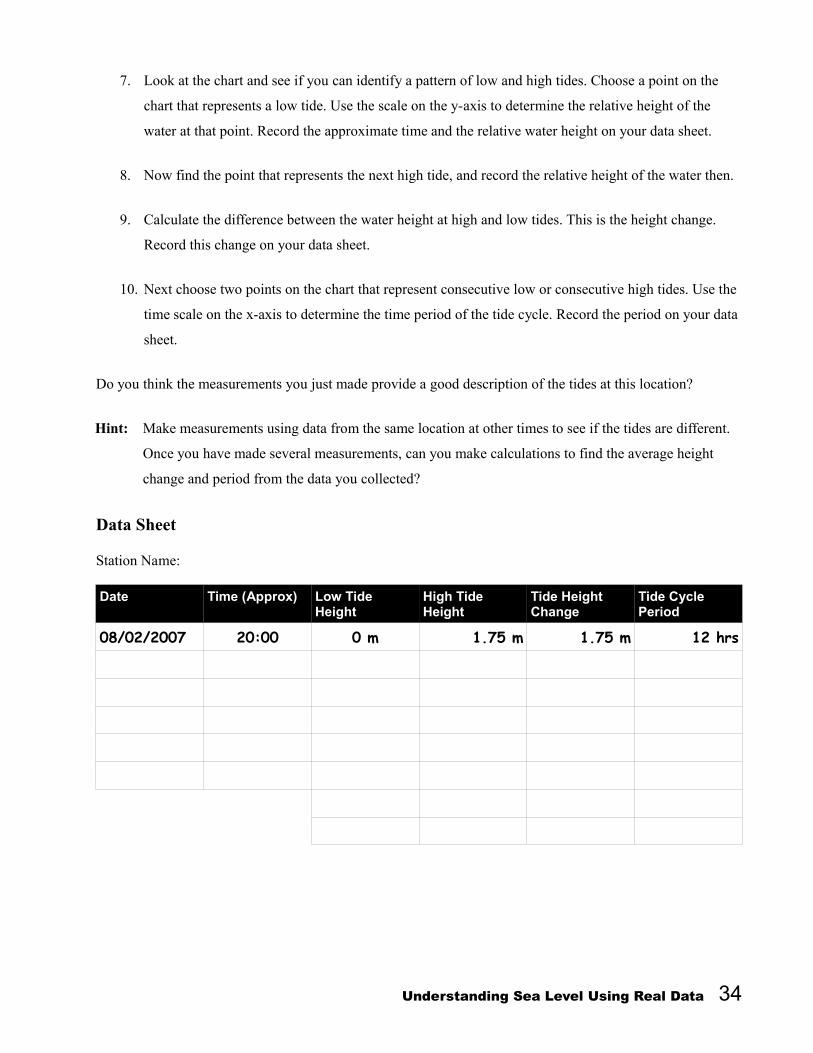
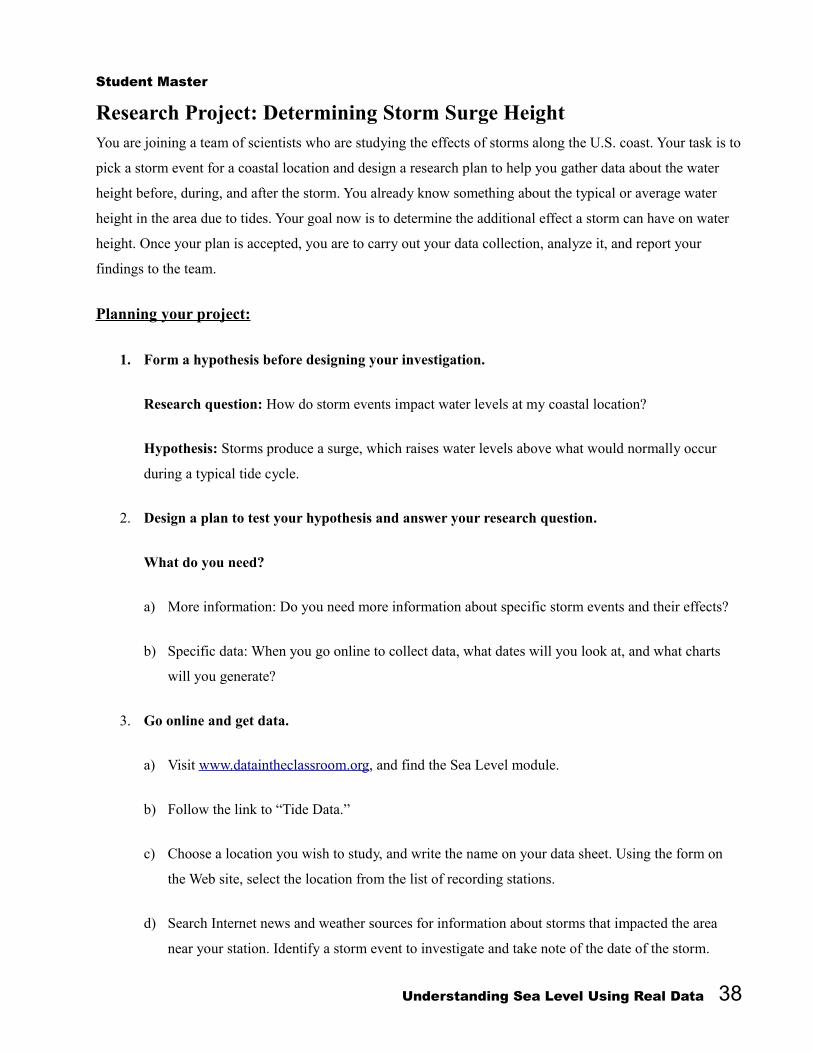
Student Master
Research Project Determining Storm Surge Height You are joining a team of scientists who are studying the effects of storms along the US coast Your task is to
pick a storm event for a coastal location and design a research plan to help you gather data about the water
height before during and after the storm You already know something about the typical or average water
height in the area due to tides Your goal now is to determine the additional effect a storm can have on water
height Once your plan is accepted you are to carry out your data collection analyze it and report your
findings to the team
Planning your project
1 Form a hypothesis before designing your investigation
Research question How do storm events impact water levels at my coastal location
Hypothesis Storms produce a surge which raises water levels above what would normally occur
during a typical tide cycle
2 Design a plan to test your hypothesis and answer your research question
What do you need
a) More information Do you need more information about specific storm events and their effects
b) Specific data When you go online to collect data what dates will you look at and what charts
will you generate
3 Go online and get data
a) Visit wwwdataintheclassroomorg and find the Sea Level module
b) Follow the link to ldquoTide Datardquo
c) Choose a location you wish to study and write the name on your data sheet Using the form on
the Web site select the location from the list of recording stations
d) Search Internet news and weather sources for information about storms that impacted the area
near your station Identify a storm event to investigate and take note of the date of the storm
Understanding Sea Level Using Real Data 38
e) Using the form on the Web site select start and end dates around the time of the storm event you
found
f) Click the ldquoGet Datardquo button
g) If you have access to a printer print a copy of the tide data chart Otherwise save a copy to your
computer so that you can refer to it later On a PC right-click with the mouse and select ldquoSave
asrdquo On a Mac hold down the Ctrl key and click with the mouse
4 Use the Data Log Sheet to keep a record of the data you select so you can refer to it later
5 Analyze the data
a) What were the highest and lowest tides recorded during the storm event
b) How did the tides during the storm compare with the average high and low tides you calculated
for this station previously
c) Calculate the different between the highest tide measured during the storm and the average high
tide for the area
d) Can you use the data to determine how long the storm impacted the area
6 Draw conclusions
Write down what you learned from your investigation Use your data to help you decide if your
hypothesis was supported
Understanding Sea Level Using Real Data 39
Student Master
Data Log Sheet
Station Name
Date Time (Approx) Low Tide Height
High TideHeight
Tide HeightChange
Tide CyclePeriod
Understanding Sea Level Using Real Data 40
Level 5 Invention Designing Your Own Investigation
Summary Grade Level 6-8
Teaching Time
Two 45 minute periods
Activity
Design an investigation
using real data to examine
a hypothesis
Web Links For links to long-term sea
level trend data visit
wwwdataintheclassroomorg
Objective Students will apply what they have learned to consider sea level data on
a larger scale To do this students will design their own plan to answer a
research question using real data
Background Students have used real data to begin to understand changes in water
levels Most of the work has been an examination of how sea level
changes on a relatively small scale ndash at a single location or station and
over a very short period of time Now it is time for students to examine
sea level on a larger scale by developing their own investigation using
real data
Students should be encouraged to develop their own research questions
and hypotheses for this activity In general questions that lead them to
considering changes in water level on a larger scale will provide a good
starting point Here are some examples of questions
Research questions
Do changes in water level have the same impact everywhere on Earth
How is sea surface height changing over time
Students choosing to look at changes in sea level over time will naturally
consider the prospect of long-term sea level rise due to climate change It
may not be easy for students to detect and interpret long-term trends
using the kinds of data tools and analysis available to them However
links to long-term trend analyses are available and students can be
challenged to apply what they have learned about reading and
understanding data to interpret these long-term data products
Understanding Sea Level Using Real Data 41
Procedure
Materials 1 Distribute the Student Master Research Project Designing Your
Own Investigation and Student Master Data Log Sheet Copies of Student
Master Research Project 2 Guide student selection of a research question (or allow students
Designing Your Own to make up their own) that is appropriate to their academic Investigation
Copies of Student experience Review student hypotheses to make sure they are
Master Data Log Sheet appropriate and that students will be able to support or disprove
Student access to them using the kinds of data they will have available
computers with Internet
connections 3 Have students design a research project to answer the question
4 Check each research project plan before students begin to see if
it is in keeping with the question and the resources available
5 Assign students to use the tools at wwwdataintheclassroomorg
to access the data they need
6 When students complete their research provide time for them to
present their findings
7 Use the student presentations as an opportunity to relate this
investigation to the current news and debate about global climate
change Ask From your own experience looking at real data
how do these data relate to the question of global climate
change
Understanding Sea Level Using Real Data 42
Student Master
Research Project Designing Your Own Investigation
Planning your project
1 Develop a research question Then form a hypothesis to investigate
Be sure to review your hypothesis with your teacher before you begin
Research question
Hypothesis
2 Design a plan to test your hypothesis and answer the research question
What do you need
a) More information
b) Specific data
3 Go online and get data
a) Visit wwwdataintheclassroomorg and find the Sea Level module
b) Follow the link to ldquoSatellite Datardquo or ldquoTide Datardquo
c) Using the form select the data and parameters you wish to look at
d) Click the ldquoGet Datardquo button
4 Use the Data Log Sheet to keep a record of the data you select so you can refer to it later
5 Analyze the data
6 Draw conclusions
Write down what you learned from your investigation Use your data to help you decide whether your
hypothesis is supported If your hypothesis is not supported think about other data you might need to
collect
Understanding Sea Level Using Real Data 43
Student Master
Data Log Sheet As you use the online data access form to select data about sea level keep a record of the parameters you
select on this data log sheet Your data log will help you remember and keep track of the data you have
looked at Consider whether each new piece of data helps support or disprove your hypothesis
Data set Region Station Dates Notes
Understanding Sea Level Using Real Data 44
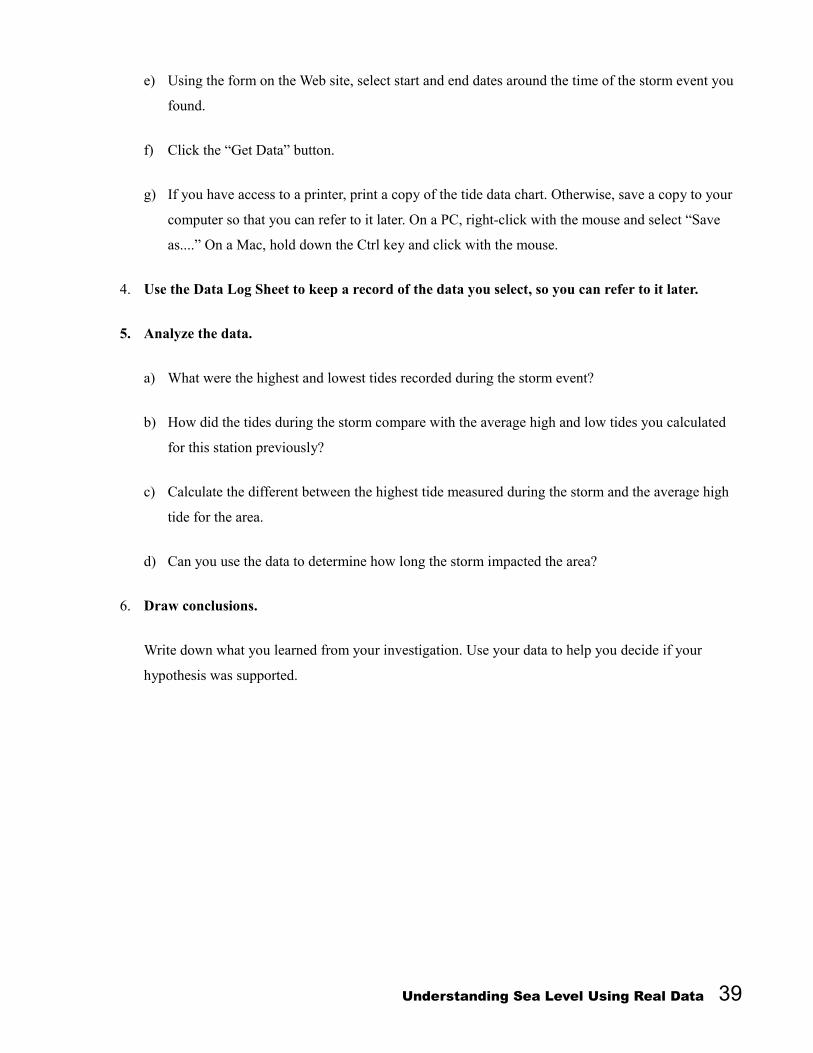
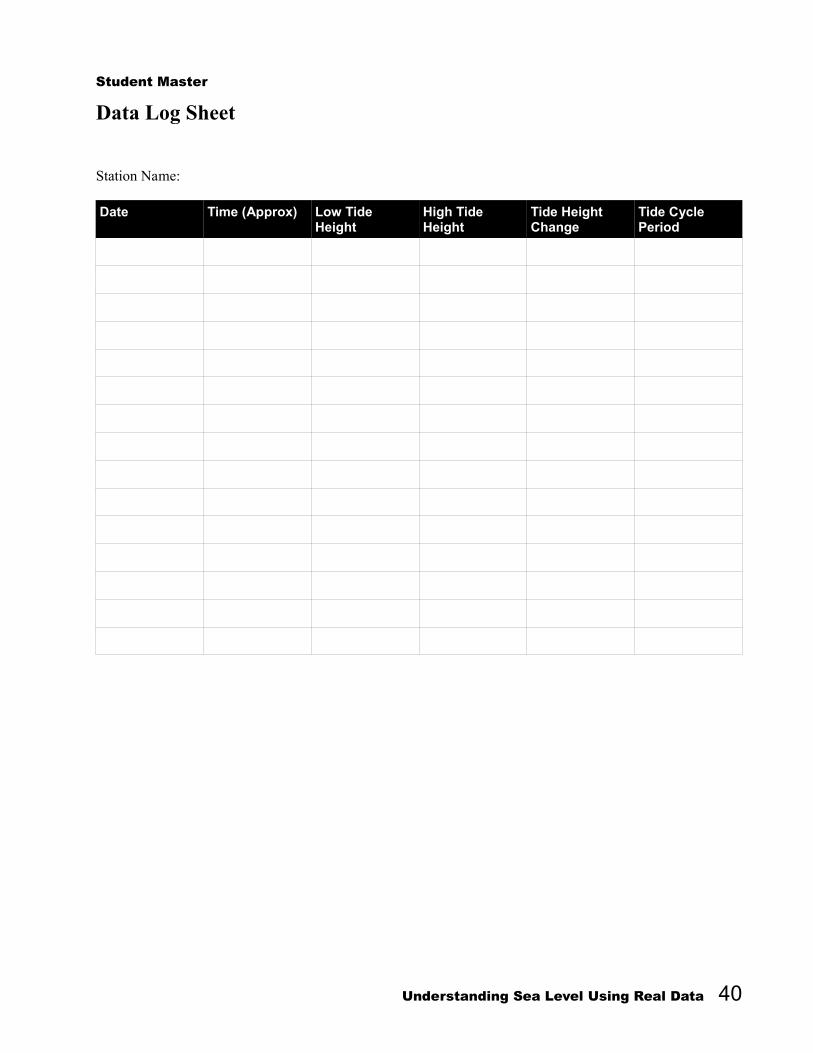
Student Master
Data Log Sheet
Station Name
Date Time (Approx) Low Tide Height
High TideHeight
Tide HeightChange
Tide CyclePeriod
Understanding Sea Level Using Real Data 40
Level 5 Invention Designing Your Own Investigation
Summary Grade Level 6-8
Teaching Time
Two 45 minute periods
Activity
Design an investigation
using real data to examine
a hypothesis
Web Links For links to long-term sea
level trend data visit
wwwdataintheclassroomorg
Objective Students will apply what they have learned to consider sea level data on
a larger scale To do this students will design their own plan to answer a
research question using real data
Background Students have used real data to begin to understand changes in water
levels Most of the work has been an examination of how sea level
changes on a relatively small scale ndash at a single location or station and
over a very short period of time Now it is time for students to examine
sea level on a larger scale by developing their own investigation using
real data
Students should be encouraged to develop their own research questions
and hypotheses for this activity In general questions that lead them to
considering changes in water level on a larger scale will provide a good
starting point Here are some examples of questions
Research questions
Do changes in water level have the same impact everywhere on Earth
How is sea surface height changing over time
Students choosing to look at changes in sea level over time will naturally
consider the prospect of long-term sea level rise due to climate change It
may not be easy for students to detect and interpret long-term trends
using the kinds of data tools and analysis available to them However
links to long-term trend analyses are available and students can be
challenged to apply what they have learned about reading and
understanding data to interpret these long-term data products
Understanding Sea Level Using Real Data 41
Procedure
Materials 1 Distribute the Student Master Research Project Designing Your
Own Investigation and Student Master Data Log Sheet Copies of Student
Master Research Project 2 Guide student selection of a research question (or allow students
Designing Your Own to make up their own) that is appropriate to their academic Investigation
Copies of Student experience Review student hypotheses to make sure they are
Master Data Log Sheet appropriate and that students will be able to support or disprove
Student access to them using the kinds of data they will have available
computers with Internet
connections 3 Have students design a research project to answer the question
4 Check each research project plan before students begin to see if
it is in keeping with the question and the resources available
5 Assign students to use the tools at wwwdataintheclassroomorg
to access the data they need
6 When students complete their research provide time for them to
present their findings
7 Use the student presentations as an opportunity to relate this
investigation to the current news and debate about global climate
change Ask From your own experience looking at real data
how do these data relate to the question of global climate
change
Understanding Sea Level Using Real Data 42
Student Master
Research Project Designing Your Own Investigation
Planning your project
1 Develop a research question Then form a hypothesis to investigate
Be sure to review your hypothesis with your teacher before you begin
Research question
Hypothesis
2 Design a plan to test your hypothesis and answer the research question
What do you need
a) More information
b) Specific data
3 Go online and get data
a) Visit wwwdataintheclassroomorg and find the Sea Level module
b) Follow the link to ldquoSatellite Datardquo or ldquoTide Datardquo
c) Using the form select the data and parameters you wish to look at
d) Click the ldquoGet Datardquo button
4 Use the Data Log Sheet to keep a record of the data you select so you can refer to it later
5 Analyze the data
6 Draw conclusions
Write down what you learned from your investigation Use your data to help you decide whether your
hypothesis is supported If your hypothesis is not supported think about other data you might need to
collect
Understanding Sea Level Using Real Data 43
Student Master
Data Log Sheet As you use the online data access form to select data about sea level keep a record of the parameters you
select on this data log sheet Your data log will help you remember and keep track of the data you have
looked at Consider whether each new piece of data helps support or disprove your hypothesis
Data set Region Station Dates Notes
Understanding Sea Level Using Real Data 44
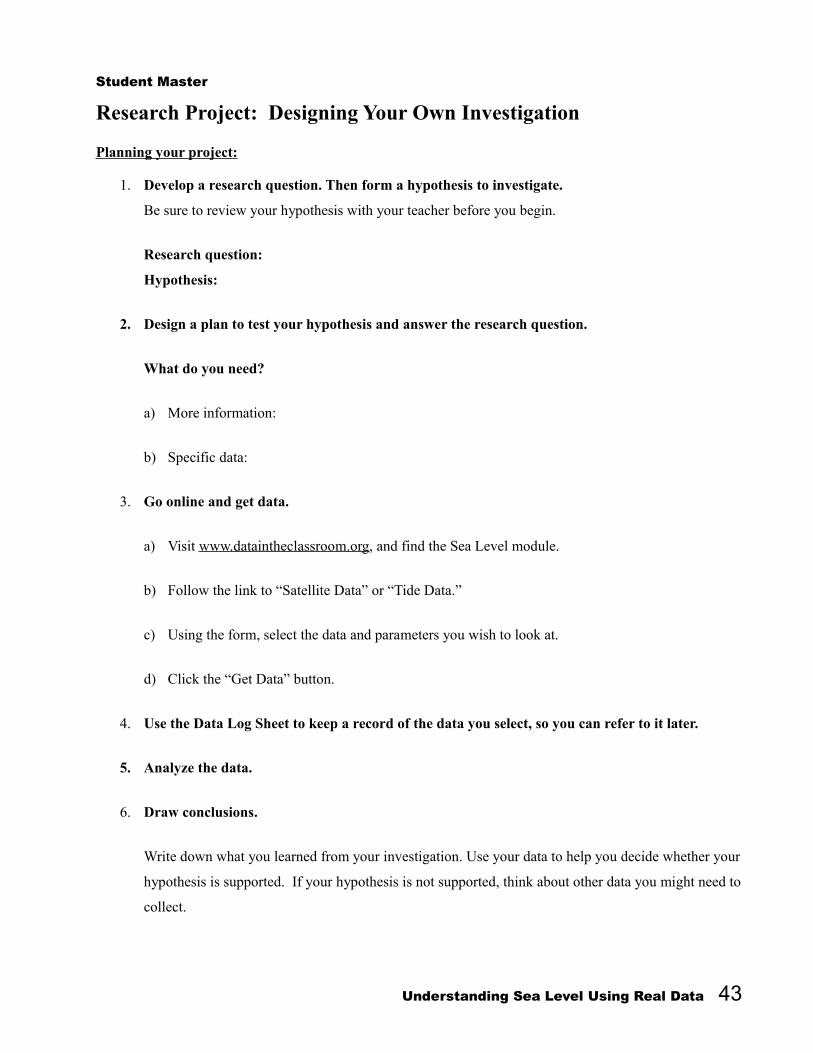
Student Master
Research Project Designing Your Own Investigation
Planning your project
1 Develop a research question Then form a hypothesis to investigate
Be sure to review your hypothesis with your teacher before you begin
Research question
Hypothesis
2 Design a plan to test your hypothesis and answer the research question
What do you need
a) More information
b) Specific data
3 Go online and get data
a) Visit wwwdataintheclassroomorg and find the Sea Level module
b) Follow the link to ldquoSatellite Datardquo or ldquoTide Datardquo
c) Using the form select the data and parameters you wish to look at
d) Click the ldquoGet Datardquo button
4 Use the Data Log Sheet to keep a record of the data you select so you can refer to it later
5 Analyze the data
6 Draw conclusions
Write down what you learned from your investigation Use your data to help you decide whether your
hypothesis is supported If your hypothesis is not supported think about other data you might need to
collect
Understanding Sea Level Using Real Data 43
Student Master
Data Log Sheet As you use the online data access form to select data about sea level keep a record of the parameters you
select on this data log sheet Your data log will help you remember and keep track of the data you have
looked at Consider whether each new piece of data helps support or disprove your hypothesis
Data set Region Station Dates Notes
Understanding Sea Level Using Real Data 44