understanding technology adoption: fertilizer in …...1 understanding technology adoption:...
TRANSCRIPT

1
Understanding Technology Adoption: Fertilizer in Western Kenya
Evidence from Field Experiments
(PRELIMINARY AND INCOMPLETE)
April 14, 2006
Esther Duflo, Michael Kremer and Jonathan Robinson
MIT, NBER, CEPR and BREAD; Harvard University, NBER and BREAD; and Princeton
University
Abstract
The question of the determinants of the adoption of new technology in
agriculture is of central interest to both academics and policy makers. In this
paper, we report the results from a unique set of field experiments conducted in
Western Kenya over five years, which were designed to investigate a range of
hypotheses on the determinants and barriers to the adoption of a profitable
technology. In the experiments, meaningful programs expected to have an effect
on the adoption of fertilizer under alternative hypotheses were proposed to
randomly selected groups of farmers. We find that while know-how plays a role
and can partly be overcome, other factors, such as the inability to save over even
short periods of time may be even stronger impediments.
1. Introduction
Maize is the staple food in most of Eastern and Southern Africa. Although a relatively new crop,
the production of maize has expanded so fast that maize has become the dominant food crop in
that region. In Kenya, maize accounts for 80% of the national production of cereals (Hassan
1998, p.164) and provides 40% of calorie consumption for Kenyans who consume more than 125
kilograms of maize per person each year (Byerlee, 1997 p.16).
Maize is also a crop which has been subject to relatively successful technological improvements
such as the use of fertilizer and new hybrid seeds. In developing countries outside of Africa, the

2
use of fertilizer accounted for 50-75% increase in the crop yields from the mid 1960s (Viyas,
1983). Many believed that this new technology in maize production with its high-yield potential
would lead Africa to replicate the success of Asia’s Green Revolution. However, this hope did
not materialize. Fertilizer use in Africa is still very low and has been stagnating since the 1980s.
Meanwhile, with rapid population growth, Africa can no longer be viewed as a land-abundant
region where food crop supply could be increased by the expansion of land used in agriculture
(Byerlee, 1997). Large areas in Africa are marginal for agriculture and arable land is scarce in
many African countries. One of those countries is Kenya, which surpasses major Asian countries
in intensity of land use (Binswanger and Pingali, 1988). This makes the need for intensification of
land use through the use of land-saving technologies such as fertilizer critical for achieving food
security. Yet, the rate of increase in fertilizer use has been substantially lower than in Asia and
Latin America (Byerlee, 1997).
In rural Western Kenya, the Ministry of Agriculture recommends the use of hybrid seeds and
fertilizer to increase maize yields. This recommendation is based on evidence from experimental
farms that fertilizer substantially increases yield. However, according to surveys we have
conducted over several years with a random sample of farmers, just 31.1% of farmers had ever
used fertilizer, and just 17.4% had used fertilizer in the year prior to the survey. This paper seeks
to understand why so many people do not use fertilizer even though it appears to have the
potential to improve yields considerably, thus improving poor farmers’ lives as well as improving
food security in the country.
Models of technology adoption in agriculture suggest three broad categories of explanations.
First, fertilizer may not be appropriate in this region. Second, it may be appropriate, but farmers
either do not know it, or do not know how to use fertilizer. There may be an inefficiently low
level of experimentation if there are externalities in learning. Finally, there is the issue of
financing profitable investments. As technology adoption, information acquisition and diffusion,
and the financing of investments are all fundamental questions in development economics, the
lessons from this project have the potential to extend far beyond the specific example of fertilizer.
In this project, we employ a series of randomized field trials to investigate several hypotheses that
might explain why farmers do not use fertilizer: fertilizer is not profitable given the conditions on
3
real farms; it is profitable but farmers do not know how to use it, or do not know how profitable it
is; or, farmers have difficulty financing the investment, perhaps because they are unable to save.
In a series of randomized field experiments, we have explored these three hypotheses. Our main
results suggest that: (1) fertilizer is profitable; (2) providing information goes part of the way
towards increasing fertilizer adoption, and part of the low fertilizer adoption may be explained by
the complete absence of diffusion of technological innovation; but (3) programs that help the
farmers commit at the point where they have money to use fertilizer later in the season also have
a large impact on future fertilizer adoption.
This project has taken place in Busia, a relatively poor rural district in Western Kenya. The
majority of Busia district is classified as a moist mid-altitude agro-ecological zone and maize is
the main staple food. Soil fertility is low and the Kenyan Agricultural Research Institute and
Ministry of Agriculture recommend use of fertilizer.
Since the summer of 2000, International Child Support (ICS), a Dutch Non-Governmental
Organization which has been working in Busia District for ten years, has conducted a series of
small-scale pilot programs in order to understand the barriers to fertilizer adoption for farmers
growing maize. In order to evaluate the impact of these programs, beneficiaries were randomly
selected and data was collected. While the experiments and the data collection have already been
completed, the data analysis is currently ongoing; this paper presents the experiments and the
results that have been obtained so far, as well as some open questions.
A. Fertilizer is profitable
A natural hypothesis to explain the low level of adoption of fertilizer is that it is not a profitable
investment for the average farmer. While agricultural experts have found that fertilizer greatly
increases yields in test plots, it may not be profitable if it requires substantial investment in
complementary inputs, is difficult to use in real-world situations, or cannot easily be used by
typical farmers. For example, Foster and Rosenzweig (1995) found that uneducated farmers have
negative profits in the first year they adopted HYV seeds. Beginning in the July, 2000, a series of
6 pilot projects (over 3 years) were designed to ascertain the profitability of fertilizer on real farms
facing the same conditions as those experienced by local farmers.
4
ICS first randomly selected 30 farmers from a list of parents of students enrolled at local schools.1
On each farm, an ICS field officer measured 3 adjacent 30 square meter plots (this is a very small
fraction of a typical farm). One plot was randomly assigned to receive Calcium Ammonium
Nitrate (CAN) fertilizer to be applied as top dressing (when the plant is knee high). On the second
plot, hybrid seeds were used in place of traditional varieties and Di-Ammonium Phosphate (DAP)
fertilizer was supplied for planting along with CAN for top dressing. The latter combination is the
full treatment recommended by the Ministry of Agriculture. The third plot was a comparison plot
on which farmers farmed as usual with traditional seeds and with no fertilizer. ICS paid for the
cost of the extra inputs (fertilizer and hybrid seed) and ICS field workers applied fertilizer and
seeds with the farmers, followed the farmers throughout the growing season, harvested with them,
and weighed the maize yield from each plot. Aside from these visits, the farmers were instructed
to farm their plots just as they would have otherwise. Interviews with the farmers and field
observation suggest that they did this.
At the end of a growing season, the maize was harvested, dried, and weighed with the farmer. In
order to calculate the value of the extra maize from the treatment plot, it was necessary to take
some care in measuring the yield. After maize is harvested, it must be dried and shelled, and the
kernels must be left to dry for several days before it is ready for consumption or for sale in the
marketplace. In later pilots, we attempted to determine the amount of weight that is lost as the
maize dries by offering farmers incentives to carefully dry their harvested maize at their home.
We then returned to measure the weight of the dried kernels and the ratio of the weight of the dry
kernels to the weight at harvest and used these figures to calculate estimates for the earlier pilots.
The program was continued for a total of six growing seasons, with small differences from season
to season. After the second pilot, ICS stopped using full treatment, and the amount of top dressing
fertilizer used per hole varied from season to season. Most notably, some pilots used ½ teaspoon
per hole, and others used 1 teaspoon, since the Kenya Agricultural Research Institute
recommends 1 teaspoon per hole (KARI, 2000), while other authorities recommend ½ teaspoons
or even less (Salasya, et al., 1998; Ouma, et al., 2002). In the fifth and sixth pilots, different
quantities of fertilizer were used on different plots. The size of the demonstration plots also
varied from pilot to pilot.
1 Comprehensive lists of households of this area are not available but fertility and primary school enrollment rates in this area are both high, so while this is not a representative sample it should not be that atypical either.
5
In total, six pilot projects were conducted over three years (Kenya has two growing seasons per
year), with sample sizes ranging from 29 to 97 farmers. Surveys suggest that there were no
differences in farmer-provided inputs, including labor inputs, such as time spent weeding,
between the plots.
Table 1 presents the mean and median rate of return obtained for each farmer by taking the
difference between the value of the output of the treated plot and the value of the output for the
comparison plot, and dividing by the cost of the inputs. Because the price of maize fluctuates
considerably during the season and the price of fertilizer does not seem to, the calculations below
are done for two prices, 25 Kenyan shilling (Ksh) per goro/goro (a volume measurement which is
used for measuring maize at the market), which is the price at harvest, and 40 Ksh per goro/goro
which is the price of maize at its maximum price over the season. These figures are based on local
prices during the three years ICS has been collecting data, but these numbers are consistent with a
much longer historical time series of prices in Nairobi and in cities closer to Busia.
Even at the conservative estimate of 25 Ksh per goro-goro fertilizer yields an average return of
39.6% to ½ teaspoon of top dressing fertilizer per hole over a 4-month period (280% annualized).
The valuation of 40 Ksh per goro-goro yields an average return of 123.4% for a 13-month
investment (110% annualized). These preliminary results suggest that using the correct amount of
top dressing fertilizer is quite profitable, so that low rates of usage cannot be explained purely by
unsuitability to African soils, as suggested by Voortman et al. (2000).
In contrast, the official full package recommended by the Ministry of Agriculture is actually
unprofitable on average, largely because the seeds may not germinate, causing a complete failure
(in contrast, recall that top dressing is applied only after seeds have germinated). Moreover, the
rate of return to 1 teaspoon of top dressing fertilizer is consistently less profitable than ½ teaspoon,
which suggests that an important part of the learning process is the amount of fertilizer to be used.
This suggests that Jovanovic and Nyarko’s (1996) target input model of technology adoption,
which is also the model employed by Foster and Rosenzweig (1995) is a good framework to
model learning and adoption. This is an environment in which learning how to use fertilizer may
be as important as learning about rates of return, and therefore an environment where we could
see learning by doing as well as learning from others. There is also considerable variability in the
rate of returns to fertilizer.
6
B. Learning
The extent to which people learn from each other is a central question in development economics.
In particular, the diffusion of new technologies through social networks (neighbors, friends, etc.)
has been and continues to be intensively studied (see Munshi (2005) for a recent review of the
work in the area). The impact of learning on technology adoption in agriculture has been studied
particularly extensively. Besley and Case (1994) show that in India, adoption of HYV seeds by an
individual is correlated with adoption among their neighbors. While this could be due to social
learning, it could also be the case that common unobservable variables affect adoption of both the
neighbors. To partially address this problem, Foster and Rosenzweig (1995) focus on
profitability. During the early years of the green revolution, returns to HYV were uncertain and
dependent on adequate use of fertilizer. In this context, the paper shows that profitability of HYV
seeds increased with past experimentation, by either the farmers or others in the village. Farmers
do not fully take this externality into account, and there is therefore underinvestment. In this
environment, the diffusion of a new technology will be slow if one neighbors' outcomes are not
informative about an individual's own conditions. Indeed, Munshi (2003) shows that in India,
HYV rice, which is characterized by much more varied conditions, displayed much less social
learning than HYV wheat.
All these results could still be biased in the presence of spatially correlated profitability shocks.
Using detailed information about social interactions, Conley and Udry (2005) distinguish
geographical neighbors from “information neighbors”, the set of individuals from whom an
individual neighbor may learn about agriculture. They show that pineapple farmers in Ghana
imitate the choices (of fertilizer quantity) of their information neighbors when these neighbors
have a good shock, and move further away from these decisions when they have a bad shock.
Conley and Udry try to rule out that this pattern is due to correlated shocks by observing that the
choices made on an established crop (maize-cassava intercropping), for which there should be no
learning, do not exhibit the same pattern.
All these papers try to solve what Manski (1993) has called the “reflection problem”: outcomes of
neighbors may be correlated because they face common (unobserved) shocks, rather than because
they imitate each other. This problem can be solved, however, with an experimental design in
which part of a population is subject to a program that changes their behavior. The ideal
7
experiment to identify social learning is to exogenously affect the choice of technology of a group
of farmers and to follow subsequent adoption by themselves and their neighbors, or agricultural
contacts.
The current setup is well-suited to test the proposition that lack of information about either the
rate of return to fertilizer, or its proper use, discouraged the farmers from using fertilizer, as well
as the strength of network effects: since the farmers participating in each pilot were randomly
selected from the parents of a school list, participating in the trials is randomly assigned within a
school, and parents from the same schools that were not selected form a control group.
Moreover, by comparing those with whom the treatment farmers report talking to about
agriculture to those with whom the comparison farmers report talking to, we can experimentally
investigate whether knowledge is transmitted within networks.
B1. The trials as agricultural extension
The trials can be thought of as a particularly intense form of agricultural extension. After the
harvest, and ICS field officer discussed the results of the experiment in detail with each farmer,
and helped him to work through a calculation of costs and benefits of using fertilizer, using his
own data as well as the data for all the farmers who participated in the trials. If the farmers
lacked information either about costs or about the proper way to use fertilizer, this intervention
should have provided that to them.2
After each pilot, we have been following each farmer to see if he chose to use fertilizer or any
other inputs on his own in subsequent seasons. Table 2 presents the results. Panel A presents the
adoption results for all the farmers involved in the six trials, the season immediately after and in
the next seasons. The data is pooled across all pilots, and all the regressions control for a dummy
for the school the farmer belong to (since randomization was stratified within school). The
samples varies across columns, since the number of times a farmer was observed after the initial
trial depends on when the trial was conducted. The results are presented for up to 5 seasons
following the pilot (although the set of farmers for whom we have data is different for different
duration after the trial). Adoption is 10.7 percentage points (or 66%) higher the season after the
pilot, This effect is statistically significant, and does not represent a trivial increase. However, it 2 We have collected data on farmers’ belief about fertilizer costs and benefits both in treatment and comparison groups. The analysis of this data is not yet complete, however.

8
also suggests in the season after the trial, only 27% of the farmers, on average use fertilizer. This
does suggest that lack of know-how is not the only barrier to the adoption of fertilizer. Panel B
restricts the sample to farmers that are observed in the three seasons following the trials and
investigates whether the effect of participating in a trial declines over time. In this sample, the
effect in the season after the trial was initially larger than in the larger sample (17%), but declines
the season after (to 11%), and seems to remain stable thereafter (at 11%).
B.2 Learning by doing
The trials gave the farmers the opportunity to experiment with fertilizer in their own farm, but it
also provided them with additional inputs: the fertilizer was applied with an ICS field officer,
who also visited the farmers regularly, and who helped them compute their rate of return and
gave information on results obtained by others at the end of the intervention. To distinguish the
effect of learning by doing from the effect of the additional information provided, ICS
implemented two separate programs in different samples.
The first program was designed to evaluate the impact of learning by doing. In this program, each
farmer was provided with a “starter kit”, consisting of a small quantity of fertilizer or fertilizer
and hybrid seeds (for a sub-sample) sufficient for a 30-square-meter plot. Farmers were instructed
that the kit was sufficient for this amount of space, and were given twine to measure two plots of
the relevant size. Beyond this, there was no monitoring of whether or not (and how) the farmers
used the starter kit. Starter kits have been used elsewhere; for instance, the Malawian government
distributed 2.86 million such packs beginning in 1998 (Masters et al., 2000). In the ICS program,
field staff explained how to use the inputs but did not formally monitor or measure the yields.
Starter kits were distributed to over 400 farmers randomly selected within 20 schools, in three
seasons. Their impact on the adoption of fertilizer or other seeds were evaluated for this entire
sample in the two seasons following the pilot. The results are presented in table 3. Starter kits
cause a significant increase in fertilizer adoption in the following season, although the effect is
about half the size of the own farm trial (5 percentage point), and does not persist in the following
year.
B.3 Learning by Watching
9
The other component of the agricultural trial was regular contact with a field officer who
demonstrated how to use fertilizer, and guided the farmers through a computation of the rate of
returns for themselves and for other farmers in the same area. To evaluate the impact of this
component, and to separate it from the effect of experimenting in one’s own farm, in three of the
trials, ICS asked the farmer to name 3 people with whom they regularly discuss agriculture. In
two the of the trials, they then invited one farmer randomly selected from this set to the key
stages of the trial (notably, planting, harvest, and the discussion of profitability). In the third
trials, they invited all the friends named by the farmer.
The impact on subsequent adoption of fertilizer amongst these farmers is presented in Table 4.
The first two columns compare the adoption of fertilizer of the farmers who were invited to watch
the trial on their friend’s farm to adoption among other contacts of the pilots and contacts of the
comparison farmers (we also include a dummy for being a friend of the pilot, but not having been
invited to the trials; we will discuss this variable below). After one season, adoption of fertilizer
treatment is 9 percentage points higher in the first group. This suggests that the effect of being
invited to watch a demonstration on someone else’s plot is as large as the effect of experimenting
on one’s own plot. It is possible to learn from others. Note that not all farmers who were invited
actually came to the trials. If there are no large direct effect on future adoption of being invited
even for those who did not go, this suggest an even larger effect of watching the trials for farmers
who chose to attend: the IV estimates are presented in panel B, and suggest that for those who
decided to come to the trial, the effect of watching the trial is 21%. While these are overestimates
to the extent that the very fact of being invited may have had a direct impact even for those who
decide not to attend (in particular, this may prompt a conversation on fertilizer between the
farmer and his or her friend), it is sensible that the effects are indeed larger for those who chose to
participate, since those who decided to come were probably those who were interested to learn in
the first place.
Since these results suggest that learning from experience in another field is possible, ICS set up a
school-based demonstration intervention, which would make it possible to replicate this
experience on a larger scale. They randomly selected 8 of 16 schools for this treatment. In those 8
schools, they selected one grade, and they invited all the parents to participate on a demonstration
plot on the school ground (schools have typically space to grow a small maize farm). The
demonstration followed the same protocol as the demonstration on the pilot farm: 2 plots were
10
set up (though they were larger than the previous demonstration plots), and one of them received
fertilizer, while the other was left as a control plot. Parents of this grade, and of one randomly
selected grade in comparison, also received a starter kit at the beginning of the next season.
The results on these experimental plots were disappointing, however. Parents and children are
responsible for maintaining the school’s farm. But in many cases, the maize was not properly
taken care of, and in some plots the crop was entirely destroyed (by animals) or stolen. Even in
plots that were harvested, the overall yield, and consequently the returns to fertilizer were low. As
a result, the plots had negative returns for most of the 8 plots. At the post-harvest de-briefing,
parents were told that the returns on their plot and that of the other school in this season were
negative, and that other trials conducted in the area had shown positive results.
In the next season, ICS field officers collected adoption data among the parents of these schools.
The results are shown in table 5, column 1: parents who have a child in class selected for the
demonstration plot are actually less likely to adopt fertilizer than those who are not. Given the
low performance of the treatment plots, the fact that the coefficient is insignificant and the point
estimate is negative is actually reassuring: it suggests that the increased adoption in response to
the pilot was actually the result of them updating their belief about fertilizer in response to a
positive experience. In contrast they do not update positively, and may be even update negatively,
in response to a negative experience.3
This also suggest that while agricultural trials may be effective in diffusing information, on-farm
agricultural trials are expensive, while community based trials may not deliver expected results,
due to the public good problem involved with properly maintaining the plots. This implies that,
while farmer can learn from them, trials may not be a cost effective way to diffuse information
about technology, unless these technologies diffuses rapidly once it is introduced. This is what we
turn to now.
B.4 Learning from others
We studied diffusion, by following both the neighbors (geographical network) and the people
named as agricultural contacts (actual network) of the pilot and the comparison farmers. As we
3 We have actually collected extensive data on belief regarding the cost and benefits of fertilizer, before and after the experiments. These will be analyzed in the next draft.

11
discussed, diffusion of agricultural technology has been a focus of much attention in previous
literature, but this setup allows us to provide experimental evidence that does not suffer from
omitted variable or simultaneity bias.
Table 6 shows the results for agricultural contacts (panel A) and neighbors (panel B). The second
row in table 4, panel A, also show similar results4 In each of these panels, we compare the
friends (or the neighbors) of the pilot farmers with the friends (or the neighbors) of the
comparison farmers. Panel A shows no evidence of the diffusion of the use of fertilizer: The
difference between the friends of the pilot farmers and the friends of the comparison farmers is
only 1.7%. the standard errors are large enough to reject a 7 percentage point increase, which is
smaller than the effect we found on own farmer or on the “invited friends”. Panel B’s result
suggests that the same is true for neighbors. The point estimates are actually slightly negative,
though they are not significantly different from zero. Since these experiments took place early on
in the project, these friends and neighbors are followed up over a long period of time. But it does
not appear that even after 4 seasons and later, there is any impact of being a friend or a pilot of a
neighbor on adoption. In fact, even pooling the data across years, which generates a large sample
and smaller standard errors (we cluster the standard error at the farmer level since we observe the
same farmers several times), the result remain really close to zero and insignificant.
These results do suggest that farmers do not discuss much about agriculture: if they did, they
would probably be able to learn from each other’s experience, as the other experiments show. To
verify this, we interviewed farmers about their neighbors and cross-checked their answers.
Indeed, there seems to be considerable uncertainty regarding the activities of the neighbors: 39%
farmers agree about whose harvest was better. Only 46% of farmers correctly state when their
neighbor planted. Pilot farmers and their neighbors do not have more accurate information about
each other than comparison farmers and their neighbors
Overall, what may be surprising about these effects is that all the learning effects are quite small:
adoption increases from 18% to 28% the season after a pilot conducted in one’s own farm, from
18% to 23% after experimenting with a starter kit, . There is no diffusion to the neighbors and the
people that the farmers talk to about agriculture, though we have shown that this does not stem
from an inability to learn from another plot (since the effect of being invited to watch a
4 The only difference between Panel A of table 6 and panel A of table 3 is that the sample is restricted to friends who were not invited to the trials.
12
demonstration on someone else’s plot is as large as the effect of doing the demonstration on one’s
own plot). It seems that something else is preventing farmers to adopt fertilizer.
C. Savings, Commitment, and Reminders
C.1 Pilot Programs
These results suggest that knowledge both about how to use fertilizer and the returns to fertilizer
are a factor in future adoption. However, even after participating in the experiment, more than
half the farmers do not use fertilizer. A possible explanation is that farmers are unable to save the
money they need to buy fertilizer, despite their desire to do so. This suggests that a savings
mechanism in which to hold their money could help them invest in agricultural inputs. To
explore this issue, ICS set up the Savings and Fertilizer Initiative (SAFI) in 2001, a program
which provides a commitment device for those farmers who wanted to use fertilizer.
The main idea behind the SAFI program is that farmers would like to use fertilizer, but do not
have the money on hand when fertilizer is needed (at planting or top dressing). The general
principle of the SAFI program is that the farmer is visited right after harvest (when maize and,
potentially, money is relatively plentiful), and is offered the option of purchasing a voucher for
fertilizer. ICS then delivers the fertilizer at the time of planting. The program is therefore a
commitment device, akin to a 401(k) program. The first step was to conduct a series of small
pilot programs, where different variables which, based on theories from psychology and form
economics, are likely to affect the take up were combined,. Panel A of table 8 presents the take
up aggregated over the various pilot programs.
In the first version of the program (SAFI 2), a group of farmers were randomly selected, and
visited right after harvest. They were visited twice, once to ask them whether they wanted to
participate in the program, and one other time, a few days to a couple of weeks later, to collect the
money. Sixty-six percent of the farmers expressed interest, and 22.6% eventually purchased
fertilizer. In the subsequent versions of the program (SAFI 3, 4, and 5), we combined SAFI with
the pilot program: pilot farmers were asked whether they wanted to use some of the maize that
they had just harvested to purchase fertilizer. Moreover, in SAFI 4, we had asked them to sell us
13
part of their harvest anyway. In either case, we asked them to make a decision and give us the
money right away, so that they had no chance to procrastinate.
The take up of SAFI 3 and 4 was very high: Among those who were offered SAFI 3 or 4, over
80% of farmers did indeed purchase fertilizer. The interpretation of these results is complicated
by two facts. SAFI 3 was offered only to farmers who had done particularly well in the
experiments (we therefore need to compare take up of fertilizer between farmers who were
offered SAFI and those who were not among those who had done well in the experiment). For
SAFI 4, all Pilot 4 farmers were asked to sell part of their maize anyway: farmers may have been
happier to hold on to maize than to hold on to cash, if they thought that cash was more likely to
be dissipated rapidly. Nevertheless, these results are quite striking, and do suggest that the
farmers make use of the commitment device, at least when they have an unexpectedly high
harvest or an extra amount of cash available.
We offered the SAFI program again in the following year to a subset of the farmers who had been
offered SAFI 4. They still had the option of selling us maize to buy fertilizer. However, since
they were not compelled to sell maize for some other reason, they were left the option of taking a
few days to collect the money. The take up of SAFI 4 exhibits the same pattern as the take up for
SAFI 2: Most (81.8%) of the farmers initially expressed interest, but after a few days, only 30%
eventually purchased for fertilizer. This is still substantially higher than the fraction of farmers
who are using fertilizer in the control group, which suggest that, even if all the farmers who were
going to use fertilizer anyway purchased fertilizer from us, the program increased the fraction of
people who are using fertilizer.
SAFI 5 explicitly explored the value of the commitment device. All Pilot 5 farmers were asked to
sell a small quantity of maize for the experiment. They were then divided into three groups. The
first group was offered the same program as before: They had the option of buying fertilizer right
away, paying either in cash or by selling maize. The second group were offered the program, but
were told that we would come back in a few days to collect the money. The third group was
asked whether they wanted us to come back at the time of top dressing with fertilizer that they
would then pay for (either in cash or in maize). The contrast between the three groups is striking:
In all cases, about 50% of farmers expressed interest in the scheme. However, the actual take up
decreases from 50% when the money is collected on that day to 29% when the money is collected
a few days later, to 0% when the money is collected at the time of top dressing.
14
The results from Pilot 4 suggested that individuals may be more willing to invest in fertilizer after
harvest if they hold wealth in a liquid asset like cash instead of maize. Pilot 6 explored this issue
further, by offering two SAFI variants. In the first, farmers were encouraged to sell their maize to
ICS so that they would have more cash on hand; the second was of the standard SAFI variety.
Seventy-one percent of those that were encouraged to sell maize took up SAFI compared to 50%
of the standard SAFI group, suggesting that the cash had some effect on take-up.
C2. SAFI, Subsidy, and Free delivery
C2.1. Experimental Design
The results from the different take up in the pilot suggest that SAFI was successful in
encouraging fertilizer adoption. However, the samples in the different versions of SAFI were
small and not necessarily comparable. We therefore set up, in conjunction with ICS, a large scale
SAFI experiment conducted over two seasons, to evaluate the impact of a SAFI program
conducted on a large scale, and to tests key hypotheses helping us to understand the impact of the
program.
The questions and hypotheses the experiments set out to answer or test were as follows, First, the
main hypothesis is that SAFI leads to higher adoption because of the timing at which people are
offered to buy fertilizer, not only because, by offering to deliver fertilizer at home, the NGO is
strongly endorsing fertilizer or because the free deliver was convenient. And is timing is what
matter, how does the elasticity of fertilizer purchase compare to that with respect to price?
Second, there are some questions which have to do with the design of SAFI: is SAFI more
valuable when the individual as cash on hands? Does it vary with previous exposure to fertilizer?
Does it vary if people can chose in advance the timing at which the offer should be made: are
they sophisticated enough to request an early visit, rather than a late visit if they are asked in
advance which date to chose?
In order to answer this question, we set up a two-year large scale SAFI experiment in the 16
schools that form the treatment and the control for the school based demonstration program. The
experiment started in the season following the demonstration plots experiment. In this season

15
(the 2004 Long Rains), a simple SAFI program (no choice of timing, the offer is a take it or leave
it offer) was offered to 244 farmers after stratifying by school and class (i.e. whether or not the
farmer received a starter kit).
In the following season (the 2004 Short Rains), the experimental design was set up to allow us to
test a variety of hypotheses. .
First, to study the impact of the availability of liquidity on the purchase of fertilizer, a set of
farmers was asked to sell some maize at an increased price (“buy” condition)
SAFI was then offered to randomly selected farmers, stratifying by school, starter kit status, prior
SAFI status, and “buy” status. Second, two variants of SAFI were offered:
• No choice condition: the farmer must buy a voucher immediately if he wishes to
participate (offered at harvest time)
• Choice condition: the farmer can decide before harvest when he would like the field
officer to come back to offer the SAFI. The farmer could request that the field officer
return at harvest, at planting, or at top dressing time. This condition was set up to test
whether farmers are sophisticated in their decision of purchasing fertilizer (and program
it in advance), or whether the fertilizer purchase right after harvest is an “impulse
purchase”.
In total, 417 farmers were offered SAFI in this program.
In addition, a set of farmers that were not sampled for SAFI were visited at planting time during
the same (2004 Short Rains) season. These farmers were sampled using the same stratified
sampling method as for SAFI and were offered fertilizer either at full price (but with free
delivery) or at half price. Thus those offered fertilizer at full price were saved travel costs and
were offered an implicit “endorsement” of fertilizer usage, while those offered fertilizer at half
price were offered these incentives plus a subsidy on the price.
C2.2 Results: Take up of the program
The main results concerning the take up of of these interventions are summarized in Table 8.
The average take up in the “visit” group (those offered fertilizer at planting time at full price) was
21%; that is, 21% of those visited at planting did buy fertilizer for planting. The average take up
in the 50% “subsidy” group was 46.2%. The average take up in the SAFI group was 39.8%. The
16
difference in take-up between those offered fertilizer at full price and the SAFI and subsidy
groups is significant, but the average difference between SAFI and the 50% subsidy is not. This
suggests that SAFI increases fertilizer purchase over and above “endorsement” and
“convenience,” and that its effect on purchase of fertilizer is roughly equivalent to that of a 50%
subsidy.
This result confirms that the timing of the SAFI offer is central to its adoption. One more result is
important to understand the role that the offer of buying fertilizer at this particular moment for the
farmer means: in the group that was asked before the harvest (in the lean season) whether and
when the field officer should come back to sell them fertilizer, and if when at what time, the
eventual purchase of fertilizer was as large as in the group that did not have the choice. This is
because a large fraction of farmers (46.8%) in the choice condition asked the field officer to come
back immediately after harvest. This suggest that the decision to buy fertilizer when the farmers
were “flush with cash” do not correspond to an impulse purchased prompted by the cue given by
the field officer. If this were the case and fertilizer were not purchase that the farmer knows they
would want to make, when visited before harvest they would ask the field officer to come back at
planting, and would end up not purchasing fertilizer. In fact, they ask them to come early, and
they do buy fertilizer when they come. Another important result, which goes in the same
direction, is the lack of difference in take up in the two groups where the farmers had cash on
hands (because they were asked to sell some maize for the experiment). Contrary to what was
observed in the smaller pilots, farmers were no more likely (in fact marginally less likely) to
purchase fertilizer right after they had sold maize. This does suggest that their decision to
purchase maize under SAFI is not only taking an opportunity to get rid of extra liquid resources.
C2.3 Results: Adoption of fertilizer
A major advantage of this experimental set up (unlike, for example many experiments conducted
on 401k or IRA) is that we are able to evaluate the impact of the program on the final decision of
interest (did the farmer use fertilizer). We can thus measure the extent to which the farmers who
purchased fertilizer under the program would have done it anyway, and to what extent the
take up is a substitution effect, and also to what extend those who bought fertilizer did not
actually use it (i.e., to what extent purchasing fertilizer in advance is actually a commitment
device).
17
A detailed survey on the adoption of fertilizer by everyone in the family (farmers grow different
plots, some in common, and some for their private use, in particular in multi-wives household)
was conducted in three seasons in the schools where SAFI programs were implemented. In
this survey, when farmers who had purchased fertilizer under any of this program
reported not using fertilizer, we also asked them what they did with it (it had been very
explicit at the time of the program that the fertilizer they purchased was theirs, and they
could do what they wanted with it). Roughly 75% of the farmers who purchased fertilizer
under the program initially say that they have used any fertilizer. When the 25%
remaining ones are asked what they did with the fertilizer they purchased under SAFI,
roughly 24% of them do not remember having ever gotten fertilizer through SAFI (these
are only 8 farmers in total), and among the remaining ones, most report having used
fertilizer after all, having kept it for another season, or having used it on another crop
than maize. In almost no circumstance did the fertilizer spoil or was it sold or given away
to someone else. It therefore does look that fertilizer purchased under the SAFI program
is indeed used on the maize crop.
The fraction of those who purchased fertilizer at the time of planting, either at half price
or at reduced price, who initially said they used fertilizer is lower (68% and 61%)
respectively. When probed, most say that they have actually used the fertilizer.
Interestingly, though anecdotally, two farmers say that they did not use the fertilizer
because it spoiled, which is very unlikely, since it was sold just before it should be used.
Similar adoption data was collected for comparison farmers. Since there was no
comparable probing of whether or not the farmer really used fertilizer for comparison
farmers, we use in both cases the “raw”, uncorrected data (that is, if a farmer who
purchased fertilizer through SAFI or any other ICS program initially tells us that they did
not use fertilizer, we count them as not using fertilizer even if they corrected their answer
later on (the corrected results are presented in an appendix table, and the conclusion are
qualitatively very similar). The results on adoption are presented in tables 9 and 10. Since
not all programs took place in the same year we show in bold the coefficient in the first
18
year where we expect to see an effect. Panel A does not have control variables, while
panel B control for education, some indicator of wealth, and prior use of fertilizer.
Column 1 in panel A suggest that the first SAFI (where take up was about 30%) leads to
a net increase in fertilizer adoption of 10%. Column 2 show that the second SAFI (where
the take up was 40%) leads to an increase in adoption of 16%. Both suggest the same
level of substitution, and suggest that the SAFI program has a significant net effect. The
coefficients are slightly larger in the regressions with control variables: 13% and 20% for
the first and second SAFI seasons, respectively.
Interestingly, in column 2, we see that the point estimate of the net effect of the 50%
subsidy on fertilizer adoption is lower than that of SAFI, even though the take up of the
program was similar. This is particularly striking in the regression with control variables,
where the effect of SAFI on take up is 20 percentage points, and that of subsidy is 12
percentage points. Moreover, the impact of the full-price visit is also significant once
control variables are introduced, and the effect is 14 percentage points, lower than that of
SAFI but higher than that of subsidy. It suggests that a 50% subsidy does not have an
additional impact on net usage of fertilizer over the free delivery, even though twice as
many farmers take it up: clearly, most farmers who did take it up were infra-marginal,
and would have used fertilizer anyway. This is much less true of SAFI, however, which
seems to generate a large fraction of new adopters.
C2.4 Interpretation
This could be a simple story of commitment device (such as the one told by Ashraf, Karlan and
Yin (2004)). There is, however, a very puzzling fact lingering in the background: the farmers are
asked when they want the fertilized to be delivered. In most cases, they want it right away (i.e.
much before they will actually use it). This is reasonable, since they may not trust ICS to
conserve their money for a long period of time, and fertilizer keeps well over a period of a few
weeks. But given this, and the fact that they seem to know their limitation, why don’t they buy
fertilizer themselves right after harvest? It seems that a sophisticated farmers (which many seem
19
to be) has the ability to do exactly what we did for them. Yet, almost nobody (even among the
people who use fertilizer) buys fertilizer in advance.
We do not yet have a very good answer to this question. One possibility is that the farmers know
they have an inconsistent time preference problem, but they procrastinate dealing with it, because
they have to pay a small cost today, which they may be reluctant to do, precisely because they
have time inconsistent time preferences. If this were the case, a small discount on the price of
fertilizer today, but with a strong deadline (expiring shortly around harvest) would induce farmers
to buy fertilizer at harvest time. We have tried this idea on a pilot basis, by distributing farmers in
one school coupons to buy fertilizer at a 6 shilling (15%) discount. The coupons could be
redeemed at any of the three stores in the villages. The take up of this program was quite high, at
29.8%. This suggests that the story we just told may be right. This also suggests a way to
transform the SAFI program into a cost effective development intervention: while it is costly and
logistically difficult to visit all the farmers exactly at the time of harvest, the coupons program
would be relatively easy to generalize.
We have also visited a sample farmers at harvest time and reminded them that buying fertilizer at
harvest time is possible, and that many farmers who want to use fertilizer do not end up doing it if
they don’t buy it at harvest time. This will tell us whether the only role of the SAFI program is to
remind farmers of their time inconsistency problem: if the reminder intervention is as effective as
SAFI, it will suggest that the main effect of SAFI is to remind people to act now and get fertilizer
before they have postponed it long enough that they do not have resources for it anymore.
D. Conclusion
The problem of fertilizer adoption is both important in itself and because it embodies all the
problems of technology adoption that we encounter in developing countries: from computers, to
deworming drugs, to condoms. We have set up a series of randomized experiment to try to
understand the determinants of fertilizer adoption. We conclude that while information matters, it
only goes part of the way, and whatever information is provided seems to be forgotten fast and
not diffused to friends and neighbors in the mean time. Other things seem important as well, in
particular the ability to finance the purchase of fertilizer, which for many farmers, is synonymous
with the ability to buy fertilizer at the time of harvest. We have seen that if farmers are offered to
buy fertilizer at the time of harvest, many do, and this lead to substantial increases in adoption.
20
We are still to resolve why they do not do it themselves, and why the market is not proactively
seeking this opportunity.
REFERENCES Ashraf, Nava, Dean S. Karlan, and Wesley Yin (2004). "Tying Odysseus to the Mast: Evidence
from a Commitment Savings Product in the Philippines," mimeo, Princeton University. Besley, Timothy and Anne Case (1993), “Modeling Technology Adoption in Developing
Countries,” American Economic Review, 83 (2): 396-402. Binswanger, Hans and Prabhu Pingali (1998), “Technological Priorities for Farming in Sub-
Saharan Africa.” World Bank Research Observer, 3 (1), pp. 81-98. Byerlee, Derek and Carl K. Eicher (editors) (1997), Africa’s Emerging Maize Revolution.
Boulder, CO: Lynne Rienner Publishers. Conley, Timothy and Christopher Udry (2005), "Learning About a New Technology: Pineapple
in Ghana," Yale Economic Growth Center Discussion Paper: 817. Hassan, Rashid. M. (editor) (1998), Maize Technology Development and Transfer: A GIS
application for research planning in Kenya. Hassan, Rashid M. and Daniel D. Karanja (1997), "Increasing Maize Production in Kenya:
Technology, Institutions, and Policy." In Africa's Emerging Maize Revolution edited by Derek Byerlee and Carl K. Eicher. Boulder, CO: Lynne Rienner Publishers.
Jovanovic, Boyan and Yaw Nyarko (1996), "Learning by Doing and the Choice of Technology,"
Econometrica 64(6), pp. 1299-1310. Manski, Charles (1993), "Identification of Exogenous Social Effects: The Reflection Problem,"
Review of Economic Studies 60, pp. 531-542. Munshi, Kaivan (2004), "Social Learning in a Heterogeneous Population: Technology Diffusion
in the Indian Green Revolution," Journal of Development Economics 73(1), pp. 185-213. Viyas, V.S. (1983), “Asian Agriculture: Achievements And Challenges,” Asian Development
Review 1 (1), pp; 27-44. Voortman, R. L., B. G. J. S. Sonneveld and M. A. Keyzer (2000), "African Land Ecology:
Opportunities and Constraints for Agricultural Development," CID Working Paper No. 37, Explaining African Economic Growth Performance Conference Series.
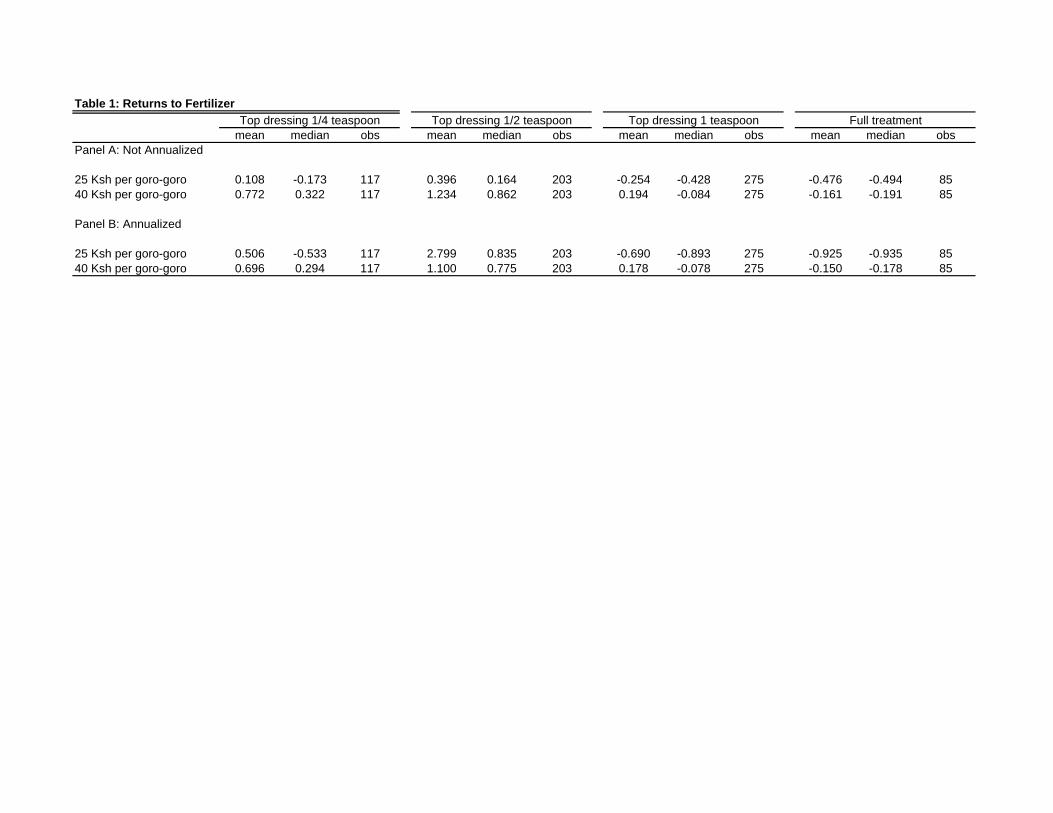
Table 1: Returns to Fertilizer
mean median obs mean median obs mean median obs mean median obsPanel A: Not Annualized
25 Ksh per goro-goro 0.108 -0.173 117 0.396 0.164 203 -0.254 -0.428 275 -0.476 -0.494 8540 Ksh per goro-goro 0.772 0.322 117 1.234 0.862 203 0.194 -0.084 275 -0.161 -0.191 85
Panel B: Annualized
25 Ksh per goro-goro 0.506 -0.533 117 2.799 0.835 203 -0.690 -0.893 275 -0.925 -0.935 8540 Ksh per goro-goro 0.696 0.294 117 1.100 0.775 203 0.178 -0.078 275 -0.150 -0.178 85
Top dressing 1/4 teaspoon Top dressing 1/2 teaspoon Top dressing 1 teaspoon Full treatment

Table 2: Adoption for Farmers Participating in Demonstration Plot
Panel A. All Farmers (1) (2) (3) (4) (5) (6) (7) (8) (9) (10)fertilizer any treatment fertilizer any treatment fertilizer any treatment fertilizer any treatment fertilizer any treatment
Demonstration Plot Farmer 0.107 0.107 0.089 0.061 0.101 0.06 0.156 0.118 0.229 0.258(0.039)*** (0.042)** (0.044)** (0.046) (0.050)** (0.054) (0.089)* (0.098) (0.093)** (0.100)**
Observations 580 577 523 521 450 447 116 116 109 109
Panel B. Only Farmers with at least 3 seasons of Adoption Data(1) (2) (3) (4) (5) (6)
fertilizer any treatment fertilizer any treatment fertilizer any treatmentDemonstration Plot Farmer 0.169 0.172 0.113 0.065 0.112 0.079
(0.050)*** (0.056)*** (0.054)** (0.059) (0.054)** (0.060)Observations 371 364 371 364 371 364Standard errors in parentheses* significant at 10%; ** significant at 5%; *** significant at 1%Regressions control for school.
5 seasons later1 season later 2 seasons later 3 seasons later 4 seasons later
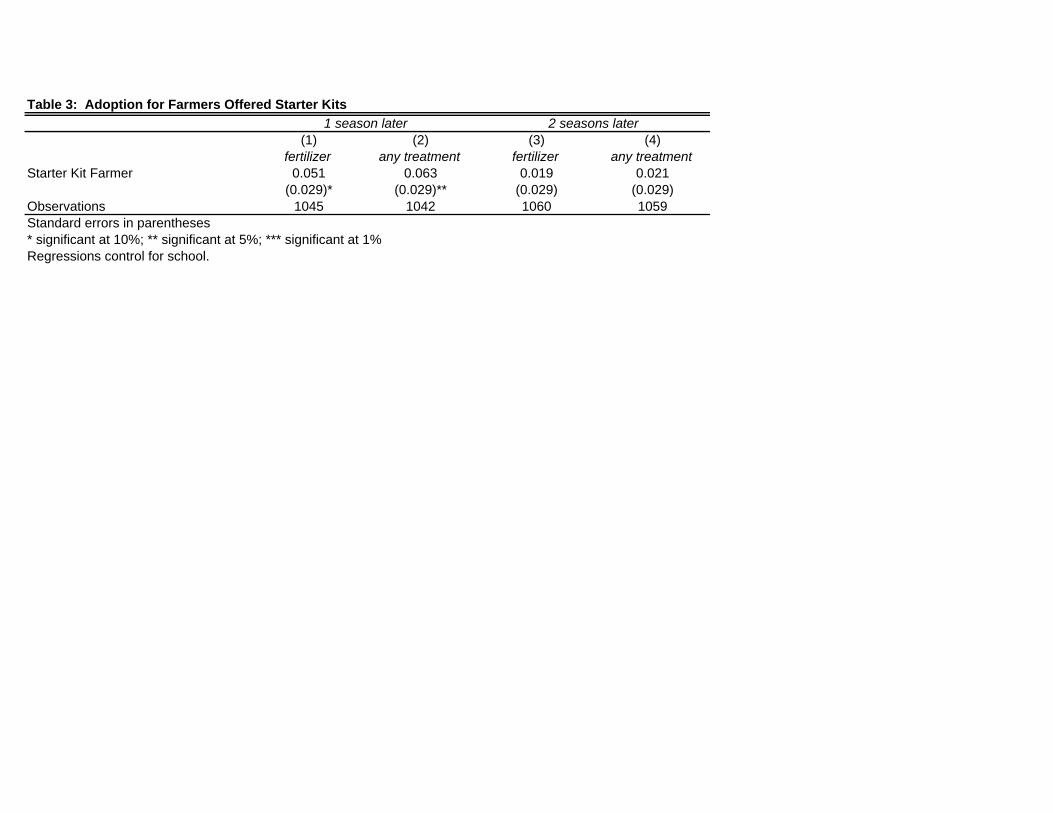
Table 3: Adoption for Farmers Offered Starter Kits
(1) (2) (3) (4)fertilizer any treatment fertilizer any treatment
Starter Kit Farmer 0.051 0.063 0.019 0.021(0.029)* (0.029)** (0.029) (0.029)
Observations 1045 1042 1060 1059Standard errors in parentheses* significant at 10%; ** significant at 5%; *** significant at 1%Regressions control for school.
1 season later 2 seasons later

Table 4: Adoption for Agricultural Contacts
Panel A. OLS (1) (2) (3) (4) (5) (6) (7) (8) (9) (10)fertilizer any treatment fertilizer any treatment fertilizer any treatment fertilizer any treatment fertilizer any treatment
Invited Agricultural Contact 0.093 0.103 0.031 0.054 -0.014 -0.022 -0.059 -0.05 0.026 0.048(0.055)* (0.059)* (0.061) (0.065) (0.058) (0.064) (0.063) (0.068) (0.068) (0.075)
Uninvited Agricultural Contact 0.002 -0.042 -0.015 -0.004 -0.015 -0.013 -0.08 -0.051 -0.132 -0.184(0.035) (0.038) (0.038) (0.041) (0.037) (0.040) (0.068) (0.073) (0.089) (0.097)*
Observations 708 706 580 580 557 556 215 215 177 176
B. Panel B: 2SLS (1) (2) (3) (4) (5) (6) (7) (8) (9) (10)fertilizer any treatment fertilizer any treatment fertilizer any treatment fertilizer any treatment fertilizer any treatment
Came to Treatment (instrumented 0.212 0.236 0.072 0.126 -0.03 -0.049 -0.123 -0.104 0.053 0.094 with Invited Agricultural Contact) (0.127)* (0.138)* (0.142) (0.151) (0.129) (0.141) (0.133) (0.142) (0.137) (0.150)Uninvited Agricultural Contact -0.002 -0.047 -0.017 -0.007 -0.014 -0.012 -0.082 -0.053 -0.131 -0.182
(0.037) (0.040) (0.039) (0.042) (0.037) (0.041) (0.068) (0.072) (0.088) (0.098)*Observations 708 706 580 580 557 556 215 215 177 176Standard errors in parentheses* significant at 10%; ** significant at 5%; *** significant at 1%Regressions control for school.
5 seasons later1 season later 2 seasons later 3 seasons later 4 seasons later
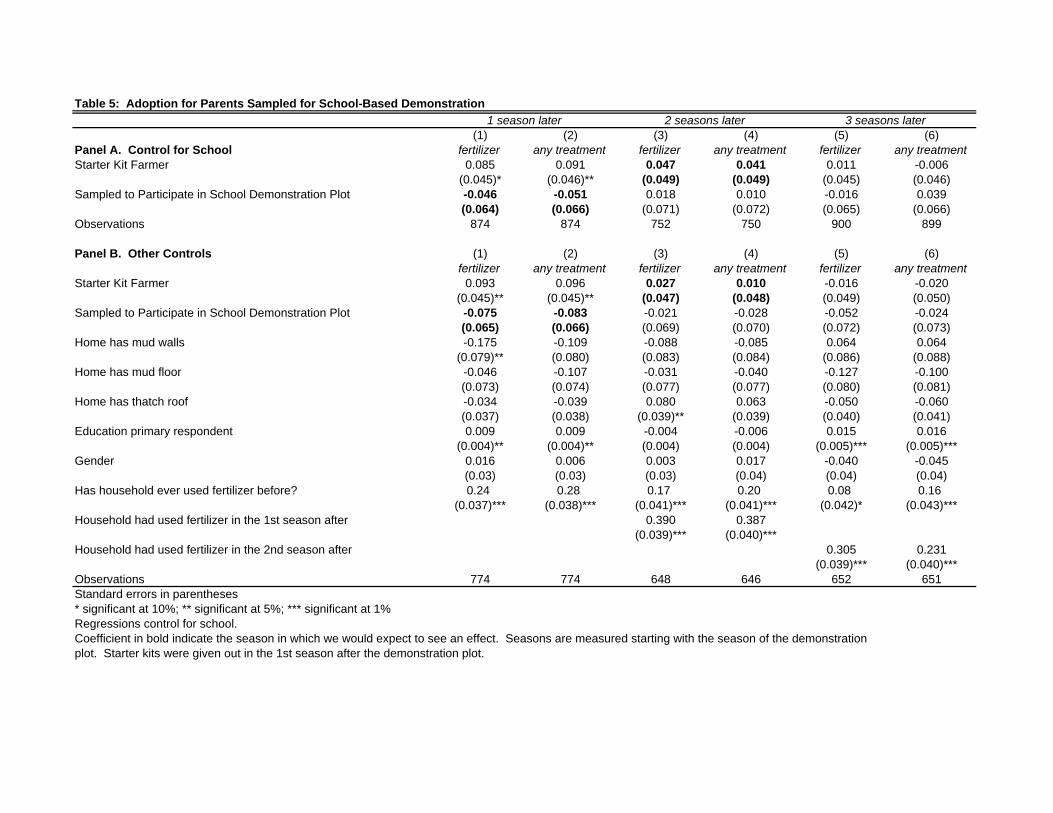
Table 5: Adoption for Parents Sampled for School-Based Demonstration
(1) (2) (3) (4) (5) (6)Panel A. Control for School fertilizer any treatment fertilizer any treatment fertilizer any treatmentStarter Kit Farmer 0.085 0.091 0.047 0.041 0.011 -0.006
(0.045)* (0.046)** (0.049) (0.049) (0.045) (0.046)Sampled to Participate in School Demonstration Plot -0.046 -0.051 0.018 0.010 -0.016 0.039
(0.064) (0.066) (0.071) (0.072) (0.065) (0.066)Observations 874 874 752 750 900 899
Panel B. Other Controls (1) (2) (3) (4) (5) (6)fertilizer any treatment fertilizer any treatment fertilizer any treatment
Starter Kit Farmer 0.093 0.096 0.027 0.010 -0.016 -0.020(0.045)** (0.045)** (0.047) (0.048) (0.049) (0.050)
Sampled to Participate in School Demonstration Plot -0.075 -0.083 -0.021 -0.028 -0.052 -0.024(0.065) (0.066) (0.069) (0.070) (0.072) (0.073)
Home has mud walls -0.175 -0.109 -0.088 -0.085 0.064 0.064(0.079)** (0.080) (0.083) (0.084) (0.086) (0.088)
Home has mud floor -0.046 -0.107 -0.031 -0.040 -0.127 -0.100(0.073) (0.074) (0.077) (0.077) (0.080) (0.081)
Home has thatch roof -0.034 -0.039 0.080 0.063 -0.050 -0.060(0.037) (0.038) (0.039)** (0.039) (0.040) (0.041)
Education primary respondent 0.009 0.009 -0.004 -0.006 0.015 0.016(0.004)** (0.004)** (0.004) (0.004) (0.005)*** (0.005)***
Gender 0.016 0.006 0.003 0.017 -0.040 -0.045(0.03) (0.03) (0.03) (0.04) (0.04) (0.04)
Has household ever used fertilizer before? 0.24 0.28 0.17 0.20 0.08 0.16(0.037)*** (0.038)*** (0.041)*** (0.041)*** (0.042)* (0.043)***
Household had used fertilizer in the 1st season after 0.390 0.387(0.039)*** (0.040)***
Household had used fertilizer in the 2nd season after 0.305 0.231(0.039)*** (0.040)***
Observations 774 774 648 646 652 651Standard errors in parentheses* significant at 10%; ** significant at 5%; *** significant at 1%Regressions control for school.Coefficient in bold indicate the season in which we would expect to see an effect. Seasons are measured starting with the season of the demonstrationplot. Starter kits were given out in the 1st season after the demonstration plot.
1 season later 2 seasons later 3 seasons later
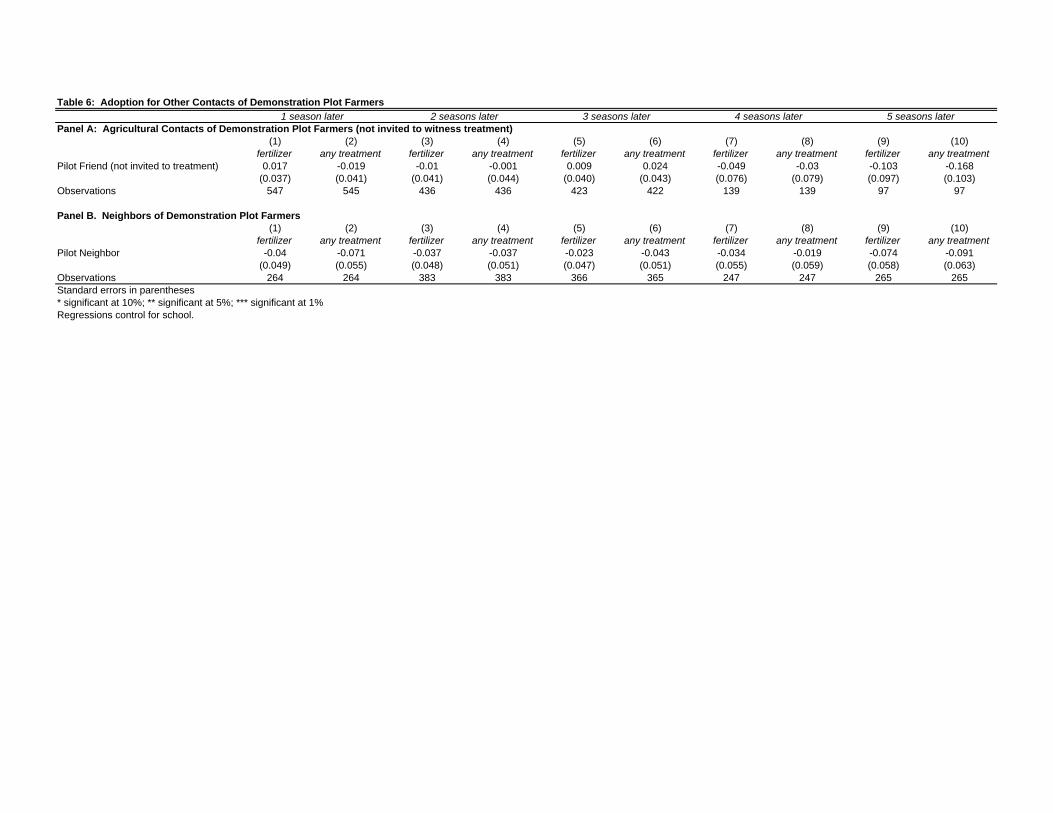
Table 6: Adoption for Other Contacts of Demonstration Plot Farmers
Panel A: Agricultural Contacts of Demonstration Plot Farmers (not invited to witness treatment)(1) (2) (3) (4) (5) (6) (7) (8) (9) (10)
fertilizer any treatment fertilizer any treatment fertilizer any treatment fertilizer any treatment fertilizer any treatmentPilot Friend (not invited to treatment) 0.017 -0.019 -0.01 -0.001 0.009 0.024 -0.049 -0.03 -0.103 -0.168
(0.037) (0.041) (0.041) (0.044) (0.040) (0.043) (0.076) (0.079) (0.097) (0.103)Observations 547 545 436 436 423 422 139 139 97 97
Panel B. Neighbors of Demonstration Plot Farmers(1) (2) (3) (4) (5) (6) (7) (8) (9) (10)
fertilizer any treatment fertilizer any treatment fertilizer any treatment fertilizer any treatment fertilizer any treatmentPilot Neighbor -0.04 -0.071 -0.037 -0.037 -0.023 -0.043 -0.034 -0.019 -0.074 -0.091
(0.049) (0.055) (0.048) (0.051) (0.047) (0.051) (0.055) (0.059) (0.058) (0.063)Observations 264 264 383 383 366 365 247 247 265 265Standard errors in parentheses* significant at 10%; ** significant at 5%; *** significant at 1%Regressions control for school.
5 seasons later1 season later 2 seasons later 3 seasons later 4 seasons later
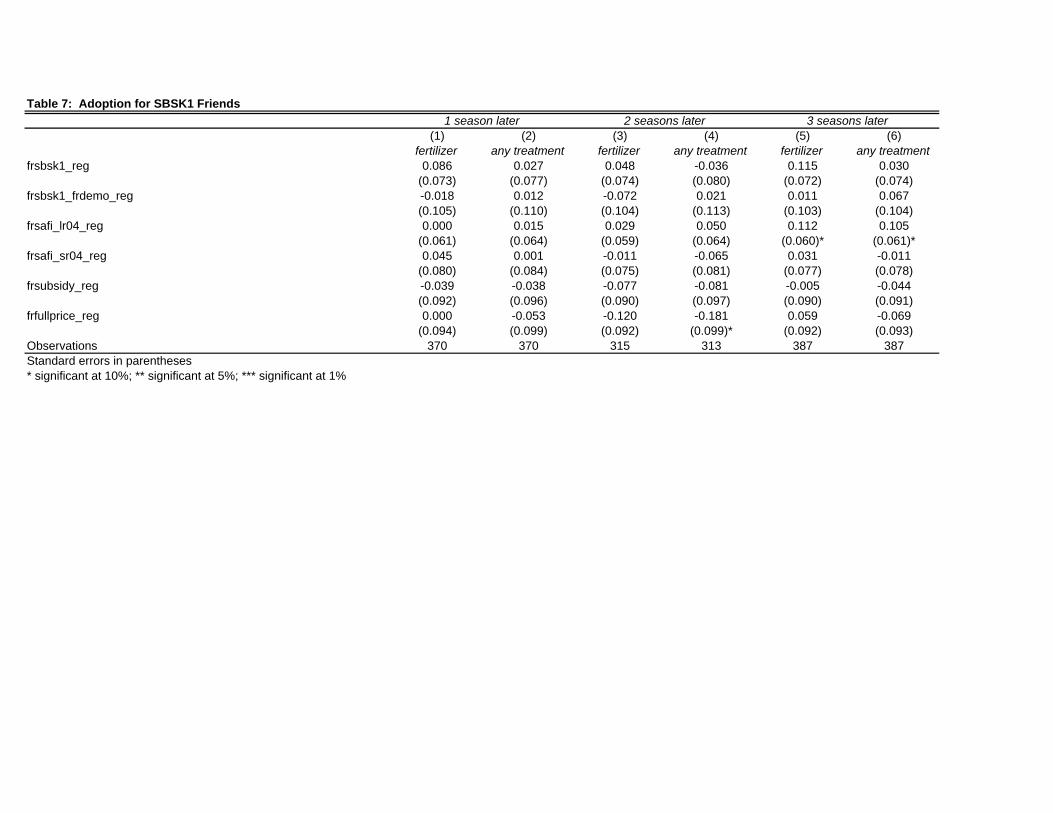
Table 7: Adoption for SBSK1 Friends
(1) (2) (3) (4) (5) (6)fertilizer any treatment fertilizer any treatment fertilizer any treatment
frsbsk1_reg 0.086 0.027 0.048 -0.036 0.115 0.030(0.073) (0.077) (0.074) (0.080) (0.072) (0.074)
frsbsk1_frdemo_reg -0.018 0.012 -0.072 0.021 0.011 0.067(0.105) (0.110) (0.104) (0.113) (0.103) (0.104)
frsafi_lr04_reg 0.000 0.015 0.029 0.050 0.112 0.105(0.061) (0.064) (0.059) (0.064) (0.060)* (0.061)*
frsafi_sr04_reg 0.045 0.001 -0.011 -0.065 0.031 -0.011(0.080) (0.084) (0.075) (0.081) (0.077) (0.078)
frsubsidy_reg -0.039 -0.038 -0.077 -0.081 -0.005 -0.044(0.092) (0.096) (0.090) (0.097) (0.090) (0.091)
frfullprice_reg 0.000 -0.053 -0.120 -0.181 0.059 -0.069(0.094) (0.099) (0.092) (0.099)* (0.092) (0.093)
Observations 370 370 315 313 387 387Standard errors in parentheses* significant at 10%; ** significant at 5%; *** significant at 1%
1 season later 2 seasons later 3 seasons later

Table 8: Take-up of Various Commitment Savings Products (SAFI Program)
Panel A. Pilot SAFI Programs Number of Farmers Percentageoption 1: take-it-or-leave-it Offered SAFI 54
Initially accepted 30 0.556Actually paid 30 0.556
option 2: take-it-or-leave-it offered SAFI 49 (with cash effect) initially accepted 39 0.796
actually paid 39 0.796
option 3: return in a few days offered SAFI 50 to collect the money initially accepted 35 0.700
actually paid 15 0.300
option 4: return in a few months offered SAFI 71 to collect the money initially accepted 44 0.620
actually paid 12 0.169
Panel B. School Based SAFI Program
Number of Farmers PercentageSAFI Long Rains 2004 Bought Fertilizer 74 0.306
Didn't buy Fertilizer 168 0.694
SAFI Short Rains 2004
Given Choice X Bought Maize Bought Fertilizer 19 0.322Didn't buy Fertilizer 40 0.678
Given Choice X Didn't Buy Maize Bought Fertilizer 66 0.440Didn't buy Fertilizer 84 0.560
Not Given Choice X Bought Maize Bought Fertilizer 24 0.414Didn't buy Fertilizer 34 0.586
Not Given Choice X Didn't Buy Maize Bought Fertilizer 57 0.380Didn't buy Fertilizer 93 0.620
Total Bought Fertilizer 166 0.398Didn't buy Fertilizer 251 0.602
Subsidy Short Rains 2004 Bought Fertilizer 67 0.462Didn't buy Fertilizer 78 0.538
Full Price Visit Short Rains 2004 Bought Fertilizer 28 0.196Didn't buy Fertilizer 115 0.804
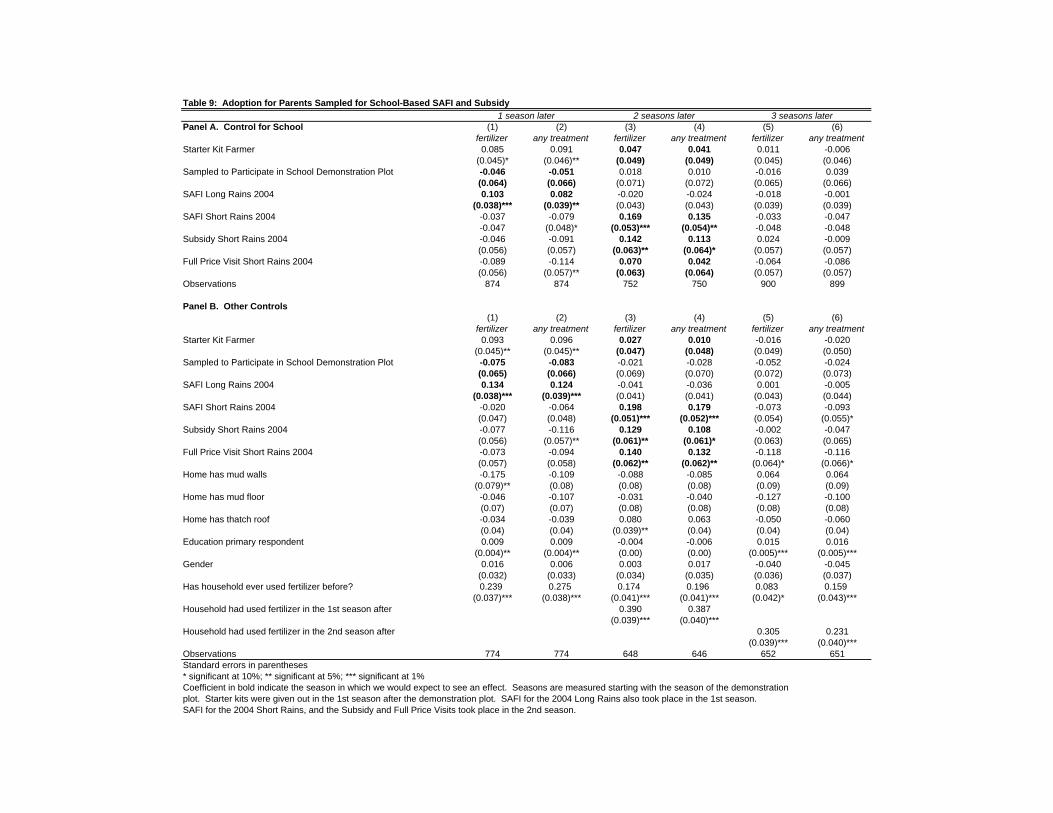
Table 9: Adoption for Parents Sampled for School-Based SAFI and Subsidy
Panel A. Control for School (1) (2) (3) (4) (5) (6)fertilizer any treatment fertilizer any treatment fertilizer any treatment
Starter Kit Farmer 0.085 0.091 0.047 0.041 0.011 -0.006(0.045)* (0.046)** (0.049) (0.049) (0.045) (0.046)
Sampled to Participate in School Demonstration Plot -0.046 -0.051 0.018 0.010 -0.016 0.039(0.064) (0.066) (0.071) (0.072) (0.065) (0.066)
SAFI Long Rains 2004 0.103 0.082 -0.020 -0.024 -0.018 -0.001(0.038)*** (0.039)** (0.043) (0.043) (0.039) (0.039)
SAFI Short Rains 2004 -0.037 -0.079 0.169 0.135 -0.033 -0.047-0.047 (0.048)* (0.053)*** (0.054)** -0.048 -0.048
Subsidy Short Rains 2004 -0.046 -0.091 0.142 0.113 0.024 -0.009(0.056) (0.057) (0.063)** (0.064)* (0.057) (0.057)
Full Price Visit Short Rains 2004 -0.089 -0.114 0.070 0.042 -0.064 -0.086(0.056) (0.057)** (0.063) (0.064) (0.057) (0.057)
Observations 874 874 752 750 900 899
Panel B. Other Controls(1) (2) (3) (4) (5) (6)
fertilizer any treatment fertilizer any treatment fertilizer any treatmentStarter Kit Farmer 0.093 0.096 0.027 0.010 -0.016 -0.020
(0.045)** (0.045)** (0.047) (0.048) (0.049) (0.050)Sampled to Participate in School Demonstration Plot -0.075 -0.083 -0.021 -0.028 -0.052 -0.024
(0.065) (0.066) (0.069) (0.070) (0.072) (0.073)SAFI Long Rains 2004 0.134 0.124 -0.041 -0.036 0.001 -0.005
(0.038)*** (0.039)*** (0.041) (0.041) (0.043) (0.044)SAFI Short Rains 2004 -0.020 -0.064 0.198 0.179 -0.073 -0.093
(0.047) (0.048) (0.051)*** (0.052)*** (0.054) (0.055)*Subsidy Short Rains 2004 -0.077 -0.116 0.129 0.108 -0.002 -0.047
(0.056) (0.057)** (0.061)** (0.061)* (0.063) (0.065)Full Price Visit Short Rains 2004 -0.073 -0.094 0.140 0.132 -0.118 -0.116
(0.057) (0.058) (0.062)** (0.062)** (0.064)* (0.066)*Home has mud walls -0.175 -0.109 -0.088 -0.085 0.064 0.064
(0.079)** (0.08) (0.08) (0.08) (0.09) (0.09)Home has mud floor -0.046 -0.107 -0.031 -0.040 -0.127 -0.100
(0.07) (0.07) (0.08) (0.08) (0.08) (0.08)Home has thatch roof -0.034 -0.039 0.080 0.063 -0.050 -0.060
(0.04) (0.04) (0.039)** (0.04) (0.04) (0.04)Education primary respondent 0.009 0.009 -0.004 -0.006 0.015 0.016
(0.004)** (0.004)** (0.00) (0.00) (0.005)*** (0.005)***Gender 0.016 0.006 0.003 0.017 -0.040 -0.045
(0.032) (0.033) (0.034) (0.035) (0.036) (0.037)Has household ever used fertilizer before? 0.239 0.275 0.174 0.196 0.083 0.159
(0.037)*** (0.038)*** (0.041)*** (0.041)*** (0.042)* (0.043)***Household had used fertilizer in the 1st season after 0.390 0.387
(0.039)*** (0.040)***Household had used fertilizer in the 2nd season after 0.305 0.231
(0.039)*** (0.040)***Observations 774 774 648 646 652 651Standard errors in parentheses* significant at 10%; ** significant at 5%; *** significant at 1%Coefficient in bold indicate the season in which we would expect to see an effect. Seasons are measured starting with the season of the demonstrationplot. Starter kits were given out in the 1st season after the demonstration plot. SAFI for the 2004 Long Rains also took place in the 1st season.SAFI for the 2004 Short Rains, and the Subsidy and Full Price Visits took place in the 2nd season.
1 season later 2 seasons later 3 seasons later
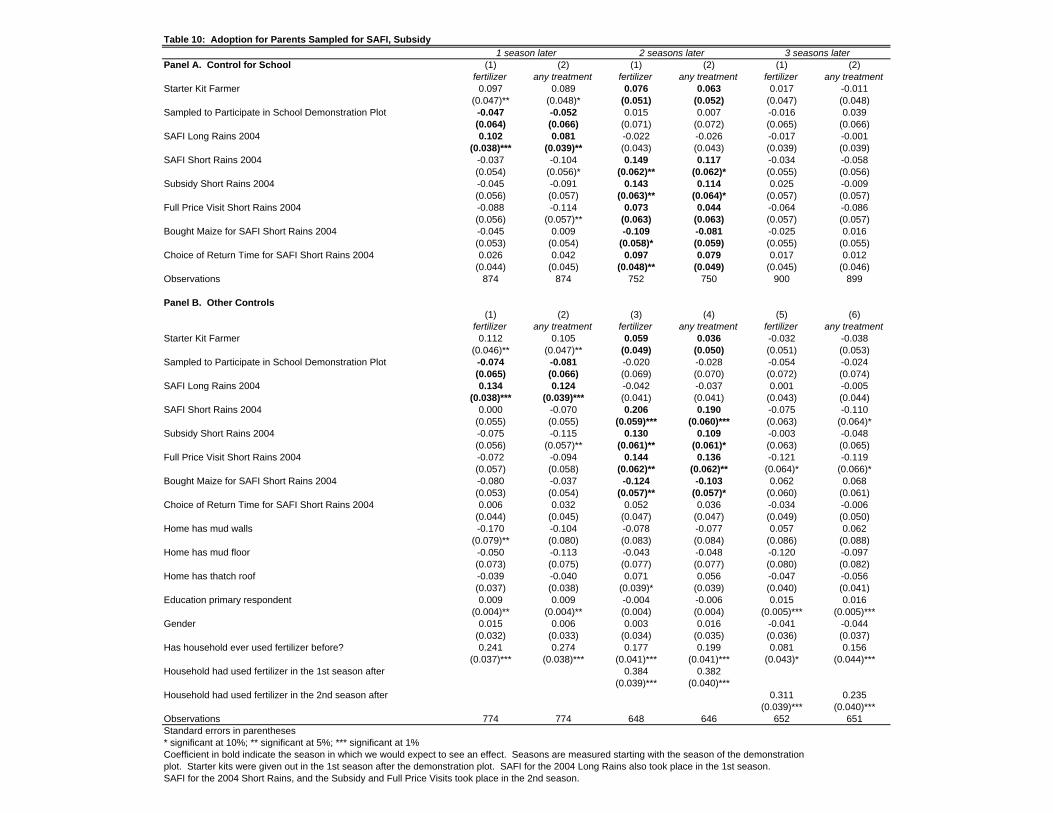
Table 10: Adoption for Parents Sampled for SAFI, Subsidy
Panel A. Control for School (1) (2) (1) (2) (1) (2)fertilizer any treatment fertilizer any treatment fertilizer any treatment
Starter Kit Farmer 0.097 0.089 0.076 0.063 0.017 -0.011(0.047)** (0.048)* (0.051) (0.052) (0.047) (0.048)
Sampled to Participate in School Demonstration Plot -0.047 -0.052 0.015 0.007 -0.016 0.039(0.064) (0.066) (0.071) (0.072) (0.065) (0.066)
SAFI Long Rains 2004 0.102 0.081 -0.022 -0.026 -0.017 -0.001(0.038)*** (0.039)** (0.043) (0.043) (0.039) (0.039)
SAFI Short Rains 2004 -0.037 -0.104 0.149 0.117 -0.034 -0.058(0.054) (0.056)* (0.062)** (0.062)* (0.055) (0.056)
Subsidy Short Rains 2004 -0.045 -0.091 0.143 0.114 0.025 -0.009(0.056) (0.057) (0.063)** (0.064)* (0.057) (0.057)
Full Price Visit Short Rains 2004 -0.088 -0.114 0.073 0.044 -0.064 -0.086(0.056) (0.057)** (0.063) (0.063) (0.057) (0.057)
Bought Maize for SAFI Short Rains 2004 -0.045 0.009 -0.109 -0.081 -0.025 0.016(0.053) (0.054) (0.058)* (0.059) (0.055) (0.055)
Choice of Return Time for SAFI Short Rains 2004 0.026 0.042 0.097 0.079 0.017 0.012(0.044) (0.045) (0.048)** (0.049) (0.045) (0.046)
Observations 874 874 752 750 900 899
Panel B. Other Controls(1) (2) (3) (4) (5) (6)
fertilizer any treatment fertilizer any treatment fertilizer any treatmentStarter Kit Farmer 0.112 0.105 0.059 0.036 -0.032 -0.038
(0.046)** (0.047)** (0.049) (0.050) (0.051) (0.053)Sampled to Participate in School Demonstration Plot -0.074 -0.081 -0.020 -0.028 -0.054 -0.024
(0.065) (0.066) (0.069) (0.070) (0.072) (0.074)SAFI Long Rains 2004 0.134 0.124 -0.042 -0.037 0.001 -0.005
(0.038)*** (0.039)*** (0.041) (0.041) (0.043) (0.044)SAFI Short Rains 2004 0.000 -0.070 0.206 0.190 -0.075 -0.110
(0.055) (0.055) (0.059)*** (0.060)*** (0.063) (0.064)*Subsidy Short Rains 2004 -0.075 -0.115 0.130 0.109 -0.003 -0.048
(0.056) (0.057)** (0.061)** (0.061)* (0.063) (0.065)Full Price Visit Short Rains 2004 -0.072 -0.094 0.144 0.136 -0.121 -0.119
(0.057) (0.058) (0.062)** (0.062)** (0.064)* (0.066)*Bought Maize for SAFI Short Rains 2004 -0.080 -0.037 -0.124 -0.103 0.062 0.068
(0.053) (0.054) (0.057)** (0.057)* (0.060) (0.061)Choice of Return Time for SAFI Short Rains 2004 0.006 0.032 0.052 0.036 -0.034 -0.006
(0.044) (0.045) (0.047) (0.047) (0.049) (0.050)Home has mud walls -0.170 -0.104 -0.078 -0.077 0.057 0.062
(0.079)** (0.080) (0.083) (0.084) (0.086) (0.088)Home has mud floor -0.050 -0.113 -0.043 -0.048 -0.120 -0.097
(0.073) (0.075) (0.077) (0.077) (0.080) (0.082)Home has thatch roof -0.039 -0.040 0.071 0.056 -0.047 -0.056
(0.037) (0.038) (0.039)* (0.039) (0.040) (0.041)Education primary respondent 0.009 0.009 -0.004 -0.006 0.015 0.016
(0.004)** (0.004)** (0.004) (0.004) (0.005)*** (0.005)***Gender 0.015 0.006 0.003 0.016 -0.041 -0.044
(0.032) (0.033) (0.034) (0.035) (0.036) (0.037)Has household ever used fertilizer before? 0.241 0.274 0.177 0.199 0.081 0.156
(0.037)*** (0.038)*** (0.041)*** (0.041)*** (0.043)* (0.044)***Household had used fertilizer in the 1st season after 0.384 0.382
(0.039)*** (0.040)***Household had used fertilizer in the 2nd season after 0.311 0.235
(0.039)*** (0.040)***Observations 774 774 648 646 652 651Standard errors in parentheses* significant at 10%; ** significant at 5%; *** significant at 1%Coefficient in bold indicate the season in which we would expect to see an effect. Seasons are measured starting with the season of the demonstrationplot. Starter kits were given out in the 1st season after the demonstration plot. SAFI for the 2004 Long Rains also took place in the 1st season.SAFI for the 2004 Short Rains, and the Subsidy and Full Price Visits took place in the 2nd season.
1 season later 2 seasons later 3 seasons later

Table 11: SAFI Reliabilities
Of those that bought fertilizer through Program:Reported Using Fertilizer in Survey 53 0.746 108 0.766 39 0.684 16 0.615Reported not Using Fertilizer in Survey 18 0.254 33 0.234 18 0.316 10 0.385
Of those that Reported Not Using Fertilizer in Survey:says bought from program 13 0.765 29 0.879 12 0.750 8 0.800says didn't buy from program 4 0.235 4 0.121 4 0.250 2 0.200
What did they do with fertilizer?1 - gave away / sold 0 0.000 1 0.036 0 0.000 0 0.0004 - fertilizer spoiled 2 0.125 1 0.036 2 0.167 0 0.0005 - used on different crop 1 0.063 7 0.250 0 0.000 1 0.1256 - kept for another season 1 0.063 9 0.321 1 0.083 2 0.2507 - used on different plot 0 0.000 2 0.071 1 0.083 1 0.1258 - used on maize crop 11 0.688 7 0.250 7 0.583 4 0.5009 - other 1 0.063 1 0.036 1 0.083 0 0.000
Long Rains 2004 Short Rains 2004SAFI SAFI
(4)(1) (2) (3)
Subsidy VisitShort Rains 2004
Full Price VisitShort Rains 2004
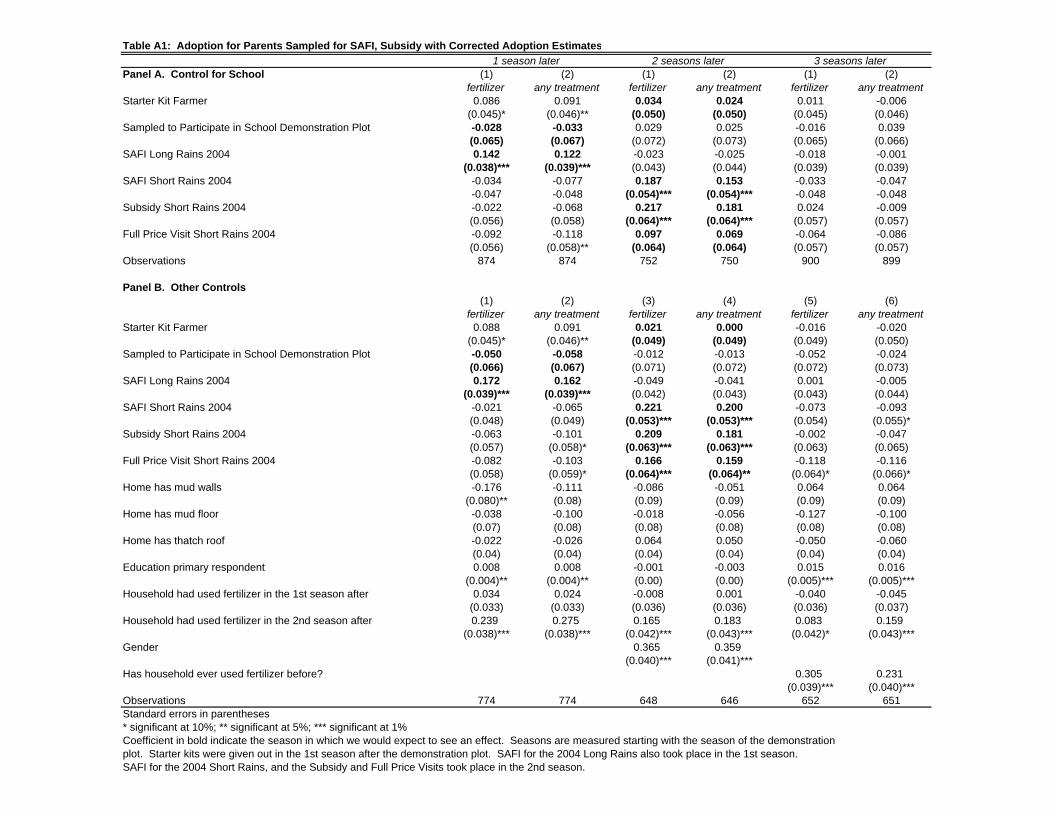
Table A1: Adoption for Parents Sampled for SAFI, Subsidy with Corrected Adoption Estimates
Panel A. Control for School (1) (2) (1) (2) (1) (2)fertilizer any treatment fertilizer any treatment fertilizer any treatment
Starter Kit Farmer 0.086 0.091 0.034 0.024 0.011 -0.006(0.045)* (0.046)** (0.050) (0.050) (0.045) (0.046)
Sampled to Participate in School Demonstration Plot -0.028 -0.033 0.029 0.025 -0.016 0.039(0.065) (0.067) (0.072) (0.073) (0.065) (0.066)
SAFI Long Rains 2004 0.142 0.122 -0.023 -0.025 -0.018 -0.001(0.038)*** (0.039)*** (0.043) (0.044) (0.039) (0.039)
SAFI Short Rains 2004 -0.034 -0.077 0.187 0.153 -0.033 -0.047-0.047 -0.048 (0.054)*** (0.054)*** -0.048 -0.048
Subsidy Short Rains 2004 -0.022 -0.068 0.217 0.181 0.024 -0.009(0.056) (0.058) (0.064)*** (0.064)*** (0.057) (0.057)
Full Price Visit Short Rains 2004 -0.092 -0.118 0.097 0.069 -0.064 -0.086(0.056) (0.058)** (0.064) (0.064) (0.057) (0.057)
Observations 874 874 752 750 900 899
Panel B. Other Controls(1) (2) (3) (4) (5) (6)
fertilizer any treatment fertilizer any treatment fertilizer any treatmentStarter Kit Farmer 0.088 0.091 0.021 0.000 -0.016 -0.020
(0.045)* (0.046)** (0.049) (0.049) (0.049) (0.050)Sampled to Participate in School Demonstration Plot -0.050 -0.058 -0.012 -0.013 -0.052 -0.024
(0.066) (0.067) (0.071) (0.072) (0.072) (0.073)SAFI Long Rains 2004 0.172 0.162 -0.049 -0.041 0.001 -0.005
(0.039)*** (0.039)*** (0.042) (0.043) (0.043) (0.044)SAFI Short Rains 2004 -0.021 -0.065 0.221 0.200 -0.073 -0.093
(0.048) (0.049) (0.053)*** (0.053)*** (0.054) (0.055)*Subsidy Short Rains 2004 -0.063 -0.101 0.209 0.181 -0.002 -0.047
(0.057) (0.058)* (0.063)*** (0.063)*** (0.063) (0.065)Full Price Visit Short Rains 2004 -0.082 -0.103 0.166 0.159 -0.118 -0.116
(0.058) (0.059)* (0.064)*** (0.064)** (0.064)* (0.066)*Home has mud walls -0.176 -0.111 -0.086 -0.051 0.064 0.064
(0.080)** (0.08) (0.09) (0.09) (0.09) (0.09)Home has mud floor -0.038 -0.100 -0.018 -0.056 -0.127 -0.100
(0.07) (0.08) (0.08) (0.08) (0.08) (0.08)Home has thatch roof -0.022 -0.026 0.064 0.050 -0.050 -0.060
(0.04) (0.04) (0.04) (0.04) (0.04) (0.04)Education primary respondent 0.008 0.008 -0.001 -0.003 0.015 0.016
(0.004)** (0.004)** (0.00) (0.00) (0.005)*** (0.005)***Household had used fertilizer in the 1st season after 0.034 0.024 -0.008 0.001 -0.040 -0.045
(0.033) (0.033) (0.036) (0.036) (0.036) (0.037)Household had used fertilizer in the 2nd season after 0.239 0.275 0.165 0.183 0.083 0.159
(0.038)*** (0.038)*** (0.042)*** (0.043)*** (0.042)* (0.043)***Gender 0.365 0.359
(0.040)*** (0.041)***Has household ever used fertilizer before? 0.305 0.231
(0.039)*** (0.040)***Observations 774 774 648 646 652 651Standard errors in parentheses* significant at 10%; ** significant at 5%; *** significant at 1%Coefficient in bold indicate the season in which we would expect to see an effect. Seasons are measured starting with the season of the demonstrationplot. Starter kits were given out in the 1st season after the demonstration plot. SAFI for the 2004 Long Rains also took place in the 1st season.SAFI for the 2004 Short Rains, and the Subsidy and Full Price Visits took place in the 2nd season.
1 season later 2 seasons later 3 seasons later