using adoption and perceived characteristics of fertilizer
TRANSCRIPT

Journal of Agricultural Education, 60(3), 155-172 https://doi.org/10.5032/jae.2019.03155
Journal of Agricultural Education Volume 60, Issue 3, 2019 155
Using Adoption and Perceived Characteristics of Fertilizer Innovations to Identify Extension Educational Needs of Florida’s Residential Audiences Laura A. Warner1, Colby J. Silvert2, and Matt Benge3
Abstract
The objective in this study was to explore factors that shape how residents manage their home landscapes, and we applied Rogers’ (2003) Diffusion of Innovations to understand fertilizer practices and implications for Extension programming to address non-point source pollution. Data were drawn from a statewide survey of 1,197 Floridians. We identified the extent to which Floridians were using 10 residential fertilizer best practices, how Floridians’ perceived characteristics of fertilizer innovations related to adoption, and evaluated how the educational needs pertaining to fertilizer use differed among non-innovative and innovative individuals. Respondents were most engaged in practices such as reading fertilizer packages and labels to apply the correct amount and least engaged in soil testing to inform fertilizer applications as well as asking their landscape professional about training. Floridians perceived the five characteristics of fertilizer best practices at a moderate level overall, and of these, characteristics, compatibility, trialability, and relative advantage predicted adoption. Innovative individuals were more interested in learning from colleagues, neighbors, and public organizations such as Cooperative Extension and government organizations. They were also more interested in learning by visiting an Extension office or through social media than those who were non-innovative. This study may inform policy-making such as local landscape ordinances and planning of Extension behavior change programs.
Keywords: diffusion of innovations; extension audience needs; fertilizer best practices; water quality protection
Introduction
Lawncare in the United States is a multi-billion dollar industry (Jenkins, 1994), and numerous environmental and social benefits are associated with residential turfgrass lawns, such as carbon sequestration, urban heat dissipation, and social cohesion (Beard & Green, 1994; Blaine, Clayton, Robbins, & Parwinder, 2012). However, residents use over three times more chemicals than agricultural producers in an equal area of managed land (Robbins & Birkenholtz, 2003). Without proper application of fertilizers and management of turfgrass systems, residential landscape practices may exacerbate pollution in inland and coastal waters (Hochmuth, Nell, Unruh, Trenholm, & Sartain, 2012; Shuman, 2002). Extension professionals working in this area need both up-to-date technical information about fertilizer and landscape practices and a deep understanding of the target audience’s educational needs.
1 Laura A. Warner is an Associate Professor of Extension Education in the Department of Agricultural Education and Communication and the Center for Landscape Conservation and Ecology at the University of Florida, PO Box 112060, Gainesville, FL, 32611, [email protected].
2 Colby J. Silvert is a Graduate Student of Extension Education in the Department of Agricultural Education and Communication at the University of Florida, PO Box 110540, Gainesville, FL, 32611, [email protected].
3 Matt Benge is an Extension Assistant Professor of Extension Education in the Department of Agricultural Education and Communication at the University of Florida, 126B Bryant Hall, Gainesville, FL 32611, [email protected].

Warner, Silvert, and Benge Using Adoption and Perceived…
Journal of Agricultural Education Volume 60, Issue 3, 2019 156
Nonpoint source (NPS) pollution originates from multiple diffuse sources and can negatively affect urban watersheds, drinking water, recreation, fisheries, and wildlife (Law, Band, & Groove, 2004; Environmental Protection Agency, 2017). Excessive nutrient concentrations in fresh or coastal bodies of water, known as eutrophication, originating from human activities can lead to severe environmental issues (Selman & Greenhaugh, 2010). In Florida, water quality issues present both environmental and economic concerns and they have diminished the northwestern coast’s local commerce more than any other environmental event (Larkin & Adams, 2007). While extensive research has focused on agricultural sources of NPS water contamination, less is understood about residential practices and impacts on urban watershed quality (Hochmuth et al., 2012; Wollheim, Pellerin, Vörösmarty, & Hopkinson, 2005).
Nitrogen and Phosphorus are common nutrients in synthetic lawn fertilizers (Cheng,
Richmond, Salminen, & Grewal, 2008; Fissore et al., 2011; Law et al., 2004) that may contribute to surface- and groundwater degradation (Hobbs et al., 2017). Groundwater nitrate levels can be higher in residential areas where the majority of residents applied fertilizer to their lawns compared to undeveloped areas (Tucker, Diblin, Mattson, Hicks, & Wang, 2014). The connection between residents’ landscape behaviors and eutrophication is a major concern in Florida, especially following major water quality issues in 2005 and 2006 (Florida Department of Agriculture and Consumer Services, 2008; Hartman, Alcock, & Pettit, 2008).
Using fertilizers properly can be difficult for a number of reasons. Soil nutritional needs
are seasonally variable due to fluctuations in soil nutrient content and seasonal heavy rains (Gold et al., 1990; Liu, Hull, & Duff, 1997; Miltner, Branham, Paul, & Rieke, 1996; Tampa Bay Estuary Program, 2015). Appropriate fertilizer rates and timing are critical to prevent nutrient losses from lawns (Soldat & Petrovic, 2008). Soil testing may determine whether additional P is needed or if existing levels are adequate (Sartain, 2007). Nutrient losses can be reduced by using slow-release fertilizers, enhanced irrigation management, and improvement of soil’s nutrient and water holding capacities (Soldat & Petrovic, 2008).
Kirkpatrick et al. (2017) conducted a study with 305 highly-educated older Florida
residents. The findings illustrated residents lacked knowledge about the rationale for local fertilizer ordinances and whether they would prevent water quality issues. Eisenhauer, Brehm, Stevenson, and Peterson (2016) called for outreach for residents’ behavior change in the landscape to go beyond the dissemination of information. Convincing people to adopt new ideas or behaviors is challenging, even when the advantages of adoption seem obvious (Rogers, 2003). Importantly, planning an impactful Extension program that leads to behavior change is reliant on the development and use of a needs assessment to understand client needs, so appropriate program content and delivery methods can be used (McCaslin & Tibezinda, 1997; Rumble, Lamm & Gay, 2018). For this reason, understanding residents’ decision-making, motivations, and educational needs pertaining to fertilizer best management practices (BMPs) is important to discourage improper fertilizer application and nutrient losses.
Theoretical Framework
Neighborhood social norms and regulations may influence the diffusion of residents’ lawn and landscape behaviors and lead to the application of excessive amounts of fertilizer (Fraser, Bazuin, Band, & Grove, 2013; Henderson, Perkins, & Nelischer, 1998). Therefore, policies and efforts to promote change should be grounded in understanding how social cohesion and norms impact the exchange of information and persuasion of individuals. The Diffusion of Innovations (DOI) theory provides a way to examine the characteristics of a target population and social system to optimize the rate of diffusion of new behaviors (Rogers, 2003). DOI posits that an innovation, such as a research-based fertilizer BMPs, may be disseminated through a social system.
The DOI theory suggests that innovations are communicated over time among members of
a social system by the process of diffusion. An innovation according to DOI may be an idea,

Warner, Silvert, and Benge Using Adoption and Perceived…
Journal of Agricultural Education Volume 60, Issue 3, 2019 157
behavior, or object that is perceived as new. Newness is therefore not determined by the amount of time since the innovation’s invention, and a previously adopted practice for one group may be an innovation to a group of potential new adopters (Rogers, 2003).
Rogers (2003) claimed that an innovation’s rate of adoption is determined by five
characteristics of the innovation: its relative advantage, compatibility, complexity, trialability, and observability. In addition, other factors influencing the adoption rate include the types of channels through which information and ideas are communicated, the social system and degree of interconnectedness, and efforts by change agents. DOI purports that in a social system, individuals adopt an innovation at different times, but in a sequence. Based on when individuals begin using an innovation, they belong to one of five adopter categories defined by their level of innovativeness: innovators, early adopters, early majority, late majority, and laggards (see Table 1).
Table 1
Diffusion of Innovations Adopter Categories Adopter Category
Innovators Early Adopters
Early Majority
Late Majority Laggards
Percentage of population (%)
2.5% 13.5% 34% 34% 16%
General attributes
Interested in new ideas regardless of risks and uncertainty; seen as outsiders in social circles; have plentiful resources
Trendsetters and opinion leaders; influential in social circles; source of advice and information for potential new adopters
Pragmatic; adopt right before the average member of the population; they are a link between very early and later adopter categories
Adopt just after the average population member; high uncertainty and risk perception of adoption; resource-limited
Disconnected from local social network; hold traditional values; wary of innovations and change agents; may never adopt unless required; few economic resources
Note. Adapted from Diffusion of Innovations (3rd ed.), by E. M. Rogers, 2003, New York: Simon and Schuster.
Adopter categories can be used to research the needs of Extension clientele, and perhaps
this approach is underused. A study comparing adopters and nonadopters of pre-sidedress nitrogen tests revealed a number of differences that could guide Extension programming for farmers (King & Rollins, 1995). For example, adopters had more positive attitudes about the tests, revealing negative attitudes might serve as a barrier to adoption.
In addition to the adopter category, an understanding of the perceived characteristics of
fertilizer BMP innovations can illuminate adoption processes among Extension audiences. These characteristics are relative advantage, compatibility, complexity, observability, and trialability (Rogers, 2003). Relative advantage can be understood as whether individuals perceive fertilizer BMPs to be better than their current practices. The degree of relative advantage relates to the innovation’s perceived economic value, impact on social status, and reductions in time and effort. Higher relative advantage generally corresponds with less uncertainty about the innovation. If a resident believes using fertilizer BMPs will save money and improve their social status in the

Warner, Silvert, and Benge Using Adoption and Perceived…
Journal of Agricultural Education Volume 60, Issue 3, 2019 158
neighborhood, then they are more likely to adopt the innovation (Rogers, 2003). An innovation’s perceived relative advantage may also increase with the use of incentives such as a cash reward for using fertilizer BMPs.
Figure 1. The relationship between perceived characteristics of fertilizer best management practices and adoption.
Compatibility is how consistent an individual perceives an innovation to be with their current values, past experiences, and needs (Rogers, 2003). A resident is more likely to adopt fertilizer BMPs when they perceive they are compatible with what presently exists. If a resident values the natural environment, and strongly believes their existing fertilizer practices are contaminating water sources, the perceived compatibility of fertilizer BMPs would likely increase. Compatibility may be increased when the innovation is consistent with the norms of a social system, such as a homeowners’ association and its lawn and landscape policies.
Innovations that are perceived as being less complex, or less difficult to use, are more likely
to be adopted (Rogers, 2003). While in some cases complexity may be less important than compatibility and relative advantage, if an innovation is perceived as too difficult to learn to use, adoption is unlikely. Trialability is distinguished by whether a potential adopter perceives they cantest an innovation before complete adoption (Rogers, 2003). A money-back guarantee valid for an amount of time after using the innovation and having the chance to experience positive results would be expected to increase trialability and positively relate to the rate of adoption.
An innovation’s perceived observability is determined by the observation of the results of
the innovation. Improved observability will increase the adoption rate. Therefore, a resident who observes a neighbor’s healthy and attractive lawn that uses fertilizer BMPs is more likely to adopt the innovation. Bandura (1977) stressed that people learn through modeling when they observe others’ behavior and outcomes and form their conclusions about how to perform the behaviors before initiating their actions.
The characteristics of innovations have been used somewhat in agricultural education
research. For example, Ruth, Lamm, Rumble, and Ellis (2017) found a relative advantage, compatibility, complexity, and trialability (but not observability) predicted US citizens’ likelihood of consuming genetically modified citrus. However, there remains much potential to apply DOI to Extension water conservation and other agricultural education contexts. There is especially a lack of quantitative research in this area.
Reaching the critical mass in the population, when enough people have adopted an
innovation that the rate of adoption becomes self-sustaining, is a pivotal point in the diffusion process (Rogers, 2003). In addition to promoting innovations that individuals want to adopt, Extension professionals, as change agents, are tasked to study the social system and strategize how

Warner, Silvert, and Benge Using Adoption and Perceived…
Journal of Agricultural Education Volume 60, Issue 3, 2019 159
to achieve adoption by the critical mass. Huang, Lamm, and Dukes (2016) proposed that audience segmentation based on differing levels of engagement with water in the landscape is crucial for Extension programs to better address clients’ specific needs. Working within social systems and interpersonal networks is an important way to facilitate adoption by the early majority. Therefore, DOI encourages change agents to target opinion leaders and respected individuals that will model results of adoption and social status to their peers (Rollins, 1993).
Purpose and Objectives
The purpose of this study was to examine the adoption of fertilizer BMPs and perceptions towards these innovations in Florida to guide impactful Extension programming to positively influence water quality. The specific objectives that guided the study were to: 1) identify the extent of adoption of fertilizer BMP innovations; 2) identify perceptions of innovations; 3) examine the relationship between the five characteristics of innovations and adoption of fertilizer BMPs; and 4) evaluate differences in educational interests and needs between innovative Floridians and non-innovative Floridians.
Methods
This quantitative study utilized online survey methods to examine relationships between
Floridians’ perceptions of innovations and fertilizer best practices. We used nonprobability sampling, which is considered appropriate for this type of exploratory research (Vaske, 2008). Before conducting the study, we submitted our protocol for review by the University of Florida Institutional Review Board, and our procedure was approved. Sample and Data Collection
The target population was Florida residents aged 18 and older. The sample was accessed using an online survey research company, which targeted gender quotas reflective of the state’s population (Burns & Burns, 2008). When using nonprobability sampling, participation rate is used as opposed to response rate which is used for probability sampling (Baker et al., 2016). A total of 2,441 individuals met the criteria of the target population, and 1,197 provided completed surveys for a participation rate of 49.0%.
Then, we used post-stratification weighting methods to ensure data were representative of
the actual population (Baker et al., 2013; Kalton & Flores-Cervantes, 2003; Lamm & Lamm, 2019). We adjusted weights of the responses so age, race, rural-urban continuum code, ethnicity, and sex-matched the 2010 U.S. census (Baker et al., 2013; Kalton & Flores-Cervantes, 2003).
The average respondent was 48.6 years old and had lived in Florida for 23.7 years. This
individual was most likely to indicate they were white and non-Hispanic and owned their home. Just under half of the respondents lived in a homeowners’ association (45.0%; f = 539), and 63.0% (f = 754) lived in metropolitan counties with a population of 1 million or more residents. The most common family income category was $50,000 to $74,999 (22.7%, f = 272), and the most common level of education reported was a 4-year college degree (29.5%, f = 354). Instrumentation
We used a researcher-developed survey instrument. Prior to data collection, the instrument was reviewed by a panel of seven experts to improve accuracy and establish content and face validity (Vaske, 2008). The panel was comprised of experts in agricultural education and communications, several Extension professionals who work with residential audiences, the director of a large urban landscape best practices program and a research coordinator with a focus on urban landscape research. After the expert panel review, we conducted a pilot test with 50 individuals to ensure adequate reliability of the instrument. Pilot test reliabilities for all constructs exceeded .70

Warner, Silvert, and Benge Using Adoption and Perceived…
Journal of Agricultural Education Volume 60, Issue 3, 2019 160
(data not presented). We made minor edits to the instrument following the pilot test and did not include these 50 responses in the full study.
There were nine questions pertaining to the objectives of the study. Dependent variables
were the adoption of fertilizer BMPs frequencies (see Table 2), interest in learning about water topics, from whom individuals wanted to learn about water, and preferred learning opportunities (see Table 3). The first of these variables was measured using a Likert-type scale while the others were “check all that apply” format. Table 2 Description of Fertilizer BMP Adoption Variable in an Evaluation of the Relationship between Floridians’ Perceived DOI Characteristics and Engagement in Fertilizer BMPs Question stem Cronbach’s
alphab
Please select how often you engage in the following fertilizer behaviors.a .911 Note. There were 10 fertilizer behavior items. Possible responses and value were never (1), rarely (2), sometimes (3), often (4), and always (5). These items were used as individual categorical variables and also used to generate a fertilizer BMP adoption index. aQuestion format was a Likert-type scale. Not applicable responses were treated as missing data. bPost-hoc reliability reported. Table 3 Description of Learning Preference Variables in an Evaluation of the Relationship between Floridians’ Perceived DOI Characteristics and Engagement in Fertilizer BMPs Variable Question stem Interest in water topics Would you like to learn more about any of the following water
topics? From whom individuals wanted to learn
Who would you like to learn from regarding the water topics you indicated being interested in previously?
Preferred learning opportunities
If you had the following types of learning opportunities to learn more about water topics, which would you most likely take advantage of?
Note. There were nine possible responses for water topics, 11 educational entities, and 18 learning opportunities.
Five independent variables were DOI perceptions of innovations (relative advantage,
compatibility, complexity, observability, and trialability; Rogers, 2003) and these were measured using Likert-type scales (see Table 4). An additional binary categorical independent variable, non-innovative or innovative group membership, was created from the BMP adoption index variable.
Warner, Silvert, and Benge Using Adoption and Perceived…
Journal of Agricultural Education Volume 60, Issue 3, 2019 161
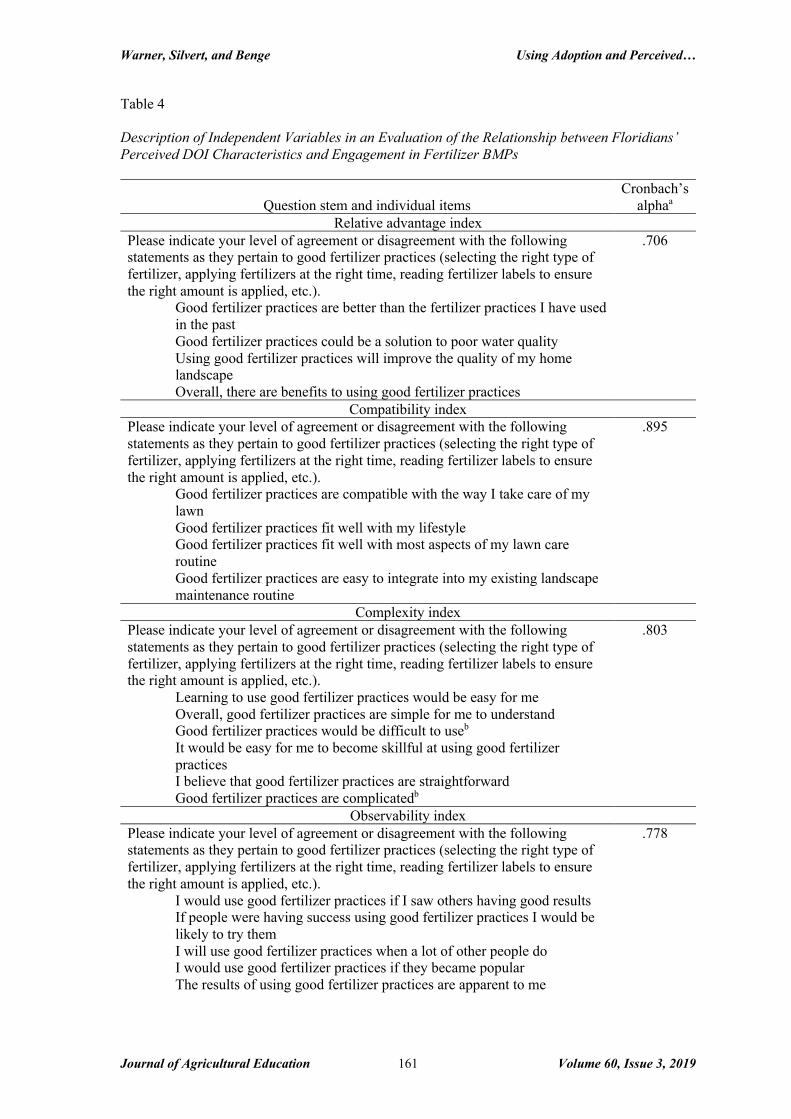
Table 4 Description of Independent Variables in an Evaluation of the Relationship between Floridians’ Perceived DOI Characteristics and Engagement in Fertilizer BMPs
Question stem and individual items Cronbach’s
alphaa
Relative advantage index Please indicate your level of agreement or disagreement with the following statements as they pertain to good fertilizer practices (selecting the right type of fertilizer, applying fertilizers at the right time, reading fertilizer labels to ensure the right amount is applied, etc.).
Good fertilizer practices are better than the fertilizer practices I have used in the past Good fertilizer practices could be a solution to poor water quality Using good fertilizer practices will improve the quality of my home landscape Overall, there are benefits to using good fertilizer practices
.706
Compatibility index Please indicate your level of agreement or disagreement with the following statements as they pertain to good fertilizer practices (selecting the right type of fertilizer, applying fertilizers at the right time, reading fertilizer labels to ensure the right amount is applied, etc.).
Good fertilizer practices are compatible with the way I take care of my lawn Good fertilizer practices fit well with my lifestyle Good fertilizer practices fit well with most aspects of my lawn care routine Good fertilizer practices are easy to integrate into my existing landscape maintenance routine
.895
Complexity index Please indicate your level of agreement or disagreement with the following statements as they pertain to good fertilizer practices (selecting the right type of fertilizer, applying fertilizers at the right time, reading fertilizer labels to ensure the right amount is applied, etc.).
Learning to use good fertilizer practices would be easy for me Overall, good fertilizer practices are simple for me to understand Good fertilizer practices would be difficult to useb It would be easy for me to become skillful at using good fertilizer practices I believe that good fertilizer practices are straightforward Good fertilizer practices are complicatedb
.803
Observability index Please indicate your level of agreement or disagreement with the following statements as they pertain to good fertilizer practices (selecting the right type of fertilizer, applying fertilizers at the right time, reading fertilizer labels to ensure the right amount is applied, etc.).
I would use good fertilizer practices if I saw others having good results If people were having success using good fertilizer practices I would be likely to try them I will use good fertilizer practices when a lot of other people do I would use good fertilizer practices if they became popular The results of using good fertilizer practices are apparent to me
.778

Warner, Silvert, and Benge Using Adoption and Perceived…
Journal of Agricultural Education Volume 60, Issue 3, 2019 162
Table 4 Description of Independent Variables in an Evaluation of the Relationship between Floridians’ Perceived DOI Characteristics and Engagement in Fertilizer BMPs Continued…
Trialability index Please indicate your level of agreement or disagreement with the following statements as they pertain to good fertilizer practices (selecting the right type of fertilizer, applying fertilizers at the right time, reading fertilizer labels to ensure the right amount is applied, etc.).
Good fertilizer practices are available to try before I make a decision about using them I have the opportunity to test good fertilizer practices before I commit to changing my lawn/landscape management routine I do not have the chance to try good fertilizer practicesb I can use good fertilizer practices on a trial basis I am able to experiment with good fertilizer practices as needed
.809
Note. All question formats were Likert-type scales. Possible responses and values were never (1), rarely (2), sometimes (3), often (4), and always (5). aPost-hoc reliability reported. bIndicates reverse-coded responses. Data Analysis
Data were analyzed using SPSS (version 25.0; IBM Corp., Armonk, NY). We used descriptive statistics to summarize frequencies (of engaging in fertilizer BMPs) along with means and standard deviations of the dependent and independent variables (objectives one and two).
We used multiple linear regression to evaluate the relationship between the five DOI
characteristics and fertilizer BMP adoption (objective three). To compare more innovative individuals to less innovative individuals, we separated 16% of the full sample who had the highest fertilizer BMP adoption index means (representing the Innovators and Early Adopters with 2.5% and 13.5%, respectively; Rogers, 2003). We designated this group the Innovative Floridians and assigned all others to the Non-Innovative Floridians group. To assess educational needs, we used chi-square tests to explore whether group membership related to topics each group was interested in learning about and how they preferred to learn. Post-hoc z-tests were conducted to compare column proportions when a significant relationship was identified between characteristics and being more or less innovative. When we identified a significant relationship, we calculated Cramer’s V to establish the practical significance (Rea & Parker, 1992).
Findings
Objective One: Identify the Extent of Adoption of Fertilizer BMP Innovations
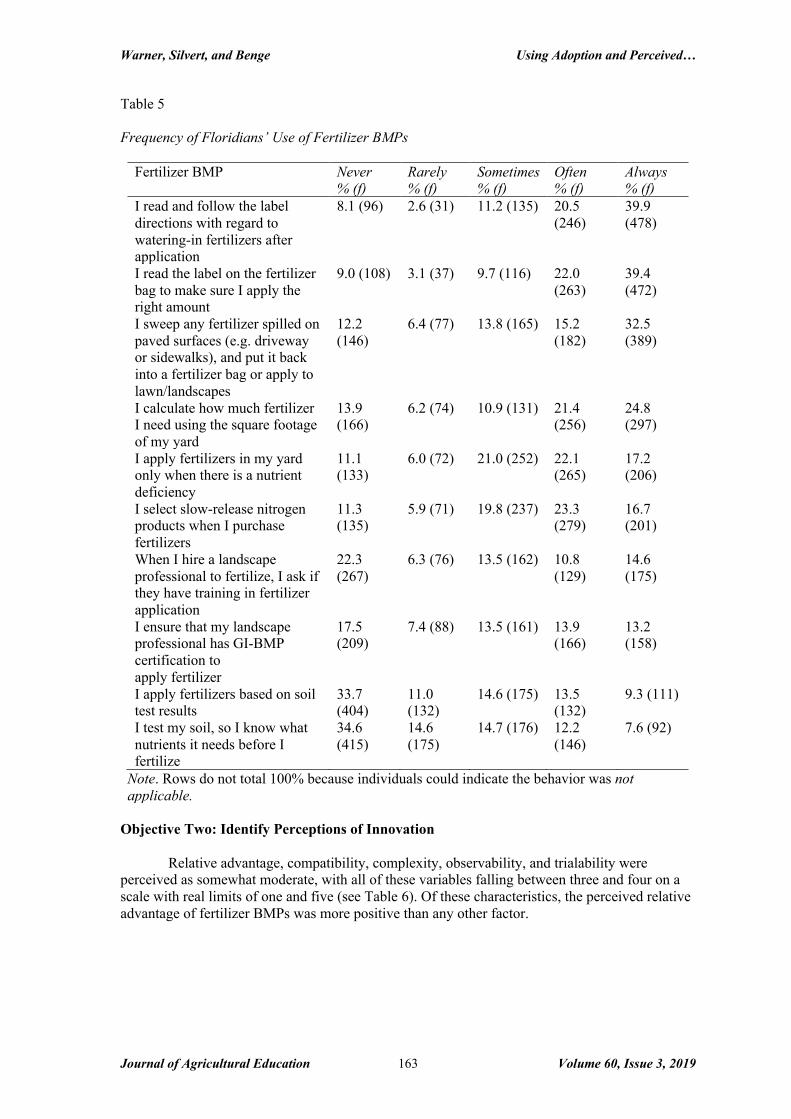
The majority of respondents always or often read the fertilizer label for watering-in and
applying the correct amount of fertilizer (see Table 5). Less than one-third always or often ask their landscape professional about their training in fertilizer application. About one-third of the respondents indicated they never test their soil or apply fertilizer according to soil test results. Almost half say they always or often sweep up spilled fertilizers and select slow-release nitrogen products.
Warner, Silvert, and Benge Using Adoption and Perceived…
Journal of Agricultural Education Volume 60, Issue 3, 2019 163
Table 5 Frequency of Floridians’ Use of Fertilizer BMPs
Fertilizer BMP Never % (f)
Rarely % (f)
Sometimes % (f)
Often % (f)
Always % (f)
I read and follow the label directions with regard to watering-in fertilizers after application
8.1 (96) 2.6 (31) 11.2 (135) 20.5 (246)
39.9 (478)
I read the label on the fertilizer bag to make sure I apply the right amount
9.0 (108) 3.1 (37) 9.7 (116) 22.0 (263)
39.4 (472)
I sweep any fertilizer spilled on paved surfaces (e.g. driveway or sidewalks), and put it back into a fertilizer bag or apply to lawn/landscapes
12.2 (146)
6.4 (77) 13.8 (165) 15.2 (182)
32.5 (389)
I calculate how much fertilizer I need using the square footage of my yard
13.9 (166)
6.2 (74) 10.9 (131) 21.4 (256)
24.8 (297)
I apply fertilizers in my yard only when there is a nutrient deficiency
11.1 (133)
6.0 (72) 21.0 (252) 22.1 (265)
17.2 (206)
I select slow-release nitrogen products when I purchase fertilizers
11.3 (135)
5.9 (71) 19.8 (237) 23.3 (279)
16.7 (201)
When I hire a landscape professional to fertilize, I ask if they have training in fertilizer application
22.3 (267)
6.3 (76) 13.5 (162) 10.8 (129)
14.6 (175)
I ensure that my landscape professional has GI-BMP certification to apply fertilizer
17.5 (209)
7.4 (88) 13.5 (161) 13.9 (166)
13.2 (158)
I apply fertilizers based on soil test results
33.7 (404)
11.0 (132)
14.6 (175) 13.5 (132)
9.3 (111)
I test my soil, so I know what nutrients it needs before I fertilize
34.6 (415)
14.6 (175)
14.7 (176) 12.2 (146)
7.6 (92)
Note. Rows do not total 100% because individuals could indicate the behavior was not applicable.
Objective Two: Identify Perceptions of Innovation
Relative advantage, compatibility, complexity, observability, and trialability were perceived as somewhat moderate, with all of these variables falling between three and four on a scale with real limits of one and five (see Table 6). Of these characteristics, the perceived relative advantage of fertilizer BMPs was more positive than any other factor.

Warner, Silvert, and Benge Using Adoption and Perceived…
Journal of Agricultural Education Volume 60, Issue 3, 2019 164
Table 6 Perceived Relative Advantage, Compatibility, Complexity, Observability, and Trialability in an Evaluation of the Relationship between Floridians’ Perceived DOI Characteristics and Engagement in Fertilizer BMPs Characteristic M SD Relative advantage 3.813 .611 Compatibility 3.757 .731 Complexity 3.657 .661 Observability 3.535 .654 Trialability 3.386 .746 Fertilizer BMP adoption 3.242 .910
Objective Three: Examine the Relationship between the Five Characteristics of Innovations and Adoption of Fertilizer BMPs
When we regressed DOI characteristics against fertilizer BMP adoption, the multiple linear regression model was significant, F(5,1191) = 51.863, p < .001, and predicted about 18% of the variance in BMP use (see Table 7). Significant β values ranged from .114 to .241, with compatibility explaining the greatest amount of variability in fertilizer BMP use when the other variables were held constant. Table 7 Fertilizer BMP Adoption predicted by Relative Advantage, Compatibility, Complexity, Observability, and Trialability in an Evaluation of the Relationship between Floridians’ Perceived DOI Characteristics and Engagement in Fertilizer BMPs
R2 Β p Overall model*
Compatibility* Trialability* Relative advantage* Observability Complexity
.179
.241 .147 .114 .022
- .006
< .001 < .001 < .001 < .001 .488 .850
Note. * indicates significant. Reported β are standardized regression coefficients. Objective Four: Evaluate Differences between Non-Innovative and Innovative Floridians
Differences existed between non-innovative and innovative Floridians pertaining to what individuals wanted to learn about, from whom they wanted to learn, and how they preferred to learn, with significant differences in more than half of the individual items (see Table 8). Innovative Floridians were more interested in learning about many of the water topics, with the greatest practical difference identified for how to encourage neighbors to conserve water. Non-innovative Floridians were less interested in learning from colleagues, Federal government and Cooperative Extension organizations, and neighbors. There was no difference in interest in learning from friends or family and social media. Innovative Floridians were more interested in learning through 10 of the 18 possible learning opportunities. The biggest practical difference identified was for visiting an Extension office.

Warner, Silvert, and Benge Using Adoption and Perceived…
Journal of Agricultural Education Volume 60, Issue 3, 2019 165
Table 8 Comparison of Learning Preferences Between Innovative and Non-Innovative Floridians in an Evaluation of the Relationship between Floridians’ Perceived DOI Characteristics and Engagement in Fertilizer BMPs
Learning preference
Non-innovative
% (f) Innovative
% (f) p χ2 Cramer’s
V Interest in water topics How I can encourage neighbors to conserve water* I am not interested in learning about any of these topics* Community actions concerning water issues* The impact of water conservation on landscapes* Water policy and economics * Alternative water sources The impact of agriculture on water resources The impact of climate change on water resources Water availability for future generations From whom individuals wanted to learn Colleagues* Cooperative Extension* Local county government organizations* Neighbors* Local nurseries* Landscapers* Social media Garden centers News media Federal government organizations Friends or family Preferred learning opportunities Visit an Extension office* Engage in a live Twitter chat* Participate in a webinar* Listen to a podcast* Get trained for a regular volunteer position* Join a Facebook group* Take part in a one-time volunteer activity* Listen to radio * Read a newspaper article or series*
13.2 (136)a
38.4 (395)a
16.2 (167)a
20.9 (215)a
16.7 (172)a
24.3 (250) 18.5 (190) 26.0 (267) 27.1 (278) 5.3 (54)a
12.8 (131)a
19.4 (199)b
11.8 (121)a
16.8 (173)a
18.1 (186)a
14.1 (145) 22.2 (228) 17.4 (179) 16.1 (165) 16.3 (167) 8.6 (88)a
1.9 (20)a
7.6 (78)a
10.5 (108)a
7.2 (74)a
9.9 (102)a
12.4 (127)a
13.7 (141)a
25.4 (261)a
26.5 (45)b
22.4 (38)b
26.5 (45)b
31.8 (54)b
24.7 (42)b
29.4 (50) 21.8 (37) 28.8 (49) 28.8 (49) 21.8 (37)b
25.3 (43)b
31.2 (53)b
21.2 (36)b
27.1 (46)b
25.9 (44)b
19.5 (33) 28.2 (48) 21.2 (36) 19.4 (33) 19.4 (33) 22.4 (38)b
9.4 (16)b
17.6 (30)b
21.8 (37)b
15.9 (27)b
18.8 (32)b
20.0 (34)b
21.2 (36)b
33.5 (57)b
< .001
< .001
.001
.002
.012 .156 .315
.439
.634
< .001 < .001 < .001
.001 .001 .017 .067 .084 .238 .274 .308
< .001 < .001 < .001 < .001 < .001
.001 .007
.011 .026
19.886
16.325
10.473
9.819
6.322 2.016 1.011
.599
.226
55.577 18.458 12.219
11.296 10.219 5.675 3.350 2.994 1.390 1.195 1.040
29.425 27.859 17.955 17.335 14.214
11.600 7.302
6.420 4.958
.129
.117
.093
.091
.073 .041 .029
.022
.014
.217 .124 .101
.097 .092 .017 .053 .050 .034 .032 .029
.157
.153
.122
.120
.109
.098
.078
.073
.064

Warner, Silvert, and Benge Using Adoption and Perceived…
Journal of Agricultural Education Volume 60, Issue 3, 2019 166
Attend a short course or workshop* Read a blog Attend a fair or festival Attend a seminar or conference Read printed fact sheets, bulletins, or brochures Watch a video Visit a web site Look at a demonstration or display Watch TV coverage
14.1 (145)a
10.2 (105) 12.3 (126) 11.1 (115) 27.6 (283) 33.6 (345) 37.4 (384) 17.2 (177) 25.7 (264)
20.0 (34)b
14.7 (25) 14.1 (24) 12.9 (22) 25.9 (44) 34.7 (59) 36.5 (62) 17.6 (30) 25.9 (44)
.046
.082
.497
.508
.650
.776
.818
.895
.961
3.967 3.026 .461 .437 .206
.081 .053 .017 .002
.058 050 .020 .019 .013
.008 .007 .004 .001
Note. * Indicates significant Cramer’s V values were interpreted as < 0.10 = negligible effect, 0.10 to 0.19 = weak effect, 0.20 to 0.39 = moderate effect, 0.40 to 0.59 = relatively strong effect, 0.60 to 0.79 = strong effect, 0.80 to 1.00 = very strong effect (Rea & Parker, 1992). Percentages and frequencies correspond to those who indicated interest in learning about the topic. Post-hoc z-tests were conducted to compare column proportions when a significant relationship was identified between characteristics and being more or less innovative. ab difference superscript letters indicate significant difference in proportions.
Conclusions, Implications, and Recommendations
Extension professionals play a crucial role in society as change agents as they aid citizens
in solving everyday and complex problems within their communities (Bloir & King, 2010). The politically, agriculturally, and urban-driven demand for fertilizer and landscape policies and accountability is of ever-increasing importance as Florida is a peninsula and surrounded by water. This research sought to understand fertilizer and landscape practices and related needs of Floridians to better inform and prepare Extension professionals working to affect change throughout the state.
The extent to which Floridians have adopted fertilizer BMPs in their yards is mixed. At the
higher end of adoption, over 60% of respondents indicated they either often or always read the label for both watering-in fertilizers after application and the fertilizer bag to make sure they apply the correct amount. However, only 20% and 23% of respondents often or always conduct a soil test and apply fertilizer based on soil test results, respectively. The University of Florida states soil testing enables both agriculturalists and residents “to find out the makeup of your soil and helps you determine how much lime and fertilizer you need to apply” (UF/IFAS 2018, para. 2). Rogers’ (2003) DOI characteristic of complexity may come into play as Floridians see the practice of soil testing as difficult and therefore do not adopt this BMP, or it could be that they do not know what a soil test is or how to do one. Even though a good majority of Floridians believe they are following fertilizer labels, they need to have knowledge and understanding of research-based lawn maintenance care recommendations to appropriately apply fertilizer products.
There is also a marked opportunity to increase asking about professionals’ training as a best
management practice, as very few Floridians ask about professionals’ training to apply fertilizers. It is likely most individuals lack the confidence to ask about training in fertilizer application, have probably never observed others doing so, and may not understand the implication of using a trained professional, meaning Rogers’ (2003) characteristics of relative advantage and observability are especially low for these types of behaviors. There is much opportunity for Extension programs to develop favorable perceptions pertaining to asking about a professional’s training, possibly by providing opportunities for residents to role play and observe these types of discussions, as well as emphasizing how these practices connect to improved water quality.
Extension professionals should increase their attention on less-adopted BMPs to ensure
urban dwellers are persuaded and gaining appropriate knowledge and skills to improve adoption rates of BMPs. Increasing knowledge on improper fertilizer application and its consequences may also reduce residents’ confusion over the purpose of fertilizer ordinances that aim to prevent leaching (Kirkpatrick et al., 2017).
Warner, Silvert, and Benge Using Adoption and Perceived…
Journal of Agricultural Education Volume 60, Issue 3, 2019 167
Rogers (2003) urged researchers to focus attention on “clusters” (p. 249) of technologies
versus single innovations, and this approach provided the opportunity to understand the adoption of fertilizer BMPs holistically. Perceptions of fertilizer BMP innovations are moderate, with relative advantage receiving the highest overall mean among the DOI characteristics and trialability receiving the lowest. It is not surprising that relative advantage has the highest overall perception as Rogers (2003) explained perceived increases in economic value, social status, and the reduction of one’s time can have a profound impact on someone making a change in behavior.
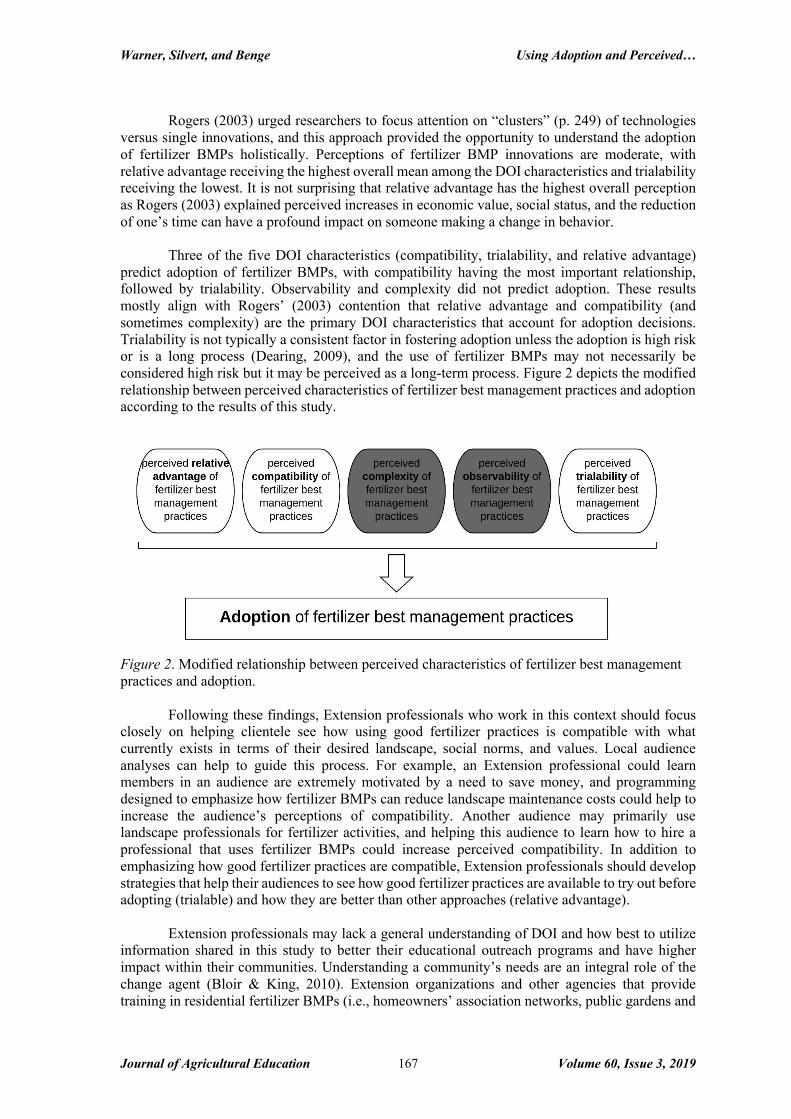
Three of the five DOI characteristics (compatibility, trialability, and relative advantage)
predict adoption of fertilizer BMPs, with compatibility having the most important relationship, followed by trialability. Observability and complexity did not predict adoption. These results mostly align with Rogers’ (2003) contention that relative advantage and compatibility (and sometimes complexity) are the primary DOI characteristics that account for adoption decisions. Trialability is not typically a consistent factor in fostering adoption unless the adoption is high risk or is a long process (Dearing, 2009), and the use of fertilizer BMPs may not necessarily be considered high risk but it may be perceived as a long-term process. Figure 2 depicts the modified relationship between perceived characteristics of fertilizer best management practices and adoption according to the results of this study.
Figure 2. Modified relationship between perceived characteristics of fertilizer best management practices and adoption.
Following these findings, Extension professionals who work in this context should focus
closely on helping clientele see how using good fertilizer practices is compatible with what currently exists in terms of their desired landscape, social norms, and values. Local audience analyses can help to guide this process. For example, an Extension professional could learn members in an audience are extremely motivated by a need to save money, and programming designed to emphasize how fertilizer BMPs can reduce landscape maintenance costs could help to increase the audience’s perceptions of compatibility. Another audience may primarily use landscape professionals for fertilizer activities, and helping this audience to learn how to hire a professional that uses fertilizer BMPs could increase perceived compatibility. In addition to emphasizing how good fertilizer practices are compatible, Extension professionals should develop strategies that help their audiences to see how good fertilizer practices are available to try out before adopting (trialable) and how they are better than other approaches (relative advantage).
Extension professionals may lack a general understanding of DOI and how best to utilize
information shared in this study to better their educational outreach programs and have higher impact within their communities. Understanding a community’s needs are an integral role of the change agent (Bloir & King, 2010). Extension organizations and other agencies that provide training in residential fertilizer BMPs (i.e., homeowners’ association networks, public gardens and
Warner, Silvert, and Benge Using Adoption and Perceived…
Journal of Agricultural Education Volume 60, Issue 3, 2019 168
science centers, nonprofit groups) need to provide training and development opportunities for their workforce to increase their knowledge in understanding and using DOI to facilitate change. Needs assessments should be conducted measuring educators’ perceived importance, knowledge, and skills of DOI in order to provide intentional professional development.
Both innovative and non-innovative individuals represent important clientele with different
needs. Innovative individuals are more interested in learning about all of the water topics explored through this study than non-innovative individuals. The largest practical difference was associated with learning to encourage neighbors to conserve water. Innovative individuals are also much more interested in learning from colleagues and local public organizations such as Cooperative Extension rather than family and friends. In this respect, government entities at the state and local levels are seen as knowledgeable and likely to be sought out for information and questions. Barnes and Haynes (2006) explain Extension should work to build trust within local communities, and this study’s research demonstrates more innovative individuals perceive Cooperative Extension and local government organizations as a trusted source for learning and information. Innovative individuals may also perceive greater access to Extension as a useful resource, while non-innovative individuals may lack awareness of potential benefits of Extension and how to seek them. Extension and local government administrators and agencies could utilize these more innovative individuals to serve in advisory roles so they can educate community stakeholders and policymakers about the impacts associated with adopting fertilizer BMPs.
Innovative individuals were also more interested in learning through specific social media
opportunities than those who were non-innovative. A study of American social media users found that approximately 80% use social media to seek out information for self-education and 40% of users use social media to share information (Whiting & Williams, 2013). More innovative individuals play an important role in the diffusion of innovations within a social network (Rogers, 2003), and the use of social media to both access and share information could be problematic as users may not always find non-biased, accurate, and up-to-date information for decision-making. Floridians are seeking out information and answers on social media platforms such as Facebook and Twitter. Extension professionals, as well as agricultural communication professionals, need to have a presence in social media platforms to ensure the public is receiving high-quality and non-biased information. Many Extension professionals use their own social media platforms and channels for their outreach efforts, and because social media is ever-changing, training and professional development efforts need to focus on providing current information and skills in optimizing social media to promote change. Further research is needed to assess both the quality and quantity of social media materials disseminated by Extension professionals, and the specific type of content and social media channels clientele prefer.
Innovators are approximately twice as likely to be interested than non-innovators in
volunteering opportunities, both as one-time volunteers and in ongoing volunteer positions. Innovators could be driven by similar motivations to volunteer as other environmental volunteers and their volunteering could support both outreach and data collection efforts (McCauley, 2017). Nonprofit organizations and government entities have a difficult time recruiting and retaining employees due to a lack of organizational values fit (Connors, 2012). Extension professionals should develop a volunteer recruitment plan targeting innovators as they are more likely to be interested in volunteering and their values align with those of their respective organizations. Connecting innovative individuals to non-innovative individuals through volunteering activities such as demonstrations or outreach may also improve diffusion of fertilizer BMPs.
As random sampling was not used, the reader is advised to take caution in applying the
findings to a broader audience. However, this concern is somewhat mitigated through the use of weighting (Baker et al., 2013; Kalton & Flores-Cervantes, 2003; Lamm & Lamm, 2019).
The findings of the current study present many opportunities for future research. It would
be interesting to examine how perceived characteristics of fertilizer BMPs differ between more-

Warner, Silvert, and Benge Using Adoption and Perceived…
Journal of Agricultural Education Volume 60, Issue 3, 2019 169
innovative and less-innovative individuals. Future research needs to be conducted on whether or not innovators volunteer more than non-innovators, and whether volunteers who are innovative volunteer longer than those who are non-innovative. Researchers should also consider measuring how Extension programs and communication campaigns can change the five perceived characteristics of fertilizer BMPs, or how these characteristics influence their consumption of Extension materials, including social media.
References
Bandura, A. (1977). Self-efficacy: Toward a unifying theory of behavioral change. Psychological Review, 84(2), 191-215. doi:10.1037/0033-295X.84.2.191
Baker, R., Brick, J. M., Bates, N. A., Battaglia, M., Couper, M. P., Dever, J. A., Tourangeau, R.
(2013). Report of the AAPOR task force on non-probability sampling. American Association for Public Opinion Research. Retrieved from https://www.aapor.org/Education-Resources/Reports/Non-Probability-Sampling.aspx
Baker, R., Brick, J. M., Keeter, S., Biemer, P., Kennedy, C., Kreuter, F., Mercer, A., &
Terhanian, G. (2016). Evaluating survey quality in today's complex environment. Retrieved from http://www.aapor.org/AAPOR_Main/media/MainSiteFiles/AAPOR_Reassessing_Survey_Methods_Report_Final.pdf
Barnes, J., & Haynes, S. (2006). Building trust in local community organizations: Where do we
start, and how can we make a difference. Journal of Extension, 44(4). Retrieved from https://www.joe.org/joe/2006august/tt6.php
Beard, J. B., & Green, R. L. (1994). The role of turfgrasses in environmental protection and their
benefits to humans. Journal of Environmental Quality, 23(3), 452-460. doi:10.2134/jeq1994.00472425002300030007x
Blaine, T. W., Clayton, S., Robbins, P., & Parwinder, G. S. (2012). Homeowner attitudes and
practices towards residential landscape management in Ohio, USA. Environmental Management, 50(2), 257. doi:10.1007/s00267-012-9874-x
Bloir, K., & King, J. (2010). Change, who…me? Journal of Extension 48(1). Retrieved from
https://www.joe.org/joe/2010february/comm1.php Burns, R. P., & Burns R. (eds). (2008). Business research methods and statistics using SPSS.
London: Sage Publications. Cheng, Z., Richmond, D. S., Salminen, S. O., & Grewal, P. S. (2008). Ecology of urban lawns
under three common management programs. Urban Ecosystems, 11(2), 177-195. doi:10.1007/s11252-008-0048-9
Connors, T. D. (2012). The volunteer management handbook: Leadership strategies for success
(2nd ed.). Hoboken, NJ: John Wiley & Sons, Inc. Dearing, J. W. (2009). Applying diffusion of innovation theory to intervention development.
Research on Social Work Practice, 19(5), 503-518. doi:10.1177/1049731509335569 Eisenhauer, B. W., Brehm, J. M., Stevenson, N., & Peterson, J. (2016). Changing homeowners’
lawn care behavior to reduce nutrient runoff. Society & Natural Resources, 29(3), 329-344. doi:10.1080/08941920.2015.1062946

Warner, Silvert, and Benge Using Adoption and Perceived…
Journal of Agricultural Education Volume 60, Issue 3, 2019 170
Environmental Protection Agency. (2017). Polluted runoff: Nonpoint source pollution. Retrieved from https://19january2017snapshot.epa.gov/nps/what-nonpoint-source_.html
Fissore, C., Baker, L. A., Hobbie, S. E., King, J. Y., McFadden, J. P., Nelson, K. C., &
Jakobsdottir, I. (2011). Carbon, nitrogen, and phosphorus fluxes in household ecosystems in the Minneapolis‐Saint Paul, Minnesota, urban region. Ecological Applications, 21(3), 619-639. doi:10.1890/10-0386.1
Florida Department of Agriculture and Consumer Services. (2008). Florida Consumer Fertilizer
Task Force final report. Retrieved from https://consensus.fsu.edu/Fertilizer-Task-Force/pdfs2/Fertilizer_Task_Force_Final_Report11408-3.pdf
Fraser, J. C., Bazuin, J. T., Band, L. E., & Grove, J. M. (2013). Covenants, cohesion, and
community: The effects of neighborhood governance on lawn fertilization. Landscape and Urban Planning, 115, 30–38. doi:10.1016/j.landurbplan.2013.02.013
Gold, A. J., DeRagon, W. R., Sullivan, W. M., & Lemunyon, J. L. (1990). Nitrate-nitrogen losses
to groundwater from rural and suburban land uses. Journal of soil and water conservation, 45(2), 305-310. Retrieved from http://www.jswconline.org/content/45/2/305.short
Hartman, R., Alcock, F., & Pettit, C. (2008). The spread of fertilizer ordinances in Florida. Sea
Grant Law Policy Journal. 1(1), 98-114. Retrieved from https://heinonline.org/HOL/Page?handle=hein.journals/sglum1&div=10&g_sent=1&casa_token=&collection=journals
Henderson, S. P., Perkins, N. H., & Nelischer, M. (1998). Residential lawn alternatives: A study
of their distribution, form and structure. Landscape and Urban Planning, 42(2-4), 135-145. doi: 10.1016/S0169-2046(98)00084-X
Hochmuth, G., Nell, T., Unruh, J. B., Trenholm, L., & Sartain, J. (2012). Potential Unintended
Consequences Associated with Urban Fertilizer Bans in Florida—A Scientific Review. HortTechnology, 22(5), 600-616. doi:10.21273/HORTTECH.22.5.600
Huang, P. W., Lamm, A. J., & Dukes, M. D. (2016). Informing extension program development
through audience segmentation: Targeting high water users. Journal of Agricultural Education, 57(2), 60-74. doi:10.5032/jae.2016.02060
Jenkins, V.S. (1994). The lawn: A history of an American obsession. Washington D.C.:
Smithsonian Institution Press. Kalton, G., & Flores-Cervantes, I. (2003). Weighting methods. Journal of Official Statistics,
19(2), 81-97. Retrieved from https://www.scb.se/contentassets/ca21efb41fee47d293bbee5bf7be7fb3/weighting-methods.pdf
King, R. N., & Rollins, T. (1995). Factors influencing the adoption decision: An analysis of
adopters and nonadopters. Journal of Agricultural Education, 36(4), 39-48. doi:10.5032/jae.1995.04039
Kirkpatrick, B., Kohler, K., Byrne, M., Fleming, L. E., Scheller, K., Reich, A., ... & Hoagland, P.
(2014). Human responses to Florida red tides: policy awareness and adherence to local fertilizer ordinances. Science of the Total Environment, 493, 898-909. doi:10.1016/j.scitotenv.2014.06.083
Warner, Silvert, and Benge Using Adoption and Perceived…
Journal of Agricultural Education Volume 60, Issue 3, 2019 171
Lamm, A. J., & Lamm, K. W. (2019) The use of nonprobability sampling methods in agricultural and extension education research. Journal of International Agricultural and Extension Education, 26(1), 5259. doi:10.5191/jiaee.2019.26105
Larkin, S. L., & Adams, C. M. (2007). Harmful algal blooms and coastal business: Economic
consequences in Florida. Society and Natural Resources, 20(9), 849-859. doi:10.1080/08941920601171683
Law, N., Band, L., & Grove, M. (2004). Nitrogen input from residential lawn care practices in
suburban watersheds in Baltimore County, MD. Journal of Environmental Planning and Management, 47(5), 737-755. doi:10.1080/0964056042000274452
Liu, H., Hull, R. J., & Duff, D. T. (1997). Comparing cultivars of three cool-season turfgrass for
soil water NO− 3 concentration and leaching potential. Crop Science, 37(2), 526-534. doi:10.2135/cropsci1997.0011183X003700020036x
McCaslin, N. L., & Tibezinda, J. P. (1997). Assessing target group needs. In B.E. Swanson, R.P.
Bentz, & A.J. Sofranko. Improving agricultural Extension: A reference manual. Rome: Food and Agriculture Organization of the United Nations.
McCauley, J. (2017). “We can help the people who can make a difference”: Motivations, goals,
and outcomes in volunteer water quality monitoring. Sociological Focus, 50(2), 125-137. doi: 10.1080/00380237.2017.1251748
Miltner, E. D., Branham, B. E., Paul, E. A., & Rieke, P. E. (1996). Leaching and mass balance of
15N-labeled urea applied to a Kentucky bluegrass turf. Crop Science, 36(6), 1427-1433. doi:10.2135/cropsci1996.0011183X003600060001x
Rea, L. M., & Parker, R. A. (1992). Designing and conducting survey research. San Francisco,
California: Jossey-Boss. Robbins, P., & Birkenholtz, T. (2003). Turfgrass revolution: Measuring the expansion of the
American lawn. Land Use Policy, 20(2), 181-194. doi: 10.1016/S0264-8377(03)00006-1 Rogers, E. M. (2003). Diffusion of innovations (3rd ed.). New York: Simon and Schuster. Rollins, T. (1993). Using the innovation adoption diffusion model to target educational
programming. Journal of Agricultural Education, 34(4), 46-54. doi:10.5032/jae.1993.04046
Rumble, J. N., Lamm, A. J., & Gay, K. D. (2018). Identifying extension agent needs associated
with communicating about policies and regulations. Journal of Agricultural Education, 59(4), 72-87. doi:10.503/jae.2018.04072
Ruth, T. K, Lamm, A. J., Rumble, J. N., & Ellis, J. D. (2017). Conversing about citrus greening:
Extension’s role in educating about genetic modification science as a solution. Journal of Agricultural Education, 58(4) 34-49. doi:10.5032/jae.2017.04034
Sartain, J.B. (2007). General recommendations for fertilization of turfgrasses on Florida soils
(SL21). Gainesville, FL: Florida Cooperative Extension Service, University of Florida. Selman, M., & Greenhalgh, S. (2010). Eutrophication: Sources and drivers of nutrient
pollution. Renewable Resources Journal, 26(4), 19-26. doi:20113079001 20113079001

Warner, Silvert, and Benge Using Adoption and Perceived…
Journal of Agricultural Education Volume 60, Issue 3, 2019 172
Soldat, D. J., & Petrovic, A. M. (2008). The fate and transport of phosphorus in turfgrass ecosystems. Crop Science, 48(6), 2051-2065. doi:10.2135/cropsci2008.03.0134
Shuman, L. M. (2002). Phosphorus and nitrate nitrogen in runoff following fertilizer application
to turfgrass. Journal of Environmental Quality, 31(5), 1710-1715. doi:10.2134/jeq2002.1710
Tampa Bay Estuary Program. (2015). Progress report 2015. Retrieved from
https://www.tbep.org/pdfs/tbep_progress_rpt_2015_webx.pdf Tucker, W. A., Diblin, M. C., Mattson, R. A., Hicks, R. W., & Wang, Y. (2014). Nitrate in
shallow groundwater associated with residential land use in central Florida. Journal of Environmental Quality, 43(2), 639-646. doi:10.2134/jeq2012.0370
UF/IFAS Extension. (2018). Soil testing. Retrieved from http://sfyl.ifas.ufl.edu/agriculture/soil-
testing/ Vaske, J. J. (2008). Survey research and analysis: Application in parks, recreation, and human
dimensions. State College, PA: Venture Publishing, Inc. Whiting, A., & Williams, D. (2013). Why people use social media: A uses and gratifications
approach. Qualitative Market Research: An International Journal, 16(4), 362-369. doi:10.1108/QMR-06-2013-0041
Wollheim, W. M., Pellerin, B. A., Vörösmarty, C. J., & Hopkinson, C. S. (2005). N retention in
urbanizing headwater catchments. Ecosystems, 8(8), 871-884. doi:10.1007/s10021-005-0178-3