understanding the causes of major birth defects: steps to ... · 20.01.2015 · case-control...
TRANSCRIPT

1 1
CDC PUBLIC HEALTH GRAND ROUNDS
January 20, 2015
Understanding the Causes of Major Birth
Defects: Steps to Prevention
Accessible version: https://youtu.be/vaoJePIMGvI

2 2
The Impact of Birth Defects and Current Understanding of their Causes
Marcia L. Feldkamp, PhD, PA Associate Professor
Division of Medical Genetics
Department of Pediatrics
University of Utah

3 3
Acknowledgment and Disclaimer
Data were provided by the Utah Birth Defect Network
(UBDN), a project of the Utah Department of Health
(UDOH). This project is supported by the Health
Resources and Services Administration (HRSA) of
the U.S. Department of Health and Human Services
for the amount of $3.046,261.
This content and conclusions are those of the author
and should not be construed as the official position
or policy of, nor should any endorsements be
inferred by HRSA, the U.S. Government or the Utah
Department of Health.

4
What Are Birth Defects?
An abnormality affecting body structure or function
that is present at birth
May be obvious at birth
May not be obvious at birth and diagnosed later in life
Functional defects include developmental disabilities
(e.g., cerebral palsy or deafness)
Structural defects include two types
Major malformation
Surgical, medical or cosmetic importance
Minor malformation
Example of minor – single palmar crease
Single palmar crease

5
Major Birth Defects Are Common
1 in 33 or 3% of
children born are
identified at birth
120,000 babies each
year in the US
Prevalence increases
to 1 in 20 or 5% by 5
years of age
Kucik et al. Public Health Reports. 2012.
27%
Heart defects
35%
Other
2% Neural tube defects
5% Cleft lip/palate
13%
Genitourinary
18%
Musculoskeletal
Type of Birth Defect

6
Heart Defects
Hypoplastic Left
Heart Syndrome
Transposition of the
Great Arteries
Normal Heart
These types of defects will require surgical repair

7
Neural Tube Defects
Spina bifida Anencephaly

8
Abdominal Wall Defects
Gastroschisis Omphalocele
9
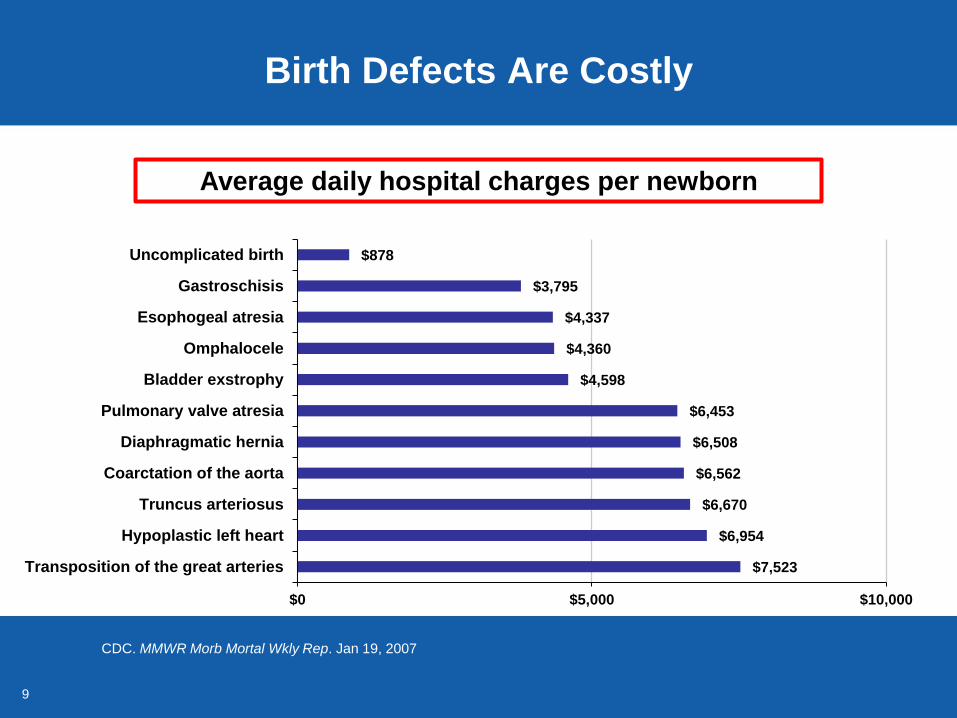
Birth Defects Are Costly
CDC. MMWR Morb Mortal Wkly Rep. Jan 19, 2007
$7,523
$6,954
$6,670
$6,562
$6,508
$6,453
$4,598
$4,360
$4,337
$3,795
$878
$0 $5,000 $10,000
Transposition of the great arteries
Hypoplastic left heart
Truncus arteriosus
Coarctation of the aorta
Diaphragmatic hernia
Pulmonary valve atresia
Bladder exstrophy
Omphalocele
Esophogeal atresia
Gastroschisis
Uncomplicated birth
Average daily hospital charges per newborn

10
Birth Defects Are Costly
In 2004, hospitalizations
and medical charges
cost $2.6 billion per year
for all ages
Medical care and
advances in technology
have improved long-term
survival among children
with birth defects
Russo CA, Elixhauser A. HCUP Statistical Briefs : Agency for Health Care Policy and Research (US); 2006-.2007 Jan.

11
Birth Defects Are Critical
Infant mortality
6.7 deaths per
1,000 infants
21% of deaths in the
first year of life are due
to birth defects
Congenital heart defects
represent largest group
Leading Causes of
Infant Mortality, 2011
LBW: Low birth weight
2011 US National Vital Statistics Data, National Center for Health Statistics
37%
Other
21%
Birth Defects
5%
Accidents 8%
SIDs
12%
Maternal factors
17%
LBW,
Prematurity

12
Most Major Birth Defects Occur Early in Pregnancy

13 13
Pregnancy Planning is
Primary Prevention of Birth Defects
The critical time period for all women to reduce their
risk is before they become pregnant
To reduce the risk of a neural tube defect, a woman
must consume folic acid before conception
Folic acid fortification of cereals and grains has been
very effective because it increases folate levels
among women in the US, whether planning a
pregnancy or not

14
Increasing Prevalence of Gastroschisis
Suggests Environmental Influence
Kirby et al. Obstet Gynecol. 2013
0
2
4
6
8
10
12
14
16
1995 1996 1997 1998 1999 2000 2001 2002 2003 2004 2005
Pre
vale
nce
pe
r 1
0,0
00
live
bir
ths
Year of Birth
Trends in Gastroschisis Prevalence by Maternal Age Group, 1995-2005

15
The Majority of Birth Defects
Do Not Have an Identifiable Cause
Utah Birth Defect Network, Utah Department of Health
Teratogen:
an agent or
factor that
causes a
malformation
in an embryo

16 16
Working to Identify the Unknown Causes
Major birth defects should be systematically
monitored in the population
Environmental factors that women are exposed to
should be investigated
Major birth defects are common, costly and critical

17 17
Advancing Understanding of the Causes of Birth Defects
Jennita Reefhuis, PhD Epidemiology Team Lead
Birth Defects Branch
Division of Birth Defects and Developmental Disabilities
National Center on Birth Defects and Developmental Disabilities

18 18
How To Study Rare Outcomes
Such as Specific Birth Defects
Cohort studies
Pro: Prospective exposure information
Con: Need a very large study to identify enough cases
Data-linkage studies Pro: Cost-efficient
Con: Methods for mother-baby linkage challenging
Con: Limited diagnostic and exposure data
Pregnancy registries Pro: Useful to identify major effects
Con: Not population based
Tinker, S. C., Gilboa, S., Reefhuis, J., Jenkins, M. M., Schaeffer, M., & Moore, C. A. (2014). Current Epidemiology Reports, 1-8.
19 19
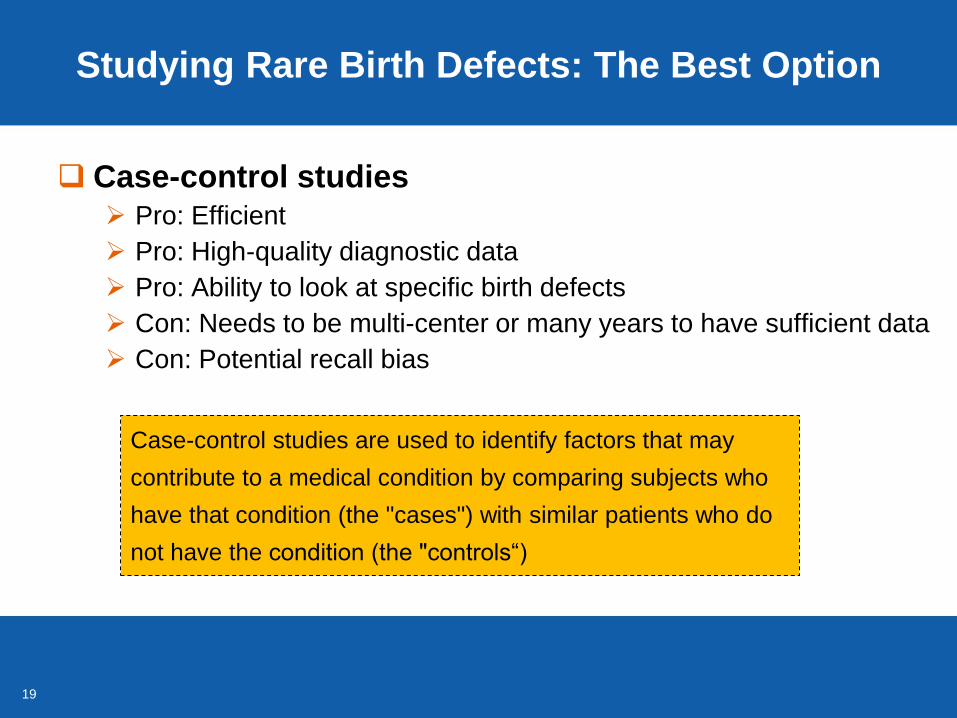
Studying Rare Birth Defects: The Best Option
Case-control studies Pro: Efficient
Pro: High-quality diagnostic data
Pro: Ability to look at specific birth defects
Con: Needs to be multi-center or many years to have sufficient data
Con: Potential recall bias
Case-control studies are used to identify factors that may
contribute to a medical condition by comparing subjects who
have that condition (the "cases") with similar patients who do
not have the condition (the "controls“)

20 20
National Birth Defects
Prevention Study
Population-based case control study
Births October 1997-December 2011
Cases from state-based birth defects
surveillance systems
Study cohort
~ 6 million total live births
48,196 affected pregnancies
21 21
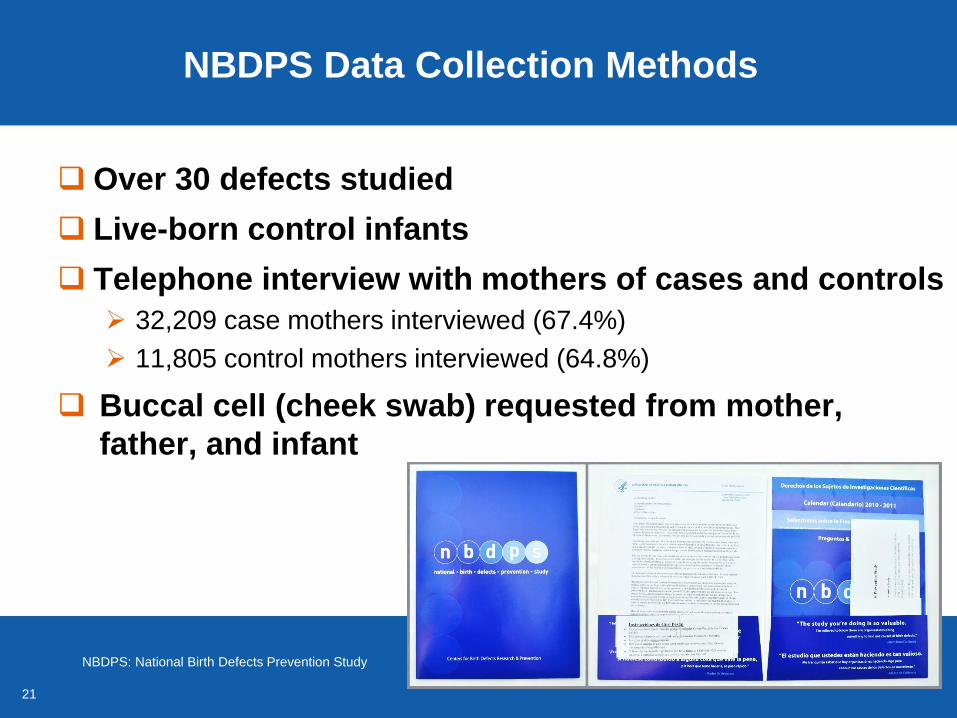
NBDPS Data Collection Methods
Over 30 defects studied
Live-born control infants
Telephone interview with mothers of cases and controls
32,209 case mothers interviewed (67.4%)
11,805 control mothers interviewed (64.8%)
Buccal cell (cheek swab) requested from mother,
father, and infant
NBDPS: National Birth Defects Prevention Study

22 22
Selected NBDPS Results
Over 200 peer-reviewed manuscripts
Diabetes diagnosed before pregnancy
Heart defects: odds ratio 4.6 (2.9 - 7.5)
Non-heart defects: odds ratio 2.3 (1.4 - 3.8)
Stress and neural tube defects
4 or more stressful life events in early pregnancy
Such as relative’s death, financial or legal problems, violence
Odds ratio 1.5 (1.1 - 2.0)
Perception of social support
Emotional, financial, daily tasks
Odds ratio 0.8 (0.5 - 1.1)
Correa et al. AJOG 2008
Carmichael et al. Paediatr Perinat Epidemiol 2014
NBDPS: National Birth Defects Prevention Study

23
NBDPS Results: Exposure to Opioid Medications
Hypoplastic left heart syndrome
17 exposed cases
Odds ratio 2.4 (1.4 - 4.1)
Spina bifida
26 exposed cases
Odds ratio 2.0 (1.3 - 3.2)
Gastroschisis
26 exposed cases
Odds ratio 1.8 (1.1 - 2.9)
Broussard et al. AJOG 2011
NBDPS: National Birth Defects Prevention Study

24 24
Better Data to Help Inform Treatment Choices
Maternal disease in pregnancy may need treatment
Disease can harm mother and baby (e.g., fever or diabetes)
Comparing risk-benefit of treatment compared with
no treatment
Comparing birth defect risk of different treatments–
some options may be safer
Choice of SSRIs for depression
Antibacterials in early pregnancy
SSRIs: selective serotonin reuptake inhibitors
www.cdc.gov/pregnancy/meds/treatingfortwo/

25 25
Antibacterial Medication in Early Pregnancy
Crider et al. JAMA Pediatrics 2009
Penicillin
OR
(95% CI)
Nitrofurantoins
OR
(95% CI)
Sulfonamides
OR
(95% CI)
Left ventricular outflow
tract obstruction
1.0
(0.8 - 1.4)
1.6
(0.8 - 3.2)
2.9
(1.6 - 5.1)
Cleft lip with or without
cleft palate
0.8
(0.6 - 1.1)
1.9
(1.1 - 3.3)
1.0
(0.5 - 1.9)
Neural tube defects 0.9
(0.6 - 1.2)
1.4
(0.7 - 3.0)
1.4
(0.7 - 2.9)

26 26
Treating for Two Initiative
Expand research to fill knowledge gaps Accelerate epidemiologic research into medication
use and pregnancy outcomes
Evaluate evidence to develop
reliable guidance Establish ongoing systematic review of evidence and
expert body to translate into summary guidance
Deliver information to support
decision-making Disseminate up-to-date, clinically relevant information
to prescribers, pharmacists, patients, and consumers
www.cdc.gov/pregnancy/meds/treatingfortwo/index.html

27 27
Exploring Modifiable Risk Factors –
Medications with New and Expanded Uses
Pregnant women not included in clinical trials
Excluded because of safety concerns
Often use medications after licensure
New medications constantly introduced
Existing medications with new indications
Antiepileptic topiramate used as weight-loss product
Antiepileptics used to treat migraines
Want to include questions about why person
is taking medicine, and at what dosage

28 28
Birth Defects Study To Evaluate
Pregnancy Exposures
17 defects selected
Severity
Prevalence
Consistent ascertainment
7 centers
Arkansas, California, Georgia, Iowa,
Massachusetts, New York, North Carolina
Births starting January 1, 2014
Focus on first trimester exposures
www.cdc.gov/ncbddd/birthdefects/bd-steps.html

29 29
Exploring Modifiable Risk Factors
Maternal Disease and Treatment with Medications
Increased survival among women with
Cancer
Organ and tissue transplants
Increased prevalence
Asthma
Attention-deficit hyperactivity disorder
Assess diagnostic and treatment details
Diabetes
Mental health disorders

30 30
Going Beyond Case-Control Studies
To establish causation, confirmation of epidemiologic
findings needed
Surgeon General’s 2014 report included a finding that smoking is
causally related to orofacial clefts (such as cleft lip, cleft palate)
Isotretinoin and severe birth defects
Thalidomide and limb and other defects
Statistical modeling studies
Assess the prevention impact
of substituting “safer” medications
The health consequences of smoking: 50 years of progress. A Report of the Surgeon General, 2014.

31 31
Birth Defects Work Must Continue
Important to remember that 1 in 33 pregnancies are
affected by birth defects
Relatively common at the population level, but individual defects
are rarer
CDC’s Birth Defects Branch and its collaborators
continue to contribute to:
Identifying risk factors for birth defects among medicines,
diseases, and environmental factors
Assessing risk-benefit of medications
Determining whether there are safer safer
treatment options for certain diseases

32 32
Birth Defects Research and Emergency Preparedness: The Vaccines and Medications in
Pregnancy Surveillance System
Allen A. Mitchell, MD
Director, Slone Epidemiology Center
Professor of Epidemiology and Pediatrics,
Boston University Schools of Public Health and Medicine

33 33
Trends in Medication Use During Pregnancy
Pregnancy Health Interview Study (Birth Defects Study), Slone Epidemiology Center, Boston University

34 34
Specific Examples
Medications whose exposure prevalence in
pregnancy has increased in recent years include:
Selective serotonin reuptake inhibitors (SSRIs)
Attention deficit hyperactivity disorder medications, primarily
amphetamine mixed salts (e.g., Adderall®)
Mitchell, et al. AJOG, 2015.
Louik, et al. Pharmacoepidemiol Drug Saf, in press.
35 35
What Are the Implications of Greater
Medication Use During Pregnancy?
For the purposes of birth defects prevention, we
need to focus on medications and vaccines for
which:
Trends document increasing use in pregnant women
and
Pregnancy exposure is common but data on pregnancy risk and
safety are insufficient

36 36
Proportion of Women Receiving
Any Influenza Vaccine during Pregnancy
18%
56% 54%
0.0
10.0
20.0
30.0
40.0
50.0
60.0
2005 2006 2007 2008 2009 2010 2011 2012 2013
Pe
rce
nt
Vac
cin
ate
d
Last Menstrual Period Year
Exposed to any flu shot
Unpublished data; Birth Defects Study, Slone Epidemiology Center, Boston University
* Incomplete year
*
H1N1 influenza pandemic

37 37
Proportion of Women Receiving
Influenza Antiviral Drugs during Pregnancy
0.0%
2.4%
0.4%
0.0
0.5
1.0
1.5
2.0
2.5
3.0
2005 2006 2007 2008 2009 2010 2011 2012 2013
Pe
rce
nt
Re
ceiv
ing
An
tivi
ral
Last Menstrual Period Year
Exposed to Antiviral
*
Unpublished data; Birth Defects Study, Slone Epidemiology Center, Boston University
* Incomplete year

38 38
Proportion of Women Receiving
Tdap Vaccine During Pregnancy
0%
39%
0.0
5.0
10.0
15.0
20.0
25.0
30.0
35.0
40.0
45.0
2005 2006 2007 2008 2009 2010 2011 2012 2013
Pe
rce
nt
Exp
ose
d
Last Menstrual Period Year
Exposed to Tdap vaccine
*
Unpublished data; Birth Defects Study, Slone Epidemiology Center, Boston University
Tdap: Tetanus Toxoid, Diphtheria Toxoid, and Acellular Pertussis Vaccine
* Incomplete year

39
How Do We Learn About Risks and Relative Safety
for “New” Exposures in Pregnancy?
Need to identify risks and
relative safety of drugs,
vaccines, and biologics
(e.g., immune globulins)
used by pregnant women
Particularly important to
have a system that is agile
in its ability to identify and
study new products

40 40
Specifically designed to assess the risks and safety
of vaccines and medications used in pregnancy
Funding model is public-private partnership
Identifies wide range of relatively common adverse
pregnancy outcomes, including birth defects overall
Has statistical power to evaluate specific birth
defects and their possible causal relation to drugs
or vaccines
Vaccines and Medications in
Pregnancy Surveillance System (VAMPSS)

41 41
Objectives of VAMPSS
Targets new (and old) drugs and vaccines recommended
for use or have come into use during pregnancy
Current examples
Annual influenza, acellular pertussis vaccines
Future examples
Respiratory syncytial virus vaccines
Group B streptococcus vaccines
Emergent examples
Ebola vaccines, drugs, or biologics that might be licensed or approved for
emergency use
Prospective cohort and case-control study arms can direct
focus on new exposures within a few months’ time
VAMPSS: Vaccines and Medications in Pregnancy Surveillance System

42
Structure of VAMPSS
Organization of Teratology
Information Specialists
Research Center
at the University of
California San Diego
Tina Chambers, PhD, MPH
Kenneth Lyons Jones, MD
Slone Epidemiology Center
at Boston University
Allen A. Mitchell, MD
Carol Louik, ScD
Includes:
CDC
NICHD
NIAID
ACOG
AAP
Biostatistician
Consumer Representative
Independent Advisory
Committee
American Academy of Allergy Asthma and Immunology
Michael Schatz, MD, MS
VAMPSS: Vaccines and Medications in Pregnancy Surveillance System ACOG: American Congress of Obstetricians and Gynecologists
NICHD: National Institute of Child Health and Human Development AAP: American Academy of Pediatrics
NIAID: National Institute of Allergy and Infectious Diseases
Prospective Cohort Case-Control Study

43 43
Prospective Cohort – Organization of Teratology Information Specialists
OTIS is a North American network of university or
hospital-based services in existence since 1979
Specialists provide risk counseling to 80 - 100,000 pregnant women and health care providers per year
Network can screen callers from a geographically diverse area to identify those who received a vaccine or medication of interest, along with an unexposed comparison group
OTIS: Organization of Teratology Information Specialists

44 44
Participants of Prospective Cohort–OTIS
OTIS sites refer potential participants to
coordinating center
An exposed cohort, a disease-matched cohort and a healthy
unexposed cohort are concurrently recruited
Each cohort followed for birth defects overall, preterm birth,
growth and spontaneous abortion
All groups receive
A series of structured telephone interviews at standard time
points during and after pregnancy, and an outcome interview
Medical records review
OTIS: Organization of Teratology Information Specialists

45 45
Data Collected from
Prospective Cohort – OTIS
Maternal interviews and medical records review
provide detailed information
Dose, timing, duration of medication and vaccine exposure
Maternal disease or indication for medication
Pregnancy history, health history, demographics
Wide range of potential confounders including
Other prescription or over-the counter medications
Body mass index
Tobacco, alcohol and vitamin and mineral use
OTIS: Organization of Teratology Information Specialists

46 46
Case-Control–Birth Defects Study
BDS began in 1976 at Slone Epidemiology Center,
Boston University
Objectives
Identify risks and safety of a wide range of medications and
vaccines with respect to the wide range of specific birth defects
Establish ranges of risk for specific medications
Identify rates of exposure to specific agents
BDS: Birth Defects Study

47 47
Case-Control Study Participants–BDS
Study participants
Infants with specific major congenital malformations (cases)
Infants without congenital malformations (controls)
Multi center design
Hospital and clinic surveillance
Greater metropolitan Boston, Philadelphia, San Diego, Nashville
Birth defects registries
Massachusetts, New York
BDS: Birth Defects Study
48 48
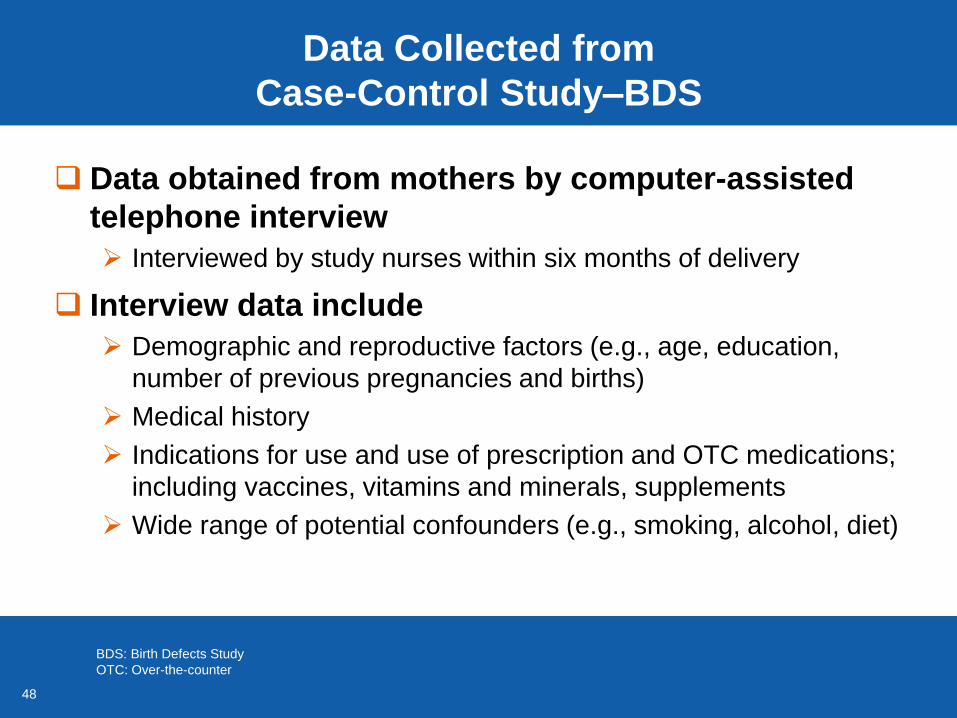
Data Collected from
Case-Control Study–BDS
Data obtained from mothers by computer-assisted
telephone interview
Interviewed by study nurses within six months of delivery
Interview data include
Demographic and reproductive factors (e.g., age, education,
number of previous pregnancies and births)
Medical history
Indications for use and use of prescription and OTC medications;
including vaccines, vitamins and minerals, supplements
Wide range of potential confounders (e.g., smoking, alcohol, diet)
BDS: Birth Defects Study
OTC: Over-the-counter

49 49
VAMPSS and Pandemic H1N1 Influenza
Anticipating a pandemic caused by H1N1 influenza
and the widespread use of the pH1N1 vaccine
among pregnant women in 2009 - 2010
BARDA requested VAMPSS to monitor the risks and
relative safety of the pandemic H1N1 vaccine and
influenza antiviral drugs
BARDA: Biomedical Advanced Research and Development Authority
VAMPSS: Vaccines and medications in pregnancy surveillance system
pH1N1: pandemic H1N1 influenza virus

50 50
Timeline for VAMPSS pH1N1 Studies
VAMPSS: Vaccines and medications in pregnancy surveillance system
pH1N1: pandemic H1N1 influenza virus
CBER/FDA: Center for Biologics Evaluation and Research at the Food and Drug Administration
ACIP: Advisory Committee on Immunization Practices
1976
pH1N1 vaccination
season
Oct 2009
July 2010
Dec 2010
Oct 2012
Preliminary data
presented to
VAMPSS
Advisory
Committee
Presentation
to
CBER/FDA
Presentation
to
ACIP
VAMPSS was able to quickly modify data collection
to meet the objectives of safety monitoring for pH1N1
vaccines and influenza antivirals in pregnant women
Start of BDS-Slone
case-control study
Mar 2012
51 51
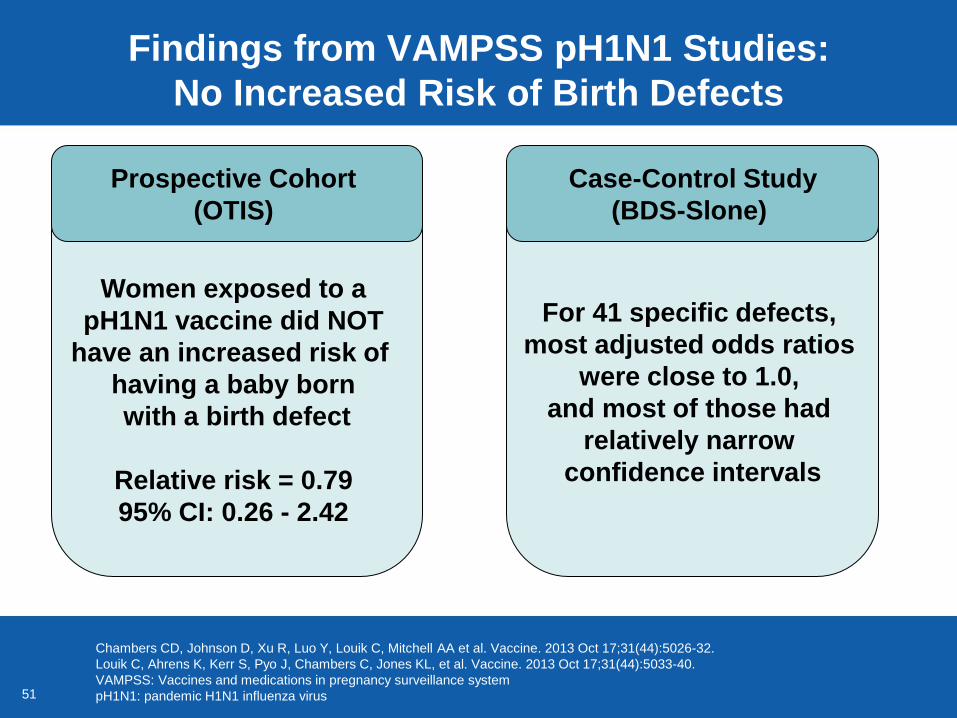
Findings from VAMPSS pH1N1 Studies:
No Increased Risk of Birth Defects
Chambers CD, Johnson D, Xu R, Luo Y, Louik C, Mitchell AA et al. Vaccine. 2013 Oct 17;31(44):5026-32.
Louik C, Ahrens K, Kerr S, Pyo J, Chambers C, Jones KL, et al. Vaccine. 2013 Oct 17;31(44):5033-40.
VAMPSS: Vaccines and medications in pregnancy surveillance system
pH1N1: pandemic H1N1 influenza virus
Women exposed to a
pH1N1 vaccine did NOT
have an increased risk of
having a baby born
with a birth defect
Relative risk = 0.79
95% CI: 0.26 - 2.42
Prospective Cohort
(OTIS)
For 41 specific defects,
most adjusted odds ratios
were close to 1.0,
and most of those had
relatively narrow
confidence intervals
Case-Control Study
(BDS-Slone)
52 52
Importance of VAMPSS for
Public Health Emergency Response
Pregnant women may be at high risk for complications
that endanger their pregnancies
Drugs, vaccines, or other medical products might be
used in pregnant women with little or no study
VAMPSS is proven to work in monitoring safety of
emergency countermeasures in pregnant women, on
short notice
VAMPSS represents a key tool to maintain confidence
among providers and the public that preventive
measures are being actively monitored for safety
VAMPSS: Vaccines and medications in pregnancy surveillance system

53 53
Identifying What Else We Can Do To Prevent Birth Defects
Suzanne Gilboa, PhD, MHS Partnerships and Applied Epidemiology Team Lead
Birth Defects Branch
Division of Birth Defects and Developmental Disabilities
National Center on Birth Defects and Developmental Disabilities

54 54
Folic Acid Fortification Prevents
Neural Tube Defects
In 1992, the U.S. Public Health
Service recommended all women of
childbearing potential consume
400μg folic acid daily
In 1998, enriched cereal grain
products were required to be
fortified at 140μg per 100g serving
Ready-to-eat cereals were allowed to
be fortified up to 400μg per serving
CDC. MMWR 1992;41(No. RR-14)
μg: Micrograms
g: Grams

55 55
0
1
2
3
4
5
6
7
8
9
1995 1996 1997 1998 1999 2000 2001 2002 2003 2004 2005 2006 2007 2008 2009 2010 2011
Cases p
er
10,0
00 l
ive b
irth
s
Year
Impact of U.S. Folic Acid Fortification on NTD
Pre-
fortification Post-fortification Optional
fortification
NTD: Neural tube defects
MMWR January 16, 2015 / 64(01);1-5
Prevented 15,000 cases of NTD
since 1999

56 56
What Else Might Have An Impact
on Birth Defects?
Use mathematical modeling of other risk factors to
see how we might have a further impact
Obesity
Pregestational diabetes
Smoking

57 57
Basic Modeling Approach
Use data inputs from the published literature
to estimate
Prevalence of the risk factor
Prevalence of the birth defect
Magnitude of association between risk factor and birth defects
If data not available from published literature, conduct a meta-
analysis to obtain a summary measure of association
Estimate the population attributable fraction for the
risk factor
Estimate the number of preventable birth defects
Modeling incorporates uncertainty (e.g., Monte Carlo simulation)

58 58
Overall Obesity Trends in the United States
CDC. U.S. Obesity Trends (www.cdc.gov/obesity/data/trends)
By 2010, every state had 20% or greater prevalence of obesity
1990 2010

59 59
Accounting for Uncertainty in the
Prevalence of Prepregnancy Obesity
For pregnant women, prepregnancy prevalence-18.7%
PRAMS has self-reported height and weight data
For U.S. women 20 years or older, obesity prevalence-33%
NHANES has measured height and weight data
For U.S. women 20 years or older, obesity prevalence-20%
BRFSS has self-reported height and weight data
Model used 18.7% estimate, plus bias factor based on
NHANES measured data and BRFSS self-reported data
Bias factor accounts for differences in these estimates
PRAMS: Pregnancy Risk Assessment Monitoring System
NHANES: National Health and Nutrition Examination Survey
BRFSS: Behavioral Risk Factor Surveillance System
Chu et al. Matern Child Health J 2009

60 60
Input Data to Model the Impact of
Prepregnancy Obesity on Birth Defects
Birth Defect
Strength of
Association
(Odds Ratio)
Estimated
Prevalence of
Birth Defect
in US*
Estimated Annual
Number of
Children Born
with Birth Defect
in US
Congenital heart defects 1.30 81.4 33,960
Spina bifida 2.24 3.5 1,460
Cleft lip with or without
cleft palate 1.20 10.63 4,437
* per 10,000 births
Honein, et al. Obesity 2013.
Stothard, et al. JAMA 2009.
Reller, et al. J Pediatr 2008.
Parker, et al. Birth Defects Res A Clin Molec Teratol 2010.

61 61
Estimates of the Impact of Reducing
Prepregnancy Obesity on Birth Defects
Annual Preventable Number
(95% Uncertainty Interval)**
Birth Defect
Population
Attributable
Fraction*
(95% Uncertainty
Interval)
If 100% Elimination
of Prepregnancy
Obesity
If 10% Reduction
in Prepregnancy
Obesity
Congenital heart defects 8%
(3%–14%)
2,850 (1,035–5,065)
285 (105–510)
Spina bifida 28%
(21%–34%)
405 (305–505)
40 (30–50)
Cleft lip with or without
cleft palate
6% (1%–11%)
260 (35–500)
25 (5–50)
* Population Attributable Fraction: The percent of cases estimated to be caused by prepregnancy obesity
** Rounded to the nearest 5
Honein, et al. Obesity 2013

62 62
Prevalence of Prepregnancy Diabetes
Among women of reproductive age,
diabetes prevalence estimates vary
between 1.9% and 4.0%
Additional 0.5% to 1% have
undiagnosed diabetes
Model used NHANES race-ethnicity
specific prevalence estimates for
women aged 20 - 44
Simeone, et al. Am J Prev Med 2014.
CDC. National Center for Health Statistics. Health Data Interactive. www.cdc.gov/nchs/hdi.htm.

63 63
Input Data to Model the Impact of
Diabetes Control on Congenital Heart Defects
Congenital Heart Defect
Odds Ratio
(Strength of
Association)
Estimated
Prevalence of
Birth Defect
in US*
Estimated
Annual Number
of Children Born
with Birth Defect
All congenital heart
defects 3.8 81.4 32,182
Coarctation of the aorta 3.7 4.5 1,767
Hypoplastic left heart
syndrome 3.7 2.3 909
Tetralogy of Fallot 6.5 4.0 1,570
* per 10,000 live births
Simeone, et al. Am J Prev Med 2014.
Reller, et al. J Ped 2008.

64 64
Estimates of the Impact of Diabetes Control on
Congenital Heart Defects
Annual Preventable Number
(95% Uncertainty Interval)*
Congenital Heart Defect
Population
Attributable
Fraction
(95% Uncertainty
Interval)
If Elimination of Risk
Associated with
Diabetes (Complete
Glycemic Control)
If 50% Reduction
in Risk
Associated with
Diabetes
All congenital heart
defects
8.3% (5.6%–11.8%)
2,670 (1,795–3,795)
1,335 (900–1,900)
Coarctation of the aorta 7.9%
(2.1%–17.8%)
140 (35–315)
70 (20–160)
Hypoplastic left heart
syndrome
8.0% (1.6% – 20.4%)
75 (15–185)
40 (10–95)
Tetralogy of Fallot 14.8%
(6.6% – 26.3%)
230 (105–415)
115 (55–210)
* Rounded to the nearest 5
Simeone, et al. Am J Prev Med 2014.

65 65
Potential Impact of Preconception Care on Costs
Associated with Birth Defects
Input Parameter Estimate
Prevalence of pregestational diabetes Diagnosed: 2.9% (2.7%-3.2%)
Undiagnosed: 0.5%
Percent of births affected by birth
defects among women with untreated
pregestational diabetes
7.3%
Preconception care effectiveness, risk
reduction 0.25 (0.15 - 0.42)
Lifetime costs of birth defects $411,723
Peterson, et al. Am J Obstet Gynecol 2014.
Hayes, et al. Prevent Chronic Dis 2011.
Razzaghi, et al. Primary Care Diab 2013.
Wahabi, et al. BMC Pregnancy Childbirth 2010.
Waitzman, et al. Inquiry 1994.

66 66
Potential Impact of Preconception Care on Costs
Associated with Birth Defects
Outcome Estimate
Birth defects averted 4,731 (4,158–5,215)
Total lifetime costs for birth
defects averted
$1.9 billion ($1.7–$2.1 billion)
Peterson, et al. Am J Obstet Gynecol 2014.

67 67
Smoking and Orofacial Clefts
50th Anniversary Surgeon General’s Report
Released in January 2014
Marked first confirmation of causal link between smoking in early
pregnancy and orofacial clefts
Smoking is one of the few known
risk factors for orofacial clefts
with potential for prevention
Prevalence of smoking
just before pregnancy: 23.2%
PRAMS: Pregnancy Risk Assessment Monitoring System
The health consequences of smoking: 50 years of progress. A Report of the Surgeon General, 2014.
Tong et al. MMWR Surveil Summ, 2013

68 68
Input Data to Model the Impact of
Smoking Cessation on Orofacial Clefts
* per 10,000 live births
Honein, et al. Birth Defects Res Part A 2014.
Hackshaw, et al. Human Reprod Update 2011.
Birth Defect
Odds Ratio
(Strength of
Association)
Estimated
Prevalence
of Birth
Defect in US*
Estimated
Annual Number
of Children
Born with Birth
Defect
Orofacial clefts 1.28 17.0 7088
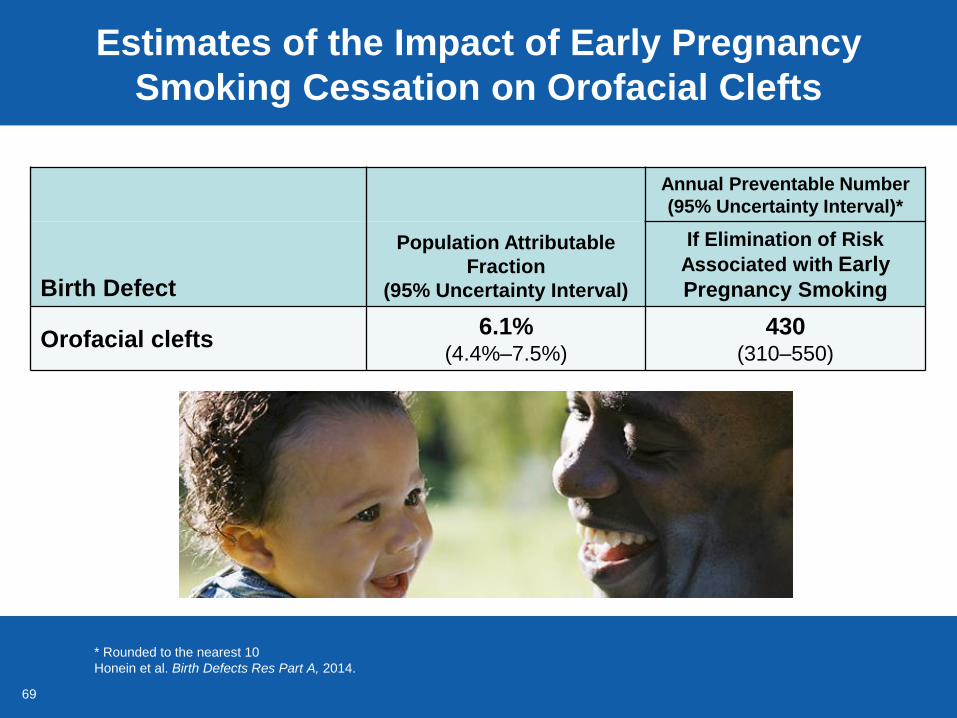
69 69
Estimates of the Impact of Early Pregnancy
Smoking Cessation on Orofacial Clefts
* Rounded to the nearest 10
Honein et al. Birth Defects Res Part A, 2014.
Annual Preventable Number
(95% Uncertainty Interval)*
Birth Defect
Population Attributable
Fraction
(95% Uncertainty Interval)
If Elimination of Risk
Associated with Early
Pregnancy Smoking
Orofacial clefts 6.1%
(4.4%–7.5%)
430 (310–550)

70 70
Advancing Prevention of Birth Defects
Birth defects are common, costly,
and critical
Majority of birth defects still do not have
an identifiable cause
The causes are likely to be multi-factorial with an
interaction between genetic factors and modifiable
(environmental) risk factors
Based on the modifiable risk factors that
have been recognized, we know that we
can improve prevention
71 71
CDC PUBLIC HEALTH GRAND ROUNDS
January 20, 2015
Understanding the Causes of Major Birth
Defects: Steps to Prevention