understanding the drought impact of el niño/la niña
TRANSCRIPT

Understanding the drought impact of El Niño/La Niña in the grain production areas in Eastern
Europe and Central Asia (ECA): Russia, Ukraine, and Kazakhstan (RUK)1
Russia, Ukraine, and Kazakhstan (RUK)
Understandingthe drought impact in the grain production areas in EasternEurope and Central Asia (ECA):
of El Niño/La Niña


Oscar RojasNatural Resources Officer, FAO
Angela PiersanteWorld Bank Consultant - Statistician
Migena CumaniWorld Bank Consultant – Remote Sensing/GIS, PMP
Yanyun LiData Management Specialist, FAO
Published byThe Food and Agriculture Organization of the United Nations
Rome, 2019
Understanding the drought impact of El Niño/La Niña in the grain production areas in Eastern
Europe and Central Asia (ECA): Russia, Ukraine, and Kazakhstan (RUK)

Requiredcitation:FAO and The World Bank. 2019. Understanding the drought impact of El Niño/La Niña in the grain production areas in Eastern Europe and Central Asia: Russia, Ukraine and Kazakhstan. Rome. 132 pp. http://www.fao.org/3/ca3758en/ca3758en.pdf. Licence: CC BY-NC-SA 3.0 IGO
The designations employed and the presentation of material in this information product do not imply the expression of any opinion whatsoever on the part of the Food and Agriculture Organization of the United Nations (FAO) or The World Bank concerning the legal or development status of any country, territory, city or area or of its authorities, or concerning the delimitation of its frontiers or boundaries. The mention of specific companies or products of manufacturers, whether or not these have been patented, does not imply that these have been endorsed or recommended by FAO or The World Bank in preference to others of a similar nature that are not mentioned.
The views expressed in this information product are those of the author(s) and do not necessarily reflect the views or policies of FAO or The World Bank.
ISBN 978-92-5-131342-8 (FAO)© FAO and International Bank for Reconstruction and Development/The World Bank, 2019
Some rights reserved. This work is made available under the Creative Commons Attribution-NonCommercial-ShareAlike 3.0 IGO licence (CC BY-NC-SA 3.0 IGO; https://creativecommons. org/licenses/by-nc-sa/3.0/igo).
Under the terms of this licence, this work may be copied, redistributed and adapted for non-commercial purposes, provided that the work is appropriately cited. In any use of this work, there should be no suggestion that FAO and/or The World Bank endorse any specific organization, products or services. The use of the FAO or The World Bank logo is not permitted. If the work is adapted, then it must be licensed under the same or equivalent Creative Commons license. If a translation of this work is created, it must include the following disclaimer along with the required citation: “This translation was not created by the Food and Agriculture Organization of the United Nations (FAO) or The World Bank. FAO and/or the World Bank are not responsible for the content or accuracy of this translation. The original English edition shall be the authoritative edition.”
Any mediation relating to disputes arising under the licence shall be conducted in accordance with the Arbitration Rules of the United Nations Commission on International Trade Law (UNCITRAL) as at present in force.
Third-party materials. Users wishing to reuse material from this work that is attributed to a third party, such as tables, figures or images, are responsible for determining whether permission is needed for that reuse and for obtaining permission from the copyright holder. The risk of claims resulting from infringement of any third-party-owned component in the work rests solely with the user.
Sales, rights and licensing. FAO information products are available on the FAO website (www. fao.org/publications) and can be purchased through [email protected]. Requests for commercial use should be submitted via: www.fao.org/contact-us/licence-request. Queries regarding rights and licensing should be submitted to: [email protected].
Cover photo: ©FAO

III
ContentsI. Acknowledgements...................................................................................................
II. Executive Summary..................................................................................................
1. Introduction..............................................................................................................
2. El Niño phenomenon................................................................................................
3. Data used on this study............................................................................................3.1. The Oceanic Niño Index (ONI)......................................................................... 3.2. Southern Oscillation Index (SOI)...................................................................... 3.3. Agriculture Stress Index (ASI)........................................................................... 3.4. Auxiliary data....................................................................................................
4. Results......................................................................................................................4.1. The correlation between areas affected by drought and El Niño indices....... 4.2. Frequency of drought occurrence................................................................... 4.3. Normalized Drought Index.............................................................................. 4.4. Agriculture Drought Index (DIX)...................................................................... 4.5. Normalized Drought Index (NDIX).................................................................. 4.6. Drought-gram for the RUK region................................................................... 4.7. Drought events during the period 1984-2015 assessed by ASI......................
5. Frequency of drought occurrence...........................................................................
6. Wheat production and El Niño/La Niña dominance in RUK region........................6.1 Ukraine..............................................................................................................6.2 Kazakhstan........................................................................................................6.3 Russian Federation............................................................................................
7. Panel Data Analysis (PDA)........................................................................................7.1 Ukraine..............................................................................................................7.2 Kazakhstan..........................................................................................................7.3 Russian Federation............................................................................................
8. Conclusions..............................................................................................................
References....................................................................................................................
VI
VIII
1
3
44567
111113 1414141517
20
22223035
45464748
51
55

IV
FiguresFigure 1. Maps of sea surface temperature anomaly in the Pacific Ocean during astrong La Niña (top, December 1988) and El Niño (bottom, December 1997)................
Figure 2. The process used to calculate the percentage of crop area affected by droughtand its agricultural stress index (ASI) at administrative unit level......................................
Figure 3. Spearman’s correlation between drought areas and El Niño indices.............
Figure 4 Agricultural drought frequency during El Niño (left) and La Niña (right)declared years...............................................................................................................
Figure 5. Normal conditions (upper part) compared with El Niño conditions (lower part)..
Figure 6. Drought-gram showing the intensity of droughts and El Niño events...........
Figure 7. Normal conditions (upper part) compared with El Niño conditions (lower part)...
Figure 8. Regions where the greatest impacts due to the shift in the jet stream as aresult of ENSO...............................................................................................................
Figure 9. The Oceanic Niño Index (ONI).......................................................................
Figure 10. The Oceanic Niño Index (ONI).....................................................................
Figure 11. The Oceanic Niño Index (ONI).....................................................................
Figure 12. Cropland distribution in the study area........................................................
Figure 13. Start of season (SOS) for First Crop Season..................................................
Figure 14. End of season (EOS) for First Crop Season..................................................
Figure 15. Crop calendar of the RUK region..................................................................
Figure 16. Correlation between ASI and ONI positive (El Niño)...................................
Figure 17. Correlation between ASI and ONI negative (La Niña)..................................
Figure 18. Drought Frequency of La Niña years............................................................
Figure 19. Drought Frequency of El Niño years............................................................
Figure 20. Normalized Drought Index in RUK region....................................................
Figure 21. Drought-Gram for Russian Federation, Ukraine and Kazakhstan. TheDrought gram shows the intensity of droughts and El Niño events..............................
Figure 22. Percentage of area affected by drought during the last drought events inKazakhstan (1984-2015).................................................................................................
Figure 23. Percentage of area affected by drought during the last drought eventsin Ukraine (1984-2015)...................................................................................................
Figure 24. Percentage of area affected by drought during the last drought eventsin Russian Federation (1984-2015).................................................................................
Figure 25. El Niño/La Niña dominance on the wheat production in RUK region..........
Figure 26. Ukraine Wheat Production by Oblast...........................................................
X
XI
XII
XIII
XIII
XIV
2
4
5
5
6
8
8
9
9
12
12
13
13
15
16
17
18
19
21
22

V
Figure 27. Winter wheat production share, Ukraine......................................................
Figure 28. Percentage area affected by drought, Ukraine.............................................
Figure 29. Severe drought scenario for wheat crop yield, Ukraine................................
Figure 30. Moderate drought scenario for wheat crop, Ukraine...................................
Figure 31. Severe drought scenario for maize crop, Ukraine.........................................
Figure 32. Moderate drought scenario for maize crop, Ukraine....................................
Figure 33. Wheat Production by Oblast, Kazakhstan.....................................................
Figure 34. Spring Wheat Production, Kazakhstan..........................................................
Figure 35. Percentage area affected by drought, Kazakhstan.......................................
Figure 36. Severe drought scenario for wheat crop, Kazakhstan..................................
Figure 37. Moderate drought scenarios for wheat, Kazakhstan....................................
Figure 38. Total Wheat Production, Russian Federation................................................
Figure 39. Winter Wheat Production, Russian Federation.............................................
Figure 40. Spring Wheat Production, Russian Federation.............................................
Figure 41. Percentage area affected by drought total wheat yield, Russian Federation.....
Figure 42. Percentage area affected by drought for winter wheat yield, Russian Federation....
Figure 43. Percentage area affected by droughts for spring wheat yield, Russian Federation..
Figure 44. Severe drought scenario for winter wheat crop, Russian Federation...........
Figure 45. Moderate drought scenario for winter wheat crop, Russian Federation......
Figure 46. Severe drought scenarios for spring wheat crop, Russian Federation.........
Figure 47. Moderate drought scenarios for spring wheat crop, Russian Federation....
Tables Table 1. ADM1 clusters according to drought levels and the wheat yield changeon the previous year......................................................................................................
Table 2. ADM1 clusters according to 100-ASI values and the maize yield changeon the previous year......................................................................................................
Table 3. ADM1 clusters according to 100-ASI values and the wheat yield changeon the previous year, Kazakhstan..................................................................................
Table 4. ADM1 clusters according to 100-ASI values and the winter wheat yieldchange rate on the previous year, Russian Federation..................................................
Table 5. ADM1 clusters according to 100-ASI values and the spring wheat yieldchange rate on the previous year, Russian Federation..................................................
23
24
27
27
29
30
30
31
32
34
34
35
36
37
38
38
39
41
42
44
44
25
28
33
40
43

Acknowledgements
We are grateful to the World Bank country offices in Kazakhstan, the Russian Federation, and Ukraine for their help with the provision of statistical agricultural production data; and FAO/EST(GIEWS) for the remote sensing data. For all useful feedback comments and all other forms of assistance, we would like to thank our colleagues at the World Bank: Ms. Marianne Grosclaude, Mr. Edinaldo Tebaldi, Ms. Eva Hasiner, and FAO-GIEWS colleagues for many rounds of useful discussions.

VII
Acronyms ADI Agricultural Drought Index
ADM Administrative Level
ASI Agriculture Stress Index
ASIS Agriculture Stress Index System
CI Confidence Interval
CPC Climate Prediction Center
EA Earth Observation
ECA Eastern Europe and Central Asia
ENSO El Niño–Southern Oscillation
EOS End of Season
FAO Food and Agriculture Organization of the United Nations
GAUL Global Administrative Unit Layers
GIEWS Global Information and Early Warning System
HCPC Hierarchical Clustering on Principal Component
IRI International Research Institute for Climate and Society
LTA Long-Term Average
NDIX Normalized Drought Index
NOAA National Oceanic and Atmospheric Administration
ONI Oceanic Niño Index
OLS Ordinary Least Squares
PDA Panel Data Analysis
PCA Principal Component Analysis
RUK Russian Federation, Ukraine and Kazakhstan Region
SOI Southern Oscillation Index
SOS Start of Season
SPOT Satellite pour l’Observation de la Terre
SST Sea Surface Temperature
USDA United States Department of Agriculture
VGT Vegetation
VHI Vegetation Health Index
WB World Bank
WMO World Meteorological Organization

VIII
Executive Summary
Grain production in the Russian Federation, Ukraine, and Kazakhstan (RUK)
The grain production areas of the Russian Federation, Ukraine, and Kazakhstan (RUK) represented 29 per cent of the total wheat exports in Europe and Central Asia in 2016, up from approximately 17 per cent in 2008 and a mere 1 per cent in 1991. The primary grain exported by the RUK region is wheat, accounting for more than 70 per cent of grain exports (followed by barley with 20 per cent). The RUK region is now considered to have the potential to strengthen global food security by expanding its grain production and exports.
Agricultural production in the RUK area is vulnerable to climate variability and drought in particular. Grain production has rebounded since the 2000s in the region, except for several years with unfavourable weather, including the severe droughts of the years 2010 and 2012. The heat wave and drought of 2010 affected all major grain producing areas of RUK.
Drought and climate variability impact in RUK
Drought and climate variability cut grain yields in the Russian Federation by a third compared to the previous year. In Ukraine, droughts are now occurring on average once every three years (FAO, 2014). Consequently, Ukraine is characterised by volatile wheat and coarse grain productivity, and on average wheat production changes by 20 per cent every three years, with a significant impact on Ukraine’s exports. In Kazakhstan, drought has been identified as the most significant risk to agricultural production. Suffering from drought in 11 out of the 20 years between 1986 and 2006, Kazakhstan faced agricultural losses, with five consecutive drought years between 1994 and 1998 (World Bank, 2006). Three additional severe droughts occurred between 2006 and 2012. The risk of drought is higher for rain-fed crop production in Northern Kazakhstan where grain production suffers from drought in two out of five years (World Bank, 2015).
Relationship between El Niño/La Niña events and climate variability
The relationship between El Niño/La Niña events and climate variability, including drought, in RUK is not well documented, nor is their impact at the production level. Some El Niño events have, in the past, become associated with

IX
drought across Ukraine, the Russian Federation, and Kazakhstan with reports of a significant impact on wheat crops. To develop recommendations on how RUK could become more reliable suppliers of grain on world markets, even in El Niño/La Niña years, researchers need to undertake further analysis in the relationships between El Niño/La Niña, drought, and grain production in RUK.
El Niño/La Niña and global impact
El Niño is a local warming of surface waters that takes place in the entire equatorial zone of the central and eastern Pacific Ocean of the Peruvian coast and which affects the atmospheric circulation worldwide (Kiladis and Diaz, 1989). It usually peaks around Christmas, hence the name of the phenomenon: El Niño is Spanish for “Christ Child.” La Niña refers to the cold equivalent of El Niño.
El Niño and La Niña are opposite phases of a natural climate pattern across the tropical Pacific Ocean that swings back and forth every 3 to 7 years on average (Figure 1). Together, they are called ENSO (pronounced “en-so”), which is short for El Niño-Southern Oscillation. The ENSO pattern in the tropical Pacific can be in one of three states: El Niño, Neutral, or La Niña. El Niño (the warm phase) and La Niña (the cool phase) lead to significant differences from the average ocean temperatures, winds, surface pressure, and rainfall across parts of the tropical Pacific. Neutral indicates that conditions are near their long-term average.
El Niño and La Niña can make extreme weather events more likely in certain regions. Predicting the life cycle and strength of El Niño and La Niña is critical for helping people plan for, avoid, or mitigate potential damages in every sector of society, including agriculture, fisheries, energy, water, transportation, and healthcare.
El Niño and Climate Change
There are many ways in which global warming could affect the frequency and intensity of El Niño/La Niña, but scientists currently have low confidence in their ability to predict exactly how a warmer world will affect the ENSO. Scientists have high confidence, however, that ENSO itself has been occurring for thousands of years and will continue in the future. Global warming is likely to affect the impacts related to El Niño and La Niña, including extreme weather events (IPCC, 2013).

X
Drought events measured by Agricultural Stress Index (ASI)
The Food and Agriculture Organization of the United Nations (FAO) has developed an agricultural drought monitoring system to support individual countries in monitoring and managing agricultural drought and the risks it entails. The tool uses satellite data to detect agricultural areas (farmland) in which crops might be affected by drought. The Agriculture Stress Index System (ASIS) is globally operational at FAO-Rome by the Global Information and Early Warning System (GIEWS) http://www.fao.org/giews/earthobservation.
Figure 1. Maps of sea surface temperature anomaly in the Pacific Ocean during a strong La Niña (top, December 1988) and El Niño (bottom, December 1997). Source: National Oceanic and Atmospheric Administration of United States (NOAA).
The surveillance of agricultural drought is a continuous activity along the year. It is based on satellite information received from FAO every 10-day over the recent 30+ years, which is an ideal period for monitoring annual crops, as it considers the water contribution made by soil water holding capacity. The results are then summed up in maps that are easily interpreted by decision-makers that can implement the drought mitigation activities in time.

XI
The first step in ASIS is to calculate the average Vegetation Health Index (VHI) as crop development proceeds (timescale), which makes it possible to assess the intensity and duration of dry periods during the crop cycle at the pixel level. The second step is the calculation of the percentage of agricultural area affected by drought (pixels with VHI<35: a value identified as a critical threshold in previous studies) to assess the spatial extent of the drought. Finally, the whole administrative area is classified according to the percentage of affected areas (Figure 2). For agriculture, it is important to focus on the periods most sensitive to water stress, such as the flowering and grain filling phases. ASIS evaluates the severity (intensity, duration, and spatial extent) of the agricultural drought and presents the results by administrative unit, thereby allowing for comparison with the country’s agricultural statistics.
Figure 2. The process used to calculate the percentage of crop area affected by drought and its agricultural stress index (ASI) at the administrative unit level. The graph on the upper right-hand shows the Vegetation Health Index (VHI) temporal average values, while the graph on the lower right-hand displays their VHI spatial values. Droughts are ranked at four levels: extreme (red), severe (pink), moderate (yellow), and slight (light green). The dark-green pixels reflect normal vegetative growth.
Relationship between drought events and El Niño indices in the RUK region
A correlation analysis was carried out between the agricultural areas affected by drought (ASI) and El Niño indices (ONI and SOI). The time series of ASI data at the subnational level was divided into two data sets: one containing the positive values of each El Niño event and one dataset with the negative

XII
values. The positive values of ONI represent El Niño years (in the case of SOI, the negative values) and the negative values of ONI represent La Niña years (positive values of SOI).
Spearman’s correlation analysis was performed. This type of correlation is known as a non-parametric measure of statistical dependence between two variables (ASI and El Niño indices), even if their relationship is not linear. The sign of the Spearman correlation indicates the direction of the association between the independent variable (El Niño index) and the dependent variable (ASI). If the agricultural area affected by drought tends to increase when ONI increases, the Spearman correlation coefficient is positive (negative in the case of SOI due to negative values). If the agricultural area affected by drought tends to decrease when the ONI index increases, the Spearman correlation is negative.
Red shaded areas on the maps show the more sensitive agricultural areas during El Niño/La Niña years. Green shaded areas show an inverse correlation during El Niño years when correlated with ONI. In these areas, favourable climatic conditions seem to prevail during El Niño, and increased crop production is expected. Figure 3 (Left) shows droughts triggered by El Niño are mainly localised on the Central and Volga regions of the Russian Federation. The rest of the RUK area does not show to be sensitive to El Niño events. Figure 3 (Right) shows the results of ONI (negative values of La Niña) and drought in agriculture. In this case, the red areas represent the areas where La Niña events are correlated with the increase of drought events. Northern Kazakhstan is sensitive to La Niña events. La Niña events trigger drought in the most productive areas of the country. Moreover, the areas close to the border between Kazakhstan and the Southern and North Caucasus in Russia are sensitive to drought triggered by the La Niña phenomenon.
Figure 3. Spearman’s correlation between drought areas and El Niño indices. Red areas represent sensitive areas to El Niño (left) and La Niña (right) events, where droughts could increase in the presence of El Niño/La Niña events.Source: Global Administrative Unit Layers (GAUL) of FAO

XIII
Determination of the agricultural drought-prone areas in the RUK region
Figure 4 shows the frequency of drought on the agricultural areas during the La Niña and El Niño declared years. The RUK region exhibits more sensitivity to suffering from droughts during La Niña (Figure 4, right) years than during El Niño years (Figure 4, left).
Figure 4. Agricultural drought frequency during El Niño (left) and La Niña (right) declared yearsSource: Global Administrative Unit Layers (GAUL) of FAO
The results of the Normalized Drought Index for the RUK region are shown in Figure 5. Kazakhstan is the topmost prone to drought (>30% of drought occurrence) when compared to Ukraine and the Russian Federation in the agriculturally productive areas of the country (Northern area). However, the agricultural productive area of Ukraine (Southern area), the winter wheat (Southern and North Caucasus) and the spring wheat areas (Siberia) in the Russian Federation show a considerable risk of drought (10-15% of drought occurrence).
Figure 5. Normalized Drought Index in the RUK region. Kazakhstan displays more than 30% of drought occurrence.Source: Global Administrative Unit Layers (GAUL) of FAO

XIV
Sensitivity to El Niño, Neutral, or La Niña events
As a complement to the Normalized Drought Index, we introduced the Drought-gram (Figure 6), a tool specifically developed to classify the arbitrary categories of drought: Extreme, Severe, Moderate, Mild, and None (we consider that less of 10% of area affected by drought could be managed by farmers, which would not always be the case).
Drought-gram offers additional information about whether a given year affected by drought corresponds to an El Niño, Neutral, or La Niña event. Observations made using Drought-gram were able to show that most of the years are transitional years from one phase to another making interpretations more complex because some areas of RUK are sensitive to El Niño and others to La Niña.
Drought-gramDrought category 1984 1985 1986 1987 1988 1989 1990 1991 1992 1993 1994 1995 1996 1997 1998 1999 2000 2001 2002 2003 2004 2005 2006 2007 2008 2009 2010 2011 2012 2013 2014 2015
Ukraine La Niña El Niño Dominance La Niña Dominance El Niño Dominance La Niña Dominance El Niño Extreme >40%Severe 30-40%Moderate 20-30%Mild 10-20%None < 10%
KazakhstanExtreme >40%Severe 30-40%Moderate 20-30%Mild 10-20%None < 10%
Russia FederationSpring wheat
Extreme >40%Severe 30-40%Moderate 20-30%Mild 10-20%None < 10%
Russia FederationWinter wheat
Extreme >40%Severe 30-40%
Moderate 20-30%Mild 10-20%None < 10%
TimeLa Niña Neutral El Niño
% a
rea
affe
cted
by d
roug
ht
Figure 6. Drought-gram showing the intensity of droughts and El Niño events
Differences related to the impact in agriculture could be explained by the timing of El Niño or La Niña phenomena, the intensity of their effect, the local climate events that could mitigate El Niño/La Niña, the phenological phase of the crop during the peak of rainfall reduction and the geographical epicentre of impact of the current El Niño/La Niña.
Another variable that could be related to drought during winter is snow cover; if there is a reduction of the depth of snow, winter wheat could be affected during the dormancy period. Low precipitation, resulting in diminished snow cover, would reduce the protection of dormant wheat plants against frost kill temperatures (usually below -18°C) during winter months. Low precipitation

XV
and thin snow cover have also jeopardised the soil moisture availability for the post-dormant growing period.
Overall, Kazakhstan suffers from more intense and frequent droughts in the RUK region. Droughts in Kazakhstan are more associated with La Niña than with El Niño phenomenon.
Quantification of drought events using statistical analysis in RUK
Statistical analysis was conducted first at the administrative level of each country’s organisation (Region, Oblast, Republic, and Krai) to provide insights, data, and information to support decision making, strategic planning, and geographic targeting at subnational and national.
• The Principal Component Analysis (PCA) technique was used to identify the most vulnerable areas clustered by production and yield in the RUK region as well as to assess and characterise the impact of drought-related events on major agricultural crop yields.
• The Econometric Data Panel Analysis was carried out to elaborate crop forecasting models at the country level, and to highlight the anomalous variations related to significant episodes during El Niño and La Niña events.
Drought Impact Assessment in Ukraine
Winter wheat and maize crops represent 80% of total cereal production; each of them accounted for about 40%. El Niño in 2007 and La Niña in 2012 strongly affected the winter wheat and maize yields. Though wheat grows throughout the country, Southern-Central is the main wheat production area in Ukraine.
The Southern-Central area (38% production share) suffered from a severe drought which resulted in an average yield decrease of 26% in 2007 and 43% in 2012. The Central region (30% production share) experienced moderate-dry periods with an average yield decrease of 1% in 2012. The Northern-West (30% production share) area, on the other hand, was not affected by significant events of drought as no water stress conditions were detected; hence, yield increased by 16% in 2007 and 8% in 2012 respectively.
At the country level, the winter wheat yield change is predicted to decline by 1.0% for a decrease of 1.0% in 100-ASI.

XVI
The maize crop is cultivated throughout the country, particularly in the Southern-Central area (42% production share). This area endured severe droughts - with yield drops of 33% in 2007 and 43% in 2012. The Central area (33% production share) underwent moderate and dry periods resulting in an average yield decrease of 28% in 2012. The Northern-West area (23% production share), which was not water-stressed, showed no yield drops during the drought years. At the national level, the yield is estimated to decline by 0.60% for a decrease of 1% in 100-ASI.
Drought Impact Assessment in Kazakhstan
About 80% of Northern Kazakhstan contributes to a major share of wheat production. The three main “oblasts” accountable for the national wheat production are by far Kustanayskaya, Akmolinskaya, and Severo-Kazachstanskaya.
The correlation analysis has confirmed that the most significant droughts occurred in 1998, 2008, 2010 and 2012. Those droughts strongly affected Kazakhstan and were influenced by La Niña. The Northern area includes the three most productive regions accounting for 80% of production share. Kustanayskaya and Akmolinskaya suffered from severe drought, and Severo-Kazachstanskaya experienced dry periods; their average yield decreased 45% in 1998, 26% in 2008, 40% in 2010, and 55% in 2012. At the country level, the spring wheat yield is predicted to decline by 1.38% for each drop of 1.0% of 100-ASI (log-linear model).
Drought Impact Assessment in the Russian Federation
The production share of wheat in the Russian Federation accounts for 80% of the total cereal production value (FAO, 2017), of which winter wheat and spring wheat account each for a 50%. The most productive areas are the Central and Southern parts of the country. However, the most affected regions by drought are in the Southern area, bordering with Northern Kazakhstan, which is, in turn, the most distressed area by drought.
The winter wheat crop is cultivated mainly in the South, Volga, and Central areas, where conditions for winter crops are most favourable.
The most significant drought episodes occurred under the influence of La Niña -in 1998 and 2010. Throughout these years, Volgogradskaya (7% production share) in the South region was the most affected area by a severe drought. Its yield declined by 35% in 1998 and 36% in 2010. Also, the Volga district (11%

XVII
production share) suffered from extreme-severe drought associated with a decrease in average yield of 60% and 49%, respectively. The Central region (23% production share), on the other hand, has undergone a moderate and dry period resulting in yield drops respectively of 19% and 41%.
At the country level, the winter yield change is estimated to decline by 0.87 % for a decrease in 100-ASI of 1.0%.
Siberia, Ural and Volga produce most of the spring wheat in the Russian Federation. The correlation analysis shows that significant drought events occurred during La Niña years -1998, 2010, and 2012.
The Volga region (25% production share) suffered from severe drought (Orenburgskaya and Saratovskaya Oblasts), moderate drought (Bashkortostan Republic and Samarskaya Oblast) and dry periods (Tatarstan Republic, Nizhegorodskaya and Ulyanovskaya Oblasts), and had an average yield loss of 52% in 1998, 51% in 2010 and 20% in 2012. Likewise, in the Urals area (16% production share), yield decreased respectively by 40%, 15% and 42%. The Siberian region (42% production share) experienced no water stress conditions, and its average yield declined by 4%, 17% and 30%, thus leading to assume drought was not the main cause of the yield loss in this area.
At the country level, the spring yield is estimated to fall by 0.95% for each drop of 1% in 100- ASI (log-linear model).
Overall, statistical analysis reveals that the negative effects of drought had a sudden and severe impact on spring wheat yield, producing more damage in the early stages of the growing crop in Kazakhstan. This phenomenon also occurred in the Russian Federation, though less intensely, whereas the winter wheat and maize yield appear to be affected by a more constant yield decrease in Ukraine and the Russian Federation.

®FAO

Understanding the drought impact of El Niño/La Niña in the grain production areas in Eastern
Europe and Central Asia (ECA): Russia, Ukraine, and Kazakhstan (RUK)1
1. Introduction
El Niño is a local warming of surface waters that takes place in the entire equatorial zone of the central and eastern Pacific Ocean of the Peruvian coast and which affects the atmospheric circulation worldwide (Kiladis and Diaz, 1989). It usually peaks around Christmas, hence the name of the phenomenon: El Niño is Spanish for “Christ Child.” La Niña refers to the cold equivalent of El Niño. It is a recurrent weather phenomenon that takes place approximately every two to seven years and usually lasts between 12 and 18 months (CPC, 2005). An El Niño event is defined by a high Oceanic Niño Index (ONI), which is based on Sea Surface Temperature (SST) departures from average in the region in the central equatorial Pacific. An El Niño episode is associated with persistent warmer than average sea surface temperatures and consistent changes in wind and rainfall patterns (Figure 1) (Ropelewski and Halpert, 1992; IRI, 2013). Despite their periodic and recurrent manifestations, El Niño episodes do not have a deterministic trend1 with fixed occurrence periods and a constant intensity.
As a result, stochastic models2 have been developed to predict the onset and intensity of El Niño episodes. However, while the accuracy of these models in predicting the onset of an El Niño episode is fairly high, the intensity is much more difficult to predict due to random atmospheric disturbances that may dampen or amplify the intensity of an El Niño occurrence and thus its impact on weather patterns (CPC, 2005).
The Southern Oscillation is an East-West balancing movement of air masses between the Pacific and the Indo-Australian areas. It is associated (roughly synchronised) with typical wind patterns and El Niño, and measured by the Southern Oscillation Index (SOI) (Parker, 1983). El Niño is the oceanic component, while the Southern Oscillation is the atmospheric one. This combination gives rise to the term ENSO (El Niño – Southern Oscillation). Although there is no perfect correlation between El Niño and the Southern Oscillation with regards to minor variations, large negative values of the SOI are associated with warm events.
1 Processes or projects having only one outcome are said to be deterministic: their outcome is ‘pre-determined’. A deterministic algorithm, for example, if given the same input information, will always produce the same output information.
2 In probability theory, a purely stochastic system is one whose state is non-deterministic (i.e. random) so that the subsequent state of the system is determined probabilistically. Any system or process that must be analyzed using probability theory is stochastic at least in part.

Understanding the drought impact of El Niño/La Niña in the grain production areas in Eastern Europe and Central Asia (ECA): Russia, Ukraine, and Kazakhstan (RUK)
2
Major meterological institutes closely monitor El Niño conditions and update forecasts accordingly. The early warning provided by climate scientists each year enables governments throughout the region to discuss and implement El Niño-related contingency plans. In order to assess the impact of drought, the FAO Agriculture Stress Index (ASI) is used as an indicator. ASI is based on remote sensing data that highlights anomalous vegetation growth and potential drought conditions in arable lands during a given cropping season (Rojas et al., 2011).
The main threat to crops is drought. However, El Niño could produce other climatic impacts, including flash floods or intense hurricanes that could influence the crop season, disrupting agricultural activities and damaging crops. ASI cannot assess the negative impact of flash floods or hurricanes, but only the positive ones, if any, due to the increase of water availability after intense rains.
The objective of this study is to enhance our understanding of the impacts of the El Niño phenomenon on the grain production areas in Eastern Europe and Central Asia (ECA): Russia, Ukraine and Kazakhstan (RUK) using FAO´s Agricultural Stress Index System (ASIS).
Figure 7. Normal conditions (upper part) compared with El Niño conditions (lower part). By disrupting the atmospheric circulation in the planet’s largest ocean basin, El Niño shifts the average location and strength of the mid-latitude jet streams, producing “side effects” on weather around the globe.

Understanding the drought impact of El Niño/La Niña in the grain production areas in Eastern
Europe and Central Asia (ECA): Russia, Ukraine, and Kazakhstan (RUK)3
2. El Niño phenomenon
According to the World Meteorological Organization (WMO, 2014), research conducted over recent decades has shed considerable light on the important role played by interactions between the atmosphere and ocean in the tropical belt of the Pacific Ocean in altering global weather and climate patterns. During El Niño events, for example, sea temperatures at the surface in the central and eastern tropical Pacific Ocean become substantially higher than normal. In contrast, during La Niña events, the sea surface temperatures in these regions become lower than normal. These temperature changes are strongly linked to major climate fluctuations around the globe and, once initiated, such events can last for 12 months or more.
The strong El Niño event of 1997-1998 was followed by a prolonged La Niña phase that extended from mid-1998 to early 2001. El Niño/La Niña events change the likelihood of particular climate patterns around the globe, but the outcomes of each event are never exactly the same. Furthermore, while there is generally a relationship between the global impacts of El Niño/La Niña events and their intensity, there is always potential for one such event to generate serious impacts in some regions irrespective of its intensity. There is a consensus among climatologic agencies about the general impacts of El Niño and La Niña around the globe as summarised in Figure 2. The information does not highlight any impact on the area of current study.
From an agricultural and food security point of view, referring only to cereal crops, it is important to know the potential impacts of El Niño/La Niña: is the potential damage of drought linked to the intensity, duration, or onset of the phenomenon? Are the Russian Federation, Kazakhstan, and Ukraine vulnerable to the impact, and which areas within these countries are more vulnerable than others? What has been the frequency and impact of droughts in their croplands over the last 30 years?
To answer these questions, we have examined the recent outputs of ASI from 1984 to the present. During this 30 year timeframe of remote sensing data, 10 El Niño events and 10 La Niña events occurred (each event covers typically the half of two years).

Understanding the drought impact of El Niño/La Niña in the grain production areas in Eastern Europe and Central Asia (ECA): Russia, Ukraine, and Kazakhstan (RUK)
4
Figure 8. Regions where the greatest impacts due to the shift in the jet stream as a result of ENSO. The highlighted areas indicate significant variations from normal weather. The magnitude of the change from normal is dependent upon the strength of the El Niño or La Niña.Source: NOAA http://www.srh.noaa.gov/jetstream/tropics/enso_impacts.html
3. Data used in this study
3.1 The Oceanic Niño Index (ONI)
The Oceanic Niño Index (ONI) has become the de facto standard that the National Oceanic and Atmospheric Administration (NOAA) uses to identify El Niño (warm) and La Niña (cool) events in the tropical Pacific (Figure 3). It is the three month mean Sea Surface Temperature (SST) anomaly for the El Niño 3.43 region (i.e., 5°N-5°S, 120°-170°W). Events are five consecutive overlapping three-month periods at or above the +0.5°C anomalies for warm (El Niño) events and at or below the -0.5°C anomalies for cold (La Niña) events. The threshold is further broken down into Weak (with a 0.5 to 0.9°C SST anomaly), Moderate (1.0 to 1.4°C) and Strong (≥ 1.5°C) events. Events receive the category of weak, moderate, or strong if they equal or exceed the threshold for at least three consecutive overlapping three month periods.
3 Niño 3.4 (5N-5S, 170W-120W): The Niño 3.4 anomalies may be thought of as representing the average equatorial SSTs across the Pacific from about the dateline to the South American coast. The Niño 3.4 index typically uses a 5-month running mean, and El Niño or La Niña events are defined when the Niño 3.4 SSTs exceed +/- 0.4°C for a period of six months or more.

Understanding the drought impact of El Niño/La Niña in the grain production areas in Eastern
Europe and Central Asia (ECA): Russia, Ukraine, and Kazakhstan (RUK)5
Figure 9. The Oceanic Niño Index (ONI)Source: http://ggweather.com/enso/oni.htm
Figure 10. The Oceanic Niño Index (ONI)Source: http://ggweather.com/enso/oni.htm
3.2 Southern Oscillation Index (SOI)
The Southern Oscillation Index, or SOI, helps understand the development and intensity of El Niño or La Niña events in the Pacific Ocean. The SOI is calculated using the pressure differences between Tahiti and Darwin. There are different methods of calculating the SOI. This study uses the data calculated by the Australian Bureau of Meteorology. http://www.bom.gov.au/climate/glossary/soi.shtml
Sustained negative values of the SOI below −8 often indicate El Niño episodes. These negative values are usually accompanied by sustained warming of the central and eastern tropical Pacific Ocean and a decrease in the strength of the Pacific trade winds. Sustained positive values of the SOI above +8 are typical of a La Niña episode. They are associated with

Understanding the drought impact of El Niño/La Niña in the grain production areas in Eastern Europe and Central Asia (ECA): Russia, Ukraine, and Kazakhstan (RUK)
6
stronger Pacific trade winds and warmer sea temperatures to the north of Australia. Waters in the central and eastern tropical Pacific Ocean become cooler during this time.
Figure 11. The Oceanic Niño Index (ONI)
3.3 Agriculture Stress Index (ASI)
The Agriculture Stress Index (ASI) http://www.fao.org/giews/earthobservation/ is an indicator that highlights anomalous vegetation growth and potential drought in arable lands during a given cropping season.
ASI integrates the Vegetation Health Index (VHI) in two dimensions that are critical to assessing a drought event in agriculture: temporal and spatial. ASI assesses the temporal intensity and duration of dry periods and calculates the percentage of arable lands affected by drought. Pixels with a VHI value below 35 per cent –identified as a critical level in previous studies to assess the extent of the drought (Kogan, 1994; Unganai and Kogan, 1998). The whole administrative area is classified according to the percentage of arable areas affected by drought conditions (Rojas, et al. 2011; Roel et al. 2016). ASI cannot assess the impacts of flash floods. The current version of ASI has the following limitations:
• The index detects extreme events of drought, which means that agricultural areas affected by moderate drought (referring to a temporary intensity at pixel level) would be neglected.

Understanding the drought impact of El Niño/La Niña in the grain production areas in Eastern
Europe and Central Asia (ECA): Russia, Ukraine, and Kazakhstan (RUK)7
• It defines two cropping seasons around the globe. This definition works properly for most areas; however, there are regions such as Central America where there are four crop seasons in a calendar year. In ASI the first crop season does not necessarily represent the main crop season, but rather the first crop season in a calendar year.
• The current version gives equal weight to all phenological phases when calculating the temporal integration without regard to the crop water requirements and their implications on crop yield reduction
• Regarding specifically the case of the Russian Federation, where 50% of the wheat is produced in winter and 50% produced in spring, the results of ASI (global version) would have less explicative power because of the mixed signal of both crop seasons captured by satellite. The total national figures of wheat come from different geographic areas with different planting times and length of crop cycles.
The limitations mentioned above could be solved using the newly developed tool known as FAO-Country-level ASIS http://www.fao.org/3/CA0986EN/ca0986en.pdf, which is a standalone version of ASIS calibrated with ground information provided by countries (Rojas, 2015). Country-level ASIS allows introducing national crop masks, planting dates, and the crop water requirements so each specific crop is analysed with the tool.
3.4 Auxiliary data
This study uses a cropland distribution layer calculated as a percentage of cropland area for each pixel (approximately 1 km resolution) prepared by Cumani and Rojas (2016). To determine the growing period, the start of season (SOS) and end of season (EOS) were derived from the SPOT-VGT time series (1998-2011) as displayed in figures 12-14. The method of White et al. (1997) for defining the length of the crop cycle was modified by applying a 25 per cent threshold for SOS and a 75 per cent threshold for EOS. The study considered these thresholds more appropriate for defining the growing period of annual crops. This analysis resulted in the following map for the RUK region:

Understanding the drought impact of El Niño/La Niña in the grain production areas in Eastern Europe and Central Asia (ECA): Russia, Ukraine, and Kazakhstan (RUK)
8
Figure 12. Cropland distribution in the study areaSource: Global Administrative Unit Layers (GAUL) of FAO
Figure 13. Start of season (SOS) for First Crop SeasonSource: Global Administrative Unit Layers (GAUL) of FAO

Understanding the drought impact of El Niño/La Niña in the grain production areas in Eastern
Europe and Central Asia (ECA): Russia, Ukraine, and Kazakhstan (RUK)9
Crop Jan Feb Mar Apr May Jun Jul Aug Sep Oct Nov DecWinter wheatSpring wheat
Planting Resume TilleringDormancy Flowering Waxy to Fully Ripe
Figure 14. End of season (EOS) for First Crop SeasonSource: Global Administrative Unit Layers (GAUL) of FAO
3.5 Crop calendar of the RUK region
Figure 15 presents the crop calendar for the length of two planting cycles in the RUK region: winter and spring wheat.
Figure 15. Crop calendar of the RUK region
In general, winter cereals have a much higher yield than spring cereals as they make use of snow as moisture for growth. This fact explains in part the highest wheat yield of Ukraine and the low yields of Kazakhstan.

Understanding the drought impact of El Niño/La Niña in the grain production areas in Eastern Europe and Central Asia (ECA): Russia, Ukraine, and Kazakhstan (RUK)
10®FAO

Understanding the drought impact of El Niño/La Niña in the grain production areas in Eastern
Europe and Central Asia (ECA): Russia, Ukraine, and Kazakhstan (RUK)11
4. Results
4.1. The correlation between areas affected by drought and El Niño indices
A correlation analysis was carried out among the agricultural areas affected by drought (ASI) and El Niño indices (ONI and SOI). The time series of ASI data at a subnational level was divided into two data sets: one containing the positive values of each El Niño event and one dataset with the negative values. The positive values of ONI represent El Niño years (in the case of SOI the negative values) and negative values of ONI represent La Niña years (positive values of SOI). Also, non-neutral years were taken into consideration. Spearman’s correlation analysis was performed. This type of correlation is known as a nonparametric measure of statistical dependence between two variables (ASI and El Niño indices), even if their relationship is not linear. The sign of the Spearman correlation indicates the direction of the association between the independent variable (El Niño index) and the dependent variable (ASI). If the agricultural area affected by drought tends to increase when ONI increases, the Spearman correlation coefficient is positive (negative in the case of SOI due to negative values). If the agricultural area affected by drought tends to decrease when the ONI index increases, the Spearman correlation is negative. Colour red is assigned to the positive correlation because the area affected by drought increases at GAUL level 1 (region/oblast level) when ONI increases. The red areas on the maps show the more sensitive agricultural areas during El Niño years. The green areas show an inverse correlation during El Niño years when correlated with ONI. In these areas, favourable climatic conditions seem to prevail during El Niño, and increased crop production is expected. Figures 9-11 show that droughts triggered by El Niño are localised mainly on the Central and Volga regions of the Russian Federation. The rest of the RUK area does not seem to be sensitive to El Niño events.
Figure 10 shows the results of ONI (negative values of La Niña) and drought in agriculture. Northern Kazakhstan is sensitive to La Niña events that trigger drought in the most productive areas of the country. Moreover, the areas close to the border between Kazakhstan, Southern and North Caucasus in Russia are sensitive to drought triggered by the La Niña phenomenon.

Understanding the drought impact of El Niño/La Niña in the grain production areas in Eastern Europe and Central Asia (ECA): Russia, Ukraine, and Kazakhstan (RUK)
12
Figure 16. Correlation between ASI and ONI positive (El Niño)Source: Global Administrative Unit Layers (GAUL) of FAO
Figure 17. Correlation between ASI and ONI negative (La Niña)Source: Global Administrative Unit Layers (GAUL) of FAO

Understanding the drought impact of El Niño/La Niña in the grain production areas in Eastern
Europe and Central Asia (ECA): Russia, Ukraine, and Kazakhstan (RUK)13
4.2. Frequency of drought occurrence
Figures 18 and 19 show drought frequency on the agricultural areas during the La Niña and El Niño declared years. The RUK region exhibits more sensitivity to suffering droughts during La Niña years than El Niño years.
Figure 18. Drought Frequency of La Niña yearsSource: Global Administrative Unit Layers (GAUL) of FAO
Figure 19. Drought Frequency of El Niño yearsSource: Global Administrative Unit Layers (GAUL) of FAO

Understanding the drought impact of El Niño/La Niña in the grain production areas in Eastern Europe and Central Asia (ECA): Russia, Ukraine, and Kazakhstan (RUK)
14
4.3. Normalized Drought Index
ASIS evaluates the severity (intensity, duration and spatial extent) of the agricultural drought during the current year and presents the final results by administrative unit, thereby allowing for comparison between the concerned areas. Drought metrics such as Mean, Standard deviation, Minimum, Maximum, Median, Sum, Long-term average were extracted. All these metrics are accessible at the sub-national level (Gaul 2-polygon) by year for the period between 1984-2014.
4.4. Agriculture Drought Index (DIX)
Using the ASIS database, it has been noted that some areas show high intensity and duration of drought and low occurrence of drought while other areas seem to have a relatively lower intensity and duration of drought and very high occurrence of drought, as well as a mixed combination of intensity and frequency. Therefore, an index was constructed to support the process of identification of drought hotspots (Cumani and Rojas, 2016) Figure 20. This index accounts for all the conditions of drought mentioned above and indicates the intensity and frequency of drought events for each area over the 33 year period. The agriculture Drought Index (DIX) was calculated using the magnitude and frequency of drought occurrence. Both of these metric descriptors indicate the severity and the recurring incidences of the drought phenomenon. DIX considers both the level of impact over the same area and the extent and time of the natural spatial-temporal hazard such as drought. The magnitude is defined as the total of all ASI mean values extracted for administrative unit. The frequency is calculated based on the number of events which have occurred during the respective years.
DIX= Magnitude (Sum) * Frequency (Count) (1)
4.5. Normalized Drought Index (NDIX)
The Normalized Drought Index is calculated based on the range of the Drought Index (Minimum and Maximum values for each area) scaled between 0 and 100. It was designed to re-scale the drought index aiming at indicating the distribution of drought occurrence hotspots worldwide. The NDIX was calculated using the formula below:
NDIX=((((DIX – DIX(min))) ⁄ ( (DIX(max) – DIX(min)))*100) (2)
Where:DIX is the actual value of the Drought Index for each pixel

Understanding the drought impact of El Niño/La Niña in the grain production areas in Eastern
Europe and Central Asia (ECA): Russia, Ukraine, and Kazakhstan (RUK)15
DIX(min) is the minimum value of the Drought Index for each pixel and,DIX(max) is the maximum value of the Drought Index for each pixel.
Figure 20 shows the results of the Normalized Drought Index for the RUK region. Kazakhstan is the topmost prone to drought (>30% of drought occurrence) when compared to Ukraine and the Russian Federation in the agriculturally productive areas of the country (Northern area). However, the productive areas of Ukraine (Southern area), the winter wheat (Southern and North Caucasus), and the spring wheat areas (Siberia) in the Russian Federation show a considerable risk of drought (10-15% of drought occurrence).
Figure 20. Normalized Drought Index in the RUK regionSource: Global Administrative Unit Layers (GAUL) of FAO
4.6. Drought-gram for the RUK region
As a complement to the Normalized Drought Index we introduced the Drought-gram, a tool specifically developed to classify the arbitrary categories of drought: Extreme, Severe, Moderate, Mild and None (we consider that less of 10% of area affected by drought could be managed by farmers which would not always be the case) (Figure 21). The Drought-gram offers additional information whether a particular year affected by drought corresponds to an El Niño, Neutral or La Niña event. Observations made using Drought-gram were able to show that most of the years are transitional years from one phase to another making interpretation more complex because some areas of RUK are sensitive to El Niño and others to La Niña. For instance, in 1998 the first part of the year was under the influence of El Niño however during the second part of the year, the climate was under the impact of La Niña. On the other hand, the planting dates and the crop cycle lengths are different (i.e. the Russian Federation plants and produces 50% of

Understanding the drought impact of El Niño/La Niña in the grain production areas in Eastern Europe and Central Asia (ECA): Russia, Ukraine, and Kazakhstan (RUK)
16
winter wheat from August to July and the remaining 50% of spring wheat from May to August). Kazakhstan produces most of the spring wheat from May to August. Wheat in Kazakhstan represents roughly 80% of the cereals production value share. Then the final impact on wheat crop in RUK in 1998 was influenced on the geographical position and time (defined by the water requirements of the phenological phase of wheat) that are sensitive to El Niño and/or La Niña. For instance, Ukraine appears to be neutral to this transition - from warm to cold event; however, Kazakhstan and the Russian Federation, increase the agricultural area affected by drought with more intensity in Kazakhstan for spring wheat. A very similar situation happened in 2010; however, in this year, the strong impact affected the agricultural areas of the Russian Federation. Finally, 2007 depicts a similar transition, but in this case, only Ukraine was affected.
Those differences related to the impact of the three years analysed (1998, 2007 and 2010) could be explained by the time to pick the event (El Niño or La Niña), the intensity of the events, the local climate events that could mitigate El Niño/La Niña, the phenological phase of the crop during the peak of rainfall reduction, and the geographical epicenter of impact of the current El Niño/La Niña. Another variable that could be related to drought during winter is snow cover; if there is a reduction of the depth of snow, winter wheat could be affected during the dormancy period4. Low precipitation, resulting in diminished snow cover, would reduce the protection of dormant wheat plants against frost kill temperatures (usual below -18°C) during winter months. Low precipitation and thin snow cover have also jeopardised the soil moisture availability for the post-dormant growing period.
Drought-gramDrought category 1984 1985 1986 1987 1988 1989 1990 1991 1992 1993 1994 1995 1996 1997 1998 1999 2000 2001 2002 2003 2004 2005 2006 2007 2008 2009 2010 2011 2012 2013 2014 2015
Ukraine La Niña El Niño Dominance La Niña Dominance El Niño Dominance La Niña Dominance El Niño Extreme >40%Severe 30-40%Moderate 20-30%Mild 10-20%None < 10%
KazakhstanExtreme >40%Severe 30-40%Moderate 20-30%Mild 10-20%None < 10%
Russia FederationSpring wheat
Extreme >40%Severe 30-40%Moderate 20-30%Mild 10-20%None < 10%
Russia FederationWinter wheat
Extreme >40%Severe 30-40%
Moderate 20-30%Mild 10-20%None < 10%
TimeLa Niña Neutral El Niño
% a
rea
affe
cted
by d
roug
ht
4 Dormancy is a period in an organism’s life cycle when growth, development, and (in animals) physical activity are temporarily stopped. This minimizes metabolic activity and therefore helps an organism to conserve energy. Dormancy tends to be closely associated with environmental conditions.
Figure 21. Drought-Gram for the Russian Federation, Ukraine, and Kazakhstan. The Drought gram shows the intensity of droughts and El Niño events.

Understanding the drought impact of El Niño/La Niña in the grain production areas in Eastern
Europe and Central Asia (ECA): Russia, Ukraine, and Kazakhstan (RUK)17
4.7. Drought events during the period 1984-2015 assessed by ASI
Kazakhstan
Overall, Kazakhstan is one of the three countries of RUK, which suffers from more intense and frequent droughts (Figure 22). The droughts in Kazakhstan during the 32 year-time series of analysis, are more related to La Niña than to El Niño phenomenon. Three cases were related to El Niño; in 1986 and 1991, years which are classified as the moderate El Niño and in 2004 classified as a weak El Niño.
Figure 22. Percentage of area affected by drought during the last drought events in Kazakhstan (1984-2015).Source: Global Administrative Unit Layers (GAUL) of FAO

Understanding the drought impact of El Niño/La Niña in the grain production areas in Eastern Europe and Central Asia (ECA): Russia, Ukraine, and Kazakhstan (RUK)
18
Ukraine
Ukraine has experienced fewer drought events and less intense; there is no clear influence of El Niño or La Niña (Figure 23). The two most extended drought events were produced one in 1986 by El Niño and in 2007 by La Niña. Both events impact different geographical areas of the country.
Figure 23. Percentage of area affected by drought during the last drought events in Ukraine (1984-2015).Source: Global Administrative Unit Layers (GAUL) of FAO
Russian Federation
In the Russian Federation, the events of drought are less frequent than in Kazakhstan during spring wheat; however, the frequency increases during the winter wheat (ASI should detect the winter kill effect after the dormancy period).
During the moderate El Niño 1986/87, the entire RUK region suffered from drought. The impact on the productive winter wheat areas in the Russian Federation was catastrophic; approximately 85% of the winter wheat areas were affected by a severe drought that reduced snow cover during the winter months (Figure 24). There is a clear increase of drought events on the winter wheat (Russian Federation) during the dominance of El Niño. This situation is not present during spring wheat. At the country level, there is no

Understanding the drought impact of El Niño/La Niña in the grain production areas in Eastern
Europe and Central Asia (ECA): Russia, Ukraine, and Kazakhstan (RUK)19
clear relation between El Niño and La Niña. However, we have more noise in the analysis due to the different areas where spring and winter wheat (mix vegetation signal) are planted. The temporal differences between both crop seasons are exposed to El Niño or La Niña in different ways and produce different levels of impacts.
Figure 24. Percentage of area affected by drought during the last drought events in the Russian Federation (1984-2015).Source: Global Administrative Unit Layers (GAUL) of FAO

Understanding the drought impact of El Niño/La Niña in the grain production areas in Eastern Europe and Central Asia (ECA): Russia, Ukraine, and Kazakhstan (RUK)
20
5. Wheat production and El Niño/La Niña dominance in the RUK region
Rojas et al., 2014 introduced the hypothesis of El Niño/La Niña dominance as cycles, where consecutive years were under the influence of a warm or cold phase. From 1984 to 1992, the El Niño phase appeared dominant for nine years; from 1993 to 2000, eight years were under the influence of La Niña; 2001 to 2007 were years under the influence of El Niño; and the years 2008 to 2013 were influenced by the La Niña effect.
Neutral and La Niña years during the dominance of El Niño behave as El Niño years, causing extended droughts in agriculture at a global level. The largest drought that occurred in the last 30 years, during the first crop season, corresponds to La Niña (1989) under the influence of El Niño’s dominant cycle, affecting 20 per cent of the worldwide agricultural surface. On the other hand, an El Niño year that takes place during La Niña’s dominance seems to have less impact on crop areas. This situation could explain why El Niño 1997/98 did not produce the impacts anticipated, affecting only four per cent of the total agricultural area.
This study assesses the impact of El Niño/La Niña dominance on the wheat production in the RUK region. Spring wheat production decreases on average in Kazakhstan and the Russian Federation during the period that climate is driven by La Niña (Figure 25) whereas the opposite happens during the winter wheat in Ukraine where wheat production increases during La Niña events. During winter wheat in the Russian Federation, this situation is less clear (Figure 25).

Understanding the drought impact of El Niño/La Niña in the grain production areas in Eastern
Europe and Central Asia (ECA): Russia, Ukraine, and Kazakhstan (RUK)21
Figure 25. El Niño/La Niña dominance on the wheat production in the RUK region

Understanding the drought impact of El Niño/La Niña in the grain production areas in Eastern Europe and Central Asia (ECA): Russia, Ukraine, and Kazakhstan (RUK)
22
6. Crop yield and El Niño/La Niña in the RUK region
6.1. Ukraine
Wheat is grown throughout the country, but central and south-central Ukraine are the key wheat production zones (USDA, 2014).
Figure 26. Ukraine Wheat Production by OblastSource: USDA
Figure 27 indicates the national production share (https://www.sott.net/article/186921-Dryness-Lowers-Ukraine-Winter-Wheat-Production-Estimates) each region contributes to the national area. The Zakarpats´Ka oblast contributes less than 1% to the national production total.

Understanding the drought impact of El Niño/La Niña in the grain production areas in Eastern
Europe and Central Asia (ECA): Russia, Ukraine, and Kazakhstan (RUK)23
Figure 27. Winter wheat production share, Ukraine
About 95 per cent of Ukraine´s wheat is “winter wheat,” and it is planted in the fall and harvested during July and August of the following year. On average, approximately 15 per cent of fall-planted crops fail to survive the winter. The amount of winterkill varies widely from year to year, from 2 per cent in 1990 to a staggering 65 per cent in 2003, when a persistent ice crust smothered the crops. The wheat yield declined during the 1990’s following the breakup of the Soviet Union and the loss of heavy State subsidies for agriculture. Farms struggled with cash shortages, and the use of fertiliser and plant-protection chemicals plummeted. Due to a combination of favourable weather and a modest but steady improvement in the financial condition of many farms, wheat production has rebounded in recent years “except for the disastrous 2003/04 crop which fell victim to unusually severe winter weather” (ICSU, 2008)
ASI would capture the areas affected by winterkill when resuming tillering5
in spring, the difference between vegetation reflectance than normal is interpreted by ASI as a drought that in this specific case represents the decrease in biomass due to winterkill. Ukraine has the highest wheat yield of the RUK region, owing it to the fact that the bulk of wheat is planted as a winter crop.
5 The tillering stage begins with the emergence of lateral shoots (tillers) at the base of the main stem of the plant. The tillering stage usually begins when a plant has three or more fully developed leaves—the height of the plant does not matter, only the number of leaves. Each tiller has the potential to produce a grain head, which is why it is so important to have as many as possible.
Tillers form primarily in the fall or early winter. Tiller growth then either slows or stops during the coldest winter months and starts again briefly when the weather warms again. (During the spring, there is a short period of vegetative growth before small grains switch from producing tillers to starting reproductive growth.)

Understanding the drought impact of El Niño/La Niña in the grain production areas in Eastern Europe and Central Asia (ECA): Russia, Ukraine, and Kazakhstan (RUK)
24
Figure 28, compares the ASI values with the wheat yield together with El Niño/La Niña events. During La Niña effect of 1995-96 and 2011-12 - droughts occurred during the second year of the event. Both events were classified as weak La Niña events. During El Niño events (Moderate: 2002-03 and Weak: 2006-07) the impact also takes place only during the second year.
Figure 28. Percentage area affected by drought, Ukraine
The most extended drought in Ukraine was experienced in 1986 followed by 2007 (Figure 28). Considering the concept of El Niño and La Niña dominance, there is evidence that wheat yield is higher during La Niña than during El Niño dominance.
Furthermore, the winter wheat and maize crops represented 80% of total cereal production value, of which each account for about 40% (FAO, 2015). Consequently, data analysis at the subnational level has been focused on the design of two models, including administrative units (ADM1s) only with more than 1.0 % of wheat and maize production during the period 2000-2014.
In 2007 and 2012 the drought effect caused most of the yield reduction, confirmed by significant correlations between the wheat yield and 100-ASI6 (Annex 2). Over these years, subnational areas have been identified in order to quantify the level of the yield reduction in correspondence to the drought effect, as follows:
6 100-ASI is only a transformation of the ASI variable. ASI represents percentage of agricultural area affected by drought then 100-ASI represents percentage of agricultural area NOT affected by drought. 100-ASI has been introduced to facilitate the interpretation by adopting a direct proportional relationship between yield and ASI variables.

Understanding the drought impact of El Niño/La Niña in the grain production areas in Eastern
Europe and Central Asia (ECA): Russia, Ukraine, and Kazakhstan (RUK)25
a) Winter wheat crop
The main information emerged by the analysis (Annex 3) is summarised in Table 1, reporting the data according to the geographic-area, production share and the average 100-ASI values in the drought years associated to each ADM1 as well as the average of the yield variation rate from the previous year. The data is organised by sorting out the geographical area from the lowest 100-ASI values (“Extreme” – “Severe” drought) to the highest (“No water stress”), both for wheat and maize crops, to obtain the following clusters:
• The Southern area, representing 38% of the production share, seems to have mostly been affected by the drought. They marked the lowest values of 100-ASI in the country (average of 2007 and 2012), thus representing an “Extreme”–“Severe” drought period, to which the highest average yield change on previous year decrease has corresponded.
• The central area together with Krym, accounting for 30% of production share, shows values of 100-ASI between 60% and 90% with a slight decrease of 1% in 2012 only.
• The Northern-West area, representing 30%, has marked values of 100-ASI over 90%, with no relevant drop.
Table 1. ADM1 clusters according to drought levels and the wheat yield change on the previous year
Geo-graphic
AreaADM1 Production
Share
AVG of 100-ASI
(2007 and 2012)
AVG of Yield Change rate
on previous year
2007 2012
Southern - Centre (38%)
Khersons’ka 7% 33%
-26% -43%
Dnipropetrovs’ka 3% 36%
Zaporiz’ka 6% 36%
Mykolayivs’ka 7% 37%
Odes’ka 7% 47%
Kirovohrads’ka 6% 58%
Donets’ka 2% 56%

Understanding the drought impact of El Niño/La Niña in the grain production areas in Eastern Europe and Central Asia (ECA): Russia, Ukraine, and Kazakhstan (RUK)
26
Geo-graphic
AreaADM1 Production
Share
AVG of 100-ASI
(2007 and 2012)
AVG of Yield Change rate
on previous year
2007 2012
Central (30%)
Vinnyts’ka 6% 67%
3% -1%
Krym 6% 68%
Cherkas’ka 5% 72%
Kharkivs’ka 4% 78%
Luhans’ka 1% 80%
Poltavs’ka 4% 84%
Kyyivs’ka 4% 87%
North-ern-West
(30%)
Sums’ka 4% 90%
16% 8%
Ternopil’s’ka 3% 95%
Chernihivs’ka 2% 97%
Khmel’nyts’ka 6% 97%
Zhytomyrs’ka 2% 98%
Rivnens’ka 2% 98%
Chernivets’ka 3% 98%
L’vivs’ka 3% 99%
Ivano-frankivs’ka 2% 100%
Volyns’ka 3% 100%
Moreover, this result is also confirmed by comparing the ASI values7 of the “Severe” drought scenario in 2007 with the moderate drought scenario in 2012 (Figures 29-30).
The most vulnerable ADM1s that marked the highest ASI values (>50%) were in the Southern area, to which corresponded the highest difference of the current year yield with the yield Long-Term Average (2000-2014 LTA).
Although the map of severe drought shows that all regions were affected by the drought, the highest ASI values were in the Southern area with the highest variation from LTA yield (-1.12 t/ha and -1.07 t/ha in 2007).
7 The maps have been created on the original ASI data and reflect different drought level within the country.

Understanding the drought impact of El Niño/La Niña in the grain production areas in Eastern
Europe and Central Asia (ECA): Russia, Ukraine, and Kazakhstan (RUK)27
Figure 29. Severe drought scenario for wheat crop yield, UkraineSource: Global Administrative Unit Layers (GAUL) of FAO
At the same time, the moderate scenario also shows that the Southern area, achieved ASI values >50% which corresponded to the highest negative yield variation (-1.24 t/ha in 2012).
Figure 30. Moderate drought scenario for wheat crops, UkraineSource: Global Administrative Unit Layers (GAUL) of FAO

Understanding the drought impact of El Niño/La Niña in the grain production areas in Eastern Europe and Central Asia (ECA): Russia, Ukraine, and Kazakhstan (RUK)
28
b) Maize crop
Concerning maize crop, Table 2 summarises the main information emerged by the correlation analysis (Annex 4), identifying the following groups:
• The Centre-Southern area, which represents 42% of the production share and seems to have been more affected by the drought. They reported the lowest values of 100-ASI of the country (average of 2007 and 2012), thus representing “Extreme”–“Severe” drought period, corresponding to the highest average yield change from previous year.
• The Centre-Northern, accounting for 33%, and which marked values of 100-ASI between 70%-90% with a yield decrease of 28% in 2012.
• The Northern-West area, representing 23%, and which marked values of 100-ASI more than 90%, with no relevant drops.
Table 2. ADM1 clusters according to 100-ASI values and the maize yield change on the previous year
Geographic Area ADM1 Production
Share
AVG of 100-ASI
(2007 and 2012
AVG of Yield Change rate on previous year
2007/06 2012/11
Cen-tre-South-ern (42%)
Dnipropetrovs’ka 11% 36%
-33% -43%
Odes’ka 7% 47%
Kirovohrads’ka 7% 58%
Donets’ka 6% 56%
Zaporiz’ka 5% 36%
Mykolayivs’ka 4% 37%
Khersons’ka 2% 33%
Centre- Northern
(33%)
Cherkas’ka 8% 72%
2% -28%
Poltavs’ka 8% 84%
Luhans’ka 6% 80%
Vinnyts’ka 5% 67%
Kharkivs’ka 4% 78%
Kyyivs’ka 2% 87%

Understanding the drought impact of El Niño/La Niña in the grain production areas in Eastern
Europe and Central Asia (ECA): Russia, Ukraine, and Kazakhstan (RUK)29
Geographic Area ADM1 Production
Share
AVG of 100-ASI
(2007 and 2012
AVG of Yield Change rate on previous year
2007/06 2012/11
North-ern-West
(23%)
Chernivets’ka 9% 98%
10% -1%
Zakarpats’ka 4% 90%
Ternopil’s’ka 3% 95%
Chernihivs’ka 2% 97%
Khmel’nyts’ka 2% 97%
Ivano-frankivs’ka 2% 100%
Sums’ka 1% 90%
Similar evidence seems to be confirmed by comparing the “Severe” and “Moderate” drought years’ scenarios. The maps in Figures 30 and 31 show that the most productive area of maize in the Southern-Central areas of Ukraine was also the most vulnerable. At the same time, this area was also the most affected by the drought in the two scenarios (with ASI values >50%)6, marking the highest negative yield variations from the LTA yield (-1.8 t/ha in 2007 and -1.39 t/ha in 2012).
Figure 31. Severe drought scenario for maize crop, UkraineSource: Global Administrative Unit Layers (GAUL) of FAO

Understanding the drought impact of El Niño/La Niña in the grain production areas in Eastern Europe and Central Asia (ECA): Russia, Ukraine, and Kazakhstan (RUK)
30
6.2. Kazakhstan
Kazakhstan is divided into 14 administrative territories, or oblasts. About 75% of the country’s wheat is produced in three oblasts in north-central Kazakhstan: Kostanai, Akmola, and North Kazakhstan (Figures 33). Minor grains include spring barley and oats (which are grown in the same region as spring wheat), winter wheat (Southern Kazakhstan), and rice (Southern Kazakhstan, mostly in Kzyl-Orda oblast).
Figure 32. Moderate drought scenario for maize crop, UkraineSource: Global Administrative Unit Layers (GAUL) of FAO
Figure 33. Wheat Production by Oblast, KazakhstanSource: Global Administrative Unit Layers (GAUL) of FAO

Understanding the drought impact of El Niño/La Niña in the grain production areas in Eastern
Europe and Central Asia (ECA): Russia, Ukraine, and Kazakhstan (RUK)31
Spring wheat accounts for 95 % of the total wheat area in Kazakhstan and virtually all of the wheat in the three north-central oblasts (USDA, 2010).
Figure 33 reports the wheat production share on the total country average, from 1995 to 2015, for each region (Kazhakstan, 2016).
Figure 34. Spring Wheat Production, Kazakhstan
Spring grain planting typically begins in mid-May and finished by early June. The crops advance through the reproductive stage during mid-July, when temperatures climb to their highest levels and grains are most vulnerable to heat stress. Grain harvest begins in late August and continues through October (USDA, 2010). Therefore, episodes of El Niño that run during May, July can cause drought conditions that strongly affect the crops’ growing season in this country.
Kazakhstan has the lowest yield (1.00 t/ha) of the three countries (RUK region) since the yield is based on the spring cycle (May to August) of the wheat production. The spring wheat is more vulnerable to drought due to lack of snow contribution to soil moisture. Based on the agricultural time series (1992-2015) the reduction wheat yield in Kazakhstan due to droughts are more frequently related to La Niña events than to El Niño events. During the dominance of La Niña, the wheat yield tends to decrease and, during the El Niño dominance, it tends to increase (Figure 35).

Understanding the drought impact of El Niño/La Niña in the grain production areas in Eastern Europe and Central Asia (ECA): Russia, Ukraine, and Kazakhstan (RUK)
32
Figure 35. Percentage area affected by drought, Kazakhstan
The drought years with a significant correlation between wheat yields and 100-ASI values turned out to be 1998, 2008, 2010 and 2012 (Annex 5) which affected the entire country.
Table 3 recaps the main information associated with the drought events (100-ASI average) and shows that no regions experienced on average a scarcity of “No water stress” events, over these years.
The highest negative yield losses which strongly impacted the country seem to have been detected in the Northern area, together with considerable yield decreases in the West area, confirm the high vulnerability of this region.
At the same time, the Southern-East area, under episodes which varied from moderate drought to dry periods, also reported substantial losses, though lower.

Understanding the drought impact of El Niño/La Niña in the grain production areas in Eastern
Europe and Central Asia (ECA): Russia, Ukraine, and Kazakhstan (RUK)33
Table 3. ADM1 clusters according to 100-ASI values and the wheat yield change on the previous year, Kazakhstan.
Geographic Area ADM1 Production
Share
AVG of 100-ASI
(1998-2008-2010-2012)
AVG of Yield Change rate on previ-ous year
1998/97 2008/07 2010/09 2012/11
Northern (80%)
Kustanayskaya 29% 52%
-45% -26% -40% -55%Akmolinskaya 25% 52%
Severo-kazach-stanskaya 27% 75%
Western(4%)
Aktyubinskaya 2% 46%
-78% 31% -43% -51%Zapadno-ka-zachstanskaya 2% 73%
Southern - East
(16%)
Pavlodarskaya 2% 68%
12% -49% -35% -28%
Jambylslkaya 2% 74%
Karagandinskaya 3% 80%
Vostochno-ka-zachstanskaya 3% 81%
Almatinskaya 3% 86%
Yujno-kazach-stanskaya 2% 88%
The observations mentioned above also seem to be confirmed by comparing the two scenarios of the “Severe” and “Moderate” drought years (Figure 36 and 37). Both scenarios show that all ADM1s were affected by the drought, even though with different intensity. Specifically, the severe scenario reveals that the most vulnerable regions with the highest ASI values (>50%) were in the Northern area, corresponding to the highest difference of the current year yield with the yield Long-Term Average (1995-2015 LTA). In fact, although the map of severe drought (Figure 36) shows that all regions have undergone the drought effect, the highest ASI values were marked in the Northern area with the highest negative yield variations from LTA (-0.52 t/ha and -0.63 t/ha in 1998).

Understanding the drought impact of El Niño/La Niña in the grain production areas in Eastern Europe and Central Asia (ECA): Russia, Ukraine, and Kazakhstan (RUK)
34
Figure 36. Severe drought scenario for wheat crops, KazakhstanSource: Global Administrative Unit Layers (GAUL) of FAO
Nevertheless, the moderate scenario, characterized by ASI values <50% (average of 2008, 2010 and 2012), shows drought periods affected the whole country, especially Akmolinskaya (ASI = 37%, to which corresponds a difference of -0.23 t/ha vs LTA) and Kustanayskaya (ASI = 35% corresponding to a difference of -0.20 t/ha vs LTA).
Figure 37. Moderate drought scenarios for wheat, KazakhstanSource: Global Administrative Unit Layers (GAUL) of FAO

Understanding the drought impact of El Niño/La Niña in the grain production areas in Eastern
Europe and Central Asia (ECA): Russia, Ukraine, and Kazakhstan (RUK)35
6.3. Russian Federation
The Russian Federation consists of 46 provinces (oblasts), 22 republics, 3 federal cities, 1 autonomous oblast, and 3 autonomous districts. The most important food crop is wheat, which was planted on more than 50 per cent of the cereal-crop area in the 1960s and 1970s. In comparison with most cereals of the moderate zone, wheat is very vulnerable to cool weather and soil acidity. Both factors limited the geographical distribution of the wheat crop to the wooded steppe and steppe zones.
Figure 38 illustrates the main productive areas of the country with the relative regional average percentage contribution to the national wheat production.
Figure 38. Total Wheat Production, Russian FederationSource: Rosstat
The winter wheat crop is cultivated mainly in the Ukranian, the Northern Caucasus, and the Black Earth regions (Voronezh Oblast, Lipetsk Oblast, Belgorod Oblast, Tambov Oblast, Oryol Oblast, and Kursk Oblast), where conditions for winter crops were most favourable, as reported in Figure 39.

Understanding the drought impact of El Niño/La Niña in the grain production areas in Eastern Europe and Central Asia (ECA): Russia, Ukraine, and Kazakhstan (RUK)
36
Figure 39. Winter Wheat Production, Russian FederationSource: Rosstat
On the other hand, the climatic regime to the east (in the south of Western Siberia and northern Kazakhstan), with late but hot summers, dry autumns, and frequently a light snow cover in a severe winter, ruled out winter wheat. In these regions spring wheat was planted, although its average yield was half that of winter wheat (Kruchkov and Rakovskaya, 1990). The climate also favours the hard-red grain as against the soft wheat, the former characterised by a shorter growing season and a lower yield (White, 1987). Figure 40 shows that the same production proportion can be found to this day.

Understanding the drought impact of El Niño/La Niña in the grain production areas in Eastern
Europe and Central Asia (ECA): Russia, Ukraine, and Kazakhstan (RUK)37
Figure 40. Spring Wheat Production, Russian FederationSource: Rosstat
An especially strong drought occurs when an anticyclone is fed by an air mass from Azores anticyclone moving in from the West (Campbell, 2016). Moving across Europe, the air mass loses its humidity and reaches European Russia completely dry (Protserov, 1950).
To solve the problem of mix signal captured by satellite, due to spring and winter wheat, we took the ASI value spatial averaged from the most representatives areas of winter (Figure 39) and spring wheat (Figure 40).
Figure 41 presents the country level values of agricultural areas affected by drought in percentage and national wheat productivity (t/ha).

Understanding the drought impact of El Niño/La Niña in the grain production areas in Eastern Europe and Central Asia (ECA): Russia, Ukraine, and Kazakhstan (RUK)
38
Figure 41. Percentage area affected by drought total wheat yield, Russian Federation
Figures 42 and 43 show the information taking in consideration the spatial-average of ASI from most productive areas of winter and spring wheat. The extension of the agricultural area affected by droughts is modest but with regular occurrence; more drought events hit the spring wheat than the winter wheat.
Figure 42. Percentage area affected by drought for winter wheat yield, Russian Federation

Understanding the drought impact of El Niño/La Niña in the grain production areas in Eastern
Europe and Central Asia (ECA): Russia, Ukraine, and Kazakhstan (RUK)39
Figure 43. Percentage area affected by droughts for spring wheat yield, Russian Federation
Moreover, the production value of wheat accounts for 80% of the total cereal production value (FAO, 2017), of which the winter wheat accounts for 50% and the spring wheat for the other 50% (USDA. 2006). The most affected regions by the drought, which are at the same time the most productive, are in the Southern -West area of the country, bordering the Northern Kazakhstan area, that is, in turn, the most distressed area in the country by the drought.
The data analysis has focused on carrying out two models: one which includes a sample of the regions which hold more than 1% of the winter wheat production share and one for the spring wheat production 1% share. This analysis has confirmed that the drought events have not highly impacted the winter wheat yield in the Southern-Central area, as much as they did in the spring wheat yield in Southern, the Ural, and Siberian areas; the strongest impact seems to have hit the Volga area.
a) Winter wheat crop
As far as the winter wheat is concerned, the outcome of the correlation analysis proved that significant drought years turned out to be 1998 and 2010 (Annex 6) and identified three groups of regions as table 4 summarises:
• The Southern area which accounted for 58% of the winter wheat production, marked high values of 100-ASI, more than 90% corresponding to the no water stress condition. It has led to suppose that this area has not been affected by the drought so that other factors likely caused the

Understanding the drought impact of El Niño/La Niña in the grain production areas in Eastern Europe and Central Asia (ECA): Russia, Ukraine, and Kazakhstan (RUK)
40
yield losses. However, Volgogradskaya was the exception as it shows to have undergone a “Moderate” drought reporting 67% of 100-ASI value, showing similar weather conditions to those of the bordering Volga area.
• The Volga area, which represented 11% of production, marked “Extreme” – “Severe” drought with the lowest 100-ASI values, thus undergoing the highest winter wheat yield decrease.
• The Central country area (23% of production) that was subject to “Moderate” drought and dry periods, was also affected by a considerable
yield decrease over these years.
Table 4. ADM1 clusters according to 100-ASI values and the winter wheat yield change rate on the previous year, Russian Federation
GeographicArea ADM1 Production
Share
AVG of 100-ASI
(1998 and 2010)
AVG of Winter Yield Change rate on previous year
1998/97 2010/09
South (58%)
Krasnodarskiy Kray 19% 99%
-15% -5%Stavropolskiy Kray 17% 97%
Rostovskaya Oblast 15% 96%
Volgogradskaya Oblast 7% 67%
Centre (23%)
Voronezhskaya Oblast 4% 75%
-19% -41%
Kurskaya Oblast 3% 81%
Belgorodskaya Oblast 3% 87%
Orlovskaya Oblast 3% 75%
Tambovskaya Oblast 3% 66%
Lipetskaya Oblast 3% 71%
Ryazanskaya Oblast 2% 82%
Tulskaya Oblast 2% 84%
Volga (11%)
Saratovskaya Oblast 4% 35%
-60% -49%
Tatarstan Rep. 2% 58%
Samarskaya Oblast 2% 44%
Penzenskaya Oblast 1% 59%
Ulyanovskaya Oblast 1% 59%
Orenburgskaya Oblast 1% 21%

Understanding the drought impact of El Niño/La Niña in the grain production areas in Eastern
Europe and Central Asia (ECA): Russia, Ukraine, and Kazakhstan (RUK)41
Furthermore, the comparison of the ASI values stemmed from scenarios of the “Severe” drought in 2010 with the “Moderate” drought in 1998 (Figure 44) revealed that the most vulnerable ADM1s of the winter wheat, with the highest ASI values (>50%) were in the Volga and Central area, where the highest differences between the yield (current year) and the yield Long-Term Average (1995-2015 LTA) existed. The highest ASI values are observed in the Volga area (Tatarstan Republic, Saratovskaya Oblast, Samarskaya Oblast) and relate to high variations from LTA (-1.6, -0.7 and -0.5 t/ha) in 2010. The least affected seems to have been the Southern area, except for the Volgogradskaya Oblast, with a 44% of ASI value and a yield difference of -0.65 t/ha vs LTA.
Figure 44. Severe drought scenario for winter wheat crop, Russian FederationSource: Global Administrative Unit Layers (GAUL) of FAO
The moderate scenario has also shown that the Saratovskaya Oblast in the Volga area marked ASI values >50% (Figure 45).

Understanding the drought impact of El Niño/La Niña in the grain production areas in Eastern Europe and Central Asia (ECA): Russia, Ukraine, and Kazakhstan (RUK)
42
Figure 45. Moderate drought scenario for winter wheat crop, Russian FederationSource: Global Administrative Unit Layers (GAUL) of FAO
b. Spring wheat crop
Serious drought episodes, resulting from correlation analysis, have proven to be 1998, 2010 and 2012 (Annex 6) that strongly affected the spring wheat yield in the Southern-Volga area, Ural and Siberian areas (Annex 7). Table 5, reports three clusters organised as follows:
• The Siberian area, which represents the most productive area of the spring wheat accounting for 46% of the production share, indicates the highest values of 100-ASI (corresponding to the “Dry period” and “No water stress”). It leads to suppose that yield losses were not due to drought.
• The Ural area, the Tyumenskaya Oblast, and the Sverdlovskaya Oblast, which border with the Siberian area, show “No water stress” values with less yield decrease than the other regions of the Ural area. The Kurganskaya Oblast and the Chelyabinskaya Oblast, which border with the Volga area, were the most affected Oblasts of the group. The Ural’s total yield decreased by roughly 40% in 1998 and 2012.
• The Volga regions also experienced negative effects of drought episodes, reporting 100-ASI values that varied from 40% to 80% and characterised by a high impact on the spring wheat yield, which dropped almost an average of 40% over the drought years.

Understanding the drought impact of El Niño/La Niña in the grain production areas in Eastern
Europe and Central Asia (ECA): Russia, Ukraine, and Kazakhstan (RUK)43
Table 5. ADM1 clusters according to 100-ASI values and the spring wheat yield change rate on the previous year, Russian Federation.
GeographicArea ADM1
Pro-duction Share
AVG of 100-ASI (1998
-2010-2012)
AVG of Spring Yield Change rate on previous
year
1998/97 2010/09 2012/11
Siberia (46%)
Altayskiy Kray 14% 85%
-4% -17% -30%
Omskaya Oblast 11% 92%
Novosibirskaya Oblast 9% 90%
Krasnoyarskiy Kray 7% 89%
Kemerovskaya Oblast 3% 82%
Irkutskaya Oblast 2% 98%
Tomskaya Oblast 1% 93%
Ural (16%)
Kurganskaya Oblast 6% 71%
-40% -15% -42%Chelyabinskaya Oblast 5% 56%
Tyumenskaya Oblast 4% 95%
Sverdlovskaya Oblast 1% 99%
Volga (25%)
Tatarstan Rep. 7% 72%
-52% -51% -20%
Orenburgskaya Oblast 6% 40%
Bashkortostan Rep. 6% 62%
Saratovskaya Oblast 2% 53%
Samarskaya Oblast 1% 61%
Nizhegorodskaya Oblast 1% 81%
Ulyanovskaya Oblast 1% 72%
Bearing on the comparison between severe and moderate scenarios (Figures 46 and 47), the severe situation identified the most vulnerable ADM1s as the Volga and Ural areas, with the highest ASI values (>50%) corresponding to the highest differences between the yield (current year) and the yield Long-Term Average (1995-2015 LTA).
In particular, the Tatarstan Republic in the Volga area marked the highest negative yield variation (-1.6 t/ha) from LTA in 2010.

Understanding the drought impact of El Niño/La Niña in the grain production areas in Eastern Europe and Central Asia (ECA): Russia, Ukraine, and Kazakhstan (RUK)
44
Figure 46. Severe drought scenarios for spring wheat crop, Russian FederationSource: Global Administrative Unit Layers (GAUL) of FAO
At the same time, the moderate scenario has also shown that the Volga and Ural area achieved ASI values >50%, related to the highest (average between 1998 and 2012) yield variations from the LTA: -0.7 t/ha and -0.5 t/ha respectively of the Bashkortostan Republic and the Chelyabinskaya Oblast.
Figure 47. Moderate drought scenarios for spring wheat crop, Russian FederationSource: Global Administrative Unit Layers (GAUL) of FAO

Understanding the drought impact of El Niño/La Niña in the grain production areas in Eastern
Europe and Central Asia (ECA): Russia, Ukraine, and Kazakhstan (RUK)45
7. Panel Data Analysis (PDA)
The key issues to develop a forecast model8, which accounts for individual heterogeneity as well as common factors due to macro events9, have led to adopt the Panel Data Analysis – PDA as predictive crop model in order to deal with heterogeneity or individual effect that may or not may be observed.
In this context the PDA - fixed or random effect- has allowed identifying the differentiated ADM1 effects (the individual effects) of droughts through the use of interactions terms between the 100-ASI and ADM1 dummies, applying the following two equations:
1) yi,t = a + β(100-ASI)i,t + yi + t + εi,t
2) yi,t = a + β(100-ASI)i,t + бyi ✳100-ASIi,t + t + εi,t
Where:yit is the outcome variable, the annual wheat yield for the cross-sectional unit ADM1 i in period t100 - ASIi,t is the regressor, values of 100-ASI marked by ADM i in period ty = the regional heterogeneity (fixed or random effect)t = common factor (time indicator) εi,t = the error term
As a result, the following models have been estimated for each country.
8 The use of panel data (fixed effects method) mitigates concerns regarding the omitted variable bias. More precisely, the fixed effect specification controls for individual heterogeneity as well as for common time-invariant factors due to macro events.
9 The common factors are information affecting all or part of the variables unobserved by the study but influencing the sample; they could be, for example, the fertilizers’ and pesticides’ prices or any anomalous climate conditions, while the individual factors could be the availability of arable land, land morphology, crop’s genetic potential, amount of sunlight, water and nutrients absorbed by the crop, the presence of weeds and pests.

Understanding the drought impact of El Niño/La Niña in the grain production areas in Eastern Europe and Central Asia (ECA): Russia, Ukraine, and Kazakhstan (RUK)
46
7.1. Ukraine
• Winter wheat crop
The linear model10 has shown that marginal variation in 100-ASI caused a decrease of about 1.0% in the annual yield.
Moreover, significant drought episodes in Ukraine occurred both during La Niña in 2007 and El Niño in 2012 events, marking higher marginal yield decreases, as indicated in the examples below:
• Odes’ka’s data analysis shows significant drops in yield of 29% in 2007 (with a loss of 59 points of 100-ASI) and of 23% in 2012 (with a loss of 46 points of 100-ASI). The respective marginal variation of 100-ASI corresponded to yield decreases over the previous year of 1.24% and 1.58%.
• Mykolayivs’ka yield values declined by 43% in 2007 (with a loss of 89 points of 100-ASI). The marginal negative variation in the 100-ASI corresponded to a yield drop of 1.26%.
• Khersons’ka was one of the most affected areas in 2012, accounting for a significant fall of 55%, with a loss of 52 points of 100-ASI. A marginal variation of 100-ASI in this year brought about even a yield decrease of 3.62%.
• Kirovohrads’ka experienced a severe drought in 2007, marking a high fall of 31%, with a loss of 67 points of 100-ASI. A marginal variation of 100-
ASI in this year provoked even a yield decrease of 1.40%.
• Maize crop
The linear model11 has shown that marginal variation in 100-ASI impacted on the annual yield with a decrease of about 0.60%.
Meaningful drought episodes during La Niña (in 2007) and El Niño (2012) events have reported anomalous values of the yield variations, such as:
10 The expected variation of yield, ∆ Y= β0+β1 (X+∆ X), has been calculated by applying the pooled OLS model Yield_changei,t = 0.0099836*(100-ASI)i,t - 0.7645063
11 The expected variation of yield, ∆ Y= β0+β1 (X+∆ X), has been calculated by applying the pooled OLS model Yield_changei,t = 0.006036*(100-ASI)i,t - 0.469681

Understanding the drought impact of El Niño/La Niña in the grain production areas in Eastern
Europe and Central Asia (ECA): Russia, Ukraine, and Kazakhstan (RUK)47
• Dnipropetrovs’ka displays drops in the yield of 17% in 2007 (with a loss of 71 points of 100-ASI) and 62% in 2012 (with a loss of 57 points of 100-ASI). The respective marginal variation of 100-ASI corresponded to yield decreases in the previous year of 0.62 % and 4.84 %.
• In Donets’ka the yield values declined by 47% in 2007 with a loss of 73 points of 100-ASI and a marginal variation in yield of 1.69%.
• Odes’ka was one of the most affected areas in 2007 and 2012, with a significant fall of 52% (with a loss of 59 points of 100-ASI) and 58% (with a loss of 46 points of 100-ASI). The marginal variation of 100-ASI in this year provoked even a yield decrease of 1.98% and 4.99% respectively.
• Mykolayivs’ka was affected by a severe drought in 2007, marking a high fall of 46%, with a loss of 89 points of 100-ASI. A marginal variation of 100-ASI in this year provoked a yield decrease of 1.43%.
7.2. Kazakhstan
The log-linear model12 has shown that marginal variation in 100-ASI provoked a decrease of 1.38 % in the annual yield.
Also, episodes of extreme drought, mainly due to La Niña events, have shown that negative variations in 100-ASI higher than 25 points, brought about a decrease of the yield marginal variation13 by values lower than 1%, such as:
• Kustanayskaya, an area among the largest producers of wheat in the country (an average of 29% of production share) and strongly impacted by the drought, marked significant drops in yield of 59% in 1998 (with a loss of 85 points of 100-ASI) and of 34% in 2010 (with a loss of 59 points of 100-ASI). The respective marginal variation of 100-ASI corresponded to yield decreases over the previous year of 0.68% and 0.63%.
• In Aktyubinskaya the wheat crop yield declined by 63% in 2010 with a decrease of 65 points of ASI and by 62% in 2012 with a loss of 57 points of 100-ASI, so that each negative point of variation in the 100-ASI corresponded to a marginal yield decrease of 0.61% and 0.81% respectively.
12 The expected variation of yield, ln (Y+∆ Y)= β0+β1(X+∆X), has been calculated by applying the random effect model ln(Yield)i,t = 0.0138 * (100-ASI)i,t -1.305+ui.t
13 The marginal variation: ∆ y/∆ x=yt - yt+1 /xt -xt+1

Understanding the drought impact of El Niño/La Niña in the grain production areas in Eastern Europe and Central Asia (ECA): Russia, Ukraine, and Kazakhstan (RUK)
48
On the other hand, it is also relevant to point out that anomalous events occurred in 1998 which marked marginal yield decrease of 1.03% for each decreased point of 100-ASI (a drop of the yield of 78% vs previous year on the total with a loss of 68 points of 100-ASI).
• Zapadno-Kazachstanskaya also experienced anomalous events depicting the lowest wheat yield values during the La Niña, among which a strong fall in yield of 79% in 1998 corresponding to the 100-ASI decrease of 44 points for an annual average yield of 0.17 t/ha. A marginal variation of 100-ASI in this year provoked a yield decrease of 1.42%, higher than the estimated average.
7.3. Russian Federation
• Winter wheat crop
The linear model14 has shown that marginal variation in 100-ASI caused a decrease of about 0.87% in the annual yield.
However, during drought episodes occurred under La Niña events, higher marginal variations in yield came out in the following areas:
• The Orenburgskaya Oblast marked drops in yield of 67% in 1998 (with a loss of 84 points of 100-ASI) and 42% in 2010 (with a loss of 67 points of 100-ASI). The respective marginal variation of 100-ASI corresponded to a yield decreases on the previous year of 1.50% and 1.16%.
• In the Ulyanovskaya Oblast, the yield values declined by 58% in 2010 (with a loss of 71 points of 100-ASI). The marginal negative variation in the 100-ASI corresponded to a yield drop of 1.86%.
• The Tatarstan Republic was one of the most affected areas in 2010, accounting for a significant fall of 69%, with a loss of 77 points of 100-ASI. The marginal variation of 100-ASI provoked a yield decrease of 2.94%.
• The Saratovskaya Oblast was affected by a severe drought in 1998 and 2010, marking a high fall in yield of 62% with a loss of 52 points of 100-ASI and of 45% with a loss of 59 points of 100-ASI. Over these years, a marginal variation of 100-ASI caused a yield decrease of 1.28% and 2.59% respectively.
14 The expected variation of yield, ∆ Y= β0+β1 (X+∆ X), has been calculated by applying the pooled OLS model Yield_changei,t = 0.0086903* (100-ASI)i,t -0.7317668
Understanding the drought impact of El Niño/La Niña in the grain production areas in Eastern
Europe and Central Asia (ECA): Russia, Ukraine, and Kazakhstan (RUK)49
• Spring wheat crop
The estimated log-linear model15 has shown that marginal variation in 100-ASI brought about a decrease of 0.95% in the annual yield.
For instance, the Orenburgskaya Oblast marked drops in yield of 60% in 1998 (with a loss of 83 points of 100-ASI) and 58% in 2010 (with a loss of 67 points of 100-ASI). The respective marginal variation of 100-ASI corresponded to yield decreases in the previous year of 0.91 % and 0.87 %.
Nevertheless, meaningful drought episodes occurred during La Niña turning out higher negative marginal variations in yield, such as:
• In the Chelyabinskaya Oblast the yield values declined by 58% in 1998 (with a loss of 69 points of 100-ASI). The marginal negative variation in the 100-ASI corresponded to a yield drop of 1.11%.
• The Tatarstan Republic was one of the most affected areas in 2010 representing an anomalous fall of 67%, with a loss of 77 points of 100-ASI. A marginal variation of 100-ASI in this year even provoked a yield decrease of 2.58%.
15 The expected variation of yield, ln (Y+∆ Y)= β0+β1 (X+∆ X), has been calculated by applying the random effect model In (Yield)i,t = 0.0094568* (100-ASI)i,t - 0.5345608 + ui,t

Understanding the drought impact of El Niño/La Niña in the grain production areas in Eastern Europe and Central Asia (ECA): Russia, Ukraine, and Kazakhstan (RUK)
50®FAO

Understanding the drought impact of El Niño/La Niña in the grain production areas in Eastern
Europe and Central Asia (ECA): Russia, Ukraine, and Kazakhstan (RUK)51
8. Conclusions
The following key findings emerge from our analysis of the El Niño/ La Niña impact in the RUK region. Kazakhstan is the most prone to drought (>30% of drought occurrences) when compared to Ukraine and the Russian Federation in the agricultural productive areas of the country (Northern area). Also, results indicate that the productive areas of Ukraine (Southern area), and the winter wheat (Southern and North Caucasus) and the spring wheat areas (Siberia) in the Russian Federation show a considerable risk of drought (10-15% of drought occurrence).
We find that the droughts triggered by El Niño are localised mainly on the Central and Volga regions of the Russian Federation. The rest of the RUK area does not show sensitivity to the El Niño events.
Northern Kazakhstan is sensitive to La Niña events that trigger drought in the most productive areas of the country areas, and La Niña episodes are correlated with the increase of drought events. Moreover, the areas close to the border between Kazakhstan, Southern and North Caucasus in Russia are sensitive to drought triggered by the La Niña phenomenon.
The Drought-gram utilised in this study offers additional information on whether a particular year affected by drought corresponds to an El Niño, Neutral or La Niña event. The observations made, show that most of the years are transitional years from one phase to another making the interpretation more complex, given that some areas of RUK are sensitive to El Niño and others to La Niña.
Kazakhstan, one of the three countries of RUK, suffers from more intense and frequent droughts. The droughts in Kazakhstan during the 32 year-time series of analysis, are more related to La Niña phenomenon than to El Niño.
Ukraine has experienced fewer drought events and less intense; there is no clear influence of El Niño or La Niña. However, the drought gram shows that during El Niño dominance there are two drought events compared to one during La Niña dominance. As of mid-May 2017, the tropical Pacific remained in an ENSO-neutral state, with above-average sea surface temperatures (SST) present in the eastern Pacific Ocean, and near-average SSTs across the central and east-central part of the basin.

Understanding the drought impact of El Niño/La Niña in the grain production areas in Eastern Europe and Central Asia (ECA): Russia, Ukraine, and Kazakhstan (RUK)
52
In the Russian Federation, the events of drought are less frequent than in Kazakhstan during spring wheat. During the winter wheat, ASI could detect the winter kill effect which will be marked as drought after the dormancy period. The spring wheat in the Russian Federation experiences more frequent losses due to drought than winter wheat. There is a clear increase of drought events on winter wheat (Russian Federation) during the dominance of El Niño. The temporal difference between both crop seasons is exposed to El Niño or La Niña in different ways and produces different levels of impact.
In general, winter cereals have a much higher yield than spring cereals, as they make use of snow as moisture for growth. This fact explains in part the highest wheat yield of Ukraine and low yields of Kazakhstan. Spring crops are more exposed to droughts than winter crops; water stress on spring crops is an important, driven variable of the crop yield. In the case of winter crops, the snow cover, the temperatures and other factors, explain the annual crop yield variation that is more complex to assess using only ASI as an indicator.
Data analysis at a sub-national level has led to identifying significant correlations between crop yield and ASI during El Niño and La Niña episodes, which have confirmed the most vulnerable areas affected by drought, as well as their respective contributions to the national production, as follows:
• in the Southern area of Ukraine: Odes’ka, Khersons’ka, Mykolayivs’ka, Zaporiz’ka, Dnipropetrovs’ka, Donets’ka and Kirovohrads’ka, which represented 38% of wheat production share, had a yield loss on the previous year of 26% in 2007 and 43% in 2012. This group, which also represented 42% of the maize production share, marked a drop of 33% in 2007 and 43% in 2012;
• in the Northern area of Kazakhstan: Akmolinskaya, Kustanayskaya, Severo-kazachstanskaya, representing 80% of the national production, lost 45% in 1998, 26% in 2008, 40% in 2010 and 55% in 2012 of wheat yield. In any case, the whole country was subject to the unfavourable weather in alternate periods;
• in the Volga area of the Russian Federation, that borders with the most vulnerable area of Kazakhstan on the Northside and represented respectively 11% of the winter wheat production, declined their yields by 60% in 1998 as well as in 2010 by 49%. At the same time, the Volga area, which also represented 25% of the spring yield, decreased its yield by 52% in 1998, 51% in 2010 and 20% in 2012. Furthermore, although the Central area (23% of the winter wheat production share) seems to have undergone moderate drought periods reported yield decrease of

Understanding the drought impact of El Niño/La Niña in the grain production areas in Eastern
Europe and Central Asia (ECA): Russia, Ukraine, and Kazakhstan (RUK)53
19% in 1998 and 41% in 2010 that might be due to several unfavourable weather conditions. The most productive area of winter wheat in the South (Krasnodarskiy Kray, Stavropolskiy Kray, Rostovskaya Oblast) representing 58% of production, seem to have been the least affected by the drought, as well as the most productive of the spring wheat (Altayskiy Kray, Novosibirskaya, and Krasnoyarskiy Kray).
Key findings of these study indicate that the availability of georeferenced subnational level data time series for the major crops was a key component in conducting such analysis. However, we find that the data remains scattered, incomplete, available for limited crops and not always available by land use system or water supply regime. A key input to this type of analysis is the consideration of water regime and input levels in addition to the variables used. Although it was not part of the current study, it is highly recommended that, at least, the water supply regime is used in future assessments to improve understanding and increase knowledge on the sensitivity analysis of the farming systems by extreme events.
The methods and approaches used in this study can be evaluated for inclusion to a toolbox for use by national experts, which coupled with the adequate institutional framework, capacity development, multi-stakeholders’ participatory approaches, and possible citizen involvement would greatly contribute in mainstreaming the approach into national development plans and policy.
Given the heterogeneity of countries regarding land morphology and climatic conditions, the aggregate data about crop production and yield, at the national level, provide a general overview of the statistical analysis. However, disaggregating the information at the sub-national level is needed to take into account the extreme variability of the climate and land morphology. This way, it may be likely to create forecasting models, depending on the prevalence of the climate factor to which the area is subject to, by applying econometric models such as Panel Data Analysis - Fixed or Random effects, which control the heterogeneity of those variables unobserved or available to be measured. As a result, the PDA has allowed estimating the marginal variation of yield decrease in correspondence to negative marginal changes in ASI, over a period of about 20 years.
In particular, in Ukraine, a variation of ASI caused an average decrease of the wheat yield of about 1%, and, during significant episodes of El Niño and La Niña, the yield decreased until the minimum value of 1.58% for each point of ASI (Odes’ka in 2012).

Understanding the drought impact of El Niño/La Niña in the grain production areas in Eastern Europe and Central Asia (ECA): Russia, Ukraine, and Kazakhstan (RUK)
54
In Kazakhstan, very small variations in ASI provoked a marginal yield decrease of about 1.4%, then decreasing below 1% for larger declines in ASI variation. However, during La Niña events, anomalous marginal yield variations occurred to reach drop of 1.42% (Zapadno-Kazachstanskaya in 1998).
In addition, during La Niña events, unusual drought espisodes occurred. The winter wheat yield achieved a decrease of 2.59% for each point of ASI (Saratovskaya Oblast in 2010) and of 2.58% in the spring wheat yield (Tatarstan Republic in 2010).
Finally, this study generated a rich database with indicators and variables at the sub-national level that contributes to an increased understanding, improved knowledge and insights of the impacts of extreme events in agriculture production. It is highly recommended that the national experts from these countries be trained in using these outputs to support the development of national strategies and implementation of such plans to increase resilience and enhance preparedness to possible extreme events. Also, the contextual rich database provides an excellent source for implementation of crop insurance programs, targeting investments in agriculture and rural development and addressing issues of food security in the region.

Understanding the drought impact of El Niño/La Niña in the grain production areas in Eastern
Europe and Central Asia (ECA): Russia, Ukraine, and Kazakhstan (RUK)55
References
Climate Prediction Center. 2005. ENSO FAQ: How often do El Niño and La Niña typically occur? National Centers for Environmental Prediction. http://www.cpc.ncep.noaa.gov/
Cumani, M. & Rojas, O. FAO. 2016. Characterization of the Agricultural Drought Prone Areas on a Global Scale. Using the FAO Agricultural Stress Index System (ASIS) to enhance the understanding of, and boost resilience to, water stress conditions in drought-prone areas. FAO, Rome. 30 p. http://www.fao.org/publications/card/en/c/93debcf8-7f70-49a9-b729-2dbc7ee1a6f7/
Kiladis, G., & Diaz, H. 1989. Global climatic anomalies associated with extremes in the southern oscillation. Journal of Climate, 2: 1069–1090.
Kogan, F. 1994. Droughts of the late 1980’s in the United States as derived from NOAA polar-orbiting satellite data. Bulletin of the American Meteorological Society, 76(5): 655−668.
Parker, D. 1983. Documentation of a southern oscillation index. Meteorological Magazine, 12: 184–188.
Rojas, O., Vrieling, A., & Rembold, F. 2011. Assessing drought probability for agricultural areas in Africa with coarse resolution remote sensing imagery. Remote Sensing of Environment, 115: 343-352. doi:10.1016/j.rse.2010.09.006.
Rojas, O., Li, Y., Cumani, R. FAO.2014. Understanding the drought impact of El Niño on the global agricultural areas. An assessment using FAO´s Agricultural Stress Index (ASI). Environment and Natural Resources Management Series 22. 42 p.
Rojas, O. 2016. Protocol for Country-Level ASIS. Calibration and national adaptation. FAO. Rome. 9 p. http://www.fao.org/3/a-i5246e.pdf
Ropelewski, C. F. & Halpert, M. S. 1992. Global and regional scale precipitation patterns associated with the El Niño/Southern Oscillation. Mon, Wea. Rev., 115: 1606–1626 (1992).

Understanding the drought impact of El Niño/La Niña in the grain production areas in Eastern Europe and Central Asia (ECA): Russia, Ukraine, and Kazakhstan (RUK)
56
Unganai, L. & Kogan, F. 1998. Drought monitoring and corn yield estimation in Southern Africa from AVHRR data. Remote Sensing of Environment, 63; 219-232.
Van Hoolst, R., Eerens, H., Haesen, D., Royer, A., Bydekerke, L., Rojas, O., Li, Y. & Racionzer, P. 2016. FAO’s AVHRR-based Agricultural Stress Index System (ASIS) for global drought monitoring, International Journal of Remote Sensing, 37:2, 418-439, DOI: 10.1080/01431161.2015.1126378
White, M. A., Thornton, P. E., & Running, S. W. 1997. A continental phenology model for monitoring vegetation responses to inter-annual climatic variability. Global Biogeochemical Cycles, 11(2): 217−234.
World Meteorological Organization (WMO), 2014. El Niño/La Niña background.http://www.wmo.int/pages/prog/wcp/wcasp/enso_background.html
Campbell, D. 2016. Survive water crisis. Available at https://www.climate-policy-watcher.org/grain-production/introduction-climate-and-agriculture-in-russia.html.Accessed on May 3rd, 2017. Office of Global Analysis (OGA). International Production Assessment Division (IPAD). 2015. Commodity Intelligence Report. Russia 2015/16 Wheat: Second Consecutive Bumper Crop. USDA. Available at https://www.pecad.fas.usda.gov/highlights/2010/01/kaz_19jan2010/Accessed on May 3rd, 2017.
Zharmagambetova, Z. 2010. Commodity Intelligence Report - Kazakhstan Agricultural Overview. USDA. Available at https://www.pecad.fas.usda.gov/highlights/2010/01/kaz_19jan2010/Accessed on May 3rd, 2017.
Lioubimtseva, E. and Henebry, Geoffrey. M. 2012. Grain production trends in Russia, Ukraine and Kazakhstan: New opportunities in an increasingly unstable world? Available at http://link.springer.com/article/10.1007/s11707-012-0318-yAccessed on May 3rd, 2017.
Lioubimtseva, E., Dronin, N. and Kirilenko, A. 2015. Grain production trends in the Russian Federation, Ukraine and Kazakhstan in the context of climate change and international trade. FAO. Available at http://www.fao.org/3/a-i4332e/i4332e07.pdf.Accessed on May 3rd, 2017.

Understanding the drought impact of El Niño/La Niña in the grain production areas in Eastern
Europe and Central Asia (ECA): Russia, Ukraine, and Kazakhstan (RUK)57
Safonov, G. and Safonova, Y. 2013. Economic analysis of the impact of climate change on agriculture in Russia. OXFAM Research Reports. Available at https://www.oxfam.org/sites/www.oxfam.org/files/rr-economic-impacts-climate-change-agriculture-russia-010413-en.pdf.Accessed on May 3rd, 2017.
FactoMineR - PCA software. Available at http://factominer.free.fr/factomethods/principal-components-analysis.htmlAccessed on Sept 3rd, 2017.
Lê, S., Josse, J. and Husson, F. 2007. Journal of statistical software.
FactoMineR: An R Package for Multivariate Analysis. Available at https://www.jstatsoft.org/article/view/v025i01.Accessed on May 3rd, 2017.
Jolliffe, I.T. 2002. Principal Component Analysis. 2nd edition Springer, New York.
Vocke, G. and Allen, E. 2006. Wheat situation and Outlook Yearbook. USDA. Editor Courtney Knauth. Washington DC. Accessed on May 3rd, 2017.
Stock, J. and Watson, M. 2014. Introduction to Econometrics. Update Global Edition. Pearson International. London.
Park, Myoung. H.2011 Practical Guides To Panel Data Modelling; a Step by Sep Analysis Using Stata. 2011. Available at http://iuj.ac.jp/faculty/kucc625/documents/panel_iuj.pdf Accessed on December 1st, 2017.
OECD website. 2017. Data section. Available at https://data.oecd.org/agroutput/crop-production.htmAccessed on December 1st, 2017.
CRM Agri-Community website, 2000. USDA. Available at http://www.crmagri.co.uk/production-maps. Accessed on May 3rd, 2017.
ICSU website. 2008. World Data Center. Available at http://wdc.org.ua/en/node/29Accessed on May 3rd, 2017.
Understanding the drought impact of El Niño/La Niña in the grain production areas in Eastern Europe and Central Asia (ECA): Russia, Ukraine, and Kazakhstan (RUK)
58
USDA website. 2010. Available at https://www.pecad.fas.usda.gov/high-lights/2010/01/kaz_19jan2010/Accessed on May 3rd, 2017.
FAO. ESS. FAOSTAT database. Available at http://www.fao.org/faostat/en/#data/QC Accessed on May 3rd, 2017.
FAO. Earth observation. Available at http://www.fao.org/giews/earthobser-vation/ Accessed on May 3rd, 2017.
FAO. GeoNetwork database. Available at http://www.fao.org/geonetwork/srv/en/metadata.show?id=12691Accessed on May 3rd, 2017.

Understanding the drought impact of El Niño/La Niña in the grain production areas in Eastern
Europe and Central Asia (ECA): Russia, Ukraine, and Kazakhstan (RUK)59
Anexos Annex 1. The analysis approaches
Drought is one of the main causes of agricultural disasters and often drought-stricken lawns are prone to becoming worn and patchy so that the magnitude of the damage might not be so evident when the analysis is carried out at a national aggregate data level, especially related to crop production, for the following reasons:
• the production at the national level could appear increased by the most productive areas that have not been damaged because they have not been affected by the drought.
• the drought periods of the year may not coincide with the most sensitive period of the crop growing season, thus affecting some areas only.16
Also, based on the drought and depending on the combination with several co-varying factors (i.e., phenological phases, agro-climatic regions, soil texture) that are not often available or not observable, so that the crop vulnerability remains a tricky phenomenon to be explored. The methodological approaches of this study have been mainly focused on analysing the major cereal crops in term of production in the RUK area, by looking into the relationship between drought, measured with the ASI17 and the crops yield18, in order to:
•analyse the meaningful drought years to identify the most vulnerable areas of the countries and to describe the impact at national level in term of yield loss, by applying the Principal Component Analysis (PCA) 19 to group the ADM1s according to drought level (measured by the 100-ASI values), yield, yield change rate on the previous year, and the production share.
16 Reference example is the study on Unusual events: Drought in Ukraine -2007 by F. Kogan17 The ASI or Agricultural Stress Index represents the percentage of the “cropped or grassland
areas” within each “administrative region,” which are affected by “drought,” as derived from “EO-observations” and defined over the course of the “growing season”. (O. Rojas, 2016)
18 “Crop production depends on the availability of arable land and is affected in particular by yields, macroeconomic uncertainty, as well as consumption patterns; it also has a great incidence on agricultural commodities’ prices. The importance of crop production is related to harvested areas, returns per hectare (yields) and quantities produced. Crop yields are the harvested production per unit of harvested area for crop products. In most of the cases yield data are not recorded but are obtained by dividing the production data by the data on area harvested. The actual yield that is captured on farm depends on several factors such as the crop’s genetic potential, the amount of sunlight, water and nutrients absorbed by the crop, the presence of weeds and pests” (OECD. 2017)
19 The “FactoMineR” software has been applied to perform the analysis, and R – ggplot for the graphs

Understanding the drought impact of El Niño/La Niña in the grain production areas in Eastern Europe and Central Asia (ECA): Russia, Ukraine, and Kazakhstan (RUK)
60
•estimate a predictive model of crops at country level using the Panel Data Analysis – fixed or random effects.
1. Datasets Selection
a. Geographical coverage, which comprises the first national administrative level (e.g., republic, region, district, town) that correspond to the ADM1 level of the GAUL system (FAO). The most representative ADM1 of each RUK country that produces more than 1% of the total main crop production has been selected to take part in the statistical analysis.
b. Item includes the crops that represent an average of 70-80% of the total national cereals production value:
•Wheat and maize crops for Ukraine,•Wheat crop for Kazakhstan, •Winter wheat and spring wheat crops for the Russian Federation.
c. Crop Variables are selected as follows: Annual crop yield and 100-ASI20, for the application of the PDA.Annual crop yield, yield change rate on the previous year, 100-ASI, and production share21, for the application of the PCA.
d. Drought Index. The 100-ASI has been applied based on the summary annual ASI first growing season, taken from FAO earth observation database and corresponding to drought levels.22
e. Time. It has been selected according to the type of analysis:•PDA: 1995 - 2015 for Kazakhstan and the Russian Federation, and 2000 - 2014 for Ukraine;•PCA: the drought years that have marked values of 100-ASI<90% and significant correlations23 with annual crop yield.
20 100-ASI is only a transformation of the ASI variable. ASI represents percentage of agricultural area affected by drought then 100-ASI represents percentage of agricultural area NOT affected by drought. 100-ASI has been introduced to facilitate the interpretation by adopting a directly proportional relationship between yield and ASI variables.
21 The production share for each ADM1 have been calculated as the percentage on the 2000-2015 average production for Kazakhstan and the Russian Federation. The production shares of Ukraine have been taken from studies of USDA source.
22 The drought level is classified by Drought-gram tool as mentioned at page 26 and reported in the document “Protocol for Country-Level ASIS” page 5. (O. Rojas, FAO.2014).
23 The Pearson’s Correlation index at least 0.4 with t- test, degrees free depends on the number of the ADM1, with 95% Confidence Interval and p-value <0.05

Understanding the drought impact of El Niño/La Niña in the grain production areas in Eastern
Europe and Central Asia (ECA): Russia, Ukraine, and Kazakhstan (RUK)61
Annex 2. Correlation index between crop yield and 100-ASI in the RUK region24
• Ukraine – wheat crop
Table A2.1 Correlation index of wheat yield and 100-ASI, Ukraine
YearIndex 2000 2001 2002 2003 2004 2005 2006 2007 2008 2009 2010 2011 2012 2013 2014
Correlation index 100-ASI1/Wheat Yield 0,18 0,05 0,15 -0,01 0,38 0,24 0,21 0,69 0,19 0,33 0,55 0,18 0,84 0,74 0,71
Coeff. Interval 95% - Signif. P-value <0,05 <0,0002 <0,0001
100-ASI1 values < 90% a a a
Selection criteria a no drought
no correlation
ano correlation no correlation
no drought
YearIndex 2000 2001 2002 2003 2004 2005 2006 2007 2008 2009 2010 2011 2012 2013 2014
Correlation index 100-ASI1/Maize Yield
-0,27 0,16 0,08 -0,10 0,09 -0,04 0,46 0,76 0,11 0,16 0,26 0,12 0,69 0,33 0,26
Coeff. Interval 95% - Signif. P-value <0,05
0,04 <0,0001 <0,0008
100-ASI1 values < 90% a a a
Selection criteria a a no drought
no correlation
no correlation
24 The symbol in the cells indicates the chosen years in the selection criteria row.25 Significant correlations have been also observed in 1996 and 1997, yet these years have not been
selected, because of a slight dry period that has characterized the country that does seem to be affected the wheat yield. On the other hand, 2004, even though depicted low values of 100-ASI, is not correlated with the yield, therefore is not part of the analysis.
• Ukraine – maize crop
Table A2.2 Correlation index of maize yield and 100-ASI, Ukraine
• Kazakhstan – wheat crop25
Table A2.3 Correlation index of wheat yield and 100-ASI, Kazakhstan
YearIndex
1995 1996 1997 1998 1999 2000 2001 2002 2003 2004 2005 2006 2007 2008 2009 2010 2011 2012 2013 2014 2015
Correlation index 100-ASI1/Wheat Yield
0,71 0,60 0,65 0,82 0,84 -0,78 -0,43 -0,60 0,19 0,16 -0,03 0,29 -0,32 0,58 0,56 0,60 0,10 0,82 0,52 0,15 -0,14
Coeff. Interval 95% - Signif. P-value <0,05 <0,015 <0,002 <0,030 <0,073 <0,050 <0,002 <0,1049
100-ASI values < 90% a a a a a
Selection criteria - a ano
significantcorrelation
ano
correlation ano
significantcorrelation
slight dry period no drought
nocorrelation
nocorrelation

Understanding the drought impact of El Niño/La Niña in the grain production areas in Eastern Europe and Central Asia (ECA): Russia, Ukraine, and Kazakhstan (RUK)
62
YearIndex
1995 1996 1997 1998 1999 2000 2001 2002 2003 2004 2005 2006 2007 2008 2009 2010 2011 2012 2013 2014 2015
Correlation index 100-ASI1/Spring wheat yield
0,63 0,45 0,29 0,73 0,24 -0,08 0,07 -0,12 -0,12 0,35 -0,04 0,48 0,31 0,41 0,64 0,81 0,03 0,63 0,28 0,46 0,18
Coeff. Interval 95% - Signif. P-value <0,05
<0,0005 0,2 <0,0001 <0,0051 0,1
100-ASI1 values < 90% a a a
Selection criteria - ano
significantcorrelation
no correlation
a no correlation
aslight dry period no correlation no drought no significant correlation
YearIndex
1995 1996 1997 1998 1999 2000 2001 2002 2003 2004 2005 2006 2007 2008 2009 2010 2011 2012 2013 2014 2015
Correlation index 100-ASI1/Winter wheat yield
0,31 0,50 0,05 0,71 -0,18 -0,11 -0,05 -0,08 -0,54 0,42 0,42 0,43 -0,03 0,33 0,66 0,84 0,39 0,17 0,23 0,24 0,18
Coeff. Interval 95% - Signif. P-value <0,05
0,0 <0,001 0,1 0,1 0,1 <0,0001 0,1
100-ASI values < 90% a a
Selection criteria - a no drought
ano
significantcorrelation
slight dry period no correlation no correlationno significant
correlation
• Russian Federation – winter wheat crop
Table A2.4 Correlation index of winter wheat yield and 100-ASI, Russian Federation
• Russian Federation – spring wheat crop
Table A2.5 Correlation index of spring wheat yield and 100-ASI, Russian Federation
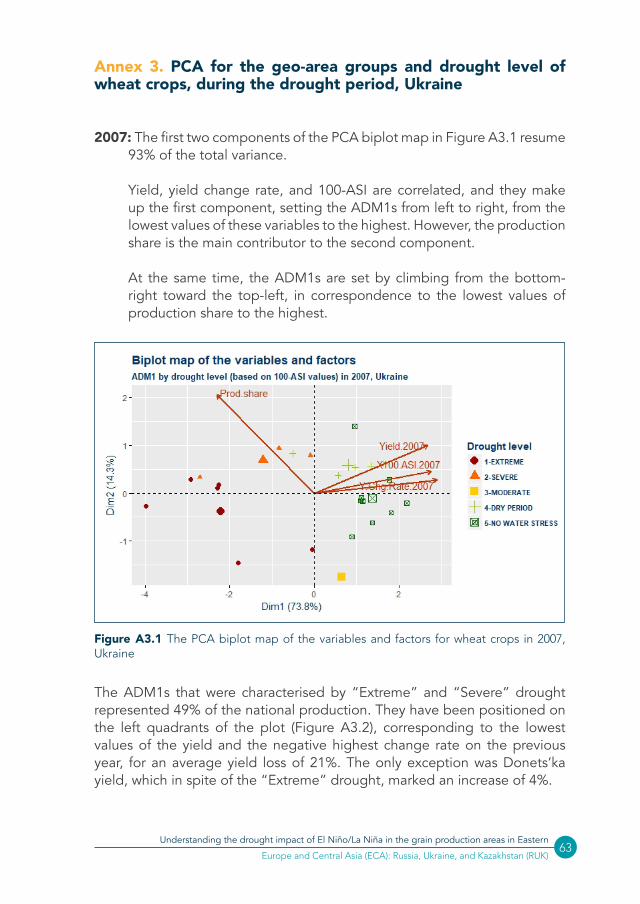
Understanding the drought impact of El Niño/La Niña in the grain production areas in Eastern
Europe and Central Asia (ECA): Russia, Ukraine, and Kazakhstan (RUK)63
Annex 3. PCA for the geo-area groups and drought level of wheat crops, during the drought period, Ukraine
2007: The first two components of the PCA biplot map in Figure A3.1 resume 93% of the total variance.
Yield, yield change rate, and 100-ASI are correlated, and they make up the first component, setting the ADM1s from left to right, from the lowest values of these variables to the highest. However, the production share is the main contributor to the second component.
At the same time, the ADM1s are set by climbing from the bottom-right toward the top-left, in correspondence to the lowest values of production share to the highest.
Figure A3.1 The PCA biplot map of the variables and factors for wheat crops in 2007, Ukraine
The ADM1s that were characterised by “Extreme” and “Severe” drought represented 49% of the national production. They have been positioned on the left quadrants of the plot (Figure A3.2), corresponding to the lowest values of the yield and the negative highest change rate on the previous year, for an average yield loss of 21%. The only exception was Donets’ka yield, which in spite of the “Extreme” drought, marked an increase of 4%.

Understanding the drought impact of El Niño/La Niña in the grain production areas in Eastern Europe and Central Asia (ECA): Russia, Ukraine, and Kazakhstan (RUK)
64
Moreover, although the “Moderate” drought, the crop yield of Luhans’ka rose by 16%, as well as the “Dry period” undergone by Poltavs’ka, Kharkivs’ka and Sums’ka marked an average growth of 23%. It leads to suppose that this year more significant variables contributed to the favourable yield increases.
Lastly, the average yield of the ADM1s, which can be grouped as “No-water stress” cluster, went up by 14%, as Table A3.1 summarises:
Figure A3.2 The PCA map of the variables and individuals by drought level for wheat crops in 2007, Ukraine
Table A3.1 Statistics of the ADM1 clusters by drought level for wheat crops in 2007, Ukraine
Drought level ADM1
Prod. Share
(%)
Yield 2007 (t/
ha)
Yield Chg.
2007/06
Yield Change Rate Average
2007/06
Extreme
Mykolayivs’ka 7 1.5 -43%
-26%
Dnipropetrovs’ka 3 2.0 -32%
Kirovohrads’ka 6 2.1 -31%
Khersons’ka 7 1.9 -27%
Zaporiz’ka 6 2.2 -24%
Severe
Odes’ka 7 1.8 -29%
-16%Vinnyts’ka 6 2.6 -14%
Cherkas’ka 5 2.8 -7%

Understanding the drought impact of El Niño/La Niña in the grain production areas in Eastern
Europe and Central Asia (ECA): Russia, Ukraine, and Kazakhstan (RUK)65
Drought level ADM1
Prod. Share
(%)
Yield 2007 (t/
ha)
Yield Chg.
2007/06
Yield Change Rate Average
2007/06Moderate Luhans’ka 1 2.1 16% 16%
Dry peri-od
Krym 6 2.3 -9%
12%
Kyyivs’ka 4 2.7 -1%
Poltavs’ka 4 2.8 6%
Kharkivs’ka 4 2.8 26%
Sums’ka 4 2.7 36%
No-water stress
Zhytomyrs’ka 2 2.3 3%
14%
L’vivs’ka 3 2.6 4%
Ivano-frankivs’ka 2 2.5 8%
Volyns’ka 3 2.5 9%
Ternopil’s’ka 3 2.5 10%
Chernivets’ka 3 2.9 15%
Rivnens’ka 2 2.7 20%
Chernihivs’ka 2 2.8 28%
Khmel’nyts’ka 6 2.6 29%
Table A3.1 presents the data of the PCA analysis mentioned above, showing those increases occurred in the slight level of drought.”While the description “Table 11. Statistics of the ADM1 clusters by drought level for wheat crops in 2007, Ukraine”
2012: The first two components, of the PCA biplot map in Figure A3.3 show 92% of the total variance. The three variables such as yield, yield change rate and 100-ASI are correlated and make up the first component. The ADM1s are set up from left to right, from the lowest values of these variables to the highest.
The production share is, also, the main contributor of the second component, so that the ADM1s are set by climbing from the bottom-right toward the top-left, in correspondence to the lowest values of production share to the highest.
The “Extreme” values of drought do not seem to have been marked in this period, indicating the “Severe” effect (ASI values <57%) as the worst drought scenario occurred over this year.

Understanding the drought impact of El Niño/La Niña in the grain production areas in Eastern Europe and Central Asia (ECA): Russia, Ukraine, and Kazakhstan (RUK)
66
Figure A3.3 The PCA biplot map of the variables and factors for wheat crops in 2012, Ukraine
The ADM1s, characterised by “Severe,” “Moderate” drought and “Dry period,” represented all together roughly 58% of production. They have been set in the left quadrants of the plot (Figure A3.4), corresponding to the lowest values of the yield with an average yield loss of 35%.
The ADM1s group, which detected the “No water stress” values, represented 40% of production. The average yield of Ternopil’s’ka, Chernivets’ka and Khmel’nyts’ka (12% of production) went down by 7%, and at the same time, the remaining 28% of the group significantly increased the yield by 18%, as indicated in Table A3.2.
According to the figures, the yield loss likely occurred to Ternopil’s’ka, Chernivets’ka and Khmel’nyts’ka does not seem to originate from drought since water scarcity was not the main issue of this latter group (“No water stress”).

Understanding the drought impact of El Niño/La Niña in the grain production areas in Eastern
Europe and Central Asia (ECA): Russia, Ukraine, and Kazakhstan (RUK)67
Figure A3.4 The PCA map of the variables and individuals by drought level for wheat crops in 2012, Ukraine
Table A3.2 Statistics of the ADM1 clusters by drought level for wheat crops in 2012, Ukraine
Drought level ADM1 Prod. Share
(%)
Yield 2012 (t/ha)
Yield Chg
2012/11
Yield Change Rate Average
2012/11
Severe
Krym 6 1.5 -55%
-45%
Khersons’ka 7 1.6 -55%
Dnipropetrovs’ka 3 1.7 -47%
Zaporiz’ka 6 1.7 -44%
Odes’ka 7 2.4 -23%
Moderate Mykolayivs’ka 7 1.8 -43% -43%
Dry period
Donets’ka 2 2.2 -33%
-17%
Kharkivs’ka 4 2.9 -20%
Kirovohrads’ka 6 2.9 -19%
Vinnyts’ka 6 4.0 -12%
Poltavs’ka 4 3.3 -2%

Understanding the drought impact of El Niño/La Niña in the grain production areas in Eastern Europe and Central Asia (ECA): Russia, Ukraine, and Kazakhstan (RUK)
68
Drought level ADM1 Prod. Share
(%)
Yield 2012 (t/ha)
Yield Chg
2012/11
Yield Change Rate Average
2012/11
No-water stress
Ternopil’s’ka 3 4.2 -10%
-7%
18%
Chernivets’ka 3 3.7 -7%
Khmel’nyts’ka 6 4.4 -5%
Ivano-frankivs’ka 2 3.8 0%
Luhans’ka 1 2.8 0%
Rivnens’ka 2 3.4 5%
L’vivs’ka 3 3.6 8%
Cherkas’ka 5 4.4 9%
Volyns’ka 3 3.0 10%
Zhytomyrs’ka 2 3.4 14%
Sums’ka 4 3.6 24%
Chernihivs’ka 2 3.8 40%
Kyyivs’ka 4 4.5 72%
Table A3.2 summarises the data of the analysis, underlining the decreases duringthe No-water stress.

Understanding the drought impact of El Niño/La Niña in the grain production areas in Eastern
Europe and Central Asia (ECA): Russia, Ukraine, and Kazakhstan (RUK)69
Figure A4.1 The PCA biplot map of the variables and factors for maize crop in 2007, Ukraine
The ADM1s were characterised by “Extreme,” “Severe,” and “Moderate” drought, and represented 61% of the national production.
They have been positioned on the left quadrants of the plot in Figure A4.2, corresponding to the lowest values of the yield (below the average yield 3.9 t/ha) and the highest change rate on the previous year. The average yield of this group dropped by 20%. The only exception is Khersons’ka yield, with a growth of 7%, despite having been affected by an “Extreme” drought. On the other hand, the average yields of the ADM1s, which can be grouped as “Dry period” and “No-water stress” clusters, went up respectively by 17% and by 11%, as Table A4.1 summarises.
Annex 4. PCA for the geo-area groups and drought level of maize crops, during the drought period, Ukraine
2007: The first two components of the PCA biplot map, in Figure A4.1, resume 94% of the total variance.
Yield, yield change rate, and 100-ASI are correlated, and they make up the first component, setting the ADM1s from left to right in correspondence of the lowest values of these variables to the highest. On the other hand, the production share is the main contributor to the second component.
At the same time, the ADM1s are set by climbing from the bottom-right toward the top-left, in correspondence to the lowest values of production share to the highest.

Understanding the drought impact of El Niño/La Niña in the grain production areas in Eastern Europe and Central Asia (ECA): Russia, Ukraine, and Kazakhstan (RUK)
70
Figure A4.2 The PCA map of the variables and individuals by drought level for maize crop in 2007, Ukraine
Table A4.1 Statistics of the ADM1 clusters by drought level for maize crop in 2007, Ukraine
Drought level ADM1 Prod.
Share (%)Yield 2007
(t/ha)Yield Chg. 2007/06
Yield Change Rate Average
2007/06
Extreme
Dnipropetrovs’ka 11 2.2 -17%
-30%
Donets’ka 6 1.4 -47%
Kirovohrads’ka 7 2.5 -37%
Mykolayivs’ka 4 1.5 -46%
Khersons’ka 2 4.1 7%
Zaporiz’ka 5 1.3 -38%
Severe
Odes’ka 7 1.1 -52%
-27%Cherkas’ka 8 4.9 -7%
Vinnyts’ka 5 3.6 -23%
Moderate Luhans’ka 6 2.4 -4% -4%
Dry period
Zakarpats’ka 4 4.6 2%17%
Kharkivs’ka 4 3.7 32%

Understanding the drought impact of El Niño/La Niña in the grain production areas in Eastern
Europe and Central Asia (ECA): Russia, Ukraine, and Kazakhstan (RUK)71
Drought level ADM1 Prod.
Share (%)Yield 2007
(t/ha)Yield Chg. 2007/06
Yield Change Rate Average
2007/06
No-water stress
Poltavs’ka 8 4.7 16%
11%
Chernivets’ka 9 4.8 3%
Kyyivs’ka 2 5.7 1%
Ivano-frankivs’ka 2 4.1 6%
Chernihivs’ka 2 5.1 10%
Khmel’nyts’ka 2 5.2 22%
Ternopil’s’ka 3 4.7 23%
Sums’ka 1 3.8 6%
Table A4.1 provides the complement of the analysis mentioned above showing the anomalous data relate to Khersons’ka, Zakarpats’ka and Kharkivs’ka.
2012: The first two components of the biplot map, in Figure A4.3, summarise 96% of the total variance. Yield, yield change rate, and 100-ASI are correlated, and they make up the first component.
The ADM1s are set from left to right in correspondence of the lowest values of these variables to the highest. Also, the production share is the main contributor of the second component, so that, at the same time, the ADM1s are set by climbing from the bottom-right toward the top-left, in correspondence to the lowest values of production share to the highest.
The “Severe” effect was the worst scenario of the drought in 2012, thus not marking the “Extreme” drought values.

Understanding the drought impact of El Niño/La Niña in the grain production areas in Eastern Europe and Central Asia (ECA): Russia, Ukraine, and Kazakhstan (RUK)
72
Figure A4.3. The PCA biplot map of the variables and factors for maize crop in 2012, Ukraine
The ADM1s, characterised by “Severe,” “Moderate” drought and “Dry period,” represented all together roughly 55% of the total country production.
They have been set on the left quadrants of the plot, corresponding to the lowest values of the yield (below the yield average: 4.5 t/ha). The related average yield fell by 43%.
The ADM1s group, which detected the “No-water stress” values, represented 41.6% of production, of which 36% reported an overall average yield decrease of 17%, with significant drops marked by Kharkivs’ka, Cherkas’ka and Luhans’ka. Likely, the significant yield loss of this latter group, occurred this year, might be due to different unobserved causes since ASI values did not indicate water scarcity.
On the other hand, the favourable effect of “No-water stress” conditions benefited Ivano-frankivs’ka, Khmel’nyts’ka and Ternopil’s’ka that increased the yield by 7%.

Understanding the drought impact of El Niño/La Niña in the grain production areas in Eastern
Europe and Central Asia (ECA): Russia, Ukraine, and Kazakhstan (RUK)73
Figure A4.4 The PCA map of the variables and individuals by drought level for maize crop in 2012, Ukraine.
The following Table A4.2 reports data of the clusters, underlining the yield losses that might not have stemmed from the drought since dominated by a “No-water stress” period.
Table A4.2 Statistics of the ADM1 clusters by drought level for maize crop in 2012, Ukraine
Drought level ADM1
Prod. Share (%)
Yield 2012 (t/
ha)Yield Chg 2012/11
Yield Change Rate Average
2012/11
Severe
Dnipropetrovs’ka 11 1.7 -62%
-43%Odes’ka 7 1.7 -58%
Zaporiz’ka 5 1.6 -49%
Khersons’ka 2 5.0 -5%
Moderate Mykolayivs’ka 4 2.5 -47% -47%
Dry period
Kirovohrads’ka 7 3.7 -44%
-36%Poltavs’ka 8 4.7 -40%
Donets’ka 6 2.4 -37%
Vinnyts’ka 5 5.9 -22%

Understanding the drought impact of El Niño/La Niña in the grain production areas in Eastern Europe and Central Asia (ECA): Russia, Ukraine, and Kazakhstan (RUK)
74
Drought level ADM1
Prod. Share (%)
Yield 2012 (t/
ha)Yield Chg 2012/11
Yield Change Rate Average
2012/11
No-water stress
Kharkivs’ka 4 3.5 -39%
-17%
7%
Cherkas’ka 8 6.6 -28%
Luhans’ka 6 2.9 -25%
Kyyivs’ka 2 6.8 -15%
Sums’ka 1 5.8 -11%
Zakarpats’ka 4 4.4 -8%
Chernivets’ka 9 5.5 -6%
Chernihivs’ka 2 6.2 -4%
Ivano-frankivs’ka 2 5.9 3%
Khmel’nyts’ka 2 6.9 9%
Ternopil’s’ka 3 7.1 14%
The Table A4.2 reports data of the clusters, underlining the yield losses that might not have stemmed from the drought since dominated by a “No-water stress” period.”

Understanding the drought impact of El Niño/La Niña in the grain production areas in Eastern
Europe and Central Asia (ECA): Russia, Ukraine, and Kazakhstan (RUK)75
Figure A5.1 The PCA biplot map of the variables and factors for wheat crops in 1998, Kazakhstan
The ADM1s, which were characterised by “Extreme” and “Severe” drought, represented 59% of the national production. They have been positioned on the left quadrants of the plot, corresponding to the lowest values of the yield and the negative highest change rate on the previous year. The overall average yield of these clusters went down by 53%.
Annex 5. PCA for the geo-area groups and drought level of wheat crops, during the drought period, Kazakhstan
1998: The first two dimensions of the PCA biplot map, in Figure A5.1, resume 86% of the total variance. Yield, yield change rate, and 100-ASI are correlated, and they make up the first component, setting the ADM1s from left to right in correspondence of the lowest values of these variables to the highest. On the other hand, the production share is the main contributor to the second component.
At the same time, the ADM1s are set by climbing from the bottom-right toward the top-left, in correspondence to the lowest values of production share to the highest.
The “Moderate” level of the drought was not marked, indicating a net gap between extreme values of ASI occurred over this year.

Understanding the drought impact of El Niño/La Niña in the grain production areas in Eastern Europe and Central Asia (ECA): Russia, Ukraine, and Kazakhstan (RUK)
76
At the same time, Severo-kazachstanskaya in the Northern area (representing 27% of production share) was also affected by a “Dry period,” with a significant decrease of 41%. On the other hand, the average yield of Karagandinskaya, situated in the central country area, went up by 41%, despite the unfavourable aridity weather conditions.
Similar heterogeneous effects also impacted the ADM1s, which can be grouped as “No -water stress” cluster, such as Yujno-kazachstanskaya and Jambylslkaya, situated in the Southern-central area, just south of Karagandinskaya, that declined their average yield by 13%. It leads to suppose that other unobserved factors contributed to the yield loss, in these ADM1s that were not affected by water stress.
The yield average of the remaining Eastern area grew by 38%, however.
Figure A5.2 The PCA map of the variables and individuals by drought level for wheat crops in 1998, Kazakhstan
Table A5.1 summarises the observations mentioned above, pointing out the unexpected effects on the yield change compared to the level of drought in Karagandinskaya, Yujno-kazachstanskaya and Jambylslkaya.

Understanding the drought impact of El Niño/La Niña in the grain production areas in Eastern
Europe and Central Asia (ECA): Russia, Ukraine, and Kazakhstan (RUK)77
Table A5.1 Statistics by the ADM1 clusters by drought level for wheat crops in 1998, Kazakhstan
Drought level ADM1
Prod. Share
(%)
Yield 1998 (t/ha)
Yield Chg rate
1998/97
Yield Change Rate Average
1998/97
Extreme
Kustanayskaya 29% 0.40 -59%
-58%Akmolinskaya 25% 0.36 -36%
Aktyubinskaya 2% 0.20 -78%
SevereZapadno-kazachstanskaya 2% 0.17 -79%
-48%Pavlodarskaya 2% 0.39 -17%
Dry period
Severo-kazachstanskaya 27% 0.68 -41% -41%
Karagandinskaya 3% 0.41 41% 41%
No-water stress
Yujno-kazachstanskaya 2% 1.16 -20%
-13%
38%
Jambylslkaya 2% 1.05 -6%
Vostochno-kazachstanskaya 3% 0.89 53%
Almatinskaya 3% 1.31 22%
2008: The first two components of the biplot map, in Figure A5.2, resume 87% of the total variance. Yield, yield change rate and 100-ASI are correlated and are the main contributor to the first component.
The ADM1s are set up from left to right in correspondence of the lowest values of these variables to the highest.
The production share is the main contributor of the second component, yet the ADM1s are set by climbing from the bottom-left toward the top-right, always in correspondence to the lowest values of production share to the highest.

Understanding the drought impact of El Niño/La Niña in the grain production areas in Eastern Europe and Central Asia (ECA): Russia, Ukraine, and Kazakhstan (RUK)
78
Figure A5.3 The PCA biplot map of the variables and factors for maize crop in 2008, Kazakhstan
The ADM1s, characterised by “Extreme,” “Severe,” “Moderate” drought and “Dry period,” represented all together roughly 16% of the national production. They have been set in the left quadrants of the plot (Figure A5.2), corresponding to the lowest values of the yield. The overall average yield fell by 48%.
The ADM1s group, which detected the “No-water stress” values, decreased the yield by an average of 26%, marked by the three most productive regions such as Akmolinskaya, Severo-kazachstanskaya and Kustanayskaya that together accounted for 80% of the national production.
On the other hand, the yield of the least productive regions (representing 4%) increased by 31%.

Understanding the drought impact of El Niño/La Niña in the grain production areas in Eastern
Europe and Central Asia (ECA): Russia, Ukraine, and Kazakhstan (RUK)79
Figure A5.4 The PCA map of the variables and individuals by drought level for wheat crops in 2008, Kazakhstan
Table A5.2 tatistics of the ADM1 clusters by drought level for wheat crops in2008, Kazakhstan
Drought level ADM1
Prod. Share
(%)
Yield 2008 (t/ha)
Yield Chang
rate 2008/07
Yield Change Rate Average
2008/07
ExtremeJambylslkaya 2% 0.65 -48%
-56%Vostochno-kazachstanskaya 3% 0.42 -65%
Severe Almatinskaya 3% 0.88 -53% -53%
Moderate Yujno-kazachstanskaya 2% 0.90 -42% -42%
Dry periodPavlodarskaya 2% 0.39 -55%
-42%Karagandinskaya 3% 0.58 -28%
No-water stress
Akmolinskaya 25% 0.74 -36%
-26%Severo-kazachstanskaya 27% 1.22 -19%
Kustanayskaya 29% 1.15 -23%
Zapadno-kazachstanskaya 2% 1.33 56%31%
Aktyubinskaya 2% 0.82 6%
Table A5.2 indicates that the significant drop of Akmolinskaya, Severo kazach-stanskaya and Kustanayskaya, that is unlikely to be only due to the drought.

Understanding the drought impact of El Niño/La Niña in the grain production areas in Eastern Europe and Central Asia (ECA): Russia, Ukraine, and Kazakhstan (RUK)
80
2010: The first two components on the biplot map, in Figure A5.5, report 86.16% of the total variance. Yield, change rate and 100-ASI are correlated and are the main contributor to the first component. The ADM1s are set up from left to right in correspondence of the lowest values of these variables to the highest.
The production share is still the main contributor of the second component so that the ADM1s are set by climbing from the bottom-left toward the top-right, in correspondence to the lowest values of production share to the highest.
The drought level, now, does not include a “Dry period” effect. However, significant losses have also affected those ADM1 that have had a “No water stress” effect.
Figure A5.5 The PCA biplot map of the variables and factors for maize crop in 2010, Kazakhstan
The ADM1s, characterised by “Extreme,” “Severe,” “Moderate” drought, represented 84% of production. They are positioned on the left quadrants of the plot (Figure A5.6) and correspond to the lowest values of the yield (below the yield average 0.87 t/ha), with an average yield loss of 40%.
The ADM1s group, which detected the “No-water stress” values, was made up by a group of the least productive regions (all together, they accounted for 16% of the national production). Although no drought was observed, the yield change rate average decreased by about 35%, as reported in Table A5.3.

Understanding the drought impact of El Niño/La Niña in the grain production areas in Eastern
Europe and Central Asia (ECA): Russia, Ukraine, and Kazakhstan (RUK)81
According to the figures, there was a dramatic fall in wheat yield during 2010, that hit both areas affected and non-affected by drought probably caused by heterogeneous events.
Figure A5.6 The PCA map of the variables and individuals by drought level for wheat crops in 2010, Kazakhstan.
Table A5.3 PCA: Statistics of the ADM1 clusters by drought level for wheat cropsin 2010, Kazakhstan
Drought level ADM1
Prod. Share
(%)
Yield 2010 (t/ha)
Yield Chg rate
2010/09
Yield Change Rate Aver-
age2010/09
ExtremeKustanayskaya 29% 0.73 -34%
-48%Aktyubinskaya 2% 0.24 -63%
Severe Severo-kazachstanskaya 27% 0.96 -33% -33%
Moderate Akmolinskaya 25% 0.51 -53%-39%
Zapadno-kazachstanskaya 2% 0.44 -24%
No-water stress
Pavlodarskaya 2% 0.57 -59%
-35%
Vostochno-kazachstanskaya 3% 0.98 -39%
Karagandinskaya 3% 0.46 -41%
Yujno-kazachstanskaya 2% 1.47 -24%
Jambylslkaya 2% 1.46 -33%
Almatinskaya 3% 1.80 -16%
Table A5.3 indicates in detail the data of the analysis showing the yield anomalies occurred during the “No-water stress.

Understanding the drought impact of El Niño/La Niña in the grain production areas in Eastern Europe and Central Asia (ECA): Russia, Ukraine, and Kazakhstan (RUK)
82
2012: The first two dimensions of the biplot map show 93% of the total variance. Yield, yield change rate and 100-ASI are correlated, contributing to create the first component so that the ADM1s are set up from left to right in correspondence of the lowest values of these variables to the highest, as well as the production share is the main contributor of the second component.
Therefore, at the same time, the ADM1s are set the, by climbing from the bottom-left toward the top-right, in correspondence to the lowest values of production share to the highest.
Figure A5.7 The PCA biplot map of the variables and factors for maize crop in 2012, Kazakhstan
The ADM1s, characterised by “Extreme” and “Severe” drought, represented 29% of production. They have been positioned on the left quadrants of the plot (Figure A5.8), with the lowest values of the yield (below the yield average of 0.82 t/ha) and an average yield loss by 57%. The right quadrants set the ADM1 with “Moderate” drought, Dry and “No water stress” periods.
According to the figures reported in table 18, the whole country seems to have marked high yield losses, sorting out by the “Extreme” drought to the “No water stress” clusters, except for Vostochno-Kazachstanskaya with an average yield increase of 2%.

Understanding the drought impact of El Niño/La Niña in the grain production areas in Eastern
Europe and Central Asia (ECA): Russia, Ukraine, and Kazakhstan (RUK)83
The “No-water stress” effect seems to have provoked a negative yield change decrease rate, thus leading to suppose that Almatinskaya yield loss was not due to the drought.
Figure A5.8The PCA map of the variables and individuals by drought level for wheat crops in 2012, Kazakhstan
Table A5.4 Statistics of the ADM1 clusters by drought level for wheat crops in2012, Kazakhstan
Drought level ADM1
Prod. Share
(%)
Yield 2012 (t/ha)
Yield Chg rate
2012/11
Yield Change Rate Average
2012/11
Extreme Aktyubinskaya 2% 0.28 -62% -62%
SevereAkmolinskaya 25% 0.70 -55%
-52%Pavlodarskaya 2% 0.38 -50%
ModerateJambylslkaya 2% 0.86 -44%
-42%Karagandinskaya 3% 0.65 -40%
Dry period
Kustanayskaya 29% 0.61 -67%
-34%
Severo-kazachstanskaya 27% 1.15 -45%
Vostochno-kazachstanskaya 3% 1.09 2%
Zapadno-kazachstanskaya 2% 0.58 -39%
Yujno-kazachstanskaya 2% 1.09 -23%
No-water stress
Almatinskaya 3% 1.63 -14% -14%
Table A5.4 highlights again the anomalies occurred in Vostochno-Kazachstanskaya and Almatinskaya.

Understanding the drought impact of El Niño/La Niña in the grain production areas in Eastern Europe and Central Asia (ECA): Russia, Ukraine, and Kazakhstan (RUK)
84
Annex 6. Russian Federation - PCA for the geo-area groups and drought level of winter wheat crop, during the drought period
1998: The first two dimensions of the biplot map, in Figure A6.1, resume roughly 99% of the total variance. Yield, yield change rate and 100-ASI are correlated, defining the first component.
As a result, the ADM1s from left to right in correspondence of the lowest values of these variables to the highest.
At the same time, the production share is highly correlated with the second component, so that the ADM1s are also set by climbing from the bottom-left toward the top-right, in correspondence to the lowest values of production share to the highest.
Figure A6.1 The PCA biplot map of the variables and factors for winter wheat crop in 1998, Russian Federation
The ADM1s, which were characterised by “Extreme,” “Severe” and “Moderate” drought, represented 7% of production with an average yield loss of 64%. At the same time, the average yield of the “Dry period” cluster (8% of production) went down by 42%.
Both groups, have been positioned on the left quadrants of the plot (Figure A6.2), the lowest values of the yield (below a yield average of 1.7 t/ha) and to the highest negative change rate on the previous year (about -60%).
The ADM1s, which can be grouped as “No water stress” cluster, represented 77% of production and marked an average yield decrease of 19%.

Understanding the drought impact of El Niño/La Niña in the grain production areas in Eastern
Europe and Central Asia (ECA): Russia, Ukraine, and Kazakhstan (RUK)85
Although the ASI values did indicate water stress in the latter group, there was a significant decline in the winter wheat which affected almost the entire area of Southern-central and Volga districts, reporting a wide negative range of yield change rate on the previous year. The highest losses from 52% to 70% were due to the Ulyanovskaya Oblast and the Tatarstan Republic, while Stavropolskiy Kray, the Rostovskaya Oblast, and the Orlovskaya Oblast reported the lowest losses, as shown in Table A6.1. Thus, still indicating the large heterogeneity of this country area.
Figure A6.2 The PCA map of the variables and individuals by drought level for winter wheat crop in 1998, Russian Federation
Table A6.1 Statistics by ADM1 clusters and drought level for winter wheat crop in 1998, Russian Federation
Drought level ADM1Prod. Share
(%)
Yield 1998 (t/ha)
Yield Chg rate 1998/97
Yield Change Rate Average
1998/97
Extreme Orenburgskaya Oblast 1% 0.6 -67% -67%
Severe Saratovskaya Oblast 4% 0.9 -62% -62%
Moderate Samarskaya Oblast 2% 0.9 -61% -61%
Dry periodVolgogradskaya Oblast 7% 1.2 -35%
-42%Penzenskaya Oblast 1% 1.1 -50%

Understanding the drought impact of El Niño/La Niña in the grain production areas in Eastern Europe and Central Asia (ECA): Russia, Ukraine, and Kazakhstan (RUK)
86
Drought level ADM1Prod. Share
(%)
Yield 1998 (t/ha)
Yield Chg rate 1998/97
Yield Change Rate Average
1998/97
No-water stress
Tatarstan Rep. 2% 1.1 -70%
-19%
Ulyanovskaya Oblast 1% 1.0 -52%
Ryazanskaya Oblast 2% 1.7 -24%
Voronezhskaya Oblast 4% 2.0 -24%
Lipetskaya Oblast 3% 2.2 -21%
Tambovskaya Oblast 3% 2.1 -21%
Tulskaya Oblast 2% 1.8 -20%
Belgorodskaya Oblast 3% 2.4 -18%
Krasnodarskiy Kray 19% 2.9 -17%
Kurskaya Oblast 3% 2.1 -17%
Rostovskaya Oblast 15% 2.1 -5%
Stavropolskiy Kray 17% 2.3 -3%
Orlovskaya Oblast 3% 2.3 -3%
Table A6.1 provides detailed data about the anomalous yield losses during the effect of “No-water stress,” likely not stemming from drought.
2010: The first component of the PCA biplot map, in Figure A6.3, shows 88.62% of the total variance. Yield, yield change rate, 100-ASI and production share are correlated, contributing to making up the first component.
As a result, the ADM1s from left to right are in correspondence of the lowest values of these variables to the highest.

Understanding the drought impact of El Niño/La Niña in the grain production areas in Eastern
Europe and Central Asia (ECA): Russia, Ukraine, and Kazakhstan (RUK)87
Figure A6.3 The PCA biplot map of the variables and factors for winter wheat crop in 2010, Russian Federation
The ADM1s, that were characterized by “Extreme,” “Severe” and “Moderate” drought and “Dry period,” represented all together roughly 41% of the national production and corresponded to the lowest values of the yield (below the yield average 1.9t/ha), with an average yield loss of 41.3%. The ADM1s, grouped as a “No water stress” cluster, represented 51% of the production, with an average yield that rose by 5% (Figure A6.4).
Table A6.2 shows the split into two principal areas: the most productive regions (51%) that were not affected by the drought and the remaining 40% that were strongly impacted by the aridity effect.
Figure A6.4 The PCA map of the variables and individuals by drought level for winter wheat crop in 2010, Russian Federation

Understanding the drought impact of El Niño/La Niña in the grain production areas in Eastern Europe and Central Asia (ECA): Russia, Ukraine, and Kazakhstan (RUK)
88
Table A6.2 Statistics of the ADM1 clusters by drought level for winter wheat crop in 2010, Russian Federation
Drought level ADM1Prod. Share
(%)
Yield 2010 (t/ha)
Yield Chg rate 2010/09
Yield Change
Rate Aver-age 2010/09
Extreme
Samarskaya Oblast 2% 1.2 -41%
-49%
Tatarstan Rep. 2% 1.0 -69%
Orenburgskaya Oblast 1% 1.1 -42%
Ulyanovskaya Oblast 1% 1.0 -58%
Saratovskaya Oblast 4% 0.9 -45%
Penzenskaya Oblast 1% 1.3 -43%
Tambovskaya Oblast 3% 1.6 -46%
Severe
Voronezhskaya Oblast 4% 1.5 -46%
-39%
Volgogradskaya Oblast 7% 1.3 -36%
Lipetskaya Oblast 3% 2.1 -45%
Orlovskaya Oblast 3% 2.5 -29%
Moderate
Kurskaya Oblast 3% 2.2 -36%
-43%Ryazanskaya Oblast 2% 1.6 -52%
Tulskaya Oblast 2% 2.0 -40%
Dry Belgorodskaya Oblast 3% 2.1 -34% -34%
No-water stress
Rostovskaya Oblast 15% 2.7 2%
5%Stavropolskiy Kray 17% 3.4 6%
Krasnodarskiy Kray 19% 5.0 9%
Table A6.2 provides detailed data about the anomalous yield losses during the effect of “No-water stress,” likely not stemming from drought.

Understanding the drought impact of El Niño/La Niña in the grain production areas in Eastern
Europe and Central Asia (ECA): Russia, Ukraine, and Kazakhstan (RUK)89
Annex 7. PCA for the geo-area groups and drought level of spring wheat crop during the drought period, Russian Federation
1998: The first two components of the biplot map, in Figure A7.1, show roughly 85% of the total variance. Yield, yield change rate and 100-ASI are correlated, contributing to create the first component.
As a result, the ADM1s from left to right in correspondence of the lowest values of these variables to the highest. At the same time, the production share is highly correlated with the second component, so that the ADM1s are also set by climbing from the bottom-left toward the top-right, in correspondence to the lowest values of production share to the highest.
Based on ASI values, the ADM1 can be grouped according to the drought level as illustrated in the factor map of Figure A7.2. However, significant losses also affected those ADM1s that marked the “No water stress” values.
Figure A7.1 The PCA biplot map of the variables and factors for spring wheat crop in 1998, Russian Federation
The ADM1s, set in the plot of Figure A7.2, was characterised by “Extreme,” “Severe” and “Moderate” drought and represented 21%, with an average yield loss of 61%.

Understanding the drought impact of El Niño/La Niña in the grain production areas in Eastern Europe and Central Asia (ECA): Russia, Ukraine, and Kazakhstan (RUK)
90
The ADM1s, grouped as “No-water stress” cluster, represented altogether 52% of production. They decreased the yield by an average of 19%.
However, only Altayskiy Kray and the Tomskaya Oblast marked a yield growth of 11%. The average yield of the remaining ADM1s (34% of production) went down by 28%, as illustrated in Table A7.1.
Figure A7.2 The PCA map of the variables and individuals by drought level for spring wheat crop in 1998, Russian Federation
Table A7.1 Statistics of the ADM1 clusters by drought level for spring wheat crop in 1998, Russian Federation
Drought level ADM1Prod. Share
(%)
Yield 1998 (t/ha)
Yield Chg 1998/97
Yield Change rate Average
1998/97
ExtremeOrenburgskaya Oblast 6% 0.5 -60%
-59%Chelyabinskaya Oblast 5% 0.6 -58%
SevereSaratovskaya Oblast 2% 0.6 -60%
-57%Bashkortostan Rep. 6% 0.9 -55%
Moderate Samarskaya Oblast 1% 0.6 -68% -68%

Understanding the drought impact of El Niño/La Niña in the grain production areas in Eastern
Europe and Central Asia (ECA): Russia, Ukraine, and Kazakhstan (RUK)91
Drought level ADM1Prod. Share
(%)
Yield 1998 (t/ha)
Yield Chg 1998/97
Yield Change rate Average
1998/97
Dry periodKurganskaya Oblast 6% 1.1 -34%
-24%Novosibirskaya Oblast 9% 1.2 -14%
No-Water Stress
Tatarstan Rep. 7% 2.1 -51%
-28%
11%
Ulyanovskaya Oblast 1% 1.1 -38%
Sverdlovskaya Oblast 1% 1.1 -35%
Tyumenskaya Oblast 4% 1.3 -34%
Nizhegorodskaya Oblast 1% 1.2 -34%
Omskaya Oblast 11% 1 -21%
Irkutskaya Oblast 2% 1.4 -12%
Krasnoyarskiy Kray 7% 1.7 -1%
Altayskiy Kray 14% 1 13%
Tomskaya Oblast 1% 1.4 9%
Kemerovskaya Oblast 3% 1.4 0%
Table A7.1 provides detailed data about the anomalous yield losses during the effect of “No-water stress,” likely not stemming from drought.
2010: The first two components of the biplot map, in Figure A7.3, show 91% of the total variance. Yield, yield change rate and 100-ASI are correlated, contributing to making up the first component.
Therefore, the ADM1s are set from left to right in correspondence of the lowest values of these variables to the highest.
At the same time, the production share is highly correlated with the second component, so that the ADM1s are also set by climbing from the bottom-left toward the top-right, in correspondence to the lowest values of production share to the highest.

Understanding the drought impact of El Niño/La Niña in the grain production areas in Eastern Europe and Central Asia (ECA): Russia, Ukraine, and Kazakhstan (RUK)
92
Figure A7.3 The PCA biplot map of the variables and factors for spring wheat crop in 2010, Russian Federation
The ADM1s, set in the plot of Figure A7.4, that were characterised by “Extreme,” “Severe” and “Moderate” drought, represented all together roughly 30% of the national production and corresponded to the lowest values of the yield (below the average 1.2t/ha), with an average yield loss of 43%.
The ADM1s, grouped as “No water stress” cluster, represented 51% of the production. Their overall average yield declined by 14%, as well as the Tyumenskaya Oblast (4% of production), that was affected by a “Dry period,” significantly decreased by 14% in yield. In addition, the average yield of the group with “No-water stress” values went down by 17%. The most productive ADM1s such as Altayskiy Kray and the Omskaya Oblast (25% of the country production of spring wheat) lost about 26% compared to the yield of the previous year. Also, in this case, ASI values showed that the “No -water stress” could not have caused such negative impact on the yield, thus highlighting that other variables influenced by these results.

Understanding the drought impact of El Niño/La Niña in the grain production areas in Eastern
Europe and Central Asia (ECA): Russia, Ukraine, and Kazakhstan (RUK)93
Figure A7.4 The PCA map of the variables and individuals by drought level for spring wheat crop in 2010, Russian Federation
Only the Sverdlovskaya Oblast seems to have increased the yield by 5%, as illustrated in Table A7.2. The decreases might be due to unobserved factors.
Table A7.2. Statistics of the ADM1 clusters by drought level for spring wheat crop in 2010, Russian Federation” should be reported under the table
Drought level ADM1
Prod. Share
(%)
Yield 2010 (t/ha)
Yield Chg rate 2010/09
Yield Change Rate Average
2010/09
Extreme
Tatarstan Rep. 7% 1.0 -67%
-49%
Orenburgskaya Oblast 6% 0.4 -58%
Samarskaya Oblast 1% 1.0 -24%
Saratovskaya Oblast 2% 0.6 -44%
Ulyanovskaya Oblast 1% 0.7 -55%
SevereBashkortostan Rep. 6% 0.8 -65%
-54%Nizhegorodskaya Oblast 1% 1.3 -43%
ModerateChelyabinskaya Oblast 5% 0.9 -26%
-26%Kurganskaya Oblast 6% 1.0 -26%
Dry period Tyumenskaya Oblast 4% 1.7 -14% -14%

Understanding the drought impact of El Niño/La Niña in the grain production areas in Eastern Europe and Central Asia (ECA): Russia, Ukraine, and Kazakhstan (RUK)
94
Drought level ADM1
Prod. Share
(%)
Yield 2010 (t/ha)
Yield Chg rate 2010/09
Yield Change Rate Average
2010/09
No-water stress
Omskaya Oblast 11% 1.2 -36%
-17%
5%
Altayskiy Kray 14% 1.3 -15%
Novosibirskaya Oblast 9% 1.5 -19%
Krasnoyarskiy Kray 7% 2.1 -10%
Tyumenskaya Oblast 4% 1.7 -14%
Kemerovskaya Oblast 3% 1.7 -18%
Irkutskaya Oblast 2% 1.6 -15%
Tomskaya Oblast 1% 1.5 -6%
Sverdlovskaya Oblast 1% 1.6 5%
2012: The first two components of the biplot map, in Figure A7.5, summarise 82% of the total variance.
Yield, change rate and 100-ASI are correlated, contributing to the first component.
Therefore, the ADM1s are set from left to right in correspondence of the lowest values of these variables to the highest.
At the same time, the production share is highly correlated with the second component, so that the ADM1s are also set by climbing from the bottom-right toward the top-left, in correspondence to the lowest values of production share to the highest.
The “Extreme” values of the drought were not marked over the current year, thus indicating that the “Severe” effect (ASI values<53%) was the worst drought scenario occurred during this period.

Understanding the drought impact of El Niño/La Niña in the grain production areas in Eastern
Europe and Central Asia (ECA): Russia, Ukraine, and Kazakhstan (RUK)95
Figure A7.5 The PCA biplot map of the variables and factors for spring wheat crop in 2012, Russian Federation
The ADM1s shown in the plot of Figure A7.6 were characterized by “Severe” drought and “Dry period,” represented 63% of the national production, and corresponded to the lowest values of the yield (below the average 1.3 t/ha), with an average yield loss of 38%.
Additionally, the “Moderate” effect impacted one region, Krasnoyarskiy Kray of the Siberian district (one of the most productive areas of the spring wheat), which marked a yield drop of 23%
Lastly, the ADM1s group, grouped as “No water stress” cluster, represented 17% of production. Although no drought has been observed, the average yield of this group decreased by 25%, thus, still indicating that the yield loss was not due to the drought in the Ural and Volga area.
On the other hand, the Nizhegorodskaya Oblast and the Irkutskaya Oblast (always in the “No-water stress” group) reported an average yield growth of 3%, as Table A7.3 summarizes:
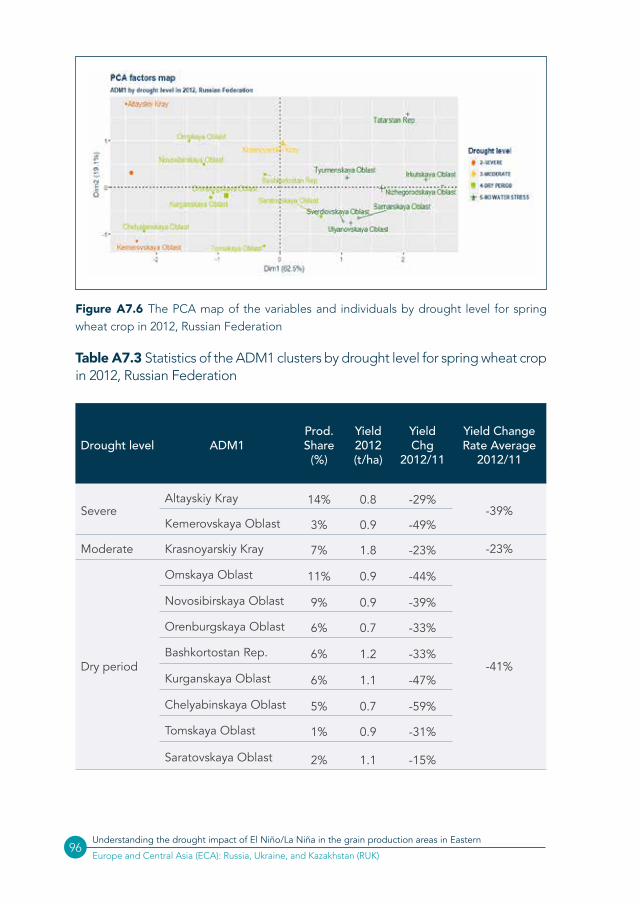
Understanding the drought impact of El Niño/La Niña in the grain production areas in Eastern Europe and Central Asia (ECA): Russia, Ukraine, and Kazakhstan (RUK)
96
Figure A7.6 The PCA map of the variables and individuals by drought level for spring wheat crop in 2012, Russian Federation
Table A7.3 Statistics of the ADM1 clusters by drought level for spring wheat crop in 2012, Russian Federation
Drought level ADM1Prod. Share
(%)
Yield 2012 (t/ha)
Yield Chg
2012/11
Yield Change Rate Average
2012/11
SevereAltayskiy Kray 14% 0.8 -29%
-39%Kemerovskaya Oblast 3% 0.9 -49%
Moderate Krasnoyarskiy Kray 7% 1.8 -23% -23%
Dry period
Omskaya Oblast 11% 0.9 -44%
-41%
Novosibirskaya Oblast 9% 0.9 -39%
Orenburgskaya Oblast 6% 0.7 -33%
Bashkortostan Rep. 6% 1.2 -33%
Kurganskaya Oblast 6% 1.1 -47%
Chelyabinskaya Oblast 5% 0.7 -59%
Tomskaya Oblast 1% 0.9 -31%
Saratovskaya Oblast 2% 1.1 -15%

Understanding the drought impact of El Niño/La Niña in the grain production areas in Eastern
Europe and Central Asia (ECA): Russia, Ukraine, and Kazakhstan (RUK)97
Drought level ADM1Prod. Share
(%)
Yield 2012 (t/ha)
Yield Chg
2012/11
Yield Change Rate Average
2012/11
No-water stress
Tyumenskaya Oblast 4% 1.8 -32%
-25%
3%
Sverdlovskaya Oblast 1% 1.5 -30%
Ulyanovskaya Oblast 1% 1.5 -28%
Samarskaya Oblast 1% 1.4 -17%
Tatarstan Rep. 7% 2.4 -15%
Nizhegorodskaya Oblast 1% 1.9 1%
Irkutskaya Oblast 2% 1.7 6%
Table A7.3 provides detailed data about the anomalous yield losses during the effect of “No-water stress,” likely not due to the drought.

Understanding the drought impact of El Niño/La Niña in the grain production areas in Eastern Europe and Central Asia (ECA): Russia, Ukraine, and Kazakhstan (RUK)
98
To avoid non-stationary concerns, the regression analysis has been carried out on the yield change rate on the previous year as the outcome variable () and 100-ASI as the regressor (x).
The plot in Figure A8.2 shows the distribution of the yield change average between 2000 and 2014 (n=20 years) for each ADM1, with a deviation of 95% confidence interval. It indicates a moderate heterogeneity across the regions that have been depended on the unobserved variables time invariant.
Although the overall yield variability is quite high within the individual groups, some ADM1 seem to have marked anomalous yield values in relation stemming from the fixed variables not observed in this study which corresponded to Dnipropetrovs’ka, Khersons’ka, Odes’ka, Mykolayivs’ka, Zaporiz’ka, Kirovohrads’ka and Poltavs’ka.
Figure A8.1 Trend in the wheat yield for each ADM1, Ukraine
Annex 8. Ukraine – Trend analysis of the winter wheat crop and PDA results
The analysis of the national wheat yield trend between 2000 and 2014, carried out by applying the Cox-Stuart test at the subnational level, has indicated a significant increasing trend at 95% confidence interval for each ADM1 (Figure A8.1), such as to reveal a non-stationary trend at country level too.

Understanding the drought impact of El Niño/La Niña in the grain production areas in Eastern
Europe and Central Asia (ECA): Russia, Ukraine, and Kazakhstan (RUK)99
Figure A8.2 Heterogeneity across the individual unit for wheat crops, Ukraine
Table A8.1 summarises the main outcome of the panel analysis, showing that although all models have provided a significant F-statistic, with p-values <0.05, the parameter estimates for both pooled OLS and random effects are similar. Even though the SSE and SEE do not seem to have high differences among the models, the value of theta () points out that the “between” variance among the groups is null.
The tests performed to select the model have reported that the pooled OLS model could be a reasonable choice as per Fph and Breusch-Pagan (bp) tests so that the marginal variation of 100-ASI determines a variation in the change rate equal to 1%.

Understanding the drought impact of El Niño/La Niña in the grain production areas in Eastern Europe and Central Asia (ECA): Russia, Ukraine, and Kazakhstan (RUK)
100
Table A8.1 Analysis results of the PDA fixed or random effects for wheat crops, Ukraine
Dependent variable: Yield change rate on the previous year (%)
Colonna1 Pooled OLS LSDV Fixed-within Random
100-ASI 0.0099836***(0.002)
0.0117***(0.002)
0.0117***(0.002)
0.0099***(0.002)
Intercept -0.7645063***(0.22)
-0.964701***(0.29) -0.764*** (0.2)
SSE 141.84 39.52 135.61 141.84
SEE 0.65 0.66 0.66 0.65
𝜃 - - - 0.00
Observations 336 336 336 336
F Statistic 18.39*** (df = 1; 334)
1.34 (df = 24; 311)
57.68*** (df = 1; 341)
18.39*** (df = 1; 334)
Fph test p-value 0.914
Bp test p-value 0.141
hp test p-value 0.018
Note: *p<0.1; **p<0.05; ***p<0.01

Understanding the drought impact of El Niño/La Niña in the grain production areas in Eastern
Europe and Central Asia (ECA): Russia, Ukraine, and Kazakhstan (RUK)101
Annex 9. Ukraine – Trend analysis of maize crop yield and PDA results
The analysis of the national wheat yield trend between 2000 and 2014, carried out by applying the Cox-Stuart test at the subnational level, has indicated a significant increasing trend at 95% confidence interval for each ADM1 (plots in figure 70); thus, allowing to consider a non-stationary trend at country level too.
Figure A9.1 Trend in the maize yield for each ADM1, Ukraine
Since the non-stationary trend, the regression analysis has been carried out on the yield change rate on the previous year (not subject to) as the outcome variable and 100-ASI as the regressor.
The plot in Figure A9.2 shows the yield change average between 2000 and 2014 (n=20 years) for each ADM1, with a deviation of 95% confidence interval. It indicates a very low heterogeneity across the regions that have been depended on the unobserved variables time invariant.
However, values of high yield variability were reported by some areas such as Dnipropetrovs’ka, Donets ’ka, Kharkivs’ka, Luhans’ka, Odes’ka, Mykolayivs’ka and Zaporiz’ka, that might be due to fixed or time-invariant factors belonging to the individual characteristics (not included in this analysis).

Understanding the drought impact of El Niño/La Niña in the grain production areas in Eastern Europe and Central Asia (ECA): Russia, Ukraine, and Kazakhstan (RUK)
102
Figure A9.2 Heterogeneity across the individual unit for maize crop, Ukraine
Table A9.1 summarizes the main outcome of the panel analysis, showing that although all models have provided a significant F-statistic, with p-values <0.05, the parameter estimates for both pooled OLS and random effects are similar as well as the values for SSE and SEE. Meanwhile, the value of theta (θ=0.00) points out that the “between” variance among the groups is null.
The tests performed to select the model reported that the random model could be a reasonable choice as per the Breusch-Pagan (bp) test so that the marginal variation of 100-ASI determines a variation in the change rate equal to 0.6%.
Table A9.1 Analysis results of the PDA fixed or random effects for maize crop, Ukraine
Dependent variable: Yield change rate on the previous year (%)
Colonna1 Pooled OLS LSDV Fixed-within Random
100-ASI 0.0060***(0.0012)
0.0064***(0.0013)
0.0064***(0.0013)
0.006036***(0.0012)
Intercept -0.469***(0.11)
-0.536***(0.15)
-0.469681***(0.11)
SSE 31.27 30.69 30.69 31.27
SEE 0.33 0.34 0.34 0.33
𝜃 - - - 0.00
Observations 280 280 280 280

Understanding the drought impact of El Niño/La Niña in the grain production areas in Eastern
Europe and Central Asia (ECA): Russia, Ukraine, and Kazakhstan (RUK)103
Dependent variable: Yield change rate on the previous year (%)
Colonna1 Pooled OLS LSDV Fixed-within Random
F Statistic 23.65***(df = 1; 278)
1.36(df = 20; 259)
24.71***(df = 1; 259)
23.65***(df = 1; 278)
Fph test p-value 0.9994
Bp test p-value 0.0143
hp test p-value 0.2597
Note: *p<0.1; **p<0.05; ***p<0.01

Understanding the drought impact of El Niño/La Niña in the grain production areas in Eastern Europe and Central Asia (ECA): Russia, Ukraine, and Kazakhstan (RUK)
104
Figure A10.1 Trend in the wheat yield for each ADM1, Kazakhstan
Based on the above consideration about the stationary trend of the yield, the regression analysis has been carried out on the logarithm of wheat yield, to ensure the equation linearity, as the outcome variable (y) and 100-ASI as the regressor (x).
The plot in Figure A10.2 shows the fluctuations of the yield average and the deviation of the yield (95% confidence interval), within each ADM1 over the whole period (n=21 years). It indicates a relevant heterogeneity across the regions due to the unobserved variables time invariant.
Zapadno-kazachstanskaya and Aktyubinskaya seem to have the lowest yield values with a high variability at the individual level, while Almatinskaya and Yujno-Kazachstanskaya have the highest, keeping the yield values around the average.
Annex 10. Kazakhstan – Trend analysis of the wheat crop yield and PDA results
The analysis of the national wheat yield trend between 1995 and 2015, carried out by applying the Cox-Stuart test at the subnational level, has indicated a non-significant increasing trend at 95% confidence interval for each ADM1 (plots in Figure A10.1); thus, allowing to consider a stationary trend at country level too.

Understanding the drought impact of El Niño/La Niña in the grain production areas in Eastern
Europe and Central Asia (ECA): Russia, Ukraine, and Kazakhstan (RUK)105
Figure A10.2 Heterogeneity across the individual unit for wheat crops, Kazakhstan
Table A10.1 summarizes the main outcome of the panel analysis, showing that although all models have provided a significant F-statistic, with p-values <0.05, the fixed and random models indicate that the Standard Errors Estimate (SSE) with 20.633 and the Residuals Sum of Squared Errors (SEE) with 0.306 are much lower than the OLS. In addition, the value of theta (θ=0.8048) reports 80% of variation coming from the individual (between) versus the idiosyncratic one.
The tests performed to select the model have reported that the random model could be a reasonable choice as per Breusch-Pagan (bp) and Hausman (hp) tests. However, both fixed and random have the same slope which informs that a variation of one point of 100-ASI determines a variation in the e ln(Yield) equal to 1.38 %.

Understanding the drought impact of El Niño/La Niña in the grain production areas in Eastern Europe and Central Asia (ECA): Russia, Ukraine, and Kazakhstan (RUK)
106
Table A10.1 Analysis results of the PDA fixed or random effects for wheat crops, Kazakhstan
Dependent variable: ln (Yield)
Colonna1 Pooled OLS LSDV Fixed-within Random
100-ASI 0.0152***(0.002)
0.0138***(0.001)
0.0138***(0.001)
0.0138***(0.001)
Intercept -1.422***(0.135)
-1.362***(0.112) -1.305***
(0.138)
SSE 47.246 20.633 20.633 21.655
SEE 0.454 0.306 0.306 0.307
𝜃 - - - 0.8048
Observations 231 231 231 231
F Statistic 99.44***(df = 1; 229)
45.52***(df = 11; 219)
172.07***(df = 1; 219)
173.11***(df = 1; 229)
Fph test p-value < 2.2e-16
Bp test p-value < 2.2e-16
hp test p-value 0.248
Note: *p<0.1; **p<0.05; ***p<0.01

Understanding the drought impact of El Niño/La Niña in the grain production areas in Eastern
Europe and Central Asia (ECA): Russia, Ukraine, and Kazakhstan (RUK)107
Annex 11. Russian Federation – Trend analysis of the winter wheat crop yield and PDA results
The analysis of the national wheat yield trend between 1995 and 2015, carried out by applying the Cox-Stuart test at the subnational level, has indicated a significant increasing trend at 95% confidence interval for each ADM1 (plots in Figure A11.1); thus, allowing to consider a non-stationary trend at country level too.
Figure A11.1 Trend in the winter wheat yield for each ADM1, Russian Federation
Since the non-stationary trend, the regression analysis has been carried out on the yield change rate on the previous year (not subject to non-stationary concerns) as the outcome variable (y) and 100-ASI as the regressor (x).
The plot in Figure A11.2 shows the distribution of the yield change average between 1996 and 2015 (n=20 years) for each ADM1, with a deviation of 95% confidence interval. It indicates a very low heterogeneity across the regions that have been dependent on the unobserved variables time invariant.
A high variability over the years is indicated at the unit level by the Orenburgskaya Oblast, the Tatarstan Republic, the Samarskaya Oblast, the Saratovskaya Oblast, the Ulyanovskaya Oblast and the Penzenskaya Oblast in the Volga area.
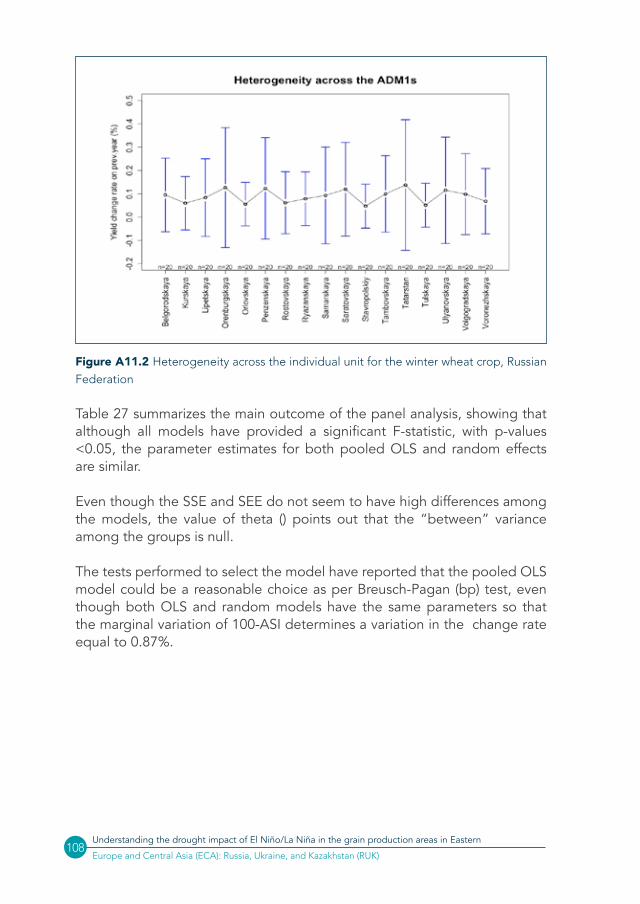
Understanding the drought impact of El Niño/La Niña in the grain production areas in Eastern Europe and Central Asia (ECA): Russia, Ukraine, and Kazakhstan (RUK)
108
Figure A11.2 Heterogeneity across the individual unit for the winter wheat crop, Russian Federation
Table 27 summarizes the main outcome of the panel analysis, showing that although all models have provided a significant F-statistic, with p-values <0.05, the parameter estimates for both pooled OLS and random effects are similar.
Even though the SSE and SEE do not seem to have high differences among the models, the value of theta () points out that the “between” variance among the groups is null.
The tests performed to select the model have reported that the pooled OLS model could be a reasonable choice as per Breusch-Pagan (bp) test, even though both OLS and random models have the same parameters so that the marginal variation of 100-ASI determines a variation in the change rate equal to 0.87%.

Understanding the drought impact of El Niño/La Niña in the grain production areas in Eastern
Europe and Central Asia (ECA): Russia, Ukraine, and Kazakhstan (RUK)109
Table A11.1 Analysis results of the PDA fixed or random effects for the winter wheat crop, Russian Federation
Dependent variable: Yield change rate on the previous year (%)
Colonna1 Pooled OLS LSDV Fixed-within Random
100-ASI 0.0086***(0.001)
0.0090***(0.001)
0.0090***(0.001)
0.0086903***(0.001)
Intercept -0.731***(0.11)
-0.795***(0.13)
-0.7317668***(0.11)
SSE 40.225 39.52 39.52 40.225
SEE 0.33 0.34 0.34 0.33
𝜃 - - - 0.00
Observations 360 360 360 378
F Statistic 54.46***(df = 1; 358)
3.35***(df = 18; 341)
57.68***(df = 1; 341)
56.46***(df = 1; 358)
Fph test p-value 0.995
Bp test p-value 0.03587
hp test p-value 0.1934
Note: *p<0.1; **p<0.05; ***p<0.01

Understanding the drought impact of El Niño/La Niña in the grain production areas in Eastern Europe and Central Asia (ECA): Russia, Ukraine, and Kazakhstan (RUK)
110
Figure A12.1 Trend in the spring wheat yield for each ADM1, Russian Federation
Based on the above consideration about the stationary trend of the yield and to ensure the equation linearity, the regression analysis has been carried out on the logarithm of wheat yield, as the outcome variable (y) and 100-ASI as the regressor (x).
The plot in figure 77 shows the average over the whole period (n=21 years), that has been calculated for each ADM1, with a deviation at 95% confidence interval, and indicates a relevant heterogeneity across the regions due to the unobserved variables time invariant.
The yield of the Kurganskaya Oblast, the Novosibirskaya Oblast, the Omskaya Oblast and the Tomskaya Oblast seem to have been affected by similar individual factors.
Annex 12. Russian Federation – Trend analysis of the spring wheat crop yield and PDA results
The analysis of the national wheat yield trend between 1995 and 2015, carried out by applying the Cox-Stuart test at the subnational level, has indicated a non-significant increasing trend at 95% confidence interval for each ADM1 (plots in Figure A12.1); thus, it allows considering a stationary trend at country level too.

Understanding the drought impact of El Niño/La Niña in the grain production areas in Eastern
Europe and Central Asia (ECA): Russia, Ukraine, and Kazakhstan (RUK)111
Figure A12.2 Heterogeneity across the individual unit for the spring wheat crop, Russian Federation
Table A12.1 summarizes the main outcome of the panel analysis, showing that although all models have provided a significant F-statistic, with p-values <0.05, the fixed and random models indicate that the Standard Errors Estimate (SSE) between 13.26 and 17.58 and the Residuals Sum of Squared Errors (SEE) between 0.19-0.21 is lower than the OLS one.
In addition, the value of theta (θ=0.70) reports 70% of variation coming from the individual versus the idiosyncratic one.
The tests performed to select the model have reported that the random model could be a reasonable choice as per Breusch-Pagan (bp) and Houseman (hp) tests, informs that a marginal variation of 100-ASI determines a variation in the ln(Yield) eqequal to 0.95 %.
The Orenburgskaya Oblast, the Tatarstan Republic, the Chelyabinskaya Oblast, the Bashkortostan Republic, the Samarskaya Oblast, the Saratovskaya Oblast and the Ulyanovskaya Oblast seem to have undergone the highest yield variability over the years due to the different individual unobserved factors.

Understanding the drought impact of El Niño/La Niña in the grain production areas in Eastern Europe and Central Asia (ECA): Russia, Ukraine, and Kazakhstan (RUK)
112
Table A12.1 Analysis results of the PDA fixed or random effects for the spring winter wheat crop, Russian Federation
Dependent variable: ln (Yield)
Colonna1 Pooled OLS LSDV Fixed-within Random
100-ASI 0.011***(0.011)
0.0090***(0.000)
0.0092***(0.001)
0.0094568***(0.000)
Intercept -0.72***(0.097)
-0.75***(0.077)
-0.534***(0.082)
SSE 32.17 20.633 13.26 17.586
SEE 0.29 0.19 0.19 0.21
𝜃 - - - 0.70
Observations 378 378 378 378
F Statistic 126.36***(df = 1; 376)
44.7***(df = 18; 359)
145.42***(df = 1; 359)
148.39***(df = 1; 376)
Fph test p-value < 2.2e-16
Bp test p-value < 2.2e-16
hp test p-value 0.08447
Note: *p<0.1; **p<0.05; ***p<0.01


Russia, Ukraine, and Kazakhstan (RUK)
Understandingthe drought impact in the grain production areas in EasternEurope and Central Asia (ECA):
of El Niño/La Niña
FAO
CA3758EN/1/03.19
ISBN 978-92-5-131342-8
9 7 8 9 2 5 1 3 1 3 4 2 8