understanding the environmental factors driving ...€¦ · understanding the environmental factors...
TRANSCRIPT

Understanding the Environmental Factors Driving Potentially Harmful Cyanobacteria
Growth and Their Toxins In Mt View Sanitary District Marshes (McNabney, Moorhen Marshes)
20130453 MVSD
Prepared for: Mt View Sanitary District
3800 Arthur Road Martinez CA 94553
Prepared by:
Cécile Mioni (Project Director), Raphael Kudela & Jonathan Zehr (Project co-Directors) University of California, Santa Cruz - Institute of Marine Sciences
Contract managers: Michael Roe (District Manager)
Neal Allen (Assistant District Manager) Mt View Sanitary District
_________________
With technical contributions by:
Kelly Davidson Chou & Lilia Corona (Field officers), MVSD Kendra Hayashi (Project manager), UCSC Nilo Alvarado (Research assistant), UCSC
Kendra Turbo-Turk (Research Specialist), UCSC Mary Hogan (Research Specialist), UCSC
Rob Franks (Marine Analytical Lab Manager), UCSC Andrew Chapman (Taxonomist), GreenWater Lab Inc.
Jon Detka (Statistics), CSUMB Peter Morrow & Mitchell Takata (UROC interns, statistics), CSUMB

Peyton Slough Marsh Complex CyanoHABs – MVSD/Grant# 20130453 1
EXECUTIVE SUMMARY
The purpose of this study was to identify the environmental drivers of noxious algae blooms in Mt. View Sanitary District marsh complex and identify what management measures and practices could be taken to mitigate or reduce these blooms and their toxins. This study was conducted because an unprecedented mat-forming bloom, which occurred during Summer/Fall 2013 in McNabney Marsh. We conducted monthly monitorings at four stations in Moorhen and McNabney marshes from May 2013 to December 2013 in order to identify the environmental drivers of individual phytoplankton species (with a focus on potentially harmful cyanobacteria) growth and toxicity. This monitoring covered basic water quality variables (temperature, dissolved oxygen, pH, electrical conductivity, nutrients and dissolved organics) as well as cyanobacterial and algal taxa identification and enumeration. Investigators from Mt. View Sanitary District and the University of California, Santa Cruz (UCSC) all redirected efforts to collect samples and carry out assays. Results presented in this report were analyzed by UCSC. No mat-forming bloom was observed during the study period and potentially harmful cyanobacteria represented a small percentage of the total assemblage. Our results suggest that a complex combination of environmental variables and possibly transport may promote the growth and accumulation of potentially harmful algae and cyanobacteria.
Based on our findings for this system, our recommendations are as follow:
• Water quality monitoring to develop site-specific methodology for cyanobacteria control, to assess interannual variability and the efficiency of the management measures and to aid with decision making. We recommend continuation of the existing monitoring of physico-chemical variables (total dissolved organic and inorganic nitrogen, total phosphorus, temperature, pH, specific conductance and salinity, dissolved oxygen). Additionally, we recommend that future monitoring programs collect information on phytoplankton population (potentially toxic and others) and toxin (microcystin). In combination to the baseline information provided by this study, a long time series of phytoplankton population and associated toxins will provide early warning that a potentially harmful algal bloom is under development and would be necessary to put specific contingency plans in action. If such a time series of phytoplankton populations exists, it would help the management determine if the blooming strain is new to the area (eg. transported) or if an endemic strain suddenly became toxic (eg. due to changes in nutrient loading, and/or temperature and turbidity).
• Characterization of water transport and residence time to prevent accumulation of noxious algae and cyanobacteria as well as their associated toxins. A better knowledge of the hydrology of McNabney Marsh would help the management in taking preventive measures to mitigate the occurrence of future harmful algae bloom. Characterizing the current circulation would help identify the “seeding” sources and put specific contingency plans in action to prevent potentially harmful strains and associated toxins from spreading and accumulating in the marshes. Also, increasing the water flow (“flushing”) through the system would reduce the residence time and thus could limit cyanobacteria blooms and accumulation in this system.

Peyton Slough Marsh Complex CyanoHABs – MVSD/Grant# 20130453 2
GLOSSARY • Ammonium: A positively charged form of inorganic nitrogen with the formula NH4
+. A byproduct of animal and microbial metabolism, ammonium can enter a water system through agricultural fertilizers, manures, sewage, runoff or be released from decaying of organic materials in water.
• Anabaena: A genus of filamentous, heterocystous, diazotroph and potentially toxic freshwater cyanobacteria. Note the taxonomy classification has recently been updated and this genus has now been transferred to the genus of Dolichospermum.
• Anatoxin-a: A neurotoxic cyanotoxin produced by several cyanobacteria such as Anabaena. • Aphanizomenon: A genus of filamentous, heterocystous diazotroph and potentially toxic freshwater
cyanobacteria. • CyanoHABs: Harmful Cyanobacteria Blooms. • Cyanobacteria: Aquatic photosynthetic bacteria (previously referred as “blue-green algae”). Some
cyanobacteria can form dense accumulations at the surface of water bodies. • Cyanotoxin: Toxic substances produced by cyanobacteria that may have adverse health or ecosystem
impacts. • Diazotroph: Bacteria that can fix atmospheric nitrogen gas (N2) into a more usable form such as
ammonia. • Eutrophic: A water body with high biological productivity, usually characterized by high dissolved
nutrients levels that support a dense accumulation of algae and cyanobacteria. • Hepatotoxin: a toxic substance that damages the liver. • Heterocystous: A cyanobacterium that produces specialized nitrogen-fixing differentiated cells
(heterocysts), which usually develop in the absence of alternative sources of combined nitrogen. • Hypereutrophic: A water body with high nutrient levels (greater than 0.1 ppm or 10.5 μM
phosphorus) and a corresponding density of phytoplankton (less than 3 foot visibility). • Microcystins: Hepatotoxic cyanotoxins produced by several cyanobacteria such as Microcystis. • Microcystis: A genus of colonial, non-diazotroph and potentially toxic freshwater cyanobacteria. • Nitrate: A negatively charged form of nitrogen with the formula NO3
-. Highly soluble and biologically active form of nitrogen, nitrate is usually found in sewage, and widely applied in fertilizers.
• Oscillatoria: A genus of mostly non-heterocystous and potentially toxic filamentous cyanobacteria. Note: Oscillatoria margaritifera, which has been identified as one of the potentially toxic cyanobacteria in Peyton slough marsh complex, is a marine strain.
• Phormidium: A genus of non-heterocystous and potentially toxic filamentous cyanobacteria broadly distributed in coastal, estuarine and fresh waters.
• Phosphate: A negatively charged form of inorganic phosphorus with the formula PO43-. Naturally
occurring in rocks, it is also a common constituent of agricultural fertilizers, manure, and organic wastes in sewage and industrial effluent. It can enter a water body through soil erosion, surface runoff or be released from sediments
• Planktothrix: A genus of planktonic, non-heterocystous filamentous and potentially toxic freshwater cyanobacteria (usually in freshwater lakes).
• Urea: A nitrogen-containing organic compound with the formula CO(NH2)2. A by-product of animal and microbial metabolism, it is also widely used in agricultural fertilizer. It can enter a water system through surface runoff or be released from lake sediments and water column.

Peyton Slough Marsh Complex CyanoHABs – MVSD/Grant# 20130453 3
TABLE OF CONTENTS

Peyton Slough Marsh Complex CyanoHABs – MVSD/Grant# 20130453 4
INTRODUCTION
BACKGROUND
Mt View Sanitary District (MVSD) Mt. View Sanitary District’s (MVSD) was established in 1923to provide sewage collection and
treatment services for a portion of the City of Martinez and unincorporated areas of Contra Costa County in California (Kyle 2001, MVSD 2014). It is the first wastewater wetland on the West Coast and is also the first wastewater treatment facility in the San Francisco Bay Area to be certified as a Green Business. MVSD currently collects and treats an average of two million gallons of wastewater per day for approximately 25,000 residents. The primary source of wastewater is residential but also includes small businesses. Following advanced secondary treatment, the effluent from MVSD flows into Moorhen Marsh, a series of six interconnected wetland ponds rather than a deep-water outfall as most treated wastewater does (MVSD 2014).
The Peyton Slough Marsh Complex - was originally a tidal marsh/estuarine complex with
brackish water flowing from the Carquinez Strait in the San Francisco Bay. The soil was predominantly saline. Little of this original area is still present (Allan 1996). MVSD marsh complex is currently located in an urban/industrial environment and is bisected by the interstate highway I-680. It includes Moorhen Marsh and McNabney Marsh (formerly known as Shell Marsh). Moorhen Marsh is a 21-acre constructed wetland pond complex located on the west side of I-680. It is owned and managed by MVSD and is the first wetland on the West Coast to use treated wastewater effluent as its primary water source (Kyle 2001, MVSD 2014). Moorhen Marsh flows into McNabney Marsh via Peyton Slough, McNabney Marsh is a 137-acre seasonally tidal restored wetland, which is located east of I-680. McNabney Marsh was heavily impacted by the April 23, 1988 Shell oil spill and has been the focus of restoration efforts (Kyle 2001). Since 1988, McNabney Marsh is co-owned by MVSD and the East Bay Regional Park District and is managed by the MVSD with guidance by the Peyton Slough Wetlands Advisory Committee. All of the treatment plant discharge passes through the wetland ponds and marshes into Peyton Slough, which then discharges into tidal waters of Carquinez Strait through a tide gate which opened in 2009 as part of the wetland restoration plan (MVSD 2014). A series of weirs between each of the wetlands allows for manipulation of water flow and directs the flow through the vegetation (Allan 1996).
MVSD treated effluent provides organic and inorganic nutrients, which support the basic food
chain of the marsh (Doone 2013). Peyton Slough Marsh Complex supports a rich and diverse assemblage of wildlife including 69 species of plants, 123 bird species (including waterfowl), over 20 mammals, and at least 34 species of aquatic invertebrates (Doone 2013, MVSD 2014). At least 15 species of birds use this wetland system for nesting (MVSD 2014).
Algal growth within the wetlands has been beneficial to the MVSD marsh complex. The growth
of algae helps to remove ammonia from wastewater, oxygenates it and acts as a food source for the zooplankton (Allan 1996). Although algal growth has been usually highest in the summer, and such growths can be a problem in eutrophic environments, few problems of blooms of nuisance algae or other odor producers have occurred in the Peyton Slough Marsh Complex (Allan 1996). Until Summer 2012, there were no documented cases of noxious cyanobacteria blooms in the MVSD marsh complex (Allan 1996, M. Roe pers. comm.).

Peyton Slough Marsh Complex CyanoHABs – MVSD/Grant# 20130453 5
Identification of the problem During Summer 2012 (August – October), McNabney Marsh experienced an unprecedented
scum-forming bloom that may have impaired water quality and may threaten the indigenous wildlife. In contrast to McNabney Marsh, no bloom was observed in the adjacent Moorhen Marsh during this time period. Blooms of smaller magnitude were also observed in both McNabney and Moorhen marshes during Winter and Spring 2013. A non-mat forming bloom occurred in McNabney Marsh in January – March 2013. A mat-forming bloom was also observed in Pond B and E of Moorhen Marsh in April-May 2013. Harmful cyanobacteria blooms can affect both water quality (e.g. dissolved oxygen sags, taste and odor problems in drinking water, toxins) and the efficiency of water diversion and treatment operations (clogging filters in water treatment plants, fish screens or channels). Preliminary investigation indicated that McNabney Marsh’s mat-forming bloom was composed of a mixed algal assemblage. Some of the bloom-forming cyanobacteria observed in McNabney Marsh can produce toxins that may reduce the water quality and may impact the supply of clean water for drinking (US EPA 2012). The cyanobacteria community was dominated by filamentous Oscillatoriales, possibly Lyngbya spp., as well as potentially harmful cyanobacterial strains (Anabaena sp., Microcystis sp., Nodularia sp., Phormidium sp.). Preliminary toxicology analyses also indicated moderate levels of the hepatotoxin microcystin (water column: 1ppb, mat: 12ppb), which exceeded the current US EPA recreational water guidance/action level for California water bodies (US EPA 2012, Graham et al. 2009). Compiled literature evidence suggests that cyanotoxins, such as microcystins, are associated with in a plethora of acute, chronic and fatal illnesses in animals and humans, which raised concerns for the indigenous wildlife (Repavich et al. 1990, Carmichael 1995, Graham et al. 2009, Miller et al. 2010, US EPA 2012).
Since 2009, McNabney Marsh’s ecology underwent significant changes, which might have
contributed in changes in the cyanobacteria assemblage composition. The marsh was opened to intermittent water exchange with Suisun Bay via a tide gate on Peyton Slough. The tide gate operated by Solvay (Figure 1). This ecological change resulted in an increase in salinity (i.e. from fresh to brackish) and may have also resulted in other physicochemical changes (e.g. residence time, nutrient loadings and stoichiometry). By contrast, the adjacent Moorhen Marsh has remained unaltered. The exceptionally dense bloom observed in McNabney Marsh both Summer 2012 and Winter 2013 coincided with an increase of the water exchange between the McNabney Marsh and Suisun Bay as the tide gate was opened more frequently and over a longer period of time as compared to previous year’s operations since 2009.
Current understanding of harmful cyanobacteria blooms indicates that bloom formation,
dynamics, and toxicity are usually complex. Indeed, compiled evidence from the literature suggests that the ability to mitigate cyanoHABs in systems such as McNabney Marsh relies on more than one environmental variable (e.g. Paerl et al. 2011). Beside increased salinity, very little information is currently available with regard to physico-chemical changes that may have triggered the 2012 and 2013 blooms. Indeed, water quality monitoring (nitrogen measurements) was halted prior to the bloom occurrence in 2011 and phosphorus has never been monitored in the marsh prior to 2012. No comprehensive studies had characterized the algal assemblage. As such, this study aimed to provide a baseline characterizing the algal assemblage in the Peyton Slough Marsh Complex as well as to determine the influence of some environmental variables (e.g. nitrogen and phosphorus chemistry and stoichiometry, water temperature) that can trigger cyanobacteria growth.

Peyton Slough Marsh Complex CyanoHABs – MVSD/Grant# 20130453 6
STUDY GOALS & OBJECTIVES
The main goal of this project was to provide a baseline for future comparison as well as to determine the environmental conditions leading to potentially harmful cyanobacterial blooms and toxicity in McNabney and Moorhen marshes.
The objectives of this monitoring program were to:
Objective 1. Establish a baseline for future comparison, to aid in identifying the parameters that are conductive to potentially harmful cyanobacteria blooms (cyanoHABs), to allow forecasting and managing cyanoHABs in McNabney and Moorhen marshes.
Objective 2. Provide a better understanding of the mechanisms underlying the source, occurrence and toxicity levels of potentially harmful cyanobacteria in McNabney and Moorhen marshes.
Objective 3. Determine how ongoing changes (e.g. different water management regimes, changes in salinity and nutrient loading) are affecting the algal assemblage in McNabney and Moorhen marshes.
Objective 4: Serve as a source of information to environmental managers to enhance existing resource management and to guide new decision support systems in order to improve management effectiveness and to mitigate the risks associated with harmful cyanobacteria blooms.
Questions to be addressed by the proposed research: 1. How changes in nutrient and water quality into McNabney and Moorhen marshes due to
increased tidal exchange are affecting the cyanobacterial community composition and toxicity? 2. What roles do key physicochemical variables (nutrients, salinity, dissolved organics, temperature)
play in determining the structure, abundance and toxicity of the cyanobacterial assemblage? 3. How will predicted changes (e.g. water management plan changes) affect the cyanobacteria
assemblage in the future? SERVICE PERFORMED
We conducted - monthly monitoring from May 30, 2013 to December 18, 2013 to determine if the spatial and temporal distribution of potentially harmful algae and cyanobacteria (cell abundance, chlorophyll a concentration) and associated toxins (microcystins and domoic acid concentrations) varied with environmental conditions in MVSD marsh complex. The sampling time period was selected to cover seasonal variations (pre-bloom, bloom, and post-bloom conditions).
Field conditions and samples were collected monthly at four stations (figure 1): the East Channel tide gate (EC), in McNabney Marsh (McB & McC), and Moorhen Marsh (A2).
Algal and cyanobacterial composition & abundance were monitored monthly at these stations. Monthly discrete surface water (“grab”) samples were analyzed using traditional (microscopic identification and enumeration) & molecular methods.
Dissolved cyanotoxins (microcystins) and domoic acid toxin were monitored at these stations. Because toxin concentrations vary greatly on a spatiotemporal scale (e.g. due to wind mixing or tidal mixing), we used Solid Phase Adsorption Toxin Tracking (SPATT) devices (Kudela 2011). Such devices allow integrating the temporal fluctuations by concentrating the toxins over time (by opposition to discrete sampling technique) as well as determining the transport and persistence of toxins away from their sources.

Peyton Slough Marsh Complex CyanoHABs – MVSD/Grant# 20130453 7
PROJECT PARTNERS The completed project was a partnership between the -MVSD and UCSC. Investigators from the
MVSD, and UCSC all directed efforts to gather samples, carry out analyses, and/or interpret results in agreement with our scope of work. Additionally, California State University, Monterey Bay (CSUMB) students and advisor provided assistance with data analysis (statistics analysis and Geographic Information Systems mapping) as part of an Undergraduate Research Opportunities Center internship project.
METHODS
DATA QUALITY ASSURANCE AND QUALITY CONTROL
The MVSD field officers and UCSC project team collected and analyzed monitoring data from May 30, 2013 to December 18, 2013 in order to gain a better understanding of temporal changes in cyanobacteria assemblage composition and relative abundance of each taxa in McNabney and Moorhen marshes.
All field work and laboratory analyses were carried out according to our Standard Operating Procedures (SOPs) or according to manufacturer’s instructions. The SOPs insured consistency and production of accurate and precise water quality analyses from the field and laboratory in support of the project objectives. The data presented in this report were handled and evaluated following our Quality Assurance (QA)/Quality Control (QC) requirements as outlined in our SOPs. Quality control procedures for each laboratory analysis included calibration of instruments with certified standards. Quality control standards were run in parallel to the environmental samples, and depending on the analysis, could include all or some of the following: calibration check standards, laboratory control samples, sampling and analytical duplicates, matrix spikes, field/travel blanks and analytical blanks.
Field measurements were recorded by MVSD field officers in field sheets (appendix 1). Data produced by analysts were recorded in a laboratory notebook and electronically. Electronic spreadsheets were used for entering field and laboratory data and computing results for the environmental samples and standards. Data quality was completed to confirm that all the standards and quality control samples met the QA/QC requirements. Computations were verified and corrected when required.
SAMPLING COLLECTION AND FIELD MEASUREMENTS Field sampling was conducted by MVSD field officers (Kelly Davidson Chou and Lilia Corona)
at four discrete stations as described in our Monitoring Plan. Sample collection consisted of collecting surface (“grab”) water samples, deployment and collection of SPATTs, measuring water quality variables with a sonde (YSI), and recording field conditions at the four sampling sites.
Field equipment, instruments, and sampling materials were cleaned and stored prior to the field trip according to standard procedures. Sample collection was carried out according to our field SOPs. Field equipment was calibrated by field officers prior to sampling and field blanks were collected parallel to the environmental samples for each field trip. Field data and additional relevant observations (e.g. odor, bloom conditions) were recorded into the field sheet the day of sampling (appendix 1). Field pictures were taken for all stations and sampling events in support of our field observations and saved electronically on the P.I. computer. Bottles and sample storage containers were labeled at the time of collection with the appropriate sample site name or code and sampling date according to our field SOPs. All samples were filtered (nutrients, chlorophyll a, DOC, molecular samples) and preserved (taxonomy/microscopy) in the field, at the sampling site immediately after collection. When filtration was required (e.g. molecular samples, and Chlorophyll a), the volume of filtered water was recorded on the appropriate field sheet at the time of collection. SPATTs, nutrients, chlorophyll a, dissolved organic carbon (DOC) and water samples for molecular (DNA) analysis as well as associated field blanks were stored on dry ice and in the dark upon collection and shipped overnight in this condition (dry ice/dark) to

Peyton Slough Marsh Complex CyanoHABs – MVSD/Grant# 20130453 8
UCSC for analysis. These samples were stored in a laboratory freezer (-20°C or -80oC for the DNA samples) until processing. Samples for algal taxonomy and cell enumeration (microscopy) were stored in an ice cooler and in the dark and shipped overnight to UCSC. They were stored in a cold room at UCSC and shipped to Greenwater Lab Inc. for processing. An inventory of the samples collected and analyzed is presented in Table 1.
SAMPLE ANALYSIS
Analytical chemistry Dissolved inorganic nutrient concentrations, including Ammonium (NH4
+), nitrate+nitrite (NOx), and phosphate (PO4
3-) were analyzed on a Flow Injection Autoanalyzer (Lachat Instrument) using EPA methods 350.1, 353.2, and 365.1, respectively. The QCs and standards were prepared using Hach® certified reference materials (nitrate: Hach® #307-49, nitrite: UCSC reference materials, ammonia: Hach® 153-49, Phosphorus: Hach® 14204-16, and wastewater effluent certified reference material: Hach® #28332-49).
Urea samples were analyzed following the methods of Mulvenna and Savidge (1992), using a Cary 50 spectrophotometer and a 10-cm flow cell. Urea standards were prepared using pure urea from Sigma Aldrich (U5378).
Dissolved organic carbon (DOC) and Dissolved organic nitrogen (DON) samples were processed and analyzed using a Shimadzu TOC analyzer as described in Mioni et al. (2012). A certified QA/QC reference material (SPEX) was included for all DOC analytical run.
Chlorophyll a (chla) was extracted and analyzed using the non-acidification method (Welschmeyer 1994). QC standards were prepared using a certified reference material.
Microscopic enumeration and taxonomy
Samples were sent to an independent lab (Greenwater Lab Inc.) and analyzed by a professional taxonomist (Andrew Chapman) using an inverted microscope. The reports from Greenwater Lab Inc. are enclosed in appendix 2.
Molecular analysis for species identification
Samples for molecular analysis were collected onto Sterivex® (Millipore, Billerica, MA) filters, and stored at -80°C prior to processing. DNA was extracted from a subset of these samples using a Qiagen DNeasy Plant kit (Valencia, CA) modified to include the additional cell lysis steps of three freeze/thaw cycles, agitation using a bead beater, and proteinase K digestion (Moisander et al., 2008). DNA extracts were screened for quality and concentration using a Nanodrop (Thermo Scientific, Waltham, MA). Partial 16S rRNA gene fragments (ca. 420 base pairs) from Cyanobacteria and plastids were polymerase chain reaction (PCR) amplified using primers described in Nubel et al. (1997). Triplicate PCR reactions were carried out in 25 μL volumes with 1X Platinum® Taq PCR buffer (Invitrogen, Carlsbad, CA), 1.5 mM MgCl2, 400 μm dNTP mix, 1.25 μm of each forward and reverse primers, 3 U Platinum® Taq polymerase (Invitrogen), and 2 μL of DNA extract. Thermocycling parameters were as follows: the initial denaturation step at 94oC for 5 min was followed by 30 cycles of 94oC for 1 min, 60oC for 1 min, and 72oC for 1 min and a final elongation step at 72oC for 10 min. PCR amplicons were cleaned using the QiaQuick Gel Extraction Kit (Qiagen), cloned using the TOPO® TA vector system (Invitrogen), and recombinant plasmids were purified using the Montage Plasmid Miniprep96 Kit (Millipore), according to the manufacturer’s guidelines for each kit. Sanger sequencing of partial 16S rRNA gene amplicons was carried out at the UC Berkeley DNA Sequencing Center.
Raw sequences were processed using Sequencher 5.1 (Gene Codes Corporation, Ann Arbor, MI). Trimmed sequences were aligned and the nearest neighbors determined using the SILVA Incremental Aligner 1.2.11 (http://www.arb-silva.de/; Quast et al., 2013). Phylogenetic analyses were conducted in ARB (Ludwig et al., 2004).

Peyton Slough Marsh Complex CyanoHABs – MVSD/Grant# 20130453 9
Toxicology analysis (SPATT) SPATT devices for continuous monitoring of cyanotoxins (microcystin LR, RR, YR, and LA)
were prepared and processed following the method of Kudela (2011). Domoic acid toxin was also extracted and monitored using Kudela’s lab analytical standard protocols.
DATA ANALYSIS Geographic Information Systems (GIS) mapping
ArcGIS software was used to map the stations as well as temporal variations in the abundance of the two dominant potentially toxic cyanobacteria taxa (Oscillatoria Margaritifera and Phormidium sp.). Statistics
To identify relationship between abiotic environmental variables and biological variables (chlorophyll a, taxa abundance) correlation analysis were conducted using R statistical software. Shapiro test was ran to test for normality of each correlation. Data were log transformed (Log10 (X) or Log10(X+k)) if necessary to meet parametric assumptions (normal distribution and linearity). Pearson correlation was used if parametric assumptions were met. Spearman correlations were used if parametric assumptions were not met (not normally distributed) even after log transformation. Two levels of significance were set for all tests: (1) probabilities of p < 0.05 were considered significant, (2) probabilities of p < 0.01 were considered very significant. RESULTS & DISCUSSION
ENVIRONMENTAL CONDITIONS Abiotic environmental variables Water temperature was not significantly different among stations and marshes although
McNabney Marsh stations exhibited the widest temporal variations (table 2, figure 2). Expectantly, electrical conductivity (ionic strength) at Moorhen Marsh station was significantly lower than that of the other stations (Table 2, Figure 2). The electrical conductivity was not significantly different among stations McB, McC and EC, although McC exhibited the widest temporal variations. Dissolved oxygen and pH varied spatiotemporally over the course of the study (table 2, figure 2). Moorhen station (A2) generally exhibited the highest pH and dissolved oxygen levels than McNabney’s stations during the warmest months of the study period (from June to September 2013). McNabney McC station exhibited the highest pH and dissolved oxygen levels compared to - the other stations when water temperatures dropped (from October to November 2013). Higher pH and dissolved oxygen (DO) levels typically occur when algae and aquatic vegetation use CO2 for photosynthesis. This overall increase of DO in the wastewater effluent is therefore most likely due primarily to algae, which typically reaches the peak of production during the summer months (Allan 1996). Higher pH and DO may also reflect transport or natural temporal variations. For example, seawater and alkaline soils typically have a higher pH than freshwater. Well mixed and faster flowing water masses typically exhibit higher DO levels while the lowest DO typically occurs in the winters in early morning (Allan 1996). Lower pH are usually observed when aquatic vegetation respire, or when bacterial decay of organic matter occurs in the water. Thus, the observed spatiotemporal variations in pH and dissolved oxygen levels may reflect spatiotemporal changes in the algal assemblage growth patterns and/or intrusion (transport) of water masses with different physicochemical signatures.
Assessing transport and residence time was not part of the scope of this study but could help
provide clues with regard to the sources, accumulation and dispersions of potentially harmful
Peyton Slough Marsh Complex CyanoHABs – MVSD/Grant# 20130453 10
cyanobacteria. Compiled literature evidence suggests that noxious cyanobacteria blooms are favored by high residence time (i.e. low flushing time) and high temperatures and low specific conductance (e.g. Paerl, 2008, WHO 1999). No comprehensive hydrological models were available to us at the time of the study. Although we do not have substantial information with regard to the hydrology of McNabney Marsh, previous reports suggest that Moorhen Marsh retention time varies between 4.8 days (Allan 1996) and 7.6 days (including 2.8 days for A2 pond, Shreiber and Mitch 2006). Such residence time could be favorable for noxious algae growth, including potentially harmful cyanobacteria. At 20 °C and light saturation, most common planktonic cyanobacteria achieve growth rates of 0.3-1.4 doublings per day, while diatoms reach 0.8-1.9 doublings per day and growth rates of up to 1.3-2.3 doublings per day have been observed for single-celled green algae (WHO 1999).
Chemical environmental variables (dissolved inorganic nutrients and dissolved organics) Phosphorus concentrations (measured as phosphate) decreases as water flows through the marsh
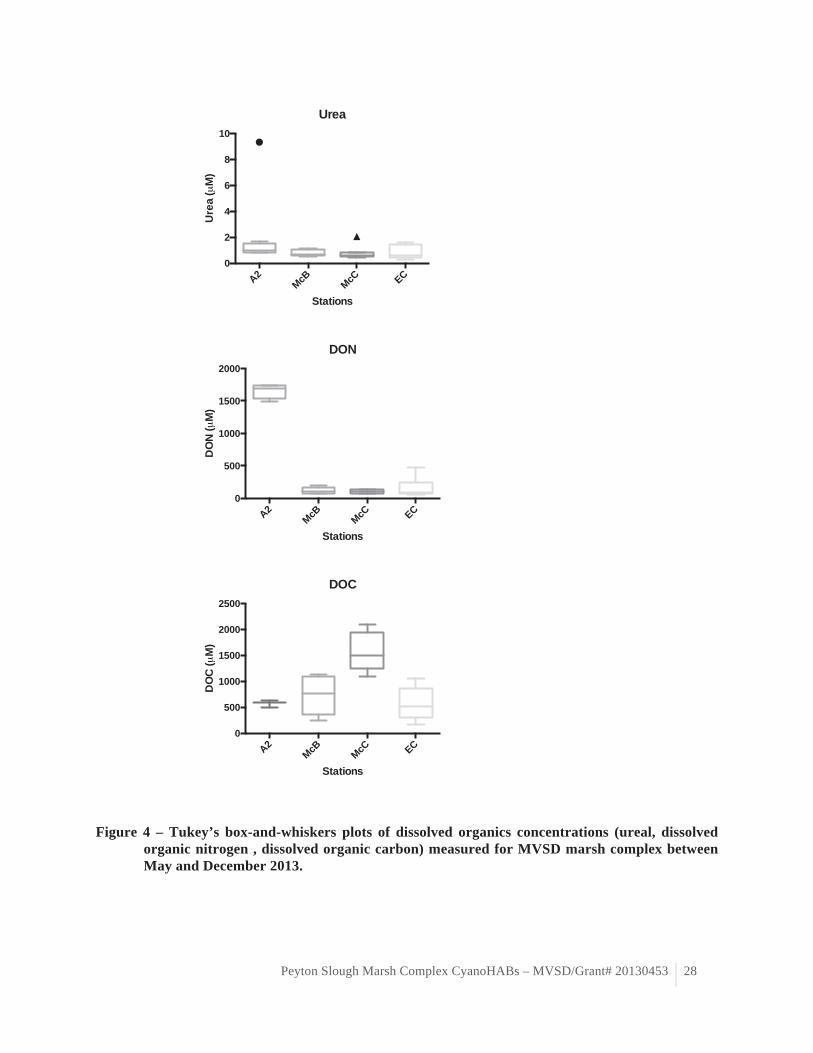
complex (Table 3, Figure 3), probably accumulating in the sediment and plants as previously observed (Allan 1996). Phosphate concentrations were significantly higher in Moorhen Marsh (A2 station). Nitrogen concentrations measured as nitrate and dissolved organic nitrogen significantly decrease as water flows through the wetlands system from Moorhen Marsh to McNabney Marsh (Table 3, Figures 3 & 4). This observation is in agreement with previous observation for MVSD marsh complex (Allan 1996). However, reduced nitrogen concentrations, measured as ammonium and urea, seem to indicate that nitrogen sources other than MVSD treated effluent. Indeed, we observed elevated ammonium concentration at station A2 in October and November 2013 (table 3) although ammonium is removed from wastewater by nitrification prior to discharge into Moorhen Marsh (L. Corona, pers. com.). Assuming that the water quality of the wastewater effluent did not change during that time period, it could indicate ammonium loading from internal (e.g. organic matter decay, nitrogen fixation) and/or external (e.g. run off, transport of different water masses) sources. Ammonium and urea concentrations also varied spatio-temporally at McNabney stations, with the greatest variations observed at McB and the tide gate stations (table 3, figure 4). This spatio-temporal variation could also indicate internal loading and/or external loading. Overall, McNabney station McC consistently exhibited the lowest nitrogen levels. Dissolved silica varied widely spatiotemporally, with the greatest variations observed in McNabney Marsh (table 3, figure 3). Spatio-temporal variation in dissolved silica may reflect transport of different water masses and/or regeneration at the sediment level from decaying plants (Struyf et al. 2005). Dissolved organic carbon varied spatiotemporally, with the greatest temporal variations observed in McNabney Marsh (table 3, figure 4). The highest DOC concentrations were observed at station McC, which may be attributable to decomposition from organic matter (e.g. algae and plants).
PHYTOPLANKTON ABUNDANCE AND COMPOSITION
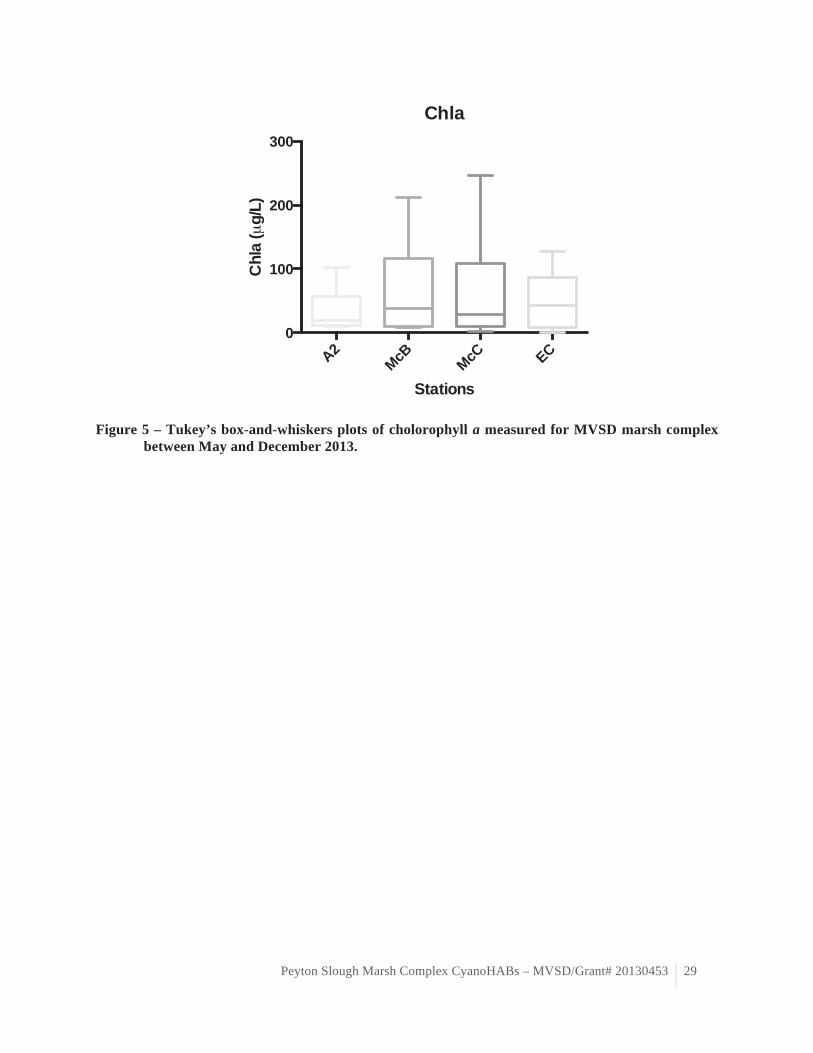
Phytoplankton biomass spatial and temporal variations (in term of chla) Chlorophyll a concentrations and total cell density varied greatly spatiotemporally and were
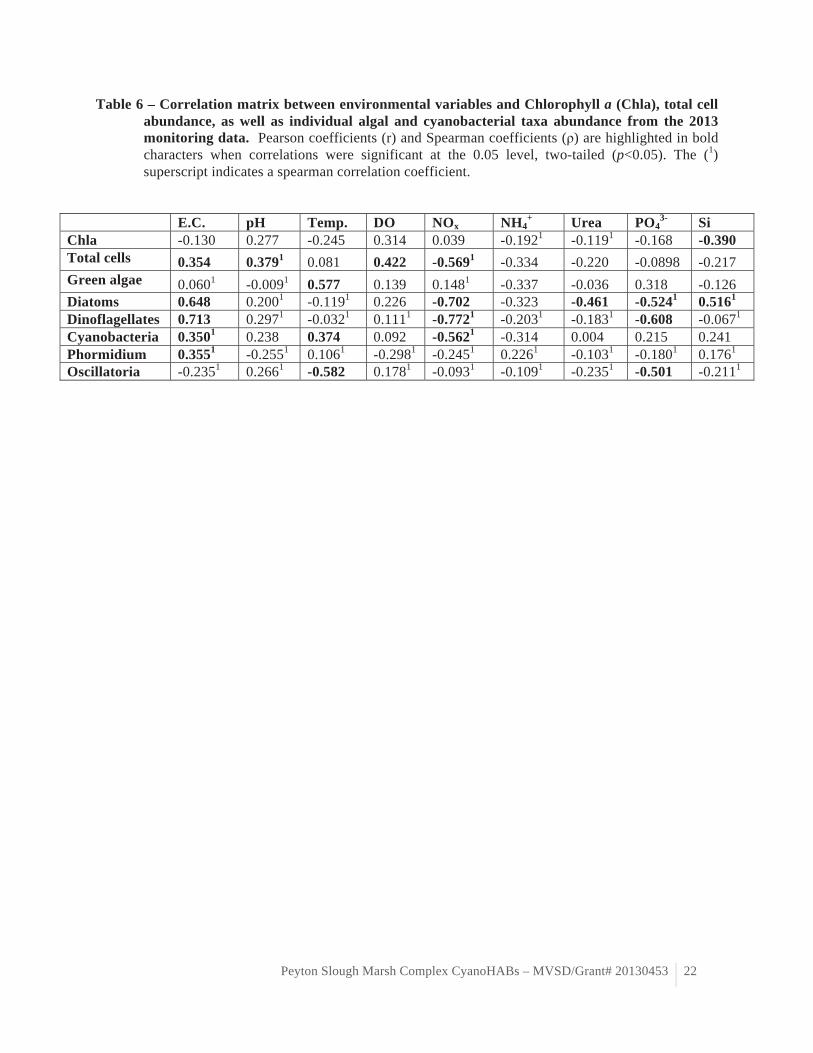
overall greater in McNabney Marsh (table 4, figure 5). Surprisingly, the greatest chlorophyll a concentrations were observed in McNabney Marsh (station McC) in December rather than during the warmest months. No mat-forming bloom was observed over the course of this study. Although the biomass reached chlorophyll a concentrations typical of eutrophic systems, no bloom comparable to that of Summer 2012 was observed in 2013. No significant correlation was observed between chla and the monitored environmental variables, except for a negative correlation with dissolved silica (r=-0.39, p=0.027, table 6). This lack of correlation may indicate that other environmental variables not considered in this study may control phytoplankton growth and biomass accumulation in the MVSD marsh complex (e.g. transport) or natural spatiotemporal succession. It is also possible that the chlorophyll a concentrations are the best proxy to assess surface phytoplankton biomass spatiotemporal variation in
Peyton Slough Marsh Complex CyanoHABs – MVSD/Grant# 20130453 11
such shallow wetland system (e.g. chlorophyll a from plants may alter the results), as illustrated by the lack of correlation between chlorophyll a concentrations and total cell densities.
Phytoplankton assemblage composition spatial and temporal variations
Total phytoplankton cell density varied spatiotemporarily and was generally greater in McNabney Marsh (table 4). Total phytoplankton cell density increased significantly with electrical conductivity (r = 0.354, p=0.047), pH (ρ=0.379, p=0.032), dissolved oxygen (r=0.422, p=0.016). Total phytoplankton cell density also strongly negatively correlated with dissolved nitrate+nitrite (ρ=-0.569, p<0.001, table 6). The positive correlation with electrical conductivity and negative correlation with nitrate+nitrite suggest that transport may explain the spatiotemporal variation of phytoplankton abundance in McNabney and Moorhen marshes. It further suggests that phytoplankton may be seeded from adjacent, more saline water bodies.
The phytoplankton community in McNabney and Moorhen marshes was characterized by a
mixed assemblage of green algae (chlorophyta), diatoms (bacillariophyta), cyanobacteria and dinoflagellates (table 4). Although both marshes were characterized by a mixed assemblage of the aforementioned taxa, Moorhen Marsh was generally dominated by green algae while McNabney Marsh was generally dominated by diatoms and cyanobacteria (table 4). Green algae cell density was strongly positively correlated to the water temperature (r=0.577, p=0.001, table 6). This result suggests that green algae growth and accumulation are primarily controlled by water temperature. We observed a positive correlation between electrical conductivity and the abundance of diatoms (r=0.648, p<0.001), dinoflagellates (r=0.713, p=0.000), and cyanobacteria (ρ=0.350, p=0.050). We also observed a negative correlation between nitrate+nitrite concentrations and diatoms (r=-0.702, p<0.001), dinoflagellates (ρ=-0.772, p=0.000), and cyanobacteria (ρ=-0.562, p=0.001, table 6). This result appears to indicate that these phytoplankton taxa are favored in (or may be transported by) more saline, less nitrogen rich waters. Additionally, cyanobacteria abundance was positively correlated to water temperature (r=0.374, p=0.035, table 6). Diatom cell density correlated negatively correlated with urea (r=0.461, p=0.008) and phosphate concentrations (ρ=-0.524, p=0.002) concentrations (table 6). Diatom abundance also correlated positively with dissolved silica (r=0.516, p=0.003). Dinoflagellates abundance correlated negatively with phosphate concentrations (r=-0.608, p=0.000, table 6).This results may indicate differential growth requirements between taxa or may indicate that these taxa were seeded into MVSD marshes from different sources with different water mass signatures.
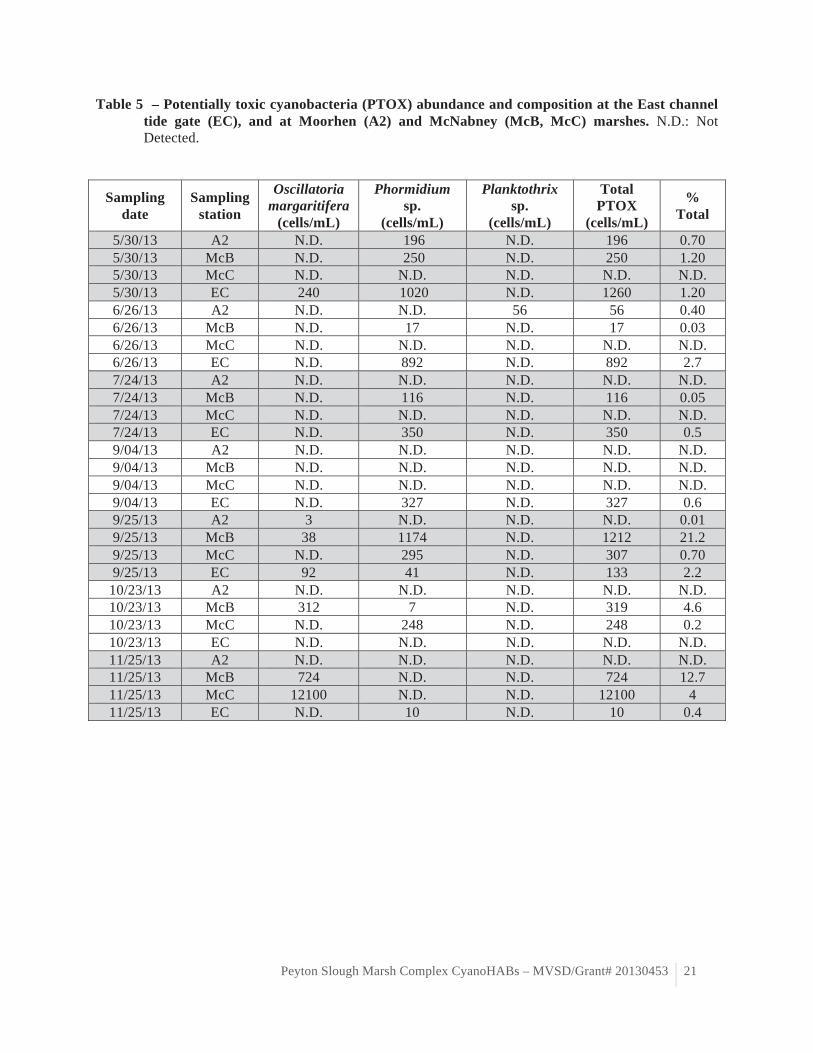
The cyanobacteria assemblage was dominated by non-harmful strains. The potentially toxic
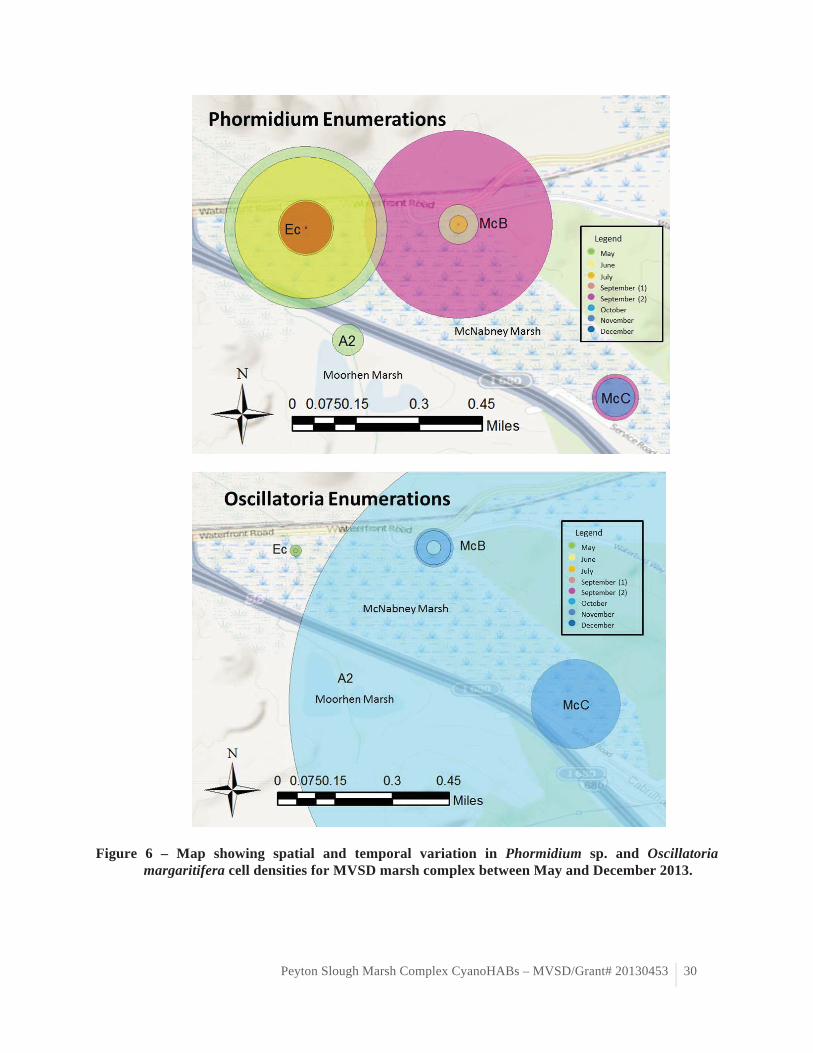
cyanobacteria strains observed during our 2013 study was not as diverse nor as abundant as that observed in the samples collected in McNabney Marsh during the bloom of summer 2012. Only three potentially toxic cyanobacteria strains were observed over the course of this study: Phormidium sp., Oscillatoria margaritifera and Planktothrix sp. (table 5, figure 6). Planktothrix sp. was only observed at Moorhen Marsh station A2 in June 2013. Planktothrix is a freshwater cyanobacteria genus that can produce liver toxins such as microcystins (Castle and Rogers 2009). Phormidium sp. and O. margaritifera were more consistently observed across McNabney Marsh stations and time points throughout the study period. Phormidium sp. is a ubiquitous cyanobacteria genus, which can produce liver toxins such as microcystins (Castle and Rogers 2009). Oscillatoria margaritifera is a historically common marine cyanobacteria species in San Francisco Bay salt marshes (Setchell and Holman 1919) that can produce cytotoxins although these toxins appear to specifically target cancer cells (Mevers et al. 2011). Phormidium sp. predominated during the warmer summer months at station McB while the greatest O. margaritifera abundance was observed during the cooler months of fall at station McC (table 5, figure 6). Phormidium sp. abundance was significantly positively correlated with electrical conductivity (ρ=0.355, p=0.046), which may indicate transport from more saline adjacent systems (table 6). Oscillatoria margaritifera

Peyton Slough Marsh Complex CyanoHABs – MVSD/Grant# 20130453 12
abundance was negatively correlated with temperature (r=-0.582, p=0.001) and phosphate concentrations (r=-0.501, p=0.004, table 6).
Molecular analysis
Molecular analyses were conducted on a subset of the total samples collected, with the goal being to verify the identity of the dominant potentially toxic (PTOX) strains present. The following sampling sites were selected that either had the highest PTOX abundances, or contained an unknown PTOX species: A2 on 6/23/13, EC on 5/31/13 and 6/23/13, McB on 9/25/13 and 10/23/13, and McC on 9/25/13 and 11/25/13. A majority of the sequences recovered from these samples were chloroplast 16S rRNA genes from a variety of eukaryotic phytoplankton groups including Chaetoceros spp. (diatom), Thalassiosira spp. (diatom), Durinskia baltica (dinoflagellate), and Nitzschia frustulum (diatom). The only cyanobacterial groups recovered from these samples were closely related to Synechococcus strains isolated from both marine and brackish environments, none of which are known to definitely produce toxins. Thus the molecular analyses (clone library) confirm that the PTOX strains did not dominate the phytoplankton assemblage (and more precisely cyanobacterial assemblage) during the study period. This result is in agreement with the microscopic observations (table 5).
CYANOTOXINS SPATT were deployed ~monthly for 7 months (June-December 2013). The majority of samples
were below the limit of detection, but on a station/date basis, only 7 of 27 SPATT samplers were below detection for all toxins. This highlights the ubiquitous, but inconsistent, presence of multiple toxins. MCY-RR and DA were the most commonly detected toxins, while MCY-YR was never detected. By station, A2 was always positive for toxins, and also exhibited some of the highest levels of toxins. The other stations were more sporadic and at lower levels, except McNabney Marsh site McB, which exhibited high levels of MCY-LR in late summer. SPATT are not currently used within a regulatory framework, and there are no recommended toxin concentrations corresponding to action levels provided for grab samples (e.g. 0.8 ppb for microcystins). However, SPATT have been compared to long-term grab sample datasets for Pinto Lake, California, and the Santa Cruz Municipal Wharf. Based on that analysis, recommended levels were identified as 50-200 ng/g for total microcystins, and >150 ng/g for DA (Kudela et al. 2013). Microcystins were consistently below that level, with a maximum value of 36.09 ng/g (McB, 24-July-2013). DA was also well below this suggested level, with a maximum value of 50.06 ng/g (A2, 25-November-2013). For comparison, SPATT deployed on USGS cruises within San Francisco Bay detected a mean MCY concentration of 1.84 ng/g and a maximum value of 25.47 ng/g, while for DA the mean and maximum of 97.76 and 1650 ng/g (n=118, November 2011 to March 2014). It is assumed that DA is primarily of marine origin while MCY is primarily of freshwater or brackish origin. The results for this analysis are consistent with that view—while DA is detectable within the marsh complex, the maximum value is less than the mean concentration in San Francisco Bay, while for MCY, the maximum concentration within the marsh is greater than the maximum in San Francisco Bay. This strongly suggests that DA is being imported to the marsh from the more oceanic Bay waters, while the MCY is likely originating within or upstream of the marsh ecosystem.
Peyton Slough Marsh Complex CyanoHABs – MVSD/Grant# 20130453 13
RECOMMENDED ACTIONS One of the goals of this project was to identify management strategies to mitigate cyanoHABs in
MVSD marsh complex. Taken together, our results provide a baseline for future studies and illustrate the complexity of the cyanobacteria dynamic and bloom formation in a system where many environmental variables vary simultaneously. Our results further suggest that a combination of environmental drivers (rather than one single driver) simultaneously control the growth of individual bloom-forming cyanobacteria taxa as well as the broad spatial and temporal (interannual and seasonal) variations. Our results nevertheless seem to validate our assumption that environmental conditions such as water temperature and nutrients may directly (e.g. physiological effect) or indirectly (e.g. transport) promote the growth and/or accumulation of cyanobacteria in MVSD marshes. As such, further studies should investigate the role of transport in the initiation and maturation of cyanoHABs in MVSD marshes. We also recommend continuation of monitoring of key environmental variables (nitrogen, phosphate, temperature, electrical conductivity, DO), which may provide crucial information if another mat-forming bloom occurs in MVSD marsh complex. In addition to the environmental variables currently monitored by on-going MVSD monitoring program, we would also recommend monitoring of phytoplankton composition (potentially toxic and others) as well as toxin (microcystin), especially during periods of higher risk of cyanoHAB (Spring, Summer, Fall). Various methods are available to monitor algal and cyanobacterial toxins (EPA 2014). Analytical cost and turn over time can be reduced by using commercially available kits such as the Abraxis Microcystin Test Strip (PN 520022) or the Envirologix Quanlitube Kit for Microcystins (PN ET 022). Positive results should be however confirmed by a laboratory using more precise and accurate analytical method (e.g. HPLC). For consistency and comparison, samples for phytoplankton composition and enumeration analysis may be sent to Andrew Chapman (Greenwater Lab Inc.), the taxonomist who completed these analysis for this study.

Peyton Slough Marsh Complex CyanoHABs – MVSD/Grant# 20130453 14
REFERENCES Allan J.M. 1996. Wetlands Creation using Secondary Treated Wastewater. Reclamation and Reclamation
Review 1(4). Available from: http://purl.umn.edu/58695
Castle, J.W., and J.H. Rogers. 2009. Hypothesis for the role of toxin-producing algae in Phanerozoic mass extinctions based on evidence from the geologic record and modern environments. Environmental Geosciences, 16(1): 1 – 23.
Carmichael, W. W. 1995. Toxic Microcystis in the environment. In: Watanabe, M. F., K. Harada, W. W. Carmichael & H. Fujiki (eds), Toxic Microcystis. CRC Press: New York, 1–12.
Doone, D. 2013. Seasonal Prey of the North American river otter, Lontra canadensis, at Delta sites. CSU East Bay electronic thesis (2013-12-11). Available from: http://hdl.handle.net/10211.3/98348
Environmental Protection Agency [Internet]. 2014. [EPA] United States Environmental Protection Agency: Cyanobacterial Harmful Algal Blooms (CyanoHABs). [Cited 2014 June 16]. Available from: http://www2.epa.gov/nutrient-policy-data/cyanobacterial-harmful-algal-blooms-cyanohabs
Graham, J.L., Loftin, K.A., and N. Kamman. 2009. Monitoring Recreational Freshwaters. Lakeline, 18 – 24.
Kudela, R.M. 2011. Characterization and Deployment of Solid Phase Adsorption Toxin Tracking (SPATT) resin for monitoring of microcystins in fresh and salt water. Harmful Algae, 11: 117-125, doi: 10.1016/j.hal.2011.08.006
Kyle, A. 2001. Shell oil spill litigation settlement trustee committee, 1990-2001: Final report. San Francisco: San Francisco Bay Conservation and Development Commission. Available from: http://nrm.dfg.ca.gov/FileHandler.ashx?DocumentID=17366
Ludwig, W., et al. 2004. "ARB: a software environment for sequence data". Nucleic acids research 32(4), 1363 1371.
Mevers, E., W.-T. Liu, N. Engene, H. Mohimami, T. Byrum, P.A. Pevzner, P.C. Dorrestein, C. Spadafora, W.G. Gerwick. 2011. Cytotoxic veraguamides, alkynyl bromide-containing cyclicdepsipeptides from the marine cyanobacterium cf. Oscillatoria margaritifera. J. Nat. Prod. 74(5), 928–936.
Miller, M.A., Kudela, R.M., Mekebri, A. and collaborators. 2010. Evidence for a novel marine harmful algal bloom: cyanotoxins (microcystin) transfer from land to sea otters. PLoS ONE 5(9): e12576.
Mioni, C.E., Kudela R.M., and D.V. Baxa. 2012. Harmful cyanobacteria blooms and their toxins in Clear Lake and the Delta (Caliornia). Final Report, Project #: 10-058-150. Surface Water Ambient Monitoring Program (SWAMP), prepared for the Central Valley Quality Control Board.
Moisander, P.H., et al. 2008. "Diversity and abundance of diazotrophic microorganisms in the South China Sea during intermonsoon." The ISME journal 2(9), 954 967.
Mt. View Sanitary District [Internet]. 2014. [MVSD] Mt. View Sanitary District [cited 2014 May 15]. Available from: http://www.mvsd.org/
Mulvenna, P.F., and G. Savidge. 1992. A modified manual method for the determination of urea in seawater using diacetylmonoxime reagent. Estuarine, Coastal and Shelf Science, 34: 429-438.
Nübel, U., F. Garcia-Pichel, and G. Muyzer. 1997. "PCR primers to amplify 16S rRNA genes from cyanobacteria." Applied and Environmental Microbiology 63(8), 3327 3332.
Paerl, H.W. 2008. Nutrients and other environmental controls of harmful cyanobacteria blooms along the freshwater-marine continuum. Adv. Exp. Med. Biol. 619, 217-237.

Peyton Slough Marsh Complex CyanoHABs – MVSD/Grant# 20130453 15
Paerl, H.W., Xu, H., McCarthy, M.J., Zhu, G., Qin, B., Li, Y., Gardner, W.S. 2011. Controlling harmful cyanobacterial blooms in a hyper-eutrophic lake (lake Taihu, China): The need for a dual nutrient (N & P) management strategy. Water Research 45, 1973–1983.
Quast, C., et al. 2013. "The SILVA ribosomal RNA gene database project: improved data processing and web-based tools." Nucleic acids research 41(D1), D590-D596.
Repavich, W.M., Sonzogni, W.C., Standridge, J.H., Wedepohla, R.E., and L.F. Meisner. 1990. Cyanobacteria (blue-green algae) in Wisconsin waters: acute and chronic toxicity. Water Research 24, 225–231.
Schreiber, I.M. and W.A. Mitch. 2006. Occurrence and Fate of Nitrosamines and Nitrosamine Precursors in Wastewater-Impacted Surface Waters Using Boron As a Conservative Tracer. Environ. Sci. Technol. 40(10), 3203-3210.
Setchell, W.A. and R.M. Homan [Eds.]. 1919. University of California Publication in Botany. The Marine algae of the Pacific Coast of North America. Volume VIII, part I: Myxophyceae. University of California Press, Berkeley CA.
Struyf, E., Van Damme, S.V., Gribsholt, B., and P. Meire. 2005. Freshwater marshes as dissolved silica recyclers in an estuarine environment (Schelde estuary, Belgium). Hydrobiologia 540, 69–77.
US EPA [Internet]. 2012. Cyanobacterial Harmful Algal Blooms (CyanoHABs). Available from: http://water.epa.gov/scitech/swguidance/standards/criteria/nutrients/cyanohabs.cfm
Welschmeyer, N.A. 1994. Fluorometric analysis of chlorophyll a in the presence of chlorophyll b and pheopigments. Limnol. Oceanogr., 39(8), 1985–1992.
WHO. 1999. Chapter 2: Cyanobacteria in the environment. In: Toxic Cyanobacteria in water: a guide to their public health consequences, monitoring and management. Routledge: London and New York. ISBN 0-419-23930-8

Peyton Slough Marsh Complex CyanoHABs – MVSD/Grant# 20130453 16
LIST OF TABLES - Table 1 – UCSC Sample Inventory. Table 2 – Hydrographic conditions at the East channel tide gate (EC), and at Moorhen (A2) and
McNabney (McB, McC) marshes. Table 3 – Chemical conditions at the East channel tide gate (EC), and at Moorhen (A2) and
McNabney (McB, McC) marshes. Table 4 – Phytoplankton assemblage composition and algal biomass (in term of chlorophyll a, chla)
at the East channel tide gate (EC), and at Moorhen (A2) and McNabney (McB, McC) marshes.
Table 5 – Potentially toxic cyanobacteria (PTOX) abundance and composition at the East channel
tide gate (EC), and at Moorhen (A2) and McNabney (McB, McC) marshes. Table 6 – Correlation matrix between environmental variables and Chlorophyll a (Chla), total cell
abundance, as well as individual algal and cyanobacterial taxa abundance from the 2013 monitoring data.
Table 7 – Dissolved toxin concentrations at the East channel tide gate (EC), and at Moorhen (A2)
and McNabney (McB, McC) marshes.

Peyton Slough Marsh Complex CyanoHABs – MVSD/Grant# 20130453 17
Table 1 – UCSC sample inventory.
* 1 samples was lost (not collected) ** 13 DOC samples were lost (broken during transport) or did not meeting QA/QC requirements (e.g. contaminated field blank or field blank broken during transport) *** 9 DON samples were lost (broken during transport) or did not meeting QA/QC requirements (e.g. contaminated field blank or field blank broken during transport).
Task Measurement Field Status Collected Analyzed Field Temperature, pH, Salinity, DO, EC 32 N/A completed Phytoplankton Chlorophyll-a 32 32 completed Phytoplankton Taxonomy/Enum. 32 32 completed Chemistry Toxin 28 27* completed Chemistry DOC 32 27** completed Nutrients Urea 32 32 completed Nutrients Nitrate+Nitrite 32 32 completed Nutrients Ammonium 32 32 completed Nutrients Phosphate 32 32 completed Nutrients DON 32 27*** completed DNA Phylogeny 32 7 completed

Peyton Slough Marsh Complex CyanoHABs – MVSD/Grant# 20130453 18
Table 2 – Hydrographic conditions at the East channel tide gate (EC), and at Moorhen (A2) and McNabney (McB, McC) marshes.
Sampling date
Sampling time
Sampling station
Temperature (°C)
EC (mS/cm)
DO (%)
pH
5/30/2013 9:02a-10:17a A2 19.89 0.942 150.4 8.74 5/30/2013 14:28a-15:22a McB 23.25 18.731 222.6 9.02 5/30/2013 N/A McC 19.49 18.565 129.5 8.75 5/30/2013 11:32a-11:55a EC 19.56 16.766 143.2 8.63 6/26/2013 07:48a A2 21.43 0.975 127.7 8.19 6/26/2013 08:55a McB 19.62 20.350 68.4 7.15 6/26/2013 09:50a McC 21.83 21.240 92.9 7.58 6/26/2013 09:20a EC 19.61 21.090 75.2 7.31 7/24/2013 07:45a A2 21.06 0.954 122.2 8.55 7/24/2013 08:30a McB 19.14 23.300 67.2 7.56 7/24/2013 09:25a McC 20.19 23.980 100.7 7.97 7/24/2013 08:55a EC 19.22 24.060 70.5 7.48 9/4/2013 07:20a A2 21.70 0.934 138.8 9.10 9/4/2013 08:00a McB 19.40 21.920 32.8 7.69 9/4/2013 09:15a McC 19.80 24.220 143.5 8.57 9/4/2013 08:40a EC 20.0 21.440 30.4 7.78
9/25/2013 07:31a A2 19.20 0.927 123.3 9.09 9/25/2013 08:32a McB 16.20 17.850 31.8 7.70 9/25/2013 09:15a McC 15.60 17.900 46.4 7.67 9/25/2013 08:05a EC 16.7 17.740 25.6 7.62 10/23/13 07:40a A2 18.4 0.950 8.85 7.48 10/23/13 08:10a McB 15.1 19.62 71.7 7.11 10/23/13 09:15a McC 14.3 19.45 69.8 8.79 10/23/13 08:50a EC 15.1 19.40 70.0 7.70 11/25/13 07:55a A2 13.8 0.844 94.9 7.76 11/25/13 08:35a McB 11.1 13.59 75.0 7.71 11/25/13 09:35a McC 9.9 13.21 155.6 9.13 11/25/13 09:00a EC 11.5 16.49 83.2 7.84 12/18/13 07:40a A2 12.4 0.863 118.20 7.52 12/18/13 08:10a McB 9.0 16.07 131.60 8.81 12/18/13 09:15a McC 7.7 15.08 139.90 9.11 12/18/13 08:40a EC 9.2 15.80 112.30 8.35

Peyton Slough Marsh Complex CyanoHABs – MVSD/Grant# 20130453 19
Table 3 – Chemical conditions at the East channel tide gate (EC), and at Moorhen (A2) and McNabney (McB, McC) marshes. (Si: Dissolved silica; PO4
3-: phosphate; NOx: nitrate+nitrite; NH4
+: ammonium; DON: total dissolved organic nitrogen; DOC: total dissolved organic carbon). Sampling
date Sampling
station Si
(µM) PO4
3- (µM)
NOx (µM)
NH4+
(µM) Urea (µM)
DON (µM)
DOC (µM)
5/30/2013 A2 170.85 55.42 1633.75 0.88 0.87 1733.52 627.39 5/30/2013 McB 81.96 12.56 0.37 0.31 0.54 76.16 1067.62 5/30/2013 McC 95.99 11.52 0.34 0.34 0.45 98.79 1500.20 5/30/2013 EC 36.12 4.96 12.49 0.19 0.25 73.70 682.65 6/26/2013 A2 192.32 77.44 1565.74 2.53 1.05 -* -* 6/26/2013 McB 117.79 12.94 35.20 27.55 0.71 107.98 495.34 6/26/2013 McC 6.63 11.74 0.39 0.42 0.70 110.42 1310.49 6/26/2013 EC 377.31 34.42 120.41 14.30 0.51 99.27 439.43 7/24/2013 A2 136.95 78.24 1592.94 1.15 9.32 1722.12 591.65 7/24/2013 McB 99.79 9.46 19.74 1.16 0.61 78.84 771.40 7/24/2013 McC 3.85 14.63 0.13 0.36 0.58 130.90 1875.08 7/24/2013 EC 110.00 7.37 27.12 10.37 0.42 79.84 514.43 9/4/2013 A2 163.84 114.76 4205.76 0.81 1.05 1675.93 485.45 9/4/2013 McB 305.42 38.60 3.41 28.89 1.16 -* -* 9/4/2013 McC 385.87 72.48 0.54 0.62 0.82 129.99 2101.36 9/4/2013 EC 424.93 31.04 5.56 32.08 0.91 -* -*
9/25/2013 A2 84.03 114.39 1557.26 0.79 0.88 -* -* 9/25/2013 McB 329.50 38.33 2.5 52.08 1.16 149.39 1130.98 9/25/2013 McC 200.94 35.80 0.5 15.16 2.05 119.84 1492.29 9/25/2013 EC 247.42 22.57 13.35 53.72 1.60 159.87 1050.80 10/23/13 A2 128.23 116.71 934.17 127.44 1.68 -** -** 10/23/13 McB 130.20 5.49 59.67 11.33 0.50 -** -** 10/23/13 McC 70.05 13.54 0.15 0.20 0.60 -** -** 10/23/13 EC 153.32 4.99 109.32 8.77 0.46 -** -** 11/25/13 A2 171.74 109.49 1832.82 10.74 0.84 -* -* 11/25/13 McB 145.25 5.30 59.07 16.26 0.58 90.43 236.61 11/25/13 McC 59.82 8.14 0.18 0.28 0.49 71.22 1088.71 11/25/13 EC 53.74 3.50 41.62 14.42 0.68 61.51 162.86 12/18/13 A2 94.27 96.49 1787.11 0.80 0.81 1492.32 -*** 12/18/13 McB 90.35 6.34 134.49 7.24 0.74 192.84 -*** 12/18/13 McC 0.39 2.66 15.73 0.17 0.56 77.73 -*** 12/18/13 EC 56.01 21.32 317.71 0.88 1.61 470.03 -***
* These samples were broken during transport and could not be analyzed. ** These samples were analyzed but did not meet our QA/QC requirements (field blank broken
during transport). *** These samples were analyzed but did not meet our QA/QC requirements (field blank
contaminated with DOC).

Peyton Slough Marsh Complex CyanoHABs – MVSD/Grant# 20130453 20
Table 4 – Phytoplankton assemblage composition and algal biomass (in term of chlorophyll a, chla) at the East channel tide gate (EC), and at Moorhen (A2) and McNabney (McB, McC) marshes. Notes: miscellaneous and species with marginal abundance were omitted. Dominant taxa are highlighted in bold characters. N.D.: Not Detected.
Sampling date
Sampling Station
Chla (µg/L)
Green algae
(cells/mL)
Diatoms (cells/mL)
Cyanobacteria (cells/mL)
Dinoflagellates (cells/mL)
Total algae(cells/mL)
5/30/13 A2 10.08 23524 257 3600 N.D. 23524 5/30/13 McB 119.70 3119 196962 2161 2160 205187 5/30/13 McC 29.33 12017 189138 29150 1986 232292 5/30/13 EC 70.35 2489 91738 9505 1571 105617 6/26/13 A2 12.81 8905 1414 1941 N.D. 13059 6/26/13 McB 37.94 13090 33405 5966 79 53011 6/26/13 McC 29.05 71795 113417 75147 640 264925 6/26/13 EC 24.85 5631 25640 1656 210 33268 7/24/13 A2 20.93 22294 841 1004 13 26522 7/24/13 McB 16.10 88200 150291 5625 30 244146 7/24/13 McC 84.91 288683 577548 8132 393 874756 7/24/13 EC 19.46 14530 48858 550 145 64083 9/04/13 A2 102.44 31438 1179 8991 79 42767 9/04/13 McB 37.03 7179 32372 33174 2394 75433 9/04/13 McC 9.34 12566 45623 1397572 3152 1459306 9/04/13 EC 1.04 6460 23685 17254 2180 50688 9/25/13 A2 10.01 35718 723 2618 8 39640 9/25/13 McB 211.44 446 2336 2202 683 5706 9/25/13 McC 2.30 34 23410 20494 2474 46570 9/25/13 EC 128.05 1888 2917 721 424 6013.2
10/23/13 A2 22.11 22092 1123 5469 N.D 29326 10/23/13 McB 7.93 1140 4748 914 55 6983 10/23/13 McC 9.68 1524 146572 9048 236 158009 10/23/13 EC 60.35 3496 2182 104 26 5834 11/25/13 A2 16.73 13025 8600 194 0.3 22290 11/25/13 McB 8.67 418 4442 724 79 5702 11/25/13 McC 116.12 8287 268825 18085 4128 304037 11/25/13 EC 4.93 427 2233 14 54 2729 12/18/13 A2 67.79 3933 13486 233 N.D. 17704 12/18/13 McB 109.19 1338 181647 1030 608 185997 12/18/13 McC 246.81 992 311217 1890 5895 327848 12/18/13 EC 91.98 1114 78949 2336 357 83227
Peyton Slough Marsh Complex CyanoHABs – MVSD/Grant# 20130453 21
Table 5 – Potentially toxic cyanobacteria (PTOX) abundance and composition at the East channel tide gate (EC), and at Moorhen (A2) and McNabney (McB, McC) marshes. N.D.: Not Detected.
Sampling date
Sampling station
Oscillatoria margaritifera
(cells/mL)
Phormidium sp.
(cells/mL)
Planktothrix sp.
(cells/mL)
Total PTOX
(cells/mL)
% Total
5/30/13 A2 N.D. 196 N.D. 196 0.70 5/30/13 McB N.D. 250 N.D. 250 1.20 5/30/13 McC N.D. N.D. N.D. N.D. N.D. 5/30/13 EC 240 1020 N.D. 1260 1.20 6/26/13 A2 N.D. N.D. 56 56 0.40 6/26/13 McB N.D. 17 N.D. 17 0.03 6/26/13 McC N.D. N.D. N.D. N.D. N.D. 6/26/13 EC N.D. 892 N.D. 892 2.7 7/24/13 A2 N.D. N.D. N.D. N.D. N.D. 7/24/13 McB N.D. 116 N.D. 116 0.05 7/24/13 McC N.D. N.D. N.D. N.D. N.D. 7/24/13 EC N.D. 350 N.D. 350 0.5 9/04/13 A2 N.D. N.D. N.D. N.D. N.D. 9/04/13 McB N.D. N.D. N.D. N.D. N.D. 9/04/13 McC N.D. N.D. N.D. N.D. N.D. 9/04/13 EC N.D. 327 N.D. 327 0.6 9/25/13 A2 3 N.D. N.D. N.D. 0.01 9/25/13 McB 38 1174 N.D. 1212 21.2 9/25/13 McC N.D. 295 N.D. 307 0.70 9/25/13 EC 92 41 N.D. 133 2.2
10/23/13 A2 N.D. N.D. N.D. N.D. N.D. 10/23/13 McB 312 7 N.D. 319 4.6 10/23/13 McC N.D. 248 N.D. 248 0.2 10/23/13 EC N.D. N.D. N.D. N.D. N.D. 11/25/13 A2 N.D. N.D. N.D. N.D. N.D. 11/25/13 McB 724 N.D. N.D. 724 12.7 11/25/13 McC 12100 N.D. N.D. 12100 4 11/25/13 EC N.D. 10 N.D. 10 0.4
Peyton Slough Marsh Complex CyanoHABs – MVSD/Grant# 20130453 22
Table 6 – Correlation matrix between environmental variables and Chlorophyll a (Chla), total cell abundance, as well as individual algal and cyanobacterial taxa abundance from the 2013 monitoring data. Pearson coefficients (r) and Spearman coefficients (ρ) are highlighted in bold characters when correlations were significant at the 0.05 level, two-tailed (p<0.05). The (1) superscript indicates a spearman correlation coefficient.
E.C. pH Temp. DO NOx NH4+ Urea PO4
3- Si Chla -0.130 0.277 -0.245 0.314 0.039 -0.1921 -0.1191 -0.168 -0.390 Total cells 0.354 0.3791 0.081 0.422 -0.5691 -0.334 -0.220 -0.0898 -0.217 Green algae 0.0601 -0.0091 0.577 0.139 0.1481 -0.337 -0.036 0.318 -0.126 Diatoms 0.648 0.2001 -0.1191 0.226 -0.702 -0.323 -0.461 -0.5241 0.5161
Dinoflagellates 0.713 0.2971 -0.0321 0.1111 -0.7721 -0.2031 -0.1831 -0.608 -0.0671 Cyanobacteria 0.3501 0.238 0.374 0.092 -0.5621 -0.314 0.004 0.215 0.241 Phormidium 0.3551 -0.2551 0.1061 -0.2981 -0.2451 0.2261 -0.1031 -0.1801 0.1761
Oscillatoria -0.2351 0.2661 -0.582 0.1781 -0.0931 -0.1091 -0.2351 -0.501 -0.2111

Peyton Slough Marsh Complex CyanoHABs – MVSD/Grant# 20130453 23
Table 7 – Dissolved toxin concentrations at the East channel tide gate (EC), and at Moorhen (A2) and McNabney (McB, McC) marshes. The concentrations are expressed in ng/g of resin. SPATTs were deployed on May 31, 2013 and retrieved on June 26, 2013, deployed on June 26, 2013 and retrieved on September 4, 2013, deployed on September 4, 2013, and retrieved on September 24, 2013, deployed on September 24 and retrieved on October 23, 2013, deployed on October 23 and retrieved on November 25, 2013, and deployed on November 25, retrieved on December 18, 2013. One SPATT sampler was lost.
Date Station MCY-LR MCY-RR MCY-YR MCY-LA DA 6/26/2013 A2 <MDL 17.76 <MDL <MDL <MDL 6/26/2013 McB 23.26 3.65 <MDL <MDL <MDL 6/26/2013 McC <MDL <MDL <MDL <MDL <MDL 6/26/2013 EC <MDL <MDL <MDL <MDL <MDL 7/24/2013 A2 <MDL 18.51 <MDL <MDL <MDL 7/24/2013 McB 36.09 <MDL <MDL <MDL <MDL 7/24/2013 McC <MDL <MDL <MDL <MDL <MDL 7/24/2013 EC <MDL <MDL <MDL <MDL <MDL 9/4/2013 A2 <MDL 11.13 <MDL 3.06 11.03 9/4/2013 McB <MDL <MDL <MDL <MDL 2.20 9/4/2013 McC <MDL <MDL <MDL 2.35 2.21 9/4/2013 EC <MDL 1.97 <MDL <MDL <MDL 9/24/2013 A2 <MDL 5.84 <MDL 1.78 <MDL 9/24/2013 McB <MDL 0.89 <MDL <MDL 1.59 9/24/2013 McC <MDL 1.37 <MDL 4.16 <MDL 9/24/2013 EC <MDL <MDL <MDL 2.11 1.72 10/23/2013 A2 4.38 5.48 <MDL <MDL 13.26 10/23/2013 McB <MDL <MDL <MDL <MDL 7.93 10/23/2013 McC <MDL 0.32 <MDL <MDL <MDL 10/23/2013 EC <MDL <MDL <MDL <MDL <MDL 11/25/2013 A2 3.39 2.21 <MDL <MDL 50.06 11/25/2013 McB 2.26 0.64 <MDL <MDL <MDL 11/25/2013 McC <MDL <MDL <MDL <MDL <MDL 11/25/2013 EC <MDL <MDL <MDL <MDL <MDL 12/18/2013 A2 1.27 <MDL <MDL <MDL 35.98 12/18/2013 McB N/A N/A N/A N/A N/A 12/18/2013 McC <MDL <MDL <MDL <MDL 5.91 12/18/2013 EC 1.35 <MDL <MDL <MDL 8.35

Peyton Slough Marsh Complex CyanoHABs – MVSD/Grant# 20130453 24
LIST OF FIGURES – Figure 1 – Map of the study area showing location of sampling stations.
Figure 2 – Tukey’s box-and-whiskers plots of abiotic environmental variables (temperature,
Electrical conductivity, Dissolved Oxygen, and pH) measured for MVSD marsh complex between May and December 2013.
Figure 3 – Tukey’s box-and-whiskers plots of dissolved inorganic nutrient concentrations
(nitrate+nitrite, ammonium, phosphate and dissolved silica) measured for MVSD marsh complex between May and December 2013.
Figure 4 – Tukey’s box-and-whiskers plots of dissolved organics concentrations (dissolved organic
carbon, dissolved organic nitrogen, urea) measured for MVSD marsh complex between May and December 2013.
Figure 5 – Tukey’s box-and-whiskers plots of cholorophyll a measured for MVSD marsh complex
between May and December 2013. Figure 6 – Map showing spatial and temporal variation in Phormidium sp. and Oscillatoria
margaritifera cell densities for MVSD marsh complex between May and December 2013.

Peyton Slough Marsh Complex CyanoHABs – MVSD/Grant# 20130453 25
Figure 1 – Map of study area showing location of sampling stations.

Peyton Slough Marsh Complex CyanoHABs – MVSD/Grant# 20130453 26
Figure 2 – Tukey’s box-and-whiskers plots of abiotic environmental variables
(Temperature, Electrical conductivity, Dissolved Oxygen, and pH) measured for MVSD marsh complex between May and December 2013.
A2McB McC EC
0
5
10
15
20
25
Temperature
Stations
Tem
pera
ture
(°C
)
A2McB McC EC
6
7
8
9
10
pH
Stations
pH
A2McB McC EC
0
10000
20000
30000
EC
Stations
EC (μ
S/cm
)
A2McB McC EC
0
50
100
150
200
250
DO
Stations
Dis
solv
ed O
xyge
n (%
)

Peyton Slough Marsh Complex CyanoHABs – MVSD/Grant# 20130453 27
Figure 3 - Tukey’s box-and-whiskers plots of dissolved inorganic nutrient concentrations(nitrate+nitrite, ammonium, phosphate and dissolved silica) measured for MVSD marsh complex between May and December 2013.
A2McB McC EC
0
1000
2000
3000
4000
5000
NOx
Stations
NO
x (μ
M)
A2McB McC EC
0
50
100
150
NH4
NH
4+ (μ
M)
A2McB McC EC
0
50
100
150
PO4
Stations
PO43-
(μM
)
A2McB McC EC
0
100
200
300
400
500
Si
Stations
DSi (μ
M)
Peyton Slough Marsh Complex CyanoHABs – MVSD/Grant# 20130453 28
Figure 4 – Tukey’s box-and-whiskers plots of dissolved organics concentrations (ureal, dissolved organic nitrogen , dissolved organic carbon) measured for MVSD marsh complex between May and December 2013.
A2McB McC EC
0
2
4
6
8
10
Urea
Stations
Ure
a (μ
M)
A2McB McC EC
0
500
1000
1500
2000
DON
Stations
DO
N (μ
M)
A2McB McC EC
0
500
1000
1500
2000
2500
DOC
Stations
DO
C (μ
M)
Peyton Slough Marsh Complex CyanoHABs – MVSD/Grant# 20130453 29
Figure 5 – Tukey’s box-and-whiskers plots of cholorophyll a measured for MVSD marsh complex between May and December 2013.
A2McB McC EC
0
100
200
300
Chla
Stations
Chl
a (μ
g/L)
Peyton Slough Marsh Complex CyanoHABs – MVSD/Grant# 20130453 30
Figure 6 – Map showing spatial and temporal variation in Phormidium sp. and Oscillatoria
margaritifera cell densities for MVSD marsh complex between May and December 2013.

Peyton Slough Marsh Complex CyanoHABs – MVSD/Grant# 20130453 31
APPENDIX – Appendix 1 – Field sheet for the monitoring period Appendix 2 – Greenwater Lab Inc. Algal enumeration and identification reports

UC Santa Cruz Algal Analysis Report Prepared: February 7, 2013 Prepared By: GreenWater Laboratories
Samples: 2 (Collected on 10/15/2012) 1. Water Column 2. Floating Mat
Methods: Wet mounts were made of glutaraldehyde preserved samples and observed at 1000X, 400X and 100X using a Nikon TE200 Inverted Microscope equipped with phase contrast optics and epi- fluorescence. Measurements and micrographs were taken of important species. Following examination of wet mounts the entire sample was homogenized for 1 minute in a blender. One mL of this homogenized material was added to 49 ml of DI water. This material was then diluted further by 1/10th, preserved with Lugol’s Iodine solution and 1 mL allowed to settle for 24 hours. Cell counts were performed on this material and relative abundances determined.
Sample 1: Water Column Blue-green algae (Cyanobacteria) were the dominant algal group in the Water Column sample collected on 10/15/12 accounting for 68.0% of total cell numbers. Other algal groups in the sample were diatoms (Bacillariophyta; 13.0%), green algae (Chlorophyta; 0.6%), euglenophytes (Euglenophyta; 0.02%), unknown unicells and colonies (Miscellaneous; 18.4%) and dinoflagellates (Pyrrhophyta; 0.0005%). The most abundant algae in the sample were a species of the filamentous cyanophyte Leptolyngbya (Leptolyngbya sp. 1; 16.4% of total cells; Fig. 1), small unknown oval unicells (15.7%; Fig. 2) and a thin, unknown cyanophyte filament (oscillatorialean filament sp. 1; 11.6%; Fig. 3). Large filamentous algae present in the sample included the cyanophyte Lyngbya aestuarii (Figs. 4-5) and the chlorophytes Cladophora sp. (Fig. 6) and Rhizoclonium sp. (Fig. 7). Cyanobacteria species from genera known to have potentially toxigenic species (PTOX Cyano) comprised 18.5% of total cell numbers. PTOX Cyano species present included Lyngbyaaestuarii, Pseudanabaena sp. 1 (Fig. 8), Pseudanabaena sp. 2 (Fig. 9), Trichormus sp. (Figs. 10-11), Phormidium sp. (Fig. 12), Nodularia cf. spumigena (Fig. 13) and Oscillatoria sp. (Fig. 14). Sample 2: Floating Mat Blue-green algae (Cyanobacteria) were the dominant algal group in the Floating Mat sample collected on 10/15/12 accounting for 84.2% of total cell numbers. Other algal groups in the sample were diatoms (Bacillariophyta; 12.6%), green algae (Chlorophyta; 1.5%), unknown unicells (Miscellaneous; 1.7%) and dinoflagellates (Pyrrhophyta; 0.0004%). The most abundant algae in the sample were oscillatorialean filament sp. 1 (18.1% of total cells), Lyngbya aestuarii(14.7%) and Leptolyngbya sp. 1 (14.2%). Large filamentous algae present in the sample included the cyanophyte Lyngbya aestuarii and the chlorophytes Cladophora sp. and Rhizoclonium sp. Cyanobacteria species from genera known to have potentially toxigenic species (PTOX Cyano) comprised 32.8% of total cell numbers. PTOX Cyano species present included Lyngbya

aestuarii, Pseudanabaena sp. 2, Trichormus sp., Pseudanabaena sp. 1, Anabaena ambigua (Fig. 15), Nodularia cf. spumigena, Phormidium sp. and Oscillatoria sp.
Fig. 1 Leptolyngbya sp. 1 400X (scale bar = 10μm)
Fig. 2 unknown oval unicell 1000X (scale bar = 2μm)
Fig. 3 oscillatorialean filament sp. 1 400X (scale bar = 10μm)

Fig. 4 Lyngbya aestuarii 400X (scale bar = 10μm)
Fig. 5 Lyngbya aestuarii 400X (scale bar = 20μm)

Fig. 6 Cladophora sp. 100X (scale bar = 100μm)
Fig. 7 Rhizoclonium sp. 400X (scale bar = 20μm)

Fig. 8 Pseudanabaena sp. 1 400X (scale bar = 10μm)
Fig. 9 Pseudanabaena sp. 1 400X (scale bar = 10μm)
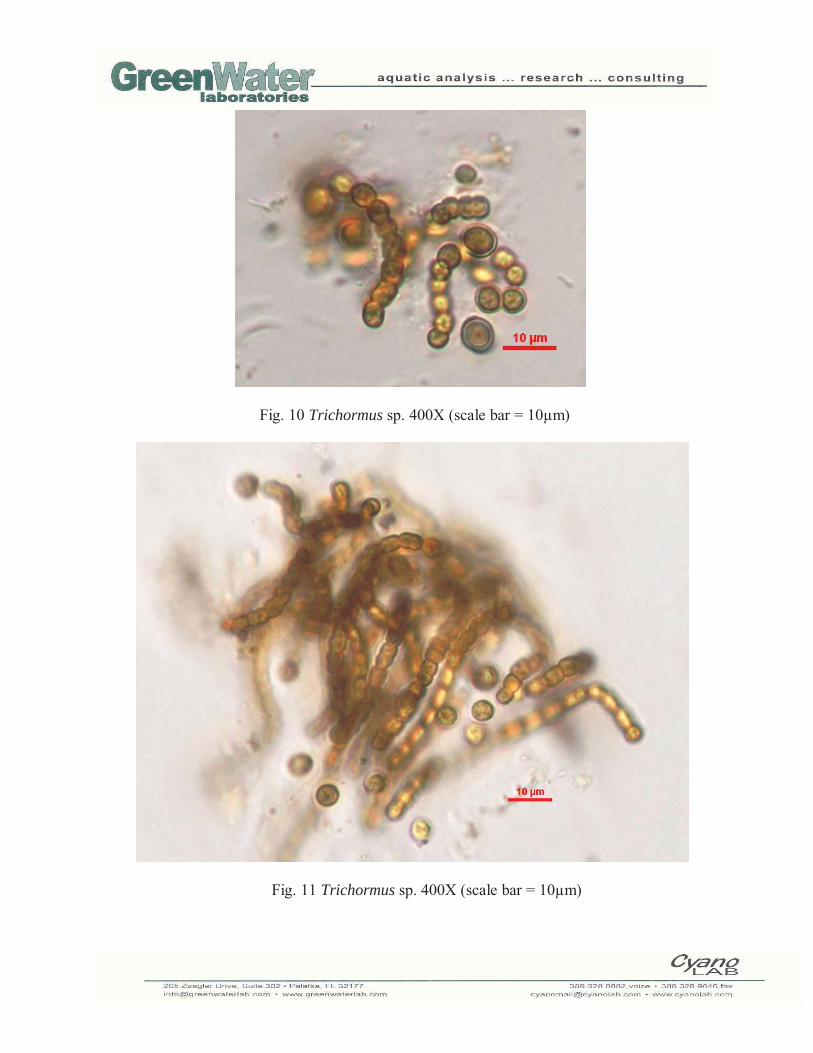
Fig. 10 Trichormus sp. 400X (scale bar = 10μm)
Fig. 11 Trichormus sp. 400X (scale bar = 10μm)

Fig. 12 Phormidium sp. 400X (scale bar = 10μm)
Fig. 13 Nodularia cf. spumigena 400X (scale bar = 20μm)

Fig. 14 Oscillatoria sp. 400X (scale bar = 10μm)
Fig. 15 Anabaena ambigua 400X (scale bar = 10μm)

UC-Santa Cruz Algal Analysis Report Prepared: August 16, 2013 Prepared By: GreenWater Laboratories
PO481621 Samples: 8 1. A2 (Collected on 5/30/13) 2. EC (Collected on 5/30/13) 3. McB (Collected on 5/30/13) 4. McC (Collected on 5/30/13) 5. A2 (Collected on 6/26/13) 6. EC (Collected on 6/26/13) 7. McB (Collected on 6/26/13) 8. McC (Collected on 6/26/13)
Sample 1: A2 130530 Total cell numbers in the A2 sample collected on 5/30/13 were 27,537 cells/mL. Green algae (Chlorophyta; 23,524 cells/mL) were the dominant algal group in the sample accounting for 85.4% of total cell numbers. Other algal groups in the sample were diatoms (Bacillariophyta; 257 cells/mL), cryptophytes (Cryptophyta; 105 cells/mL), blue-green algae (Cyanobacteria; 3,600 cells/mL), euglenophytes (Euglenophyta; 0.3 cells/mL) and yellow-green algae (Xanthophyta; 52 cells/mL). The most abundant species was the chlorophyte Scenedesmus opoliensis (15,184 cells/mL; Figs. 1-2).
Total numbers of potentially toxigenic cyanobacteria (PTOX Cyano) were 196 cells/mL (0.7% of total cell numbers). Oscillatoria/Phormidium sp. (196 cells/mL) was the only PTOX Cyano species detected.
Sample 2: EC 130530 Total cell numbers in the EC sample collected on 5/30/13 were 105,617 cells/mL. Diatoms (Bacillariophyta; 91,738 cells/mL) were the dominant algal group in the sample accounting for 86.9% of total cell numbers. Other algal groups in the sample were green algae (Chlorophyta; 2,489 cells/mL), blue-green algae (Cyanobacteria; 9,505 cells/mL), microflagellates (Miscellaneous; 314 cells/mL) and dinoflagellates (Pyrrhophyta; 1,571 cells/mL). The most abundant species were small centric diatoms (52,150 cells/mL; Fig. 3), including Stephanodiscus(Fig. 4), and Chaetoceros sp. (33,301 cells/mL; Fig. 5).
Total numbers of potentially toxigenic cyanobacteria (PTOX Cyano) were 1,260 cells/mL (1.2% of total cell numbers). PTOX Cyano species present included Phormidium sp. (1,020 cells/mL; Fig. 6) and Lyngbya/Oscillatoria sp. (240 cells/mL).
Sample 3: McB 130530 Total cell numbers in the McB sample collected on 5/30/13 were 205,187 cells/mL. Diatoms (Bacillariophyta; 196,962 cells/mL) were the dominant algal group in the sample accounting for 96.0% of total cell numbers. Other algal groups in the sample were green algae (Chlorophyta;

3,119 cells/mL), blue-green algae (Cyanobacteria; 2,161 cells/mL), microflagellates (Miscellaneous; 785 cells/mL) and dinoflagellates (Pyrrhophyta; 2,160 cells/mL). The most abundant species were small centric diatoms (86,393 cells/mL) and Chaetoceros sp. (86,393 cells/mL).
Total numbers of potentially toxigenic cyanobacteria (PTOX Cyano) were 250 cells/mL (1.2% of total cell numbers). Phormidium sp. (250 cells/mL) was the only PTOX Cyano species detected.
Sample 4: McC 130530 Total cell numbers in the McC sample collected on 5/30/13 were 232,292 cells/mL. Diatoms (Bacillariophyta; 189,138 cells/mL) were the dominant algal group in the sample accounting for 81.4% of total cell numbers. Other algal groups in the sample were green algae (Chlorophyta; 12,017 cells/mL), blue-green algae (Cyanobacteria; 29,150 cells/mL) and dinoflagellates (Pyrrhophyta; 1,986 cells/mL). The most abundant species were Chaetoceros sp. (94,247 cells/mL) and small centric diatoms (72,256 cells/mL).
No known potentially toxigenic cyanobacteria (PTOX Cyano) were observed in the sample.
Sample 5: A2 130626 Total cell numbers in the A2 sample collected on 6/26/13 were 13,059 cells/mL. Green algae (Chlorophyta; 8,905 cells/mL) were the dominant algal group in the sample accounting for 68.2% of total cell numbers. Other algal groups in the sample were diatoms (Bacillariophyta; 1,414 cells/mL), blue-green algae (Cyanobacteria; 1,941 cells/mL), unknown flagellates and unicells (Miscellaneous; 785 cells/mL) and yellow-green algae (Xanthophyta; 13 cells/mL). The most abundant species was the chlorophyte Scenedesmus opoliensis (5,655 cells/mL).
Total numbers of potentially toxigenic cyanobacteria (PTOX Cyano) were 56 cells/mL (0.4% of total cell numbers). Planktothrix sp. (56 cells/mL) was the only PTOX Cyano species detected.
Sample 6: EC 130626 Total cell numbers in the EC sample collected on 6/26/13 were 33,268 cells/mL. Diatoms (Bacillariophyta; 25,640 cells/mL) were the dominant algal group in the sample accounting for 77.1% of total cell numbers. Other algal groups in the sample were green algae (Chlorophyta; 5,631 cells/mL), cryptophytes (Cryptophyta; 65 cells/mL), blue-green algae (Cyanobacteria; 1,656 cells/mL), microflagellates (Miscellaneous; 65 cells/mL) and dinoflagellates (Pyrrhophyta; 210 cells/mL). The most abundant species were small centric diatoms (17,868 cells/mL).
Total numbers of potentially toxigenic cyanobacteria (PTOX Cyano) were 892 cells/mL (2.7% of total cell numbers). PTOX Cyano species present included Phormidium sp. (757 cells/mL) and Oscillatoria/Phormidium sp. (135 cells/mL).

Sample 7: McB 130626 Total cell numbers in the McB sample collected on 6/26/13 were 53,011 cells/mL. Diatoms (Bacillariophyta; 33,405 cells/mL) were the dominant algal group in the sample accounting for 63.0% of total cell numbers. Other algal groups in the sample were green algae (Chlorophyta; 13,090 cells/mL), blue-green algae (Cyanobacteria; 5,966 cells/mL), euglenophytes (Euglenophyta; 1 cell/mL), microflagellates (Miscellaneous; 157 cells/mL), prasinophytes (Prasinophyta; 79 cells/mL) and dinoflagellates (Pyrrhophyta; 79 cells/mL). The most abundant species were small centric diatoms (25,447 cells/mL).
Total numbers of potentially toxigenic cyanobacteria (PTOX Cyano) were 17 cells/mL (0.03% of total cell numbers). Phormidium sp. (17 cells/mL) was the only PTOX Cyano species detected.
Sample 8: McC 130626 Total cell numbers in the McC sample collected on 6/26/13 were 264,925 cells/mL. Diatoms (Bacillariophyta; 113,417 cells/mL) were the dominant algal group in the sample accounting for 42.8% of total cell numbers. Other algal groups in the sample were green algae (Chlorophyta; 71,795 cells/mL), blue-green algae (Cyanobacteria; 75,147 cells/mL), microflagellates (Miscellaneous; 3,927 cells/mL) and dinoflagellates (Pyrrhophyta; 640 cells/mL). The most abundant species were small centric diatoms (106,421 cells/mL).
No known potentially toxigenic cyanobacteria (PTOX Cyano) were observed in the sample.

Fig. 1 Scenedesmus opoliensis 200X (scale bar = 100μm)
Fig. 2 Scenedesmus opoliensis 400X (scale bar = 20μm)

Fig. 3 centric diatom spp. 400X (scale bar = 10μm)
Fig. 4 Stephanodiscus sp. 1000X (scale bar = 5μm)

Fig. 5 Chaetoceros sp. 400X (scale bar = 10μm)
Fig. 6 Phormidium sp. 400X (scale bar = 20μm)

UC-Santa Cruz Algal Analysis Report Prepared: November 5, 2013 Prepared By: GreenWater Laboratories
PO487324 Samples: 4 (Collected on 7/24/13) 1. A2 2. EC 3. McB 4. McC
Sample 1: A2 130724 Total cell numbers in the A2 sample collected on 7/24/13 were 26,522 cells/mL. Green algae (Chlorophyta; 22,294 cells/mL) were the dominant algal group in the sample accounting for 84.1% of total cell numbers. Other algal groups in the sample were diatoms (Bacillariophyta; 841 cells/mL), cryptophytes (Cryptophyta; 956 cells/mL), blue-green algae (Cyanobacteria; 1,004 cells/mL), unknown flagellates (Miscellaneous; 1,414 cells/mL) and dinoflagellates (Pyrrhophyta; 13 cells/mL). The most abundant species was the chlorophyte Scenedesmus opoliensis (13,037 cells/mL; Fig. 1).
No potentially toxigenic cyanobacteria (PTOX Cyano) were detected in the sample.
Sample 2: EC 130724 Total cell numbers in the EC sample collected on 7/24/13 were 64,083 cells/mL. Diatoms (Bacillariophyta; 48,858 cells/mL) were the dominant algal group in the sample accounting for 76.2% of total cell numbers. Other algal groups in the sample were green algae (Chlorophyta; 14,530 cells/mL), blue-green algae (Cyanobacteria; 550 cells/mL), euglenophyta (Euglenophyta; 1 cell/mL) and dinoflagellates (Pyrrhophyta; 145 cells/mL). The most abundant species were small centric diatoms (34,557 cells/mL; Fig. 2).
Total numbers of potentially toxigenic cyanobacteria (PTOX Cyano) were 350 cells/mL (0.5% of total cell numbers). Phormidium sp. (350 cells/mL; Fig. 3) was the only PTOX Cyano species detected.
Sample 3: McB 130724 Total cell numbers in the McB sample collected on 7/24/13 were 244,145 cells/mL. Diatoms (Bacillariophyta; 150,291 cells/mL) were the dominant algal group in the sample accounting for 61.6% of total cell numbers. Other algal groups in the sample were green algae (Chlorophyta; 88,200 cells/mL), blue-green algae (Cyanobacteria; 5,625 cells/mL) and dinoflagellates (Pyrrhophyta; 30 cells/mL). The most abundant species were small centric diatoms (118,987 cells/mL).
Total numbers of potentially toxigenic cyanobacteria (PTOX Cyano) were 116 cells/mL (0.05% of total cell numbers). Phormidium sp. (116 cells/mL; Fig. 4) was the only PTOX Cyano species detected.

Sample 4: McC 130724 Total cell numbers in the McC sample collected on 7/24/13 were 869,755 cells/mL. Diatoms (Bacillariophyta; 577,548 cells/mL) were the dominant algal group in the sample accounting for 66.4% of total cell numbers. Other algal groups in the sample were green algae (Chlorophyta; 288,683 cells/mL), blue-green algae (Cyanobacteria; 8,132 cells/mL) and dinoflagellates (Pyrrhophyta; 393 cells/mL). The most abundant species were small centric diatoms (527,335 cells/mL; Fig. 5).
No known potentially toxigenic cyanobacteria (PTOX Cyano) were observed in the sample.
Fig. 1 Scenedesmus opoliensis A2 400X (scale bar = 20μm)
Fig. 2 centric diatom sp. EC 400X (scale bar = 10μm)

Fig. 3 Phormidium sp. EC 400X (scale bar = 20μm)
Fig. 4 Phormidium sp. McB 400X (scale bar = 10μm)
Fig. 5 centric diatom sp. McC 400X (scale bar = 5μm)

UC-Santa Cruz Algal Analysis Report Prepared: November 11, 2013 Prepared By: GreenWater Laboratories
PO487324 Samples: 4 (Collected on 9/04/13) 1. A2 2. EC 3. McB 4. McC
Sample 1: A2 130904 Total cell numbers in the A2 sample collected on 9/4/13 were 42,767 cells/mL. Green algae (Chlorophyta; 31,438 cells/mL) were the dominant algal group in the sample accounting for 73.5% of total cell numbers. Other algal groups in the sample were diatoms (Bacillariophyta; 1,179 cells/mL), cryptophytes (Cryptophyta; 923 cells/mL), blue-green algae (Cyanobacteria; 8,991 cells/mL), unknown flagellates (Miscellaneous; 157 cells/mL) and dinoflagellates (Pyrrhophyta; 79 cells/mL). The most abundant species was the chlorophyte Scenedesmus opoliensis (22,855 cells/mL; Fig. 1).
No potentially toxigenic cyanobacteria (PTOX Cyano) were detected in the sample.
Sample 2: EC 130904 Total cell numbers in the EC sample collected on 9/4/13 were 50,679 cells/mL. Diatoms (Bacillariophyta; 23,685 cells/mL) and blue-green algae (Cyanobacteria; 17,254 cells/mL) were the dominant algal groups in the sample accounting for 46.7% and 34.0% of total cell numbers respectively. Other algal groups in the sample were green algae (Chlorophyta; 6,460 cells/mL), cryptophytes (Cryptophyta; 98 cells/mL), euglenophyta (Euglenophyta; 20 cell/mL), unknown flagellates (Miscellaneous; 982 cells/mL) and dinoflagellates (Pyrrhophyta; 2,180 cells/mL). The most abundant species were small, unknown cyanophyte colonies (12,566 cells/mL; Fig. 2) and small centric diatoms (11,290 cells/mL; Fig. 3). The sample contained abundant picoplankton.
Total numbers of potentially toxigenic cyanobacteria (PTOX Cyano) were 327 cells/mL (0.6% of total cell numbers). Phormidium sp. (327 cells/mL) was the only PTOX Cyano species detected.
Sample 3: McB 130904 Total cell numbers in the McB sample collected on 9/4/13 were 75,434 cells/mL. Blue-green algae (Cyanobacteria; 33,174 cells/mL) and diatoms (Bacillariophyta; 32,372 cells/mL) were the dominant algal groups in the sample accounting for 44.0% and 42.9% of total cell numbers respectively. Other algal groups in the sample were green algae (Chlorophyta; 7,179 cells/mL), unknown flagellates (Miscellaneous; 314 cells/mL) and dinoflagellates (Pyrrhophyta; 2,394 cells/mL). The most abundant species was a small cyanophyte colony (28,588 cells/mL; Fig. 4). The sample contained abundant picoplankton.

No potentially toxigenic cyanobacteria (PTOX Cyano) were detected in the sample.
Sample 4: McC 130904 Total cell numbers in the McC sample collected on 9/4/13 were 1,459,306 cells/mL. Blue-green algae (Cyanobacteria; 1,397,572 cells/mL) were the dominant algal group in the sample accounting for 95.8% of total cell numbers. Other algal groups in the sample were diatoms (Bacillariophyta; 45,623 cells/mL), green algae (Chlorophyta; 12,566 cells/mL), euglenophytes (Euglenophyta; 393 cells/mL) and dinoflagellates (Pyrrhophyta; 3,152 cells/mL). The most abundant species was the colonial cyanophyte Cyanodictyon sp. (892,205 cells/mL; Fig. 5). The sample contained abundant picoplankton.
No known potentially toxigenic cyanobacteria (PTOX Cyano) were observed in the sample.
Fig. 1 Scenedesmus opoliensis A2 400X (scale bar = 20μm)
Fig. 2 cyanophyte colony sp. EC 400X (scale bar = 10μm)

Fig. 3 centric diatom sp. EC 400X (scale bar = 10μm)
Fig. 4 cyanophyte colony sp. McB 400X (scale bar = 10μm)
Fig. 5 Cyanodictyon sp. McC 400X (scale bar = 20μm)

UC-Santa Cruz Algal Analysis Report Prepared: January 10, 2014 Prepared By: GreenWater Laboratories PO489771 Samples: 4 (Collected on 9/25/13) 1. A2 2. EC 3. McB 4. McC Sample 1: A2 130925 Total cell numbers in the A2 sample collected on 9/25/13 were 39,640 cells/mL. Green algae (Chlorophyta; 35,718 cells/mL) were the dominant algal group in the sample accounting for 90.1% of total cell numbers. Other algal groups in the sample were diatoms (Bacillariophyta; 723 cells/mL), cryptophytes (Cryptophyta; 573 cells/mL), blue-green algae (Cyanobacteria; 2,618 cells/mL) and dinoflagellates (Pyrrhophyta; 8 cells/mL). The most abundant species was the chlorophyte Scenedesmus opoliensis (30,158 cells/mL; Fig. 1). Total numbers of potentially toxigenic cyanobacteria (PTOX Cyano) were 3 cells/mL (0.01% of total cell numbers). Oscillatoria sp. (3 cells/mL) was the only PTOX Cyano species detected. Sample 2: EC 130925 Total cell numbers in the EC sample collected on 9/25/13 were 6,014 cells/mL. Diatoms (Bacillariophyta; 2,917 cells/mL) and green algae (Chlorophyta; 1,888 cells/mL) were the dominant algal groups in the sample accounting for 48.5% and 31.4% of total cell numbers respectively. Other algal groups in the sample were blue-green algae (Cyanobacteria; 721 cells/mL), euglenophytes (Euglenophyta; 0.2 cell/mL), unknown flagellates (Miscellaneous; 63 cells/mL) and dinoflagellates (Pyrrhophyta; 424 cells/mL). The most abundant species were small centric diatoms (1,885 cells/mL; Fig. 2) and Scenedesmus opoliensis (1,259 cells/mL). Total numbers of potentially toxigenic cyanobacteria (PTOX Cyano) were 133 cells/mL (2.2% of total cell numbers). PTOX Cyano species observed included Oscillatoria/Phormidium sp. (92 cells/mL) and Phormidium sp. (41 cells/mL). Sample 3: McB 130925 Total cell numbers in the McB sample collected on 9/25/13 were 5,707 cells/mL. Diatoms (Bacillariophyta; 2,336 cells/mL) and blue-green algae (Cyanobacteria; 2,202 cells/mL) were the dominant algal groups in the sample accounting for 40.9% and 38.6% of total cell numbers respectively. Other algal groups in the sample were green algae (Chlorophyta; 446 cells/mL), euglenophytes (Euglenophyta; 8 cells/mL), unknown flagellates (Miscellaneous; 31 cells/mL) and dinoflagellates (Pyrrhophyta; 683 cells/mL). The most abundant species were small centric diatoms (1,686 cells/mL) and Phormidium sp. (1,013 cells/mL; Fig. 3).

Total numbers of potentially toxigenic cyanobacteria (PTOX Cyano) were 1,212 cells/mL (21.2% of total cell numbers). PTOX Cyano species observed included Phormidium sp. (1,013 cells/mL), Phormidium sp. (123 cells/mL), Oscillatoria margaritifera (38 cells/mL) and Phormidium sp. (38 cells/mL). Oscillatoria margaritifera is not listed as a known toxin producer but is included due to a number of related species that have been found to be potentially toxigenic. Sample 4: McC 130925 Total cell numbers in the McC sample collected on 9/25/13 were 46,569 cells/mL. Diatoms (Bacillariophyta; 23,410 cells/mL) and blue-green algae (Cyanobacteria; 20,494 cells/mL) were the dominant algal groups in the sample accounting for 50.3% and 44.0% of total cell numbers. Other algal groups in the sample were green algae (Chlorophyta; 34 cells/mL), euglenophytes (Euglenophyta; 79 cells/mL), unknown flagellates (Miscellaneous; 79 cells/mL) and dinoflagellates (Pyrrhophyta; 2,474 cells/mL). The most abundant species were small centric diatoms (16,886 cells/mL) and the filamentous cyanophyte Geitlerinema/Jaaginema sp. (11,624 cells/mL; Fig. 4). Total numbers of potentially toxigenic cyanobacteria (PTOX Cyano) were 307 cells/mL (0.7% of total cell numbers). PTOX Cyano species observed included Phormidium sp. (200 cells/mL), Phormidium sp. (95 cells/mL) and a species of nostocalean filamentous cyanophyte (12 cells/mL).
Fig. 1 Scenedesmus opoliensis A2 400X (scale bar = 10μm)

Fig. 2 centric diatom sp. EC 400X (scale bar = 10μm)
Fig. 3 Phormidium sp. McB 400X (scale bar = 10μm)

Fig. 4 Geitlerinema/Jaaginema sp. McC 200X (scale bar = 20μm)

UC-Santa Cruz Algal Analysis Report Prepared: January 23, 2014 Prepared By: GreenWater Laboratories PO495925 Samples: 4 (Collected on 10/23/13) 1. A2 2. EC 3. McB 4. McC Sample 1: A2 131023 Total cell numbers in the A2 sample collected on 10/23/13 were 29,326 cells/mL. Green algae (Chlorophyta; 22,092 cells/mL) were the dominant algal group in the sample accounting for 75.3% of total cell numbers. Other algal groups in the sample were diatoms (Bacillariophyta; 1,123 cells/mL), cryptophytes (Cryptophyta; 524 cells/mL), blue-green algae (Cyanobacteria; 5,469 cells/mL) and unknown unicells (Miscellaneous; 118 cells/mL). The most abundant species was the chlorophyte Scenedesmus opoliensis (14,871 cells/mL; Fig. 1). The sample contained abundant detritus. No potentially toxigenic cyanobacteria (PTOX Cyano) species were observed in the sample. Sample 2: EC 131023 Total cell numbers in the EC sample collected on 10/23/13 were 5,835 cells/mL. Green algae (Chlorophyta; 3,496 cells/mL) and diatoms (Bacillariophyta; 2,182 cells/mL) were the dominant algal groups in the sample accounting for 59.9% and 37.4% of total cell numbers respectively. Other algal groups in the sample were blue-green algae (Cyanobacteria; 104 cells/mL), euglenophytes (Euglenophyta; 13 cells/mL), unknown unicells (Miscellaneous; 13 cells/mL) and dinoflagellates (Pyrrhophyta; 26 cells/mL). The most abundant species were small centric diatoms (1,990 cells/mL; Fig. 2) and Scenedesmus opoliensis (1,784 cells/mL; Fig. 2). The sample contained abundant detritus. No potentially toxigenic cyanobacteria (PTOX Cyano) species were observed in the sample. Sample 3: McB 131023 Total cell numbers in the McB sample collected on 10/23/13 were 6,982 cells/mL. Diatoms (Bacillariophyta; 4,748 cells/mL) were the dominant algal group in the sample accounting for 68.0% of total cell numbers. Other algal groups in the sample were green algae (Chlorophyta; 1,140 cells/mL), blue-green algae (Cyanobacteria; 914 cells/mL) euglenophytes (Euglenophyta; 63 cells/mL), unknown unicells (Miscellaneous; 63 cells/mL) and dinoflagellates (Pyrrhophyta; 55 cells/mL). The most abundant species were small centric diatoms (4,304 cells/mL; Fig. 3) including Cyclotella cf. meneghiniana (Figs. 4-5). The sample contained abundant detritus. Total numbers of potentially toxigenic cyanobacteria (PTOX Cyano) were 319 cells/mL (4.6% of total cell numbers). PTOX Cyano species observed included Oscillatoria margaritifera (247

cells/mL), Oscillatoria sp. (65 cells/mL) and Phormidium sp. (7 cells/mL). Oscillatoria margaritifera is not listed as a known toxin producer but is included due to a number of related species that have been found to be potentially toxigenic. Sample 4: McC 131023 Total cell numbers in the McC sample collected on 10/23/13 were 158,008 cells/mL. Diatoms (Bacillariophyta; 146,572 cells/mL) were the dominant algal group in the sample accounting for 92.8% of total cell numbers. Other algal groups in the sample were green algae (Chlorophyta; 1,524 cells/mL), cryptophytes (Cryptophyta; 393 cells/mL), blue-green algae (Cyanobacteria; 9,048 cells/mL), euglenophytes (Euglenophyta; 236 cells/mL) and dinoflagellates (Pyrrhophyta; 236 cells/mL). The most abundant species were small centric diatoms (133,517 cells/mL; Fig. 6) including Cyclotella cf. meneghiniana (Fig. 7). The sample contained abundant detritus. Total numbers of potentially toxigenic cyanobacteria (PTOX Cyano) were 248 cells/mL (0.2% of total cell numbers). Phormidium sp. (248 cells/mL) was the only PTOX Cyano species observed.
Fig. 1 Scenedesmus opoliensis A2 400X (scale bar = 10μm)

Fig. 2 centric diatom sp. and Scenedesmus opoliensis EC 200X (scale bar = 50μm)
Fig. 3 centric diatom sp. McB 400X (scale bar = 10μm)

Fig. 4 Cyclotella cf. meneghiniana McB 1000X (scale bar = 5μm)
Fig. 5 Cyclotella cf. meneghiniana McB 1000X (scale bar = 5μm)
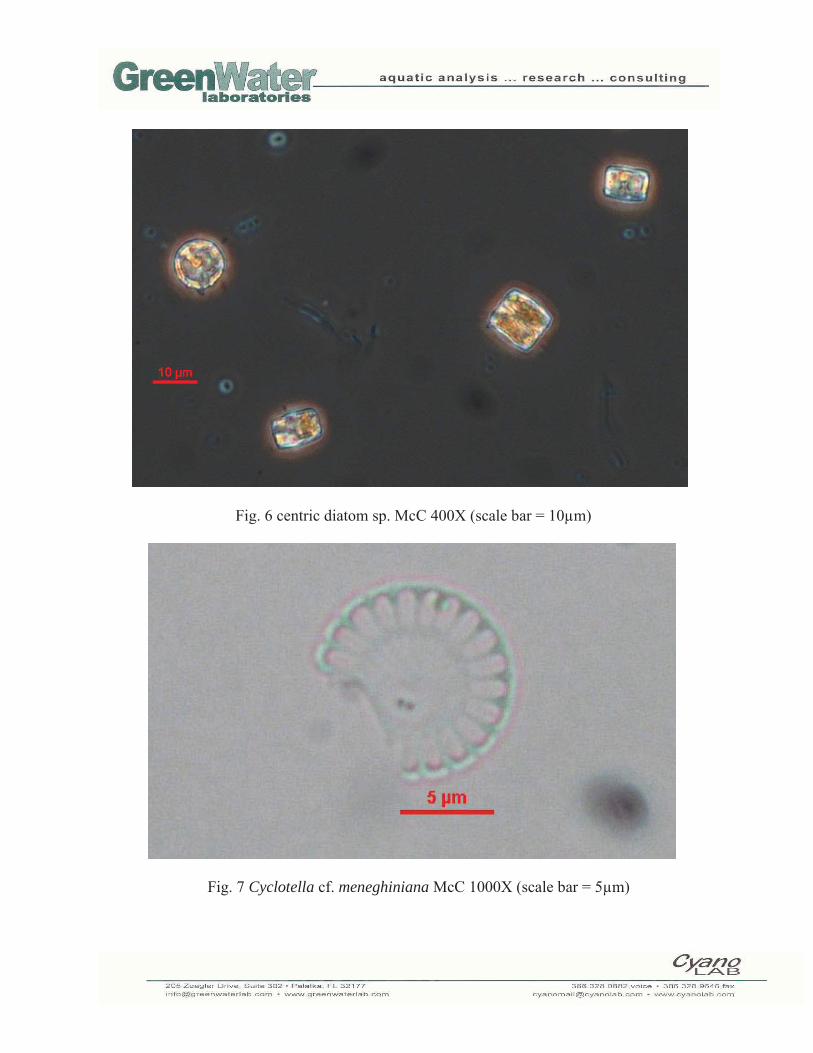
Fig. 6 centric diatom sp. McC 400X (scale bar = 10μm)
Fig. 7 Cyclotella cf. meneghiniana McC 1000X (scale bar = 5μm)

UC-Santa Cruz Algal Analysis Report Prepared: January 28, 2014 Prepared By: GreenWater Laboratories PO495925 Samples: 4 (Collected on 11/25/13) 1. A2 2. EC 3. McB 4. McC Sample 1: A2 131125 Total cell numbers in the A2 sample collected on 11/25/13 were 22,291 cells/mL. Green algae (Chlorophyta; 13,025 cells/mL) and diatoms (Bacillariophyta; 8,600 cells/mL) were the dominant algal groups in the sample accounting for 58.4% and 38.6% of total cell numbers respectively. Other algal groups in the sample were cryptophytes (Cryptophyta; 471 cells/mL), blue-green algae (Cyanobacteria; 194 cells/mL) and dinoflagellates (Pyrrhophyta; 0.3 cells/mL). The most abundant species were small centric diatoms (8,325 cells/mL; Fig. 1) including Cyclotella cf. meneghiniana (Fig. 2), and the chlorophyte Scenedesmus opoliensis (7,487 cells/mL; Fig. 3). No potentially toxigenic cyanobacteria (PTOX Cyano) species were observed in the sample. Sample 2: EC 131125 Total cell numbers in the EC sample collected on 11/25/13 were 2,729 cells/mL. Diatoms (Bacillariophyta; 2,233 cells/mL) were the dominant algal group in the sample accounting for 81.8% of total cell numbers. Other algal groups in the sample were green algae (Chlorophyta; 427 cells/mL), blue-green algae (Cyanobacteria; 14 cells/mL), euglenophytes (Euglenophyta; 1 cell/mL) and dinoflagellates (Pyrrhophyta; 54 cells/mL). The most abundant species were small centric diatoms (1,152 cells/mL; Fig. 4) including Cyclotella cf. meneghiniana, and Chaetoceros sp./spp. (890 cells/mL; Fig. 5). The sample contained abundant detritus. Total numbers of potentially toxigenic cyanobacteria (PTOX Cyano) were 10 cells/mL (0.4% of total cell numbers). Phormidium sp. (10 cells/mL) was the only PTOX Cyano species observed. Sample 3: McB 131125 Total cell numbers in the McB sample collected on 11/25/13 were 5,701 cells/mL. Diatoms (Bacillariophyta; 4,442 cells/mL) were the dominant algal group in the sample accounting for 77.9% of total cell numbers. Other algal groups in the sample were green algae (Chlorophyta; 418 cells/mL), blue-green algae (Cyanobacteria; 724 cells/mL) euglenophytes (Euglenophyta; 39 cells/mL) and dinoflagellates (Pyrrhophyta; 79 cells/mL). The most abundant species were Chaetoceros sp./spp. (2,356 cells/mL; Fig. 6) and small centric diatoms (1,728 cells/mL; Fig. 7) including Cyclotella cf. meneghiniana. The sample contained abundant detritus.
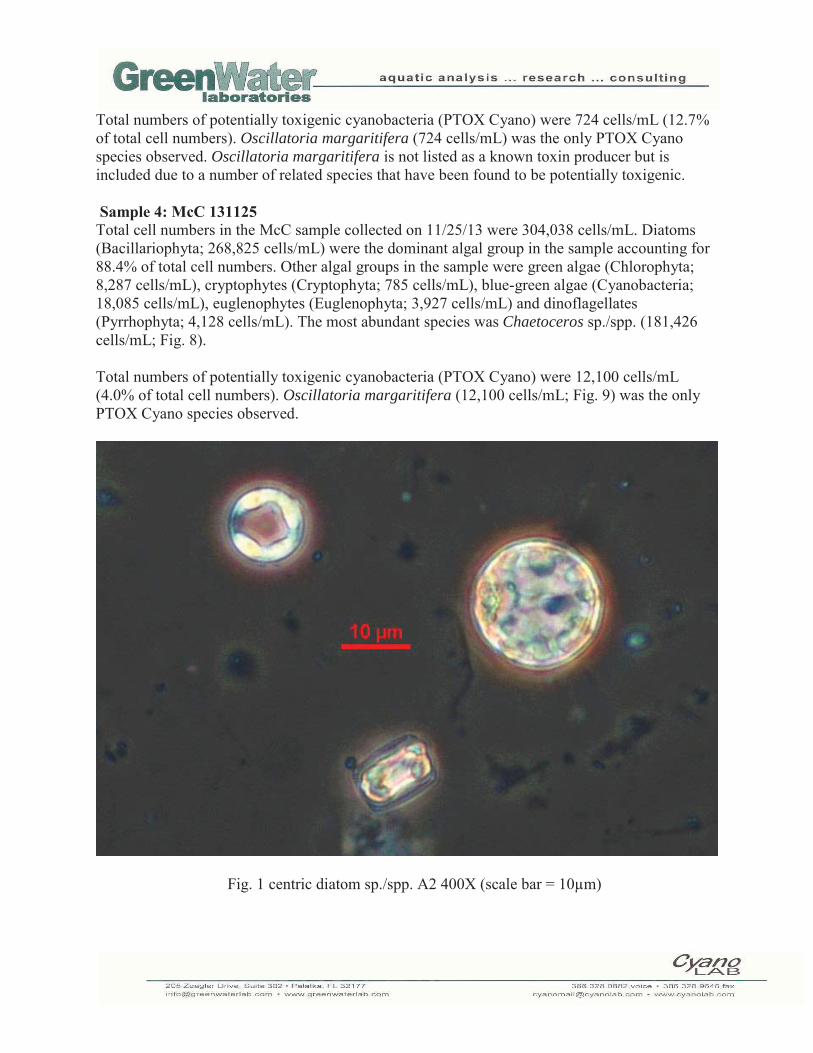
Total numbers of potentially toxigenic cyanobacteria (PTOX Cyano) were 724 cells/mL (12.7% of total cell numbers). Oscillatoria margaritifera (724 cells/mL) was the only PTOX Cyano species observed. Oscillatoria margaritifera is not listed as a known toxin producer but is included due to a number of related species that have been found to be potentially toxigenic. Sample 4: McC 131125 Total cell numbers in the McC sample collected on 11/25/13 were 304,038 cells/mL. Diatoms (Bacillariophyta; 268,825 cells/mL) were the dominant algal group in the sample accounting for 88.4% of total cell numbers. Other algal groups in the sample were green algae (Chlorophyta; 8,287 cells/mL), cryptophytes (Cryptophyta; 785 cells/mL), blue-green algae (Cyanobacteria; 18,085 cells/mL), euglenophytes (Euglenophyta; 3,927 cells/mL) and dinoflagellates (Pyrrhophyta; 4,128 cells/mL). The most abundant species was Chaetoceros sp./spp. (181,426 cells/mL; Fig. 8). Total numbers of potentially toxigenic cyanobacteria (PTOX Cyano) were 12,100 cells/mL (4.0% of total cell numbers). Oscillatoria margaritifera (12,100 cells/mL; Fig. 9) was the only PTOX Cyano species observed.
Fig. 1 centric diatom sp./spp. A2 400X (scale bar = 10μm)

Fig. 2 Cyclotella cf. meneghiniana A2 1000X (scale bar = 10μm)
Fig. 3 Scenedesmus opoliensis A2 400X (scale bar = 10μm)
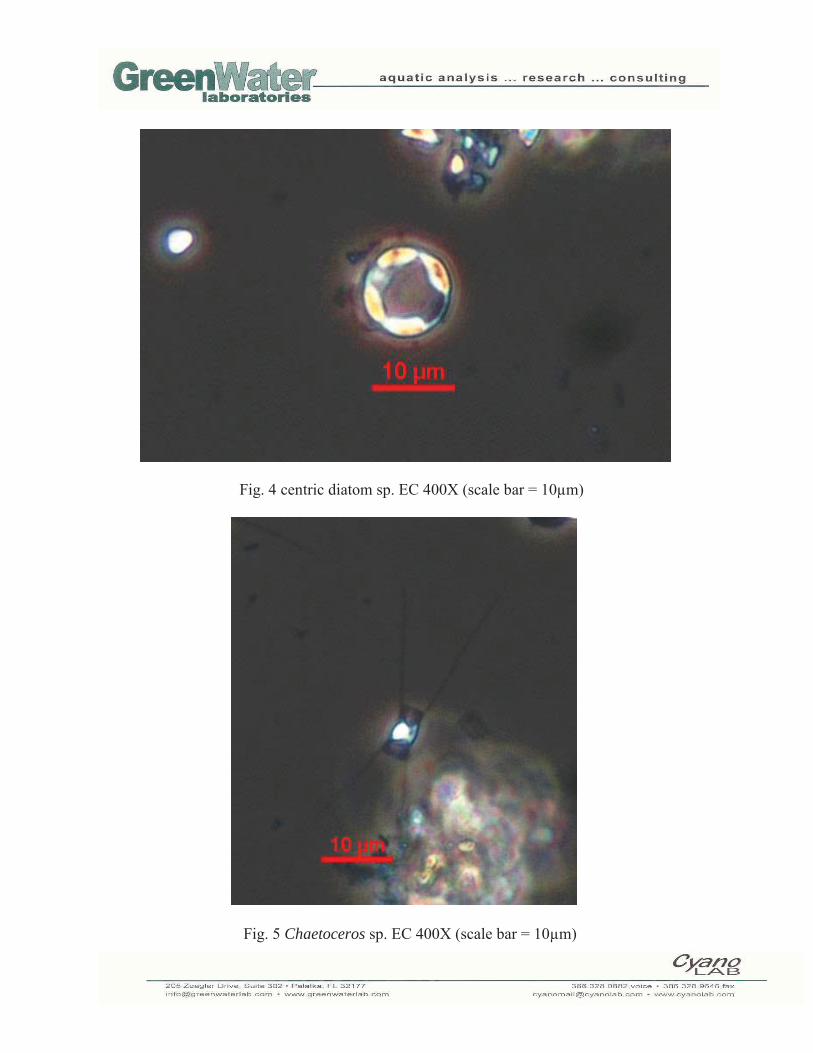
Fig. 4 centric diatom sp. EC 400X (scale bar = 10μm)
Fig. 5 Chaetoceros sp. EC 400X (scale bar = 10μm)

Fig. 6 Chaetoceros sp./spp. McB 400X (scale bar = 20μm)
Fig. 7 centric diatom sp. McB 400X (scale bar = 10μm)

Fig. 8 Chaetoceros sp./spp. McC 400X (scale bar = 10μm)
Fig. 9 Oscillatoria margaritifera McC 400X (scale bar = 20μm)

UC-Santa Cruz Algal Analysis Report Prepared: February 3, 2014 Prepared By: GreenWater Laboratories PO497839 Samples: 4 (Collected on 12/18/13) 1. A2 2. EC 3. McB 4. McC Sample 1: A2 131218 Total cell numbers in the A2 sample collected on 12/18/13 were 17,705 cells/mL. Diatoms (Bacillariophyta; 13,486 cells/mL) were the dominant algal group in the sample accounting for 76.2% of total cell numbers. Other algal groups in the sample were green algae (Chlorophyta; 3,933 cells/mL), cryptophytes (Cryptophyta; 52 cells/mL) and blue-green algae (Cyanobacteria; 233 cells/mL). The most abundant species were small centric diatoms (13,484 cells/mL; Fig. 1) including cf. Stephanodiscus sp. (Fig. 2) and Cyclotella cf. meneghiniana (Fig. 3). No potentially toxigenic cyanobacteria (PTOX Cyano) species were observed in the sample. Sample 2: EC 131218 Total cell numbers in the EC sample collected on 12/18/13 were 83,257 cells/mL. Diatoms (Bacillariophyta; 78,949 cells/mL) were the dominant algal group in the sample accounting for 94.8% of total cell numbers. Other algal groups in the sample were green algae (Chlorophyta; 1,114 cells/mL), cryptophytes (Cryptophyta; 157 cells/mL), blue-green algae (Cyanobacteria; 2,336 cells/mL), euglenophytes (Euglenophyta; 314 cells/mL) and dinoflagellates (Pyrrhophyta; 357 cells/mL). The most abundant species was a small centric diatom, most likely a species of Stephanodiscus (71,628 cells/mL; Figs. 4-5). Total numbers of potentially toxigenic cyanobacteria (PTOX Cyano) were 10 cells/mL (0.4% of total cell numbers). Phormidium sp. (10 cells/mL) was the only PTOX Cyano species observed. Sample 3: McB 131218 Total cell numbers in the McB sample collected on 12/18/13 were 185,997 cells/mL. Diatoms (Bacillariophyta; 181,647 cells/mL) were the dominant algal group in the sample accounting for 97.7% of total cell numbers. Other algal groups in the sample were green algae (Chlorophyta; 1,338 cells/mL), cryptophytes (Cryptophyta; 196 cells/mL), blue-green algae (Cyanobacteria; 1,030 cells/mL), euglenophytes (Euglenophyta; 393 cells/mL), unknown flagellates (Miscellaneous; 785 cells/mL) and dinoflagellates (Pyrrhophyta; 608 cells/mL). The most abundant species was a small centric diatom, most likely a species of Stephanodiscus (71,628 cells/mL; Fig. 6-7). Total numbers of potentially toxigenic cyanobacteria (PTOX Cyano) were 840 cells/mL (0.5% of total cell numbers). Oscillatoria margaritifera (840 cells/mL) was the only PTOX Cyano

species observed. Oscillatoria margaritifera is not listed as a known toxin producer but is included due to a number of related species that have been found to be potentially toxigenic. Sample 4: McC 131218 Total cell numbers in the McC sample collected on 12/18/13 were 327,848 cells/mL. Diatoms (Bacillariophyta; 311,217 cells/mL) were the dominant algal group in the sample accounting for 94.9% of total cell numbers. Other algal groups in the sample were green algae (Chlorophyta; 992 cells/mL), cryptophytes (Cryptophyta; 982 cells/mL), blue-green algae (Cyanobacteria; 1,890 cells/mL), euglenophytes (Euglenophyta; 6,872 cells/mL) and dinoflagellates (Pyrrhophyta; 5,895 cells/mL). The most abundant species was a small centric diatom, most likely a species of Stephanodiscus (286,668 cells/mL; Fig. 8-9). Total numbers of potentially toxigenic cyanobacteria (PTOX Cyano) were 1,890 cells/mL (0.6% of total cell numbers). Oscillatoria margaritifera (1,890 cells/mL) was the only PTOX Cyano species observed.
Fig. 1 centric diatom sp./spp. A2 400X (scale bar = 20μm)

Fig. 2 cf. Stephanodiscus sp. A2 1000X (scale bar = 5μm)
Fig. 3 Cyclotella cf. meneghiniana A2 1000X (scale bar = 5μm)

Fig. 4 cf. Stephanodiscus sp. EC 400X (scale bar = 10μm)
Fig. 5 cf. Stephanodiscus sp. EC 1000X (scale bar = 5μm)

Fig. 6 cf. Stephanodiscus sp. McB 400X (scale bar = 10μm)
Fig. 7 cf. Stephanodiscus sp. McB 1000X (scale bar = 5μm)

Fig. 8 cf. Stephanodiscus sp. McC 400X (scale bar = 10μm)
Fig. 9 cf. Stephanodiscus sp. McC 1000X (scale bar = 5μm)