understanding the wildfish harvesting business...
TRANSCRIPT

Understanding the wildfish
harvesting business
Webjørn Barstad CEO HAVFISK ASA

• The Global Picture – Supply side – Markets – From science to individual vessel quotas
• Norwegian fisheries and HAVFISK
• Outlook
Agenda HAVFISK ASA

The Global Picture Supply side

World capture production stable at «maximum potential»


The most important white fish species from the fisheries
3.543
1.050
1.216
345
280494
260
White fish catch -‐ 2015 E
Alaska Pollock
Hakes
Atlantic Cod
Haddock
Saithe
Pacific Cod
HokiSource: Kontali AnalyseSource: Kontali Analyse
(1000 tonnes)

Catch by nations and species (mt)
Alaska Pollock
Atlantic cod Hake Saithe Haddock SBW
Pacific cod Hoki TOTAL
Chile - - 40 000 - - 14 000 - 40 000 94 000 88 000
Argentine - - 270 000 - - 9 000 - 45 000 324 000 328 000
USA 1 405 000 - 250 000 8 000 3 000 - 330 000 - 1 996 000 1 984 000
Canada 10 000 18 000 50 000 5 000 8 000 - 5 000 - 96 000 88 000
Russia 1 670 000 448 000 2 000 1 000 77 000 - 80 000 - 2 278 000 2 212 000
Norway - 475 000 2 000 156 000 94 000 - - - 727 000 659 000
Iceland - 239 000 - 53 000 36 000 - - - 328 000 329 000
Faroe Islands - 17 000 - 17 000 3 000 - - - 37 000 51 000
EU - 160 000 68 000 54 000 50 000 - - - 332 000 318 000
Namibia - - 140 000 - - - - - 140 000 140 000
South Africa - - 150 000 - - - - - 150 000 145 000
Japan/S-Korea 280 000 - - - - 3 000 65 000 - 348 000 343 000
New Zealand - - - - - 35 000 - 150 000 185 000 195 000
Others - 10 000 96 000 14 000 1 000 2 000 2 000 4 000 129 000 118 000
Total 3 365 000 1 367 000 1 068 000 308 000 272 000 63 000 482 000 239 000 7 164 000 6 998 000
Source; National statistics/KA-Est.
NationCatch by nation and species 2014
E 2015

The Global Picture Markets
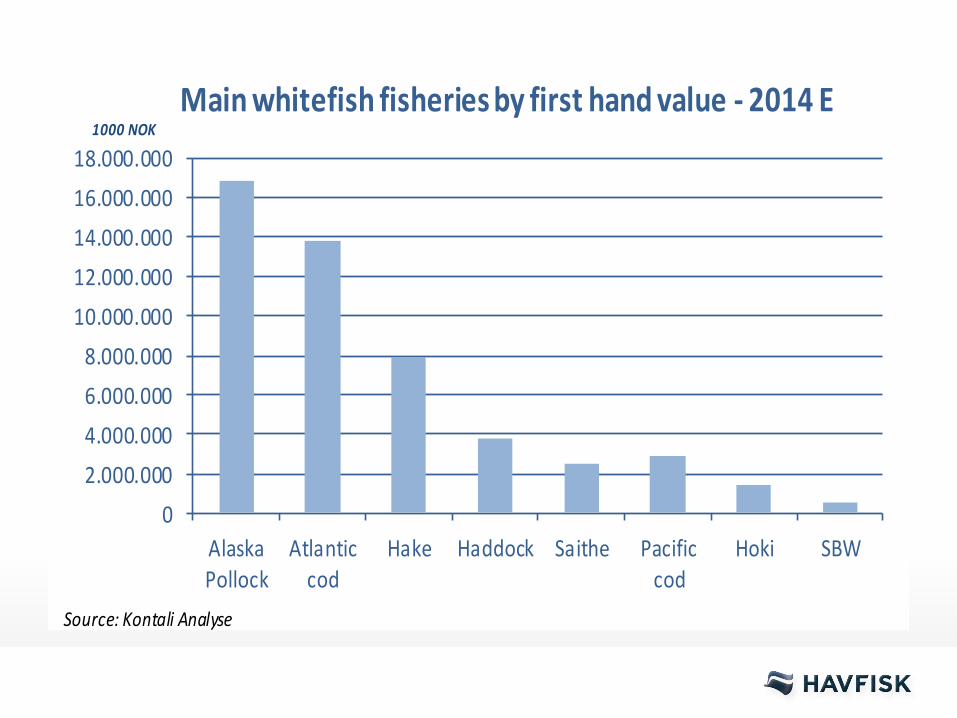
02.000.0004.000.0006.000.0008.000.000
10.000.00012.000.00014.000.00016.000.00018.000.000
AlaskaPollock
Atlanticcod
Hake Haddock Saithe Pacificcod
Hoki SBW
1000 NOKMain whitefish fisheries by first hand value -‐ 2014 E
Source: Kontali Analyse

The world market of whitefish
47 %
14 %12 %
9 %8 % 7 %
2 %
5 %
0 %
5 %
10 %
15 %
20 %
25 %
30 %
35 %
40 %
45 %
50 %
EU North America Asia Russia South America Japan Africa Others
Source: Kontali Analyse
The global volume of groundfish -‐ Where is it consumed? (2014 E)

White Fish Cod Alaska Pollock Haddock Saithe Hakes HokiTotal
Germany 547 70 411 3 23 36 4UK 474 250 101 86 15 20 2Spain 473 190 32 0 6 245 0France 359 60 183 13 26 55 22Scandinavia (SE, DK, FI) 245 134 26 23 40 10 12Poland 243 97 109 7 6 13 11Be/Ne/Lux 237 89 71 17 32 26 2Portugal 162 98 5 0 0 59 0Italy 158 44 30 0 0 84 0Others 115 45 57 3 5 3 2
3013 1077 1025 152 153 551 55
Top 3 Markets1 Germany UK Germany UK Scandinavia Spain France2 UK Spain France Scandinavia Be/Ne/Lux Italy Scandinavia3 Spain Scandinavia Poland Be/Ne/Lux France Portugal Poland
Source: Kontali Analyse
1000 tonnes R.W.
EU country split -‐ whitefish consumption 2014
Vessel quotas
From science to individual vessel quotas

• Annual quota advice from the relevant scientific institution – Interna<onal Council for the Explora<on of the Sea – Species by species scien<fic advice
• Problem: Fish don’t care about borders in the sea… • Solution: Agreement on total allowable catches (TAC)
and quota sharing between nations through annual bi- or multilateral negotiations – Based on scien<fic advice – End result: na<onal TACs for various species
How is the vessels quota decided?
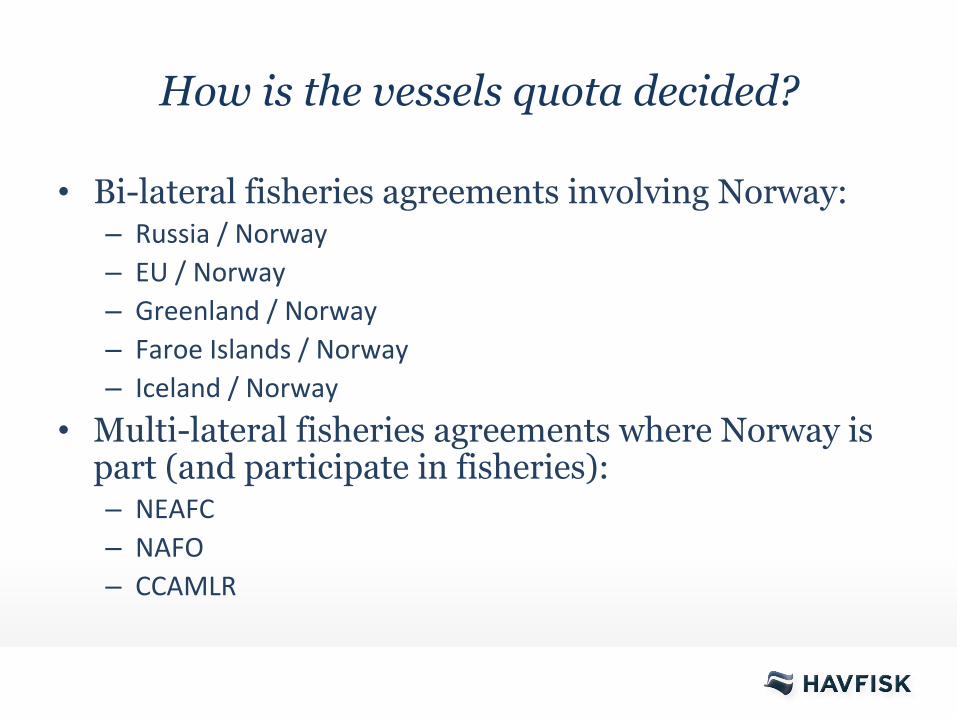
• Bi-lateral fisheries agreements involving Norway: – Russia / Norway – EU / Norway – Greenland / Norway – Faroe Islands / Norway – Iceland / Norway
• Multi-lateral fisheries agreements where Norway is part (and participate in fisheries): – NEAFC – NAFO – CCAMLR
How is the vessels quota decided?

National TAC from agreements - Allocations for science, political purposes etc = TAC available to commercial fishing fleet Divided between variety of vessel groups according to long term quotasharing agreement within the Norwegian Fishermens Association
-‐ Different agreed shares from species to species
How is the vessels quota decided?

How is the vessels quota decided?
• Trawler groups quota share (eg. Cod 33%) allocated with an equal quota size per individual vessel quota
• Total of ~88 individual vessel quotas in trawl group (Cod)
• One vessel can hold up to 4 quotas

Norwegian fisheries and HAVFISK

Ocean area > 6 x land area

• World fishing nation no. 10 by volume (largest in Europe)
• World fishing nation no. 2 by export value
• The worlds largest Cod stock
• EU 31 mt pr fisherman • Norway 255 mt pr
fisherman
Positioned for profitability
Modern, efficient, well managed, sustainable Norway as a fishing nation
20
40
60
80
100
120
140
1980 1985 1990 1995 2000 2005 2010 2014
Vessels
Number of cod trawl vessels Norway 1980-‐2014
Source: Fiskeridirektoratet

• Norway’s largest harvesting company and quota holder – 11% of the Norwegian whitefish quota (cod, saithe, haddock)
– 7 Barents Sea shrimp licenses + 1 Greenland
• 10 operational trawlers – Three new vessels delivered in 2013 and 2014
Key facts Company overview

Norwegian fishing companies The 35 largest fishing companies in 2014 (gross catch value in mill. NOK)
MNOK

• 390 employees • Ownership to fish
industry facilities in northern Norway
• Facilities are operated by sister company Norway Seafoods
• Listed on Oslo Stock Exchange
• Aker ASA 73,25 %
Key facts Company overview

Year 2014 • Operating Revenues:
1 049 MNOK • EBITDA: 299 MNOK
(28 %) • EBITDA per kilo: 5,0 NOK • Equity ratio: 35 % • Volume 2014: 59 295 mt (~83 000 mt live weight)
Q2- 2015 Operating Revenues: 257 MNOK EBITDA: 84 MNOK (34 %) EBITDA per kilo: 6,1 NOK Equity ratio: 36,2 % Q3 figures – 6 November
Results 2014 & Q2 2015 Financials

Key value drivers HFISK

• Strong supply growth and financial downturn in key markets have negative impact on cod prices.
• Cod-prices appears to have bottomed out in Q1/2013
Export prices for frozen cod h/g in NOK. Source: Norwegian Seafood Council
Historic price trend - Cod Value drivers

Cost breakdown (based on 2014 figures) Value drivers
28
100
150
200
250
50
Dri
vers
Cost per day in operation Fixed cost : yearly maintenance in ship yards
Cost
615732
159101
316
Personnel
10% 31%
Freight/ packaging
Maintenance
6% 3%
Fuel
6%
Fishing gear
16%
Administration
Cost (MNOK) % of revenue
Percentage of catch value Cost per kilo
Cost per day in operation Average consumption for a freezing trawlers = 10 000 litres/day
Cost per day in operation Average of NOK/day 10 000
Fixed cost Overhead cost, administration, insurance
Low fixed sum per day Main personnel cost is in % of catch value

• Significant increase in catch efficiency – Change in fleet – Availability of fish
• New vessels: – improvement in catch efficiency
– flexibility to par<cipate in alterna<ve fisheries
Catch efficiency Value drivers
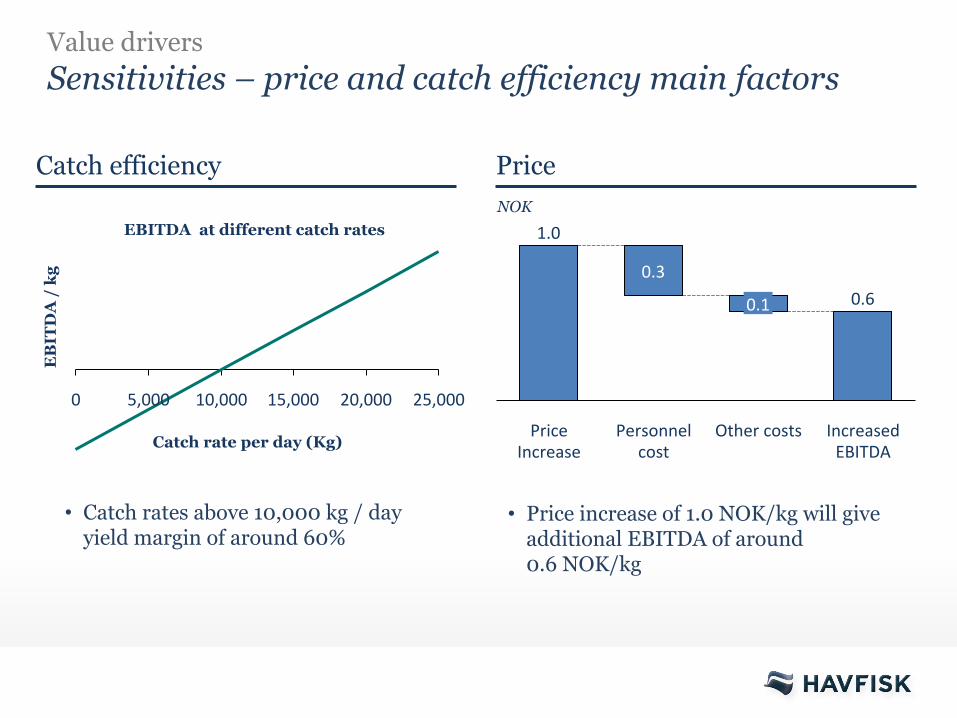
Sensitivities – price and catch efficiency main factors Value drivers
5,000 10,000 15,000 20,000 25,000 0
Catch efficiency Price
Catch rate per day (Kg)
• Catch rates above 10,000 kg / day yield margin of around 60%
Personnel cost
Price Increase
Other costs
1.0
0.3
0.1
Increased EBITDA
0.6
• Price increase of 1.0 NOK/kg will give additional EBITDA of around 0.6 NOK/kg
EB
ITD
A /
kg
NOK EBITDA at different catch rates
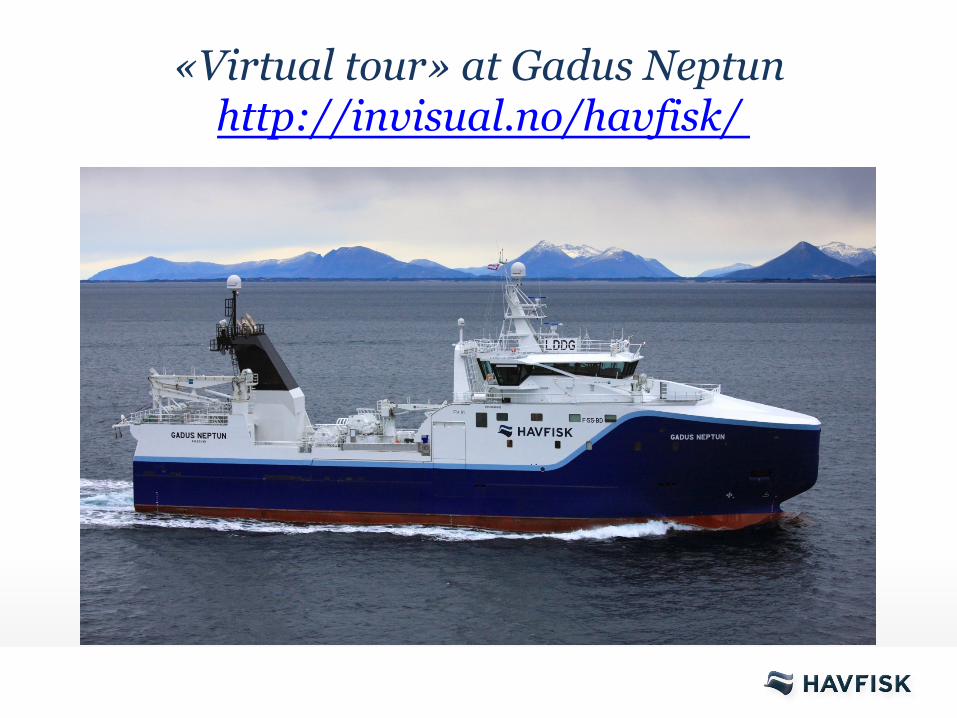
«Virtual tour» at Gadus Neptun http://invisual.no/havfisk/

Outlook HFISK

§ Quotas 2016 § Cod -‐ same level as in 2015 § Haddock + 9 % § Saithe + 7 %
§ Q3 presenta<on – 6 November 2015 9 am § Hotel Con<nental – Oslo
§ Industry Handbook § www.havfisk.no/investor rela<ons/reports and presenta<ons
Outlook HAVFISK

• Health, convenience, environment and ethics – Fish is an important source of
protein, vitamins and minerals – The Norwegian fishing for cod,
haddock and saithe is certified by MSC standard for sustainable fisheries
– Fish is an environmentally friendly source of protein
• Growing focus on fish in retail – customer demands drives convenience
Long term mega trends Outlook
Aker Seafoods invests in the future!
Source: Prof Ray Hilborn, University of Washington

• The Food Gap Challenge towards 2050
Long term mega trends Outlook
69% increase in food
production will be necessary
The world needs more
seafood - less than 10 percent of food consumption is
sea-based
HAVFISK – ca 200 mill meals per year
Disclaimer
This Presenta<on includes and is based, inter alia, on forward-‐looking informa<on and statements that are subject to risks and uncertain<es that could cause actual results to differ. These statements and this Presenta<on are based on current expecta<ons, es<mates and projec<ons about global economic condi<ons, the economic condi<ons of the regions and industries that are major markets for HAVFISK ASA including subsidiaries and affiliates. These expecta<ons, es<mates and projec<ons are generally iden<fiable by statements containing words such as ”expects”, ”believes”, ”es<mates” or similar expressions. Important factors that could cause actual results to differ materially from those expecta<ons include, among others, economic and market condi<ons in the geographic areas and industries that are or will be major markets for HAVFISK`s businesses, fish prices, market acceptance of new products and services, changes in governmental regula<ons, interest rates, fluctua<ons in currency exchange rates and such other factors as may be discussed from <me to <me in the Presenta<on. Although HAVFISK ASA believes that its expecta<ons and the Presenta<on are based upon reasonable assump<ons, it can give no assurance that those expecta<ons will be achieved or that the actual results will be as set out in the Presenta<on. HAVFISK ASA is making no representa<on or warranty, expressed or implied, as to the accuracy, reliability or completeness of the Presenta<on, and neither HAVFISK ASA nor any of its directors, officers or employees will have any liability to you or any other persons resul<ng from your use.