unified modeling, simulation, and market implications ... · this project improves the method for....
TRANSCRIPT

NREL is a national laboratory of the U.S. Department of Energy, Office of Energy Efficiency and Renewable Energy, operated by the Alliance for Sustainable Energy, LLC.
Unified Modeling, Simulation, and Market Implications: FASTSim and ADOPT
P.I.: Aaron BrookerNational Renewable Energy LaboratoryJune 11, 2015
Project ID # VAN004
This presentation does not contain any proprietary, confidential, or otherwise restricted information.

2
Overview
• Project start date: Oct. 2013• Project end date: Sept. 2015• Percent complete: 75%
• Barriers addressed: Manyo Assess the impact that DOE
vehicle technology targets have on DOE end goals
• Total project funding: $285Ko DOE share: 100%
• Funding received in FY14: $150K• Funding for FY15: $135K
Timeline
Budget
Barriers
• Interactions/collaborationso GM, Ford, Chryslero EIA, ORNL, ANL, SNLo SRA International, TA Engineeringo UC – Davis
• Project lead: NREL
Partners
ANL: Argonne National LaboratoryGM: General MotorsEIA: U.S. Energy Information AdministrationNREL: National Renewable Energy Laboratory
ORNL: Oak Ridge National LaboratorySNL: Sandia National LaboratoriesUC: University of California

3
Relevance\Objective
VTO Goals (http://www1.eere.energy.gov/vehiclesandfuels/about/fcvt_mission.html):
Reduce dependence on foreign oil and GHG emissions
RelevanceThis project improves the method forestimating how VTO R&D impacts overallVTO goals.
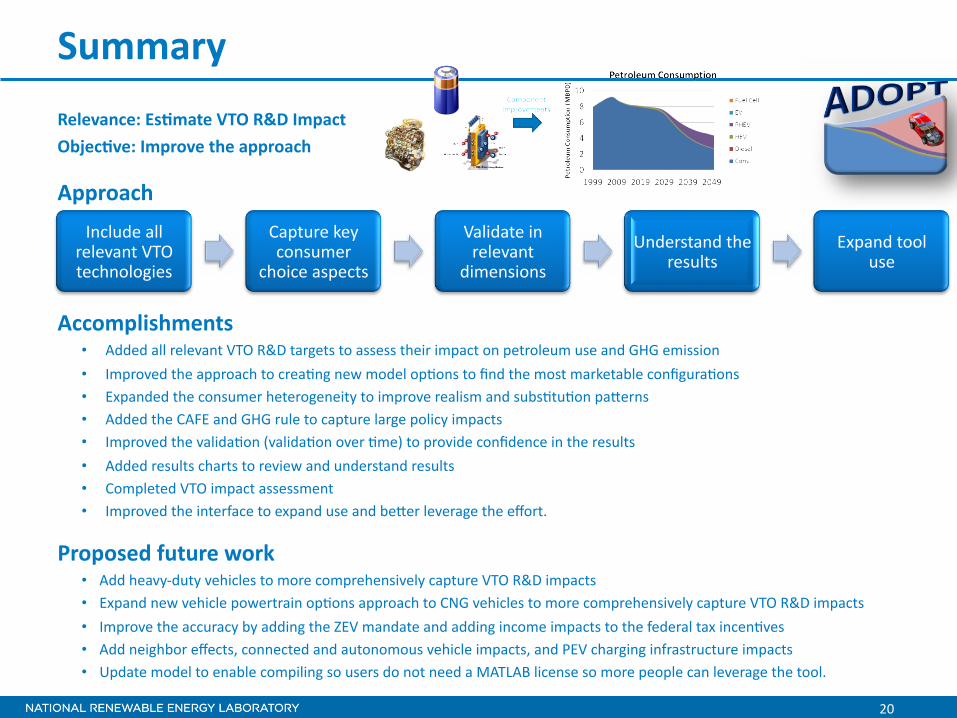
Objective: Improve comprehensiveness, accuracy, comprehension, and use• Add all relevant VTO R&D targets to assess their impact on petroleum use and GHG emission• Improve approach to creating new model options to find the most marketable configurations• Expand consumer heterogeneity to improve realism and substitution patterns• Add CAFE and GHG rule to capture large policy impacts• Improve validation (validation over time) to provide confidence in the results• Add results chart to review and understand results• Complete VTO impact assessment• Improve interface to expand use and better leverage the effort.
GHG: greenhouse gasMBPD: million barrels per dayVTO: Vehicle Technologies Office

4
MilestonesMonth / Year
Milestone or Go/No-Go Decision
Description Status
Dec. 2014 Quarterlyupdate
• Expanded to capture the CAFE/GHG rulingimplications for alternative fuels
• Added region-based data for United States downto ZIP Code level to more accurately capture fuelprices, income distributions, and incentives
• Improved alignment with AEO assumptions forbetter comparisons
• Published papers on ADOPT and FASTSim.
Complete
March 2015
Quarterly update
• Added fuel cell vehicles• Added remaining DOE research and development
(R&D) technologies• Added powertrain component size evolution for
all powertrains• Completed analysis estimating petroleum and
GHG emission impacts of expected DOE R&Dtechnology improvements.
Complete
June 2015 Quarterly update
• Complete CAFE and GHG ruling relatedenhancements
• Complete region-based framework.
Sept. 2015
Milestoneand paper
• Complete and publish report on petroleum andGHG emission impacts.
ADOPT: Automotive Deployment Options Projection ToolAEO: Annual Energy Outlook
CAFE: Corporate Average Fuel EconomyFASTSim: Future Automotive Systems Technology Simulator

Q%
;662)07Q9';=>?<'>N%2N#%D'
Income distribution
Fuel prices
Vehicle attributes
Fueling station availability D2+/+%-0%U&>2(3,%D3)3V;%!"#$%OkMIl%
D2+/+%-0%Y3&/2%m&8_3;%!"#$%OQkXl%
Policy (CAFE)
Technology Improvements
Weighting (logit) Function
6
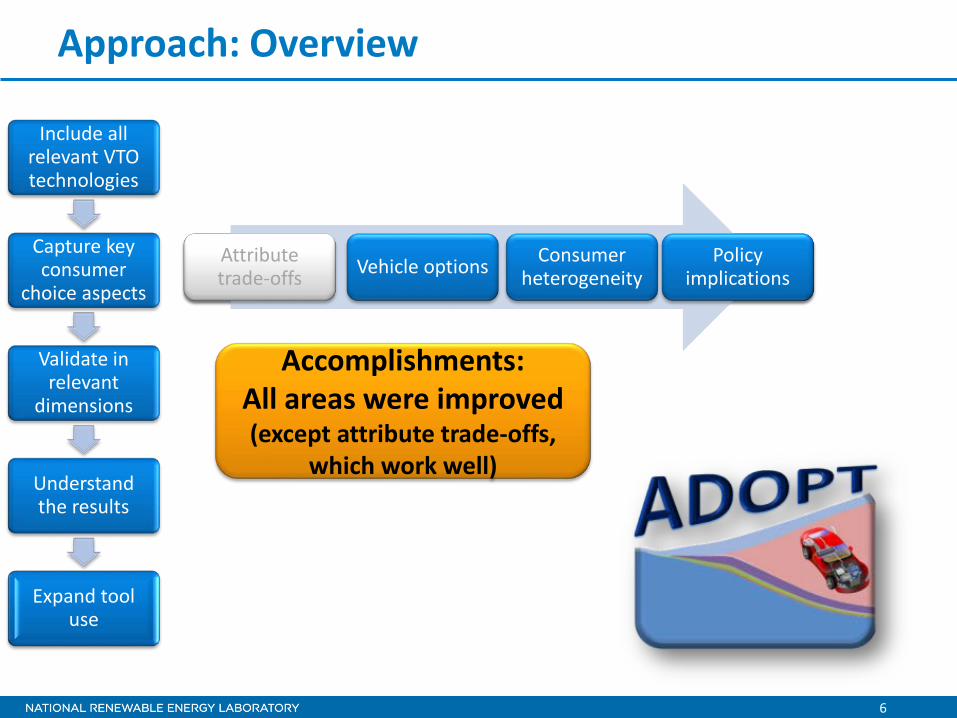
Approach: Overview
Attribute trade-offs Vehicle options Consumer
heterogeneityPolicy
Implications
Include all relevant VTO technologies
Capture key consumer
choice aspects
Validate in relevant
dimensions
Understand the results
Expand tool use
Accomplishments:All areas were improved (except attribute trade-offs,
which work well)
Attribute trade-offs Vehicle options Consumer
heterogeneityPolicy
implications
7
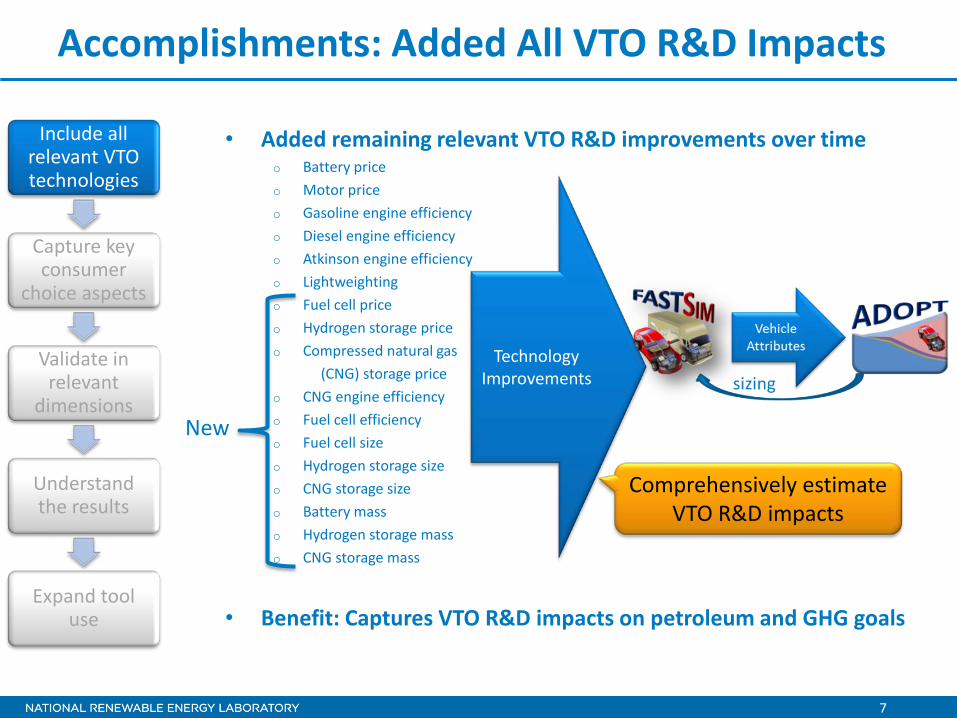
Accomplishments: Added All VTO R&D Impacts
• Added remaining relevant VTO R&D improvements over timeo Battery priceo Motor priceo Gasoline engine efficiencyo Diesel engine efficiencyo Atkinson engine efficiencyo Lightweightingo Fuel cell priceo Hydrogen storage priceo Compressed natural gas
(CNG) storage priceo CNG engine efficiencyo Fuel cell efficiencyo Fuel cell sizeo Hydrogen storage sizeo CNG storage sizeo Battery masso Hydrogen storage masso CNG storage mass
• Benefit: Captures VTO R&D impacts on petroleum and GHG goals
TechnologyImprovements
Include all relevant VTO technologies
Capture key consumer
choice aspects
Validate in relevant
dimensions
Understand the results
Expand tool use
Comprehensively estimate VTO R&D impacts
New
8
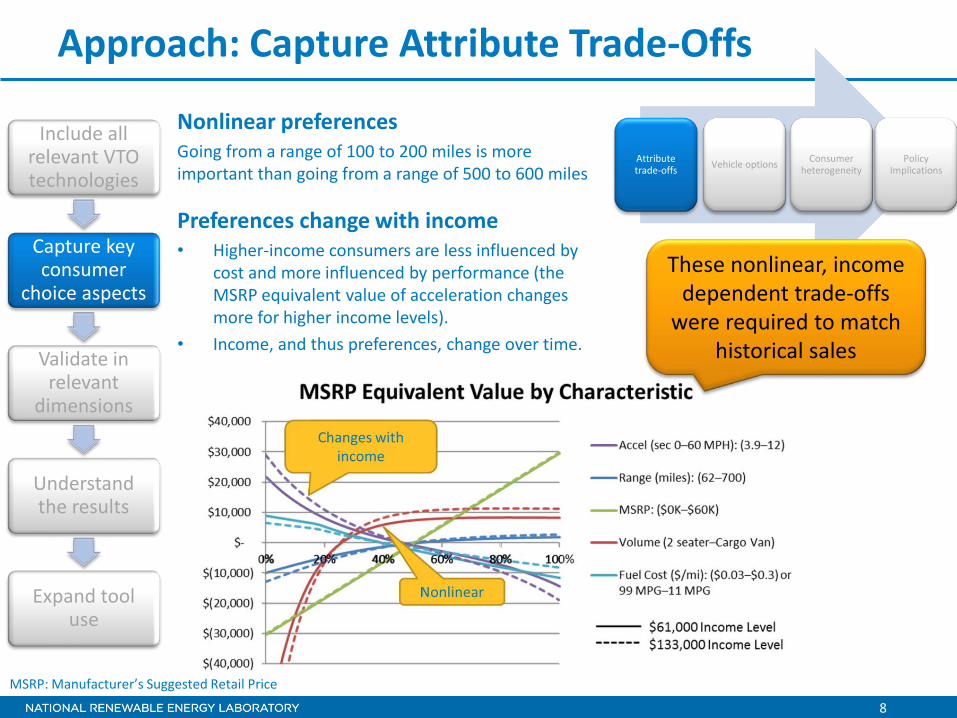
Approach: Capture Attribute Trade-Offs
Nonlinear preferencesGoing from a range of 100 to 200 miles is more important than going from a range of 500 to 600 miles
Preferences change with income• Higher-income consumers are less influenced by
cost and more influenced by performance (the MSRP equivalent value of acceleration changes more for higher income levels).
• Income, and thus preferences, change over time.
MSRP: Manufacturer’s Suggested Retail Price
Attribute trade-offs Vehicle options Consumer
heterogeneityPolicy
Implications
These nonlinear, income dependent trade-offs
were required to match historical sales
Include all relevant VTO technologies
Capture key consumer
choice aspects
Validate in relevant
dimensions
Understand the results
Expand tool use
k%
;77).6*#8Q.%"489'5.62)N%&'4Q%'5"42)&/71)"')V'B%D'_%Q#7*%'>61)"8'
ZZHN%o3f%1B3,%V32&>,3%
Aa.&-B/3%/.(?3j+g'%
H32&>,3%+8*+)'% C+)'B93.%23/3.+:3)3&/0%
D+,&>0%F98,&>(*+)'%
F)>,B?3%(,,%.3,3V()/%HK<%/3>2)+,+:&3'%
C(8/B.3%_30%>+)'B93.%
>2+&>3%('83>/'%
H(,&?(/3%&)%.3,3V()/%
?&93)'&+)'%
4)?3.'/()?%/23%.3'B,/'%
#f8()?%/++,%B'3%
!3@%<8*+)'%
Aa.&-B/3'%
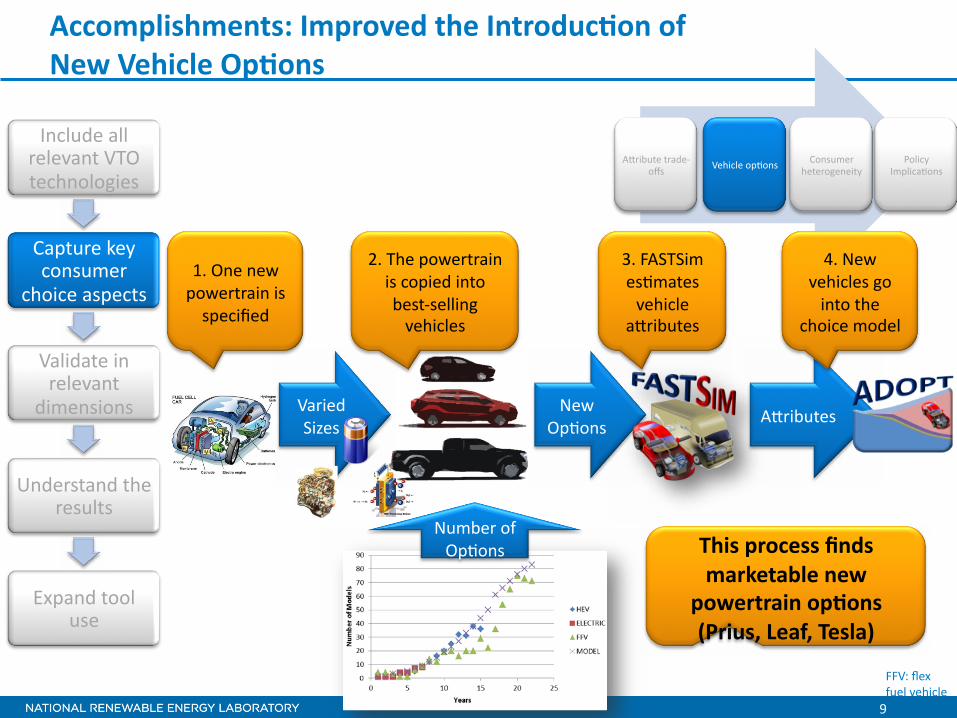
O5%<)3%)3@%8+@3./.(&)%&'%
'83>&L3?%
H(.&3?%6&n3'%
M5%K23%8+@3./.(&)%&'%>+8&3?%&)/+%-3'/j'3,,&):%
V32&>,3'%
P5%ZA6K6&9%3'*9(/3'%V32&>,3%
(a.&-B/3'%
J5%!3@%V32&>,3'%:+%
&)/+%/23%>2+&>3%9+?3,%
<Q#8'62)7%88'$"&8'.023%40E*%'"%D'
6)D%2420#"')61)"8'Z?2#/8,'H%0V,'<%8*0^'
!B9-3.%+1%<8*+)'%
10
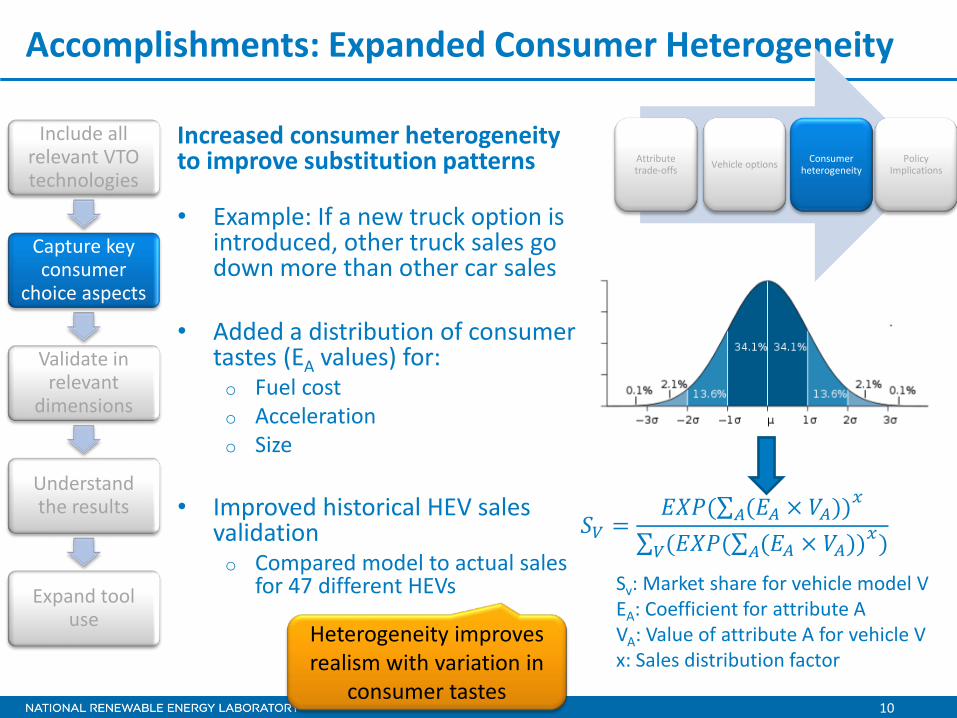
Accomplishments: Expanded Consumer Heterogeneity
Increased consumer heterogeneity to improve substitution patterns
• Example: If a new truck option is introduced, other truck sales go down more than other car sales
• Added a distribution of consumer tastes (EA values) for:o Fuel costo Accelerationo Size
• Improved historical HEV sales validationo Compared model to actual sales
for 47 different HEVs
𝑆𝑆𝑉𝑉 =𝐸𝐸𝐸𝐸𝐸𝐸(∑𝐴𝐴(𝐸𝐸𝐴𝐴 × 𝑉𝑉𝐴𝐴))𝑥𝑥
∑𝑉𝑉(𝐸𝐸𝐸𝐸𝐸𝐸(∑𝐴𝐴(𝐸𝐸𝐴𝐴 × 𝑉𝑉𝐴𝐴))𝑥𝑥)Sv: Market share for vehicle model VEA: Coefficient for attribute AVA: Value of attribute A for vehicle V x: Sales distribution factor
Attribute trade-offs Vehicle options Consumer
heterogeneityPolicy
Implications
Include all relevant VTO technologies
Capture key consumer
choice aspects
Validate in relevant
dimensions
Understand the results
Expand tool use
Heterogeneity improves realism with variation in
consumer tastes

11
Accomplishments: Added CAFE and GHG Ruling Policy Implications
• CAFE and GHG rule implicationso New vehicle fuel economy is
driven by CAFEo CAFE is increasing sharplyo Major impact on vehicle options
and sales.
• Added data for CAFE and GHG rulingo CAFE is based on vehicle
footprint—added data to all vehicles
o Added regulation-based GHGs by fuel.
• Added techniques to help meet the CAFE and GHG ruling based on current and past trendso Technology improvementso Engine downsizing: Reduces fuel
economy, cost, and accelerationo Incentives/penalties (iterates
until the totals balance each year).
Attribute trade-offs Vehicle options Consumer
heterogeneityPolicy
Implications
Include all relevant VTO technologies
Capture key consumer
choice aspects
Validate in relevant
dimensions
Understand the results
Expand tool use
Important to capture because of the large increase

12
Approach: Validate in Relevant Dimensions
2012 U.S. Sales (matches similarly for 10 other years/regions)
Include all relevant VTO technologies
Capture key consumer
choice aspects
Validate in relevant
dimensions
Understand the results
Expand tool use
Validating for a given set of vehicles provides confidence in
attribute trade-offs
13
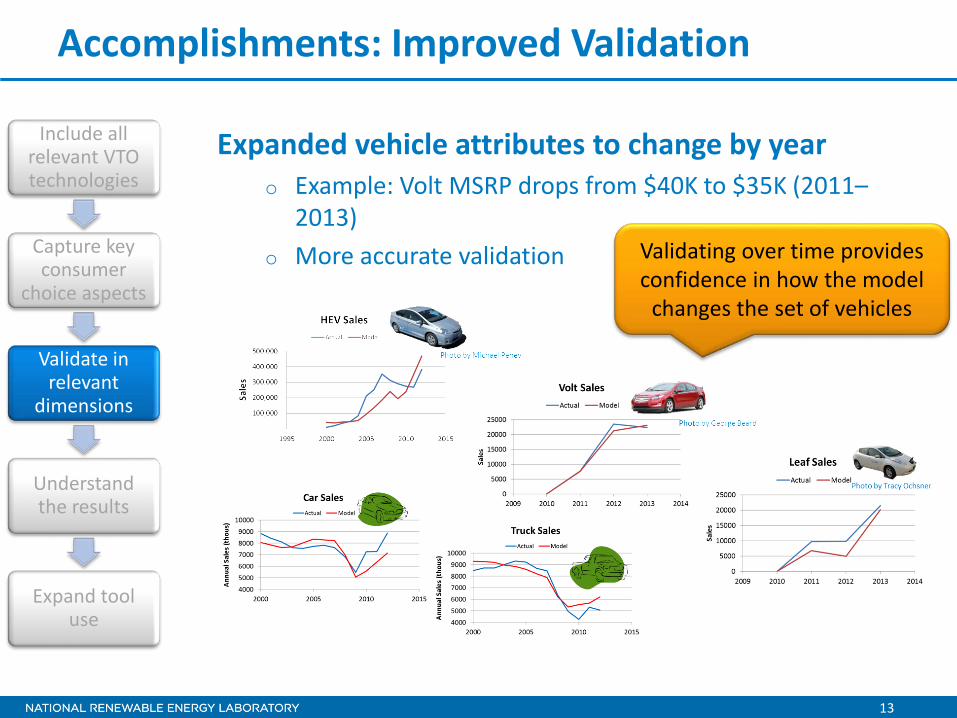
Accomplishments: Improved Validation
Expanded vehicle attributes to change by yearo Example: Volt MSRP drops from $40K to $35K (2011–
2013)o More accurate validation
Include all relevant VTO technologies
Capture key consumer
choice aspects
Validate in relevant
dimensions
Understand the results
Expand tool use
Validating over time provides confidence in how the model
changes the set of vehicles

14
Accomplishments: Completed VTO Impact Analysis andImproved Interface for Understanding the Results
Scenario comparisons
35 Chart Choices
Include all relevant VTO technologies
Capture key consumer
choice aspects
Validate in relevant
dimensions
Understand the results
Expand tool use
Viewing and comparing a wide variety of results help with
understanding them and having confidence in them
15
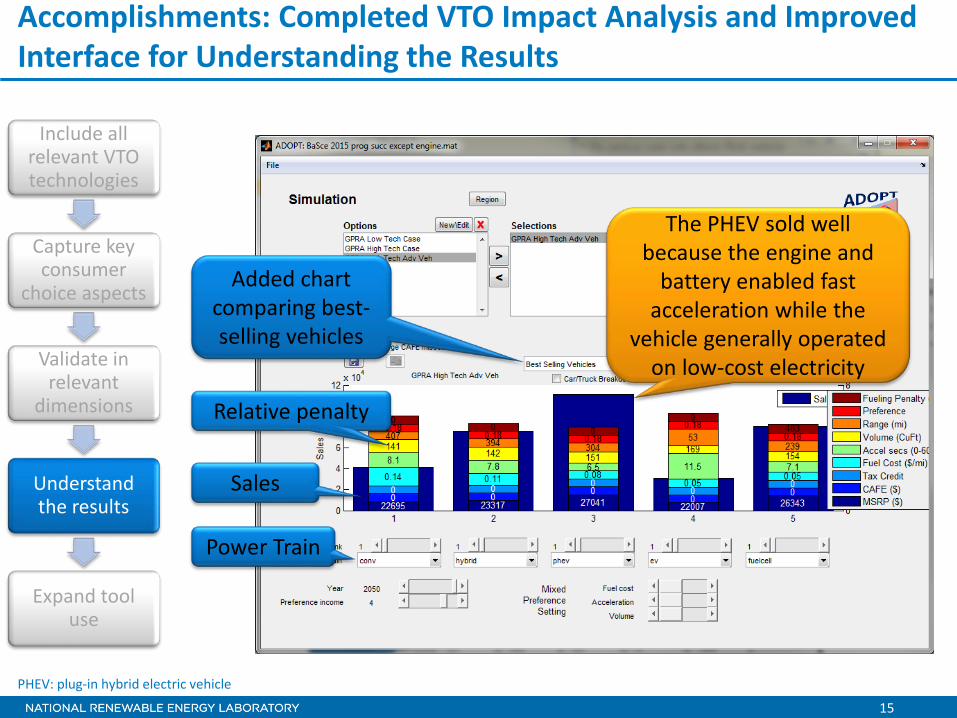
Accomplishments: Completed VTO Impact Analysis and Improved Interface for Understanding the Results
Added chart comparing best-selling vehicles
Relative penalty
Sales
Power Train
The PHEV sold well because the engine and
battery enabled fast acceleration while the
vehicle generally operated on low-cost electricity
PHEV: plug-in hybrid electric vehicle
Include all relevant VTO technologies
Capture key consumer
choice aspects
Validate in relevant
dimensions
Understand the results
Expand tool use

16
Accomplishments: Improved Interface to Expand Use
Improved interface to
expand tool use
Include all relevant VTO technologies
Capture key consumer
choice aspects
Validate in relevant
dimensions
Understand the results
Expand tool use
17
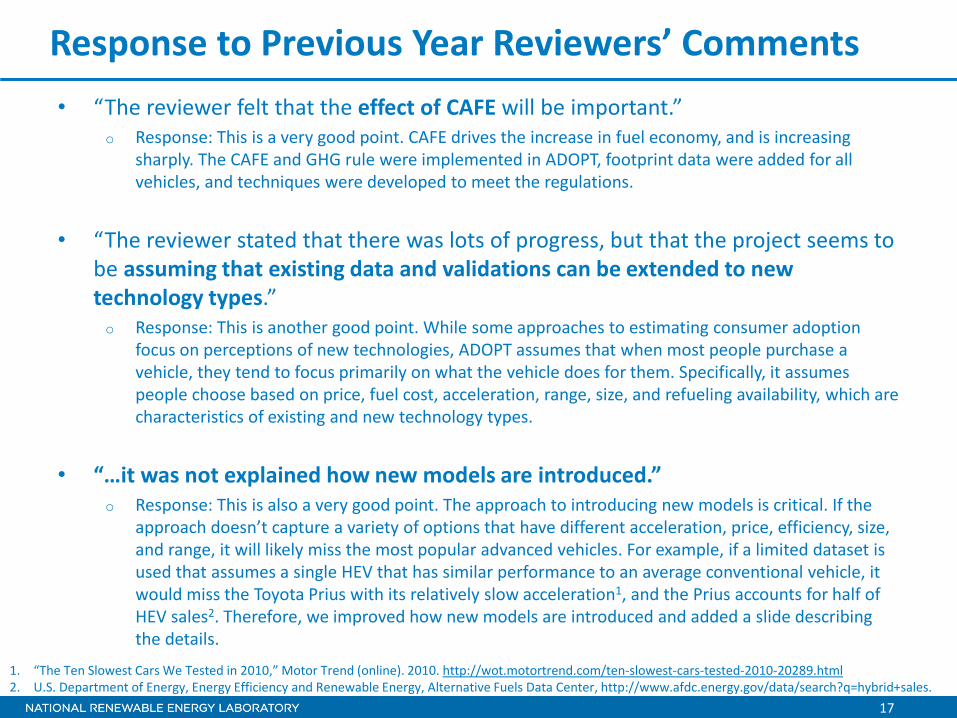
Response to Previous Year Reviewers’ Comments• “The reviewer felt that the effect of CAFE will be important.”
o Response: This is a very good point. CAFE drives the increase in fuel economy, and is increasing sharply. The CAFE and GHG rule were implemented in ADOPT, footprint data were added for all vehicles, and techniques were developed to meet the regulations.
• “The reviewer stated that there was lots of progress, but that the project seems to be assuming that existing data and validations can be extended to new technology types.”o Response: This is another good point. While some approaches to estimating consumer adoption
focus on perceptions of new technologies, ADOPT assumes that when most people purchase a vehicle, they tend to focus primarily on what the vehicle does for them. Specifically, it assumes people choose based on price, fuel cost, acceleration, range, size, and refueling availability, which are characteristics of existing and new technology types.
• “…it was not explained how new models are introduced.”o Response: This is also a very good point. The approach to introducing new models is critical. If the
approach doesn’t capture a variety of options that have different acceleration, price, efficiency, size, and range, it will likely miss the most popular advanced vehicles. For example, if a limited dataset is used that assumes a single HEV that has similar performance to an average conventional vehicle, it would miss the Toyota Prius with its relatively slow acceleration1, and the Prius accounts for half of HEV sales2. Therefore, we improved how new models are introduced and added a slide describing the details.
1. “The Ten Slowest Cars We Tested in 2010,” Motor Trend (online). 2010. http://wot.motortrend.com/ten-slowest-cars-tested-2010-20289.html2. U.S. Department of Energy, Energy Efficiency and Renewable Energy, Alternative Fuels Data Center, http://www.afdc.energy.gov/data/search?q=hybrid+sales.

18
Collaboration and Coordination• Received input and feedback from:
o Industry– Chrysler– Ford– GM
o Government– ANL– EIA– ORNL
o UC – Davis
• Worked with ANL to compare approach and results witho MA3T (ORNL)o LVChoice (Energetics)o LAVE_Trans (ORNL)
• Obtained data from:o PA Consulting Groupo Polko SRA International (Sentech)
Led to improvements in substitution patterns (expanded heterogeneity)
Improved confidence in the model from the positive feedback
Improved understanding of results
Expanded error checking
Expanded validation and confidence

19
Challenges/Proposed Future Work
• Doesn’t capture the impacts that VTO R&D has on heavy-duty vehicleso Proposing to integrate an approach to capturing heavy-duty vehicles
• New CNG vehicle options are not being createdo Fully integrate CNG vehicles
• Needs more flexibility to simulate different regions (incentives, fuel prices, income distributionso Completing in FY15
• Does not account for impacts of the ZEV mandateo Proposing for FY16
• Allows all consumers to benefit from tax incentives when actual incentives depend on income o Proposing for FY16
• Doesn’t capture neighbor effects, connected and autonomous vehicles, or PEV charging infrastructure impactso Proposing for FY16
• Model requires MATLAB license, which limits distribution and useo Modify to enable MATLAB compilation
Improve Comprehensiveness
Improve Accuracy
Expand use
MI%
-/..02G'
C%*%N0"7%9'F81.04%'_<>'C`='5.6074'
>EP%71N%9'5.62)N%'4Q%'0662)07Q'
;662)07Q'
;77).6*#8Q.%"48'•! A??3?%(,,%.3,3V()/%HK<%"e7%/(.:3/'%/+%(''3''%/23&.%&98(>/%+)%83/.+,3B9%B'3%()?%]d]%39&''&+)%
•! F98.+V3?%/23%(88.+(>2%/+%>.3(*):%)3@%9+?3,%+8*+)'%/+%L)?%/23%9+'/%9(._3/(-,3%>+)L:B.(*+)'%•! #f8()?3?%/23%>+)'B93.%23/3.+:3)3&/0%/+%&98.+V3%.3(,&'9%()?%'B-'*/B*+)%8(a3.)'%•! A??3?%/23%CAZ#%()?%]d]%.B,3%/+%>(8/B.3%,(.:3%8+,&>0%&98(>/'%•! F98.+V3?%/23%V(,&?(*+)%`V(,&?(*+)%+V3.%*93c%/+%8.+V&?3%>+)L?3)>3%&)%/23%.3'B,/'%
•! A??3?%.3'B,/'%>2(./'%/+%.3V&3@%()?%B)?3.'/()?%.3'B,/'%•! C+98,3/3?%HK<%&98(>/%(''3''93)/%•! F98.+V3?%/23%&)/3.1(>3%/+%3f8()?%B'3%()?%-3a3.%,3V3.(:3%/23%3g+./5%
?2)6)8%&'V/4/2%'D)23'•! A??%23(V0j?B/0%V32&>,3'%/+%9+.3%>+98.323)'&V3,0%>(8/B.3%HK<%"e7%&98(>/'%•! #f8()?%)3@%V32&>,3%8+@3./.(&)%+8*+)'%(88.+(>2%/+%C!]%V32&>,3'%/+%9+.3%>+98.323)'&V3,0%>(8/B.3%HK<%"e7%&98(>/'%
•! F98.+V3%/23%(>>B.(>0%-0%(??&):%/23%x#H%9()?(/3%()?%(??&):%&)>+93%&98(>/'%/+%/23%13?3.(,%/(f%&)>3)*V3'%•! A??%)3&:2-+.%3g3>/';%>+))3>/3?%()?%(B/+)+9+B'%V32&>,3%&98(>/';%()?%D#H%>2(.:&):%&)1.('/.B>/B.3%&98(>/'%•! 48?(/3%9+?3,%/+%3)(-,3%>+98&,&):%'+%B'3.'%?+%)+/%)33?%(%UAK$AT%,&>3)'3%'+%9+.3%83+8,3%>()%,3V3.(:3%/23%/++,5%
F)>,B?3%(,,%.3,3V()/%HK<%/3>2)+,+:&3'%
C(8/B.3%_30%>+)'B93.%
>2+&>3%('83>/'%
H(,&?(/3%&)%.3,3V()/%
?&93)'&+)'%
4)?3.'/()?%/23%.3'B,/'%
#f8()?%/++,%B'3%

Technical Back-Up Slides

22
Choice Model: Validation
2008 U.S. Sales

23
Choice Model: Validation
2008: 90004 (Los Angeles, CA)

24
Choice Model: Validation
2012 U.S. SalesModel matches who is purchasing hybrids

25
FASTSim Fuel Economy Validation
010203040506070
Fuel
Econ
omy
(MPG
)
UDDS Validation
Actual
Model
010203040506070
Fuel
Econ
omy
(MPG
)
Highway Validation
Actual
Model
0.010.020.030.040.050.060.070.0
Fuel
Econ
omy
(MPG
)
Fuel Economy Validation
Actual
Model
UDDS: Urban Dynamometer Driving Schedule

26
0
0.05
0.1
0.15
0.2
0.25
0.3
Tesla Roadster MINI E
55 M
PH k
Wh/
mile
Const 55 MPH Validation
Actual
Model
FASTSim EV Efficiency Validation
0
0.05
0.1
0.15
0.2
0.25
0.3
1999 EV1 Tesla Roadster
60 M
PH k
Wh/
mile
Const 60 MPH Validation
Actual
Model
0
0.05
0.1
0.15
0.2
0.25
0.3
Tesla Roadster MINI E65
MPH
kW
h/m
ile
Const 65 MPH Validation
Actual
Model