union and state finances at a glance 2016-2017
TRANSCRIPT
UNION AND STATES FINANCE AT A GLANCE
UNION AND STATE FINANCES AT
A GLANCE 2016-2017
Comptroller and Auditor General of India

UNION AND STATES FINANCE AT A GLANCE
Preface
This publication “Union and States Finances at a Glance” is an overview of the
Government Finances of both the Union and the states. It presents the
information on accounts in an easy to comprehend manner with extensive use of
graphs, charts. It portrays the trends in the receipts, expenditure and fiscal
position of the Union and State Governments. It also provides an opportunity for
Inter-state comparisons and does attempt to address the felt –need of various
stakeholders for a publication containing reader friendly summary of Union and
Union State Finances. Detailed information on any of the aspects dealt with in this
publication is available in the 'Combined Finance and Revenue Accounts' 2016-
17 and the 'Finance Accounts' of the Union and the States for the year 2016-17.
We look forward to reader’s views and comments on this publication. The
feedback would help us in further improving the publication in the years to come.
( Rajiv Mehrishi)
Comptroller and Auditor General of India
Date: 13 August 2019
Place: New Delhi

UNION AND STATES FINANCE AT A GLANCE
CONTENTS
Chapter 1 Page No.
1.1. Introduction 01
1.2. Structure of Government Accounts 02
1.3. Quality of Accounts 02
1.4. Flow diagram for Accounts Compilation 05
Chapter 2
2.1. Sources and Application of Funds 06
2.2. Cash Management 07
Chapter 3
3.1 Revenue Receipts 10
3.2 The Revenue Basket 11
3.3. Analysis of Tax Revenue of States 11
3.4 Grants-in-Aid 14
3.5 Revenue (Tax) Buoyancy 16
Chapter 4
4.1 Revenue and Capital Expenditure 19
4.2 Analysis of Components of Revenue Expenditure 22
4.3 Sectoral Analysis of Expenditure 24
4.4 Committed Expenditure 27
4.5 Functional Analysis 29
Chapter 5
5.1 Deficit 35
5.2 Gross Domestic Product (GDP) and Gross State
Domestic Product (GSDP) 35
5.3 State Government’s Performance under Fiscal
Responsibility and Budget Management Act
(FRBMA) 37
Chapter 6
6.1 Public Debt 38
Chapter 7
7.1 Public Account 41
7.2 Assets and Liabilities 46

1 UNION AND STATES FINANCE AT A GLANCE
Chapter-1
Introduction
How Accounts Are Compiled
Union Government accounts are compiled by the Controller General of Accounts from the
accounts received from the Pay and Accounts Offices (PAOs) attached to the Ministries and
Departments of the Government of India. The Accounts of the Railways, P&T and Defence also
forms part of the Union Government Accounts.
The accounts of the State Government are compiled by the Accountant General of the State
concerned based on the transactions reported by the treasuries and other accounts rendering
units like Public Works Divisions, Forest Divisions, etc.
Finance Accounts Finance Accounts of both the Union Government and State Governments1 are prepared
annually. These are audited by the Comptroller and Auditor General of India. The Accounts
present the receipts and expenditure of the Government for the year together with the
financial results disclosed by the revenue and capital accounts and public debt. The liabilities
and assets of the Government are worked out from the balances recorded in the accounts.
Union and State Finances at a Glance
This publication provides the reader with a snapshot of the Finances of Union and the States.
We have included key financial parameters and attempted to make the publication reader
friendly, keeping the use of technical terms to a minimum. We welcome inputs to improve the
product further.
1The figure taken here do not include the un-apportioned amounts in respect of those states where balances remain un-apportioned.
1.1.1
1.1.2
1.1.3

2 UNION AND STATES FINANCE AT A GLANCE
Structure of Government Accounts
Quality of Accounts Exclusions
The offices of the Accountants General (A&E) receive monthly accounts from various
treasuries, Public Works divisions, Forest divisions, Irrigation divisions and Rural
Engineering Service divisions. In order to compile and consolidate these accounts for their
incorporation in the monthly civil accounts (MCA). The accounts of all these account
rendering units (ARUs) are required to be received by the Accountant General. Non receipt
of accounts from ARUs result in exclusion of the respective accounts in the compilation of
MCA for that month. The accounts are incomplete to the extent of exclusions. The Annual
Average Percentage of Exclusion of Accounts during the year 2016-17 is depicted below:
Part-I Consolidated
Fund
Part-II Contingency
Fund
Part-III Public
Account
Receipts and Expenditure on Revenue and Capital Accounts, Public Debt, Loans and Advances
Fund available to meet unforeseen expenditure which is not provided for in the budget. The expenditure incurred from the fund would be transferred to the Consolidated Fund and the Contingency Fund recouped appropriately before the closure of accounts of the year
Transactions relating to Debt (other than included in Part-I), Deposits, Advances, Remittances and Suspense. Debt and Deposit represent the liability of the Government to repay. Advances are recoveries to be effected by the Government. The transactions relating to Remittances and Suspense represent only adjusting entries which would be cleared eventually.
1.3.1
1

3 UNION AND STATES FINANCE AT A GLANCE
Reconciliation of Receipts and Expenditure
To exercise effective control of expenditure, to keep it within the budget grants and to ensure
accuracy of their accounts, all Chief Controlling Officers (CCOs)/Controlling Officers (COs) are
required to reconcile the figures of Receipts and Expenditure recorded in their books every
month with the figures accounted for by the Principal Accountant General (A&E). There is no
assurance about the completeness and correctness of the receipts and expenditure figures
depicted in the Finance Accounts to the extent of non-reconciliation. The status of
reconciliation in respect of receipts and expenditure is depicted below:
0
5.02
10
0.450 0 0 0
6.94
2.52 2.34
0.41 0 0
10.53
6.37
1.57
19.9
0.420 0 0 0 0 0 0 0.3
1.11
0123456789
101112131415161718192021
An
dh
ra P
rad
esh
Aru
nac
hal
Pra
des
h
Ass
am
Bih
ar
Ch
atti
sgar
h
Gu
jara
t
Har
yan
a
Him
ach
al P
rad
esh
Jam
mu
& K
ash
mir
Jhar
khan
d
Kar
nat
aka
Ker
ala
Mad
hya
Pra
des
h
Mah
aras
htr
a
Man
ipu
r
Meg
hal
aya
Miz
ora
m
Nag
alan
d
Od
ish
a
Pu
nja
b
Raj
asth
an
Sikk
im
Tam
il N
adu
Tela
nga
na
Trip
ura
Utt
ar P
rad
esh
Utt
arak
han
d
Wes
t B
enga
l
(in
%)
AnnualAveragePercentageofExclusion(%)
1.3.2

4 UNION AND STATES FINANCE AT A GLANCE
0
10
20
30
40
50
60
70
80
90
100A
ND
HR
A P
RA
DES
H
AR
UN
AC
HA
L P
RA
DE
SH
ASS
AM
BIH
AR
CH
HA
TTIS
GA
RH
GU
JAR
AT
HA
RYA
NA
HIM
AC
HA
L P
RA
DES
H
JAM
MU
& K
ASH
MIR
JHA
RK
HA
ND
KA
RN
ATA
KA
KER
ALA
MA
DH
YA P
RA
DE
SH
MA
HA
RA
SHTR
A
MA
NIP
UR
MEG
HA
LAYA
MIZ
OR
AM
NA
GA
LAN
D
OD
ISH
A
PU
NJA
B
RA
JAST
HA
N
SIK
KIM
TAM
IL N
AD
U
TELA
NG
AN
A
TRIP
UR
A
UTT
AR
PR
AD
ESH
UTT
AR
AK
HA
ND
WES
T B
ENG
AL
(in
%)
Percentage of Reconciliation of Total Expenditure
Percentageof TotalExpenditure
0102030405060708090
100
AN
DH
RA
PR
AD
ESH
AR
UN
AC
HA
L P
RA
DE
SH
ASS
AM
BIH
AR
CH
HA
TTIS
GA
RH
GU
JAR
AT
HA
RYA
NA
HIM
AC
HA
L P
RA
DES
H
JAM
MU
& K
ASH
MIR
JHA
RK
HA
ND
KA
RN
ATA
KA
KER
ALA
MA
DH
YA P
RA
DE
SH
MA
HA
RA
SHTR
A
MA
NIP
UR
MEG
HA
LAYA
MIZ
OR
AM
NA
GA
LAN
D
OD
ISH
A
PU
NJA
B
RA
JAST
HA
N
SIK
KIM
TAM
IL N
AD
U
TELA
NG
AN
A
TRIP
UR
A
UTT
AR
PR
AD
ESH
UTT
AR
AK
HA
ND
WES
T B
ENG
AL
(in
%)
Percentage of Reconciliation of Total Receipts
Percentageof TotalReceipts

5 UNION AND STATES FINANCE AT A GLANCE
Flow Diagram for Accounts compilation
Drawing and Disbursing Officer
Union Government
Pay and Accounts Officer
Principal Pay and Accounts Officer
Controller General of Accounts
Union Government Accounts
Accounts of Railways, P&T, Defence
Drawing and Disbursing Officers
PW and Forest Divisions
Treasuries Pay and
Accounts Office
Accountant General
State Accounts
GOI Ministries
Departments and
Accountants General of
State Government
Inter Government Adjustments
Through RBI
6 UNION AND STATES FINANCE AT A GLANCE
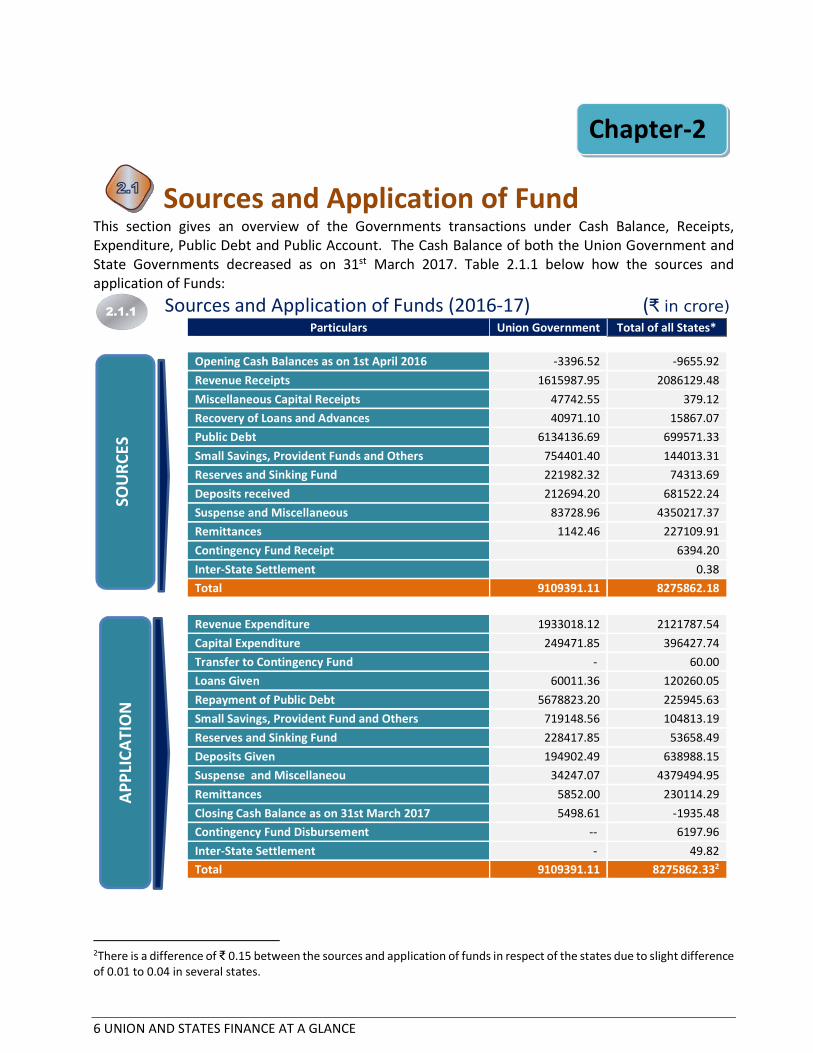
Sources and Application of Fund This section gives an overview of the Governments transactions under Cash Balance, Receipts, Expenditure, Public Debt and Public Account. The Cash Balance of both the Union Government and State Governments decreased as on 31st March 2017. Table 2.1.1 below how the sources and application of Funds:
Sources and Application of Funds (2016-17) (₹ in crore)
2There is a difference of ₹ 0.15 between the sources and application of funds in respect of the states due to slight difference of 0.01 to 0.04 in several states.
Particulars Union Government Total of all States*
Opening Cash Balances as on 1st April 2016 -3396.52 -9655.92
Revenue Receipts 1615987.95 2086129.48
Miscellaneous Capital Receipts 47742.55 379.12
Recovery of Loans and Advances 40971.10 15867.07
Public Debt 6134136.69 699571.33
Small Savings, Provident Funds and Others 754401.40 144013.31
Reserves and Sinking Fund 221982.32 74313.69
Deposits received 212694.20 681522.24
Suspense and Miscellaneous 83728.96 4350217.37
Remittances 1142.46 227109.91
Contingency Fund Receipt 6394.20
Inter-State Settlement 0.38
Total 9109391.11 8275862.18
Revenue Expenditure 1933018.12 2121787.54
Capital Expenditure 249471.85 396427.74
Transfer to Contingency Fund - 60.00
Loans Given 60011.36 120260.05
Repayment of Public Debt 5678823.20 225945.63
Small Savings, Provident Fund and Others 719148.56 104813.19
Reserves and Sinking Fund 228417.85 53658.49
Deposits Given 194902.49 638988.15
Suspense and Miscellaneou 34247.07 4379494.95
Remittances 5852.00 230114.29
Closing Cash Balance as on 31st March 2017 5498.61 -1935.48
Contingency Fund Disbursement -- 6197.96
Inter-State Settlement - 49.82
Total 9109391.11 8275862.332
SOU
RC
ES
AP
PLI
CA
TIO
N
2.1.1
Chapter-2

7 UNION AND STATES FINANCE AT A GLANCE
Cash Management
The Union and State Governments except Sikkim maintain their accounts with the Reserve Bank
of India (RBI). The Government of Jammu and Kashmir maintains its account with the RBI through
the agency bank viz. Jammu and Kashmir Bank. The Government of Sikkim maintains its account
with the State Bank of Sikkim. The State Government can obtain Ordinary Ways and Means
Advance and Special Ways and Means Advance from RBI in order to maintain its liquidity position.
If there is a shortfall in the agreed minimum Cash Balance even after availing of Special Ways and
Means Advance, the Union and State Governments can avail of the Overdraft (OD) facility.
Ways and Means Advances from Reserve Bank of India
Under an agreement with the Reserve Bank of India (RBI), the State Government has to maintain a
minimum cash balance with the RBI. If the balance falls below the agreed minimum on any day, the
deficiency is made good by taking ordinary and special ways and means advances / overdrafts from
time to time. During 2016-17, except for Himachal Pradesh, Jammu& Kashmir, Jharkhand, Kerala,
Manipur, Nagaland, Punjab, Telangana, Uttar Pradesh, Uttarakhand, and West Bengal which have
either availed ordinary or Special Ways and Means Advances or both, all other States maintained
minimum cash balance on all the 365 days without availing any Ways and Means Advances from
Reserve Bank of India. Punjab availed Overdraft facility for 179 days during the year.
Following are two sets of graphs for “where ` came from” and “where the ` went”
In case of Union while the sources include 67 per cent from borrowings, application of funds include
62 per cent used in repayment of Debt. The Revenue Expenditure in respect of the Union consists of
the item Grants- in-Aid (` 291000.86 crore which is 15.05 percent of the total revenue expenditure
of the Union government) given by the Union to States. In respect of the States the Grants-in-aid
received from the Union forms a part of the Revenue Receipts. Details are in Chapter 3.
2.2.1
2.2.2

8 UNION AND STATES FINANCE AT A GLANCE
Where the ₹ came from and where ` went ? Union
0.04%17.73%
0.52%
0.45%
67.29%
8.28%
2.44%2.33%
0.92% 0.01%
Sources of Funds (Union)
Opening Cash Balances as on 1st April2016
Revenue Receipts
Miscellaneous Capital Receipts
Recovery of Loans and Advances
Public Debt
Small Savings, Provident Funds andOthers
Reserves and Sinking Fund
Deposits received
Suspense Account
Remittances
21.22% 2.74%
0.66%
62.34%
7.89%
2.51%2.14%
0.38% 0.06%0.06%
Application of Funds (Union)
Revenue Expenditure
Capital Expenditure
Loans Given
Repayment of Public Debt
Small Savings, Provident Fund and Others
Reserves and Sinking Fund
Deposits Given
Suspense Account
Remittances
Closing Cash Balance as on 31st March 2017
2.2.3

9 UNION AND STATES FINANCE AT A GLANCE
Where the ₹ came from and where ` went ? States
0.12%
25.15%
0.005%
0.19%8.43%
1.74%
0.90%
8.22%
52.44%
2.74%0.08%
0.000005%Sources of Funds (States)
Opening Cash Balances as on 1st April2016Revenue Receipts
Miscellaneous Capital Receipts
Recovery of Loans and Advances
Public Debt
Small Savings, Provident Funds and Others
Reserves and Sinking Fund
Deposits received
Suspense Account
Remittances
Contingency Fund Receipt
Inter-State Settlement
25.63%
4.79%
1.45%
2.73%
1.27%
0.65%
7.72%
52.89%
2.78%0.02%
0.07% 0.0006%
0.0007% Application of Funds (States)Revenue Expenditure
Capital Expenditure
Loans Given
Repayment of Public Debt
Small Savings, Provident Fund and Others
Reserves and Sinking Fund
Deposits Given
Suspense Account
Remittances
Closing Cash Balance as on 31st March 2017
Contingency Fund Disbursement
Inter-State Settlement
Transfer to Contingency Fund
2.2.4
10 UNION AND STATES FINANCE AT A GLANCE
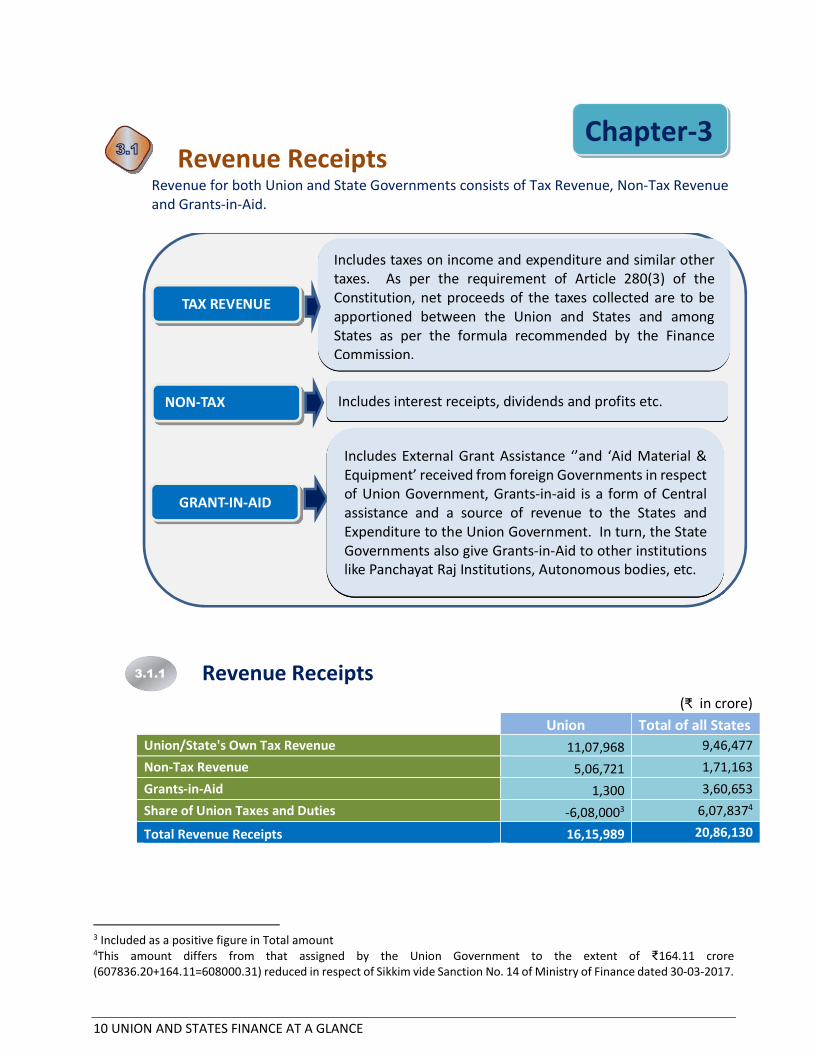
Chapter-3 Revenue Receipts
Revenue for both Union and State Governments consists of Tax Revenue, Non-Tax Revenue and Grants-in-Aid.
Revenue Receipts
(₹ in crore)
Union Total of all States
Union/State's Own Tax Revenue 11,07,968 9,46,477
Non-Tax Revenue 5,06,721 1,71,163
Grants-in-Aid 1,300 3,60,653
Share of Union Taxes and Duties -6,08,0003 6,07,8374
Total Revenue Receipts 16,15,989 20,86,130
3 Included as a positive figure in Total amount 4This amount differs from that assigned by the Union Government to the extent of ₹164.11 crore (607836.20+164.11=608000.31) reduced in respect of Sikkim vide Sanction No. 14 of Ministry of Finance dated 30-03-2017.
TAX REVENUE
NON-TAX REVENUE
GRANT-IN-AID
Includes taxes on income and expenditure and similar other taxes. As per the requirement of Article 280(3) of the Constitution, net proceeds of the taxes collected are to be apportioned between the Union and States and among States as per the formula recommended by the Finance Commission.
Includes interest receipts, dividends and profits etc.
Includes External Grant Assistance ‘’and ‘Aid Material & Equipment’ received from foreign Governments in respect of Union Government, Grants-in-aid is a form of Central assistance and a source of revenue to the States and Expenditure to the Union Government. In turn, the State Governments also give Grants-in-Aid to other institutions like Panchayat Raj Institutions, Autonomous bodies, etc.
3.1.1
1.11

11 UNION AND STATES FINANCE AT A GLANCE
The Revenue Basket
Union Government All States Government
Every Revenue Rupee raised by the Union Government consists of 77 paise from Tax and 23 paise from Non-Tax Revenue.
Every “Revenue Rupee’ raised by the State Governments consists of 46 paise from Tax Revenue, 29 paise Tax Proceeds transferred to States,17 paise from Grant-in-Aid from Union Government and 8paise Non-Tax Revenue.
Analysis of Tax Revenue of States
Tax Revenue Tax is the most important source of Revenue Receipts constituting 77 percent of Union and 46
percent of State revenues. Total Revenue Receipts relative to Gross Domestic Product5 is 14.58
percent in respect of the Union and 13.35percent for the State governments. In the following Table,
an analysis of States’ own Tax Revenue, Non-Tax Revenue and Share of Union Taxes and duties is
made:
5GDP of Union ₹15253714 crore for the base year 2011-12 at current prices released by CSO in September, 2018.
1252024.071405468.035
1591638.61832884.91
2086129.467
0
500000
1000000
1500000
2000000
2500000
2012-13 2013-14 2014-15 2015-16 2016-17
(in
cro
re)
Trends of Revenue Receipts of all states
77
23
(Percent)
Tax Revenue Non Tax Revenue
46
8
29
17
(Percent)
Tax RevenueNon Tax RevenueShare of Union Taxes and DutiesGrants-in-Aid
3.3.1

12 UNION AND STATES FINANCE AT A GLANCE
States’ Own Tax Revenue, Non Tax Revenue and Share of Union Taxes assigned to the states (All States Average: ₹ 67295 crore)6
State/Union Territory
States Own Tax Revenue (₹ in crore )
Non-Tax Revenue
(₹ in crore )
Share of Net proceeds assigned
to States (₹ in crore )
Total Receipts (₹ in crore )
Own tax as a ratio of Total Revenue Receipts
Sikkim 653 452 2069 4610.30 14.16
Puducherry 2401 1245 0 5382.95 44.60
Mizoram 442 365 2801 7398.30 5.97
Meghalaya 1186 685 3911 8938.95 13.27
Manipur 587 165 3757 9129.12 6.43
Nagaland 511 345 3033 9442.28 5.41
Goa 4261 2712 2299 9564.97 44.55
Tripura 1422 219 3909 9645.45 14.74
Arunachal Pradesh 709 545 8388 11779.57 6.02
Uttarakhand 10897 1346 6411 24888.96 43.78
Himachal Pradesh 7039 1717 4344 26264.34 26.80
NCT of Delhi 31140 381 0 34345.73 90.67
Jammu & Kashmir 7819 4072 9489 41978.47 18.63
Jharkhand 13299 5351 19142 47053.97 28.26
Punjab 27747 5863 9600 47985.42 57.82
Assam 12080 4353 20189 49219.81 24.54
Haryana 34026 6196 6597 52496.82 64.82
Chhattisgarh 18945 5669 18809 53685.25 35.29
Odisha 22852 8043 28321 74299.40 30.76
Kerala 42176 9700 15225 75611.73 55.78
Telangana 48408 9782 14877 82817.96 58.45
Andhra Pradesh 44181 5193 26264 98984.49 44.63
Bihar 23742 2403 58881 105584.99 22.49
Rajasthan 44372 11616 33556 109026.00 40.70
Gujarat 64443 13346 18835 109841.80 58.67
West Bengal 45466 2950 44625 117832.45 38.59
Madhya Pradesh 44194 9086 46064 123306.79 35.84
Karnataka 82956 5795 28760 133213.79 62.27
Tamil Nadu 85941 9914 24538 140231.13 61.29
Maharashtra 136616 12709 33715 204693.14 66.74
Uttar Pradesh 85966 28944 109428 256875.15 33.47
Total 946477 171162 607837 2086129.5
6 Average =Total Receipts /No. of states &UTs
0
10
20
30
40
16
4
11
Grouping of States based on their total Revenue receipts
Above Average
Around Average
Below Average

13 UNION AND STATES FINANCE AT A GLANCE
NCT of Delhi tops the list in having the highest own tax revenue to Total revenue receipts ratio
followed by Maharashtra, Haryana, Karnataka and Tamil Nadu. The state of Nagaland had the
lowest ratio.
Share of union Taxes is the main source of receipts in respect of the Special Category States
except Himachal Pradesh.
0
20000
40000
60000
80000
100000
120000
140000
160000
States'own Tax revenue, Non Tax revenue and Share of net proceeds assigned to states in respect of General Category
States/UTs.
Own tax Revenue Non Tax Revenue Share of Union Taxes
0
5000
10000
15000
20000
25000
ArunachalPradesh
Assam HimachalPradesh
Jammu &Kashmir
Manipur Meghalaya Mizoram Nagaland Sikkim Tripura
States'own Tax revenue, Non Tax revenue and Share of net proceeds assigned to states in respect of Special Category States.
Own tax Revenue Non Tax Revenue Share of Union Taxes

14 UNION AND STATES FINANCE AT A GLANCE
Grants-in-Aid Grants-in-Aid are given by the Union Government to States for implementation of Central Schemes etc. which constitute part of the State Revenue.
Share of Grants-in-Aid as a Percent of State Revenue
State/Union Territory
Grants-in-aid from Govt. of India
(₹ in crore ) Total Revenue Receipt
(₹ in crore )
% of Grant-in-Aid to Total Revenue Receipts
Goa 293 9565 3.06%
NCT of Delhi 2825 34346 8.23%
Punjab 4776 47985 9.95%
Maharashtra 21653 204693 10.58%
Haryana 5678 52497 10.82%
Kerala 8510 75612 11.26%
Telangana 9752 82818 11.78%
Karnataka 15703 133214 11.79%
Gujarat 13218 109842 12.03%
Uttar Pradesh 32537 256875 12.67%
Tamil Nadu 19838 140231 14.15%
Rajasthan 19483 109026 17.87%
Arunachal Pradesh 2138 11780 18.15%
Chhattisgarh 10262 53685 19.11%
Madhya Pradesh 23963 123307 19.43%
Bihar 20559 105585 19.47%
Jharkhand 9261 47054 19.68%
Odisha 15082 74299 20.30%
West Bengal 24791 117832 21.04%
Andhra Pradesh 23346 98985 23.59%
Uttarakhand 6234 24889 25.05%
Assam 12598 49220 25.60%
Sikkim 1437 4610 31.17%
Puducherry 1736 5383 32.26%
Meghalaya 3157 8939 35.31%
Tripura 4095 9645 42.46%
Jammu & Kashmir 20599 41979 49.07%
Himachal Pradesh 13164 26264 50.12%
Manipur 4621 9129 50.61%
Mizoram 3791 7398 51.24%
Nagaland 5553 9442 58.81%
Total 360653 2086129 17.29%
The percentage of Central Assistance given as Grant-in-Aid to different States shows considerable
variations. While the States like Goa, NCT of Delhi and Punjab received Grants-in-Aid from the Union
Government constituting about 3-10 percent of their total Revenue Receipts. Whereas Jammu &
3.4.1

15 UNION AND STATES FINANCE AT A GLANCE
Kashmir, Himachal Pradesh, Manipur, Mizoram, Nagaland received Grants-in-Aid of about more than 45
percent of their total Revenue Receipts. A graphical representation of all States showing the ratio of the
Grants-in-aid received to their total revenues is given below:
All Special Category States are in receipt of Grants in Aid more than the average of all states.
0.00%
10.00%
20.00%
30.00%
40.00%
50.00%
60.00%
70.00%
Go
a
NC
T o
f D
elh
i
Pu
nja
b
Mah
aras
htr
a
Har
yan
a
Ker
ala
Tela
nga
na
Kar
nat
aka
Gu
jara
t
Utt
ar P
rad
esh
Tam
il N
adu
Raj
asth
an
Aru
nac
hal
Pra
des
h
Ch
hat
tisg
arh
Mad
hya
Pra
des
h
Bih
ar
Jhar
khan
d
Od
ish
a
Wes
t B
enga
l
An
dh
ra P
rad
esh
Utt
arak
han
d
Ass
am
Sikk
im
Pu
du
cher
ry
Meg
hal
aya
Trip
ura
Jam
mu
& K
ash
mir
Him
ach
al P
rad
esh
Man
ipu
r
Miz
ora
m
Nag
alan
d
Percentage of Grant-in-aid to the total receipts
Percentage All States' average = 17.29%
188681.79205953.00
330804.65 325895.60360652.81
0.00
50000.00
100000.00
150000.00
200000.00
250000.00
300000.00
350000.00
400000.00
2012-13 2013-14 2014-15 2015-16 2016-17
(₹ in
Cro
re)
Trends of Grants-in-Aid

16 UNION AND STATES FINANCE AT A GLANCE
Revenue (Tax) Buoyancy Buoyancy ratio indicates the elasticity or degree of responsiveness of a fiscal variable
(Revenue Receipts or state’s Own Tax revenue) with respect to a given change in the
base variable (GSDP). As GSDP grows, the ability of the State Government to mobilize
its own tax revenue should also increase. Buoyancy of a parameter is calculated as the
ratio of the rate of growth of the parameter to the GSDP growth rate. The following
table shows the Tax buoyancy with respect to the GSDP for 2016-17.
States Revenue Receipts 2015-16
Revenue Receipts2016-17
Rate of Growth7
GSDP 2015-16
GSDP 2016-17
GSDP Growth
Rate8
Revenue Receipts/GSDP
2016-17
Revenue Buoyancy
w.r.t GSDP9
Andhra Pradesh 88648 98984 11.66 603376 699307 15.90 14.15 0.73
Arunachal Pradesh 10553 11780 11.62 20294 24056 18.54 48.97 0.63
Assam 42457 49220 15.93 226276 257510 13.80 19.11 1.15
Bihar 96123 105585 9.84 381501 438030 14.82 24.10 0.66
Chhattisgarh 46068 53685 16.53 260776 290140 11.26 18.50 1.47
Delhi 34999 34346 -1.87 551963 616826 11.75 5.57 -0.16
Goa 8552 9565 11.84 54275 62661 15.45 15.26 0.77
Gujarat 97483 109842 12.68 994316 1125654 13.21 9.76 0.96
Haryana 47557 52497 10.39 492657 547396 11.11 9.59 0.93
Himachal Pradesh 23440 26264 12.05 110511 124570 12.72 21.08 0.95
Jammu & Kashmir 35780 41978 17.32 114637 115654 0.89 36.30 19.46
Jharkhand 40638 47054 15.79 241955 253536 4.79 18.56 3.30
Karnataka 118817 133214 12.12 1027068 1117334 8.79 11.92 1.38
Kerala 69033 75612 9.53 588337 655205 11.37 11.54 0.84
Madhya Pradesh 105511 123307 16.87 565053 640484 13.35 19.25 1.26
Maharashtra 185036 204693 10.62 2001223 2267789 13.32 9.03 0.80
Manipur 8280 9129 10.26 20068 23325 16.23 39.14 0.63
Meghalaya 7043 8939 26.92 27304 29567 8.29 30.23 3.25 Mizoram 6676 7398 10.82 13374 15212 13.74 48.63 0.79
Nagaland 8044 9442 17.38 20524 21119 2.90 44.71 6.00
Odisha 68941 74299 7.77 341887 378991 10.85 19.60 0.72
Puducherry 5088 5383 5.80 26533 27739 4.55 19.41 1.28
Punjab 41523 47985 15.56 391543 427297 9.13 11.23 1.70
Rajasthan 100285 109026 8.72 672707 749692 11.44 14.54 0.76
Sikkim 3784 4610 21.84 16637 18852 13.31 24.46 1.64
Tamil Nadu 129008 140231 8.70 1212668 1298511 7.08 10.80 1.23
Telangana 76134 82818 8.78 583117 646265 10.83 12.81 0.81
Tripura 9427 9645 2.32 33496 36880 10.10 26.15 0.23
Uttar Pradesh 227076 256875 13.12 1153795 1275141 10.52 20.14 1.25
Uttarakhand 21234 24889 17.21 176171 195192 10.80 12.75 1.59
West Bengal 109732 117832 7.38 1039923 1251067 20.30 9.42 0.36
Source : The figures have been taken from the State Accounts at a Glance of the respective States.
7 {(Current year receipts – previous year receipts)/previous year receipts}*100 8{(Current year GSDP – previous year GSDP)/previous year GSDP}*100 9 Growth rate of Revenue receipts / growth rate of GSDP
(₹ in crore)

17 UNION AND STATES FINANCE AT A GLANCE
Comparative table of the Revenue, Tax and state’s own tax buoyancy is below:
States Revenue Buoyancy w.r.t GSDP
Tax Buoyancy10 w.r.t GSDP
State's Own Tax11 buoyancy12 w.r.t GSDP
Manipur 0.63 1.19 0.16
Arunachal Pradesh 0.63 2.04 0.16
West Bengal 0.36 0.35 0.18
Mizoram 0.79 1.66 0.21
Sikkim 1.95 1.29 0.31
Assam 1.15 0.91 0.34
Bihar 0.66 1.27 0.37
Tripura 0.23 1.43 0.38
Delhi -0.16 0.46 0.43
Andhra Pradesh 0.73 0.69 0.43
Gujarat 0.96 0.48 0.43
Goa 0.77 2.39 0.44
Himachal Pradesh 0.95 1.04 0.44
Maharashtra 0.80 0.46 0.45
Meghalaya 3.25 1.63 0.48
Uttar Pradesh 1.25 1.11 0.49
Madhya Pradesh 1.26 0.91 0.52
Uttarakhand 1.59 0.82 0.52
Rajasthan 0.76 0.91 0.52
Telangana 0.81 0.71 0.54
Jharkhand 3.30 1.73 0.55
Odisha 0.72 1.24 0.56
Haryana 0.93 0.63 0.56
Kerala 0.84 1.18 0.57
Chhattisgarh 1.47 1.16 0.58
Punjab 1.70 0.96 0.71
Nagaland 6.00 0.83 0.83
Karnataka 1.38 1.00 0.84
Tamil Nadu 1.23 1.20 0.93
Puducherry 1.28 1.90 1.90
Jammu & Kashmir 19.46 26.28 7.62
State’s own Tax revenue buoyancy in respect of Puducherry is the highest followed by Tamil Nadu,
Karnataka and Punjab among the general category states. Jammu & Kashmir has the highest own tax
buoyancy among both the general category and the special category states. Nagaland, Meghalaya and
10 Growth rate of Tax Revenue / growth rate of GSDP 11 refer to table at Para 3.3.1 for tax revenue and State’s own tax revenue 12 Growth rate of Own Tax Revenue / growth rate of GSDP

18 UNION AND STATES FINANCE AT A GLANCE
Sikkim follow Jammu and Kashmir among the special category states. In case of Revenue buoyancy while
Jammu and Kashmir tops the list, Jharkhand, Uttarakhand and Karnataka follow. Comparative graphs
showing the Revenue buoyancy, Tax Buoyancy and own tax buoyancy separately for General Category
and special Category States is shown below:

19 UNION AND STATES FINANCE AT A GLANCE
Chapter-4
Revenue and Capital Expenditure Expenditure is grouped under the following three sectors:
Capital expenditure is met usually from borrowed funds with the object of increasing concrete assets of
material and permanent character. It also includes receipts of a capital nature intended to be applied
as a set off to capital expenditure. As under the Revenue Section, expenditure under Capital section is
also grouped under three categories.
Expenditure under the General Service category pertains mainly to sovereign functions and committed expenditure. Expenditure under the remaining two categories relate to developmental activities of the Government. In the following Tables the percentage of Expenditure to GDP for the Union and States has been depicted on the basis of GDP of ` 1525371413 crore for the Union and all States14 (GSDP of `1563100215crore for the States).
13 Source: Central Statistics Office 14The GDP figures (₹15253714 crore) used are released by CSO and are at current prices. However, in respect of the States the aggregated State wise GSDP figures (₹15631002 crore) are slightly higher (around 2.47 per cent) than the National GDP. 15 Source: Accounts at a Glance 2016-2017 of all States
GENERAL SERVICES
SOCIAL SERVICES
ECONOMIC SERVICES
Includes Interest Payments, Police, Public Works, Pension Payments etc.
Includes Education, Sports, Medical, Family Welfare and Sanitation, Social Welfare and Nutrition etc.
Includes Crop/ Animal Husbandry, Industries, Irrigation, Mining, Transport, Forest etc.

20 UNION AND STATES FINANCE AT A GLANCE
Sector-wise Revenue and Capital Expenditure- Union Government
Sector
Revenue Expenditure ( ₹ in crore )
Capital
Expenditure
(₹ in crore )
%age of
Total
Revenue
Expenditure
%age of
Total Capital
Expenditure
%of Revenue
Expenditure
to GDP16
% of Capital
Expenditure
to GDP
General 926181 99380 47.91 39.84 6.07 0.65
Social 97210 5315 5.03 2.13 0.64 0.03
Economic 618626 144777 32.01 58.03 4.06 0.95
Others
(Grant-in-Aid) 291001 15.05 1.91
Total 1933018 249472 100.00 100.00 12.67 1.63
Sector-wise Revenue Expenditure-States
Sector
States
Revenue
Expenditure
( ₹ in crore )
States
Capital
Expenditure
(₹ in crore )
%age of
Total
Revenue
Expenditure
%age of
Total
Capital
Expenditure
%of
Revenue
Expenditure
to GDP
%of Capital
Expenditure
to GDP
General 699274 19299 32.96 4.87 4.58 0.13
Social 854200 86034 40.26 21.70 5.60 0.56
Economic 511869 291095 24.12 73.43 3.36 1.91
Others(Grant-in-Aid) 56444 2.66 0.37
Total 2121787 396428 100.00 100.00 13.91 2.60
16GDP for FY 2016-2017is ₹15253714 crore as released by CSO at current prices.

21 UNION AND STATES FINANCE AT A GLANCE
The following two graphs depict the amount of each sector of total expenditure concerned in respect of
Union and all the States combined:
0
5,00,000
10,00,000
15,00,000
20,00,000
25,00,000
Union Government State Government
926181, 48%699274, 33%
97210, 5%854200, 40%
618626, 32%
511869, 24%291001, 15%
56444, 3%
(₹ in
cro
re)
Composition of Revenue Expenditure -Union and States
General Services Social Services Economic Services Others (Grant-in-Aid)
0
50,000
1,00,000
1,50,000
2,00,000
2,50,000
3,00,000
3,50,000
4,00,000
Union Government State Government
144777, 58%
291095, 73%5315, 2%
86034, 22%
99380, 40%
19299, 5%
(₹ in
cro
re)
General Services Social Services Economic Services

22 UNION AND STATES FINANCE AT A GLANCE
Analysis of Components of Revenue Expenditure
Interest Payments
One of the components of Revenue Expenditure under General Services is Interest payments. It is a
committed charge and therefore, deserves detailed analysis. The position of interest paid by respective
States is as follows:
State Interest Payment
(₹ in crore ) Revenue Expenditure
(₹ in crore ) Percentage of Interest to Revenue Expenditure 17
Arunachal Pradesh 399.23 9395 4.25%
Mizoram 341.26 6230 5.48%
Chhattisgarh 2686.83 48165 5.58%
Assam 2963.75 49363 6.00%
Odisha 4035.43 65041 6.20%
Meghalaya 522.23 8337 6.26%
Manipur 543.75 8185 6.64%
Nagaland 635.50 8652 7.35%
Madhya Pradesh 9079.49 119537 7.60%
Sikkim 324.39 3788 8.56%
Bihar 8190.66 94765 8.64%
Tripura 794.31 8855 8.97%
Karnataka 12032.76 131921 9.12%
Jharkhand 4172.25 45089 9.25%
NCT Delhi 2882.52 29302 9.84%
Andhra Pradesh 11697.36 116215 10.07%
Telangana 8609.19 81432 10.57%
U.T. Govt. Puducherry 577.56 5458 10.58%
Uttar Pradesh 26935.67 236592 11.38%
Jammu and Kashmir 4567.30 39812 11.47%
Goa 1148.03 8866 12.95%
Himachal Pradesh 3358.91 25344 13.25%
Kerala 12116.50 91096 13.30%
Maharashtra 28531.92 213229 13.38%
Tamil Nadu 20533.24 153195 13.40%
Rajasthan 17676.93 127140 13.90%
Uttarakhand 3723.05 25271 14.73%
Haryana 10541.91 68403 15.41%
Gujarat 17796.84 103895 17.13%
West Bengal 25702.85 133918 19.19%
Punjab 11641.76 55296 21.05%
Grand Total 254763.37 2121787 12.01%
17 Percentage of Interest payment to Revenue expenditure= (Interest Payment /Revenue Expenditure) *100
All State average of interest paid to the total revenue expenditure: 12.01 per cent
4.2.1
1

23 UNION AND STATES FINANCE AT A GLANCE
Highlights o All States Average of Interest paid is 12.01 percent of Total Revenue Expenditure.
o Percentage of Interest paid by 11 States was more than All States Average interest paid.
o Punjab and West Bengal have highest component of Interest outgo.
o Arunachal Pradesh and Mizoram have the lowest percentage of interest payments.
12.95% 13.25% 13.30% 13.38% 13.40% 13.90%14.73%
15.41%17.13%
19.19%21.05%
0
5
10
15
20
25
0.00%
5.00%
10.00%
15.00%
20.00%
25.00%
Percentage of interest to Total Revenue Expenditure higher than all states average
Percentage All States'average =12.01

24 UNION AND STATES FINANCE AT A GLANCE
Sectoral Analysis of Expenditure Expenditure on General Services-w All States Average: ₹ 23180 crore18
Revenue Expenditure (GS) (₹ in Crore)
Capital Expenditure (GS) (₹ in Crore)
Total Expenditure under General Services
(₹ in Crore) State/Union Territory
Sikkim 1421 71.18 1492.18
U.T. Govt. Puducherry 1639 85.09 1724.09
Mizoram 2097 49.18 2146.18
Meghalaya 2480 83.00 2563.00
Arunachal Pradesh 2768 113.09 2881.09
Goa 2873 203.57 3076.57
Manipur 3421 96.00 3517.00
Tripura 3503 204.55 3707.55
Nagaland 3897 132.55 4029.55
NCT Delhi 6590 350.21 6940.21
Himachal Pradesh 9728 208.37 9936.37
Uttarakhand 9934 72.39 10006.39
Chhattisgarh 11496 187.54 11683.54
Jharkhand 13024 589.61 13613.61
Jammu and Kashmir 15111 768.71 15879.71
Odisha 16714 374.29 17088.29
Assam 17123 199.60 17322.60
Haryana 21631 399.37 22030.37
Telangana 25125 567.43 25692.43
Madhya Pradesh 27903 697.84 28600.84
Punjab 28488 248.79 28736.79
Karnataka 31265 1060.39 32325.39
Bihar 30607 2090.35 32697.35
Andhra Pradesh 32786 295.17 33081.17
Gujarat 35804 622.89 36426.89
Rajasthan 39203 436.52 39639.52
Kerala 41195 210.86 41405.86
West Bengal 50131 853.66 50984.66
Tamil Nadu 51453 750.83 52203.83
Maharashtra 71609 1548.23 73157.23
Uttar Pradesh 88255 5727.30 93982.30
Total 699274 19298.56 718572.56
18 Total expenditure under General Services / number of States/ UTs
0
10
20
30
40
17
2
12
Sector-wise grouping of States based on their Expenditure on General Services
AboveAverage
AroundAverage
BelowAverage
Uttar Pradesh has spent significantly more on General Services in Comparison to other States among the General Category states. Sikkim, Mizoram and Meghalaya have spent much lower on General services among the Special Category States.
4.3.1

25 UNION AND STATES FINANCE AT A GLANCE
Expenditure on Social Services All States Average: ₹ 30330 crore19
Revenue expenditure on Social Services
(₹ in Crore)
Capital expenditure on Social Services
(₹ in Crore)
Total expenditure on social services
(₹ in Crore) State/Union Territory
Sikkim 1335 243.21 1578.21
U.T. Govt. Puducherry 2129 120.98 2249.98
Manipur 2057 413.00 2470.00
Mizoram 2301 313.29 2614.29
Nagaland 2295 431.72 2726.72
Meghalaya 3099 459.36 3558.36
Arunachal Pradesh 3046 579.91 3625.91
Goa 3345 431.80 3776.80
Tripura 3683 1420.96 5103.96
Himachal Pradesh 9610 1041.07 10651.07
Uttarakhand 10529 947.61 11476.61
Jammu and Kashmir 11564 2305.78 13869.78
Punjab 15672 1087.35 16759.35
NCT Delhi 16579 2130.04 18709.04
Jharkhand 18557 1532.02 20089.02
Chhattisgarh 21342 2460.62 23802.62
Assam 22673 1542.6 24215.6
Haryana 25473 1586.41 27059.41
Odisha 27600 3001.21 30601.21
Kerala 33765 1292.68 35057.68
Telangana 35286 3161.72 38447.72
Bihar 40737 3592.49 44329.49
Gujarat 44926 431.80 45357.80
Madhya Pradesh 47942 3285.16 51227.16
Andhra Pradesh 50228 2430.91 52658.91
Rajasthan 49372 6214.28 55586.28
Tamil Nadu 55297 6041.09 61338.09
Karnataka 54549 6896.84 61445.84
West Bengal 57067 4438.08 61505.08
Maharashtra 90282 3266.51 93548.51
Uttar Pradesh 91861 17150.47 109011.47
Total 854201 86034.17 940235.17
19Total expenditure under Social Services / number of States/ UTs
0
10
20
30
40
17
3
11
Sector-wise grouping of States based on their expenditure on Social Services
AboveAverage
AroundAverage
BelowAverage
4.3.2
Uttar Pradesh and Maharashtra have spent significantly more on Social Services in Comparison to other States among the General Category states. The highest expenditure on the Capital component has been spent by Uttar Pradesh. Goa has spent more on the Capital component compared to the revenue component. Assam has spent more on Social Services among the Special Category States.

26 UNION AND STATES FINANCE AT A GLANCE
Expenditure on Economic Services All States Average: ₹ 25902 crore20 Revenue Expenditure on
Economic Services (₹ in Crore)
Capital Exp on Economic Services
(₹ in Crore)
Total expenditure on Economic Services
(₹ in Crore) State/Union Territory
Sikkim 977 405.89 1382.89
U.T. Govt. Puducherry 1685 240.58 1925.58
Mizoram 1832 548.93 2380.93
Nagaland 2460 511.82 2971.82
Tripura 1471 1668.05 3139.05
Manipur 2343 984.57 3327.57
Meghalaya 2757 747.44 3504.44
Arunachal Pradesh 3580 851.02 4431.02
NCT Delhi 5111 1274.05 6385.05
Uttarakhand 3903 3934.22 7837.22
Himachal Pradesh 5996 2249.60 8245.60
Assam 8914 3759.87 12673.87
Punjab 10218 3010.17 13228.17
Goa 2648 15517.49 18165.49
Jammu and Kashmir 13138 5211.04 18349.04
Kerala 10655 8622.41 19277.41
Chhattisgarh 14176 6822.35 20998.35
Jharkhand 13508 8739.05 22247.05
Gujarat 22749 1003.36 23752.36
Haryana 20875 4877.32 25752.32
West Bengal 26156 6044.69 32200.69
Odisha 19714 15095.57 34809.57
Bihar 23417 21525.55 44942.55
Andhra Pradesh 33108 12417.70 45525.70
Tamil Nadu 33980 13917.56 47897.56
Rajasthan 38565 10328.91 48893.91
Telangana 20950 29641.41 50591.41
Madhya Pradesh 36885 23305.31 60190.31
Karnataka 40421 20193.20 60614.2
Maharashtra 43843 20734.52 64577.52
Uttar Pradesh 45834 46911.35 92745.35
Total 511869 291095.00 802964.00
20 Total expenditure under Economic Services / number of States/ UTs
0
5
10
15
20
25
30
35
17
3
11
Sector-wise grouping of States based on their expenditure on Economic Services
AboveAverage
AroundAverage
BelowAverage
4.3.3
Uttar Pradesh, Maharashtra and Karnataka have spent significantly more on the revenue component under Economic Services in comparison to other States among the General Category states. Uttar Pradesh, Telangana and Goa have spent more on the Capital component compared to the revenue component. Jammu & Kashmir has spent the highest amount on Economic Services among the Special Category States.

27 UNION AND STATES FINANCE AT A GLANCE
Committed Expenditure The Committed Expenditure of the State Governments on revenue account mainly consists
of Interest Payments and Servicing of Debt, Expenditure on Salaries and Wages and Pensions. The
Position of Committed Expenditure of States is as follows:
All States average Committed expenditure= ₹29008 crore21
State Salary and
Wages (₹ in crore)
Interest Payment and Servicing of
Debts (₹ in crore)
Expenditure on Pensions (₹ in crore)
Total Committed Expenditure (₹ in crore)
Revenue Expenditure (₹ in crore )
Committed Expenditure to Revenue Expenditure
NCT Delhi 0 860 287 1147 29302 4%
Sikkim 1423 336 446 2205 3788 58%
U.T. Govt. Puducherry 1558 794 632 2984 5458 55%
Meghalaya 2242 654 648 3544 8337 43%
Mizoram 2323 556 761 3640 6230 58%
Arunachal Pradesh 3567 549 641 4757 9395 51%
Manipur 3088 654 1174 4916 8185 60%
Nagaland 3750 375 1093 5218 8652 60%
Goa 2107 2883 844 5834 8866 66%
Tripura 3912 794 1209 5915 8855 67%
Uttarakhand 8670 3783 3170 15623 25271 62%
Jharkhand 8927 4601 4135 17663 45089 39%
Chhattisgarh 14071 2887 3486 20444 48165 42%
Gujarat 8722 1178 11303 21203 103895 20%
Jammu & Kashmir 15130 3359 4217 22706 39812 57%
Himachal Pradesh 9356 10542 4114 24012 25344 95%
Karnataka 9803 4172 11295 25270 131921 19%
Odisha 15180 4035 6843 26058 65041 40%
Punjab 17707 579 8773 27059 55296 49%
Assam 19210 3139 6565 28914 49363 59%
Tamil Nadu 16148 336 19973 36457 153195 24%
Bihar 15784 8774 12508 37066 94765 39%
Haryana 17006 17797 5659 40462 68403 59%
Madhya Pradesh 20186 12117 8793 41096 119537 34%
Telangana 19223 20918 9011 49152 81432 60%
Maharashtra 26067 9079 16858 52004 213229 24%
Andhra Pradesh 26937 12292 12872 52101 116215 45%
West Bengal 13027 26053 13945 53025 133918 40%
Rajasthan 29552 11642 12296 53490 127140 42%
Kerala 28047 12033 15277 55357 91096 61%
Uttar Pradesh 38371 37708 28227 104306 236592 44%
TOTAL 401094 215479 227055 843628 2121787 40%
21 Total Committed Expenditure / Number of Sates and UTs

28 UNION AND STATES FINANCE AT A GLANCE
0%
10%
20%
30%
40%
50%
60%
70%
80%
90%
100%
An
dh
ra P
rad
esh
Aru
nac
hal
Pra
des
h
Ass
am
Bih
ar
Ch
hat
tisg
arh
Go
a
Gu
jara
t
Har
yan
a
Him
ach
al P
rad
esh
Jam
mu
& K
ash
mir
Jhar
khan
d
Kar
nat
aka
Ker
ala
Mad
hya
Pra
des
h
Mah
aras
htr
a
Man
ipu
r
Meg
hal
aya
Miz
ora
m
Nag
alan
d
NC
T D
elh
i
Od
ish
a
Pu
nja
b
Raj
asth
an
Sikk
im
Tam
il N
adu
Tela
nga
na
Trip
ura
U.T
. Go
vt. P
ud
uch
erry
Utt
ar P
rad
esh
Utt
arak
han
d
Percentage of Committed Expenditure to Revenue Expenditure
Committed Expenditure to Revenue Expenditure All States' average = 40%
0
5
10
15
20
25
30
35
14
6
11
Grouping of States based on Committed Expenditure
Above Average
Around Average
Below Average

29 UNION AND STATES FINANCE AT A GLANCE
Committed Expenditure
Salary and wages constitute the major portion (45 per cent) of the committed expenditure followed by
Interest payments and servicing of Debts (29 percent) and Pensions (26 per cent).
Functional Analysis An analysis of Expenditure by major functions on the basis of Sectoral expenditure in
relation to the total expenditure of each state gives insight into the priorities of various states on
different functions. The expenditure in respect of some of the major functions is shown below:
0
50000
100000
150000
200000
250000
300000
350000
400000
450000
401093
254763227055
`IN
CR
OR
E
ALL STATES/ UTS
Salary and Wages
Interest Payment andServicing of Debts
Expenditure on Pensions

30 UNION AND STATES FINANCE AT A GLANCE
Education, Sports, Arts and Culture All States per Capita Average: ₹ 4317 crore22
Revenue Expenditure on
Education, Sports Arts & Culture
(₹ in crore)
Capital Expenditure on
Education, Sports Arts & Culture
(₹ in crore)
Total expenditure on Education, Sports
Arts & Culture (₹ in crore)
Population (in Crore)
Per Capita Expenditure23
(₹ in crore) State/Union Territory
Bihar 19152 1074.46 20226.46 10.89 1857.34
Jharkhand 7978 253.50 8231.50 3.61 2280.19
Uttar Pradesh 52220 2018.30 54238.30 21.92 2474.38
West Bengal 23474 388.19 23862.19 9.54 2501.28
Odisha 11809 360.16 12169.16 4.53 2686.35
Madhya Pradesh 21144 736.97 21880.97 7.88 2776.77
Gujarat 18560 1166.53 19726.53 6.72 2935.50
Punjab 8813 220.04 9033.04 2.99 3021.08
Telangana 11955 246.14 12201.14 3.91 3120.5
Karnataka 20084 1108.46 21192.46 6.68 3172.52
NCT Delhi 7680 1339.27 9019.27 2.80 3221.17
Andhra Pradesh 17213 143.53 17356.53 5.31 3268.65
Rajasthan 24498 119.07 24617.07 7.49 3286.66
Tamil Nadu 26034 989.25 27023.25 7.98 3386.37
Assam 12655 0 12655.00 3.45 3668.12
Maharashtra 45358 52.28 45410.28 12.07 3762.24
Manipur 1159 52.31 1211.31 0.32 3785.34
Haryana 11060 141.75 11201.75 2.80 4000.63
Chhattisgarh 11079 516.95 11595.95 2.88 4026.37
Nagaland 1292 27.14 1319.14 0.31 4255.29
Jammu and Kashmir 5770 566.01 6336.01 1.41 4493.62
Tripura 1835 148.13 1983.13 0.44 4507.11
Meghalaya 1608 10.79 1618.79 0.35 4625.11
Kerala 17061 345.08 17406.08 3.70 4704.35
Goa 1467 105.13 1572.13 0.31 5071.39
U.T. Govt. Puducherry 758 12.66 770.66 0.14 5504.71
Uttarakhand 5366 434.59 5800.59 1.03 5631.64
Himachal Pradesh 4945 295.72 5240.72 0.76 6895.68
Mizoram 1162 20.59 1182.59 0.15 7883.93
Arunachal Pradesh 1409 94.14 1503.14 0.16 9394.63
Sikkim 769 45.90 814.90 0.07 11641.43
Grand Total 395367 13033.04 408400.04 132.60 133840.35
22 Per Capita expenditure / number of States/ UTs 23 Total Expenditure on Education, sports, Art and Culture/ Population
0
10
20
30
40
13
12
6
Key Sector-wise grouping of States based on their expenditure on Education, Sports, Arts & Culture
Above Average
Around Average
Below Average
4.5.1
31 UNION AND STATES FINANCE AT A GLANCE
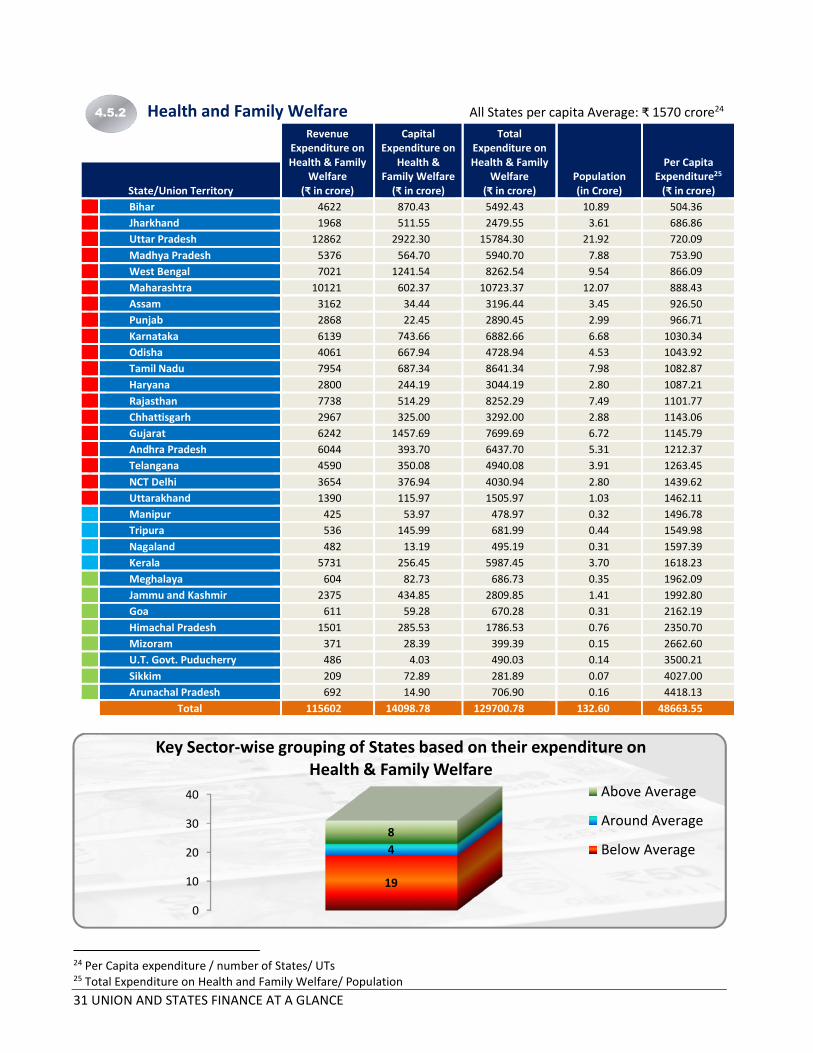
Health and Family Welfare All States per capita Average: ₹ 1570 crore24
Revenue Expenditure on Health & Family
Welfare (₹ in crore)
Capital Expenditure on
Health & Family Welfare
(₹ in crore)
Total Expenditure on Health & Family
Welfare (₹ in crore)
Population (in Crore)
Per Capita Expenditure25
(₹ in crore) State/Union Territory
Bihar 4622 870.43 5492.43 10.89 504.36
Jharkhand 1968 511.55 2479.55 3.61 686.86
Uttar Pradesh 12862 2922.30 15784.30 21.92 720.09
Madhya Pradesh 5376 564.70 5940.70 7.88 753.90
West Bengal 7021 1241.54 8262.54 9.54 866.09
Maharashtra 10121 602.37 10723.37 12.07 888.43
Assam 3162 34.44 3196.44 3.45 926.50
Punjab 2868 22.45 2890.45 2.99 966.71
Karnataka 6139 743.66 6882.66 6.68 1030.34
Odisha 4061 667.94 4728.94 4.53 1043.92
Tamil Nadu 7954 687.34 8641.34 7.98 1082.87
Haryana 2800 244.19 3044.19 2.80 1087.21
Rajasthan 7738 514.29 8252.29 7.49 1101.77
Chhattisgarh 2967 325.00 3292.00 2.88 1143.06
Gujarat 6242 1457.69 7699.69 6.72 1145.79
Andhra Pradesh 6044 393.70 6437.70 5.31 1212.37
Telangana 4590 350.08 4940.08 3.91 1263.45
NCT Delhi 3654 376.94 4030.94 2.80 1439.62
Uttarakhand 1390 115.97 1505.97 1.03 1462.11
Manipur 425 53.97 478.97 0.32 1496.78
Tripura 536 145.99 681.99 0.44 1549.98
Nagaland 482 13.19 495.19 0.31 1597.39
Kerala 5731 256.45 5987.45 3.70 1618.23
Meghalaya 604 82.73 686.73 0.35 1962.09
Jammu and Kashmir 2375 434.85 2809.85 1.41 1992.80
Goa 611 59.28 670.28 0.31 2162.19
Himachal Pradesh 1501 285.53 1786.53 0.76 2350.70
Mizoram 371 28.39 399.39 0.15 2662.60
U.T. Govt. Puducherry 486 4.03 490.03 0.14 3500.21
Sikkim 209 72.89 281.89 0.07 4027.00
Arunachal Pradesh 692 14.90 706.90 0.16 4418.13
Total 115602 14098.78 129700.78 132.60 48663.55
24 Per Capita expenditure / number of States/ UTs 25 Total Expenditure on Health and Family Welfare/ Population
0
10
20
30
40
19
4
8
Key Sector-wise grouping of States based on their expenditure on Health & Family Welfare
Above Average
Around Average
Below Average
4.5.2

32 UNION AND STATES FINANCE AT A GLANCE
Agriculture All States per capita Average: ₹ 1628 crore26
Revenue Expenditure
on Agriculture (₹ in crore)
Capital Expenditure
on Agriculture (₹ in crore)
Total Expenditure
on Agriculture (₹ in crore)
Population (in Crore)
Per Capita Expenditure27
(₹ in crore) State/Union Territory
NCT Delhi 119 17.31 136.31 2.80 48.68
Bihar 2287 127.89 2414.89 10.89 221.75
West Bengal 3265 608.47 3873.47 9.54 406.02
Uttar Pradesh 5599 3921.13 9520.13 21.92 434.31
Rajasthan 5140 462.09 5602.09 7.49 747.94
Assam 2530 54.88 2584.88 3.45 749.24
Jharkhand 2206 569.31 2775.31 3.61 768.78
Gujarat 5035 806.86 5841.86 6.72 869.32
Haryana 2519 413.07 2932.07 2.80 1047.17
Manipur 357 1.75 358.75 0.32 1121.09
Goa 293 69.08 362.08 0.31 1168.00
Tamil Nadu 9882 1001.41 10883.41 7.98 1363.84
Maharashtra 13245 3416.88 16661.88 12.07 1380.44
Madhya Pradesh 10311 693.31 11004.31 7.88 1396.49
Odisha 6497 218.23 6715.23 4.53 1482.39
Andhra Pradesh 7945 116.38 8061.38 5.31 1518.15
Nagaland 480 14.89 494.89 0.31 1596.42
Meghalaya 565 9.45 574.45 0.35 1641.29
Tripura 620 111.83 731.83 0.44 1663.25
Telangana 6122 680.42 6802.42 3.91 1739.75
Kerala 6088 651.51 6739.51 3.70 1821.49
U.T. Govt. Puducherry 249 9.72 258.72 0.14 1848.00
Karnataka 11976 501.42 12477.42 6.68 1867.88
Jammu and Kashmir 1955 732.66 2687.66 1.41 1906.14
Punjab 5718 86.35 5804.35 2.99 1941.25
Himachal Pradesh 1678 50.45 1728.45 0.76 2274.28
Chhattisgarh 6769 92.01 6861.01 2.88 2382.30
Uttarakhand 1775 852.99 2627.99 1.03 2551.45
Mizoram 509 44.79 553.79 0.15 3691.93
Sikkim 269 8.48 277.48 0.07 3964.00
Arunachal Pradesh 770 7.36 777.36 0.16 4858.50
Total 122773 16352.38 139125.38 132.60 50471.54
26 Per Capita expenditure / number of States/ UTs 27 Total Expenditure on Agriculture / Population
0
10
20
30
40
16
3
12
Key Sector-wise grouping of States based on their expenditure on Agriculture
Above Average
Around Average
Below Average
4.5.3

33 UNION AND STATES FINANCE AT A GLANCE
Rural Development All States per capita Average: ₹ 1504 crore28
Revenue Expenditure on
Rural Development (₹ in crore)
Capital Expenditure on Rural
Development (₹ in crore)
Total Expenditure on Rural
Development (₹ in crore)
Population (in Crores)
Per Capita Expenditure29
(₹ in crore) State/Union Territory
NCT Delhi 10.00 127.89 137.89 2.80 49.25
Punjab 261.00 134.13 395.13 2.99 132.15
U.T. Govt. Puducherry 32.00 0.00 32.00 0.14 228.57
Assam 1666.00 0.00 1666.00 3.45 482.90
Goa 143.00 6.69 149.69 0.31 482.87
Kerala 1280.00 615.58 1895.58 3.70 512.32
Gujarat 3424.00 1182.54 4606.54 6.72 685.50
Maharashtra 7017.00 1686.95 8703.95 12.07 721.12
Uttar Pradesh 13848.00 2249.22 16097.22 21.92 734.36
Karnataka 5547.00 49.26 5596.26 6.68 837.76
Tamil Nadu 5919.00 1241.54 7160.54 7.98 897.31
Haryana 2892.00 0.00 2892.00 2.80 1032.86
Jammu and Kashmir 516.00 1117.19 1633.19 1.41 1158.29
West Bengal 12838.00 6.92 12844.92 9.54 1346.43
Bihar 8352.00 7891.74 16243.74 10.89 1491.62
Madhya Pradesh 8818.00 3169.35 11987.35 7.88 1521.24
Himachal Pradesh 1179.00 3.49 1182.49 0.76 1555.91
Rajasthan 11140.00 547.13 11687.13 7.49 1560.36
Chhattisgarh 4299.00 366.70 4665.70 2.88 1620.03
Telangana 6549.00 102.76 6651.76 3.91 1701.22
Odisha 7991.00 0.00 7991.00 4.53 1764.02
Andhra Pradesh 9802.00 0.00 9802.00 5.31 1845.95
Tripura 314.00 556.62 870.62 0.44 1978.68
Uttarakhand 1248.00 841.50 2089.50 1.03 2028.64
Mizoram 345.00 6.02 351.02 0.15 2340.13
Manipur 811.00 0.00 811.00 0.32 2534.38
Jharkhand 7247.00 2074.57 9321.57 3.61 2582.15
Nagaland 811.00 0.00 811.00 0.31 2616.13
Arunachal Pradesh 422.00 35.66 457.66 0.16 2860.38
Sikkim 236.00 9.66 245.66 0.07 3509.43
Meghalaya 1333.00 3.70 1336.70 0.35 3819.14
Total 126290.00 24026.81 150316.81 132.60 46631.10
28 Per Capita expenditure / number of States/ UTs 29 Total Expenditure on Rural Development / Population
0
10
20
30
40
14
4
13
Sector-wise grouping of States based on their expenditure on Rural Development
Above Average
Around Average
Below Average
4.5.4

34 UNION AND STATES FINANCE AT A GLANCE
Transport All States per capita Average: ₹ 1835 crore30 Revenue
Expenditure on Transport
(₹ in crore)
Capital Expenditure on
Transport (₹ in crore)
Total Expenditure on
Transport (₹ in crore)
Population (in Crore)
Per Capita Expenditure31
(₹ in crore) State/Union Territory
West Bengal 1580 2022.35 3602.35 9.54 377.60
Rajasthan 1686 2420.87 4106.87 7.49 548.31
Andhra Pradesh 1181 2096.88 3277.88 5.31 617.30
Punjab 505 1351.96 1856.96 2.99 621.06
Bihar 1787 5601.20 7388.20 10.89 678.44
Madhya Pradesh 1245 4671.99 5916.99 7.88 750.89
U.T. Govt. Puducherry 34 74.20 108.20 0.14 772.86
Tamil Nadu 1522 5917.02 7439.02 7.98 932.21
Maharashtra 6106 5461.23 11567.23 12.07 958.35
Telangana 595 3180.03 3775.03 3.91 965.48
Gujarat 4528 2938.11 7466.11 6.72 1111.03
Jammu and Kashmir 778 831.85 1609.85 1.41 1141.74
Assam 2300 1716.78 4016.78 3.45 1164.28
Uttar Pradesh 4826 22653.08 27479.08 21.92 1253.61
Kerala 1285 3585.71 4870.71 3.70 1316.41
Jharkhand 446 4504.99 4950.99 3.61 1371.47
NCT Delhi 2842 1051.07 3893.07 2.80 1390.38
Chhattisgarh 654 3422.89 4076.89 2.88 1415.59
Haryana 2820 1588.40 4408.40 2.8 1574.43
Uttarakhand 315 1385.39 1700.39 1.03 1650.86
Manipur 111 464.82 575.82 0.32 1799.44
Nagaland 399 175.19 574.19 0.31 1852.23
Karnataka 4844 7623.61 12467.61 6.68 1866.41
Odisha 1981 6767.42 8748.42 4.53 1931.22
Meghalaya 186 566.93 752.93 0.35 2151.23
Goa 282 400.43 682.43 0.31 2201.39
Tripura 189 856.94 1045.94 0.44 2377.14
Himachal Pradesh 1546 1583.61 3129.61 0.76 4117.91
Mizoram 289 373.91 662.91 0.15 4419.40
Sikkim 142 256.64 398.64 0.07 5694.86
Arunachal Pradesh 877 382.22 1259.22 0.16 7870.13
Total 47881 95927.72 143808.72 132.60 56893.66
30Per Capita expenditure / number of States/ UTs 31Total Expenditure on Rural Development / Population
0
10
20
30
40
18
8
5
Key Sector-wise grouping of States based on their expenditure on Transport
Above Average
Around Average
Below Average
4.5.5
35 UNION AND STATES FINANCE AT A GLANCE
Chapter-5
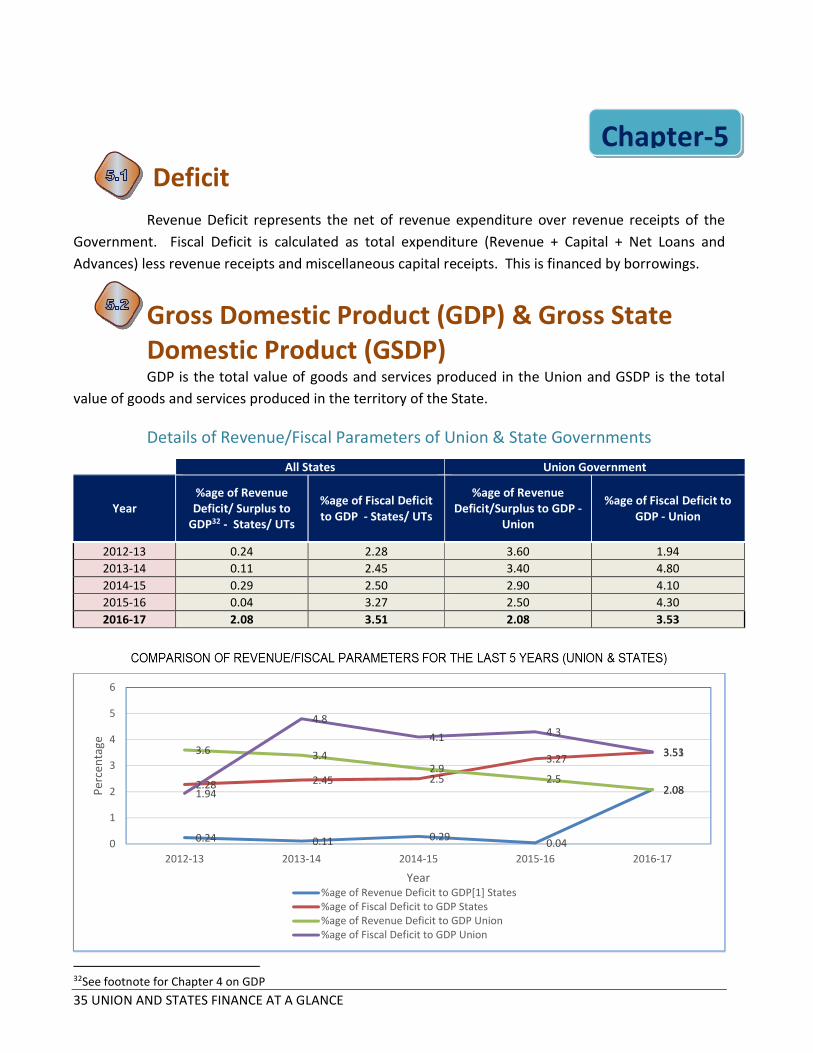
Deficit
Revenue Deficit represents the net of revenue expenditure over revenue receipts of the
Government. Fiscal Deficit is calculated as total expenditure (Revenue + Capital + Net Loans and
Advances) less revenue receipts and miscellaneous capital receipts. This is financed by borrowings.
Gross Domestic Product (GDP) & Gross State Domestic Product (GSDP) GDP is the total value of goods and services produced in the Union and GSDP is the total
value of goods and services produced in the territory of the State.
Details of Revenue/Fiscal Parameters of Union & State Governments
All States Union Government
Year %age of Revenue Deficit/ Surplus to
GDP32 - States/ UTs
%age of Fiscal Deficit to GDP - States/ UTs
%age of Revenue Deficit/Surplus to GDP -
Union
%age of Fiscal Deficit to GDP - Union
2012-13 0.24 2.28 3.60 1.94
2013-14 0.11 2.45 3.40 4.80
2014-15 0.29 2.50 2.90 4.10
2015-16 0.04 3.27 2.50 4.30
2016-17 2.08 3.51 2.08 3.53
32See footnote for Chapter 4 on GDP
0.24 0.11 0.290.04
2.082.28 2.45 2.5
3.273.513.6 3.4
2.92.5
2.081.94
4.8
4.1 4.3
3.53
0
1
2
3
4
5
6
2012-13 2013-14 2014-15 2015-16 2016-17
Per
cen
tage
Year%age of Revenue Deficit to GDP[1] States%age of Fiscal Deficit to GDP States%age of Revenue Deficit to GDP Union%age of Fiscal Deficit to GDP Union

36 UNION AND STATES FINANCE AT A GLANCE
State Governments have enacted the Fiscal Responsibility and Budget management (FRBM) Act which
specifies Targets for the fiscal parameters like Revenue Deficit / Surplus, fiscal deficit , Debt and other
obligations, guarantees, etc.
Each State government targeted to eliminate Revenue Deficit and maintain a Revenue Surplus. Despite
this ten states/ UTs including Puducherry had a Revenue Deficit during 2016-17.
Three States viz. Arunachal Pradesh, Mizoram and Sikkim had Fiscal Surplus during 2016-17.
In respect of Fiscal deficit to GSDP ratio the states are required to maintain the ratio at 3.0 per cent.
Fourteen states have crosssed the target of 3.0 per cent during the year. The average Fiscal deficit to
GSDP ratio is 3.51 per cent during 2016-17.

37 UNION AND STATES FINANCE AT A GLANCE
State Governments’ performance under Fiscal Responsibility and Budget Management Act (FRBMA)
As per the recommendations of the Fourteenth Finance Commission, the State Governments are required to amend their Fiscal Responsibility and Budget Management (FRBM) Acts. In terms of the Act, the State Governments shall, by rules, specify the fiscal rules suggested for the FRBM Acts of States by the Finance Commission constituted by the President of India. The targets for the States as per the fiscal rules framed by the State Governments and achievements/shortfalls there against are depicted in the graphs below:
20320.07
-10621.86
-31937.77
-5381.83
-35658.11-40000
-30000
-20000
-10000
0
10000
20000
30000
2012-13 2013-14 2014-15 2015-16 2016-17
(₹ i
n C
rore
)
Trend of Revenue Deficit/ Surplus
-196146.08-240500.75
-278112.08
-430694.45-536099.78
-600000
-500000
-400000
-300000
-200000
-100000
0
2012-13 2013-14 2014-15 2015-16 2016-17
(₹ i
n C
rore
)
Trend of Fiscal Deficit

38 UNION AND STATES FINANCE AT A GLANCE
Chapter- 6 Public Debt
State Government, in order to carry out its day today activities, raises money from Public, Public Sector
Undertakings through loans, by obtaining Ways and Means Advance from Reserve Bank of India and also
through loans and advances from the Government of India. Public Debt comprises Internal Debt and
External Debt in respect of Union Government whereas Loans and Advances from the Central
Government instead of External Loans constitute Public Debt of the State Governments. The
Government also encourages Small Savings from the Public, which are used for funding its activities.
Public debt:
The Public Debt consists of market loans, loans from banks/financial institutions, and loans and advances
from the GoI. The Constitution of India provides that a State may borrow, within the territory of India,
upon the security of its Consolidated Fund, within such limits as may from time to time, be fixed by the
Act of its Legislature and give guarantees within such limits as may be fixed.
Union Government
57,41,70996%
2,28,2594%
Components of Public Debt -Union ( in Crore)
Internal Debt
External Debt
3941854.82 4425347.67 4935804.815515097.55 5969968.20
0
2000000
4000000
6000000
8000000
2012-13 2013-14 2014-15 2015-16 2016-17
(₹ in
Cro
re)
Public Debt -Union Government: trends
Union Government Amount
( in Crore)
Internal Debt 5741709
External Debt 228259
Total 5969968
6.1.1

39 UNION AND STATES FINANCE AT A GLANCE
State Governments The Public debt (closing balance) to GSDP ratio during the period 2016-17 is
presented in Table below:
State Internal Debt (₹
in crore)
Loans from Central
Government (₹ in crore)
Total Public debt
(₹ in crore) GSDP
Public Debt to GSDP Ratio
NCT Delhi 0.00 30018.00 30018.00 616826.00 4.87 Chhattisgarh 28330.29 2047.15 30377.44 290139.70 10.47
Assam 26736.66 1429.78 28166.44 257510.21 10.94
Odisha 34553.42 7465.02 42018.44 378991.26 11.09
Arunachal Pradesh 2522.36 231.84 2754.20 24056.24 11.45
Karnataka 132489.05 13793.61 146282.66 1117334.00 13.09
Maharashtra 293951.78 7885.84 301837.62 2267789.00 13.31
Gujarat 192771.64 6566.32 199337.96 1125654.00 17.71
Tripura 6335.65 267.71 6603.36 36879.70 17.91
Uttarakhand 34555.05 654.54 35209.59 195192.21 18.04
Sikkim 3395.68 110.45 3506.13 18852.00 18.60
Meghalaya 5378.14 128.15 5506.29 29567.00 18.62
Telangana 112829.77 8406.00 121235.77 646265.00 18.76
Madhya Pradesh 108391.34 13917.10 122308.44 640483.64 19.10
Kerala 118268.72 7614.14 125882.86 655205.00 19.21
Tamil Nadu 237700.67 14337.94 252038.61 1298511.06 19.41
Goa 11162.39 1233.03 12395.42 62661.00 19.78
Jharkhand 48682.31 2162.29 50844.60 253536.11 20.05
Andhra Pradesh 140782.90 9025.33 149808.23 699307.00 21.42
Mizoram 3081.12 291.19 3372.31 15211.93 22.17
Manipur 4898.91 366.96 5265.87 23324.95 22.58
Haryana 122616.87 1985.86 124602.73 547396.06 22.76
West Bengal 282069.06 13209.12 295278.18 1251067.42 23.60
Uttar Pradesh 288626.78 13249.62 301876.40 1275141.00 23.67
Bihar 96595.00 9595.81 106190.81 438030.00 24.24
Rajasthan 184284.58 11139.37 195423.95 749692.00 26.07
Puducherry 5461.50 1784.78 7246.28 27739.00 26.12
Himachal Pradesh 31494.03 1076.43 32570.46 124570.00 26.15
Jammu and Kashmir 34266.75 1489.20 35755.95 115654.00 30.92
Nagaland 6930.07 185.80 7115.87 21119.00 33.69
Punjab 149880.15 3893.00 153773.15 427297.00 35.99
Grand Total 2749042.64 185561.38 2934604.02 15631002.49
1611723.37 1784131.96 1955146.602332512.02
2934604.02
0.00
1000000.00
2000000.00
3000000.00
4000000.00
2012-13 2013-14 2014-15 2015-16 2016-17
(₹ in
Cro
re)
Trends of Public Debt (All States)
6.1.2

40 UNION AND STATES FINANCE AT A GLANCE
Debt-GSDP ratio is an important indicator which signifies sustainability of the fiscal
liability. Punjab had the highest debt to GSDP ratio followed by Nagaland and Jammu & Kashmir
where debt to GSDP ratio is more than thirty per cent. NCT of Delhi, Chhattisgarh, Assam, Odisha,
Arunachal Pradesh, Karnataka, Maharashtra, Gujarat, Tripura, Uttarakhand, Sikkim, Meghalaya,
Telangana, Madhya Pradesh, Mizoram, Kerala, Tamil Nadu and Goa had the lowest debt to GSDP
ratio less than twenty per cent. The debt-GSDP ratio in respect of Special Category and General
Category states is depicted below:
0.005.00
10.0015.0020.0025.0030.0035.0040.00
An
dh
ra P
rad
esh
Aru
nac
hal
Pra
des
h
Ass
am
Bih
ar
Ch
hat
tisg
arh
NC
T D
elh
i
Go
a
Pu
du
cher
ry
Gu
jara
t
Har
yan
a
Him
ach
al P
rad
esh
Jam
mu
an
d K
ash
mir
Jhar
khan
d
Kar
nat
aka
Ker
ala
Mad
hya
Pra
des
h
Mah
aras
htr
a
Man
ipu
r
Meg
hal
aya
Miz
ora
m
Nag
alan
d
Od
ish
a
Pu
nja
b
Raj
asth
an
Sikk
im
Tam
il N
adu
Tela
nga
na
Trip
ura
Utt
ar P
rad
esh
Utt
arak
han
d
Wes
t B
enga
l
De
bt-
GSD
P r
atio
States
Public Debt to GSDP Ratio - General Category States / UTs
0.00
5.00
10.00
15.00
20.00
25.00
30.00
35.00
40.00
ArunachalPradesh
Assam HimachalPradesh
Jammuand
Kashmir
Manipur Meghalaya Mizoram Nagaland Sikkim Tripura
Deb
t-G
SDP
rat
io
States
Public Debt to GSDP Ratio - Special Category states
Average: 21.00
Average: 19.47

41 UNION AND STATES FINANCE AT A GLANCE
Chapter-7 Public Account All other public moneys received by or on behalf of the Government, where the Government acts
as a banker or trustee, are credited to the Public Account. The Public Account includes repayables
like Small Saving and provident Funds, Deposits (bearing interest and not bearing interest),
Advances, Reserve Funds (bearing interest and not bearing interest), Remittances and Suspense
heads (both of which are transitory heads, pending final booking). The net cash balance available
with the Government is also included under the Public Account. The Public account is not subject
to the vote of the Legislature.
Liabilities on Public Account:
The other liabilities comprise small savings, provident funds, etc., Reserve Funds and deposits. As
on 31st March 2017, total liabilities on Public Account were ₹ 887474 crore. Interest bearing
liabilities amounted to ₹ 527755 crore and the remaining ₹ 359715 crore were non-interest
bearing. State-wise outstanding liabilities on Public Account are presented in Table below:
7.1.1

42 UNION AND STATES FINANCE AT A GLANCE
Liabilities on Public Account (₹ in crore)
State/Union Territory Small Savings Reserve Funds
Bearing interest
Reserve Funds Not
Bearing interest
Deposits Bearing interest
Deposits Total Liabilities on
Public Account
Not Bearing interest
Andhra Pradesh 13568 305 2323 6246 29064 51506
Arunachal Pradesh 1761 66 520 68 456 2871
Assam 10179 2791 14 311 2519 15814
Bihar 8891 696 26 88 22829 32530
Chhattisgarh 4592 693 1650 71 6047 13053
Delhi 0 0 0 0 0 0
Goa 2079 759 15 936 640 4429
Gujarat 10060 3493 1220 12088 16947 43808
Haryana 13321 1968 66 397 6016 21768
Himachal Pradesh 11844 1 219 8 2602 14674
Jammu & Kashmir 19363 590 1285 66 5149 26453
Jharkhand 1076 1259 0 10 13638 15983
Karnataka 24919 1235 15148 343 23141 64786
Kerala 60571 116 307 2 2890 63886
Madhya Pradesh 14493 771 6447 3 11778 33492
Maharashtra 24645 441 9198 37845 21892 94021
Manipur 1513 41 472 127 1388 3541
Meghalaya 1374 30 7 1 2067 3479
Mizoram 2921 -5 7 3 886 3812
Nagaland 891 15 -16 95 832 1817
Odisha 20118 1451 308 54 7674 29605
Puducherry 603 0 -64 98 415 1052
Punjab 20604 4869 1 749 2530 28753
Rajasthan 38894 394 1229 4688 14373 59578
Sikkim 831 4 90 29 212 1166
Tamil Nadu 19325 0 1342 2581 8107 31355
Telangana 6594 110 521 603 5675 13503
Tripura 3751 109 5 0 791 4656
Uttar Pradesh 48238 44 51015 3767 18327 121391
Uttarakhand 6390 272 85 406 2220 9373
West Bengal 13346 1029 -32 11619 16442 42404
Total 406755 23547 93408 83302 247547 854559
A graph showing the liabilities on account of Public Account with reference to the all India average is shown below:

43 UNION AND STATES FINANCE AT A GLANCE
Personal Deposit Accounts Personal Deposit Accounts form a part of the Deposits under the public account. They
are included under Deposits not bearing interest. The purpose of Personal Deposit Accounts is to
enable designated Drawing Officers to incur expenditure pertaining to a specific purpose, or
which funds are placed at their disposal, by transfer from the Consolidated Fund of the State.
Administrators of Personal Deposit Accounts are required to close such accounts at the end of
financial year and transfer the unspent balances back to the Consolidated Fund in accordance
with prevailing rules of the respective State Governments. The State Governments transfer huge
quantity of funds from the State Consolidated Fund to the Personal Deposits Accounts and these
funds are parked in Personal Deposits Accounts for many years to avoid lapse of grant.
A large number of Personal Deposit Accounts are being operated in the states of Andhra
Pradesh, Telangana, Maharashtra, Rajasthan, Uttar Pradesh, Kerala, Odisha Madhya Pradesh,
etc.
0
20000
40000
60000
80000
100000
120000
140000
An
dh
ra P
rad
esh
Aru
nac
hal
Pra
des
h
Ass
am
Bih
ar
Ch
hat
tisg
arh
Del
hi
Go
a
Gu
jara
t
Har
yan
a
Him
ach
al P
rad
esh
Jam
mu
& K
ash
mir
Jhar
khan
d
Kar
nat
aka
Ker
ala
Mad
hya
Pra
des
h
Mah
aras
htr
a
Man
ipu
r
Meg
hal
aya
Miz
ora
m
Nag
alan
d
Od
ish
a
Pu
du
cher
ry
Pu
nja
b
Raj
asth
an
Sikk
im
Tam
il N
adu
Tela
nga
na
Trip
ura
Utt
ar P
rad
esh
Utt
arak
han
d
Wes
t B
enga
l
`in
cro
re
Liabilities on Public Account
Liabilities on Public Account
Total Liabilities on Public Account Average =Rs. 59824 crore
7.1.2

44 UNION AND STATES FINANCE AT A GLANCE
In the States of Jammu & Kashmir, Jharkhand, Mizoram, NCT Delhi, Sikkim and Tripura,
Personal Deposits accounts were not operated by the State Governments during 2016-17.
Personal Deposit Accounts held by the State Governments at the end of March, 2017 are
indicated in the Table below:
State Total Number of PD Accounts at the end of March 31, 2017
Balance at the end of March 31, 2017 (₹ in lakh)
Dr./Cr.
Andhra Pradesh 58539 35,747.74 Cr.
Arunachal Pradesh 15 31.96 Cr.
Assam 26 60.10 Cr.
Bihar 177 4,45,877.30 Cr.
Chhattisgarh 281 1,89,247.49 Cr.
Goa 118 6,660.25 Cr.
Gujarat 478 39,527.13 Cr.
Haryana 124 23,487.02 Cr.
Himachal Pradesh 113 244.66 Cr.
Karnataka 64 2,94,211.13 Cr.
Kerala 1144 12,632.10 Cr.
Madhya Pradesh 799 5,35,037.78 Cr.
Maharashtra 2528 13,33,451.65 Cr.
Manipur 2 241.74 Cr.
Meghalaya 7 642.84 Cr.
Nagaland 1 2.39 Cr.
Odisha 827 45,639.58 Cr.
Punjab 161 3,449.78 Cr.
Rajasthan 1528 5,19,644.87 Cr.
Tamil Nadu 735 -44,192.36 Cr.
Telangana 28087 -3,336.9533 Cr.
U.T. Govt. Puducherry -0.11 Cr.
Uttar Pradesh 1317 1,333.48 Dr.
Uttarakhand 19 18,533.41 Cr.
West Bengal 153 5,14,070.38 Cr.
33Minus balance is due to un-apportionment of opening balance between Andhra Pradesh and Telangana.

45 UNION AND STATES FINANCE AT A GLANCE
While the number of PDAs in respect of Andhra Pradesh and Telangana is high the amount of
PDAs in respect of Maharashtra is the highest followed by Madhya Pradesh, Rajasthan and West
Bengal. In respect of Special Category states, Himachal Pradesh has the highest number of PDAs
while the highest amount of PDAs is in Meghalaya.
-₹ 2,00,000
₹ 0
₹ 2,00,000
₹ 4,00,000
₹ 6,00,000
₹ 8,00,000
₹ 10,00,000
₹ 12,00,000
₹ 14,00,000
₹ 16,00,000
0
10000
20000
30000
40000
50000
60000
70000
Am
ou
nt
in P
DA
s (i
n C
rore
)
Nu
mb
er o
f P
DA
s
Axis Title
Number and Amount in PDAs - General Category States/UTs
Total Number of PD Accounts at the end of March 31, 2017 Balance at the end of March 31, 2017
₹ 31.96 ₹ 60.10
₹ 244.66₹ 241.74
₹ 642.84
₹ 2.39 ₹ 0
₹ 100
₹ 200
₹ 300
₹ 400
₹ 500
₹ 600
₹ 700
0
20
40
60
80
100
120
ArunachalPradesh
Assam HimachalPradesh
Manipur Meghalaya Nagaland
Am
ou
nt
in P
DA
s (i
n C
rore
)
Nu
mb
er o
f P
DA
s
Axis Title
Number and Amount in PDAs - Special Category States
Total Number of PD Accounts at the end of March 31, 2017 Balance at the end of March 31, 2017

46 UNION AND STATES FINANCE AT A GLANCE
Assets and Liabilities
The Government accounts capture only the financial liabilities (debt) of the Government and the financial assets (investments) created out of the expenditure incurred by the Government. Other fixed assets in the form of Land, Buildings, Factories, etc. are not exhibited in the Government accounts at present.
The liabilities of Government of India viz. Internal and External debt and in the case of State Governments, Loans and Advances from Government of India constitute Public Debt for that Government. Besides these, liabilities of the Government also include Small Savings from public, Provident Fund from employees of Government and certain obligations like Insurance and Pension Funds and other deposits. Public Account also includes the Suspense and Remittance Account which are intermediary in operation of the accounts.
Assets and Liabilities and the Statement of Balances (Position as on 31st March 2017) (₹in crore)
Assets Union State Combined Liabilities Union State Combined
Cash 134804 295735 430539 Internal debt 5741709 2748583 8490293
Cash in treasuries and local Remittances
-7 3181 3175 External Debt 228259 0 228259
Departmental Balance
3869 1486 5355
Loans and Advances from Central Government 0 188888 188888
Permanent Cash Imprest 85 366 451
Non Plan Loans 0 36942 36942
Cash Balance Investments 125350 174983 300334 Pre 1984-85 Loans 0 97 97
Deposits with Reserve Bank of India 5505 -5117 389
Loans for State Plan Schemes 0 151576 151576
Investment from Earmarked Funds 0 120836 120836
Loans for Central Plan Schemes 0 -1 -1
Capital Expenditure 2185919 2812710 4998629
Loans for Central sponsored Plan Schemes 0 83 83
Contingency Fund (un-recouped) 0 628 628 Other Loans 0 191 191
Loans and Advances 275292 475902 751194
Inter State Settlement 0 74 74
Advances with departmental officers -396 4641 4245
Contingency Fund (corpus) 500 5098 5598
Suspense and Miscellaneous Balances
0 8435 8435 Small Saving Provident Fund 548348 406757 955106
Remittance Balances 12359 9274 21634 Deposits 182435 348802 531237
Reserve Funds 25665 218710 244375
Remittance Balances 0 10507 10507
Misc Capital Receipt 0 698 698
Suspense & Misc. Balances 21089 36323 57411
Total 2607978 3607325 6215303 Total 6748005 3964441 10712446
Cumulative excess of expenditure over Receipts 4140027 781321 4921348
Cumulative Excess of Assets over Liabilities 424206 424206
Total 6748005 4388647 11136652 Total 6748005 4388647 11136652