uniplot - a package to uniform and customize r graphics · 2011-11-16 · uniplot - a package to...
TRANSCRIPT

uniPlot - a package to uniform and customize R graphics
uniPlot - a package to uniform and customize Rgraphics
Sina Rueger
IDP Institute of Data Analysis and Process DesignZHAW Zurich University of Applied Sciences
useR!August 2011
1 / 20

uniPlot - a package to uniform and customize R graphics
uniPlot makes the work with graphical displays in R produced forreports less time intensive.
2 / 20

uniPlot - a package to uniform and customize R graphics
●●●●●
●
●●●● ●●●
● ●
●●●
●●
●●
●
●●
● ●●●●● ●● ●●
●●● ●
●●●●
●
●
●●●●●
●●
●
●
●●●
●
●
●
●
●●
●
●
● ●
●
●
●
●
●
●●
● ●
●●
●
●
●●●
●
● ●●
●
●●
●●
●
●
●● ●●
●
●
●
●
●
●●
●
●
●
●
●
●●
●
● ●●
●
●●
●
●
●
●
●
●
●
●●
●●
●
●
●
●
●
●
●●
●
●●
●●
●●
●●
●●
●
0.5 1.0 1.5 2.0 2.5
12
34
56
7
graphics
Petal.Width
Pet
al.L
engt
h
ggplot2
Petal.Width
Pet
al.L
engt
h
1
2
3
4
5
6
●●●
●●
●
●●●
● ●●
●
●●
●
●●
●
●
●
●
●
●
●
● ●●●
●●●●
●●
●●
●●
●
●●●
●
●
●
●
●●●
●
●
●
●
●●
●
●
●
●
●
●
●
●
●
●●
●
●
●
●
●
●
●
●●
●
●
●
●
●●
●
●
● ●
●
●
●●
●
●
●
●
●● ●●
●
●
●
●
●
●
●
●
●
●
●
●
●
●
●
●●
●
●
●
●
●
●
●
●
●
●
●
●●
●
●
●
●
●
●
●
●
●●
●
●
●
●●
●
●
●
●
●
●
●
0.5 1.0 1.5 2.0 2.5
lattice
Petal.Width
Pet
al.L
engt
h
1
2
3
4
5
6
7
0.0 0.5 1.0 1.5 2.0 2.5
●●●●●
●
●●●
● ●●
●
●●
●●
●
●●
●●
●
●●
● ●●●●●
●●●●
●●
●●●
●●●
●
●
●●●●●
●●
●
●
●●
●
●
●
●
●
●●
●
●
●●
●
●
●
●
●
●●
●●
●●
●
●
●●
●
●
● ●●
●
●●
●●
●
●
●● ●●
●
●
●
●
●
●●
●
●
●
●
●
●●
●
●●
●●
●●
●
●
●
●
●
●
●
●●
●●
●
●
●
●
●
●
●●
●
●●
●●
●●
●●
●●
●
3 / 20

uniPlot - a package to uniform and customize R graphics
Used packages for data analysis: graphics, ggplot2 andlattice
Writing a report → formatting of graphical displays necessary
4 / 20

uniPlot - a package to uniform and customize R graphics
●●●●●
●
●●●● ●●●
● ●
●●●
●●
●●
●
●●
● ●●●●● ●● ●●
●●● ●
●●●●
●
●
●●●●●
●●
●
●
●●●
●
●
●
●
●●
●
●
● ●
●
●
●
●
●
●●
● ●
●●
●
●
●●●
●
● ●●
●
●●
●●
●
●
●● ●●
●
●
●
●
●
●●
●
●
●
●
●
●●
●
● ●●
●
●●
●
●
●
●
●
●
●
●●
●●
●
●
●
●
●
●
●●
●
●●
●●
●●
●●
●●
●
0.5 1.0 1.5 2.0 2.5
12
34
56
7
graphics
Petal.Width
Pet
al.L
engt
h
> par(pch = 16, las = 1, mar = c(4, 4, 3, 2), cex = 0.5)
> plot(iris$Petal.Width, iris$Petal.Length, main = ’graphics’, xlab = ’Petal.Width’, ylab =
’Petal.Length’)
5 / 20

uniPlot - a package to uniform and customize R graphics
●●
●
●
●
●
●
●
●
● ●
●
●
●
●
●
●
●
●
●
●
●
●
●
●
● ●
●
●
●●
●●
●
●
●
●
●
●
●
●●●
●
●
●
●
●
●
●
●
●
●
●
●
●
●
●
●
●
●
●
●
●
●
●
●
●
●
●
●
●
●
●
●
●
●
●
●
●
●
●
●
●
● ●
●
●
●
●
●
●
●
●
●● ●
●
●
●
●
●
●
●
●
●
●
●
●
●
●
●
●
●
●
●
●
●
●
●
●
●
●
●
●
●
●
●
●
●
●
●
●
●
●
●
●
●
●
●
●
●●
●
●
●
●
●
●
●
0.5 1.0 1.5 2.0 2.5
1
2
3
4
5
6
7
graphics
Petal.Width
Pet
al.L
engt
h
6 / 20

uniPlot - a package to uniform and customize R graphics
ggplot2
Petal.Width
Pet
al.L
engt
h1
2
3
4
5
6
1
2
3
4
5
6
setosa
●●●●●
●●●●● ●●●
● ●●●●
●●
●●
●
●●● ●●●●● ●● ●●●●
● ●●
●●●●
●
●●●●●
virginica
●
●
●●
●
●
●
●
●●
●●
●
● ●●
●
●●
●
●
●
●
●
●●
●●
●●
●●
●
●
●
●
●●
●
●●
●●
●●
●●
●●
●
0.5 1.0 1.5 2.0 2.5
versicolor
●●
●
●
●●●
●
●
●
●
●●
●
●
● ●
●
●
●
●
●
●●
● ●
●●
●
●●●
●
●
● ●●
●●●
●●
●
●
●● ●●
●
●
0.5 1.0 1.5 2.0 2.5
> theme set(theme bw())
> qplot(Petal.Width, Petal.Length, data = iris, main = ’ggplot2’, xlab = ’Petal.Width’, ylab =
’Petal.Length’)
+ facet wrap( Species)
+ opts(axis.title.x = theme text(vjust = 0), panel.border = theme rect(colour = ’black’),
strip.background = theme rect(colour = "black", fill = ’black’), strip.text.x =
theme text(colour = ’white’)) 7 / 20

uniPlot - a package to uniform and customize R graphics
ggplot2
Petal.Width
Pet
al.L
engt
h
1
2
3
4
5
6
1
2
3
4
5
6
setosa
●●●●●
●●●●● ●●●
● ●●●●
●●
●●
●
●●● ●●●●● ●● ●●●●
● ●●
●●●●
●
●●●●●
virginica
●
●
●●
●
●
●
●
●●
●●
●
● ●●
●
●●
●
●
●
●
●
●●
●●
●●
●●
●
●
●
●
●●
●
●●
●●
●●
●●
●●
●
0.5 1.0 1.5 2.0 2.5
versicolor
●●
●
●
●●●
●
●
●
●
●●
●
●
● ●
●
●
●
●
●
●●
● ●
●●
●
●●●
●
●
● ●●
●●●
●●
●
●
●● ●●
●
●
0.5 1.0 1.5 2.0 2.5
8 / 20

uniPlot - a package to uniform and customize R graphics
lattice
Petal.Width
Pet
al.L
engt
h
1
2
3
4
5
6
7
0.0 0.5 1.0 1.5 2.0 2.5
●●●●●
●●●●●●●●
●●●●●
●●
●●
●
●●● ●●●●● ●●●●●●
●●●
●●●●
●
●●●●●
setosa
●●●
●
●●●
●
●
●●
●●
●
●
●●●
●
●
●
●
●●
●●●
●
●
●●●
●
●
●●●
●●●
●●
●
●
●●●●
●
●
versicolor1
2
3
4
5
6
7
●
●
●●
●
●
●
●
●●
●●
●
● ●●
●
●●
●
●
●
●
●
●●
●●
●●
●●
●
●
●
●
●●
●
●●
●●
●●
●●
●●
●
virginica
> trellis.par.set(strip.background = list(col = gray(0.2)), add.text = list(col = ’white’))
> xyplot(Petal.Length ∼ Petal.Width | Species, iris, main = ’lattice’, xlab = ’Petal.Width’, ylab =
’Petal.Length’)9 / 20

uniPlot - a package to uniform and customize R graphics
lattice
Petal.Width
Pet
al.L
engt
h
1
2
3
4
5
6
7
0.0 0.5 1.0 1.5 2.0 2.5
●●●●●
●●●●●●●●
●●●●●
●●
●●
●
●●● ●●●●● ●●●●●●
●●●
●●●●
●
●●●●●
setosa
●●●
●
●●●
●
●
●●
●●
●
●
●●●
●
●
●
●
●●
●●●
●
●
●●●
●
●
●●●
●●●
●●
●
●
●●●●
●
●
versicolor1
2
3
4
5
6
7
●
●
●●
●
●
●
●
●●
●●
●
● ●●
●
●●
●
●
●
●
●
●●
●●
●●
●●
●
●
●
●
●●
●
●●
●●
●●
●●
●●
●
virginica
10 / 20

uniPlot - a package to uniform and customize R graphics
Solutions
use only one package
use function ggplot2like package latticeExtra for ggplot2and lattice
adjust settings of packages graphics, ggplot2 and lattice
11 / 20

uniPlot - a package to uniform and customize R graphics
Idea of uniPlot
1 Synchronize options over graphics, ggplot2 and lattice byadjusting one of them.
2 Making these options persistent over one R session.
3 Reset option.
Simple usage!
12 / 20

uniPlot - a package to uniform and customize R graphics
Application
uniPlot(type = ’uniPlot’,
graphics = NULL,
ggplot2 = NULL,
lattice = NULL
)
13 / 20

uniPlot - a package to uniform and customize R graphics
> uniPlot()
●●●
●●
●
●●●
● ●●
●
●●
●
●●
●
●
●
●
●
●
●
● ●●●
●●●●
●●
●●
●●
●
●●●
●
●
●
●
●●●
●
●
●
●
●●
●
●
●
●
●
●
●
●
●
●●
●
●
●
●
●
●
●
●●
●
●
●
●
●●
●
●
● ●
●
●
●●
●
●
●
●
●● ●●
●
●
●
●
●
●
●
●
●
●
●
●
●
●
●
●●
●
●
●
●
●
●
●
●
●
●
●
●●
●
●
●
●
●
●
●
●
●●
●
●
●
●●
●
●
●
●
●
●
●
0.5 1.0 1.5 2.0 2.5
1
2
3
4
5
6
7
graphics
Petal.Width
Pet
al.L
engt
h
●●●
●●
●
●●●
● ●●
●
●●
●
●●
●
●
●
●
●
●
●
● ●●●
●●●●
●●
●●
●●
●
●●●
●
●
●
●
●●●
●
●
●
●
●●
●
●
●
●
●
●
●
●
●
●●
●
●
●
●
●
●
●
●●
●
●
●
●
●●
●
●
● ●
●
●
●●
●
●
●
●
●● ●●
●
●
●
●
●
●
●
●
●
●
●
●
●
●
●
●●
●
●
●
●
●
●
●
●
●
●
●
●●
●
●
●
●
●
●
●
●
●●
●
●
●
●●
●
●
●
●
●
●
●
lattice
Petal.Width
Pet
al.L
engt
h
1
2
3
4
5
6
7
●●●●●
●●●●●●●●
●●●●●
●●
●●
●
●●● ●●●●● ●●●●●●
●●●
●●●●
●
●●●●●
setosa
0.0 0.5 1.0 1.5 2.0 2.5
●●●
●
●●●
●
●
●●
●●
●
●
●●●
●
●
●
●
●●
●●●
●
●
●●●
●
●
●●●
●●●
●●
●
●
●●●●
●
●
versicolor
0.0 0.5 1.0 1.5 2.0 2.5
1
2
3
4
5
6
7
●
●
●●
●
●
●
●
●●
●●
●
● ●●
●
●●
●
●
●
●
●
●●
●●
●●
●●
●
●
●
●
●●
●
●●
●●
●●
●●
●●
●
virginica
ggplot2
Petal.Width
Pet
al.L
engt
h
1
2
3
4
5
6
1
2
3
4
5
6
setosa
●●●●●
●●●●● ●●●
● ●●●●
●●
●●
●
●●● ●●●●● ●● ●●●●
● ●●
●●●●
●
●●●●●
virginica
●
●
●●
●
●
●
●
●●
●●
●
● ●●
●
●●
●
●
●
●
●
●●
●●
●●
●●
●
●
●
●
●●
●
●●
●●
●●
●●
●●
●
0.5 1.0 1.5 2.0 2.5
versicolor
●●
●
●
●●●
●
●
●
●
●●
●
●
● ●
●
●
●
●
●
●●
● ●
●●
●
●●●
●
●
● ●●
●●●
●●
●
●
●● ●●
●
●
0.5 1.0 1.5 2.0 2.5
14 / 20
uniPlot - a package to uniform and customize R graphics
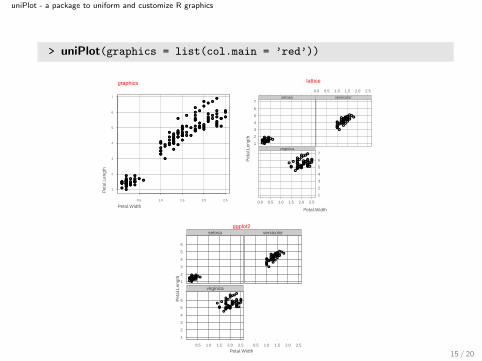
> uniPlot(graphics = list(col.main = ’red’))
●●●
●●
●
●●●
● ●●
●
●●
●
●●
●
●
●
●
●
●
●
● ●●●
●●●●
●●
●●
●●
●
●●●
●
●
●
●
●●●
●
●
●
●
●●
●
●
●
●
●
●
●
●
●
●●
●
●
●
●
●
●
●
●●
●
●
●
●
●●
●
●
● ●
●
●
●●
●
●
●
●
●● ●●
●
●
●
●
●
●
●
●
●
●
●
●
●
●
●
●●
●
●
●
●
●
●
●
●
●
●
●
●●
●
●
●
●
●
●
●
●
●●
●
●
●
●●
●
●
●
●
●
●
●
0.5 1.0 1.5 2.0 2.5
1
2
3
4
5
6
7
graphics
Petal.Width
Pet
al.L
engt
h
●●●
●●
●
●●●
● ●●
●
●●
●
●●
●
●
●
●
●
●
●
● ●●●
●●●●
●●
●●
●●
●
●●●
●
●
●
●
●●●
●
●
●
●
●●
●
●
●
●
●
●
●
●
●
●●
●
●
●
●
●
●
●
●●
●
●
●
●
●●
●
●
● ●
●
●
●●
●
●
●
●
●● ●●
●
●
●
●
●
●
●
●
●
●
●
●
●
●
●
●●
●
●
●
●
●
●
●
●
●
●
●
●●
●
●
●
●
●
●
●
●
●●
●
●
●
●●
●
●
●
●
●
●
●
lattice
Petal.Width
Pet
al.L
engt
h
1
2
3
4
5
6
7
●●●●●
●●●●●●●●
●●●●●
●●
●●
●
●●● ●●●●● ●●●●●●
●●●
●●●●
●
●●●●●
setosa
0.0 0.5 1.0 1.5 2.0 2.5
●●●
●
●●●
●
●
●●
●●
●
●
●●●
●
●
●
●
●●
●●●
●
●
●●●
●
●
●●●
●●●
●●
●
●
●●●●
●
●
versicolor
0.0 0.5 1.0 1.5 2.0 2.5
1
2
3
4
5
6
7
●
●
●●
●
●
●
●
●●
●●
●
● ●●
●
●●
●
●
●
●
●
●●
●●
●●
●●
●
●
●
●
●●
●
●●
●●
●●
●●
●●
●
virginica
ggplot2
Petal.Width
Pet
al.L
engt
h
1
2
3
4
5
6
1
2
3
4
5
6
setosa
●●●●●
●●●●● ●●●
● ●●●●
●●
●●
●
●●● ●●●●● ●● ●●●●
● ●●
●●●●
●
●●●●●
virginica
●
●
●●
●
●
●
●
●●
●●
●
● ●●
●
●●
●
●
●
●
●
●●
●●
●●
●●
●
●
●
●
●●
●
●●
●●
●●
●●
●●
●
0.5 1.0 1.5 2.0 2.5
versicolor
●●
●
●
●●●
●
●
●
●
●●
●
●
● ●
●
●
●
●
●
●●
● ●
●●
●
●●●
●
●
● ●●
●●●
●●
●
●
●● ●●
●
●
0.5 1.0 1.5 2.0 2.5
15 / 20

uniPlot - a package to uniform and customize R graphics
> uniPlot(graphics = list(pch = 16, reference.col = gray(0.8), tcl
= (-0.5), col.main = ’black’), lattice = list(strip.background.col =
"green3"))
0.5 1.0 1.5 2.0 2.5
1
2
3
4
5
6
7
graphics
Petal.Width
Pet
al.L
engt
h
●●●
●●
●
●●●
● ●●
●
●●
●
●●
●
●
●
●
●
●
●
● ●●●
●●●●
●●
●●
●●
●
●●●
●
●
●
●
●●●
●
●
●
●
●●
●
●
●
●
●
●
●
●
●
●●
●
●
●
●
●
●
●
●●
●
●
●
●
●●
●
●
● ●
●
●
●●
●
●
●
●
●● ●●
●
●
●
●
●
●
●
●
●
●
●
●
●
●
●
●●
●
●
●
●
●
●
●
●
●
●
●
●●
●
●
●
●
●
●
●
●
●●
●
●
●
●●
●
●
●
●
●
●
●
lattice
Petal.Width
Pet
al.L
engt
h
1
2
3
4
5
6
7
●●●●●
●●●●●●●●
●●●●●
●●
●●
●
●●● ●●●●● ●●●●●●
●●●
●●●●
●
●●●●●
setosa
0.0 0.5 1.0 1.5 2.0 2.5
●●●
●
●●●
●
●
●●
●●
●
●
●●●
●
●
●
●
●●
●●●
●
●
●●●
●
●
●●●
●●●
●●
●
●
●●●●
●
●
versicolor
0.0 0.5 1.0 1.5 2.0 2.5
1
2
3
4
5
6
7
●
●
●●
●
●
●
●
●●
●●
●
● ●●
●
●●
●
●
●
●
●
●●
●●
●●
●●
●
●
●
●
●●
●
●●
●●
●●
●●
●●
●
virginica
ggplot2
Petal.Width
Pet
al.L
engt
h
1
2
3
4
5
6
1
2
3
4
5
6
setosa
●●●●●
●●●●●●●●
●●●●●
●●
●●
●
●●● ●●●●● ●●●●●●
●●●
●●●●
●
●●●●●
virginica
●
●
●●
●
●
●
●
●●
●●
●
● ●●
●
●●
●
●
●
●
●
●●
●●
●●
●●
●
●
●
●
●●
●
●●
●●
●●
●●
●●
●
0.5 1.0 1.5 2.0 2.5
versicolor
●●
●
●
●●●
●
●
●
●
●●
●
●
●●
●
●
●
●
●
●●
●●
●●
●
●●●
●
●
●●●
●●●
●●
●
●
●●●●
●
●
0.5 1.0 1.5 2.0 2.5 16 / 20

uniPlot - a package to uniform and customize R graphics
> uniPlot(type = ’before’) ## reset options
0.5 1.0 1.5 2.0 2.5
12
34
56
7
graphics
Petal.Width
Pet
al.L
engt
h
●●●●●
●
●●●● ●●●
● ●
●●●
●●
●●
●
●●
● ●●●●● ●● ●●
●●● ●
●●●●
●
●
●●●●●
●●
●
●
●●●
●
●
●
●
●●
●
●
● ●
●
●
●
●
●
●●
● ●
●●
●
●
●●●
●
● ●●
●
●●
●●
●
●
●● ●●
●
●
●
●
●
●●
●
●
●
●
●
●●
●
● ●●
●
●●
●
●
●
●
●
●
●
●●
●●
●
●
●
●
●
●
●●
●
●●
●●
●●
●●
●●
●
lattice
Petal.Width
Pet
al.L
engt
h
1
2
3
4
5
6
7
0.0 0.5 1.0 1.5 2.0 2.5
●●●●●
●●●●●●●●
●●●●●
●●
●●
●
●●● ●●●●● ●●●●●●
●●●
●●●●
●
●●●●●
setosa
●●●
●
●●●
●
●
●●
●●
●
●
●●●
●
●
●
●
●●
●●●
●
●
●●●
●
●
●●●
●●●
●●
●
●
●●●●
●
●
versicolor1
2
3
4
5
6
7
●
●
●●
●
●
●
●
●●
●●
●
● ●●
●
●●
●
●
●
●
●
●●
●●
●●
●●
●
●
●
●
●●
●
●●
●●
●●
●●
●●
●
virginica
ggplot2
Petal.Width
Pet
al.L
engt
h
1
2
3
4
5
6
1
2
3
4
5
6
setosa
●●●●●
●●●●● ●●●
● ●●●●
●●
●●
●
●●● ●●●●● ●● ●●●●
● ●●
●●●●
●
●●●●●
virginica
●
●
●●
●
●
●
●
●●
●●
●
● ●●
●
●●
●
●
●
●
●
●●
●●
●●
●●
●
●
●
●
●●
●
●●
●●
●●
●●
●●
●
0.5 1.0 1.5 2.0 2.5
versicolor
●●
●
●
●●●
●
●
●
●
●●
●
●
● ●
●
●
●
●
●
●●
● ●
●●
●
●●●
●
●
● ●●
●●●
●●
●
●
●● ●●
●
●
0.5 1.0 1.5 2.0 2.5
17 / 20

uniPlot - a package to uniform and customize R graphics
Open Points
clean up code → gaps in alignment of options, lists insynchronizing
creating styles / allowing themes
color palettes
show settings
18 / 20

uniPlot - a package to uniform and customize R graphics
Contact
Sina RuegerIDP, ZHAWRosenstrasse 3CH - 8401 [email protected]
19 / 20

uniPlot - a package to uniform and customize R graphics
Chambers, J.M. (2008) Software for data analysis: programmingwith R. Springer.R Development Core Team (2011) Writing R Extensions.Sarkar, D. (2008) Lattice: multivariate data visualization with R.Springer.Tufte, E.R. (1983) The visual display of quantitative information.Graphics Press.Wickham, H. (2009) ggplot2: elegant graphics for data analysis.Springer.
20 / 20