uniqa insurance group ag fy17 preliminary results · grafik aus excel sheet „investment“...
TRANSCRIPT

FY17 results right on target
UNIQA Insurance Group AG
FY17 Preliminary Results
28 February 2018
Andreas Brandstetter, CEO
Kurt Svoboda, CFO/CRO, CEO UNIQA Austria
Dezimal = Punkt Tausender = Komma Abgekürzt immer = 1Q15 Euro Millionen = EUR xm

UNIQA Investor Relations
Group Strategy &
Results
Highlights
Group Results
Outlook
Appendix:
Additional
Information
Business Performance Operating Segments
Asset Management
Shareholder Information
FY17
2
Executive Summary FY17
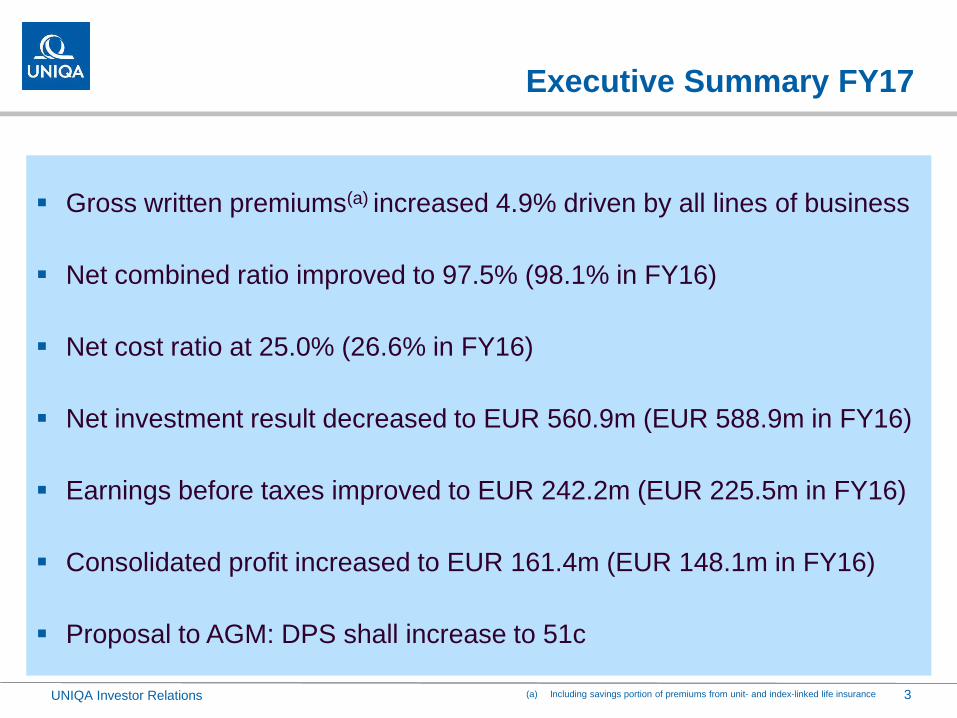
Gross written premiums(a) increased 4.9% driven by all lines of business
Net combined ratio improved to 97.5% (98.1% in FY16)
Net cost ratio at 25.0% (26.6% in FY16)
Net investment result decreased to EUR 560.9m (EUR 588.9m in FY16)
Earnings before taxes improved to EUR 242.2m (EUR 225.5m in FY16)
Consolidated profit increased to EUR 161.4m (EUR 148.1m in FY16)
Proposal to AGM: DPS shall increase to 51c
UNIQA Investor Relations (a) Including savings portion of premiums from unit- and index-linked life insurance 3
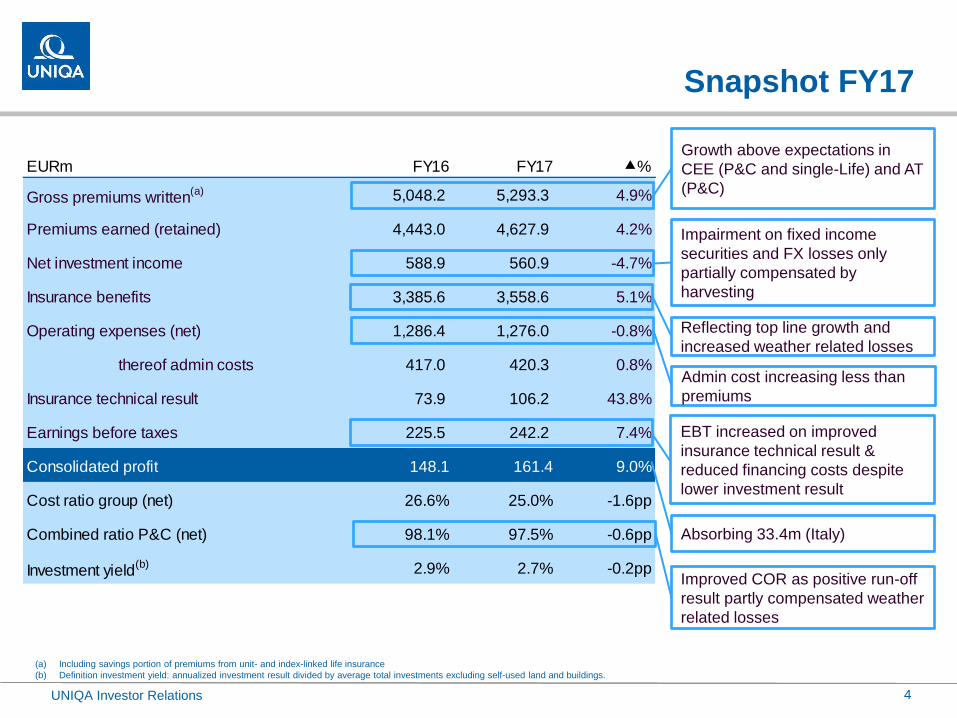
EURm FY16 FY17 %
Gross premiums written(a) 5,048.2 5,293.3 4.9%
Premiums earned (retained) 4,443.0 4,627.9 4.2%
Net investment income 588.9 560.9 -4.7%
Insurance benefits 3,385.6 3,558.6 5.1%
Operating expenses (net) 1,286.4 1,276.0 -0.8%
thereof admin costs 417.0 420.3 0.8%
Insurance technical result 73.9 106.2 43.8%
Earnings before taxes 225.5 242.2 7.4%
Consolidated profit 148.1 161.4 9.0%
Cost ratio group (net) 26.6% 25.0% -1.6pp
Combined ratio P&C (net) 98.1% 97.5% -0.6pp
Investment yield(b) 2.9% 2.7% -0.2pp
Snapshot FY17
UNIQA Investor Relations
(a) Including savings portion of premiums from unit- and index-linked life insurance
(b) Definition investment yield: annualized investment result divided by average total investments excluding self-used land and buildings.
4
Growth above expectations in
CEE (P&C and single-Life) and AT
(P&C)
Reflecting top line growth and
increased weather related losses
EBT increased on improved
insurance technical result &
reduced financing costs despite
lower investment result
Improved COR as positive run-off
result partly compensated weather
related losses
Impairment on fixed income
securities and FX losses only
partially compensated by
harvesting
Admin cost increasing less than
premiums
Grafik aus Excel Sheet „Overview“
Absorbing 33.4m (Italy)

155% 153%
194% 202%
250%
161% 150%
182%
215% 216%
FY13 FY14 FY15 FY16 FY17e
SCR ECR1.21
0.94
1.09
0.480.53
FY13 FY14 FY15 FY16 FY17
14.6%15.6%
17.2%
10.0% 9.3%
FY13 FY14 FY15 FY16 FY17
8.98
10.0010.20
10.34 10.35
FY13 FY14 FY15 FY16 FY17
Key Financial Indicators
UNIQA Investor Relations
Earnings per share (EUR)
Regulatory and Economic Capital Position (%)
Operating Return on Equity (%) Book value per share (EUR)
5
Grafik aus Excel Sheet „Share Charts“
EPS: Net Income / 308.2 SI: von Zottl per Mail
RoE von Stefan BvPS: Shareholder‘s equity
/ 308.2
b) Operating ROE = (EBT excl. goodwill amortisation)/(own funds excl. revaluation reserve)
~ ~

UNIQA Investor Relations
Group Strategy &
Results
Highlights
Group Results
Outlook
Appendix:
Additional
Information
Business Performance Operating Segments
Asset Management
Shareholder Information
FY17
6

2,518 2,640
1,0041,042
1,3571,358
169254
5,0485,293
4.9%
FY16 FY17
2,419 2,439 2,518 2,640
926 964 1,0041,042
1,405 1,367 1,3571,358
275 441 169254
5,0265,211
5,0485,293
4.9%
2014 2015 2016 2017
Continued growth above expectations
in all business lines
UNIQA Investor Relations
Gross written premium(a) per business line EURm
(a) Including savings portion of premiums from unit- and index-linked life insurance 7
Offen?
581
816
626 607 591
248
270
253 261 258
354
361
331 313 352
52
65
77 64 47
1,236
1,512
1,2871,245 1,249
1.1%
4Q16 1Q17 2Q17 3Q17 4Q17
P&C Health Life - recurring Life - single
Robust growth of P&C business (+4.8%) driven by motor and other P&C in AT, corporate business/fronting in Ukraine and
motor in CE (total P&C AT +3.4%, CEE +5.8%)
Health business continued solid growth (+3.8%), especially in CEE
Life business grew 5.6% in FY17: Strong unit linked single premium business in PL overcompensating expected reduction
of traditional life business in AT
Grafik aus Excel Sheet „Charts “
(Erklärung für dieses Sheet in eigener Doku)
FÜR 2Q16: Jahre raus und
dafür 8 Quartale links rollierend hineinstellen

Cost Ratio decreased to 25.0%
UNIQA Investor Relations 8
162 176159 158 153
6354
53 45 58
127 100102
94
123
352
331315
297
333
-5.3%
28.4%25.9% 24.1% 23.6%
26.5%
4Q16 1Q17 2Q17 3Q17 4Q17
Acquisition related expenses Other operating expenses
642646
228 210
417 420
1,286 1,276
-0.8%
26.6%25.0%
FY16 FY17
Cost ratio
614 632 642 646
226 212 228 210
361 346417 420
1,200 1,190
1,286 1,276
-0.8%
24.8%23.7%
26.6%25.0%
2014 2015 2016 2017
Net commissions (a)
Cost ratio (net) (%), Costs (EURm)
Net commissions increased at clearly slower pace than premium volume ytd
Acquisition related expenses decreased in FY17 compared to FY16; Mid-term downward trend reflecting strict cost control
Investments of EUR 40.9m in FY17 (Investments FY16: EUR 54.5m) included in other operating expenses
(a) Including changes in DAC (Deferred Acquisition Costs)
Grafik aus Excel Sheet „Charts “
(Erklärung für dieses Sheet in eigener Doku)
FÜR 2Q16: Jahre raus und
dafür 8 Quartale links rollierend hineinstellen
Kostenquote in rot?

62.2% 65.9% 64.4% 67.4% 66.0%
35.2%31.8% 31.5%
30.3% 32.8%
97.4% 97.7% 95.9%97.8% 98.8%
1.5
4Q16 1Q17 2Q17 3Q17 4Q17
Loss Ratio Expense Ratio
P&C: COR improved to 97.5% despite
weather impact
UNIQA Investor Relations
In FY17 weather related losses of approximately EUR 120m were approx. EUR 50m above average of last 7 years and
FY16 weather related losses
Continued portfolio management and positive run-off result compensated above average weather impact
P&C cost ratio slightly improved ytd
Investments decreased slightly to EUR 17.8m in FY17 (EUR 22.6m in FY16)
9
65.7% 65.9%
32.4% 31.6%
98.1% 97.5%
-0.6
FY16 FY17
69.0% 67.5% 65.7% 65.9%
30.6% 30.4% 32.4% 31.6%
99.5% 97.9% 98.1% 97.5%
2014 2015 2016 2017
Combined ratio (net) (%)
Grafik aus Excel Sheet „Charts “
(Erklärung für dieses Sheet in eigener Doku)
pp pp
pp
-8
27
20
16
21
N/A
4Q16 1Q17 2Q17 3Q17 4Q17
594
611
643
630
611
2.9%
4Q16 1Q17 2Q17 3Q17 4Q17
24
26
29
22
32
33.9%
4Q16 1Q17 2Q17 3Q17 4Q17
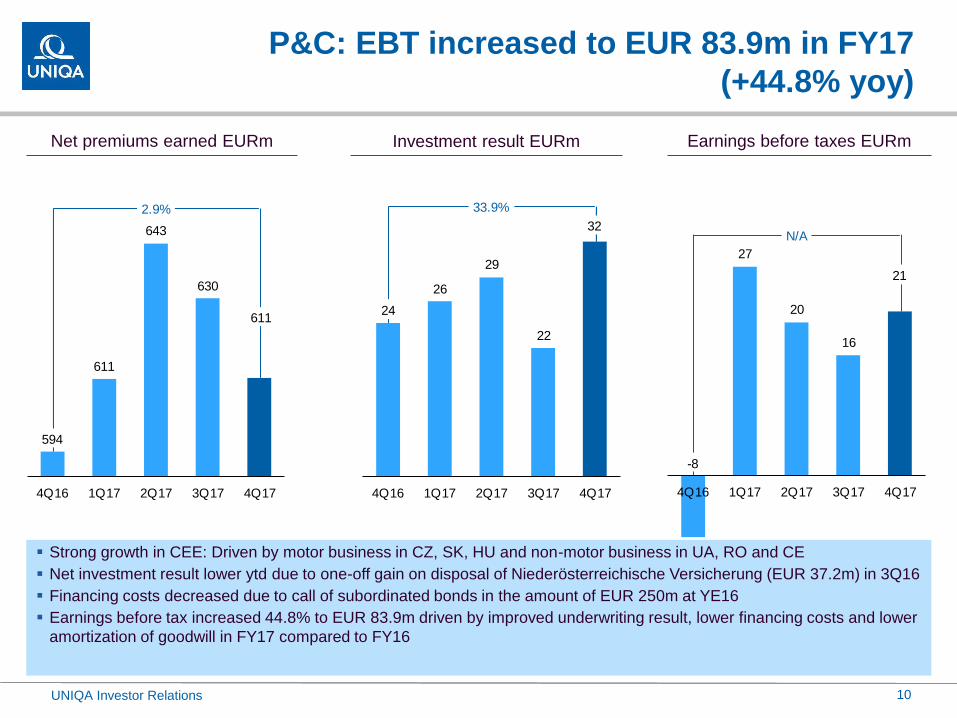
P&C: EBT increased to EUR 83.9m in FY17
(+44.8% yoy)
UNIQA Investor Relations
Strong growth in CEE: Driven by motor business in CZ, SK, HU and non-motor business in UA, RO and CE
Net investment result lower ytd due to one-off gain on disposal of Niederösterreichische Versicherung (EUR 37.2m) in 3Q16
Financing costs decreased due to call of subordinated bonds in the amount of EUR 250m at YE16
Earnings before tax increased 44.8% to EUR 83.9m driven by improved underwriting result, lower financing costs and lower
amortization of goodwill in FY17 compared to FY16
Net premiums earned EURm Investment result EURm Earnings before taxes EURm
10
Grafik aus Excel Sheet „Charts “
(Erklärung für dieses Sheet in eigener Doku)
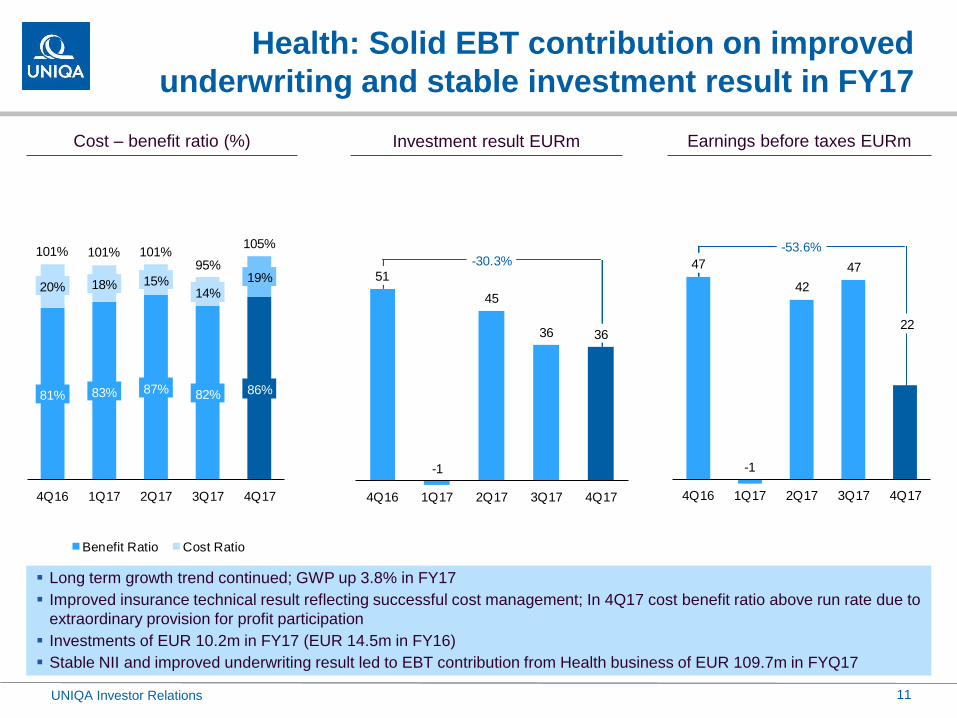
Health: Solid EBT contribution on improved
underwriting and stable investment result in FY17
UNIQA Investor Relations
Cost – benefit ratio (%) Investment result EURm Earnings before taxes EURm
11
81% 83% 87% 82% 86%
20% 18% 15%14%
19%
101% 101% 101%95%
105%
4Q16 1Q17 2Q17 3Q17 4Q17
Benefit Ratio Cost Ratio
51
-1
45
36 36
-30.3%
4Q16 1Q17 2Q17 3Q17 4Q17
47
-1
42
47
22
-53.6%
4Q16 1Q17 2Q17 3Q17 4Q17
Long term growth trend continued; GWP up 3.8% in FY17
Improved insurance technical result reflecting successful cost management; In 4Q17 cost benefit ratio above run rate due to
extraordinary provision for profit participation
Investments of EUR 10.2m in FY17 (EUR 14.5m in FY16)
Stable NII and improved underwriting result led to EBT contribution from Health business of EUR 109.7m in FYQ17
Grafik aus Excel Sheet „Charts “
(Erklärung für dieses Sheet in eigener Doku)

16,22415,970 15,803
15,775
15,78048
19
11
28
32
4Q16 1Q17 2Q17 3Q17 4Q17
Margin on Reserves (a)
Life: Decreased earnings before tax reflecting
lower net investment and other result in FY17
UNIQA Investor Relations
Reserves of traditional life business in AT declined in line with expectations in FY17
Growing top line (+5.6%) driven by single unit-linked business in Poland (EUR 144m in FY17)
Cost ratio improved on growing top-line; Investments of EUR 12.9m in FY17(EUR 17.4m in FY16)
Technical result stable, but lower net investment and other result led to lower EBT contribution of EUR 48.7m in FY17
Reserve (net) EURbn Investment result EURm Earnings before taxes EURm
12
94
51
84
10299
5.6%
4Q16 1Q17 2Q17 3Q17 4Q17
37
7
0
24
18
-52.7%
4Q16 1Q17 2Q17 3Q17 4Q17
Grafik aus Excel Sheet „Charts “
(Erklärung für dieses Sheet in eigener Doku)
(a) Definition margin on reserves: Annualized operating result divided by average technical reserves (b) Excluding Italy

82.1%
6.6%
5.5%
2.1% 3.7%
Bonds Real estate Cash Equities & Alternatives Participations
135
191209
281
218
142
190 182
108
145167 170
76
158 161 167
1Q
14
2Q
14
3Q
14
4Q
14
1Q
15
2Q
15
3Q
15
4Q
15
1Q
16
2Q
16
3Q
16
4Q
16
1Q
17
2Q
17
3Q
17
4Q
17
UNIQA Investor Relations
Investment Activity
Note: Excluding unit-linked investment income Quarterly figures excluding Italy
Investment income EUR
Investment allocation by asset class
13
Grafik aus Excel Sheet „Investment“
(Erklärung für dieses Sheet in eigener Doku)
Net investment result of EUR 560.9m in FY17
(EUR 588.9m in FY16)
Current income of EUR 510.6m in FY17 (EUR
537.1m in FY16)
Contribution from participation in STRABAG:
EUR +42.4m in FY17 (EUR 30.9m in FY16)
Realized and unrealized gains of EUR 50.3m in FY17
(EUR 51.8m in FY16); Impairments and FX losses
(USD) mitigated by realized and unrealized gains on
equities, real estate and fixed income securities
Total assets under management (excluding unit-and
index linked) slightly down compared to YE16
reflecting decreasing traditional life back book in
Austria
Real estate at amortized costs in IFRS balance sheet;
Market value according to external appraisals
significantly above book value
EUR 20.6bn
Dec 16
EUR 20.5bn
Dec 17
81.7%
6.0%
4.8%
3.4%4.1%

UNIQA Investor Relations
Group Strategy &
Results
Highlights
Group Results
Outlook
Appendix:
Additional
Information
Business Performance Operating Segments
Asset Management
Shareholder Information
FY17
14
Outlook
UNIQA Investor Relations 15
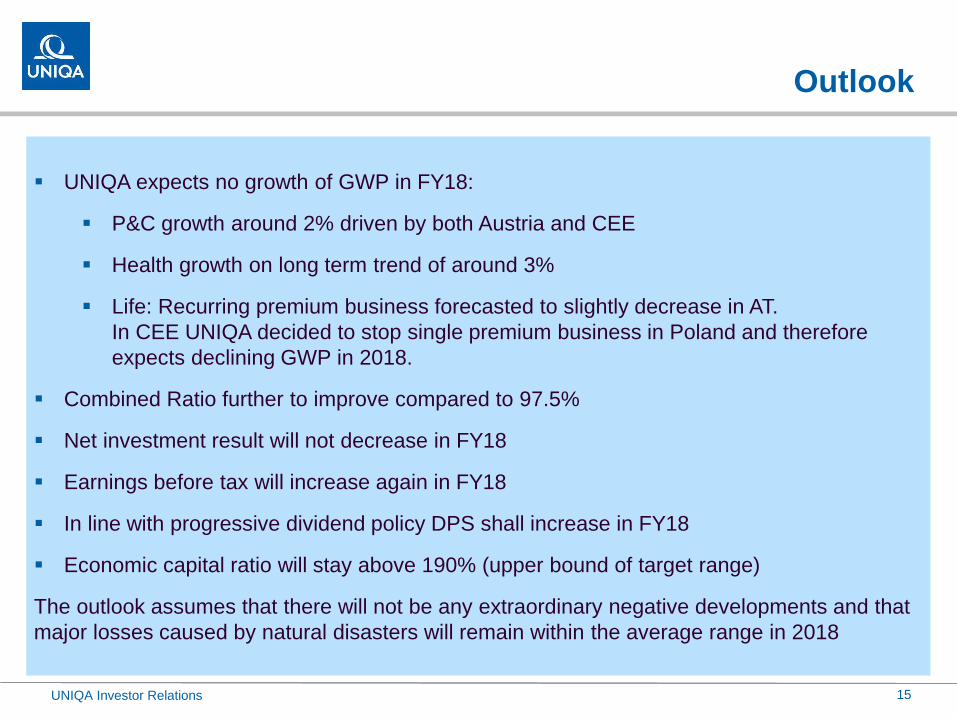
UNIQA expects no growth of GWP in FY18:
P&C growth around 2% driven by both Austria and CEE
Health growth on long term trend of around 3%
Life: Recurring premium business forecasted to slightly decrease in AT.
In CEE UNIQA decided to stop single premium business in Poland and therefore
expects declining GWP in 2018.
Combined Ratio further to improve compared to 97.5%
Net investment result will not decrease in FY18
Earnings before tax will increase again in FY18
In line with progressive dividend policy DPS shall increase in FY18
Economic capital ratio will stay above 190% (upper bound of target range)
The outlook assumes that there will not be any extraordinary negative developments and that
major losses caused by natural disasters will remain within the average range in 2018
UNIQA Investor Relations
Group Strategy &
Results
Highlights
Group Results
Outlook
Appendix:
Additional
Information
Business Performance Operating Segments
Asset Management
Shareholder Information
FY17
16

UNIQA Austria
Highlights
(a) Including savings portion of premiums from unit- and index-linked life insurance UNIQA Investor Relations 17
Grafik aus Excel Sheet „P&L AT RV UI RE
GRP “ (Erklärung für dieses Sheet
in eigener Doku)
Gross premiums written flattish ytd; stop of sale of single premium
business products in life segment (-55.0%) overcompensated by
growth in non-life (motor) business and health business
Net insurance claims and benefits up +2.6%; increasing loss ratio in
P&C due to summer storms; continued portfolio management and
positive run-off result compensated above average weather impact
Net operating expenses: commissions decreased due reduction of
new traditional life business; acquisition related expenses and other
operating expenses below FY16 level (investments of EUR 40.9m
in FY17 lower vs EUR 54.5m in FY16)
Net investment income slightly up reflecting realized and unrealized
profits and losses; downside impairment of FI subordinated debt in
1Q17 and FX effects
EBT increased as a result of higher insurance technical result
(driven by lower costs) and investment income development
EURm FY16 FY17 Δ yoy
Gross premiums written(a) 3,631.5 3,656.6 0.7%
Reinsurers' share -689.3 -665.2 -3.5%
Change due to premiums earned -0.7 0.0 -93.5%
Net Premiums Earned(a) 2,941.4 2,991.3 1.7%
Savings portion included in premiums -225.7 -226.4 0.3%
Premiums Earned 2,715.8 2,764.9 1.8%
Net Insurance Claims and Benefits -2,292.1 -2,350.7 2.6%
Expenditure for claims -2,761.4 -2,723.4 -1.4%
Change in actuarial reserves 542.5 466.2 -14.1%
Policyholder participation -73.2 -93.5 27.7%
Net Operating Expenses -589.2 -548.3 -6.9%
Net Commissions -209.8 -188.5 -10.2%
Acquisition related expenses -187.5 -169.6 -9.5%
Other operating expenses -192.0 -190.3 -0.9%
Allocated investment income 306.8 319.2 4.0%
other technical result -23.4 -24.3 3.9%
INSURANCE TECHNICAL RESULT 117.9 160.8 36.4%
Net Investment Income 460.1 462.4 0.5%
Allocated investment income -306.8 -319.2 4.0%
other non-technical result -14.6 -14.8 1.1%
OPERATING RESULT 256.5 289.2 12.7%
Amortisation of goodwill -3.5 -2.5 -28.6%
Financing costs -20.8 -25.1 20.7%
EARNIINGS BEFORE TAXES 232.2 261.6 12.7%

UNIQA Austria P&C
Financial Highlights
UNIQA Investor Relations 18
Grafik aus Excel Sheet „P&L AT RV UI RE
GRP “ (Erklärung für dieses Sheet
in eigener Doku)
Gross premium written increased 3.4% ytd caused by motor
business and property retail business growth; moderate growth of
other lines of business
Net insurance claims and benefits increased due to higher
expenditures for claims due to increased business volume and
numerous weather related losses
Continued portfolio management and positive run-off result
compensated above average weather impact (UAT COR at 91.8%)
Net commissions increased due to lower reinsurance relief
Investments decreased slightly to EUR 17.8m in FY17 (EUR 22.6m
in FY16)
Net investment income increased due to realized and unrealized
profits and losses; negative effects from FX
EBT increased ytd due to improved both insurance technical result
and investment income
EURm FY16 FY17 Δ yoy
Gross premiums written(a) 1,568.6 1,621.8 3.4%
Reinsurers' share -627.4 -621.7 -0.9%
Change due to premiums earned -0.3 -0.2 -44.4%
Net Premiums Earned(a) 940.9 999.9 6.3%
Savings portion included in premiums 0.0 0.0 N/A
Premiums Earned 940.9 999.9 6.3%
Net Insurance Claims and Benefits -648.0 -675.8 4.3%
Expenditure for claims -629.3 -652.7 3.7%
Change in actuarial reserves 0.1 0.0 -65.5%
Policyholder participation -18.8 -23.1 23.0%
Net Operating Expenses -233.9 -241.8 3.3%
Net Commissions -48.9 -78.1 59.5%
Acquisition related expenses -89.4 -79.3 -11.3%
Other operating expenses -95.6 -84.4 -11.7%
Allocated investment income 0.0 0.0 N/A
other technical result -4.2 -4.3 3.5%
INSURANCE TECHNICAL RESULT 54.8 78.0 42.2%
Net Investment Income 27.6 43.0 55.7%
Allocated investment income 0.0 0.0 N/A
other non-technical result -11.8 -10.8 -8.2%
OPERATING RESULT 70.6 110.2 55.9%
Amortisation of goodwill 0.0 0.0 N/A
Financing costs 0.0 0.0 N/A
EARNIINGS BEFORE TAXES 70.6 110.2 55.9%

UNIQA Austria Health
Financial Highlights
UNIQA Investor Relations 19
Grafik aus Excel Sheet „P&L AT RV UI RE
GRP “ (Erklärung für dieses Sheet
in eigener Doku)
Gross premiums written continued growth trend due to premium
adjustments and a successful cooperation with business partner
Hartlauer
Insurance claims and benefits increased due to higher expenditures
for claims (higher benefits paid in FY17)
Net operating expenses decreased -10.1% compared to FY16:
lower commissions (decrease of new business underwriting); lower
acquisition and operating expenses
Net investment income improved due to improved result of higher
realized and unrealized gains ytd
Strong EBT contribution from Health business of EUR 118.0m in
FY17; improved technical result and stable investment income level
EURm FY16 FY17 Δ yoy
Gross premiums written(a) 956.3 979.7 2.4%
Reinsurers' share -0.6 -0.2 -62%
Change due to premiums earned -0.4 -0.1 -86.0%
Net Premiums Earned(a) 955.3 979.4 2.5%
Savings portion included in premiums 0.0 0.0 N/A
Premiums Earned 955.3 979.4 2.5%
Net Insurance Claims and Benefits -821.8 -849.5 3.4%
Expenditure for claims -653.6 -678.2 3.8%
Change in actuarial reserves -124.2 -135.2 8.8%
Policyholder participation -44.0 -36.2 -17.8%
Net Operating Expenses -143.1 -128.7 -10.1%
Net Commissions -37.3 -27.8 -25.5%
Acquisition related expenses -52.0 -49.0 -5.7%
Other operating expenses -53.8 -51.9 -3.6%
Allocated investment income 77.7 81.3 4.6%
other technical result -0.1 0.1 N/A
INSURANCE TECHNICAL RESULT 68.0 82.6 21.5%
Net Investment Income 116.1 118.9 2.4%
Allocated investment income -77.7 -81.3 4.6%
other non-technical result -1.8 -2.2 21.4%
OPERATING RESULT 104.6 118.0 12.8%
Amortisation of goodwill 0.0 0.0 N/A
Financing costs 0.0 0.0 N/A
EARNIINGS BEFORE TAXES 104.6 118.0 12.8%

UNIQA Austria Life
Financial Highlights
(a) Including savings portion of premiums from unit- and index-linked life insurance UNIQA Investor Relations 20
Grafik aus Excel Sheet „P&L AT RV UI RE
GRP “ (Erklärung für dieses Sheet
in eigener Doku)
Decline in top line driven by reduction of single premium business;
recurring premium decline of -1.3% partly compensated with
increase of bank assurance business
Insurance claims and benefits decreased due to reduced volume of
single premium business
Net operating expenses: decline in commissions including DAC
effect is driven by reduction of sale of new traditional Life products;
acquisition related expenses decreased
Net investment income decreased primarily due to decreased
current income; partly mitigated by realized gains
Earnings before tax decreased driven by significantly lower
investment income ytd
EURm FY16 FY17 Δ yoy
Gross premiums written(a) 1,106.5 1,055.2 -4.6%
Reinsurers' share -61.4 -43.3 -29.4%
Change due to premiums earned 0.0 0.2 440.2%
Net Premiums Earned(a) 1,045.2 1,012.1 -3.2%
Savings portion included in premiums -225.7 -226.4 0.3%
Premiums Earned 819.5 785.7 -4.1%
Net Insurance Claims and Benefits -822.3 -825.4 0.4%
Expenditure for claims -1,478.5 -1,392.5 -5.8%
Change in actuarial reserves 666.6 601.4 -9.8%
Policyholder participation -10.4 -34.3 228.6%
Net Operating Expenses -212.2 -177.9 -16.2%
Net Commissions -123.5 -82.6 -33.1%
Acquisition related expenses -46.0 -41.2 -10.4%
Other operating expenses -42.6 -54.0 26.8%
Allocated investment income 229.2 237.9 3.8%
other technical result -19.1 -20.1 5.2%
INSURANCE TECHNICAL RESULT -5.0 0.2 N/A
Net Investment Income 316.4 300.5 -5.0%
Allocated investment income -229.2 -237.9 3.8%
other non-technical result -1.0 -1.7 74.1%
OPERATING RESULT 81.3 61.0 -24.9%
Amortisation of goodwill -3.5 -2.5 -28.6%
Financing costs -20.8 -25.1 20.7%
EARNIINGS BEFORE TAXES 57.0 33.5 -41.3%
UNIQA International
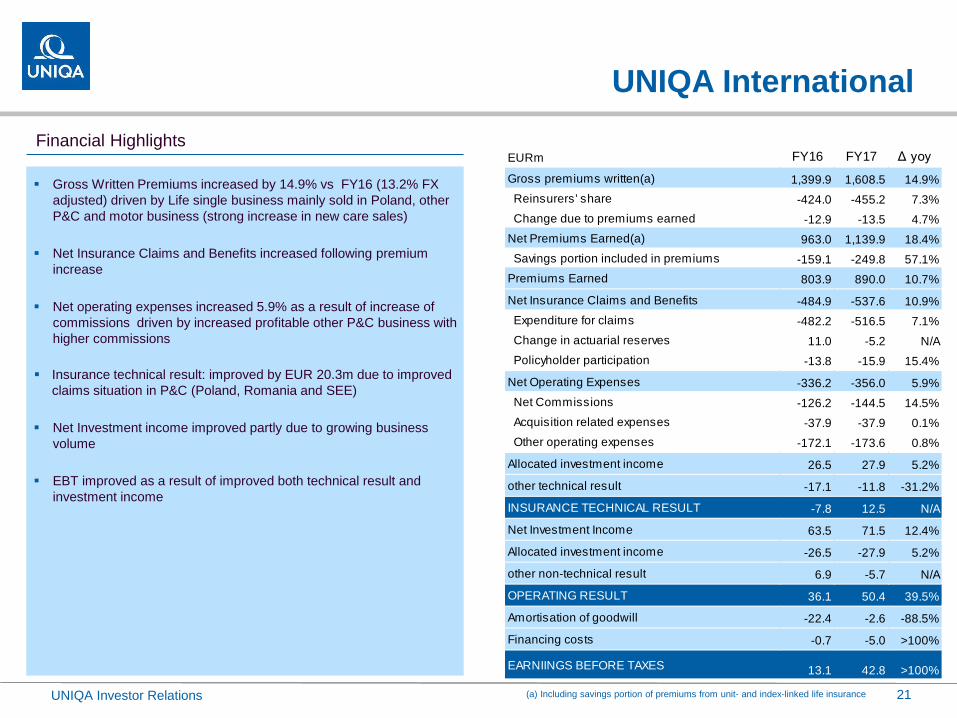
Gross Written Premiums increased by 14.9% vs FY16 (13.2% FX
adjusted) driven by Life single business mainly sold in Poland, other
P&C and motor business (strong increase in new care sales)
Net Insurance Claims and Benefits increased following premium
increase
Net operating expenses increased 5.9% as a result of increase of
commissions driven by increased profitable other P&C business with
higher commissions
Insurance technical result: improved by EUR 20.3m due to improved
claims situation in P&C (Poland, Romania and SEE)
Net Investment income improved partly due to growing business
volume
EBT improved as a result of improved both technical result and
investment income
Financial Highlights
(a) Including savings portion of premiums from unit- and index-linked life insurance UNIQA Investor Relations 21
Grafik aus Excel Sheet „P&L AT RV UI RE
GRP “ (Erklärung für dieses Sheet
in eigener Doku)
EURm FY16 FY17 Δ yoy
Gross premiums written(a) 1,399.9 1,608.5 14.9%
Reinsurers' share -424.0 -455.2 7.3%
Change due to premiums earned -12.9 -13.5 4.7%
Net Premiums Earned(a) 963.0 1,139.9 18.4%
Savings portion included in premiums -159.1 -249.8 57.1%
Premiums Earned 803.9 890.0 10.7%
Net Insurance Claims and Benefits -484.9 -537.6 10.9%
Expenditure for claims -482.2 -516.5 7.1%
Change in actuarial reserves 11.0 -5.2 N/A
Policyholder participation -13.8 -15.9 15.4%
Net Operating Expenses -336.2 -356.0 5.9%
Net Commissions -126.2 -144.5 14.5%
Acquisition related expenses -37.9 -37.9 0.1%
Other operating expenses -172.1 -173.6 0.8%
Allocated investment income 26.5 27.9 5.2%
other technical result -17.1 -11.8 -31.2%
INSURANCE TECHNICAL RESULT -7.8 12.5 N/A
Net Investment Income 63.5 71.5 12.4%
Allocated investment income -26.5 -27.9 5.2%
other non-technical result 6.9 -5.7 N/A
OPERATING RESULT 36.1 50.4 39.5%
Amortisation of goodwill -22.4 -2.6 -88.5%
Financing costs -0.7 -5.0 >100%
EARNIINGS BEFORE TAXES 13.1 42.8 >100%

UNIQA International P&C
Financial Highlights
UNIQA Investor Relations 22
Grafik aus Excel Sheet „P&L AT RV UI RE
GRP “ (Erklärung für dieses Sheet
in eigener Doku)
Gross premiums written increased 5.8% compared to FY16 (4.7%
FX adjusted); growth in other P&C due to new big insurance
contract in Ukraine and higher premiums income in CE due to
strong increase in new car sales and new tariffs
Net operating expenses increased due to higher commissions
related to other P&C business
Insurance technical result improved due to improved claim situation
in Poland, Romania and SEE
Net investment result impacted by lower realized and unrealized
capital gains in Poland, Croatia and Ukraine
Earnings before taxes improved due to better technical result and
lower goodwill amortization
EURm FY16 FY17 Δ yoy
Gross premiums written(a) 942.3 997.3 5.8%
Reinsurers' share -413.8 -442.2 6.9%
Change due to premiums earned -11.2 -10.8 -3.7%
Net Premiums Earned(a) 517.3 544.3 5.2%
Savings portion included in premiums 0.0 0.0 N/A
Premiums Earned 517.3 544.3 5.2%
Net Insurance Claims and Benefits -308.8 -316.2 2.4%
Expenditure for claims -305.5 -311.8 2.1%
Change in actuarial reserves 0.4 0.2 -43.3%
Policyholder participation -3.7 -4.6 22.7%
Net Operating Expenses -204.4 -212.5 4.0%
Net Commissions -58.3 -68.4 17.3%
Acquisition related expenses -28.9 -28.0 -3.0%
Other operating expenses -117.2 -116.0 -1.0%
Allocated investment income 0.0 0.0 N/A
other technical result -19.1 -14.9 -21.9%
INSURANCE TECHNICAL RESULT -14.9 0.7 N/A
Net Investment Income 32.9 28.8 -12.5%
Allocated investment income 0.0 0.0 N/A
other non-technical result -3.7 -6.2 67.0%
OPERATING RESULT 14.3 23.4 63.7%
Amortisation of goodwill -19.5 -2.3 -88.4%
Financing costs -0.7 -5.0 >100%
EARNIINGS BEFORE TAXES -5.9 16.1 N/A

UNIQA International Health
Financial Highlights
UNIQA Investor Relations 23
Grafik aus Excel Sheet „P&L AT RV UI RE
GRP “ (Erklärung für dieses Sheet
in eigener Doku)
Gross premium written: increased 31.7% where as highest growth
rate is recorded in Croatia, Russia, Ukraine and Liechtenstein
Commissions in line with premium development, while other operating
expenses decrease due to lower cost allocation
EBT improved due to higher business volume and operating
expenses
EURm FY16 FY17 Δ yoy
Gross premiums written(a) 47.7 62.8 31.7%
Reinsurers' share -1.9 -3.5 88%
Change due to premiums earned -1.8 -2.0 9.5%
Net Premiums Earned(a) 44.0 57.3 30.2%
Savings portion included in premiums 0.0 0.0 N/A
Premiums Earned 44.0 57.3 30.2%
Net Insurance Claims and Benefits -29.3 -36.3 23.8%
Expenditure for claims -28.0 -34.8 24.4%
Change in actuarial reserves -1.3 -0.8 -36.2%
Policyholder participation 0.0 -0.6 >100%
Net Operating Expenses -19.8 -21.8 10.2%
Net Commissions -7.8 -10.4 32.6%
Acquisition related expenses -0.9 -0.9 -6.5%
Other operating expenses -11.0 -10.5 -4.4%
Allocated investment income 0.0 0.0 N/A
other technical result 1.4 0.0 N/A
INSURANCE TECHNICAL RESULT -3.7 -0.8 -78.7%
Net Investment Income 0.5 0.3 -40.7%
Allocated investment income 0.0 0.0 N/A
other non-technical result 0.1 0.4 >100%
OPERATING RESULT -3.1 -0.1 -96.2%
Amortisation of goodwill 0.0 0.0 N/A
Financing costs 0.0 0.0 N/A
EARNIINGS BEFORE TAXES -3.1 -0.1 -96.2%

UNIQA International Life
Financial Highlights
(a) Including savings portion of premiums from unit- and index-linked life insurance UNIQA Investor Relations 24
Grafik aus Excel Sheet „P&L AT RV UI RE
GRP “ (Erklärung für dieses Sheet
in eigener Doku)
Gross premiums written: Increased by +33.8%
Significant increase in PL - main growth driver unit-
linked Life insurance (Life single EUR 144.1m)
Strong growth in Russia and Ukraine
Net insurance claims and benefits up with increased business
volume
Commissions: increase vs. prior year in EE and SEE
Investment income improved due to better macroeconomic
developments in CEE
Other non technical result worsened due to extraordinary effect in
FY16 (FX gains in Russia)
Earnings before tax increased due to better insurance technical
result and improved investment income
EURm FY16 FY17 Δ yoy
Gross premiums written(a) 409.9 548.4 33.8%
Reinsurers' share -8.4 -9.4 12.9%
Change due to premiums earned 0.2 -0.7 N/A
Net Premiums Earned(a) 401.6 538.3 34.0%
Savings portion included in premiums -159.1 -249.8 57.1%
Premiums Earned 242.6 288.5 18.9%
Net Insurance Claims and Benefits -146.8 -185.2 26.1%
Expenditure for claims -148.7 -169.8 14.2%
Change in actuarial reserves 11.9 -4.6 N/A
Policyholder participation -10.0 -10.7 6.9%
Net Operating Expenses -112.0 -121.7 8.7%
Net Commissions -60.0 -65.7 9.4%
Acquisition related expenses -8.1 -9.0 11.9%
Other operating expenses -43.9 -47.0 7.1%
Allocated investment income 26.5 27.9 5.2%
other technical result 0.5 3.1 >100%
INSURANCE TECHNICAL RESULT 10.8 12.6 16.1%
Net Investment Income 30.1 42.3 40.6%
Allocated investment income -26.5 -27.9 5.2%
other non-technical result 10.5 0.1 -99.1%
OPERATING RESULT 25.0 27.1 8.6%
Amortisation of goodwill -2.8 -0.3 -89.3%
Financing costs 0.0 0.0 N/A
EARNIINGS BEFORE TAXES 22.1 26.8 21.2%

UNIQA International – country deep dive
UNIQA Investor Relations 25
Grafik aus Excel Sheet „UI Countries “
(Erklärung für dieses Sheet in eigener Doku)
in EURm
FY17 % to PY FY17 % to PY FY17 % to PY FY17 % to PY FX adjusted
Western Europe (WE) (b) 30.6 21.4% 13.5 19.1% 0.0 44.0 20.7% 20.9%
Western Europe (WE) 30.6 21.4% 13.5 19.1% 0.0 44.0 20.7% 20.9%
Czech Republic 195.3 11.3% 9.6 7.9% 43.7 1.0% 248.6 9.2% 6.4%
Hungary 118.2 16.4% 4.8 25.3% 85.4 3.9% 208.4 11.1% 10.1%
Poland 262.9 3.2% 0.4 448.4% 175.0 132.0% 438.4 32.7% 29.4%
Slovakia 91.5 4.6% 0.1 -67.2% 37.5 16.7% 129.1 7.5% 7.5%
Central Europe (CE) 668.0 7.8% 15.0 13.0% 341.5 46.6% 1,024.5 18.4% 16.2%
Romania 85.2 -19.8% 0.2 -34.1% 12.2 15.4% 97.6 -16.6% -15.4%
Ukraine 48.8 55.2% 7.5 19.5% 14.9 50.4% 71.2 49.5% 60.3%
Eastern Europe (EE) 134.0 -2.6% 7.7 17.1% 27.1 32.3% 168.8 2.5% 5.6%
Albania 27.9 1.9% 1.9 -2.7% 5.5 28.9% 35.3 5.1% 2.8%
Bosnia-Herzegovina 13.2 -0.8% 0.0 16.4 -0.9% 29.6 -0.8% -0.8%
Bulgaria 28.2 1.2% 6.9 29.4 -1.1% 64.4 11.9% 11.9%
Croatia 40.5 2.9% 7.0 41.7% 26.8 -13.1% 74.3 -1.1% -2.5%
Montenegro 9.7 0.6% 0.7 -18.7% 1.9 4.6% 12.3 -0.2% -0.2%
Macedonia 11.0 0.2% 0.3 2.5% 1.4 18.6% 12.7 2.0% 1.8%
Serbia 25.4 8.5% 4.5 4.2% 14.6 -2.0% 44.5 4.4% 2.8%
Kosovo 8.0 -1.9% 1.6 -33.4% 0.6 -16.4% 10.2 -9.5% -9.5%
Southeastern E. (SEE) 163.9 2.4% 22.9 55.0% 96.6 -3.4% 283.4 3.1% 2.2%
Russia 0.8 N/A 3.7 112.1% 83.2 47.4% 87.7 50.6% 34.7%
Russia (RU) 0.8 N/A 3.7 112.1% 83.2 47.4% 87.7 50.6% 34.7%
UI Administration
UNIQA International 997.3 5.8% 62.8 31.7% 548.4 33.8% 1,608.5 14.9% 13.2%
GWP(a) Non-life GWP(a) Health GWP(a) Life GWP(a) Total
(a) Including savings portion of premiums from unit- and index-linked life insurance
(b) As of 2017 Switzerland is presented as a banch of Liechtenstein and will not be presented separately in the future

UNIQA International – country deep dive
UNIQA Investor Relations 26
(b)
Grafik aus Excel Sheet „UI Countries “
(Erklärung für dieses Sheet in eigener Doku)
in EURm
FY17 FY16 FY17 FY16 FY17 FY16 FY17 FY16 FY17 FY16
Western Europe (WE) (b) 15.3 12.5 -0.8 0.4 145.1% 138.0% 24.7% 30.8% 0.4 0.9
Western Europe (WE) 15.3 12.5 -0.8 0.4 145.1% 138.0% 24.7% 30.8% 0.4 0.9
Czech Republic 164.4 153.0 7.1 7.3 95.9% 94.7% 30.2% 33.6% 14.1 12.5
Hungary 140.5 130.7 3.8 3.9 83.1% 89.4% 23.9% 26.6% 2.8 0.2
Poland 312.4 203.0 12.9 14.3 98.6% 106.1% 20.0% 27.9% 12.7 6.0
Slovakia 88.3 83.9 5.0 3.9 98.0% 96.0% 37.0% 36.9% 4.6 6.1
Central Europe (CE) 705.6 570.7 28.8 29.4 95.4% 98.6% 25.3% 30.4% 34.2 24.8
Romania 63.6 62.5 4.0 2.7 102.0% 96.7% 47.1% 34.0% -0.4 -5.7
Ukraine 47.2 38.6 6.2 8.8 100.0% 101.7% 54.6% 63.8% 4.4 7.8
Eastern Europe (EE) 110.8 101.0 10.2 11.6 101.4% 98.2% 50.3% 45.4% 4.0 2.1
Albania 30.3 27.6 0.7 0.7 79.5% 65.9% 50.6% 43.1% 2.5 4.8
Bosnia-Herzegovina 25.9 25.8 2.3 2.4 97.2% 96.9% 36.7% 32.9% 1.0 1.1
Bulgaria 48.9 43.5 0.9 1.4 105.8% 115.4% 33.0% 31.1% 1.4 0.8
Croatia 53.2 53.9 14.8 15.1 100.1% 103.2% 39.0% 40.4% 5.1 -10.8
Montenegro 10.3 10.0 0.7 0.7 93.2% 99.5% 44.2% 47.1% 0.3 0.0
Macedonia 11.1 11.0 0.3 0.4 95.9% 99.0% 52.4% 48.6% 0.5 0.7
Serbia 35.7 40.2 1.3 4.8 90.5% 88.8% 38.6% 38.8% 2.1 1.5
Kosovo 9.6 10.8 0.1 0.2 80.2% 111.1% 42.2% 43.9% 1.1 -1.8
Southeastern E. (SEE) 225.0 222.8 21.3 25.7 92.5% 94.2% 39.9% 38.6% 13.9 -3.6
Russia 83.1 56.0 12.7 -3.2 13.8% 17.8% 10.2 5.8
Russia (RU) 83.1 56.0 12.7 -3.2 59.6% 37.1% 13.8% 17.8% 10.2 5.8
UI Administration 0.0 0.0 -0.7 -0.3 -19.8 -17.0
UNIQA International 1,139.9 963.0 71.5 63.5 97.1% 99.2% 31.2% 34.9% 42.8 13.1
Premiums earned (a) Net investment income Combined ratio P&C Cost ratio Earnings before taxes
(a) Including savings portion of premiums from unit- and index-linked life insurance
(b) As of 2017 Switzerland is presented as a banch of Liechtenstein and will not be presented separately in the future

Reinsurance
Comprises the reinsurance activities of UNIQA Insurance Group AG
in Vienna and the central reinsurance hub UNIQA Re in Zurich
Increased result reflecting improved underwriting in P&C business,
especially in CEE
Financial Highlights
(a) Including savings portion of premiums from unit- and index-linked life insurance UNIQA Investor Relations 27
Grafik aus Excel Sheet „P&L AT RV UI RE
GRP “ (Erklärung für dieses Sheet
in eigener Doku)
EURm FY16 FY17 Δ yoy
Gross premiums written(a) 1,130.8 1,091.6 -3.5%
Reinsurers' share -94.5 -98.7 4.4%
Change due to premiums earned -13.6 10.2 N/A
Net Premiums Earned(a) 1,022.7 1,003.0 -1.9%
Savings portion included in premiums 0.0 0.0 N/A
Premiums Earned 1,022.7 1,003.0 -1.9%
Net Insurance Claims and Benefits -694.7 -692.5 -0.3%
Expenditure for claims -684.9 -681.6 -0.5%
Change in actuarial reserves 0.3 1.2 >100%
Policyholder participation -10.2 -12.1 18.5%
Net Operating Expenses -330.5 -320.2 -3.1%
Net Commissions -324.4 -315.9 -2.6%
Acquisition related expenses 0.0 0.0 N/A
Other operating expenses -6.1 -4.3 -30.0%
Allocated investment income 0.0 0.0 N/A
other technical result -8.7 -11.3 29.9%
INSURANCE TECHNICAL RESULT -11.2 -20.9 86.2%
Net Investment Income 29.9 31.0 3.6%
Allocated investment income 0.0 0.0 N/A
other non-technical result -0.5 -1.6 >100%
OPERATING RESULT 18.2 8.4 -53.6%
Amortisation of goodwill 0.0 0.0 N/A
Financing costs -0.1 -2.9 >100%
EARNIINGS BEFORE TAXES 18.1 5.5 -69.5%
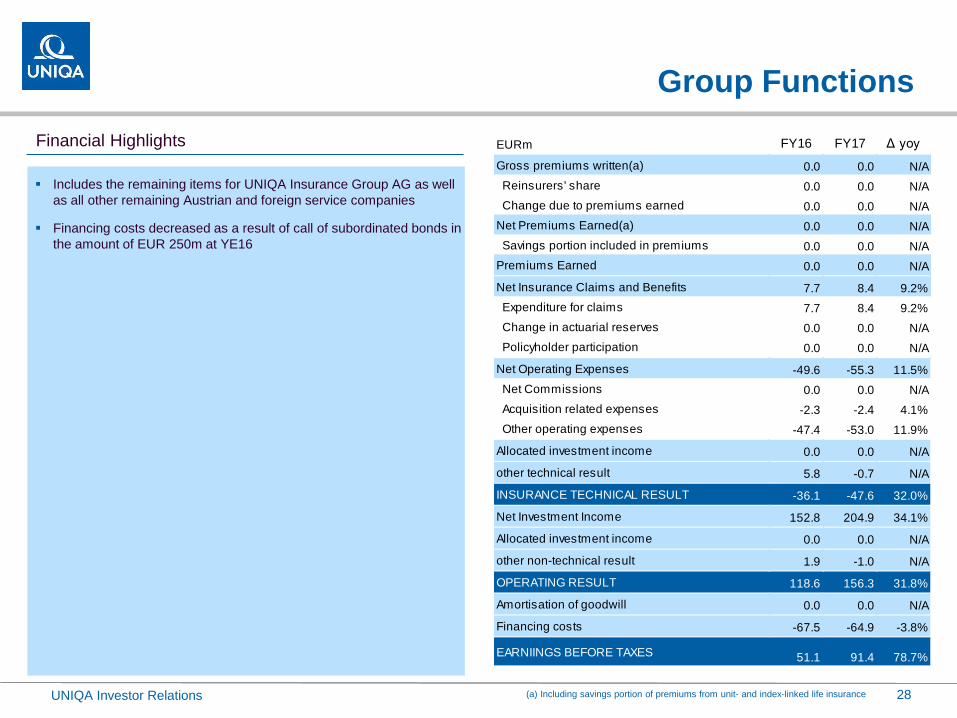
Group Functions
Includes the remaining items for UNIQA Insurance Group AG as well
as all other remaining Austrian and foreign service companies
Financing costs decreased as a result of call of subordinated bonds in
the amount of EUR 250m at YE16
Financial Highlights
(a) Including savings portion of premiums from unit- and index-linked life insurance UNIQA Investor Relations 28
Grafik aus Excel Sheet „P&L AT RV UI RE
GRP “ (Erklärung für dieses Sheet
in eigener Doku)
EURm FY16 FY17 Δ yoy
Gross premiums written(a) 0.0 0.0 N/A
Reinsurers' share 0.0 0.0 N/A
Change due to premiums earned 0.0 0.0 N/A
Net Premiums Earned(a) 0.0 0.0 N/A
Savings portion included in premiums 0.0 0.0 N/A
Premiums Earned 0.0 0.0 N/A
Net Insurance Claims and Benefits 7.7 8.4 9.2%
Expenditure for claims 7.7 8.4 9.2%
Change in actuarial reserves 0.0 0.0 N/A
Policyholder participation 0.0 0.0 N/A
Net Operating Expenses -49.6 -55.3 11.5%
Net Commissions 0.0 0.0 N/A
Acquisition related expenses -2.3 -2.4 4.1%
Other operating expenses -47.4 -53.0 11.9%
Allocated investment income 0.0 0.0 N/A
other technical result 5.8 -0.7 N/A
INSURANCE TECHNICAL RESULT -36.1 -47.6 32.0%
Net Investment Income 152.8 204.9 34.1%
Allocated investment income 0.0 0.0 N/A
other non-technical result 1.9 -1.0 N/A
OPERATING RESULT 118.6 156.3 31.8%
Amortisation of goodwill 0.0 0.0 N/A
Financing costs -67.5 -64.9 -3.8%
EARNIINGS BEFORE TAXES 51.1 91.4 78.7%

Consolidation
Consolidation of intercompany effects
Financial Highlights
(a) Including savings portion of premiums from unit- and index-linked life insurance UNIQA Investor Relations 29
Grafik aus Excel Sheet „P&L AT RV UI RE
GRP “ (Erklärung für dieses Sheet
in eigener Doku)
EURm FY16 FY17 Δ yoy
Gross premiums written(a) -1,113.9 -1,063.4 -4.5%
Reinsurers' share 1,015.5 1,033.9 1.8%
Change due to premiums earned -1.0 -0.5 -49.9%
Net Premiums Earned(a) -99.4 -30.1 -69.8%
Savings portion included in premiums 0.0 0.0 N/A
Premiums Earned -99.4 -30.1 -69.8%
Net Insurance Claims and Benefits 78.5 13.8 -82.4%
Expenditure for claims 78.8 19.9 -74.7%
Change in actuarial reserves 0.5 0.1 -75.8%
Policyholder participation -0.8 -6.2 >100%
Net Operating Expenses 19.2 3.9 -79.7%
Net Commissions 18.6 3.1 -83.6%
Acquisition related expenses 0.0 0.0 N/A
Other operating expenses 0.6 0.8 46.8%
Allocated investment income 0.0 0.0 N/A
other technical result 12.9 13.9 7.7%
INSURANCE TECHNICAL RESULT 11.1 1.5 -86.8%
Net Investment Income -117.4 -208.8 77.8%
Allocated investment income 0.0 0.0 N/A
other non-technical result -4.2 3.3 N/A
OPERATING RESULT -110.5 -204.0 84.6%
Amortisation of goodwill 0.0 0.0 0.0%
Financing costs 21.6 44.9 >100%
EARNIINGS BEFORE TAXES -89.0 -159.1 78.8%
Group Balance Sheet
UNIQA Investor Relations
Assets Liabilities
30
Grafik aus Excel Sheet „Group Balance “
(Erklärung für dieses Sheet in eigener Doku)
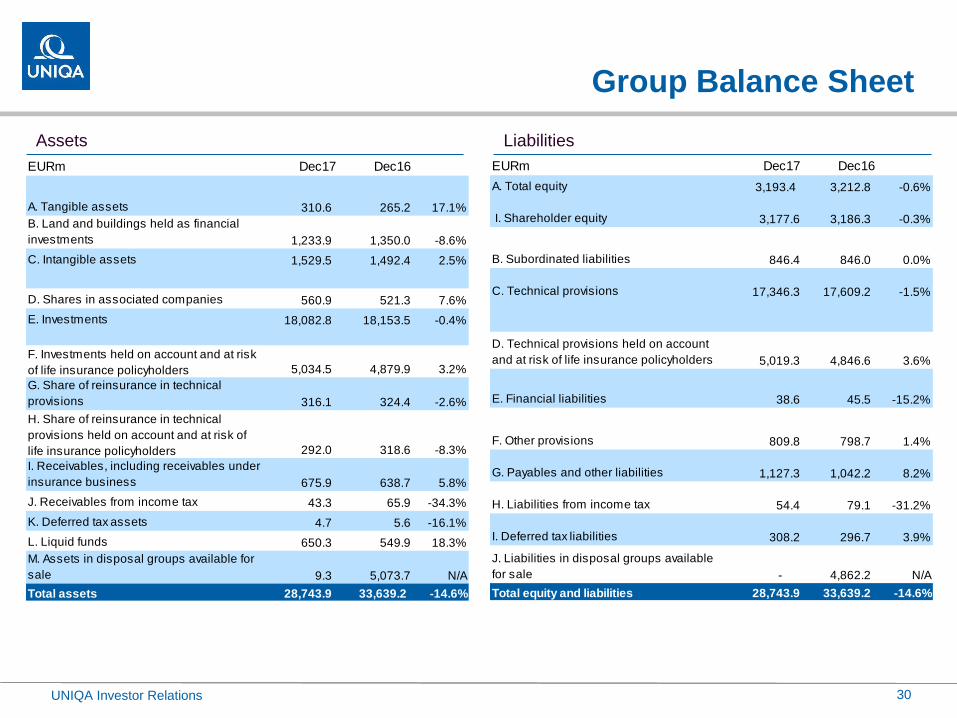
EURm Dec17 Dec16
A. Tangible assets 310.6 265.2 17.1%
B. Land and buildings held as financial
investments 1,233.9 1,350.0 -8.6%
C. Intangible assets 1,529.5 1,492.4 2.5%
D. Shares in associated companies 560.9 521.3 7.6%
E. Investments 18,082.8 18,153.5 -0.4%
F. Investments held on account and at risk
of life insurance policyholders 5,034.5 4,879.9 3.2%
G. Share of reinsurance in technical
provisions 316.1 324.4 -2.6%
H. Share of reinsurance in technical
provisions held on account and at risk of
life insurance policyholders 292.0 318.6 -8.3%
I. Receivables, including receivables under
insurance business 675.9 638.7 5.8%
J. Receivables from income tax 43.3 65.9 -34.3%
K. Deferred tax assets 4.7 5.6 -16.1%
L. Liquid funds 650.3 549.9 18.3%
M. Assets in disposal groups available for
sale 9.3 5,073.7 N/A
Total assets 28,743.9 33,639.2 -14.6%
EURm Dec17 Dec16
A. Total equity 3,193.4 3,212.8 -0.6%
I. Shareholder equity 3,177.6 3,186.3 -0.3%
B. Subordinated liabilities 846.4 846.0 0.0%
C. Technical provisions 17,346.3 17,609.2 -1.5%
D. Technical provisions held on account
and at risk of life insurance policyholders 5,019.3 4,846.6 3.6%
E. Financial liabilities 38.6 45.5 -15.2%
F. Other provisions 809.8 798.7 1.4%
G. Payables and other liabilities 1,127.3 1,042.2 8.2%
H. Liabilities from income tax 54.4 79.1 -31.2%
I. Deferred tax liabilities 308.2 296.7 3.9%
J. Liabilities in disposal groups available
for sale - 4,862.2 N/A
Total equity and liabilities 28,743.9 33,639.2 -14.6%

Shareholders‘ equity (excluding minority interest)
UNIQA Investor Relations
Shareholders’ equity decreased in FY17:
Revaluation reserves decreased mainly due to interest rates ytd development and disposal of Italy
Dividend pay-out in amount of EUR 150m
31
76
150
57
161
Dec 16 Profit attributable
to shareholders
Dividend payment Valuation of financial
instruments AFS
Other Dec17
3.186 3.178
EURm

Group Income Statement
(a) Including savings portion of premiums from unit- and index-linked life insurance
(a) Including savings portion of premiums from unit- and index-linked life insurance UNIQA Investor Relations 32
Grafik aus Excel Sheet „Group P&L “
(Erklärung für dieses Sheet in eigener Doku)
EURm 4Q16 1Q17 2Q17 3Q17 4Q17 FY16 FY17 Δ yoy
Gross premiums written(a) 1,235.9 1,511.9 1,286.7 1,245.3 1,249.5 5,048.2 5,293.3 4.9%
Reinsurers' share -51.0 -70.0 -30.6 -36.7 -47.9 -192.3 -185.3 -3.7%
Change due to premiums earned 52.0 -162.1 47.9 52.1 58.2 -28.2 -3.9 -86.1%
Net Premiums Earned(a) 1,236.9 1,279.7 1,304.0 1,260.7 1,259.8 4,827.7 5,104.1 5.7%
Savings portion included in premiums -126.3 -122.1 -146.7 -102.6 -104.8 -384.7 -476.2 23.8%
Premiums Earned 1,110.6 1,157.6 1,157.3 1,158.1 1,155.0 4,443.0 4,627.9 4.2%
Net Insurance Claims and Benefits -800.4 -858.7 -890.4 -910.0 -899.6 -3,385.6 -3,558.6 5.1%
Expenditure for claims -965.0 -971.3 -975.2 -959.8 -977.7 -3,879.5 -3,884.0 0.1%
Change in actuarial reserves 125.5 78.3 179.5 76.3 128.2 554.3 462.3 -16.6%
Policyholder participation -14.5 -11.2 -26.9 -42.2 -47.5 -98.0 -127.8 30.4%
Net Operating Expenses -351.9 -331.0 -314.7 -296.9 -333.3 -1,286.4 -1,276.0 -0.8%
Net Commissions -162.4 -176.5 -159.0 -157.7 -152.7 -641.7 -645.8 0.6%
Acquisition related expenses -62.5 -54.1 -53.4 -44.8 -57.5 -227.6 -209.9 -7.8%
Other operating expenses -126.9 -100.4 -102.3 -94.5 -123.1 -417.0 -420.3 0.8%
Allocated investment income 67.1 79.0 86.8 90.8 90.5 333.3 347.1 4.1%
other technical result -9.3 -6.5 -7.8 -15.7 -4.2 -30.5 -34.2 12.2%
INSURANCE TECHNICAL RESULT 16.1 40.4 31.3 26.2 8.3 73.9 106.2 43.8%
Net Investment Income 169.5 75.8 157.7 160.1 167.3 588.9 560.9 -4.7%
Allocated investment income -67.1 -79.0 -86.8 -90.8 -90.5 -333.3 -347.1 4.1%
other non-technical result -5.5 10.8 -24.9 5.4 -11.2 -10.6 -19.8 87.2%
OPERATING RESULT 112.9 48.0 77.3 101.0 74.0 318.8 300.3 -5.8%
Amortisation of goodwill -19.3 -1.4 -1.4 -1.4 -0.8 -25.8 -5.0 -80.5%
Financing costs -16.9 -13.5 -13.6 -13.6 -12.3 -67.5 -53.0 -21.4%
EARNINGS BEFORE TAXES 76.7 33.1 62.3 85.9 60.8 225.5 242.2 7.4%

Group P&C
Gross Written Premiums increased 4.8% as a result of strong growth
in CEE driven by motor business in CZ, SK, HU and non-motor
business in UA, RO and CE
Net insurance claims increased as a result of higher basic losses and
higher NatCat losses compared to FY16
Net operating expenses increased by 3.3% ytd due to higher
commissions offsetting lower acquisition related expenses and other
operating expenses
Acquisition related down due to lower handling expenses in new
business via exclusive distribution channel
Insurance technical result increased on better COR due to portfolio
sanitation both in AT and CEE
Net investment result lower ytd due to one-off gain on disposal of
Niederösterreichische Versicherung (EUR 37.2m) in 3Q16
Earnings before tax increased 44.8% to EUR 83.9m driven by
improved underwriting result, lower financing costs and lower
amortization of goodwill in FY17 compared to FY16
Financial Highlights
UNIQA Investor Relations 33
Grafik aus Excel Sheet „P&L AT RV UI RE
GRP “ (Erklärung für dieses Sheet
in eigener Doku)
EURm FY16 FY17 Δ yoy
Gross premiums written 2,518.4 2,639.7 4.8%
Reinsurers' share -133.0 -143.2 7.6%
Change due to premiums earned -26.4 -1.4 -94.5%
Net Premiums Earned 2,359.1 2,495.1 5.8%
Savings portion included in premiums 0.0 0.0 N/A
Premiums Earned 2,359.1 2,495.1 5.8%
Net Insurance Claims and Benefits -1,550.6 -1,644.8 6.1%
Expenditure for claims -1,519.1 -1,605.3 5.7%
Change in actuarial reserves 0.8 0.1 -90.7%
Policyholder participation -32.4 -39.6 22.3%
Net Operating Expenses -763.2 -788.5 3.3%
Net Commissions -408.9 -453.6 10.9%
Acquisition related expenses -120.7 -109.7 -9.2%
Other operating expenses -233.5 -225.2 -3.6%
Allocated investment income 0.0 0.0 N/A
other technical result -15.3 -19.0 24.1%
INSURANCE TECHNICAL RESULT 30.0 42.8 42.7%
Net Investment Income 132.6 108.5 -18.2%
Allocated investment income 0.0 0.0 N/A
other non-technical result -17.8 -12.3 -31.0%
OPERATING RESULT 144.8 139.0 -4.0%
Amortisation of goodwill -19.5 -2.3 -88.4%
Financing costs -67.4 -52.9 -21.4%
EARNIINGS BEFORE TAXES 57.9 83.9 44.8%

Group Health
Gross Premiums Written increased by 3.8%
UNIQA International: 31.7%
UNIQA Austria: 2.4%
Net insurance claims and benefits increased by 4.0% due to higher
expenditure for claims in FY17
Net Operating expenses decreased -4.3% mostly driven by lower
acquisition related expenses; other operating expenses increased due
to higher expenses in IT
Net investment income increased due to higher realized gains in
Austria from sale of equity securities and real-estate assets
EBT increased to EUR 109.7m as a result of improvement of both
technical result and investment income
Financial Highlights
UNIQA Investor Relations 34
Grafik aus Excel Sheet „P&L AT RV UI RE
GRP “ (Erklärung für dieses Sheet
in eigener Doku)
EURm FY16 FY17 Δ yoy
Gross premiums written 1,003.7 1,042.0 3.8%
Reinsurers' share -1.3 -1.1 -12%
Change due to premiums earned -2.0 -2.0 -3.1%
Net Premiums Earned 1,000.4 1,038.9 3.9%
Savings portion included in premiums 0.0 0.0 N/A
Premiums Earned 1,000.4 1,038.9 3.9%
Net Insurance Claims and Benefits -843.6 -877.6 4.0%
Expenditure for claims -674.0 -704.9 4.6%
Change in actuarial reserves -125.5 -136.0 8.3%
Policyholder participation -44.0 -36.8 -16.5%
Net Operating Expenses -175.5 -168.0 -4.3%
Net Commissions -45.8 -39.4 -13.9%
Acquisition related expenses -52.9 -49.9 -5.7%
Other operating expenses -76.8 -78.7 2.5%
Allocated investment income 77.7 81.3 4.6%
other technical result 1.2 -0.2 N/A
INSURANCE TECHNICAL RESULT 60.1 74.3 23.6%
Net Investment Income 114.9 116.4 1.3%
Allocated investment income -77.7 -81.3 4.6%
other non-technical result -1.2 0.3 N/A
OPERATING RESULT 96.2 109.8 14.1%
Amortisation of goodwill 0.0 0.0 N/A
Financing costs -0.1 -0.1 -9.7%
EARNIINGS BEFORE TAXES 96.1 109.7 14.2%

Group Life
Gross Premium Written rose 5.6% ytd driven by positive development
in both recurring and single premium business in UI (EUR +144.1m
Single Life in Poland); recurring business in Austria slightly declining
Net Insurance Benefits increased compared to prior year; actuarial
reserves decreased due to portfolio reduction in UAT; rise in profit
participation is a result of change in deferred profit participation in
UAT
Net Operating Expenses decreased ytd mainly driven by decreased
net commissions in UAT and changed business mix in UI; acquisition
related expenses down due to lower handling expenses in new
business conducted via exclusive distribution channel; her other
operating expenses higher due to higher costs of contract
modifications
Reduction of net investment income is mainly result of fixed income
securities impairment
Earnings before tax decreased -32.0% in FY17mainly as a result of
reduced net investment income and other non technical result
Financial Highlights
UNIQA Investor Relations (a) Including savings portion of premiums from unit- and index-linked life insurance 35
Grafik aus Excel Sheet „P&L AT RV UI RE
GRP “ (Erklärung für dieses Sheet
in eigener Doku)
EURm FY16 FY17 Δ yoy
Gross premiums written(a) 1,526.1 1,611.6 5.6%
Reinsurers' share -58.0 -41.0 -29.4%
Change due to premiums earned 0.2 -0.5 N/A
Net Premiums Earned(a) 1,468.3 1,570.2 6.9%
Savings portion included in premiums -384.7 -476.2 23.8%
Premiums Earned 1,083.6 1,094.0 1.0%
Net Insurance Claims and Benefits -991.4 -1,036.2 4.5%
Expenditure for claims -1,648.8 -1,583.0 -4.0%
Change in actuarial reserves 679.0 598.2 -11.9%
Policyholder participation -21.6 -51.4 >100%
Net Operating Expenses -347.7 -319.5 -8.1%
Net Commissions -187.1 -152.8 -18.3%
Acquisition related expenses -54.0 -50.3 -6.9%
Other operating expenses -106.7 -116.4 9.1%
Allocated investment income 255.7 265.8 4.0%
other technical result -16.3 -15.0 -8.3%
INSURANCE TECHNICAL RESULT -16.2 -10.9 -32.9%
Net Investment Income 341.4 336.0 -1.6%
Allocated investment income -255.7 -265.8 4.0%
other non-technical result 8.4 -7.9 N/A
OPERATING RESULT 77.9 51.4 -34.0%
Amortisation of goodwill -6.3 -2.8 -55.9%
Financing costs 0.0 0.0 N/A
EARNIINGS BEFORE TAXES 71.6 48.7 -32.0%

UNIQA Investor Relations
Group Strategy &
Results
Highlights
Group Results
Outlook
Appendix:
Additional
Information
Business Performance Operating Segments
Asset Management
Shareholder Information
FY17
36

22%
16%62%
P&C
Health
Life
46%
19%
13%
12%
8%2% Governent Bonds EU
Covered Bonds
Corporates
Government Bonds Non-EU
Financials
Other
46%
18%
11%
11%
11%2% Governent Bonds EU
Covered Bonds
Corporates
Government Bonds Non-EU
Financials
Other
UNIQA Investor Relations
Fixed income portfolio
Overall composition Rating distribution
Dec16
EUR 16.5bn
Dec 17
EUR 16.5bn
By segment
37
26%25% 25%
14%
7%4%
19%
32%
23%
14%
8%
3%
AAA AA A BBB <BBB Not rated
Dec 17 Dec 16
Grafik aus Excel Sheet „MRM Data “
(Erklärung für dieses Sheet in eigener Doku)

20%
12%
68%
P&C
Health
Life
UNIQA Investor Relations
Fixed income portfolio
Government and government related
Overall composition EUR 9.7bn Rating distribution
By segment
38
20.5%
29.6%
27.9%
12.4%
9.4%
0.2%
AAA AA A BBB NonInvestment
grade
Not rated
34%
13%
9%
9%
8%
7%
7%
4%4%
4% 2% Rest of Europe
Austria
Rest of World
Poland
Belgium
France
Europa
Slovakia
Ireland
Supranational Organisations
Italy
Grafik aus Excel Sheet „MRM Data “
(Erklärung für dieses Sheet in eigener Doku)

UNIQA Investor Relations
Fixed income portfolio
Corporates including financials
Overall composition EUR 3.3bn Rating distribution
By segment
66%
14%
20%
39
21%
17%
13%11%
10%
10%
7%
5%4% 2% United States of America
Rest of Europe
Austria
France
Germany
United Kingdom
Rest of World
Europa
Netherlands
Italy
34%
20%
46% P&C
Health
Life
3.0%
12.1%
33.8%
30.4%
7.6%
13.2%
AAA AA A BBB NonInvestment
grade
Not rated
Grafik aus Excel Sheet „MRM Data “
(Erklärung für dieses Sheet in eigener Doku)
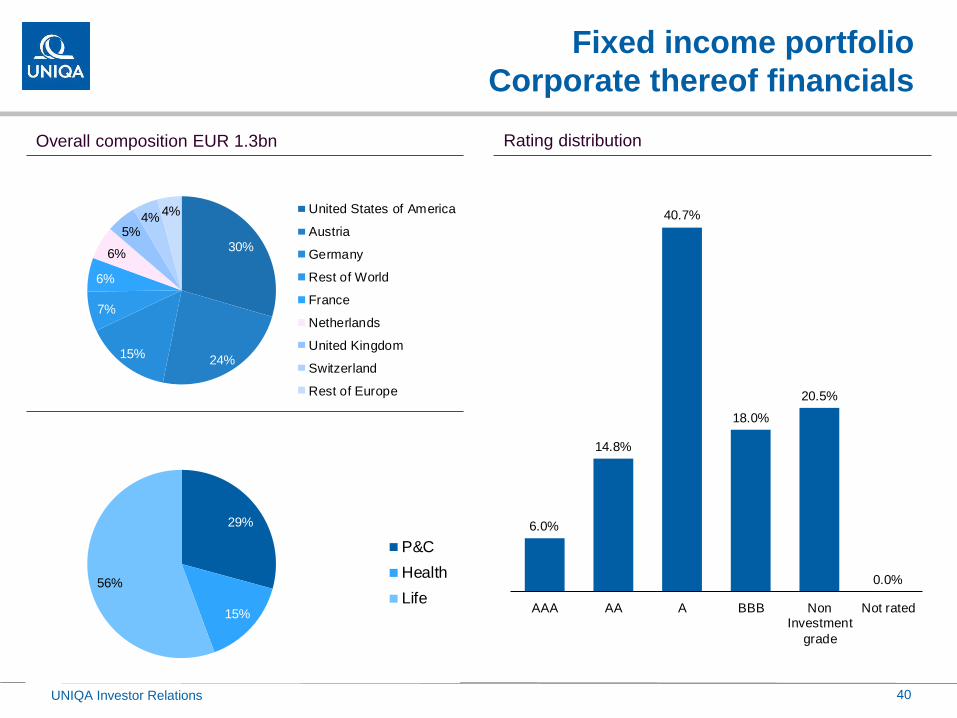
UNIQA Investor Relations
Fixed income portfolio
Corporate thereof financials
Overall composition EUR 1.3bn Rating distribution
By segment
40
30%
24%15%
7%
6%
6%
5%4%
4% United States of America
Austria
Germany
Rest of World
France
Netherlands
United Kingdom
Switzerland
Rest of Europe
29%
15%
56%
P&C
Health
Life
6.0%
14.8%
40.7%
18.0%
20.5%
0.0%
AAA AA A BBB NonInvestment
grade
Not rated
Grafik aus Excel Sheet „MRM Data “
(Erklärung für dieses Sheet in eigener Doku)
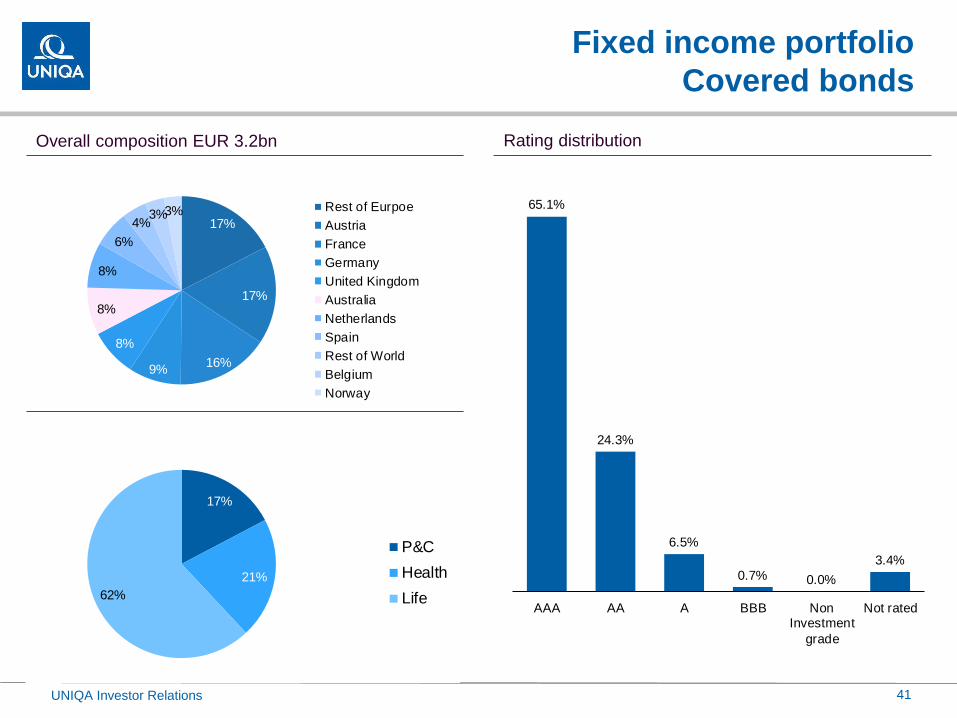
UNIQA Investor Relations
Fixed income portfolio
Covered bonds
Overall composition EUR 3.2bn
Rating distribution
By segment
41
17%
17%
16%9%
8%
8%
8%
6%
4%3%3% Rest of Eurpoe
Austria
France
Germany
United Kingdom
Australia
Netherlands
Spain
Rest of World
Belgium
Norway
17%
21%
62%
P&C
Health
Life
65.1%
24.3%
6.5%
0.7% 0.0%
3.4%
AAA AA A BBB NonInvestment
grade
Not rated
Grafik aus Excel Sheet „MRM Data “
(Erklärung für dieses Sheet in eigener Doku)
UNIQA Investor Relations
Group Strategy &
Results
Highlights
Group Results
Outlook
Appendix:
Additional
Information
Business Performance Operating Segments
Asset Management
Shareholder Information
FY17
42
UNIQA Investor Relations
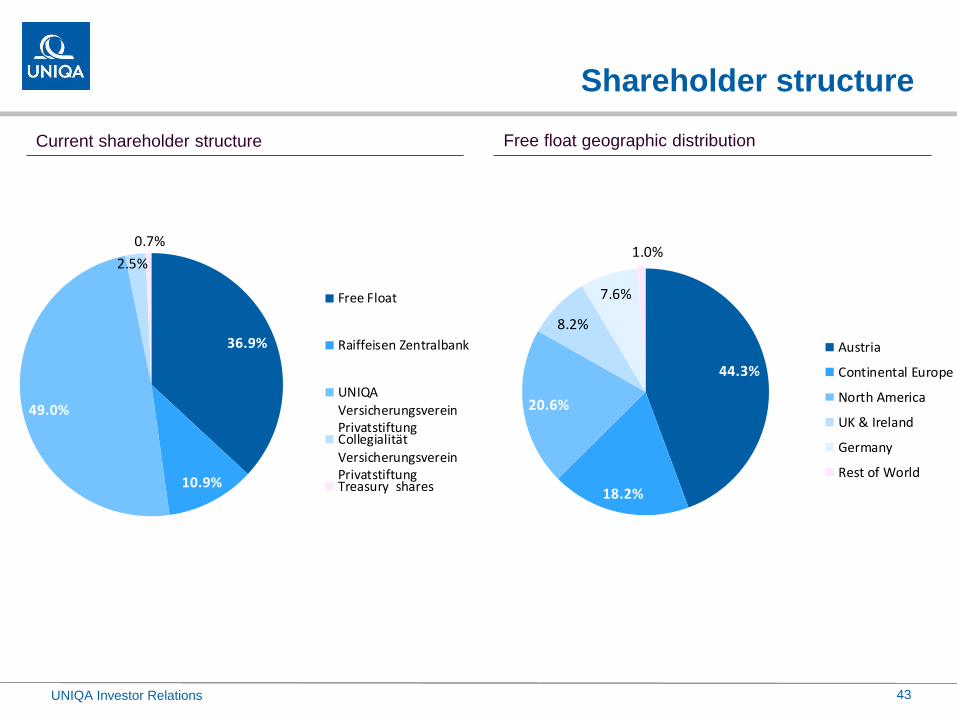
Shareholder structure
Current shareholder structure Free float geographic distribution
43
44.3%
18.2%
20.6%
8.2%
7.6%
1.0%
Austria
Continental Europe
North America
UK & Ireland
Germany
Rest of World
36.9%
10.9%
49.0%
2.5%
0.7%
Free Float
Raiffeisen Zentralbank
UNIQAVersicherungsvereinPrivatstiftungCollegialitätVersicherungsvereinPrivatstiftungTreasury shares

UNIQA Investor Relations
Shareholder information and contacts
General information
UNIQA Insurance Group AG
Listed on the Vienna Stock Exchange since 1999
309m common shares
ISIN: AT0000821103
Bloomberg: UQA AV
Reuters: UNIQ.VI
Vienna Stock Exchange: UQA
Contact details
Investor Relations
Michael Oplustil, Stefan Glinz, Tiana Majstorovic
Untere Donaustrasse 21, 1029 Vienna
Phone.: (+43) 1 21175-3773
E-mail: [email protected]
Dividend per share / Pay out ratio
44 (a) Proposal to the Annual General Meeting
0.25
0.35
0.42
0.470.49
0.51
41% 38% 45% 44% 102% 97%
2012 2013 2014 2015 2016 2017e
This Presentation is being provided for information purposes to selected recipients only and does not constitute or form part of, and should not be construed as an offer or invitation or
recommendation to, purchase or sell or subscribe for, or any solicitation of any offer to purchase or subscribe for any securities in UNIQA Insurance Group AG, a stock Corporation
organised under Austrian law (the "Company"), in any jurisdiction. Neither the Presentation, nor any part of it nor anything contained or referred to in it, nor the fact of its distribution,
should form the basis of or be relied on, in connection with, or act as an inducement in relation to, a decision to purchase or subscribe for or enter into any contract or make any other
commitment whatsoever in relation to any such securities.
The information contained in this Presentation has been provided by the Company and has not been verified independently. Unless otherwise stated, the Company is the source of
information.
No reliance may be placed for any purpose whatsoever on the information or opinions contained in the Presentation or on its completeness, accuracy of fairness. No representation or
warranty, express or implied, is made or given by or on behalf of the Company or any of its respective directors, officers, employees, agents or advisers as to the accuracy,
completeness or fairness of the information or opinions contained in the Presentation and no responsibility or liability is accepted by any of them for any such information or opinions. In
particular, no representation or warranty is given as to the achievement or reasonableness of, and no reliance should be placed on any projections, targets, estimates or forecasts
contained in this Presentation and nothing in this Presentation is or should be relied on as a promise or representation as to the future.
This Presentation contains forward-looking statements based on the currently held beliefs and assumptions of the management of the Company, which are expressed in good faith
and, in their opinion, reasonable. Forward-looking statements involve known and unknown risks, uncertainties and other factors, which may cause the actual results, financial condition,
performance, or achievements of the Company, or industry results, to differ materially from the results, financial condition, performance or achievements expressed or implied by such
forward-looking statements. Given these risks, uncertainties and other factors, recipients of this document are cautioned not to place undue reliance on these forward-looking
statements.
All features in this Presentation are current at the time of publication but may be subject to change in the future. The Company disclaims any obligation to update or revise any
statements, in particular forward-looking statements, to reflect future events or developments.
Statements contained in this Presentation regarding past events or performance should not be taken as a guarantee of future events or performance.
Prospective recipients should not treat the contents of this Presentation as advice relating to legal, taxation or investment matters, and are to make their own assessments concerning
such matters and other consequences of a potential investment in the Company and its securities, including the merits of investing and related risks.
In receiving any information relating to the Company (whether in written or oral form), including information in this Presentation, you will be deemed to have represented and agreed for
the benefit of the Company (i) that you will only use such information for the purposes of discussions with the Company, (ii) to hold such information in strict confidence and not to
disclose it (or any discussions with the Company) to any person, except as may be required by law, regulation or court order, (iii) not to reproduce or distribute (in whole or in part,
directly or indirectly) any such information, (iv) that you are permitted, in accordance with all applicable laws, to receive such information, and (v) that you are solely responsible for your
own assessment of the market position of the Company and that you will conduct your own analysis and be solely responsible for forming your own view of the potential future
performance of the Company's business.
Disclaimer
45 UNIQA Investor Relations