unit 1: statistical analysis -...
TRANSCRIPT

Unit 1: Statistical Analysis
IB Biology SL
Statistics
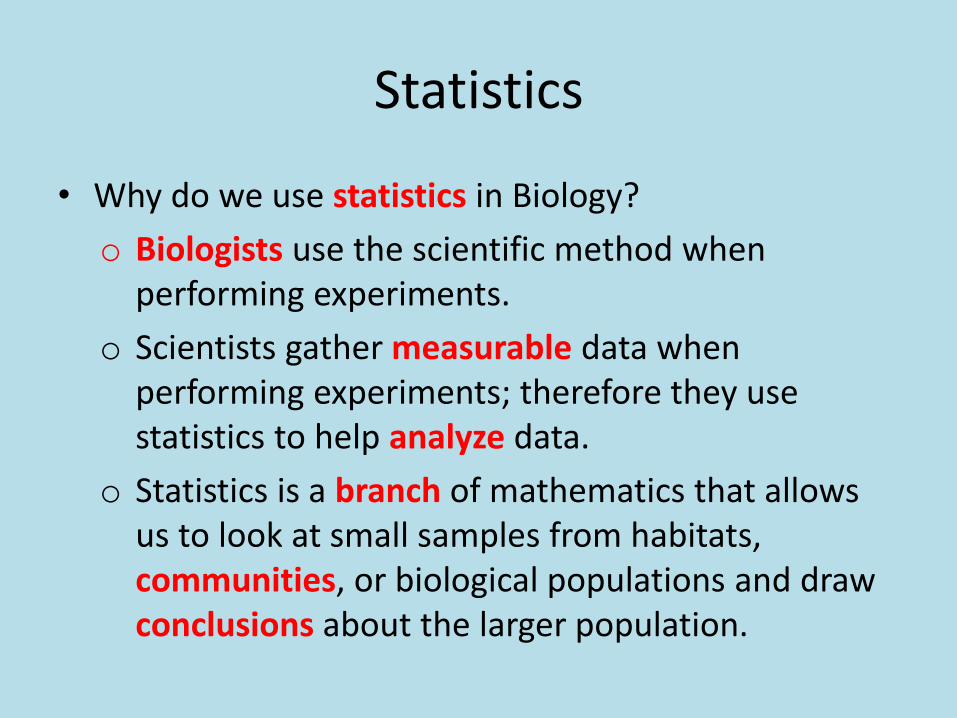
• Why do we use statistics in Biology?
o Biologists use the scientific method when performing experiments.
o Scientists gather measurable data when performing experiments; therefore they use statistics to help analyze data.
o Statistics is a branch of mathematics that allows us to look at small samples from habitats, communities, or biological populations and draw conclusions about the larger population.
Mean, range, standard deviation and error bars
• Mean
o The mean is an average of data points.
• Range
o The range is the measure of the spread of data.
o The difference between the largest and smallest observed values.

Mean, range, standard deviation and error bars
• Standard deviation
o The standard deviation (SD) is the measure of how dispersed or spread out the individualobservations are around the mean.
o It is determined by a scientific formula.
o You can calculate the standard deviation of a data set by using the SD function of a graphic display or scientific calculator.
Mean, range, standard deviation and error bars
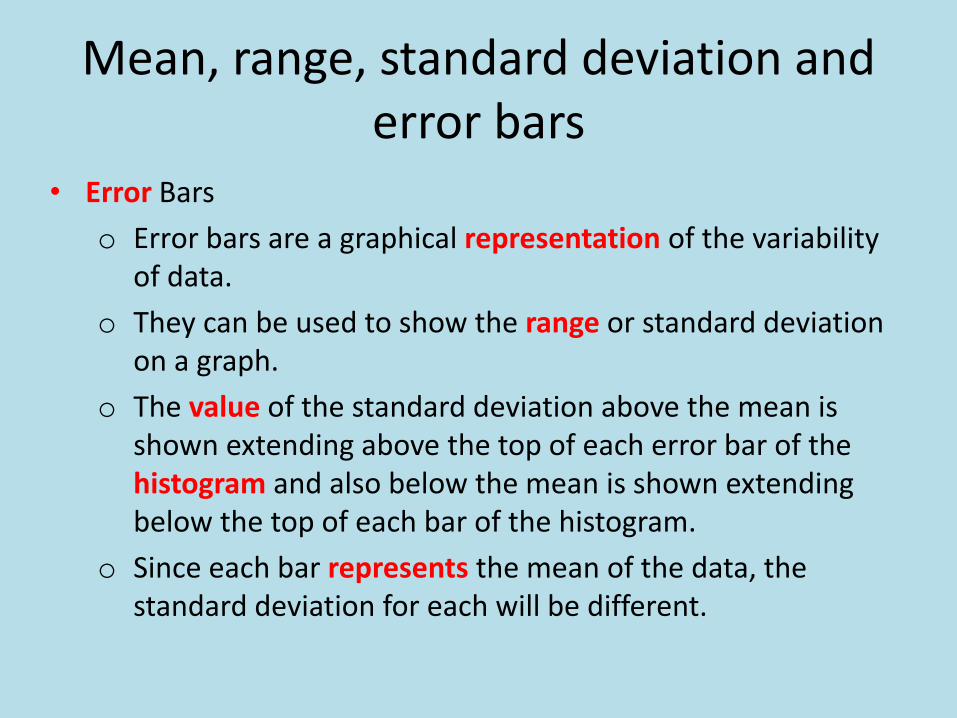
• Error Bars
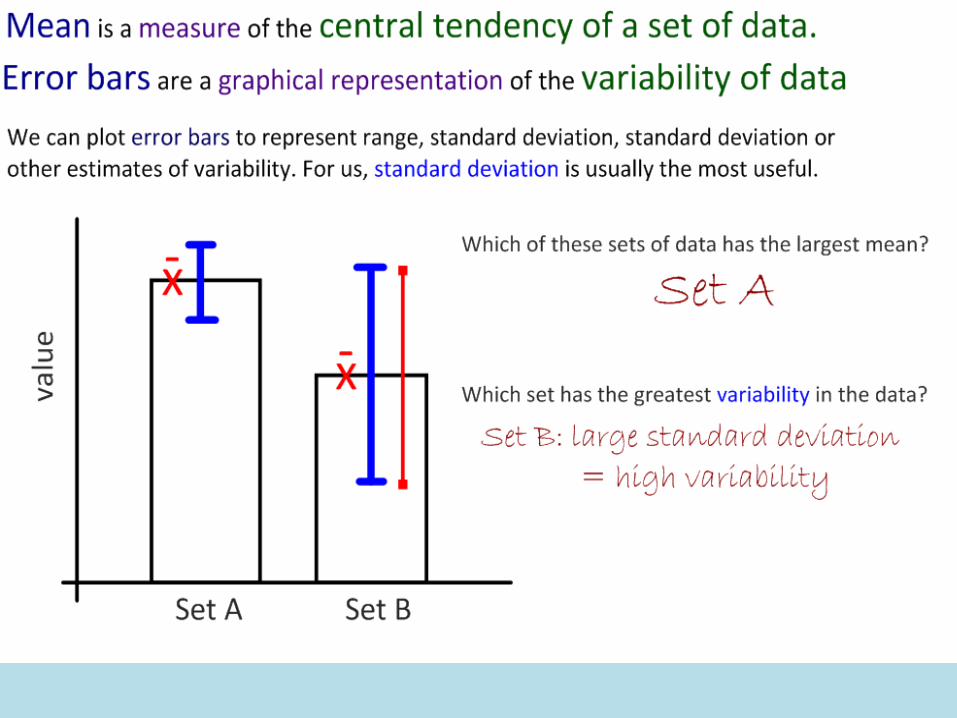
o Error bars are a graphical representation of the variability of data.
o They can be used to show the range or standard deviation on a graph.
o The value of the standard deviation above the mean is shown extending above the top of each error bar of the histogram and also below the mean is shown extending below the top of each bar of the histogram.
o Since each bar represents the mean of the data, the standard deviation for each will be different.
Error Bars
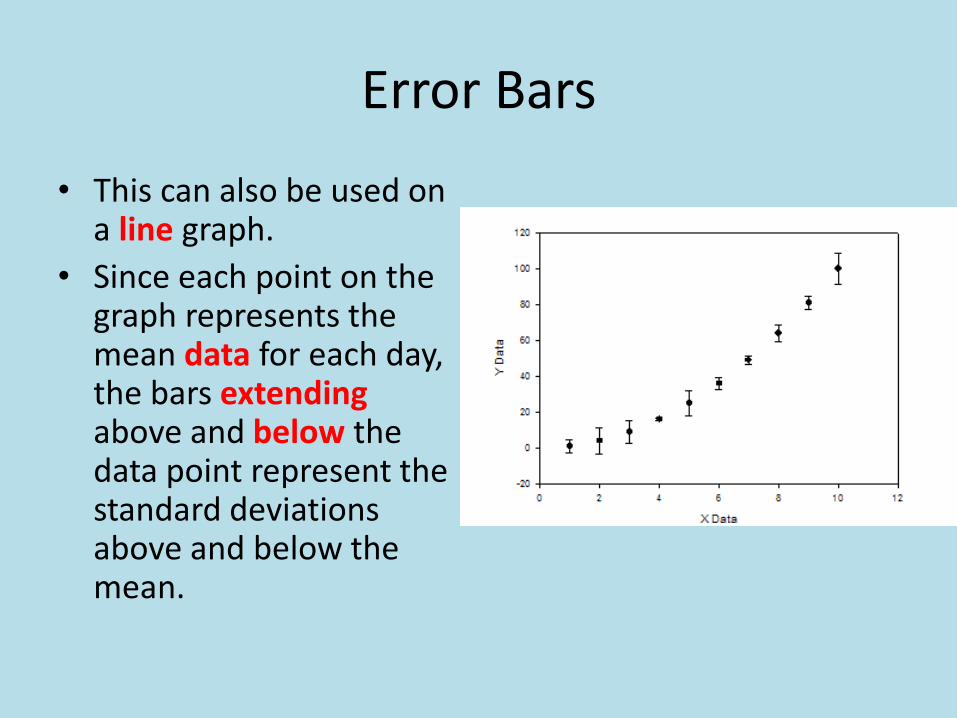
• This can also be used on a line graph.
• Since each point on the graph represents the mean data for each day, the bars extendingabove and below the data point represent the standard deviations above and below the mean.

Standard deviation
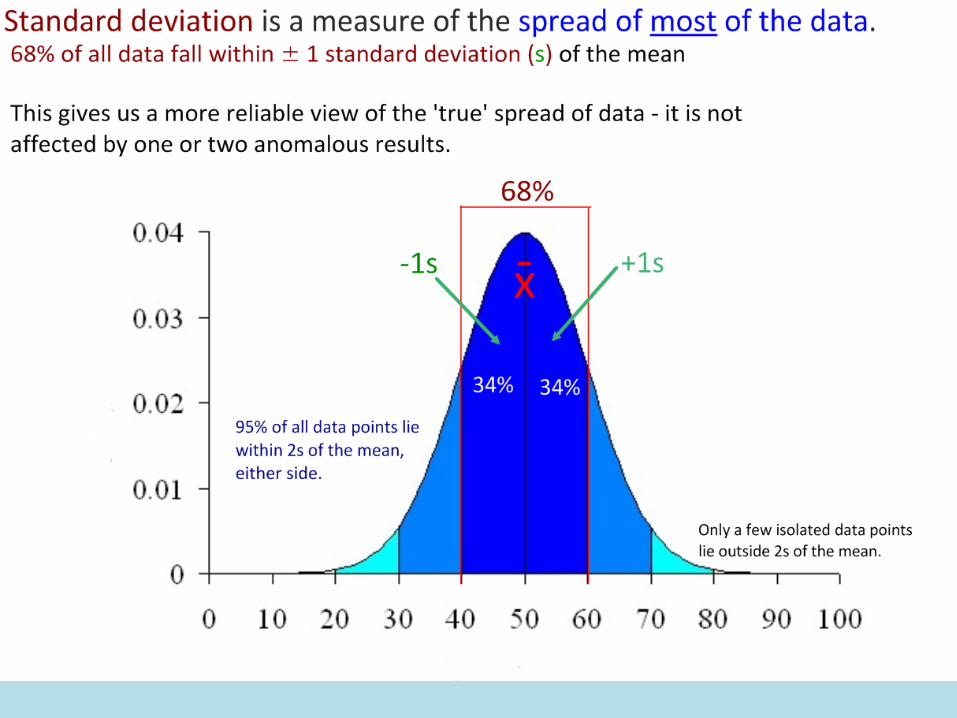
• Standard deviation is used to summarize the spread of values around the mean and to compare means and spread of data between two or more samples
• In a normal distribution, about 68% of all values lie within ±1 standard deviation from the mean.
• This rises to about 95% for ±2 standard deviations from the mean.
Standard deviation
• The standard deviation tells us how tightly the data points are clustered around the mean.
• The standard deviation is small when the datapoints are clustered together. It is large when the data points are spread apart.
• You can calculate the standard deviation of a data set easily with your calculator.

Standard deviation
• Comparing the means and spread of data between two or more samples
1. In statistics we make inferences about whole populations based on just a sample of the population.
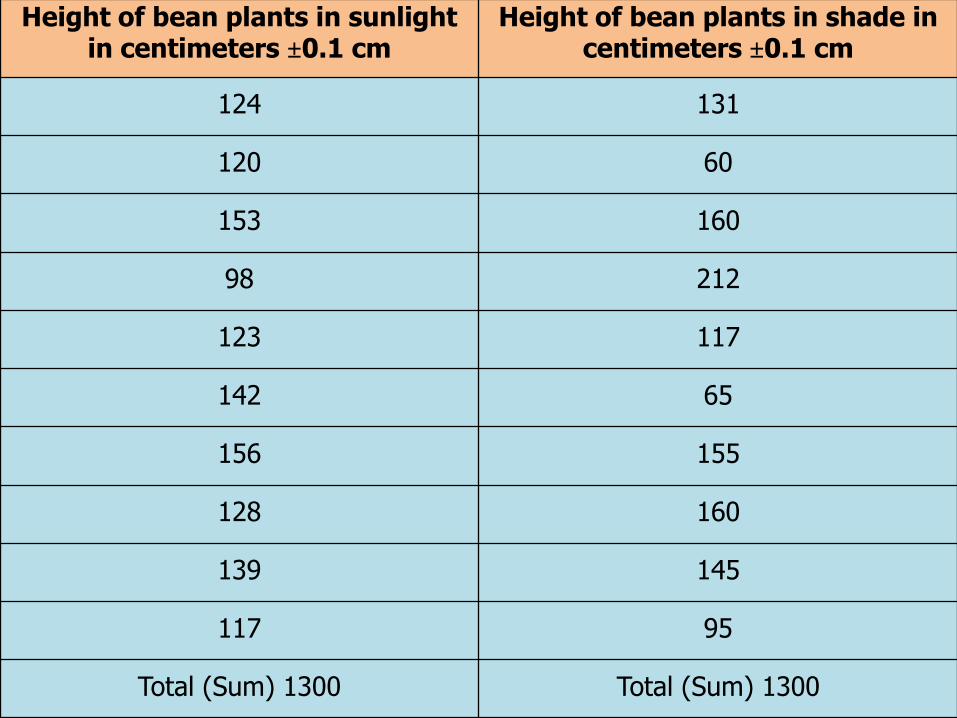
2. We will use an example of bean plants growing in sunlight and shade to determine how standard deviation is useful for comparing data.
Height of bean plants in sunlight in centimeters ±0.1 cm
Height of bean plants in shade in centimeters ±0.1 cm
124 131
120 60
153 160
98 212
123 117
142 65
156 155
128 160
139 145
117 95
Total (Sum) 1300 Total (Sum) 1300

Standard Deviation
3. First we determine the mean by dividing the total by 10 (the number of plants).
4. This results in 130.0 cm for each condition.
5. There are large differences between the two sets of data. There is greater variability for the plants in shade than the plants in sunlight. Although the mean is the same the variation is not the same.
6. Using your calculator input the values above and use the standard deviation function to determine the standard deviation for each condition.
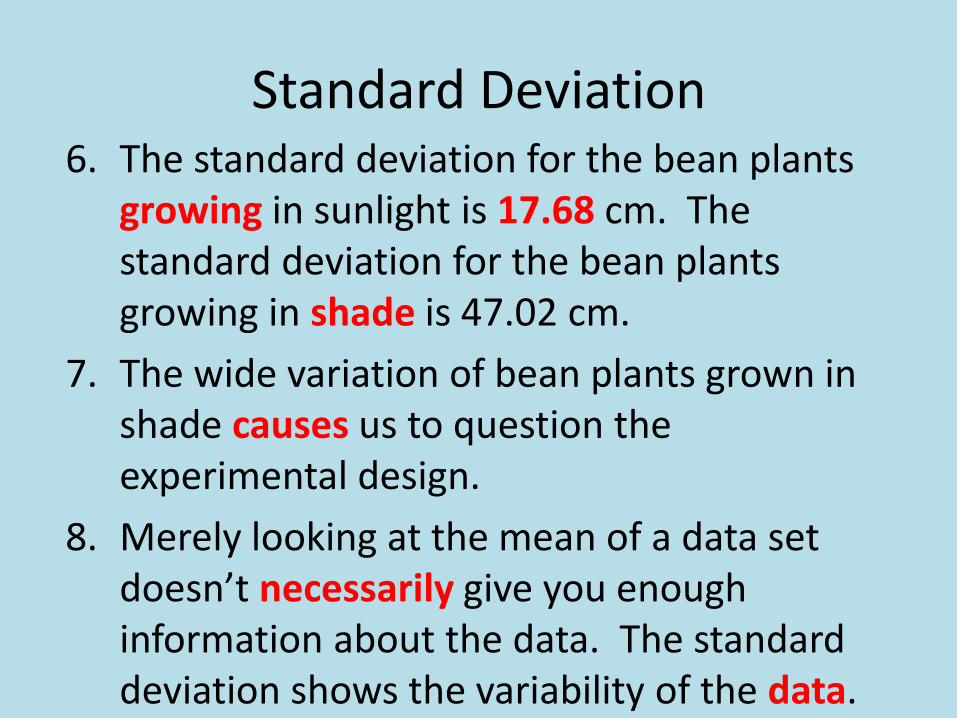
Standard Deviation6. The standard deviation for the bean plants
growing in sunlight is 17.68 cm. The standard deviation for the bean plants growing in shade is 47.02 cm.
7. The wide variation of bean plants grown in shade causes us to question the experimental design.
8. Merely looking at the mean of a data set doesn’t necessarily give you enough information about the data. The standard deviation shows the variability of the data.
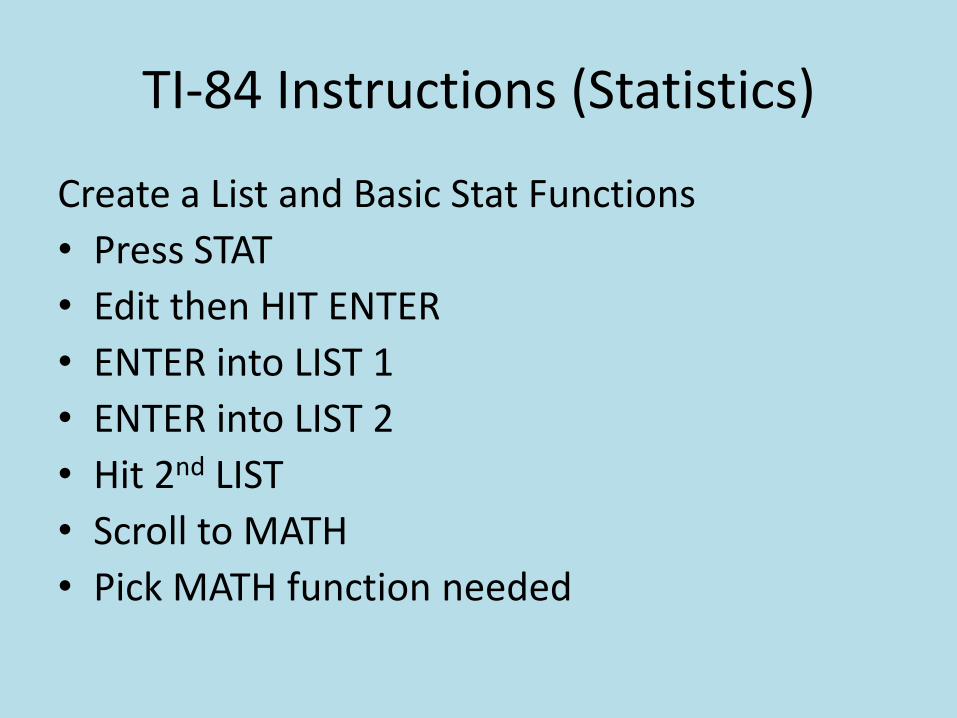
TI-84 Instructions (Statistics)
Create a List and Basic Stat Functions
• Press STAT
• Edit then HIT ENTER
• ENTER into LIST 1
• ENTER into LIST 2
• Hit 2nd LIST
• Scroll to MATH
• Pick MATH function needed


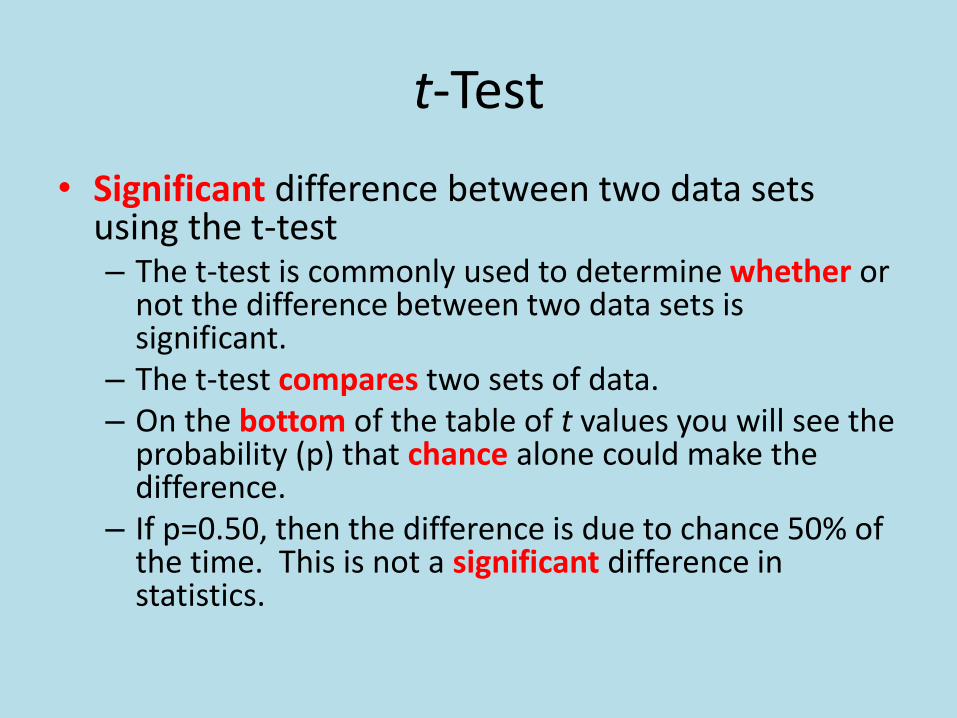
t-Test
• Significant difference between two data sets using the t-test– The t-test is commonly used to determine whether or
not the difference between two data sets is significant.
– The t-test compares two sets of data.– On the bottom of the table of t values you will see the
probability (p) that chance alone could make the difference.
– If p=0.50, then the difference is due to chance 50% of the time. This is not a significant difference in statistics.

t-Test
• However, if p=0.05, then the difference is due to chance only 5% of the time.
• In our bean example from before that would mean that there is a 95% chance that the difference is due to one set of the bean plants being in the sunlight.
• The 95% chance is a significant difference in statistics.
• Statisticians are never completely certain, but they like to be at least 95% certain of their findings before drawing conclusions.

t-Test
• Mean, standard deviation, and sample size are used to calculate the value of t when comparing two groups of data.
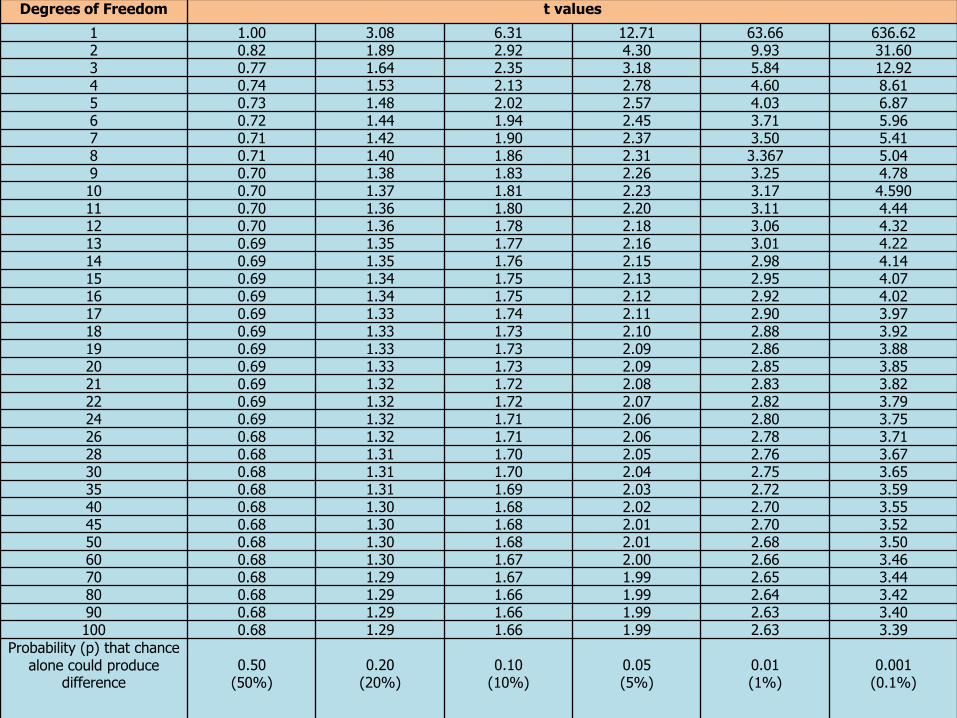
• First look at the degrees of freedom and then move across to the value of t.
• Degrees of freedom are the sum of the sample sizes of the two groups minus 2.
• Example: If the degree of freedom is 9, and the given value of t is 2.60. Look to the bottom of the table and you will see that the probability that chance alone produced the result is 5% (0.05).
• That means that there is a 95% chance that the differenceis significant.
Degrees of Freedom t values
1 1.00 3.08 6.31 12.71 63.66 636.622 0.82 1.89 2.92 4.30 9.93 31.603 0.77 1.64 2.35 3.18 5.84 12.924 0.74 1.53 2.13 2.78 4.60 8.615 0.73 1.48 2.02 2.57 4.03 6.876 0.72 1.44 1.94 2.45 3.71 5.967 0.71 1.42 1.90 2.37 3.50 5.418 0.71 1.40 1.86 2.31 3.367 5.049 0.70 1.38 1.83 2.26 3.25 4.7810 0.70 1.37 1.81 2.23 3.17 4.59011 0.70 1.36 1.80 2.20 3.11 4.4412 0.70 1.36 1.78 2.18 3.06 4.3213 0.69 1.35 1.77 2.16 3.01 4.2214 0.69 1.35 1.76 2.15 2.98 4.1415 0.69 1.34 1.75 2.13 2.95 4.0716 0.69 1.34 1.75 2.12 2.92 4.0217 0.69 1.33 1.74 2.11 2.90 3.9718 0.69 1.33 1.73 2.10 2.88 3.9219 0.69 1.33 1.73 2.09 2.86 3.8820 0.69 1.33 1.73 2.09 2.85 3.8521 0.69 1.32 1.72 2.08 2.83 3.8222 0.69 1.32 1.72 2.07 2.82 3.7924 0.69 1.32 1.71 2.06 2.80 3.7526 0.68 1.32 1.71 2.06 2.78 3.7128 0.68 1.31 1.70 2.05 2.76 3.6730 0.68 1.31 1.70 2.04 2.75 3.6535 0.68 1.31 1.69 2.03 2.72 3.5940 0.68 1.30 1.68 2.02 2.70 3.5545 0.68 1.30 1.68 2.01 2.70 3.5250 0.68 1.30 1.68 2.01 2.68 3.5060 0.68 1.30 1.67 2.00 2.66 3.4670 0.68 1.29 1.67 1.99 2.65 3.4480 0.68 1.29 1.66 1.99 2.64 3.4290 0.68 1.29 1.66 1.99 2.63 3.40100 0.68 1.29 1.66 1.99 2.63 3.39
Probability (p) that chance alone could produce
difference0.50
(50%)0.20
(20%)0.10
(10%)0.05(5%)
0.01(1%)
0.001(0.1%)

TI-84 Instructions (Statistics)
Create a List and Basic Stat Functions – T-TEST
• Press STAT
• SCROLL to TESTS
• Select TWO-SAMPLE T-TESTS
• POOLED – SELECT YES
• SCROLL DOWN HIT CALCULATE

Correlation vs. Causation
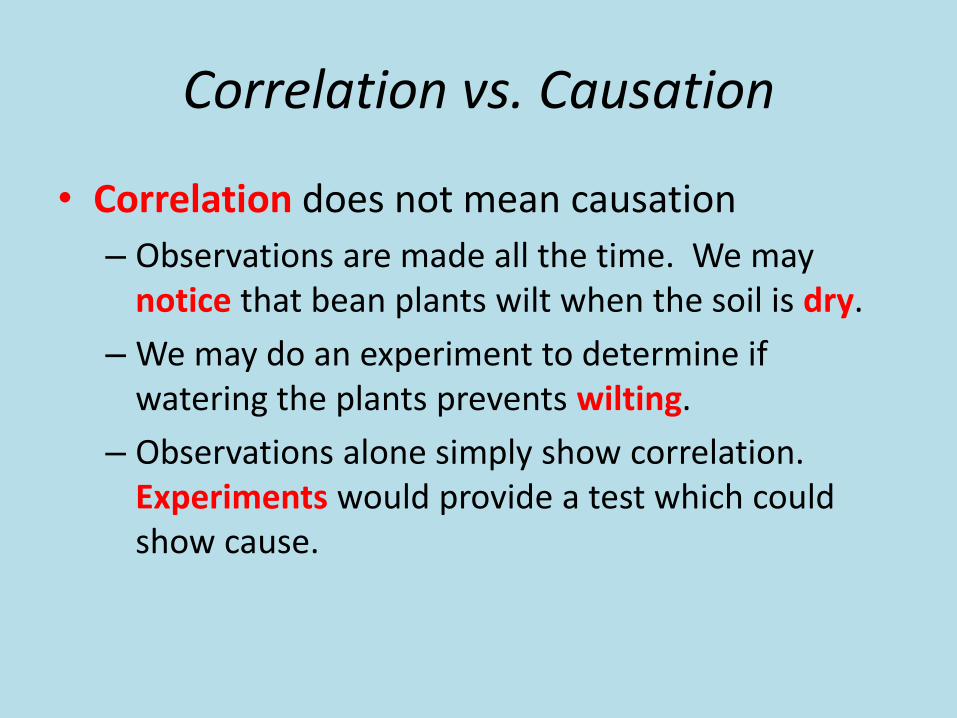
• Correlation does not mean causation
– Observations are made all the time. We may notice that bean plants wilt when the soil is dry.
– We may do an experiment to determine if watering the plants prevents wilting.
– Observations alone simply show correlation. Experiments would provide a test which could show cause.

Correlation vs. Causation
• Cormorants– Mathematical correlation tests use the value r to
signify the correlation
– The value of r can vary from +1 (completely positive correlation) to 0 (no correlation) to -1 (completely negative correlation)
– Example: The size of breeding cormorant birds in millimeters to determine if there is a correlation between the sizes of males and females which breed together.
Correlation vs. Causation
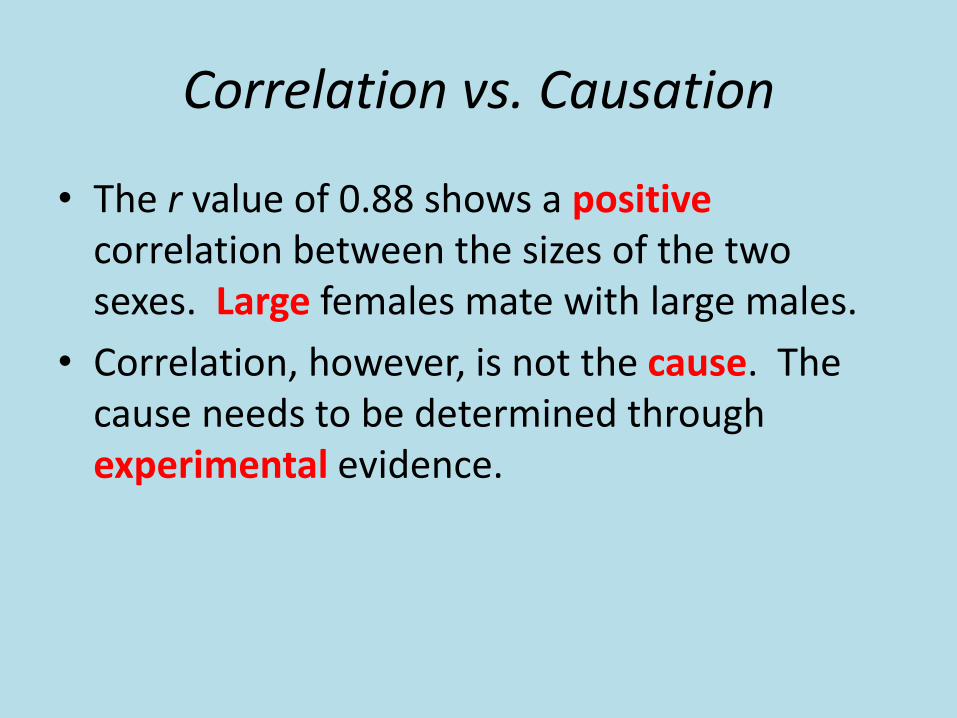
• The r value of 0.88 shows a positivecorrelation between the sizes of the two sexes. Large females mate with large males.
• Correlation, however, is not the cause. The cause needs to be determined through experimental evidence.
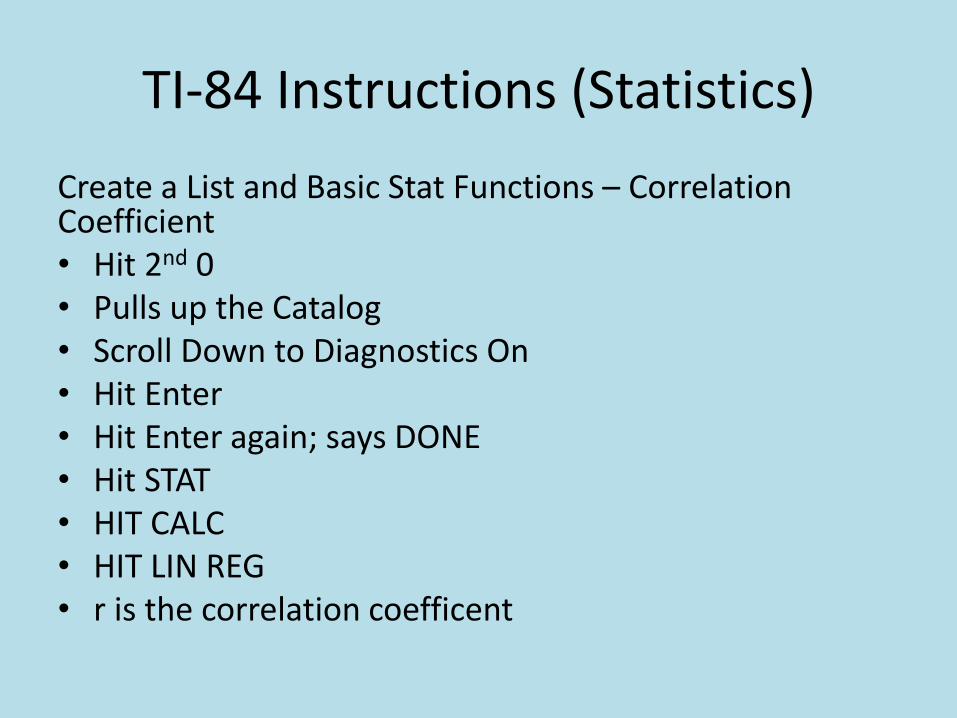
TI-84 Instructions (Statistics)
Create a List and Basic Stat Functions – Correlation Coefficient• Hit 2nd 0• Pulls up the Catalog• Scroll Down to Diagnostics On• Hit Enter• Hit Enter again; says DONE• Hit STAT• HIT CALC• HIT LIN REG• r is the correlation coefficent

Pair Numbers Size of female cormorants in
millimeters
Size of male cormorants in
millimeters
1 17.1 16.5
2 18.5 17.4
3 19.7 17.3
4 16.2 16.8
5 21.3 19.5
6 19.6 18.3
r = 0.88