unit 1 the flow of genetic information lectures: 1. dna structure and chemistry 2. genomic dna,...
TRANSCRIPT
UNIT 1
THE FLOW OF GENETIC INFORMATION
LECTURES:1. DNA Structure and Chemistry2. Genomic DNA, Genes, Chromatin3. DNA Replication, Mutation, Repair4. RNA Structure and Transcription5. Eukaryotic Transcriptional Regulation6. RNA Processing7. Protein Synthesis and the Genetic Code 8. Protein Synthesis and Protein Processing

THE FLOW OF GENETIC INFORMATION
DNA RNA PROTEIN
DNA
1 2 3
1. REPLICATION (DNA SYNTHESIS)2. TRANSCRIPTION (RNA SYNTHESIS)3. TRANSLATION (PROTEIN SYNTHESIS)

1. DNA Structure and Chemistry
a). Evidence that DNA is the genetic informationi). DNA transformationii). Transgenic experimentsiii). Mutation alters phenotype
b). Structure of DNAi). Structure of the bases, nucleosides, and nucleotidesii). Structure of the DNA double helix
3’,5’-phosphodiester bondpolarity of the polynucleotide chainshydrogen bonding of the bases
specificity of base pairingcomplementarity of the DNA strands
c). Chemistry of DNAi). Forces contributing to the stability of the double helixii). Denaturation of DNA
hyperchromicitymelting curves and Tm

i) DNA transformation: in vivo experiment
Mice are injected either with Type R, non-virulentStreptococcus or with heat-killed, virulent Type S cells.

• Mice are injected with both Type R, non-virulent andheat-killed, Type S Streptococcus
• DNA carrying genes from the virulent, heat-killed cells transforms the non-virulentbacterial cells, making them lethal to the mice

DNA transformation: in vitro experiment
Type R cells Type R colonies
Type S cells Type S colonies
Mixture ofType R and Type S
colonies
Type R cells+ DNA fromType S cells

Genotype:An organism’s genetic constitution.
Phenotype:The observed characteristics of an organism,
as determined by the genetic makeup(and the environment).
DNA from Type S cells (thus conferring the Type S genotype)transformed Type R cells into cells having the Type S phenotype

ii). Transgenic experiments
Plasmid DNA carrying thegrowth hormone gene
Injected into nucleus of a fertilized mouse egg
Egg implanted into uterusof surrogate mother mouse
Mother mouse gives birth to transgenic mouse

Thymine (T)
Guanine (G) Cytosine (C)
Adenine (A)
b). Structure of DNA
i). Structure of the bases, nucleosides, and nucleotides
Purines Pyrimidines
5-Methylcytosine (5mC)

[structure of deoxyadenosine]

Nomenclature
Purinesadenine adenosineguanine guanosinehypoxanthine inosine
Pyrimidinesthymine thymidinecytosine cytidine
+ribose uracil uridine
Nucleoside NucleotideBase +deoxyribose +phosphate

• polynucleotide chain• 3’,5’-phosphodiester bond
ii). Structure of the DNA double helix

• hydrogen bonding of the bases
A-T base pair
G-C base pair
Chargaff’s rule: The content of A equals the content of T, and the content of G equals the content of C in double-stranded DNA from any species

Double-stranded DNA
• specificity of base pairing• complementarity of the DNA strands• B-DNA has 10 base-pairs per turn

• base pairing during DNA synthesis
Parental DNA strands
Daughter DNA strands
• base pairing during RNA synthesis

DNA that is over- or underwound is “supercoiled”
• positive supercoiling results from overwinding DNAand normally occurs during DNA replication
• negative supercoiling results from underwinding DNAand normally occurs in the nucleosome
• negative supercoiling can give rise to Z-DNA• Z-DNA is a left handed helix
with zigzagged (hence Z) phosphates• Z-DNA occurs where there are
alternating pyrimidines and purines (on one strand)• the transition of B- to Z-DNA is
facilitated by 5-methylcytosine
• negative supercoiling may affect RNA synthesis• by promoting Z-DNA formation• by making it easier to separate the DNA strands


5’
5’3’
3’
5’carbon
3’carbon
• antiparallel polarity of thepolynucleotide chains

• nucleases hydrolyze phosphodiester bonds
Endonucleases cleave internallyand can cut on either side of aphosphate leaving 5’ phosphateor 3’ phosphate ends dependingon the particular endonuclease.
Exonucleases cleave atterminal nucleotides.
5’
5’3’
3’
e.g., proofreading exonucleases
e.g., restriction endonucleases

c). Chemistry of DNA
i). Forces affecting the stability of the DNA double helix
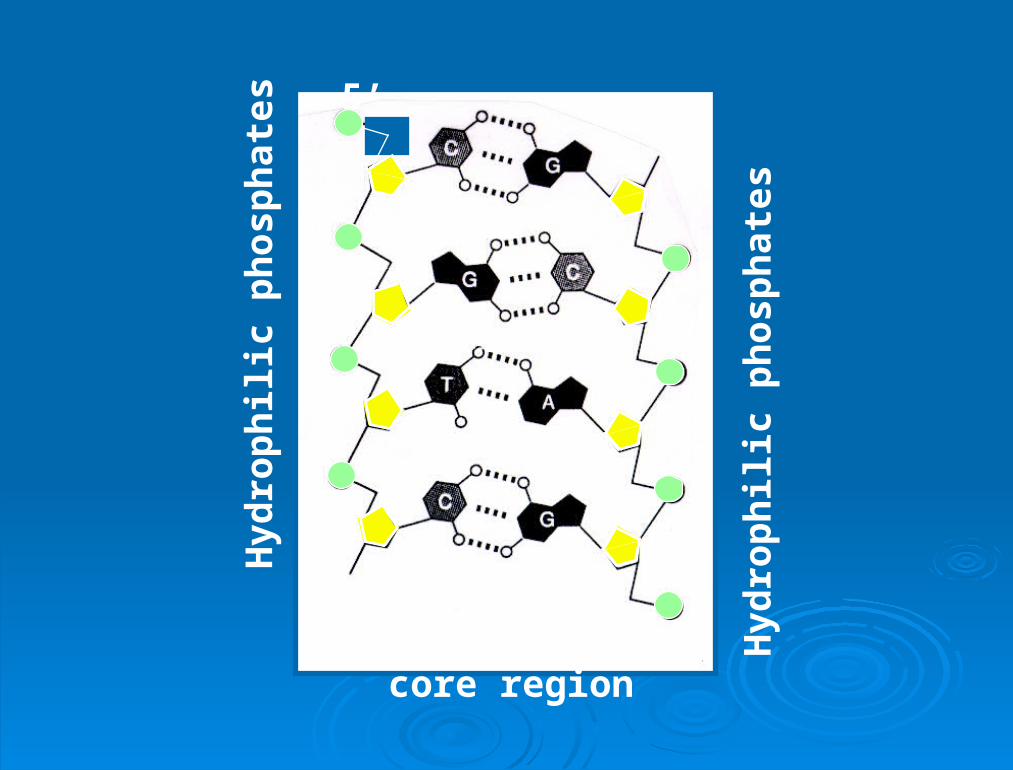
• hydrophobic interactions - stabilize - hydrophobic inside and hydrophilic outside
• stacking interactions - stabilize - relatively weak but additive van der Waals forces
• hydrogen bonding - stabilize - relatively weak but additive and facilitates stacking
• electrostatic interactions - destabilize - contributed primarily by the (negative) phosphates - affect intrastrand and interstrand interactions - repulsion can be neutralized with positive charges
(e.g., positively charged Na+ ions or proteins)
5’
5’3’
3’
Hydrophobic core region
Hyd
rop
hili
c p
ho
sph
ates
Hyd
rop
hili
c p
ho
sph
ates
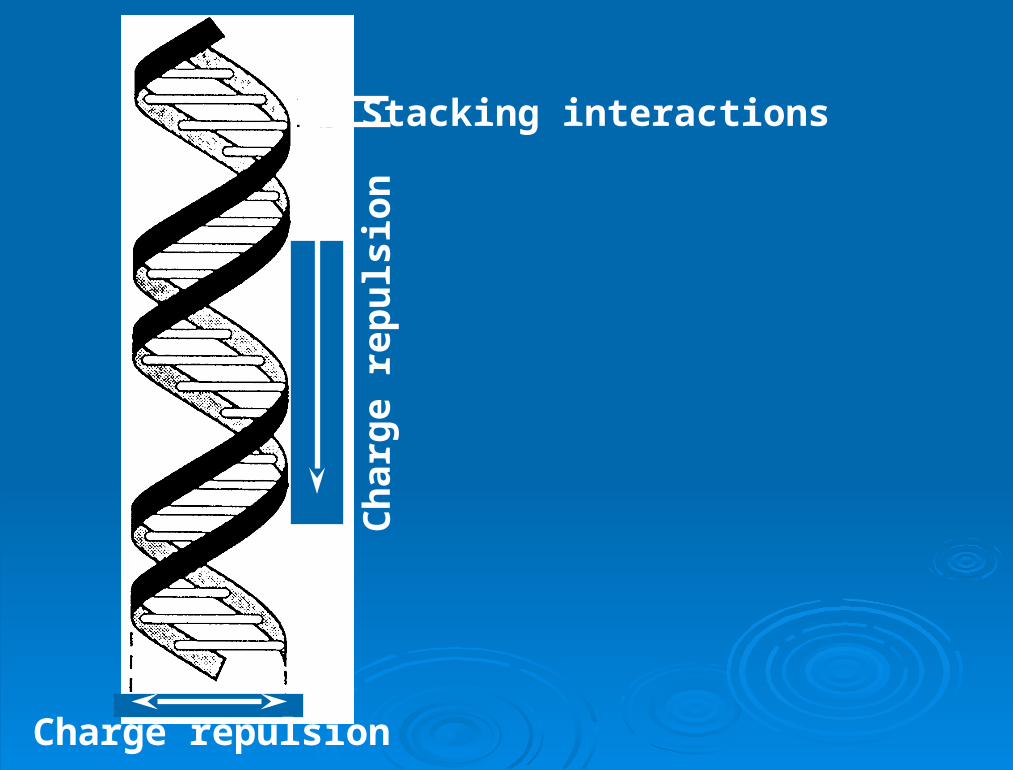
Stacking interactions
Charge repulsion
Ch
arg
e re
pu
lsio
n

Model of double-stranded DNA showing three base pairs

ii). Denaturation of DNA
Double-stranded DNA
A-T rich regions denature first
Cooperative unwinding of the DNA strands
Strand separationand formation ofsingle-stranded random coils
Extremes in pH or high temperature

Electron micrograph of partially melted DNA
• A-T rich regions melt first, followed by G-C rich regions
Double-stranded, G-C rich DNA has not yet melted
A-T rich region of DNAhas melted into asingle-stranded bubble

• hyperchromicity
The absorbance at 260 nm of a DNA solution increases when the double helix is melted into single strands.
260
Ab
sorb
ance
Single-stranded
Double-stranded
220 300

100
50
0
7050 90
Temperature oC
Pe
rce
nt
hyp
erc
hro
mic
ity
• DNA melting curve
• Tm is the temperature at the midpoint of the transition

• average base composition (G-C content) can be determined from the melting temperature of DNA
50
7060 80
Temperature oC
• Tm is dependent on the G-C content of the DNA
Pe
rce
nt
hyp
erc
hro
mic
ity
E. coli DNA,which is 50% G-C,has a Tm of 69 o C.