unit-level test adequacy criteria for visual dataflow
TRANSCRIPT
1
Unit-Level Test Adequacy Criteria for VisualDataflow Languages and a TestingMethodology
MARCEL R. KARAM
American University of Beirut
TREVOR J. SMEDLEY
Dalhousie University
and
SERGIU M. DASCALU
University of Nevada Reno
Visual dataflow languages (VDFLs), which include commercial and research systems, have had asubstantial impact on end-user programming. Like any other programming languages, whethervisual or textual, VDFLs often contain faults. A desire to provide programmers of these languageswith some of the benefits of traditional testing methodologies has been the driving force behind oureffort in this work. In this article we introduce, in the context of prograph, a testing methodologyfor VDFLs based on structural test adequacy criteria and coverage. This article also reports on theresults of two empirical studies. The first study was conducted to obtain meaningful informationabout, in particular, the effectiveness of our all-Dus criteria in detecting a reasonable percentageof faults in VDFLs. The second study was conducted to evaluate, under the same criterion, theeffectiveness of our methodology in assisting users to visually localize faults by reducing theirsearch space. Both studies were conducted using a testing system that we have implemented inPrograph’s IDE.
Categories and Subject Descriptors: D.2.5 [Software Engineering]: Testing and Debugging; D.2.6[Software Engineering]: Programming Environments; D.1.7 [Programming Techniques]:Visual Programming
General Terms: Algorithms, Languages, Verification.
Additional Key Words and Phrases: Software testing, visual dataflow languages, fault detection,fault localization, color
This article is revised and expanded version of a paper presented at the IEEE Symposium onHuman-Centric Computing Languages and Environments (HCC’01) [Karam and Smedley 2001] c©IEEE 2001.Authors’ address: M. R. Karam, Department of Computer Science, American University of Beirut,3 Dag Hammarskjold Plaza, eighth floor, New York, NY 10017; email: [email protected] to make digital or hard copies of part or all of this work for personal or classroom use isgranted without fee provided that copies are not made or distributed for profit or direct commercialadvantage and that copies show this notice on the first page or initial screen of a display alongwith the full citation. Copyrights for components of this work owned by others than ACM must behonored. Abstracting with credit is permitted. To copy otherwise, to republish, to post on servers,to redistribute to lists, or to use any component of this work in other works requires prior specificpermission and/or a fee. Permissions may be requested from Publications Dept., ACM, Inc., 2 PennPlaza, Suite 701, New York, NY 10121-0701 USA, fax +1 (212) 869-0481, or [email protected]© 2008 ACM 1049-331X/2008/09-ART1 $5.00 DOI 10.1145/1391984.1391985 http://doi.acm.org/10.1145/1391984.1391985
ACM Transactions on Software Engineering and Methodology, Vol. 18, No. 1, Article 1, Pub. date: September 2008.

1:2 • M. R. Karam et al.
ACM Reference Format:Karam, M. R., Smedley, T. J., and Dascalu, S. M. 2008. Unit-level test adequacy criteria for visualdataflow languages and a testing methodology. ACM Trans. Softw. Engin. Method. 18, 1, Arti-cle 1 (September 2008), 40 pages. DOI = 10.1145/1391984.1391985 http://doi.acm.org/10.1145/1391984.1391985
1. INTRODUCTION
Visual dataflow languages (VDFLs) provide meaningful visual representa-tions for the creation, modification, execution and examination of programs.In VDFLs, users code by creating icons (operations) and linking them together.In this article, we refer to this activity as visual coding. The icons, or visualconstructs, are the source code, rather than merely visual representations of atextual code that lies beneath the icons. In VDFLs, the order of execution, whennot explicitly defined by the user, is determined by the visual language’s editingengine. That is, the computation is governed by the dataflow firing rule, whichstates that a computational element can execute as soon as sufficient incomingdata has arrived to begin the computation. This model of execution, known asthe dataflow computational model, has inspired several visual programminglanguages (Bernini and Mosconi [1994], Kimura et al. [1990], and Fisk [2003]).It is, in general, conceptualized as a kind of fluid that flows through linkagesbetween computational elements. The elements can be thought of as filters orprocessors that use the incoming data to produce a new stream of outgoing data.In a pure dataflow computational model, control constructs are not explicitlyspecified by the programmer; rather, the order of execution is implied by theoperations’ data interdependencies. To allow the user to explicitly add controlconstructs such as those found in imperative languages, VDFLs [Shafer 1994;Marten 2005] extended the pure computational dataflow model to include thenecessary control constructs. This extension, as some researchers believe, isnecessary for a dataflow language to have any practical use in developing tra-ditional software. Thus a visual program that is based on the dataflow compu-tational model can be characterized by both its data and control dependencies.
VDFLs are widely used, by researchers and end-users alike for a variety ofresearch and development tasks. For example, there is research into steeringscientific visualization [Burnett et al. 1994], using VDFLs for writing func-tional programs [Kelso 2002], writing and evaluating XML and XPath queries[Boulos et al. 2006; Karam et al. 2006], developing general-purpose applications[Shafer 1994], building domain-specific applications such as those used for lab-oratory instrumentations [Paton 1998], and buffering of intermediate results indataflow diagrams [Woodruff and Stonebraker 1995]. In general, researchersfeel that it is in these directions that visual dataflow programming languagesshow the most promise.
Despite claims that the use of graphics in VDFLs allows direct and concreterepresentations of problem-domain entities, and that the direct representa-tions can simplify the programming task of researchers and developers alike,we found that many informal investigations into VDFLs reveal that, like anyother languages, they contain faults. A possible factor in the existence of these
ACM Transactions on Software Engineering and Methodology, Vol. 18, No. 1, Article 1, Pub. date: September 2008.

Unit-Level Test Adequacy Criteria for Visual Dataflow Languages • 1:3
faults, as argued by Meyer and Masterson [2000], is most likely related to incor-rect control annotations and datalinks. In spite of this evidence, we have foundno related discussions in the research literature of techniques for testing or eval-uating a testing methodology that can reveal faults and assist in fault localiza-tion in VDFLs. In fact, there has been some work on testing in other paradigms.For example, in the domain of form-based languages, recent work has focusedon testing visual form-based languages [Rothermel et al. 2001]. Although thevisual dataflow paradigm is similar to the visual form-based paradigm in thatthey are both visual, several characteristics of the form-based paradigm, such asthe dependency-driven nature of its evaluation engine and the responsivenessof its editing environment, suggest a different approach when testing dataflowlanguages. There has also been work on specification-based testing for impera-tive languages [Kuhn and Frank 1997; Ouabdesselam and Parissis 1995]. Sincemost VDFLs are intended for use by a variety of researchers and professionalend-users alike, few of these users are likely to create specifications for theirprograms [Wing and Zaremski 1991]. Moreover, even when specifications exist,evidence suggests that code-based testing techniques can provide an effectivemechanism for detecting faults [Hutchins et al. 1994; Wong et al. 1995] and in-creasing software reliability [Del Frate 1995]. Other research (e.g., Azem et al.[1993], Belli and Jack [1993], and Luo et al. [1992]) considered problems of test-ing and reliability determination for logic programs written in Prolog. AlthoughVDFLs are comparable to logic-based programs in that both are declarative (i.e.,declaring data and control dependencies between operations), several featuresof the logic paradigm, such as the bidirectional nature of unification, and back-tracking after failure, are so different from VDFLs that the testing techniquesdeveloped for Prolog cannot be applied to VDFLs.
On the other hand, there has been extensive research on testing impera-tive programs (e.g., Clarke et al. [1989], Frankl and Weiss [1993], Frankl andWeyuker [1988], Harrold and Soffa [1988], Hutchins et al. [1994], Korel andLaski [1983], Ntafos [1984], Offutt et al. [1996], Perry and Kaiser [1990], Rappsand Weyuker [1985], Rothermel and Harrold [1997], Weyuker [1986, 1993], andWong et al. [1995]). In fact, the family of testing criteria we present for VDFLsin this article is rooted in the body of the aforementioned work on impera-tive testing. There are significant differences between VDFLs and imperativelanguages, and these differences have ramifications for testing strategies ofVDFLs. These differences can be divided into three classes, as describednext.
The first class pertains to the evaluation or execution order. The order of ex-ecution of nonpredicate operations or statements is not predetermined by theprogrammer, but is simply based on data dependencies. If we were to construct,as with imperative languages, a control flow graph (CFG) that represents theflow of control in VDFLs, taking into consideration all possible execution orders,it would be extremely large and complex. It would also most likely be impossibleto satisfy any criteria using this graph, since most dataflow language imple-mentations choose a specific execution ordering for non-predicate operations,and use it for every execution. This is, in fact, the execution behavior of VDFLs.The execution order is maintained by a topological sort that is performed on
ACM Transactions on Software Engineering and Methodology, Vol. 18, No. 1, Article 1, Pub. date: September 2008.
1:4 • M. R. Karam et al.
all operations during the phases of visual coding and modification of the code.Since we are not considering, for the purpose of our current work, operations,that can have side-effects (object-oriented features such as the get and set op-erations that read and respectively write objects’ data, and global variables),any execution order of a sequence of non-predicate operations will yield thesame result. Thus we need only consider one order—the one determined by theediting engine of the language. In future work we intend to address the sideeffects issues.
The second class of differences pertains to performing static source codeanalysis in VDFLs. With imperative languages, a wide range of techniquesfor computing source code (control-flow and dataflow) analysis in individualprocedures and programs are well known [Aho et al. 1986] and have been usedin various tools, including data-flow testers (e.g., Korel and Laski [1985], Franklet al. [1985], and Harrold and Soffa [1988]). With VDFLs, however, the variabledeclaration process and the visual constructs’ characteristics have impact onhow precisely and efficiently source code analysis can be done. First, in general,variables in VDFLs cannot be explicitly defined; that is, users write programsby creating icons that are connected via datalinks. In general, a datalink iscreated between an outgoing port on one icon, and an incoming port on another.In VDFLs such as the one we are considering in this work, outgoing portsare known as roots, and incoming ports are known as terminals. One way todeal with the implicit declaration of variables is to think of roots as variabledefinitions, and terminals connected to those roots as variable uses. Second,although formal grammars for pictures [Zhang and Zhang 1997] and parsingalgorithms for pictorially represented programs have been investigated [Changet al. 1989], none of these techniques is applicable to VDFLs for the purposeof efficiently performing source code analysis. One of the solutions to overcomethis difference is to take advantage of the control-flow and data-flow informationthat can be obtained from the data structures maintained by the editing engineof VDFLs.
The third class of differences pertains to the reporting mechanisms of testresults. With imperative languages, the use of textual logs as a way to view testresults, albeit difficult to read and interpret, is practically impossible in VDFLs.Test results of VDFLs should be reported in a way that complements the visualconstructs, given their unique characteristics and properties. For example, someindication should be given to the tester when a datalink connecting a variabledefinition to its use is not exercised. Therefore, the reporting mechanism shouldbe visual and well incorporated within the integrated development environment(IDE) that supports the implementation of the VDFL.
In Section 2 of this article, we present Prograph’s syntax and its formal se-mantics. In Section 3, we present a family of structural unit-based test adequacycriteria for VDFLs. In Section 4, we examine the applicability of several code-based data-flow applicability criteria for testing VDFLs. In Section 5, we intro-duce our a methodology that takes advantage of the aforementioned classes ofdifferences to achieve efficient and precise control-flow and dataflow analysesin VDFLs, and provides a testing environment that implements, in particular,the all-Dus. The testing environment accommodates the user base of VDFLs
ACM Transactions on Software Engineering and Methodology, Vol. 18, No. 1, Article 1, Pub. date: September 2008.

Unit-Level Test Adequacy Criteria for Visual Dataflow Languages • 1:5
Fig. 1. A Prograph program for quicksort.
with a visual interface that is augmented with a color mapping scheme [Joneset al. 2002] that facilitates the task of localizing faults by reducing their searchspace without requiring a formal testing theoretical background. In Section 6,we describe the design of our experiments and present the empirical resultsobtained. Section 7 concludes the article with a summary of our contributionsand an outline of planned directions of future work.
2. VISUAL DATAFLOW LANGUAGES
Since much of our work is based on the visual programming environment ofPrograph [Shafer 1994], we will next informally introduce its syntax and se-mantics using the example that is depicted in Figure 1.
2.1 Prograph
Figure 1 shows a Prograph implementation of the well known algorithm quick-sort for sorting a list into ascending order. The bottom right window entitledUniversals of “Quicksort” in this figure, depicts two icons for the methods, callsort and quicksort. Note that Prograph is an object-oriented language; hencethe term method or universal is used to refer to entities known as proceduresin imperative programming languages.
The left side window, entitled 1:1 call sort in Figure 1, shows the details of themethod call sort, a dataflow diagram in which three operations are connectedand scheduled to execute sequentially. The first operation in this diagram, ask,is a primitive that calls system-supplied code to produce a dialogue box request-ing data input from the user (or a list of numbers typed into the dialogue box).Once the ask primitive has been executed, the data entered by the user flowsdown the datalink to the operation quicksort, invoking the method quicksort.This method expects to receive a list, which it sorts as explained below, out-putting the sorted list, which flows down the datalink to the show operation.The show produces a dialogue displaying the sorted list. The small circle iconson the top and bottom of an operation, representing inputs and outputs, are
ACM Transactions on Software Engineering and Methodology, Vol. 18, No. 1, Article 1, Pub. date: September 2008.

1:6 • M. R. Karam et al.
called terminals and roots, respectively. Note that the 1:1 in the window enti-tled 1:1 call sort, indicates that the method call sort has only one case associatedwith it. In general, a method consists of a sequence of cases. More on what acase is and how it executes can be found next.
The method quicksort consists of two cases, each represented by a dataflowdiagram as shown in the windows entitled 1:2 quicksort and 2:2 quicksort ofFigure 1, respectively. The first case, 1:2 quicksort, implements the recursivecase of the algorithm, while the second, 2:2 quicksort, implements the base case.The thin bar-like operation at the top of a case, where parameters are copiedinto the case, is called an input-bar, while the one at the bottom, where resultsare passed out, is called an output-bar. In the first case of quicksort, the firstoperation to be executed is the match operation , which tests to see if theincoming data on the root of the input-bar is the empty list. The check mark iconattached to the right end of the match is a next-case on success control, whichis triggered by success of the match, immediately terminating the executionof the first case and initiating execution of the second case. If this occurs, theempty list is simply passed through from the input-bar of the second case to itsoutput-bar, and execution of quicksort finishes, producing the empty list.
If the input list is not empty, the control on the match operation in the firstcase is not triggered, and the first case is executed. Here, the primitive operationdetach-l (or detach left) outputs the first element of the list and the remainderof the list on its left and right roots respectively. Next, the operation, , is exe-cuted. This operation is an example of a multiplex, illustrating several featuresof the language. First, the three-dimensional representation of the operationindicates that the primitive operation >= will be applied repeatedly. Second,the terminal annotated as is a list-terminal, indicating that a list is ex-pected as data, one element of which will be consumed by each execution of theoperation. In this example, when the multiplex is executed, the first element ofthe list input to the case will be compared with each of the remaining elements.Finally, the special roots and indicate that this particular multiplex is apartition, which divides the list of items arriving on the list annotated terminalinto two lists items for which the comparison is successful, and those for whichit is not. These two lists appear on the and roots, respectively.
The lists produced by the partition multiplex are sorted by recursive calls tothe quicksort method. The final sorted list is then assembled using two primitiveoperations: attach-l, which attaches an element to the left end of a list, and (join),which concatenates two lists.
The execution mechanism of Prograph is data-driven dataflow. That is, anoperation executes when all its input data is available. In practice, a linearexecution order for the operations in a case is predetermined by topologicallysorting the directed acyclic graph of operations and subject to certain con-straints. For example, an operation with a control should be executed as early aspossible.
In our example the method quicksort has only one input and one output,and therefore does not illustrate the relationship between the terminals of anoperation and the roots of the input-bar in a case of the method it invokes.These terminals and roots must be of equal number, and are matched from
ACM Transactions on Software Engineering and Methodology, Vol. 18, No. 1, Article 1, Pub. date: September 2008.

Unit-Level Test Adequacy Criteria for Visual Dataflow Languages • 1:7
left to right. A similar relationship exists between the roots of an operationand the terminals of the output-bar in a case of a method invoked by theoperation.
One important kind of operation not illustrated in the above example is thelocal operation. A local operation is one that does not call a separately de-fined method, such as the quicksort method shown above. Instead, it containsits own sequence of cases and their operations, and is therefore analogous toa parameterized begin-end block in a standard procedural language. A localoperation is often referred to as local method, and can also have roots andterminals attached to it. Roots and terminals on a local operation can be anno-tated with a loop to create a repeating case or cases. Terminate on success ,and Terminate on failure , as the names indicate, are controls that can beapplied to operations in a local operation to stop the iterations during execu-tion. More information on the operations and possible control can be found inSection 3.2.
The formal semantics of Prograph are defined by specifying an executionfunction for each operation in a program. Each execution function maps a listX to a pair (Y, c), where c is a control flag, Y is a list, and the lengths of the listsX and Y are, respectively, equal to the number of terminals and the number ofroots of the operation, and the elements X and Y are from a domain � containingall values of simple types and instances of classes. Execution functions mayproduce the special value error; for example, if a list terminal receives a valuethat is not a list. By defining execution functions for operations, the input/outputbehavior of a program is specified. To find more on the language syntax andsemantics, see Shafer [1994].
3. A FAMILY OF TEST ADEQUACY CRITERIA FOR VISUALDATAFLOW LANGUAGES
As previously mentioned, test adequacy criteria have been well researched forimperative languages. In this section, we explore the appropriate applicabilityof several of these criteria (e.g., Laski and Korel [1983], Ntafos [1984], andRapps and Weyuker [1985]) to VDFLs. We argue that an abstract control-flowmodel, which is common to all these test adequacy criteria, can be appropriatelyadapted to VDFLs. Moreover, we argue that code-based data-flow test adequacycriteria, which relate test adequacy to interactions between definitions anduses of variables in the source code (definition-use associations), can be highlyappropriate for VDFLs; in particular that of Rapps and Weyuker [1985]. Thereare several reasons for this appropriateness. The first reason involves the typesof faults that have been known to occur in VDFLs, the largest percentage ofwhich have been observed to involve errors in incorrect or missing controls, anddatalinks [Meyer and Masterson 2000]. Second, the application of [Rapps andWeyuker 1985] criteria, combined with the use of the color mapping scheme ofJones et al. [2002] on the datalink constructs of VDFLs, can be shown to providesignificant advantages including a relative ease of applicability to individualdatalinks (or, as we show later in Section 4.2 definition-use associations) andan increased ability to localize faults.
ACM Transactions on Software Engineering and Methodology, Vol. 18, No. 1, Article 1, Pub. date: September 2008.

1:8 • M. R. Karam et al.
3.1 The Abstract Model for Prograph
Test adequacy criteria are often defined on models of programs rather than onthe code itself. We have created such a model for VDFLs [Karam and Smedley2001] that we call the operation case graph (OCG). In this article we augmentthe OCG to represent the complete set of Prograph’s operations and their ap-plicable controls. These are: input-bar; output-bar; locals; and universal meth-ods or functions; Constants; match; and primitives or system defined methods.These operations may have the following control annotations: next-case, finish,terminate, fail, continue, or repeat annotation. Roots and terminals on localsor universals may have list or loop annotations. An operation that is controlannotated is referred to as a predicate operation otherwise it is a non-predicateoperation.
Given a Prograph procedure p in a program P, we say that since each pro-cedure consists of one or more cases, we define an abstract graph model forPrograph by constructing an OCG for each case c in p or OCG(c). Each OCG(c)has a unique entry and exit nodes ne, and nx respectively, and will be assignedthe name and label of its corresponding case in Prograph. For example, if amethod X has two cases 1:2 X and 2:2 X denoting X case one of two and Xcase two of two, respectively, the OCG graphs will be labeled OCG(1:2X ) andOCG(2:2X ). A local operation, as previously mentioned, has its own sequence ofcases, and each case will also have its own OCG. We next describe the build-ing process of the control-flow abstract model of OCG(p) = {OCG(c1), OCG(c2),. . ., OCG(cn)} in the context of the example of Figure 2, which is designed tointroduce all the control constructs of Prograph.
3.2 The Building Process of the OCGs
Most test adequacy criteria for imperative languages are defined in terms ofabstract models of programs, rather than directly on the code itself. This meansthat the code is translated into a control-flow graph (CFG) and testing is appliedto the graph representing the code. This definition reflects explicitly the codeconstructs, and program execution follows the flow of control in the CFG. Ingeneral, to construct a CFG for a function f or CFG(f), f is decomposed into a setof disjoint blocks of statements. A block is a sequence of consecutive statementsin which the flow of control enters at the beginning of the block and leaves atthe end without halt or the possibility of branching, except at the end. A controltransfer from one block to another in CFG(f) is represented by a directed edgebetween the nodes such that the condition of the control transfer is associatedwith it.
With VDFLs, the dataflow computational model (control and data depen-dency) makes grouping several non-predicate operations in one block not verydesirable, since the execution order is determined by the editing engine. There-fore, to deal with the first class of differences between imperative languagesand VDFLs that we mentioned in Section 1, we represent each procedurep ∈ P with an OCG(p) that preserves two properties of p’s operations: dataand control dependencies. With regard to preserving the data dependen-cies, we say that for each procedure p, there is a sequence of operations,
ACM Transactions on Software Engineering and Methodology, Vol. 18, No. 1, Article 1, Pub. date: September 2008.
Unit-Level Test Adequacy Criteria for Visual Dataflow Languages • 1:9
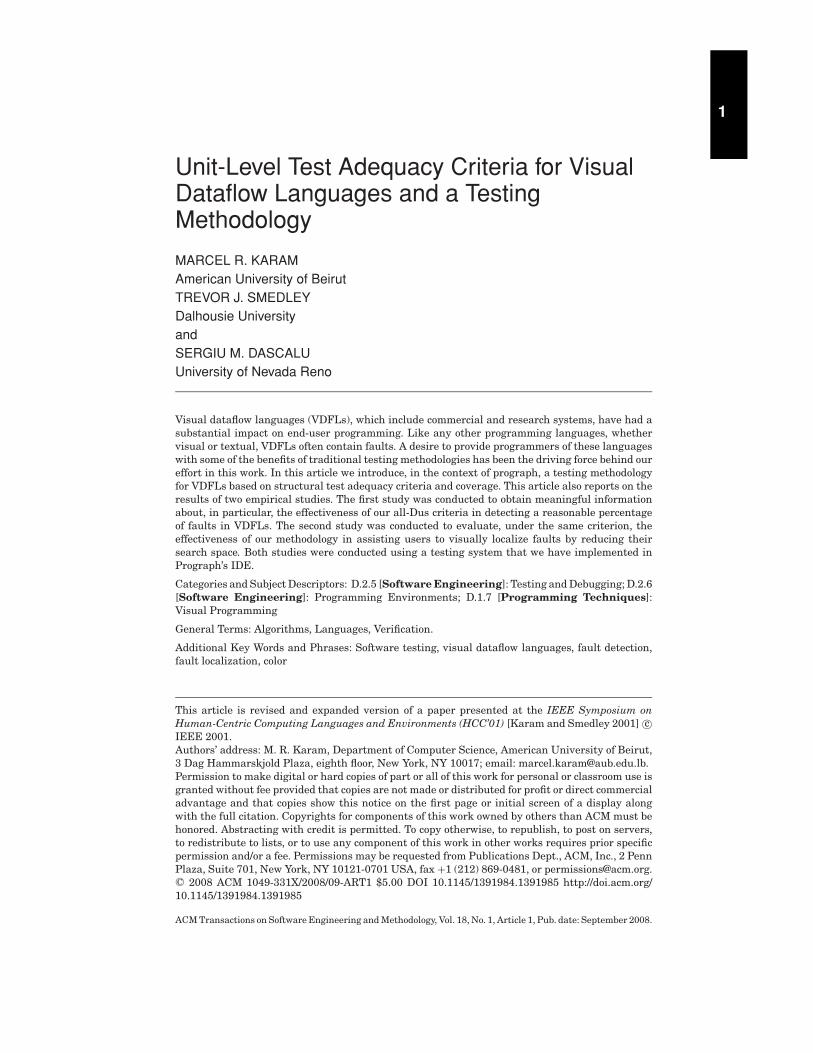
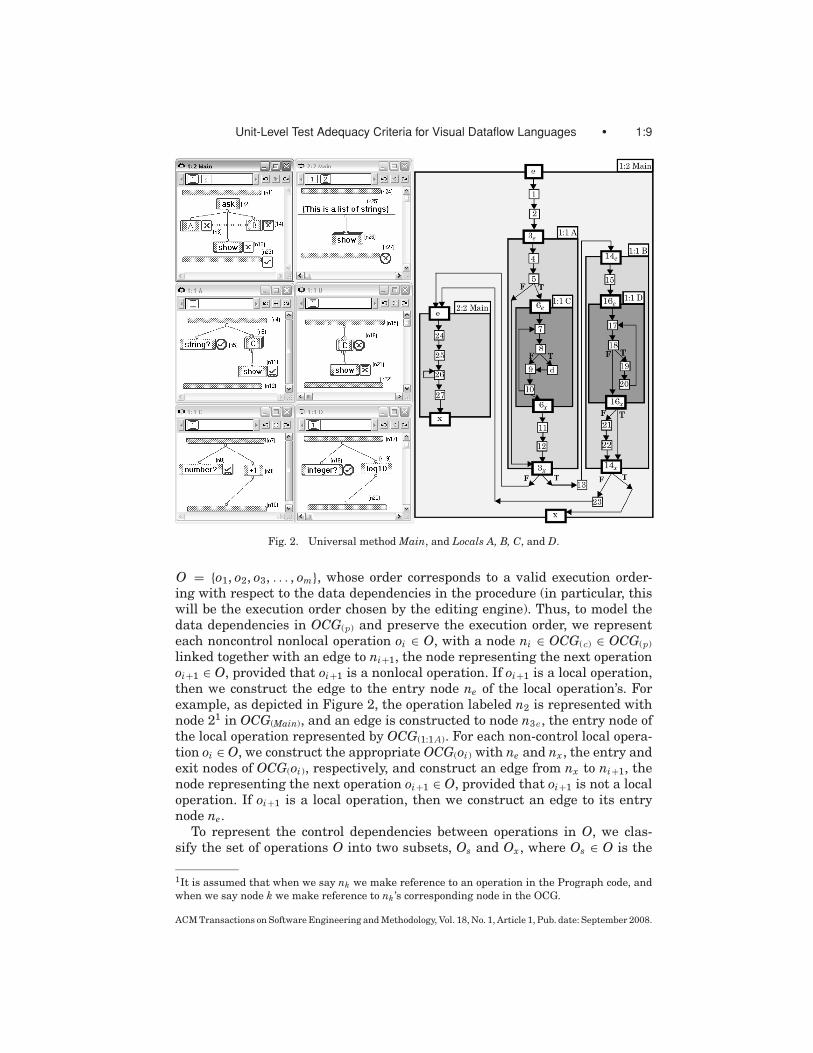
Fig. 2. Universal method Main, and Locals A, B, C, and D.
O = {o1, o2, o3, . . . , om}, whose order corresponds to a valid execution order-ing with respect to the data dependencies in the procedure (in particular, thiswill be the execution order chosen by the editing engine). Thus, to model thedata dependencies in OCG(p) and preserve the execution order, we representeach noncontrol nonlocal operation oi ∈ O, with a node ni ∈ OCG(c) ∈ OCG(p)linked together with an edge to ni+1, the node representing the next operationoi+1 ∈ O, provided that oi+1 is a nonlocal operation. If oi+1 is a local operation,then we construct the edge to the entry node ne of the local operation’s. Forexample, as depicted in Figure 2, the operation labeled n2 is represented withnode 21 in OCG(Main), and an edge is constructed to node n3e , the entry node ofthe local operation represented by OCG(1:1A). For each non-control local opera-tion oi ∈ O, we construct the appropriate OCG(oi ) with ne and nx , the entry andexit nodes of OCG(oi ), respectively, and construct an edge from nx to ni+1, thenode representing the next operation oi+1 ∈ O, provided that oi+1 is not a localoperation. If oi+1 is a local operation, then we construct an edge to its entrynode ne.
To represent the control dependencies between operations in O, we clas-sify the set of operations O into two subsets, Os and Ox , where Os ∈ O is the
1It is assumed that when we say nk we make reference to an operation in the Prograph code, andwhen we say node k we make reference to nk ’s corresponding node in the OCG.
ACM Transactions on Software Engineering and Methodology, Vol. 18, No. 1, Article 1, Pub. date: September 2008.

1:10 • M. R. Karam et al.
subset of operations that always succeed by default, and Ox ∈ O is the sub-set that do not. This classification is necessary to accurately represent andaccount for the flow of control in OCG(p), since control annotated operations ∈Os (on failure) do not change the control flow of the program. For example, inFigure 2, the primitive operation show that is labeled n13, which is annotatedwith a next-case on failure . Since n13 succeeds by default, the control flowin OCG(1:2Main) will not be affected. However, had the control been applied (onsuccess) to n13, the flow of control would have been affected, and subsequently,when the operation is evaluated, the control will be transferred to the next case2:2 Main or OCG(2:2Main). The output-bar, among other operations, belongs toOs.
Therefore, to represent the control dependencies between operations in O,we perform static analysis on each control annotated operation oi ∈ O. Next,we present each control and discuss how it is represented in the OCG.
Next-Case annotation. An operation oi with a next-case annotation will be rep-resented as follows: If oi is a nonlocal operation ∈ Ox , then oi will be representedby a node ni with two edges coming from it (true and false), one connected to ni+1,which is the node representing the next sequential operation oi+1 in the currentcase, and the other to entry node ne of the next case. If oi is a nonlocal operation∈ Os, we check the type of the control annotation, if it is next-case on failure ,we ignore the control; however, if it is a next-case on success , we construct anedge to the entry node ne of the next case. For example, as depicted in Figure 2,the operation labeled n23 is annotated with a next-case on success, so we con-struct an edge from node 23, its corresponding node in OCG(1:2Main), to the entrynode of the OCG(2:2Main). If oi is a local operation ∈ Ox , we construct the ap-propriate OCG(oi ), with its ne and nx , respectively. We recursively process allof oi ’s content, and then construct two edges on nx of oi to represent the flow ofcontrol (true and false): one to ni+1, the node representing the next sequentialoperation oi+1 in the current case; and the other to ne, the entry node of the nextcase. For example, as depicted in Figure 2, since the local operation labeled n3is annotated with a next-case on Failure, we represent it with OCG(1:1A), andconstruct two edges on its nx , one to the next operation n13, and the other to neof OCG(2:2Main).
Finish annotation. An operation oi with a finish annotation is unique in thesense that, when evaluated/activated in non-repeated or looped case, the flowof control does not change upon the outcome of the finish control. This meansthat if the outcome is either true or false, the next node that gets evaluatedor executed is the same. The same situation occurs when the finish annotatedoperation happens to be in a repeated or looped case; however, here the trueor false outcome may set a flag that will indicate whether successive iterationswill take place after finishing the current iteration. Thus, to handle a finishannotated operation, whether in a repeated or nonrepeated case, and representboth its true and false outcomes, an operation oi with a finish annotation willbe represented as follows: if oi is a nonlocal operation ∈ Os, we simply ignorethe evaluation of its control (on success or failure), and represent oi with a node
ACM Transactions on Software Engineering and Methodology, Vol. 18, No. 1, Article 1, Pub. date: September 2008.

Unit-Level Test Adequacy Criteria for Visual Dataflow Languages • 1:11
ni with one edge connected to ni+1, the node representing the next sequentialoperation oi+1. If oi is a nonlocal operation ∈ Ox , we represent oi with a nodeni with two edges coming out from it (true and false), one edge connected toni+1, the node representing the next sequential operation oi+1 in the currentcase, and the other edge to a dummy node d. From the dummy node d, we alsoconstruct an edge to ni+1. The reason for constructing this edge is to allow theflow of control to go to ni+1 when the outcome of the finish control goes throughthe dummy node d. When d exists in a looped-local and is traversed, it sets aflag value that indicates whether the loop edge can be traversed. For example,as depicted in Figure 2, the operation labeled n8 is annotated with a finish onsuccess . We therefore represent n8 with node 8 in OCG(1:1C ), and constructtwo edges from it, one to the next operation n9, and the other to d, the dummynode. If oi is a local operation ∈ Ox , we construct the appropriate OCG(oi ), withits ne and nx , respectively. We recursively process all of oi ’s content, and thenconstruct two edges on nx of oi to represent the flow of control (true and false):one to ni+1, the node representing the next sequential operation oi+1 in thecurrent case; and the other to dummy node d.
Terminate annotation. An operation oi with a terminate annotation will berepresented as follows: if oi is a nonlocal operation ∈ Os, we check the type ofthe control annotation, if it is terminate on failure , we ignore the control. Forexample, as depicted in Figure 2, the operation labeled n21 is annotated with aterminate on success, so we construct an edge from node 21, its correspondingnode in OCG(1:2C ), to node ni+1 or node 22. However, if oi is annotated with aterminate on success , we construct an edge to nx , the exit node of the currentcase. If oi is a nonlocal operation ∈ Ox , we represent oi with a node ni withtwo edges coming from it (true and false): one edge connected to ni+1, the noderepresenting the next sequential operation oi+1 in the current case; and theother edge to nx , the exit node of the current case. If oi is a local operation ∈Ox , we construct the appropriate OCG(oi ), with its ne and nx , respectively. Werecursively process all of oi ’s content, and then construct two edges on nx of oi torepresent the flow of control (true and false): one to ni+1, the node representingthe next sequential operation oi+1 in the current case; and the other to nx ,the exit node of the current case. For example, as depicted in Figure 2, theoperation labeled n14 is annotated with a terminate on failure, so we constructits OCG(1:1B), and construct on the nx of OCG(1:1B) or node 14x two edges, oneto node ni+1 or node 23, and the other to the exit node x of OCG(1:2Main).
Fail annotation. The evaluation of an operation oi with a fail annotation isanalogous to exception throwing in imperative languages. An operation oi witha fail annotation will be represented as follows: if oi is a nonlocal operation∈ Os, we check the type of the control and if it is fail on failure we ignorethe control. For example, as depicted in Figure 2 the operation labeled n27 isannotated with a fail on failure, so we ignore the control, and we just constructan edge from node 27, to the exit node x of OCG(2:2Main). However, if the controlis fail on success , we construct an edge to the entry node ne of the next case.If oi is a nonlocal operation ∈ Ox , oi will be represented by a node ni with
ACM Transactions on Software Engineering and Methodology, Vol. 18, No. 1, Article 1, Pub. date: September 2008.

1:12 • M. R. Karam et al.
Fig. 3. Illustrating the list and partition control.
two edges coming from it (true and false): one connected to ni+1, which is thenode representing the next sequential operation oi+1 in the current case; andthe other to nx , the exit node of the current case. If oi is a local operation ∈Ox , we construct the appropriate OCG(oi ), with its ne and nx , respectively. Werecursively process all of oi ’s content, and then construct two edges from nx of oi,to represent the flow of control (true and false) one to ni+1, the node representingthe next sequential operation oi+1 in the current case, and the other to nx , theexit node of the current case. For example, as depicted in Figure 2, the locallooped operation labeled n16 is annotated with a fail on failure. We thereforerepresent it with OCG(1:1D), and construct two edges from its exit node 16x , oneto the next operation node 21, and the other to the exit node of OCG(1:1C ) ornode 14x .
List, repeat, partition, or loop annotation. An operation oi with a list, repeat,partition, or a loop annotation, will be represented according to the type of theoperation. If oi is a nonlocal operation ∈ Os, we represent it with a node ni, andconstruct an edge that goes out of ni and back into ni, and construct anotheredge to ni+1, the next node in the case. For example, as depicted in Figure 2,the operation labeled n26 is annotated with a list control, and we thereforerepresent it with node 26 and construct one edge that goes out of node 26 andback into it, and another edge to node 27. If oi is annotated with a second controlon success, we construct the appropriate edges; otherwise we simply ignore itbecause it will not have any effect on the control flow of the program. If oi is anonlocal operation ∈ Ox , we represent it with a node ni, construct an edge thatgoes out of ni and back into ni, and construct another edge to ni+1, the nextnode in the case. We then check to see if oi is annotated with a second control.If oi is annotated with a control annotation, we construct the appropriate edgesthat represent the control. For example, as depicted in Figure 3, the operation
ACM Transactions on Software Engineering and Methodology, Vol. 18, No. 1, Article 1, Pub. date: September 2008.

Unit-Level Test Adequacy Criteria for Visual Dataflow Languages • 1:13
labeled n4 is annotated with a partition control, and therefore we represent itwith node 4 and construct an edge that goes out of node 4 and back into it. Wethen construct, as previously described for the terminate control, two edges: oneto node 5, and the other to the exit node. Another example is the list annotatedoperation n5 in Figure 3. It should be noted that although the operation labeledn7 is annotated with a partition control, it does not alter the control flow of theprogram, and therefore, as depicted in Figure 3, we represent it by constructingnode 7, and an edge that comes out of node 7 and back into it. If oi is a localoperation ∈ Ox , we construct an edge from the node representing the output-barof OCG(oi) to the node representing the input-bar. For example, in OCG(1:1C ) ofFigure 2, the OCG representing the local operation labeled n6 that is annotatedwith a loop control, we construct an edge from the output-bar of OCG(1:1C ) ornode 10 to its input-bar or node 7. If oi is control annotated, as it is the casewith the local operation labeled n16, we then construct the appropriate edges,as previously described for the fail control: one to node 21, and the other to node14x .
3.3 Control-flow Test Adequacy Criteria For Visual Dataflow Languages
In imperative languages, a test adequacy criterion fails to be applicable if itrequires coverage of nonexecutable code constructs, often referred to as deadcode. For such code, it is a common practice to render the applicable criterionand redefine it so that it is applicable to executable code only. In VDFLs, asimilar approach applies; we next define our applicable node and control testadequacy criteria for VDFLs. Before we do that, however, we need to first definea test case and a test suite for VDFLs. Formally, a test suite can be defined asfollows:
Definition 3.1 (A test suite T in VDFLs). We define a test case t for a universalmethod p to be the tuple (z, i, ov/i , cn), where: z is the test case number; i is aset of input values for t; ov/i is p’s output valid/invalid results, and cn is the setof exercised nodes in OCG(p) that is obtained as the result of executing t on p.We say that t is valid or t = (z, i, ov, cn) if the actual output for an executionof p with t is the same as the expected output for t; otherwise, t is invalid ort = (z, i, oi, cn). Having defined what a test case is, a test suite T can then bedefined as the tuple (Z, I, OV/I , CN ), where: Z = {z1, z2 , . . . , zk} is the set of testcase numbers; I = {i1, i2, . . . , ik}, OV/I (ov/i ∈ OV/I ) is p’s output valid/invalid setof results of executing p with all test cases t ∈ T; and CN is the set of coverednodes in OCG(p) that is obtained as the result of executing p with all test casest ∈ T.
Definition 3.2 (all-nodes criterion for VDFLs). Formally, given a VDFL uni-versal method p with an operation case graph OCG(p), a test t exercises a noden ∈ OCG(p) if t causes the evaluation of p, and traverses a path through OCG(p)that includes n. A test suite T is node-adequate for p and for each dynamicallyexecutable node n in OCG(p) if there is at least one t ∈ T that exercises n.
Definition 3.3 (all-edges criterion for VDFLs). Formally, given a VDFL uni-versal method p with an Operation Case Graph OCG(p), a test t exercises anedge e = (ni, n j ) ∈ OCG(p) if it causes the execution of p, and that execution
ACM Transactions on Software Engineering and Methodology, Vol. 18, No. 1, Article 1, Pub. date: September 2008.

1:14 • M. R. Karam et al.
traverses a path through OCG(p) that includes e. A test suite T is edge-adequatefor a p if, for each dynamically executable edge e in OCG(p), there is at least onet ∈ in T that exercises e.
As with imperative languages, if all edges in OCG( p) are covered, all nodesare necessarily covered. This observation leads to the conclusion that branchcoverage in VDFLs is stronger than node coverage. When a testing criterionA is stronger than another testing criterion B, we say that A subsumes B.Thus branch coverage subsumes node coverage, and a test suite T that satisfiesbranch coverage, must also satisfy node coverage.
3.4 Dataflow Analysis in OCGs
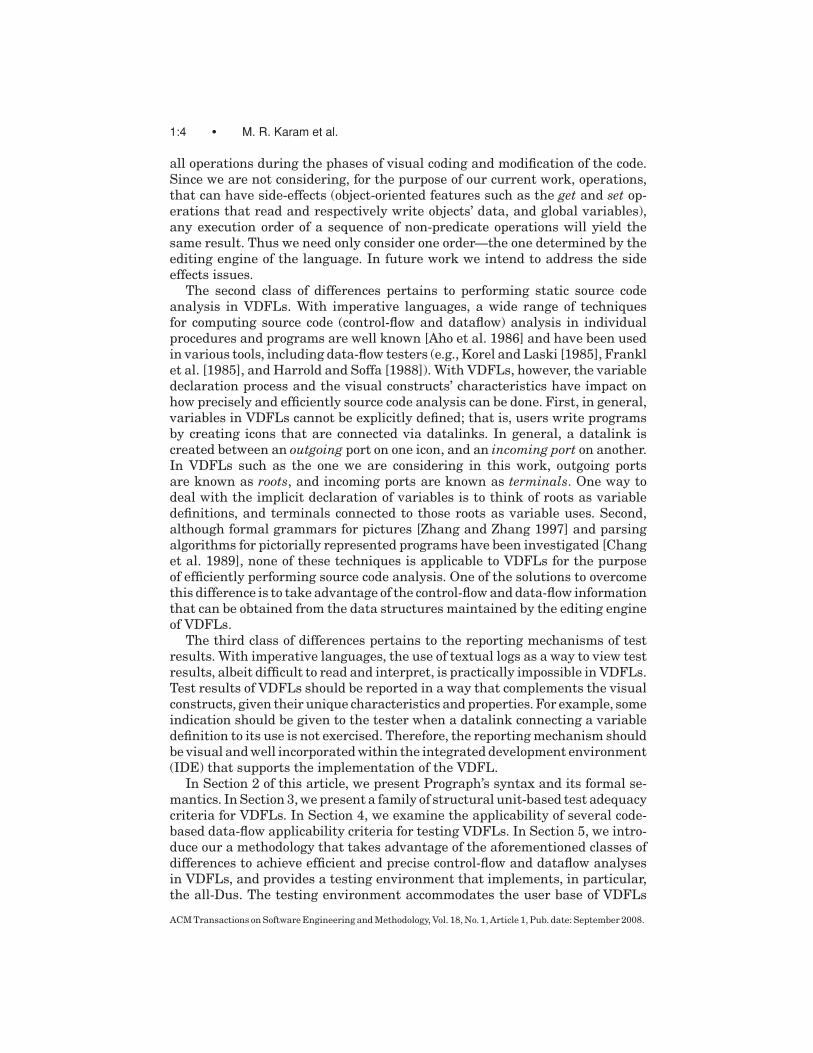
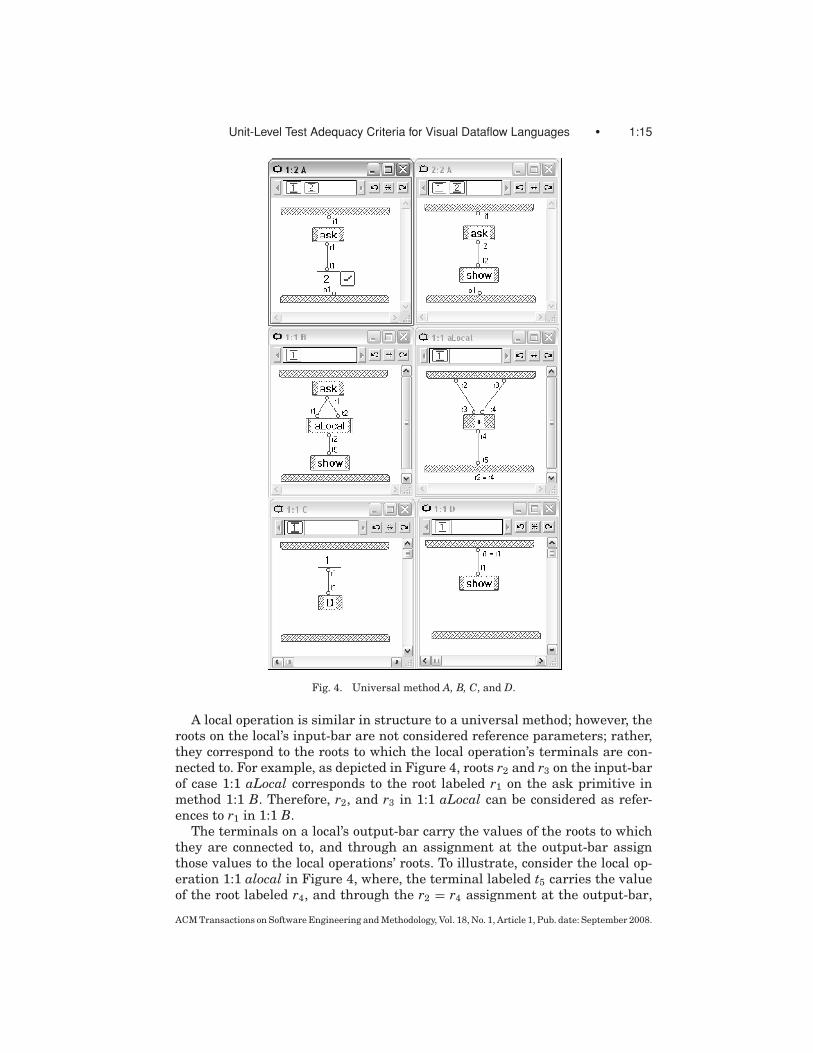
The data interaction model in VDFLs, although visual, is somewhat analogousto that of imperative languages. In imperative languages, data interaction be-tween variables is made by explicitly defining and referencing the names ofvariables in a procedure. For example, the statement s1: x = 3 explicitly de-fines x and writes to its memory location, whereas the statement s2: y = x + 3explicitly uses or references x by reading from its memory location. In VDFLs,variables cannot be explicitly defined, and their interactions are modeled asdatalinks connecting operations’ roots to other operations’ terminals. In thisinteraction model, roots serve as implicit variable definitions and terminalsconnected to those roots serve as variable uses. In general, when a root r, on anoperation oi is connected to a terminal t on an operation o j (i and j > 1), we saythat t in o j references r in oi. In other words, r is used in o j . For example, asdepicted in Figure 4, in 1:1 C root r1 is connected to terminal t1 on the universalmethod D.
The basic structure of a Prograph universal method is similar to a procedurein imperative languages. The roots on the input-bar of a universal representthe method’s inputs, and correspond to reference parameters in imperative lan-guages. The terminals on the output-bar of a universal represent the method’soutputs, and correspond to variables returned in imperative languages. Thereader should note that Prograph, unlike imperative languages, allows morethan one root on the output-bar. When a universal method has more than onecase, roots on the input-bar of each case are essentially the same variables. Asimilar situation exists for terminals on the output-bar. For example, in Figure4, the roots on the input-bars of cases 1:2 A and 2:2 A are the same. Likewise,the terminals on the output-bars of cases 1:2 A and 2:2 A are also the same.
Operations in the body of a universal that are connected to roots on the uni-versal’s input-bar get their values from the roots which are connected to theterminals at the call site. For example, in Figure 4, the reference parameterlabeled i1 in 1:1 D gets its value from the root labeled r1 in 1:1 C. As withimperative languages, reference parameters and actual parameters in visualdataflow languages are bound at call sites. Thus we say that the reference pa-rameter or i1 in 1:1 D is bound to the actual parameter or r1 in 1:1 C. Since weare only interested in unit-based data-flow analysis in VDFLs, a call site is con-sidered a primitive operation. Work is underway to deal with inter-proceduraldataflow analysis and testing for interactive units in VDFLs.
ACM Transactions on Software Engineering and Methodology, Vol. 18, No. 1, Article 1, Pub. date: September 2008.
Unit-Level Test Adequacy Criteria for Visual Dataflow Languages • 1:15
Fig. 4. Universal method A, B, C, and D.
A local operation is similar in structure to a universal method; however, theroots on the local’s input-bar are not considered reference parameters; rather,they correspond to the roots to which the local operation’s terminals are con-nected to. For example, as depicted in Figure 4, roots r2 and r3 on the input-barof case 1:1 aLocal corresponds to the root labeled r1 on the ask primitive inmethod 1:1 B. Therefore, r2, and r3 in 1:1 aLocal can be considered as refer-ences to r1 in 1:1 B.
The terminals on a local’s output-bar carry the values of the roots to whichthey are connected to, and through an assignment at the output-bar assignthose values to the local operations’ roots. To illustrate, consider the local op-eration 1:1 alocal in Figure 4, where, the terminal labeled t5 carries the valueof the root labeled r4, and through the r2 = r4 assignment at the output-bar,
ACM Transactions on Software Engineering and Methodology, Vol. 18, No. 1, Article 1, Pub. date: September 2008.

1:16 • M. R. Karam et al.
Fig. 5. Method E and its looped-Local bLoop.
assigns the value of r4 to r2 in 1:1 B. Roots corresponding to actual parameterscan be redefined only when they are used as loop roots. To illustrate, considerthe looped-local operation 1:1 bLoop in Figure 5, where the assignments r2 =r1 and r2 = r4 occur at the at the loop root in 1:1 E and output-bar of the 1:1bLoop, respectively. The first assignment r2 = r1 is necessary to carry the flowof data in case the flow of execution breaks before it reaches the output-bar of1:1 bLoop. The second assignment is necessary to increment the index of theloop or r2. In this work, we make no distinction between atomic data such as aroot representing an integer and aggregate data such as a root representing alist or root-list. Thus a datalink connecting a root-list or partition control listroot as it is the case on the left or right root on the operation that is labeled n4in Figure 3, to a list-terminal (the left or right list-terminal on the operationthat is labeled n5 in Figure 3), is regarded as definition-use association on thewhole list datum.
4. APPLICABLE DATAFLOW TEST ADEQUACY CRITERIA FOR VDFLS
Most code-based dataflow test adequacy criteria for imperative programs aredefined in terms of paths that define and use variables through the controlflow graph of a program. In this section we examine the applicability of severalcode-based test adequacy criteria to VDFLs.
ACM Transactions on Software Engineering and Methodology, Vol. 18, No. 1, Article 1, Pub. date: September 2008.

Unit-Level Test Adequacy Criteria for Visual Dataflow Languages • 1:17
4.1 Background: Traditional Dataflow Analysis
In imperative languages, dataflow analysis in a control flow graph of a function for CFG( f ) focuses on how variables are bound to values, and how these variablesare to be used. Variable occurrences in a CFG( f ) can be either definitions oruses, depending on whether those occurrences store values in, or fetch valuesfrom memory, respectively. Two types of uses are of interest to dataflow testing:computational use or c-use; and predicate use or p-use. Given a definition of avariable x in a block bi corresponding to a node ni ∈ CFG( f ), we say that a blockb j corresponding to a node n j ∈ CFG( f ) contains a computational use or c-useof x if there is a statement in b j that references the value of x. We also say thata node nk ∈ CFG( f ) contains a predicate use or p-use of x if the last statementin bk contains a predicate statement where the value of that variable is used todecide whether a predicate is true for selecting execution paths. A conditionaltransfer statement in a node n ∈ CFG( f ) has two executional successors: nl ;and nm, such that l is different from m.
Paths in the CFG( f ) that trace a definition to all or some of its uses is com-monly known as definition-use chains or du-chains.
Dataflow analysis techniques for computing du-chains for individual proce-dures [Aho et al. 1986] are well known, and dataflow test adequacy criteria havebeen well researched for imperative languages, and various criteria have beenproposed (e.g., Clarke et al. [1989], Frankl and Weyuker [1988], Laski and Ko-rel [1983], Ntafos [1984], Perry and Kaiser [1990], and Rapps and Weyuker[1985]). Dataflow test adequacy criteria can be particularly applicable toVDFLs. There are many reasons for that. The first reason involves the typesof faults (missing or erroneous datalinks) that have been observed to occur inVDFLs [Meyer and Masterson 2000]. The second reason involves the relativeease of application to VDFLs. As mentioned in Section 1, the dataflow infor-mation maintained by the editing engine of VDFLs languages allow, unliketheir imperative counterparts, efficient and more precise algorithms to be usedfor obtaining dataflow analysis, thus allowing dataflow testing to be realizedfor VDFLs with less cost than its imperative counterparts—a fact that shallbecome more clear in Section 4.3.
4.2 Dataflow Associations for VDFLs
Dataflow test adequacy concentrates, on interactions between definitions anduses of variables in the source code. These are called definition-use associa-tions or simply DUs. DUs can be appropriately modeled in VDFLs as datalinks.There are several reasons for this appropriateness. First, as with imperativelanguages, we recognize two types of variable uses in VDFLs: c-use or computa-tional use; and p-use or predicate use. A c-use occurs when a datalink connectsa root r on one operation oi to a terminal t that exists on a noncontrol annotatedoperation o j ( j > i). For example, as depicted in Figure 4, the root labeled r2 inmethod 2:2 A is c-used in the Primitive operation show. A p-use occurs whena datalink connects a root r on an operation ok to a terminal t that exists ona control annotated operation ol (k > l). For example, as depicted in Figure 4,the root labeled r1 in case 1:2 A, is p-used in the control annotated Match 2. In
ACM Transactions on Software Engineering and Methodology, Vol. 18, No. 1, Article 1, Pub. date: September 2008.

1:18 • M. R. Karam et al.
VDFLs we consider two types of DUs: definition-c-use (def-c-use) association;and definition-p-use (def-p-use) association. Given a universal method p, letO = {o1, o2, . . . , on} be the set of operations in p, and N be the set of blocks ornodes in an OCG ( p), representing p. Let R = {r1, r2, . . . ,rx} be the set of roots onan operation oi, where 1 < i < n, and let T = {t1, t2, . . . ,t y } be the set of terminalson an operation o j , where 1 < i < j < n, we have the following definitions:
Definition 4.1 (def-c-use association for VDFLs). A def-c-use association isa triple (ni, n j , (r, t)), such that, ni and n j are nodes ∈ OCG(p) representingoperations oi ∈ O and o j ∈ O respectively, r ∈ R in oi, t ∈ T in o j , there isa datalink between r and t, o j is a noncontrol annotated operation, and thereexists an assignment of values to p’s input, in which ni reaches n j . For example,the def-c-use with respect to r5 at n12 and its c-use at t7 in n13 in 2:2 E of Figure 5is (n12, n13, (r5, t7)).
Definition 4.2 (def-p-use association). A definition-p-use association is a triple(ni, (n j , nk), (r, t)), such that, ni, n j , and nk are nodes or blocks in ∈ OCG(p)representing the subset of operations {oi, o j , ok} ∈ O, r ∈ R in oi, t ∈ T in o j ,there is a datalink between r and t, o j is a control annotated operation, andthere exists an assignment of values to p’s input, in which ni reaches n j , andcauses the predicate associated with n j to be evaluated such that nk is the nextnode to be reached. For example, the def-p-use with respect to r1 at n2 and itsp-use at n3 in 1:2 E of Figure 5 is: {(n2, (n3, n4e), (r1, t1)), (n2, (n3, e(2:2E), (r1, t1))}.
There are three points to consider about these definitions.
—We make a distinction between p-uses and c-uses, and that lets us trackwhether a test suite T that exercises all du-associations in OCG(p), also exer-cises both outcomes of each control annotated operation that has a datalinkconnecting the root of some other operation to one of its terminals. This dis-tinction, as we shall see, has consequences in the visual reflection techniquewe use in our color mapping scheme to show exercised du-associations ordatalinks.
—In the absence of Persistents or global variables, the redefinition of a variableor root r does not arise, except on the output-bar of a case that has been anno-tated with loop control, and thus will not interfere with any other definitionor redefinition of r along any particular path in OCG(p). To illustrate, considerthe example that is depicted in Figure 5; r2 is defined at the entry node of theloop (n4e ), and always redefined at the output-bar (n8) of every case belongingto the loop operation. Therefore, any du-chains that are applicable to r2 inn4e are also applicable to r2 in n8. This fact is one factor that facilitates moreefficient dataflow analysis in VDFLs. Aside from extracting non-Loop-rootsrelated du-associations from the editing engine, accounting for the Loop-rootrelated ones, is a simple exercise of knowing where the definition is (node) andassociating that definition with the same uses as those of the original defini-tion, since it is not possible to have a redefinition on any path in the OCG(p).
—Analogous to the definition of du-associations for imperative programs in(Clarke et al. [1989], Frankl and Weyuker [1983], Korel and Laski [1983],Ntafos [1984], Perry and Kaiser [1990], and Rapps and Weyuker [1985]
ACM Transactions on Software Engineering and Methodology, Vol. 18, No. 1, Article 1, Pub. date: September 2008.

Unit-Level Test Adequacy Criteria for Visual Dataflow Languages • 1:19
Fig. 6. k-dr interactions.
our du-associations, which can be determined statically may not all beexecutable. There may be no assignment of input values to a program thatwill cause a definition of a root r to reach a particular use on a terminal t.Determining whether such du-associations are executable is shown to beimpossible in general and often infeasible in practice [Frankl and Weyuker1988; Weyuker 1983]; thus, dataflow test adequacy criteria typically requirethat test data exercise (cover) only executable du-associations. In this re-spect, our criterion (as we shall show) is no exception and can indeed containnonexecutable du-associations. In the rest of this article, to distinguish thesubset of the static du-associations in a VDFLs that are executable, we referto them as executable du-associations.
The second reason for the appropriateness of modeling datalinks as DUs inVDFLs can be attributed to the visual reflection of tested or exercised DUsthat are associated with a datalink during testing or after a test suite hasbeen exercised. In general, there is visually, a one-to-one mapping betweenevery datalink and its associated DUs. A more detailed description of our colormapping technique to datalinks is found in Section 5.1.
4.3 Applicable Dataflow Testing Criteria
Having introduced the definition and use associations in VDFLs, we next brieflyexamine the applicability of three major dataflow testing criteria: Ntafos [1984];Laski and Korel [1983]; and Rapps and Weyuker [1985].
Ntafos [1984] proposed a family of test adequacy criteria called the requiredk-tuples, where k is a natural number > 1. The required k-tuples require that apath set P = {p1, p2, . . . , pn} covers chains of alternating definitions and uses, ordefinition-reference interactions called k-dr interactions (k > 1). An example ofk-dr interactions is depicted in Figure 6. In n1, there is a definition of a variablex1, that is used to define variable x2 in n2 such that x1 ∈ n1 reaches n2 via pathp1. Therefore, the information assigned to variable x1 ∈ n1 is propagated to vari-able x2 ∈ n2. This information is further propagated to another variable, say, x3∈ n3 such that x2 ∈ n2 reaches n3 via path p2. This information propagation pro-cess continues until it reaches nk . Thus the set of paths {p1, p2, . . . , pk−1} formk-dr interactions. The required k-tuples requires some subpath propagatingeach k-dr interaction such that (1) if the last use is a predicate the propagationshould consider both outcome (true and false), and (2) if the first definition orthe last use is in a loop, the propagation should consider either a minimal orsome larger number of loop iterations. The required k-tuple coverage criterion,or k-dr interaction chain coverage criterion, then requires that all feasiblek-dr-interaction chains should be tested.
ACM Transactions on Software Engineering and Methodology, Vol. 18, No. 1, Article 1, Pub. date: September 2008.
1:20 • M. R. Karam et al.
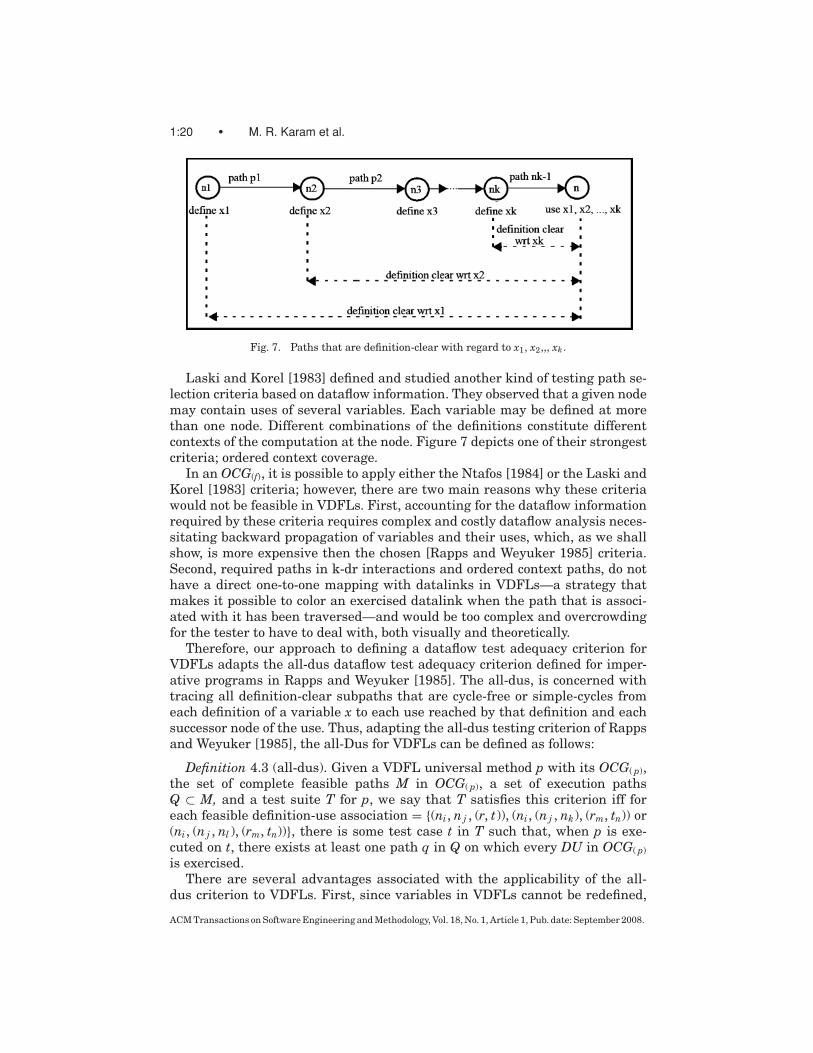
Fig. 7. Paths that are definition-clear with regard to x1, x2,,, xk .
Laski and Korel [1983] defined and studied another kind of testing path se-lection criteria based on dataflow information. They observed that a given nodemay contain uses of several variables. Each variable may be defined at morethan one node. Different combinations of the definitions constitute differentcontexts of the computation at the node. Figure 7 depicts one of their strongestcriteria; ordered context coverage.
In an OCG(f), it is possible to apply either the Ntafos [1984] or the Laski andKorel [1983] criteria; however, there are two main reasons why these criteriawould not be feasible in VDFLs. First, accounting for the dataflow informationrequired by these criteria requires complex and costly dataflow analysis neces-sitating backward propagation of variables and their uses, which, as we shallshow, is more expensive then the chosen [Rapps and Weyuker 1985] criteria.Second, required paths in k-dr interactions and ordered context paths, do nothave a direct one-to-one mapping with datalinks in VDFLs—a strategy thatmakes it possible to color an exercised datalink when the path that is associ-ated with it has been traversed—and would be too complex and overcrowdingfor the tester to have to deal with, both visually and theoretically.
Therefore, our approach to defining a dataflow test adequacy criterion forVDFLs adapts the all-dus dataflow test adequacy criterion defined for imper-ative programs in Rapps and Weyuker [1985]. The all-dus, is concerned withtracing all definition-clear subpaths that are cycle-free or simple-cycles fromeach definition of a variable x to each use reached by that definition and eachsuccessor node of the use. Thus, adapting the all-dus testing criterion of Rappsand Weyuker [1985], the all-Dus for VDFLs can be defined as follows:
Definition 4.3 (all-dus). Given a VDFL universal method p with its OCG( p),the set of complete feasible paths M in OCG( p), a set of execution pathsQ ⊂ M, and a test suite T for p, we say that T satisfies this criterion iff foreach feasible definition-use association = {(ni, nj , (r, t)), (ni, (nj , nk), (rm, tn)) or(ni, (nj , nl ), (rm, tn))}, there is some test case t in T such that, when p is exe-cuted on t, there exists at least one path q in Q on which every DU in OCG( p)is exercised.
There are several advantages associated with the applicability of the all-dus criterion to VDFLs. First, since variables in VDFLs cannot be redefined,
ACM Transactions on Software Engineering and Methodology, Vol. 18, No. 1, Article 1, Pub. date: September 2008.

Unit-Level Test Adequacy Criteria for Visual Dataflow Languages • 1:21
accounting for the all-dus can be obtained from the editing engine, and account-ing for the redefinition of loop-associated variable definitions (loop-root) can beeasily calculated since they always occur at the same place (output-bar of acase). A second advantage is the ease of visually mapping every path corre-sponding to a du-association to a datalink. The du-associations correspondingto the redefinition of a loop-root on an output-bar of a case are constructedduring a testing session as indirect datalinks. The construction process of theindirect links will be discussed in Task 2 of Section 5.1, in the context of theexample in Figure 13. The third advantage is the color mapping scheme thatcan be applied to each exercised du-associations or datalink. Our color map-ping scheme uses a continuous coloring technique to color datalinks that areexercised only during failed executions (incorrect results), passed executions(correct results), or both.
5. A METHODOLOGY FOR TESTING VDFLS
Several algorithms for collecting static control-flow and dataflow analysis tech-niques [Aho et al. 1986] have been developed for imperative languages. All thesealgorithms process the program’s textual source code to build the flow of con-trol and extract static analysis by propagating variable definitions along controlflow paths to conservatively identify executable du-associations. As previouslydiscussed in Section 1, the second class of differences between VDFLs languagesand traditional ones (the iconic nature of the VDFLs) makes it impossible touse conventional text scanners to: construct the OCG; preserve the control anddata dependencies among operations; extract all-Dus; or probe the code for dy-namic tracking purposes. To compensate for these fundamental differences, wehave augmented a Prograph-to-Java translator in a way that allowed us to ex-tract the topologically sorted operations2 , and perform LR parsing on them(before they are translated to Java) to accurately build the OCGs, as well asintegrate support for our testing methodology into Prograph’s environment ata fine granularity, providing functionalities that gave us the ability to:
—Determine the source code static control-flow and dataflow analysis.—Probe the Java code to automatically track execution traces of every test case
t in T, which provide the information necessary to determine the exerciseddu-associations that is involved in producing valid or invalid output valuesin a test case.
—Visually communicate, through the use of a coloring scheme, the coverageof datalinks, which in turn play an important role in helping users locatepotential faults in the visual code.
—launch a user-accessible test sessions facility—developed through the toolsadd-on in Prograph—to visually pronounce validations output, and commu-nicate to the user how well exercised a function is.
2The topological sorted order of operations is performed automatically by the editing engine whileediting the program. This sorting preserves both the control and data dependencies in developedprograms.
ACM Transactions on Software Engineering and Methodology, Vol. 18, No. 1, Article 1, Pub. date: September 2008.
1:22 • M. R. Karam et al.
5.1 The Details of the Methodology
The approach we chose to gain access to the set of operations that is storedand maintained by the editing engine, involved the design and implementationof a component that acts as an interface to the editing engine’s applicationprogramming interface (API). This approach has proven to be very useful in thephases of: (1) constructing the OCG and extracting dataflow analysis, using aone-pass LR parsing technique, (2) probing of the code as it is translated to Java,and (3) coloring and visual validation of datalinks after testing. We next discussdetails related to each phase. The code used in all phases in our prototype wasmainly written in Prograph, with the exception of a few libraries that werewritten in C++. We next explain each phase of our methodology in the contextof the example that is depicted in Figure 5.Task 1—constructing the OCG and computing static dataflow analysis.Using the API interface component, we were able to access an indexed set ofoperations that is stored and maintained by the editing engine of Prograph.This information made it possible to perform a one-pass over the set, build-ing the OCGs, and collecting their relevant du-associations. A portion of thedesign and algorithms of our object-oriented one-pass solution is depicted inFigure 8. Figure 8(a) depicts part of the operation class hierarchy (implementedin Prograph). Each inherited class in the hierarchy has a method buildOper()—depicted in Figure 8(c) and Figure 8(d) for primitive and input-bar operation,respectively—that determines the type of operation, its control, and then buildsthe appropriate node, edge(s), and extract relevant du-associations. The algo-rithm in Figure 8(a) is invoked on all operations in the set. To illustrate howits main function (biuldOper()) works, without getting wrapped up in infinitedetails, we next describe our one-pass technique in the construction context ofthe input-bar (n1), and the primitive operations ask and integer? of Figure 5that are labeled n2 and n3, respectively.� When the input-bar operation is fetched from the set, the buildOper() al-
gorithm in Figure 8(d) is invoked. Line 2 constructs n1 in the OCG ofFigure 5. Line 3 creates the edge between n1 (already fetched) and n2 thenext operation to be fetched. Line 4 records the edge (n1, n2), and assign afalse value to it. This false value will be true when this edge is traversed.
� When the operation ask is fetched from the set, the buildOper() algorithm inFigure 8(c) is invoked. Since the ask primitive is not annotated with any typeof control, the first case of the switch statement in the algorithm of Figure 8(c)on line 4 is executed. Line 5 determines O1 (or n3) in the OCG in Figure 5. Line6 creates the edge between n2 (already fetched) and n3 the next operation tobe fetched. Line 7 records the edge (n2, n3) in the OCG and assigns a falsevalue to it. Line 8 makes a call to extractDUs (O, null, null, null) algorithmof Figure 8. Since n2 does not have any control annotations, the first switchcase on line 2 of the extractDUs algorithm is chosen. The for loop howeverdoes not execute, since n2 does not have any terminals. Now consider theinteger? primitive. When the operation integer? is fetched from the set, thebuildOper() algorithm in Figure 8 (c) is invoked. Since the integer? primitiveis annotated with next-case control, the fourth case of the switch statement
ACM Transactions on Software Engineering and Methodology, Vol. 18, No. 1, Article 1, Pub. date: September 2008.

Unit-Level Test Adequacy Criteria for Visual Dataflow Languages • 1:23
Fig. 8. Algorithms in (b), (c), and (d) for building the OCG and extracting dataflow information.
in the algorithm of Figure 8(c) on line 28 is executed. Line 29 determines O1(or n4) in the OCG in Figure 5. Line 30 creates the edge between n3 (alreadyfetched) and n4 the next operation to be fetched. Line 31 records the edge (n3,n4) in the OCG and assigns a false value to it. Line 32 determines and returnsOT the type of n3 (Os or Ox). You may recall from The building process of the
ACM Transactions on Software Engineering and Methodology, Vol. 18, No. 1, Article 1, Pub. date: September 2008.

1:24 • M. R. Karam et al.
OCGs that Os ∈ O is the subset of operations that always succeed by default,and Ox ∈ O is the subset that does not. Line 33 determines and returnsOC the type of control (i.e. fail, finish, next-case, or terminate} (in this case,it is next-case on failure). Line 34 invokes determineNThTargetOper(O, OT ,OC) which determines O2 the nth operation to which the other edge of theevaluation of the integer? is built to (in this case its the input-bar or n15 inthe OCG). Line 38 creates the edges between n3 and n15; (shown in Figure5 as an edge from n3 to the Entry node 1:2 E, and from that to n11). Line 39records the edge (n3, n11), and finally line 40 makes a call to extractDUs (O,e1, e2, null). Since n3 has a control annotation, the first switch case on line 2of the extractDUs algorithm is chosen.
� As previously mentioned, with the presence of loops in Prograph, roots as-sociated with a loop or loop-roots are first defined at the local’s loop-root,and then implicitly redefined at the Output-Bar of each case in the looped-local. For example, as depicted in Figure 5, the loop-root r2 is first defined atthe looped operation bLooped, and subsequently redefined at the operationlabeled n8 with the implicit statement r2 = r4. Thus the du-associationsrelated to a loop-root lr are divided into two sets. One set that satisfiesthe du-associations with regard to the definition of lr on the looped-local,and a second set that satisfies the du-associations with regard to the im-plicit redefinition of lr on the output-bar of the looped-local. The first set iscollected by computing the du-associations with regard to the definition oflr that is connected or has uses, via wrap-around datalinks, to operationsinside the looped-local. For example, the definition of the loop-root r2 onnode 4e in Figure 5 has a c-use on the operation labeled n7, and a p-use onthe operation labeled n6. The second set is collected by computing the du-associations with regard to the implicit redefinition of lr (at the output-bar)that has uses on operations inside the looped-local. For example, the implicitredefinition of the loop-root r2 at n8 has a c-use on the operation labeledn7, and a p-use on the operation labeled n6. Since the implicit redefinitionof a loop-root always occurs at the output-bar of the looped cases, collectingthe du-associations associated with a loop-root before the implicit redefini-tion can be resolved statically by relying on the automatic collection of thedataflow information provided by the editing engine during the visual codingphase.
Task 2—tracking execution traces, and visual representation of results.To track the dynamic execution, we have simply instrumented the Prograph-to-Java translator in a way that allows us to probe each operation/control an-notated operation before it is translated. Once the Java textual code has beencompiled, test suites are then run on the Java code. The probes allowed ourtesting environment to record, under each test case t in T, the execution tracesand maintain the states (true or false) of each operation, predicate operation, ordu-associations, as collected by the algorithms in Figure 8 and Figure 9. To ap-ply our color mapping scheme to exercised datalinks, our testing environmentalso maintained a set of pointers for each operation, root, and terminal to allowus to effectively color these datalinks after the execution of each test case t in
ACM Transactions on Software Engineering and Methodology, Vol. 18, No. 1, Article 1, Pub. date: September 2008.

Unit-Level Test Adequacy Criteria for Visual Dataflow Languages • 1:25
Fig. 9. Collecting the dus.
a test suite T. To illustrate the use concept of these pointers, consider the askand integer? operations in 1:2 E of Figure 5 and their root r1 and terminal t1,respectively. Figure 10 depicts in Window (a) and its related windows (b, c, d,e, and f), a series of connected arrows that starts in the highlighted item of (a)and ends in the highlighted item in (e). The series of arrows shows the varioushighlighted window items’ value, when double clicked in the same order as thatof the arrow sequence. The sequence, when followed from (a) to (e), shows theprimitive operation integer? in (a); its pointer value in (b) as the first item inthe Window; the terminal pointer of t1 in (d); its connected operation ask in (e);and finally, the pointer value of operation ask in the top item of (f). The variousvalues of operations, terminals, and roots are used in the color mapping schemeduring testing.
The visual illustrations and colors we used to represent all-dus coverage re-flect two constraints that we believe to be important for the integration of visualtesting into VDFLs. We derived these constraints from literature on cognitiveaspects of programming (Gren and Petre [1996] and Yang et al. [1997]), andthe use of color in fault localization [Agrawal, et al. 1995; Jones et al. 2002].The constraints we placed on the visual representation and colors of exerciseddatalinks under test should: (1) be courteous of screen space and maintainconsistency of visual constructs; and (2) be accessible and recognizable.
To satisfy the first constraint when reflecting through color the all-dus cov-erage of datalinks and their associated du-associations, we introduced only oneadditional artifact to existing datalinks; indirect datalinks. Direct datalinks areof course created by the user at the visual coding phase. Indirect datalinks, how-ever, are constructed, after the user initiates a testing session, from loop-roots to
ACM Transactions on Software Engineering and Methodology, Vol. 18, No. 1, Article 1, Pub. date: September 2008.

1:26 • M. R. Karam et al.
Fig. 10. A fragment tof Prograph’s implementation showing the pointers used in tracking andcoloring of operations ask and integer, and root r1 and terminal t1 in the example of Figure 5.
terminals inside a looped-local operation. For example, as depicted in Figure 13,four indirect datalinks are constructed from the loop-roots on the looped-Localfactorial operation to the terminals on operations 0, -1, and ∗ to represent theirassociated du-associations. While indirect datalinks do introduce additional ar-tifacts to the visual code, their presence is necessary to communicate, throughcolor, their testedness. The indirect datalinks appear and disappear dependingon whether the looped-local window that is associated with the use (c-use orp-use) is opened. That is, if the looped-local window is closed/minimized, theindirect datalinks are made to disappear and the loop-roots that are associatedwith the indirect datalinks are made to blink to indicate that user attentionis needed. Once the user double clicks on a blinking loop-root, the looped-localwindow is opened and the indirect datalinks are made to reappear. The blink-ing, as a metaphor, has been used commercially in many of today’s operatingsystems and applications to draw a user’s attention to a specific area on thescreen. For the sake of simplicity, direct and indirect datalinks will be referredto in the rest of this article as datalinks.
To satisfy the second constraint, and assist the analyst in identifying andminimizing the fault search space, we incorporated a color mapping scheme
ACM Transactions on Software Engineering and Methodology, Vol. 18, No. 1, Article 1, Pub. date: September 2008.

Unit-Level Test Adequacy Criteria for Visual Dataflow Languages • 1:27
that uses a continuous level of varying color (hue) to indicate the ways in whichthe datalinks participate in the passed and failed test cases in a test suite. Weselected colors along the red (danger), yellow (cautious), and green (safe), toimprove our goal of drawing users’ attention to testing results and potentialfault locations. A similar approach [Jones et al. 2002; Liblit et al. 2005] thatused color to localize faulty statements in imperative languages, found thesecolor combinations to be the most natural and the best for viewing. Other stud-ies found that, due to the physiology of the human eye, red stands out whilegreen recedes [Christ 1975; Murch 1984; Shneiderman 1998]. The color map-ping scheme measurements and testing results will be described in Section 6.2.
The testing system we have implemented in Prograph’s IDE and used toproduce Figure 10 and Figure 13 in this article, provide users with the ability toinitiate an all-dus testing session, and use the static and dynamic data collectedfrom Task 1 and Task 2 to present the user with testing results in a debug-likewindow. This approach provides, in Prograph, an integrating environment oftesting and debugging. Creating these debug-like windows was made possiblethrough the API and external library that are available to third part developersof Prograph.
6. EXPERIMENTAL DESIGN AND EMPIRICAL RESULTS
To obtain meaningful information about the effectiveness of our all-dus ade-quate testing methodology in: (a) revealing a reasonable percentage of faultsin VDFLs; and (b) assisting users in visually localizing faults by reducing theirsearch space, we designed and conducted two studies. We next describe the de-sign setup, measurements analysis, and empirical results for Study 1. Study 2is discussed in Section 6.2.
6.1 Study 1
In setting up the design of our first study, we used a set F = { f1, f2, . . . , f8}of 8 programs/functions3 we called the base functions set, and produced, foreach f ∈ F a test pool4 tp(f). Next, we used tp(f) to create for each f ∈ F (i)DU T ( f ) = {T1, T2, . . . , Tk} the set of du-adequate test suites with regard to f,and (ii) RST ( f ) = {T ′
1, T ′2, . . . , T ′
k} the set of randomly selected test suites forf such that, for each j < k, Tj = {t1, t2, . . . , td } and T ′
j = {t ′1, t ′
2, . . . , t ′d } are of
equal size, and t and t ′ are test cases in T and T ′, respectively. We then createdV( f ) = {v1( f ), v2( f ), . . . , vn( f )} the set of faulty versions for each f ∈ F, where eachfaulty version vi( f ) ∈ V( f ) contained a distinct single fault. Finally, for eachfaulty version vi( f ) ∈ V( f ) ∈ F , we ran on vi( f ): (1) every du-adequate test suiteTj ∈ DU T ( f ) and recorded its fault detection ability; and (2) every randomlyselected test suite T ′
j ∈ RST ( f ) and recorded its fault detection ability. We saythat a fault is detected when: in (1) the output of vi( f ) when executed on t∈ T, produce results that differ from that of f when executed on t; in (2) theoutput of vi (f) when executed on t ′ ∈ T ′, produce results that differ from that
3We use the words program and function interchangeably in the rest of this article.4Details of creating test pools and other experimental steps will be explained later in this section.
ACM Transactions on Software Engineering and Methodology, Vol. 18, No. 1, Article 1, Pub. date: September 2008.

1:28 • M. R. Karam et al.
of f when executed on t ′. Similar studies, design approach, and fault-detectingabilities of several varieties of test suites applied to imperative and form-basedprograms, have been used in Frankl and Weiss [1993]; Hutchins et al. [1994];and Rothermel et al. [2001]. We next describe the rest of our study design setupand results.
6.1.1 Base Programs and Test Suites. Our base programs’ specificationsfor this study were chosen not to be overly complex. The logic behind this wasto allow people involved in this study to seed faults in these programs, cre-ate their test pools, and examine their code for infeasible du-associations. Thesubject programs had to however be complex enough to be considered realis-tic, and permit for the seeding of many hard-to-find faults. Each function waschosen to be compilable and executable as a stand-alone unit. Since our testingmethodology has been implemented in Prograph’s IDE, we obtained 8 Prographprograms from examples that were shipped with Prograph, and were thus con-sidered to be commercially produced. Table I lists the numbers of operations,control annotated operations, and du-associations for each base program. Thesebase programs provided the oracle to check the results of test cases executedon the faulty versions.
6.1.2 Base Programs’ Test Pools and their Test Suites. Since it is easy toshow that, for VDFLs, as well as for imperative programs, dataflow adequacycriteria (Definition 4.4) can produce test suites that are stronger then state-ment (Definition 3.2) or decision coverage criteria (Definition 3.3), we electedto acquire du-adequate test suites for our base programs to evaluate the effec-tiveness of our testing methodology. To obtain these, we began by asking onePrograph expert to generate TP (F ) = {tp( f 1), tp( f 2), . . . , tp( f 8)} the set of testpools containing for each base function fi ∈ F its own test pool tp(fi). To popu-late each tp(fi) ∈ TP(F ), the user first created an initial set of test cases basedon his understanding and knowledge of exercising fi ’s functionality and specialvalues and boundary points that are easily observable in the visual code. Thetester then examined the du-coverage achieved by the initial test cases set, andmodified/augmented the initial set of test cases, to ensure that each executabledu-association was exercised by at least 7 test cases. The resulting test poolsfor each fi ∈ F, as depicted in Table I, ranged in size from 143 to 524 test cases.
To obtain the du-adequate test suite dut(fi) = {t1, t2, . . . , tm} from each tp(fi),we first determined, for each test case t ∈ tp(fi) it’s exercised du-associations, andthen created dut(fi) by randomly selecting a test case t from tp(fi), and addingit to dut(fi) only if it incrementally added to the overall cumulative coverageachieved by test cases added to dut(fi). We repeated this process until dut(fi)was du-adequate; yielding, for each fi ∈ F a dut(fi) of size m. This process re-sulted, after discarding duplicate test suites, between 12 and 17 du-adequatetest suites for each fi ∈ F. Finally, to create a randomly selected test suite rst(fi)for each function fi ∈ F, we performed the random function t ′ = ran (tp(fi) ={t1, t2, . . . , tm}), m times, where m is the size of dut(fi), = {t ′
1, t ′2, . . . , t ′
m} to ran-domly select test cases from tp(fi) of the same sizes as that of the latter.
ACM Transactions on Software Engineering and Methodology, Vol. 18, No. 1, Article 1, Pub. date: September 2008.

Unit-Level Test Adequacy Criteria for Visual Dataflow Languages • 1:29
Table I. The Number of Operations, Edges, Du-Associations (Dus), Number of FaultyVersions, and Test Pool Size (Number of Test Cases) for Each Base Program
Faulty Test pool sizePrograms Operations Edges Dus Version for each fBubble Sort 54 32 49 11 267Factorial 27 6 32 15 179Fibonacci 49 8 50 13 192Gaussian elimination 88 32 106 19 481Matrix multiplication 64 28 56 9 318Replace subtree 31 10 29 16 298Topological sort 66 28 74 18 143Word place: finding theplace of a word in a sentence. 82 31 107 20 524
6.1.3 Faulty Versions. Ideally, the most desirable type of faults to studywould be real faults that have been recorded in the course of the developmentof the software; however, due to inadequate information available to us aboutfaults of that type, we created V(f) the set of n faulty versions for each basefunction fi ∈ F. To do that, we asked 8 different individuals with different per-ceptions of fault-related production in Prograph programs (ranging in expertisefrom intermediate to experts), and mostly without knowledge of each other’swork, to introduce in each vi (f) ∈ V(f), a single fault that reflects, as realisticallyas possible, their experience with real Prograph development, in an effort topreserve the accuracy of our study. The fault seeding process yielded, as de-picted in Table I, between 9 and 20 faulty versions for each fi ∈ F. The seededfaults were mostly changes to a single feature of the visual code, and took theform of creating erroneous or missing: datalink; control; input; or primitive.
6.1.4 Measuring the Effectiveness of Fault Detection. Let T ∈ DUT(f)and T ′ ∈ RST ( f ) be two test suites for f ∈ F, respectively, and V( f ) ={v1( f ), v2( f ), . . . , vn( f )} is the set of faulty versions in f each containing a sin-gle known fault. We say that if TS = (T or T ′) detects (e < = n) of the faults inV(f), then the effectiveness of TS can then be measured by percentage of faultyversions whose faults are detected by TS, and is given by (e/k ∗100). A faultis detected by TS if there exists at least one test case t = (z, i, ov/i , cn) ∈ TS(recall Definition 3.1) that, when applied to vi (f) and f, causes the production ofthe tuple (z, i, oi, cn) in vi (f), and the tuple (z, i, ov, cn) in f. As mentioned earlier,base programs provided the oracle to check the output (ov for valid or oi forinvalid) of a test case executed on a faulty versions.
6.1.5 Data Analysis and Overall Results. Figure 11 contains a separategraph for each of the eight base program f ∈ F. Each graph contains everyfaulty version vi (f) of f, and each vi (f) occupies a vertical bar position along thex-axis and is represented by an overlapping pair of vertical bars. The two over-lapping bars depict the percentage of the du-adequate test suites (black bars)and the percentage of the randomly generated test suites (light grey), respec-tively, that detected the fault in that faulty version. The legend and informa-tion on the X-axis and Y-axis are depicted in the lower part of Figure 11. As
ACM Transactions on Software Engineering and Methodology, Vol. 18, No. 1, Article 1, Pub. date: September 2008.

1:30 • M. R. Karam et al.
Fig. 11. Percentages of test suites that revealed faulty versions, per program, per version. Blackbars depict results for du-adequate test suites; gray bars depict results for randomly generated testsuites.
the overlapping bars of each program and its faulty versions indicate in Figure11, both DUT(f) and RST(f) missed faults in Study 1 which involved 121 faultyversions. Figure 12 indicates three vertical bars on the X-axis: the first bar rep-resents, with the Y-axis, the number of faulty versions in which the DUT(f) wasmore effective than RST(f); the second bar indicates, with the Y-axis, the num-ber of faulty versions in which the RST(f) was more effective than DUT(f ); andthe third bar indicates, with the Y-axis, the number of faulty versions in whichthe RST(f) was as effective as the DUT(f) in detecting the fault. As depictedin Figure 12, there were across the entire study 80 faulty versions in whichthe DUT(f) were more effective then RST(f), 20 faulty versions in which theRST(f) were more effective then DUT(f), and 21 faulty versions in which RST(f)were as effective as DUT(f). These results clearly indicate that du-adequate testsuites are more effective at revealing faults than their randomly generatedcounterparts. Two similar studies by Hutchins et al. [1994] for imperative lan-guages, and Rothermel et al. [2001] for form-based languages also showed thatdu-adequate test suites were more successful at detecting faults.
ACM Transactions on Software Engineering and Methodology, Vol. 18, No. 1, Article 1, Pub. date: September 2008.

Unit-Level Test Adequacy Criteria for Visual Dataflow Languages • 1:31
Fig. 12. This graph captures for each program and its versions, three vertical bars on the X-axiscontaining the numbers of: DUT(f) > RST(f); DUT(f) < RST(f); and DUT(f) = RST(f).
6.1.6 Study Conclusion. In this study, we conducted a highly accuratemeasurement of the test suites (T ∈ DUT(f) and T ′ ∈ RST(f)) effectiveness indetecting faults. There are, however, some aspects of this study that wouldlimit our ability to generalize the results pertaining to the capabilities of ourtest suites. We thus need to make it clear that (i) our base programs may not belarge enough, and may not unnecessarily capture the program space in VDFLs;(ii) our faulty versions creation method may not necessary represent the faultspace in VDFLs; and (iii) our test pools were generated based on the correctbase programs, and it may be worth investigating the effectiveness of our testsuites had we included the faulty version in the test pool extraction. Second,we cannot claim any knowledge on different groupings of faults. For example,we were not able to determine, after an exhaustive examination of the faultsin our programs, why some faults were easily detected by DUT(f), others easilydetected by RST(f), and several other faults were equally well detected by bothRST(f) and DUT(f). We did conclude that there is no clear strategy to follow tobring about such groupings.
6.2 Study 2
Thus far, we have not demonstrated that our testing methodology, combinedwith our color mapping scheme and visual feedback, can assist users in
ACM Transactions on Software Engineering and Methodology, Vol. 18, No. 1, Article 1, Pub. date: September 2008.

1:32 • M. R. Karam et al.
visually localizing faults by reducing their search space. In Study 2, we usethe DUT(f) of Study 1 (since it was proven to be more effective at detectingfaults) to measure how effective our color mapping scheme is in helping tolocate faults after a test suite set is executed on a faulty version. The proce-dure in this study was as follows: for every f ∈ F, we executed each vi (f) ∈ V(f)on each T ∈ DUT(f), and then applied, for to each (vi (f), T) pair, the continu-ous color scheme and visual feedback to the datalinks (du-associations: c-useand p-use). We then calculated for each vi (f), over all test suites T ∈ DUT(f),the continuous color of each datalink in vi (f). The datalinks’ colors were thenused in this study to investigate the space faults and the user’s ability to localizefaults. We next describe our color mapping scheme, empirical results, and studyconclusion (see Figure 13).
6.2.1 Color Mapping Scheme. The fundamental idea of our color mappingscheme revolves around continuously coloring (red to yellow to green5), ac-cording to the relevant percentage of test cases that produce valid results whenexecuting the du-associations to the test cases that exercise the du-associationsbut produce invalid results. As such, the color of a datalink can be anywhere inthe continuous spectrum of colors from red to orange to yellow to green. A sim-ilar color mapping scheme was used in Agrawal et al. [1995] and Jones et al.[2002] to study the localization of faulty program lines or statements. Othersimilar studies colored cells for validation in form-based languages [Rothermelet al. 2001].
For every direct and indirect datalink in vi (f) ∈ V(f), our color mapping scheme6
is as follows:� If the percentage of the test cases in DUT(f) that exercise a direct and indirect
datalink and produce valid results, when run on vi (f), is much higher thanthe percentage of test cases that produce incorrect results, then the hot spotappears more green; otherwise it appears more red. The intuition here is thatdatalinks that are executed primarily by test cases that produce valid resultsare not likely to be faulty, and thus are colored green to denote a possiblesafe neighborhood; otherwise, datalinks that are executed primarily by testcases that produce invalid results should be suspected as being faulty, andthus are colored red to denote a possible faulty neighborhood. The notion ofneighborhood is necessary in VDFLS since, unlike imperative languages, thecode constructs are graph-like, and distributed over many cases. Hence ournotion of localizing faults through color mapping differs from that introducedfor imperative languages [Agrawal et al. 1995; Jones et al. 2002]. In our study,the fault space is considered to be found if it is located in the neighborhood ofone or more datalinks that are colored suspiciously or in the reddish-orangishcolor range in a case containing the fault. The intuition here is that this candirect a user’s attention to a faulty neighborhood, and minimize the searchspace of faults.
5These color combinations were found to be the most natural in [Jones et al. 2002], and they alsocomplement the blue colored program constructs in Prograph.6The reader is encouraged to read the PDF file of this article or print a colored copy.
ACM Transactions on Software Engineering and Methodology, Vol. 18, No. 1, Article 1, Pub. date: September 2008.

Unit-Level Test Adequacy Criteria for Visual Dataflow Languages • 1:33
Fig. 13. The factorial main under test showing color reflections on datalinks.
� If the percentage of the test cases in DUT(f) that produce valid results, whenrun on vi (f), is near-equal to the percentage of test cases that produce incorrectresults, then the hot spot is colored yellow. The intuition here is that datalinksthat are executed by test cases that produce a mixture of valid and invalidresults are consider a cautious neighborhood, and are thus colored yellow.
� If 100% of the test cases in DUT(f), run on vi (f), do not exercise a particular hotspot, then that hot spot is not colored, and is left blue (its original color). Theintuition here is that if a datalink is never exercised, leaving it in its original
ACM Transactions on Software Engineering and Methodology, Vol. 18, No. 1, Article 1, Pub. date: September 2008.

1:34 • M. R. Karam et al.
color could give incentive to users to further investigate its neighborhood incase of failure.
6.2.2 Color Measurements of Datalinks. Recall Definition 3.1 where we de-fined a test suite T = (Z, I, OV/I , CN ). Using Z, the test case number; I, the set ofinputs values; OV/I vi (f)’s output valid/invalid set of results of executing vi (f) us-ing T; and CN , the set of covered nodes in OCG(vi (f)) that helped us to determinethe exercised datalinks in each t = (z, i, ov/i , cn) ∈ T, we colored a hot spot ordatalink representing a c-use as follows: color = low red + ((%valid()) (%valid()+ %invalid()) ∗ color range). The valid() function returns, as a percentage, theratio of the number of test cases that executed the hot spot and produced avalid result to the total number of test cases in the test suite. Likewise, theinvalid() function returns, as a percentage, the ratio of the number of test casesthat executed the hot spot and produced an invalid result to the total numberof test cases in the test suite. The value for the low red is the lower end of thecolor spectrum, and has a value of 0. The color range corresponds to the highend of the desired color spectrum; green in our case. For example, if a datalinkrepresenting a c-use is executed by 50% of test cases that produced invalid re-sults, and 100% of the test cases that produced valid results, its color will be10/15 ∗ 120 = 80, which renders this as a green-yellowish color, as depicted inthe color legend of Figure 14. The color of a hot spot or datalink representinga p-use is computed, using the above formula, as the average color of the du-associations representing the true and false exercised outcome.7 For example,if a datalink representing a p-use (true) is executed by 50% of test cases thatproduced invalid results, and 100% of the test cases that produced valid results,and its p-use (false) is executed by 100% of test cases that produced invalid re-sults, and 50% of the test cases that produced valid results, its color will be 1/3∗ 120 = 40, thus the datalink will be rendered at (80 + 40)/2 = 60. The indi-rect datalinks (representing c-use and p-use associations) that are constructedduring testing are colored analogously to their direct datalinks counterpart.
6.2.3 Data Analysis and Overall Results. To evaluate our color mappingtechnique, and report how frequently a fault is found in a reddish-oringishneighborhood, we analyzed the color mapping applied to our subject program’sfaulty versions. To simplify the presentation of faulty versions and their faultspace, we decided to represent, as depicted in Figure 14, a separate graph foreach of the eight base programs’ faulty versions. Each faulty version vi (f) off occupies a vertical bar (with color spectrum) position along the x-axis andrepresents the low and high neighborhood color of the fault space where thefault is found. The Y-axis represents the color range (120). The color legend isdepicted in the lower part of Figure 11.
Across all versions of the base programs, there were two categories of neigh-borhood fault space that were found to exceed the danger zone. The first
7We initially tried to color datalinks representing def-p-use associations [recall Definition 4.2: (ni,(n j , nk), (rx , t y )), (ni, (n j , nl ), (rx′ , t y ′ ))] by dividing them into two halves and applying the colormapping scheme to each half separately. This approach was found to be difficult to explain to userswith regard to the overall color mapping consistency scheme.
ACM Transactions on Software Engineering and Methodology, Vol. 18, No. 1, Article 1, Pub. date: September 2008.

Unit-Level Test Adequacy Criteria for Visual Dataflow Languages • 1:35
Fig. 14. This graph captures for each base program the color range of the neighborhood where thefault was found.
category had its low color spectrum in the appropriate zone but its high colorspectrum in the inappropriate zone. For example, as depicted in Figure 14, ver-sions 3 and 6 of the Factorial base program have their fault space approximatelybetween 53 and 60. In the second category, both the low and high color spectrumwere not found in their appropriate zone. For example, as depicted in Figure 14,version 11 of the Factorial base program has its fault space approximately be-tween 60 and 70. Across all faulty versions of the base programs, less than 6%was found to be in category 1, and less than 3% was found in category 2. Wewere not very concerned with category 1, since the majority of the datalinks inall instances were in the low color spectrum, and were very indicative to theuser as to where the fault space is. As for the second category, we examinedtheir versions, and discovered that the fault was in erroneous datalinks thatinitialize root values that were used in datalink executions by all or most testcases.
ACM Transactions on Software Engineering and Methodology, Vol. 18, No. 1, Article 1, Pub. date: September 2008.

1:36 • M. R. Karam et al.
Versions 11 and 15 of Factorial and Topological sort, in particular, were foundto have more than one faulty space. This is not considered a threat to our testingtechniques, since users can use the process of elimination in examining thefaulty spaces or neighborhoods.
6.2.4 Study Conclusion. One significant problem in Study 2 was the pres-ence of infeasible paths and their related du-associations in the faulty versions.There are two different causes to infeasible paths. The first cause is semanticdependencies that always hold. These dependencies in the single fault versionsof our subject programs varied in nature from a du-association on a path thatis directly related to conditional statements whose either true or false outcomecan never be realized to loops-related du-associations paths that could never betraversed. The presence of these du-associations is usually referred to as deaddu-associations. The second cause of infeasible paths is due to the limitation orlack of input data to exercise them.
Not being able to color datalinks was difficult to explain to users. It is ourintention to deal with the first cause by trying to detect, using static analysissimilar to that of Clarke [1976], and color identified infeasible datalinks green.
As for the category of the fault space spectrum, we intend to address thissituation by using a more advanced visualization technique that could perhapsmake use of the dependency analyses and slicing of the code. Computing staticoutput slices can be achieved by either using iterative dataflow equations [Ahoet al. 1986; Weiser 1984], or using a dependence graph [Horwitz et al. 1990].The second approach is particularly applicable to VDFLs, since OCG is alreadya graph representing both data and control dependencies.
7. CONCLUSIONS
The recently increasing popularity in the visual paradigm in general, andVDFLs in particular, has resulted in many languages that are being used to pro-duce much research and commercial software. Further, this popularity is likelyto grow due to the users’ anticipation of moving into the visual age of program-ming. VDFLs are prone to faults that can occur at the visual coding phase. Toprovide users of this paradigm with some of the benefits that are enjoyed bytheir imperative counterpart, we have developed a testing methodology that isappropriate for VDFLs. Our methodology and algorithms are compatible withand accommodate all visual languages with a dataflow computational engine.Our algorithms are also efficient, especially when given the fact that our staticdataflow analysis is derived from probing the same data structures used to exe-cute the visual code. This article presented an implementation overview of a toolthat we have developed that implements our testing methodology, along withthe results of two studies that evaluate the effectiveness our fault detectionand fault localization technique.
Our empirical results from Study 1 suggest that our testing methodologycan achieve fault detection results comparable to those achieved by analogoustechniques for testing imperative languages. To investigate the importance ofthese results and evaluate their potential benefits to VDFLs users, we imple-mented, for Study 2, a color mapping technique that is based on our all-DUs
ACM Transactions on Software Engineering and Methodology, Vol. 18, No. 1, Article 1, Pub. date: September 2008.

Unit-Level Test Adequacy Criteria for Visual Dataflow Languages • 1:37
Table II. Hot Spots of Interest in the Visual Code.
Hot Spot Hot spot color schemeOperation A non control annotated operation’s borders are
colored to indicate it’s correspondent OCG’s nodeparticipations in a test suite.
Predicate The borders and the check/cross marks representOperation the hot spots of interest, and they are associated
with the True and False edges in the OCG, respec-tively. If the operation o ∈ Os, then both hot spotswill be proportionately colored when the edge e∈ OCG that is associated with o is exercised. If o∈ Ox, then the borders are appropriately coloredwhen the when the true edge e ∈ OCG is exercised,and the check/cross mark is appropriately coloredwhen the when the true edge e ∈ OCG is exercised
Loop The loop arrows are appropriately colored to in-dicate the “loop back edge” participation in theOCG after a test suite.
Multiplex The 3-D like lines on the multiplexed operationare colored to indicate the “back edge” participa-tion in the OCG after a test suite.
testing methodologies. This coloring technique provided a visual mapping ofthe participation of datalinks in testing to assist users with no formal testingtheory in minimizing the fault search space. The datalinks are colored using acontinuous spectrum from red to yellow to green. Our empirical results fromStudy 2 suggest that our technique is promising for helping locate suspiciousconstructs in VDFLs and point to some directions for future work. We were en-couraged by the fact that, for our subject programs, our technique significantlyreduced the search space for the faults in a single fault version. We suspect,however, that users who have programming experience will perform differentlyusing our testing approach than users who do not have such experience. Thuswe intend to examine the relative effectiveness of our testing to both of theseuser populations. To build knowledge of testing skills among less experiencedusers, one approach we could take wiould be to allow these users to experimentwith weaker adequacy criteria, such as all-Nodes or all-Edges.
Since Study 2 focused on single faulty versions, we are currently conductingadditional studies to further evaluate our technique with multiple faults byapplying all-Nodes, all-Edges and all-Dus in one testing session, all at once,and evaluate the faults localization detection ability of our system. The colormapping scheme that we are applying to the operations and control annotatedoperations (hot spots) is depicted in Table II.
One approach that can be beneficial to the user is the ability to modify thesource code after locating a fault, and have our testing environment rerun themodified program on the test suite and dynamically update the views. One ap-proach to doing this would be to incorporate regression test selection techniquessimilar to those found in Gupta et al. [1996].
ACM Transactions on Software Engineering and Methodology, Vol. 18, No. 1, Article 1, Pub. date: September 2008.

1:38 • M. R. Karam et al.
Finally, the testing methodology presented in this article addresses onlyone of the important problems in dealing with VDFLs errors. Other testingproblems have been examined in the context of imperative languages. Theseproblems include: generating test inputs, validating test outputs, and detect-ing nonexecutable code. These problems are also important in the context ofVDFLs, and in our ongoing work we are investigating them. We are also work-ing on a way to scale up the methodology by taking into account global anddynamic variables.
ACKNOWLEDGMENTS
We thank Pictorius Incorporated for providing us with details and insight onhow to integrate our testing methodology into the IDE of Prograph. In partic-ular, many thanks to Garth Smedley.
REFERENCES
AGRAWAL, H., HORGAN, J., LONDON, S., AND WONG, W. 1995. Fault localization using execution slicesand dataflow tests. In Proceedings of the 6th IEEE International Symposium on Software Relia-bility Engineering. 143–151.
AHO, A., SETHI, R., AND ULLMAN, J. 1986. Compilers: Principles, Techniques, and Tools. Addison-Wesley, Reading, MA.
AZEM, A., BELLI, F., JACK, O., AND JEDRZEJOWICZ, P. 1993. Testing and reliability of logic programs.In Proceedings of the 4th International Symposium on Software Reliability Engineering. 318–327.
BELLI, F. AND JACK, O. 1995. A Test coverage notion for logic programming. In Proceedings ofthe 6th IEEE International Symposium on Software Reliability Engineering. IEEE ComputerSociety, Los Alamitos, CA, 133–142.
BERNINI, M. AND MOSCONI, M. 1994. Vipers: A data flow visual programming environment basedon the Tcl language. In Proceedings of the Workshop on Advanced Visual Interfaces (AVI’94). ACMPress, 243–245.
BOULUS, J., KARAM, M. R., KOTEICHE, Z., AND OLLAIC, H. 2006. XQueryViz: An XQuery visualiza-tion tool. In Proceedings the 10th International Conference on Extended Database Technologies.Munich, Germany, 1155–1158.
BURNETT, M., HOSSLI, R., PULLIAM, T., VANVOORST, B., AND YANG, X. 1994. Toward visual program-ming languages for steering in scientific visualization: A taxonomy. IEEE Comput. Sci. Eng. 1,4, 44–62.
CHANG, S. K., TAUBER, M.J., YU, B., AND YU, J. S. 1989. A visual language compiler. IEEE Trans.Softw. Eng. 15, 5, 506–525.
CHRIST, R. 1975. Review and analysis of color coding research for visual displays. Human Factors.17, 6, 542–570.
CLARKE, L. A. 1976. A system to generate test data and symbolically execute programs. IEEETrans. Softw. Eng. SE-2, 3, 215–222.
CLARKE, L. A., PODGURSKI, A., RICHARDSON, D. J., AND ZEIL, S. J. 1989. A formal evaluation of dataflow path selection criteria. IEEE Trans. Softw. Eng. 15, 11, 1318–1332.
DEL FRATE, F., GARG, P., MATHUR, A., AND PASQUINI, A. 1995. On the correlation between codecoverage and software reliability. In proceedings of the 6th International Symposium on SoftwareReliability Engineering. 124–132.
FISK, D. 2003. Full metal jacket: A pure visual dataflow language built on top of Lisp. In Pro-ceedings of the International Lisp Conference. New York, NY, 232–238.
FRANKL, P. AND WEISS, S. 1993. An experimental comparison of the effectiveness of branch testingand data flow testing. IEEE Trans. Softw. Eng. 19, 8, 774–787.
FRANKL, P., WEISS, S., WEYUKER, E. J. 1985. ASSET: A system to select and evaluate tests. InProceedings of the IEE Conference on Software Tools. 72–79.
ACM Transactions on Software Engineering and Methodology, Vol. 18, No. 1, Article 1, Pub. date: September 2008.
Unit-Level Test Adequacy Criteria for Visual Dataflow Languages • 1:39
FRANKL, P. G. AND WEYUKER, E. J. 1988. An applicable family of data flow testing criteria. IEEETrans. Softw. Eng. 14, 10, 1483–1498.
GREN, T. R. G. AND PETRE, M. 1996. Usability analysis of visual programming environments: A“cognitive dimensions” framework. J. Visual Lang. Comput. 7, 2, 131–174.
GUPTA, R., HARROLD, M. J., AND SOFFA, M. L. 1996. Program slicing-based regression testing tech-niques. J. Softw. Test. Veri. Rel. 6, 2, 83–112.
HARROLD, M. J. AND SOFFA, M. L. 1988. An incremental approach to unit testing during mainte-nance. In Proceedings of the Conference on Software Maintenance. 362–367.
HORWITZ, S., REPS, T., AND BINKLEY, D. 1990. Interprocedural slicing using dependence graphs.ACM Trans. Program. Lang. Syst. 12, 1, 26–60.
HUTCHINS, M., FOSTER, H., GORADIA, T., AND OSTRAND, T. 1994. Experiments of the effectiveness ofdataflow- and controlflow-based test adequacy criteria. In Proceedings of the 16th InternationalConference on Software Engineering. 191–200.
JONES, J. A., HARROLD, M. J., AND STASKO, J. 2002. Visualization of test information to assist faultlocalization. In Proceedings of the 24th International Conference on Software Engineering. 467–477.
KARAM, M. R. AND SMEDLEY, T. J. 2001. A testing methodology for a dataflow-based visual program-ming language. In Proceedings of the IEEE Symposia on Human Centric Computing Languagesand Environments. 280–287.
KARAM, M., BOULOS, J., OLLAIC, H., AND KOTEICHE, Z. 2006. XQueryViz: a visual dataflow XQuerytool. In Proceedings of the International Conference on Internet and Web Applications and Ser-vices. Guadeloupe, French Caribbean, IEEE Computer Society Press, 196/1–6.
KELSO J. 2002. A visual programming environment for functional languages. Ph. D. Thesis.Murdoch University, Australia.
KIMURA, T. D., CHOI, J. W., AND MACK, J. M. 1990. Show and tell: a visual programming language.In E. P. Glinert Ed. Visual Progrmming Environments. IEEE Computer Society Press, 397–404.
KUHN, W. AND FRANK, A. U. 1997. The use of functional programming in the specification andtesting process. In Proceedings of the International Conference and Workshop on InteroperatingGeographic Information Systems.
LASKI, J. W. AND KOREL, B. 1983. A data flow oriented program testing strategy. IEEE Trans.Softw. Eng. SE-9, 3, 347–354.
KOREL, B. AND LASKI, J. 1985. A tool for data flow oriented program testing. In Proceedings of the2nd Conference on Software Development Tools. Techniques and Alternatives, 34–37.
LIBLIT, B., NAIK, M., ZHENG, A. X., AIKEN, A., AND JORDAN, M. I. 2005. Scalable statistical bugisolation. In Proceedings of the ACM SIGPLAN Conference on Programming Language Designand Implementation. Chicago, IL, 15–26.
LUO, G., BOCHMANN, G., SARIKAYA, B., AND BOYER, M. 1992. Control-flow based testing of Prolog pro-grams. In Proceedings of the 3rd International Symposium on Software Reliability Engineering.104–113.
MARTENTM. 2007. http://www.andescotia.com.MEYER, M. R. AND MASTERSON, T. 2000. Towards a better visual programming language: critiquing
Prograph’s control structures. In Proceedings of the 5th annual CCSC Northeastern Conferenceon The Journal of Computing in Small Colleges. 181–193.
MURCH, G. M. 1984. Physiological principles for the effective use of color. IEEE Comput. Graph.Appl. 4, 11, 49–54.
NTAFOS, S. C. 1984. On required element testing. IEEE Trans. Softw. Eng. 10, 6, 795–803.OFFUTT, A. J., PAN, J., TEWARY, K., AND ZHANG, T. 1996. An experimental evaluation of data flow
and mutation testing. Softw. Pract. Exper. 26, 2, 165–176.OUABDESSELAM, F. AND PARISSIS, I. 1995. Testing techniques for dataflow synchronous programs.
In Proceedings of the 2nd International Workshop on Automated and Algorithmic Debugging.249–260.
PATON, B. E. 1998. Sensors, Transducers & LabView, Prentice Hall.PERRY, D. E. AND KAISER, G. E. 1990. Adequate testing and object-oriented programming. J. Object-
Oriented Prog. 2, 5, 13–19.RAPPS, S. AND WEYUKER, E. J. 1985. Selecting software test data using data flow information.
IEEE Trans. Softw. Eng. SE-11, 4, 367–375.
ACM Transactions on Software Engineering and Methodology, Vol. 18, No. 1, Article 1, Pub. date: September 2008.

1:40 • M. R. Karam et al.
ROTHERMEL, G. AND HARROLD, M. J. 1997. A safe, efficient regression test selection technique. ACMTrans. Softw. Eng. Methodol. 6, 2, 173–210.
ROTHERMEL, G., LI, L., DUPUIS, C., AND BURNETT, M. 1998. What you see is what you test: A method-ology for testing form-based visual programs. In Proceedings of the 20th International Conferenceon Software Engineering (ICSE’98). IEEE Press, Los Alamitos, CA, 198–207.
ROTHERMEL, G., BURNETT, M., LI, L., DUPUIS, C., AND SHERETOV, A. 2001. A methodology for testingspreadsheets. ACM Trans. Softw. Eng. Meth. 10, 1, 110–147.
SHAFER, D. 1994. The Power of Prograph CPX, The Reader Network.SHNEIDERMAN, B. 1998. Designing the User Interface: Strategies for Effective Human-Computer
Interaction, 3rd ed. Addison-Wesley, Reading, MA.WEISER, M. 1984. Program slicing. IEEE Trans. Softw. Eng. 10, 4, 352–357.WEYUKER, E. J. 1986. Axiomatizing software test data adequacy. IEEE Trans. Softw. Eng. 12, 12,
1128–1138.WEYUKER, E. J. 1993. More experience with dataflow testing. IEEE Trans. Softw. Eng. 19, 9,
912–919.WING, J. M., AND ZAREMSKI, A. M. 1991. A formal specification of a visual language editor. In
Proceedings of the 6th International Workshop on Software Specification and Design. 120–129.WONG, W. E., HORGAN, J. R., LONDON, S., AND MATHUR, A. P. 1995. Effect of test set minimization
on fault detection effectiveness. In Proceedings of the 17th International Conference on SoftwareEngineering. 41–50.
WOODRUFF, A. AND STONEBRAKER, M. 1995. Buffering of intermediate results in dataflow diagrams.In Proceedings of the 11th International Symposium on Visual Languages. 187–194.
YANG, S., BURNETT, M., DEKOVEN, E., AND ZLOOF, M. 1997. Representation design benchmarks: adesign-time aid for VPL navigable static representations. J. Visual Lang. Comput. 8, 5/6, 563–599.
ZHANG, D. Q. AND ZHANG, K. 1997. Reserved graph grammar: A specification tool for diagrammaticVPLs. In Proceedings of the IEEE Symposium on Visual Languages. 284–291.
Received November 2006; revised August 2007; accepted August 2007
ACM Transactions on Software Engineering and Methodology, Vol. 18, No. 1, Article 1, Pub. date: September 2008.