united lincolnshire hospitals trust integrated …
TRANSCRIPT
1 | P a g e
UNITED LINCOLNSHIRE HOSPITALS TRUST
INTEGRATED PERFORMANCE REPORT
PERIOD TO 31 OCTOBER 2017
2 | P a g e
To: FSID
From: Karen Brown, Director of Finance, Procurement & Corporate Affairs
Date: 28th November 2017
Healthcare standard
All healthcare standard domains
Title:
Integrated Performance Report for October 2017
Author/Responsible Director: Karen Brown, Director of Finance
Purpose of the report: To update the Board on the performance of the Trust for the period ended 31st October 2017, provide analysis to support decisions, action or initiate change and set out proposed plans and trajectories for performance improvement.
The report is provided to the Board for:
Summary/key points: Executive Summary for identifies highlighted performance with sections on key Successes and Challenges facing the Trust.
Recommendations: The Board is asked to note the current performance and
future performance projections. The Board is asked to approve action to be taken where performance is below the expected target. This is an evolving report and the Board are invited to make suggestions as we continue to develop it Strategic risk register New risks that affect performance or performance that creates new risks to be identified on the Risk Register.
Performance KPIs year to date As detailed in the report.
Resource implications (eg Financial, HR) None
Assurance implications The report is a central element of the Performance
Management Framework Patient and Public Involvement (PPI) implications None
Equality impact
Information exempt from disclosure
Requirement for further review?
Decision Discussion
Assurance Information √
√ √
√
3 | P a g e
Integrated Performance Report for the Period to 31st October 2017
Executive Summary for period of 31st August 2017 ......................................................................................................... 4
Integrated Performance Report ........................................................................................................................................ 5
Detailed Trust Board Performance ................................................................................................................................... 6
Referral to Treatment ....................................................................................................................................................... 7
Cancer Waiting Times – 62 Day ...................................................................................................................................... 10
A&E 4 Hour Standard ...................................................................................................................................................... 13
Diagnostics ...................................................................................................................................................................... 15
Safe Ambition 1: Reduction of Harm Associated with Mortality .................................................................................... 16
Safe Ambition 2: Reduction of Harm Associated with Harm Free Care .......................................................................... 25
Safe Ambition 3: Reduction of Harm Associated with Falls ............................................................................................ 26
Safe Ambition 4: Reduction of Harm Associated with Pressure Ulcers .......................................................................... 27
Safe Ambition 5: Reduction of Harm Medication Incidents ........................................................................................... 29
Safe Ambition 6: Reduction of Harm Associated with Infection .................................................................................... 30
Safe Ambition 6: Reduction of Harm Associated with Infection (CAUTI) ....................................................................... 31
Safe Ambition 7: Reduction of Harm Associated with Deterioration Sepsis .................................................................. 32
Workforce Headline Summary ........................................................................................................................................ 33
Finance Headline Summary ............................................................................................................................................ 49
CQUINs 2017/18 ............................................................................................................................................................. 52
Equality Analysis Statement ............................................................................................................................................ 58
Appendix 1. Glossary ....................................................................................................................................................... 59
Appendix 2. Overview of thresholds for Red, Amber, Green ratings ............................................................................. 60
Appendix 3. Detailed thresholds for Red, Amber, Green ratings ................................................................................... 61
4 | P a g e
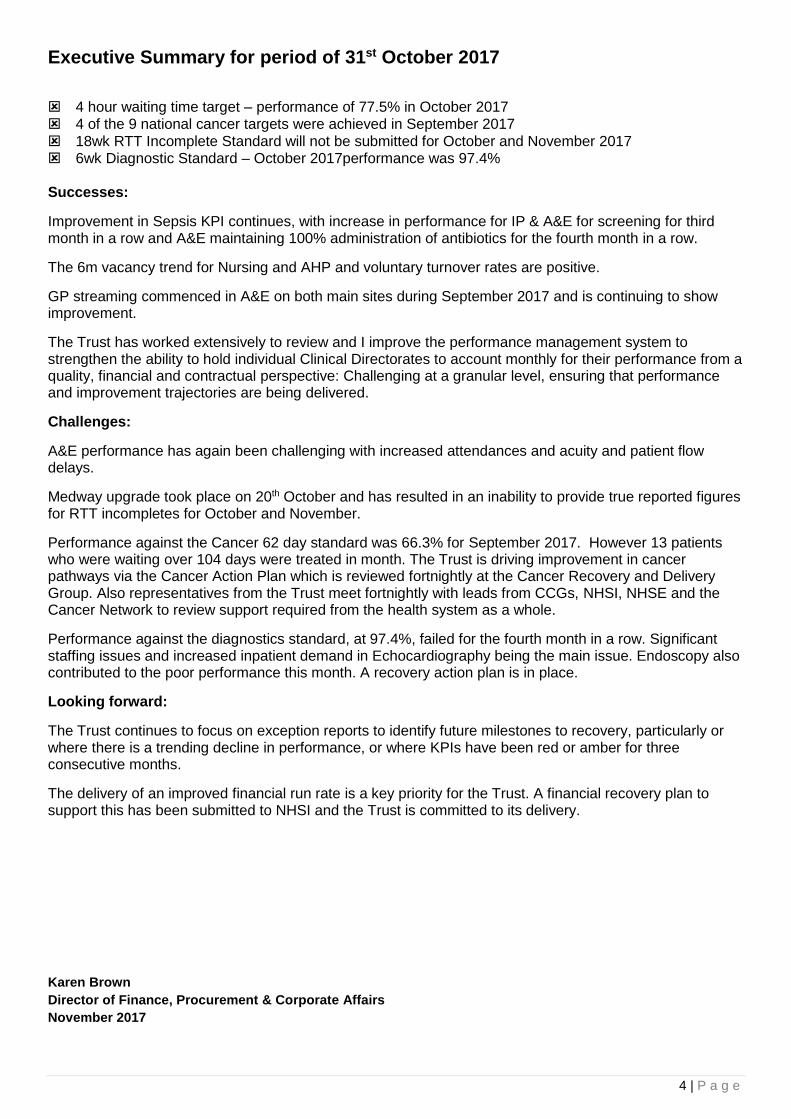
Executive Summary for period of 31st October 2017
4 hour waiting time target – performance of 77.5% in October 2017 4 of the 9 national cancer targets were achieved in September 2017
18wk RTT Incomplete Standard will not be submitted for October and November 2017 6wk Diagnostic Standard – October 2017performance was 97.4%
Successes:
Improvement in Sepsis KPI continues, with increase in performance for IP & A&E for screening for third month in a row and A&E maintaining 100% administration of antibiotics for the fourth month in a row.
The 6m vacancy trend for Nursing and AHP and voluntary turnover rates are positive.
GP streaming commenced in A&E on both main sites during September 2017 and is continuing to show improvement.
The Trust has worked extensively to review and I improve the performance management system to strengthen the ability to hold individual Clinical Directorates to account monthly for their performance from a quality, financial and contractual perspective: Challenging at a granular level, ensuring that performance and improvement trajectories are being delivered.
Challenges:
A&E performance has again been challenging with increased attendances and acuity and patient flow delays.
Medway upgrade took place on 20th October and has resulted in an inability to provide true reported figures for RTT incompletes for October and November. Performance against the Cancer 62 day standard was 66.3% for September 2017. However 13 patients who were waiting over 104 days were treated in month. The Trust is driving improvement in cancer pathways via the Cancer Action Plan which is reviewed fortnightly at the Cancer Recovery and Delivery Group. Also representatives from the Trust meet fortnightly with leads from CCGs, NHSI, NHSE and the Cancer Network to review support required from the health system as a whole.
Performance against the diagnostics standard, at 97.4%, failed for the fourth month in a row. Significant staffing issues and increased inpatient demand in Echocardiography being the main issue. Endoscopy also contributed to the poor performance this month. A recovery action plan is in place.
Looking forward:
The Trust continues to focus on exception reports to identify future milestones to recovery, particularly or where there is a trending decline in performance, or where KPIs have been red or amber for three consecutive months.
The delivery of an improved financial run rate is a key priority for the Trust. A financial recovery plan to support this has been submitted to NHSI and the Trust is committed to its delivery.
Karen Brown
Director of Finance, Procurement & Corporate Affairs
November 2017
5 | P a g e
Integrated Performance Report
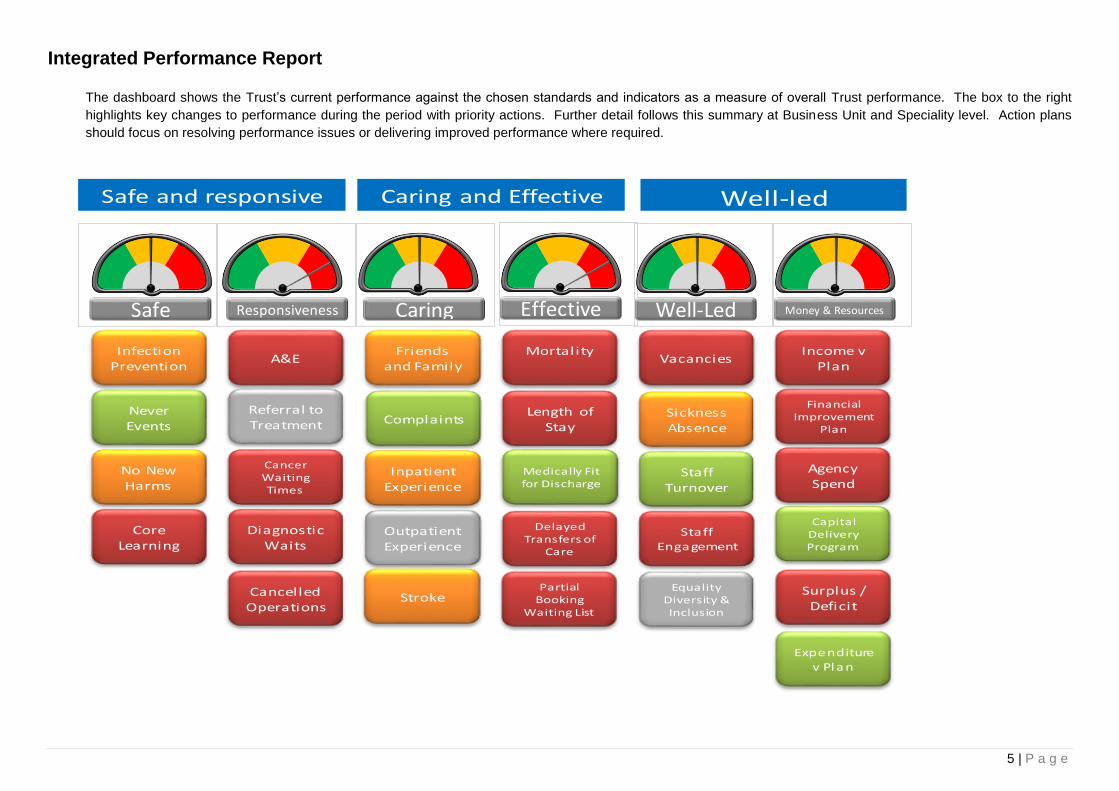
The dashboard shows the Trust’s current performance against the chosen standards and indicators as a measure of overall Trust performance. The box to the right
highlights key changes to performance during the period with priority actions. Further detail follows this summary at Business Unit and Speciality level. Action plans
should focus on resolving performance issues or delivering improved performance where required.
Infection Prevention
NeverEvents
No New Harms
Core Learning
A&E
Cancer Waiting Times
Referral to Treatment
DiagnosticWaits
CancelledOperations
Friends and Family
Inpatient Experience
Outpatient Experience
Complaints
Mortality
Medically Fit for Discharge
DelayedTransfers of
Care
Length of Stay
Vacancies
SicknessAbsence
StaffTurnover
StaffEngagement
Equality Diversity & Inclusion
Income v Plan
FinancialImprovement
Plan
Agency Spend
Safe and responsive Caring and Effective Well-led
Capital Delivery Program
Safe EffectiveResponsiveness Caring Well-Led Money & Resources
Surplus / Deficit
StrokePartial
BookingWaiting List
Expenditure
v Plan

6 | P a g e
Detailed Trust Board Performance
Reporting
FrequencySource Target YTD Current Month Last Month
Infection Control
Clostrum Difficile (post 3 days) Monthly Datix 59 42 6 8
MRSA bacteraemia (post 3 days) Monthly Datix 0 1 0 0
MSSA Monthly Datix 14 9 2 1
ECOLI Monthly Datix 56 25 2 3
Never Events Monthly Datix 0 1 0 1
No New Harms
Serious Incidents reported (unvalidated) Monthly Datix 0 173 22 26
Harm Free Care % Monthly 95% 91.74% 90.80% 91.90%
New Harm Free Care % Monthly 98% 98.05% 97.00% 97.60%
Catheter & New UTIs Monthly 1 1 2 1
Falls Monthly Datix 3.90 3.57 3.50 3.32
Medication errors Monthly Datix 0 991 120 138
Medication errors (mod, severe or death) Monthly Datix 0 145 19 19
Pressure Ulcers (PUNT) 3/4 Monthly 46 9 8
VTE Risk Assessment Monthly 95% 97.00% 96.58% 96.49%
Core Learning Monthly ESR 95% 90.40% 89.17% 90.73%
Reporting
FrequencySource Target YTD Current Month Last Month
Friends and Family Test
Inpatient (Response Rate) Monthly Envoy Messenger 26% 24.43% 24.00% 21.00%
Inpatient (Recommend) Monthly Envoy Messenger 96% 91.71% 90.00% 92.00%
Emergency Care (Response Rate) Monthly Envoy Messenger 14% 19.29% 20.00% 18.00%
Emergency Care (Recommend) Monthly Envoy Messenger 87% 81.00% 81.00% 82.00%
Maternity (Reponse Rate) Monthly Envoy Messenger 23% 9.00% 8.00% 9.00%
Maternity (Recommend) Monthly Envoy Messenger 97% 96.57% 97.00% 98.00%
Outpatients (Reponse Rate) Monthly Envoy Messenger 14% 14.14% 14.00% 13.00%
Outpatients (Recommend) Monthly Envoy Messenger 94% 92.43% 92.00% 92.00%
Complaints
No of Complaints received Monthly Datix 70 420 58 74
No of Complaints still Open Monthly Datix 0 1824 302 276
No of Complaints ongoing Monthly Datix 0 273 58 42
No of Pals Monthly Datix 0 0 0 0
No of pals converted to formal complaints Monthly Datix 0 0 0 0
Inpatient Experience
Mixed Sex Accommodation Monthly Datix 0 5 2 3
eDD Monthly EDD 95% 83.45% 83.27% 80.07%
PPCI 90 hrs Quarterly 100% 95.10% 97.33% 97.33%
PPCI 150 hr Quarterly 100% 85.00% 85.33% 85.33%
#NOF 24 Monthly 70% 57.72% 53.62% 53.33%
#NOF 48 hrs Monthly 95% 91.82% 94.20% 92.00%
Dementia Screening 1 month behind 90% 91.35% 93.82% 93.52%
Dementia risk assessment 1 month behind 90% 95.32% 93.68% 92.72%
Dementia referral for Specialist treatment 1 month behind 90% 83.46% 88.57% 84.38%
Stroke
Patients with 90% of stay in Stroke Unit 1 month behind SSNAP 80% 83.55% 91.40% 90.30%
Sallowing assessment < 4hrs 1 month behind SSNAP 80% 70.28% 73.50% 76.20%
Scanned < 1 hrs 1 month behind SSNAP 50% 58.90% 52.10% 69.20%
Scanned < 12 hrs 1 month behind SSNAP 100% 97.90% 99.00% 97.30%
Admitted to Stroke < 4 hrs 1 month behind SSNAP 90% 64.60% 64.60% 67.10%
Metric
Metric
Safe
Caring
Reporting
FrequencySource Target YTD Current Month Last Month
A&E
4hrs or less in A&E Dept Monthly Medway 90.0% 78.65% 77.54% 76.68%
12+ Trolley waits Monthly Medway 0 0 1 0
RTT
52 Week Waiters Monthly Medway 0 7 3 7
18 week incompletes Monthly Medway 92.0% 88.09%
Cancer - Other Targets
62 day classic 1 month behind Somerset 85% 69.55% 66.30% 71.20%
2 week wait suspect 1 month behind Somerset 93% 89.00% 90.10% 85.30%
2 week wait breast symptomatic 1 month behind Somerset 93% 83.13% 87.90% 91.70%
31 day first treatment 1 month behind Somerset 96% 95.92% 93.00% 97.90%
31 day subsequent drug treatments 1 month behind Somerset 98% 99.53% 100.00% 100.00%
31 day subsequent surgery treatments 1 month behind Somerset 94% 91.45% 92.70% 97.60%
31 day subsequent radiotherapy treatments 1 month behind Somerset 94% 94.98% 95.60% 100.00%
62 day screening 1 month behind Somerset 90% 86.63% 97.60% 89.70%
62 day consultant upgrade 1 month behind Somerset 85% 86.80% 100.00% 84.30%
104+ Day Waiters 1 month behind Somerset - 8 9
Diagnostic Waits
diagnostics achieved Monthly Medway 99.1% 98.62% 97.35% 98.07%
diagnostics Failed Monthly Medway 0.9% 1.38% 2.65% 1.93%
Cancelled Operations
Cancelled Operations on the day (non clinical) Monthly Medway 1.10% 3.96% 4.57% 4.06%
Not treated within 28 days. (Breach) Monthly Medway 0.00% 8.97% 4.71%
Reporting
FrequencySource Target YTD Current Month Last Month
Mortality
SHMI Quarterly 100 111.42 112.57 112.57
Hospital-level Mortality Indicator Quarterly 100 102.99 102.34 102.17
Length of Stay
Average LoS - Elective Monthly Medway / Slam 2.8 2.81 3.12 2.73
Average LoS - Non Elective Monthly Medway / Slam 3.8 4.37 4.37 4.37
Medically Fit for Discharge Monthly Bed managers 60 56.14 53.00 62.00
Delayed Transfers of Care Monthly Bed managers 3.5% 4.12% 4.66%
Partial Booking Waiting List Monthly Medway 0 5249 3956 4762
Reporting
FrequencySource Target YTD Current Month Last Month
Vacancies Monthly ESR 5.0% 10.58% 9.85% 9.73%
Sickness Absence Monthly ESR 4.5% 4.53% 4.62% 4.62%
Staff Turnover Monthly ESR 8.0% 5.60% 5.37% 5.32%
Staff Engagement
Staff Appraisals Monthly ESR 95.0% 78.86% 78.00% 80.00%
Equality Diversity and Inclusion
Reporting
FrequencySource Target YTD Current Month Last Month
Income Monthly Board Report Master 37978 246689 35234 36249
Expenditure Monthly Board Report Master -41646 -288214 -41455 -41306
Efficiency Delivery Monthly FIMS report 1526 3746 0 1523
Surplus / Deficit Monthly FPIC Finance Report -3668 -50416 -7542 -6267
Well Led
Money & Resources
Metric
Metric
Metric
Metric
Responsiveness
Effective
7 | P a g e
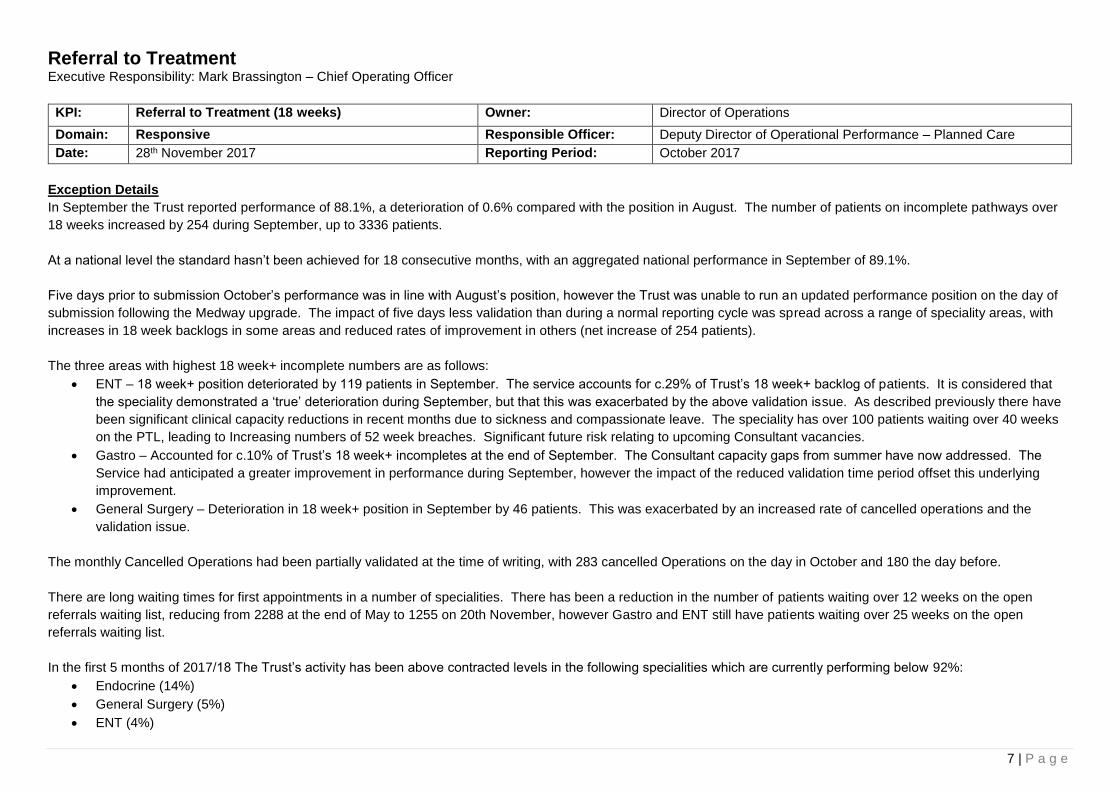
Referral to Treatment Executive Responsibility: Mark Brassington – Chief Operating Officer
KPI: Referral to Treatment (18 weeks) Owner: Director of Operations
Domain: Responsive Responsible Officer: Deputy Director of Operational Performance – Planned Care
Date: 28th November 2017 Reporting Period: October 2017
Exception Details
In September the Trust reported performance of 88.1%, a deterioration of 0.6% compared with the position in August. The number of patients on incomplete pathways over
18 weeks increased by 254 during September, up to 3336 patients.
At a national level the standard hasn’t been achieved for 18 consecutive months, with an aggregated national performance in September of 89.1%.
Five days prior to submission October’s performance was in line with August’s position, however the Trust was unable to run an updated performance position on the day of
submission following the Medway upgrade. The impact of five days less validation than during a normal reporting cycle was spread across a range of speciality areas, with
increases in 18 week backlogs in some areas and reduced rates of improvement in others (net increase of 254 patients).
The three areas with highest 18 week+ incomplete numbers are as follows:
ENT – 18 week+ position deteriorated by 119 patients in September. The service accounts for c.29% of Trust’s 18 week+ backlog of patients. It is considered that
the speciality demonstrated a ‘true’ deterioration during September, but that this was exacerbated by the above validation issue. As described previously there have
been significant clinical capacity reductions in recent months due to sickness and compassionate leave. The speciality has over 100 patients waiting over 40 weeks
on the PTL, leading to Increasing numbers of 52 week breaches. Significant future risk relating to upcoming Consultant vacancies.
Gastro – Accounted for c.10% of Trust’s 18 week+ incompletes at the end of September. The Consultant capacity gaps from summer have now addressed. The
Service had anticipated a greater improvement in performance during September, however the impact of the reduced validation time period offset this underlying
improvement.
General Surgery – Deterioration in 18 week+ position in September by 46 patients. This was exacerbated by an increased rate of cancelled operations and the
validation issue.
The monthly Cancelled Operations had been partially validated at the time of writing, with 283 cancelled Operations on the day in October and 180 the day before.
There are long waiting times for first appointments in a number of specialities. There has been a reduction in the number of patients waiting over 12 weeks on the open
referrals waiting list, reducing from 2288 at the end of May to 1255 on 20th November, however Gastro and ENT still have patients waiting over 25 weeks on the open
referrals waiting list.
In the first 5 months of 2017/18 The Trust’s activity has been above contracted levels in the following specialities which are currently performing below 92%:
Endocrine (14%)
General Surgery (5%)
ENT (4%)
8 | P a g e
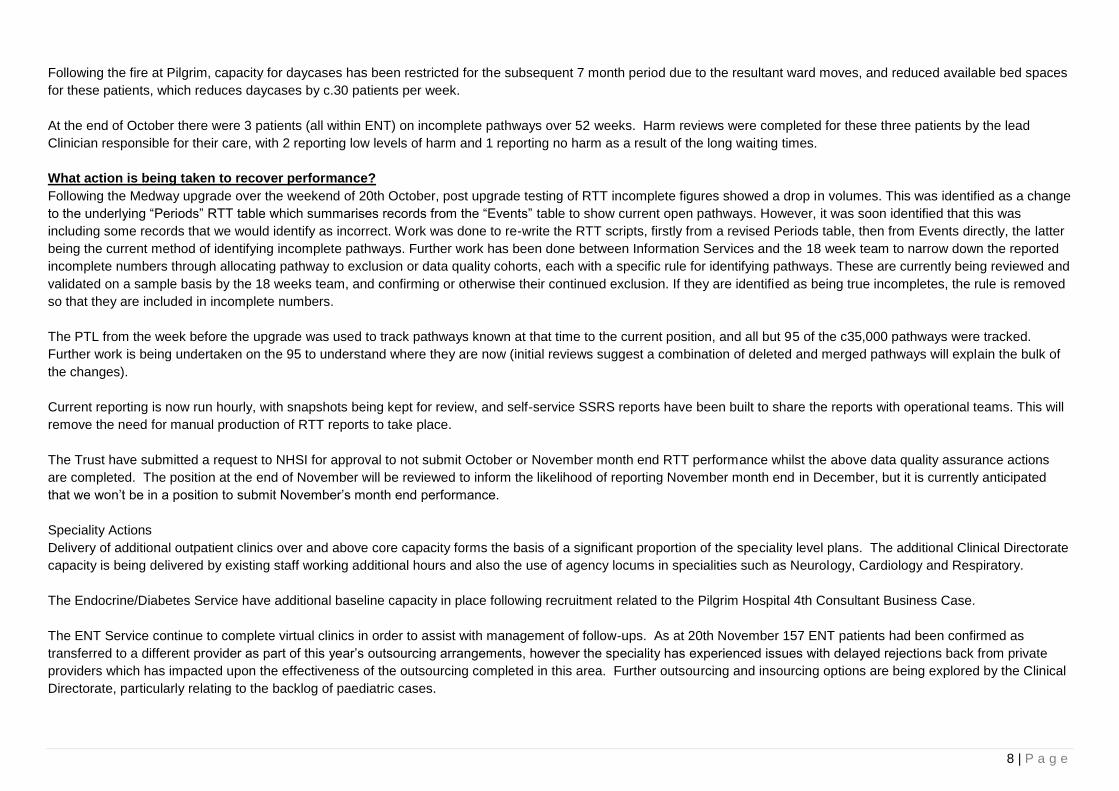
Following the fire at Pilgrim, capacity for daycases has been restricted for the subsequent 7 month period due to the resultant ward moves, and reduced available bed spaces
for these patients, which reduces daycases by c.30 patients per week.
At the end of October there were 3 patients (all within ENT) on incomplete pathways over 52 weeks. Harm reviews were completed for these three patients by the lead
Clinician responsible for their care, with 2 reporting low levels of harm and 1 reporting no harm as a result of the long waiting times.
What action is being taken to recover performance?
Following the Medway upgrade over the weekend of 20th October, post upgrade testing of RTT incomplete figures showed a drop in volumes. This was identified as a change
to the underlying “Periods” RTT table which summarises records from the “Events” table to show current open pathways. However, it was soon identified that this was
including some records that we would identify as incorrect. Work was done to re-write the RTT scripts, firstly from a revised Periods table, then from Events directly, the latter
being the current method of identifying incomplete pathways. Further work has been done between Information Services and the 18 week team to narrow down the reported
incomplete numbers through allocating pathway to exclusion or data quality cohorts, each with a specific rule for identifying pathways. These are currently being reviewed and
validated on a sample basis by the 18 weeks team, and confirming or otherwise their continued exclusion. If they are identified as being true incompletes, the rule is removed
so that they are included in incomplete numbers.
The PTL from the week before the upgrade was used to track pathways known at that time to the current position, and all but 95 of the c35,000 pathways were tracked.
Further work is being undertaken on the 95 to understand where they are now (initial reviews suggest a combination of deleted and merged pathways will explain the bulk of
the changes).
Current reporting is now run hourly, with snapshots being kept for review, and self-service SSRS reports have been built to share the reports with operational teams. This will
remove the need for manual production of RTT reports to take place.
The Trust have submitted a request to NHSI for approval to not submit October or November month end RTT performance whilst the above data quality assurance actions
are completed. The position at the end of November will be reviewed to inform the likelihood of reporting November month end in December, but it is currently anticipated
that we won’t be in a position to submit November’s month end performance.
Speciality Actions
Delivery of additional outpatient clinics over and above core capacity forms the basis of a significant proportion of the speciality level plans. The additional Clinical Directorate
capacity is being delivered by existing staff working additional hours and also the use of agency locums in specialities such as Neurology, Cardiology and Respiratory.
The Endocrine/Diabetes Service have additional baseline capacity in place following recruitment related to the Pilgrim Hospital 4th Consultant Business Case.
The ENT Service continue to complete virtual clinics in order to assist with management of follow-ups. As at 20th November 157 ENT patients had been confirmed as
transferred to a different provider as part of this year’s outsourcing arrangements, however the speciality has experienced issues with delayed rejections back from private
providers which has impacted upon the effectiveness of the outsourcing completed in this area. Further outsourcing and insourcing options are being explored by the Clinical
Directorate, particularly relating to the backlog of paediatric cases.

9 | P a g e
An advice and guidance service is scheduled to commence within ENT by the end of November, providing secondary care support to GP Practices prior to referrals being
made into the Trust. A new Audiology pathway has commenced which will support the ENT backlog reduction, by streaming appropriate patients to Audiology assessment as
part of a MDT clinic. The scope of this new pathway has increased during November, as the age range of patients included has been widened.
Outsourcing has commenced within General Surgery, Ophthalmology and Urology. As at 20th November, a total of 78 General Surgery patients, 49 Ophthalmology patients
and 12 Urology patients have been accepted by independent sector providers, with plans for further patients to be identified within these speciality areas.
The Cardiology Service has completed a process to standardise booking rules across the Service, which will provide a small increase in capacity. In the medium term once
the valve registry is established this will release further capacity within the Cardiology Service, with the Lincoln Cardiology Devices Consultant due to start in Q4.
Two new Gastro Consultants have now commenced in post at Lincoln, which takes that service to a fully established position. In order to maximise the available capacity the
Gastroenterology Service have completed a review of all of their rules in order to ensure optimal distribution of capacity.
The Clinical Directorates have been working with KPMG to increase efficiency of delivery within both Outpatient and Theatre settings. These workstreams will be monitored
by the Outpatient Improvement Committee and Theatre Optimisation Committee respectively.
Lincs East CCG implemented a divert of routine referrals away from ULHT in ENT, Community Paeds and Dermatology from 4th August for a period of 3 months. This period
of referral divert has now come to an end. Lincs West CCG, South Lincs CCG and South-West CCG did not agreed to a service pause into the specialities requested in June.
In ENT, Comm Paeds and Dermatology during the period of this referral divert, GP referrals into these specialities reduced by the following levels compared to the pre-divert
period:
ENT 15% reduction
Dermatology 6% reduction
Comm Paeds 43% reduction
Peer review of referrals has commenced in a small proportion of GP practices, and is expected to roll out to all practices in the coming months.
On 1st September the Neurology Service re-opened to headache patients, where the recently approved community headache pathway has been utilised. CCG
representatives were unable to attend the scheduled meeting in early November to discuss the re-opening of the full Neurology Service, therefore this decision has been re-
scheduled to be discussed on 27th November.
What is the recovery date?
March 2017

10 | P a g e
Cancer Waiting Times – 62 Day Executive Responsibility: Mark Brassington – Chief Operating Officer
KPI: Cancer Waiting Times (62 Day) Owner: Chief Operating Officer
Domain: Responsive Responsible Officer: Deputy Director of Operational Performance – Planned Care
Date: 28th November 2017 Reporting Period: September 2017
Exception Details
The Trust achieved a performance of 66.3% against the 62 day classic standard in September. The Trust achieved 4 out of the 9 cancer standards. 138 treatments were recorded in September against the 62-day classic standard, which is the lowest monthly treatment volume recorded since April (the previous 3 months had all been over 160 treatments each). Performance in Lower GI remained below 55% for the fifth month in a row. Skin dropped below 90% for the first time in over a year, and the volume of treatments recorded in skin was 15 less than in August, which had a negative impact on the overall Trust position. There was a significant improvement in lung performance, which performed above 75% for the first time in the over 2 years. Completion of RCAs for each breach in September found that the most frequent breach reasons were as follows (in order of occurrence):
Theatre capacity
Pathology
Patient choice and fitness
CT Capacity (including biopsies)
Outpatient capacity
Oncology capacity
Administrative delays The combined frequency of Pathology and theatre capacity issues identified has more than double compared with August As of 17th November there are 13 pts on or over 104 days without an agreed treatment plan: 8 x Urology, 1 x colorectal, 1 x Head and Neck, 1 x Upper GI, 1 x Haem, 1 x lung. 3 of the 13 have confirmed cancer diagnosis. The management for five of these patients being led by a tertiary centre. The Trust treated 13 patients at 104 days or over during September, completing RCAs for all 13 patients. Due to the length of these pathways these patients had multiple reasons for delays in their pathways, as follows:
9 cases included patient choice delays
5 cases included theatre capacity restrictions
4 case included Outpatient capacity
60.0%
70.0%
80.0%
90.0%
100.0%
Apr2014
Jul Oct Jan2015
Apr Jul Oct Jan2016
Apr Jul Oct Jan2017
Apr Jul
62 Day Cancer Performance
Actual Performance
11 | P a g e
4 case included pathology delays
4 cases included Oncology capacity delays
4 cases included complexity or procedural factors
3 cases included CT delays
3 cases included links to primary care delays
2 cases included patient fitness factors
1 case included U/S capacity restrictions
1 case included other Radiology restrictions
1 case included delays within the MDT
1 case included delays as a result of pathway processes The Trust completes a full review of any potential harm related to excessive waits for cancer treatment (104 + Day Waits): 13 Harm Reviews issued for September. As at 20th November 7 have identified no harm, 3 have identified a low level of harm, 0 have identified a moderate level of harm. The remainder are awaiting clinical feedback. Moderate and severe levels of harm will be reviewed by the Medical Director for onward management. What action is being taken to recover performance?
The Trust is driving improvement in cancer pathways via the Cancer Action Plan which is reviewed fortnightly at the Cancer Recovery and Delivery Group. Key actions being undertaken/continuing in the coming weeks include:
Revised Urology pathways – Clinical agreement has been reached relating to a revised pathway which will see 2ww clinics created which feed directly into MRI and TRUS biopsy slots. This new pathway went live on 1st October.
Continuation of Endoscopy backlog clearance – Medinet continue to provide addition sessions at weekends. A procurement exercise for a longer term outsourcing arrangement has closed. An initial evaluation exercise has been completed, with the full process to be completed before the end of November and expectation of a start date before the end of the calendar year. Alongside this a business case for increased internal Endoscopy capacity has been completed. This was reviewed by IPB on 23rd August, where further clarifications were requested. This is scheduled to return to IPB in November.
Continuation of extended CT capacity – External funding has enabled the Radiology Service to plan to continue the extended CT capacity until December 2017. The Trust is waiting for formal confirmation that additional central funding has been secured in order to continue this until the end of the financial year.
Roll out of lower GI STT at Pilgrim – The Clinical Directorate and CCG are in agreement to ensure that this service will commence by the end of December.
Oncology administrative optimisation – Chemo-scheduler business case has been approved. These posts have been appointed to and the individuals are now in post. This will improve co-ordination of chemotherapy capacity.
Histology turnaround times – Performance meetings commenced with Path Links. Path Links have secured additional locum Consultant capacity and are pursuing options around outsourcing of reporting. Raising awareness internally around utilization of 2ww priority stickers.
Improve Radiology reporting times – Radiology Dept are piloting earlier utilization of outsourcing capacity within cancer pathways and have successfully recruited to longstanding vacancies. Performance figures from October show improvements in overall turnaround times, but this will continue to be reviewed with further options considered to improve performance as required.
Straight to test for CT on lung pathway – Pathway agreed within the Trust. Details have been distributed to CCGs for communication with GP Practices, with a view to the service commencing in mid-December. Once the straight to test aspect of the pathway is established the lung team have plans to further develop the early stages of the pathway in line with national recommendations for service developments.
Communication with patients – The CCGs have provided a project manager to lead the development a standardized approach to communicating with patients on suspect cancer pathways from an administrative perspective, in order to ensure that patients are appropriately informed relating to the nature of the referral and the importance of timely access to appointments.
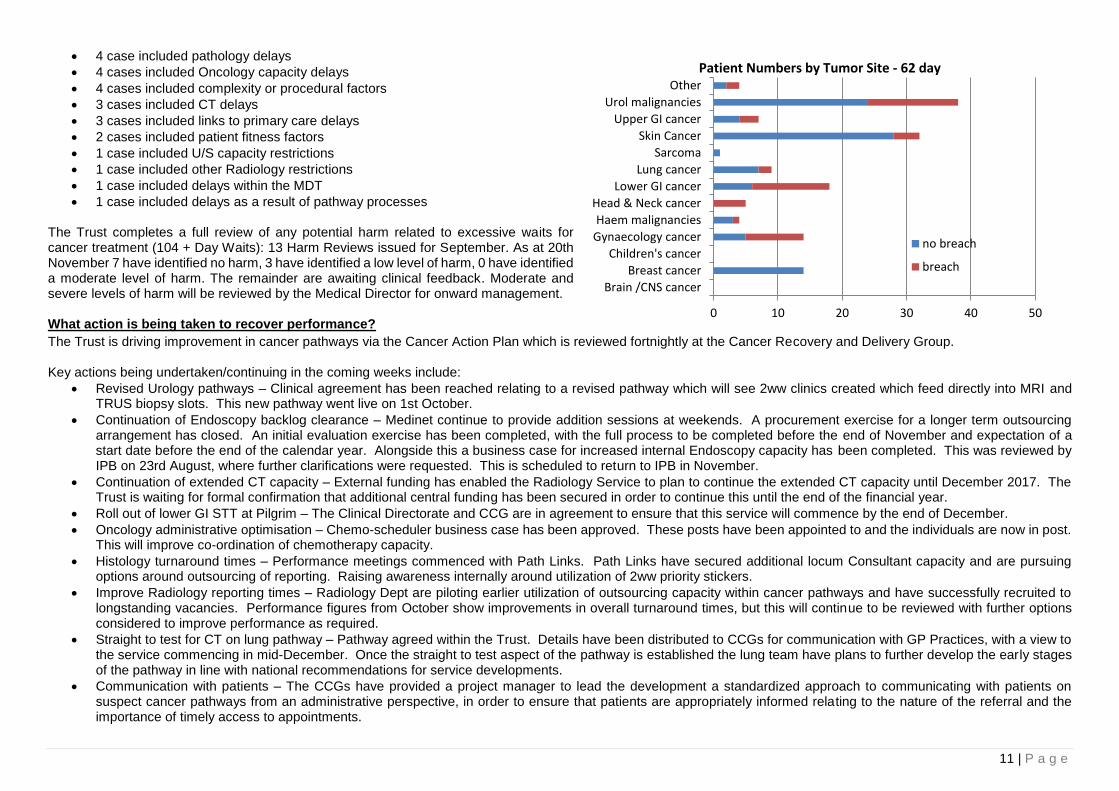
0 10 20 30 40 50
Brain /CNS cancer
Breast cancer
Children's cancer
Gynaecology cancer
Haem malignancies
Head & Neck cancer
Lower GI cancer
Lung cancer
Sarcoma
Skin Cancer
Upper GI cancer
Urol malignancies
Other
Patient Numbers by Tumor Site - 62 day
no breach
breach
12 | P a g e
Daily operational meetings have been established in order to unblock delays within individual cancer pathways, involving representation from all key areas within the Trust’s cancer pathways.
Chief Operating Officer has commenced weekly PTL review meetings with Clinical Directorates. Representatives from the Trust meet fortnightly with leads from CCGs, NHSI, NHSE and the cancer network to review support required from the health system as a whole. Key actions include:
SET funding of £250k for cancer pathway improvement has been agreed, schemes include:
Temporary additional cancer tracking capacity to increase tracking frequency – commenced during September
Project Lead post facilitating improvements within tracking processes, review of pathways, MDT support and tertiary communication – appointment made, with start date of beginning of December agreed
Urology/Lower GI Improvement/Operations Manager for Cancer – interviews scheduled for mid-November
Radiology Cancer Co-ordinator – Interviews completed, but no appointment made. Clinical Directorate reviewing alternative options for implementation.
External support to review whole pathway capacity/demand – commenced on site 30/8/17, producing revised PTL template and Radiology daily report tool. Tumour site capacity/demand tool has been developed in draft, with a plan to sign off this work by the end of November.
13 | P a g e
A&E 4 Hour Standard Executive Responsibility: Mark Brassington – Chief Operating Officer
KPI: 4 Hour Wait (A&E) Owner: Chief Operating Officer
Domain: Responsive Responsible Officer: Director of Operations / Deputy Director of Urgent Care
Date: 28th November 2017 Reporting Period: October 2017
Exception Details
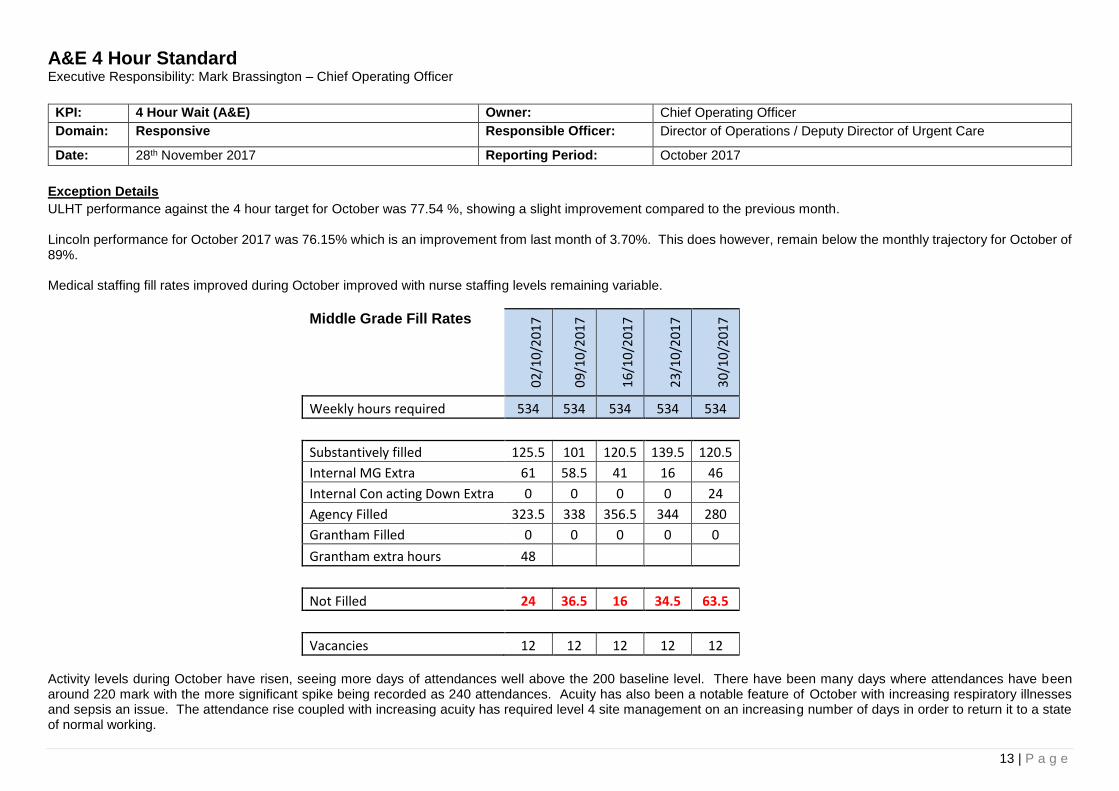
ULHT performance against the 4 hour target for October was 77.54 %, showing a slight improvement compared to the previous month. Lincoln performance for October 2017 was 76.15% which is an improvement from last month of 3.70%. This does however, remain below the monthly trajectory for October of 89%. Medical staffing fill rates improved during October improved with nurse staffing levels remaining variable.
Middle Grade Fill Rates 0
2/1
0/2
01
7
09
/10
/20
17
16
/10
/20
17
23
/10
/20
17
30
/10
/20
17
Weekly hours required 534 534 534 534 534
Substantively filled 125.5 101 120.5 139.5 120.5
Internal MG Extra 61 58.5 41 16 46
Internal Con acting Down Extra 0 0 0 0 24
Agency Filled 323.5 338 356.5 344 280
Grantham Filled 0 0 0 0 0
Grantham extra hours 48
Not Filled 24 36.5 16 34.5 63.5
Vacancies 12 12 12 12 12 Activity levels during October have risen, seeing more days of attendances well above the 200 baseline level. There have been many days where attendances have been around 220 mark with the more significant spike being recorded as 240 attendances. Acuity has also been a notable feature of October with increasing respiratory illnesses and sepsis an issue. The attendance rise coupled with increasing acuity has required level 4 site management on an increasing number of days in order to return it to a state of normal working.
14 | P a g e
Discharge levels fell off mid-month but a deep dive approach to red to green and a renewed and more forward looking focus on patient pathways has helped to bring discharge levels back on track. Detailed pre and post weekend planning is in place. GP Streaming has been embedding throughout October with staff becoming more familiar and comfortable with the new process. Whilst streaming numbers were initially low, by the end of the month (5 weeks post commencement of streaming) they had increased to around 15% against the target of 20%. A major cause of delays during October has been the poor performance of our non-emergency transport provider TASL who have struggled to step up to the required activity levels and have on occasions declared major incident status. This has necessitated the short-term engagement of a private transport provider to maintain flow on site. What action is being taken to recover performance?
At Lincoln the newly qualified nurses completed their supernumery period in October. There is an on-going focus on recruitment to medical staff in the ED. The Emergency
Department medical rota has become more stable and international recruitment is progressing well. 5 middle grade doctors have been offered clinical attachments in the UK
to enable sign off of an English assessment and registration with the GMC.
The building scheme for the GP Streaming Service remains on track and is due to complete by 18th December 2017.
A key site focus is on achieving 10 empty admitting area beds by 10am in order to gain early flow on site in order to decompress the Emergency Department. This coupled
with a drive to deliver agreed levels of ward discharges on a daily basis has been supporting an improvement on performance. Further work is required in order to improve
weekend discharges and this will be one of 3 key areas of focus during November.
15 | P a g e
Diagnostics Executive Responsibility: Mark Brassington – Chief Operating Officer
KPI: Diagnostics Owner: Chief Operating Officer
Domain: Responsive Responsible Officer: Director of Operations / Deputy Director of Urgent Care
Date: 28th October 2017 Reporting Period: October 2017
Exception Details
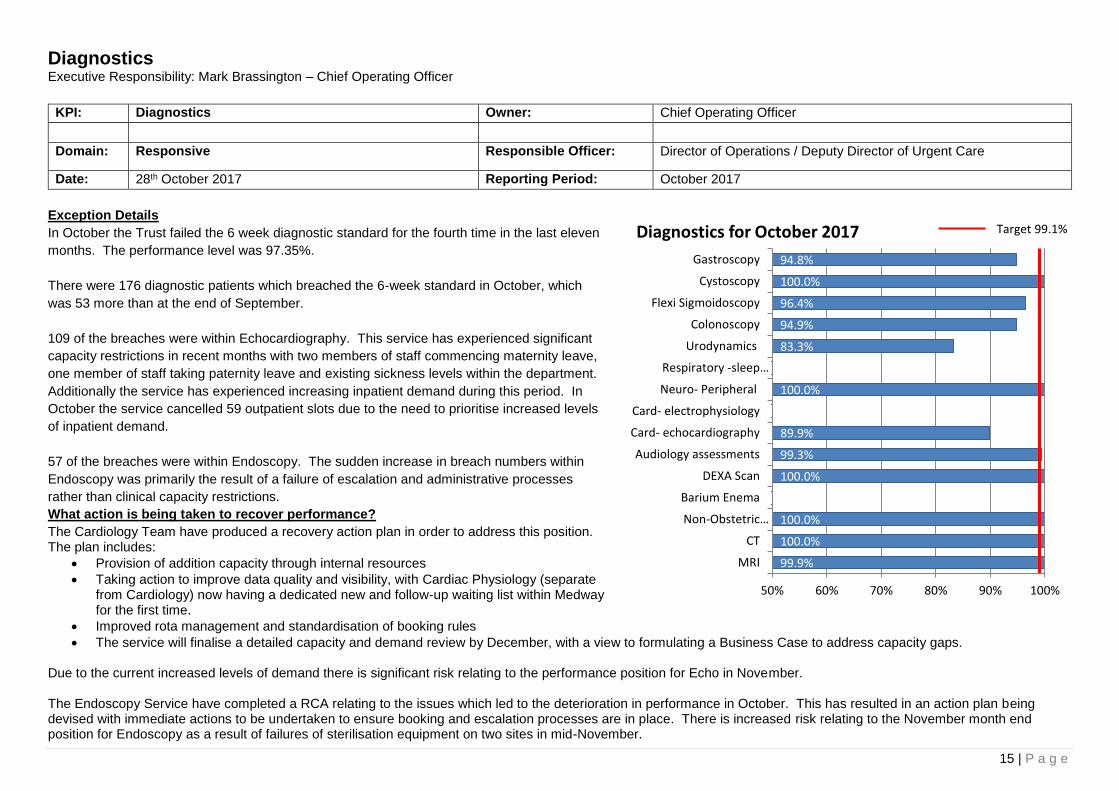
In October the Trust failed the 6 week diagnostic standard for the fourth time in the last eleven
months. The performance level was 97.35%.
There were 176 diagnostic patients which breached the 6-week standard in October, which
was 53 more than at the end of September.
109 of the breaches were within Echocardiography. This service has experienced significant
capacity restrictions in recent months with two members of staff commencing maternity leave,
one member of staff taking paternity leave and existing sickness levels within the department.
Additionally the service has experienced increasing inpatient demand during this period. In
October the service cancelled 59 outpatient slots due to the need to prioritise increased levels
of inpatient demand.
57 of the breaches were within Endoscopy. The sudden increase in breach numbers within
Endoscopy was primarily the result of a failure of escalation and administrative processes
rather than clinical capacity restrictions.
What action is being taken to recover performance?
The Cardiology Team have produced a recovery action plan in order to address this position. The plan includes:
Provision of addition capacity through internal resources
Taking action to improve data quality and visibility, with Cardiac Physiology (separate from Cardiology) now having a dedicated new and follow-up waiting list within Medway for the first time.
Improved rota management and standardisation of booking rules
The service will finalise a detailed capacity and demand review by December, with a view to formulating a Business Case to address capacity gaps. Due to the current increased levels of demand there is significant risk relating to the performance position for Echo in November. The Endoscopy Service have completed a RCA relating to the issues which led to the deterioration in performance in October. This has resulted in an action plan being devised with immediate actions to be undertaken to ensure booking and escalation processes are in place. There is increased risk relating to the November month end position for Endoscopy as a result of failures of sterilisation equipment on two sites in mid-November.
99.9%
100.0%
100.0%
100.0%
99.3%
89.9%
100.0%
83.3%
94.9%
96.4%
100.0%
94.8%
50% 60% 70% 80% 90% 100%
MRI
CT
Non-Obstetric…
Barium Enema
DEXA Scan
Audiology assessments
Card- echocardiography
Card- electrophysiology
Neuro- Peripheral
Respiratory -sleep…
Urodynamics
Colonoscopy
Flexi Sigmoidoscopy
Cystoscopy
Gastroscopy
Diagnostics for October 2017 Target 99.1%

16 | P a g e
Safe Ambition 1: Reduction of Harm Associated with Mortality Executive Responsibility: Neil Hepburn – Medical Director
Trust/Site ULHT HSMR Aug 16-Jul 17
12 month
ULHT HSMR Apr 17-Jul 17
YTD
ULHT HSMR Jul-17
ULHT SHMI Apr 16-Mar 17
Trust Crude Mortality YTD Internal source
Nov 16-Oct 17
Trust 102.34 93.18 90.12 112.57 1.77% LCH 116.98 1105.27 94.91 117.39 1.79% PHB 93.28 87.64 96.60 111.14 1.97% GDH 67.68 50.71 17.48 93.97 0.93%
ULHT HSMR Rolling Year (36 Months) Lincoln HSMR Rolling Year (36 Months)
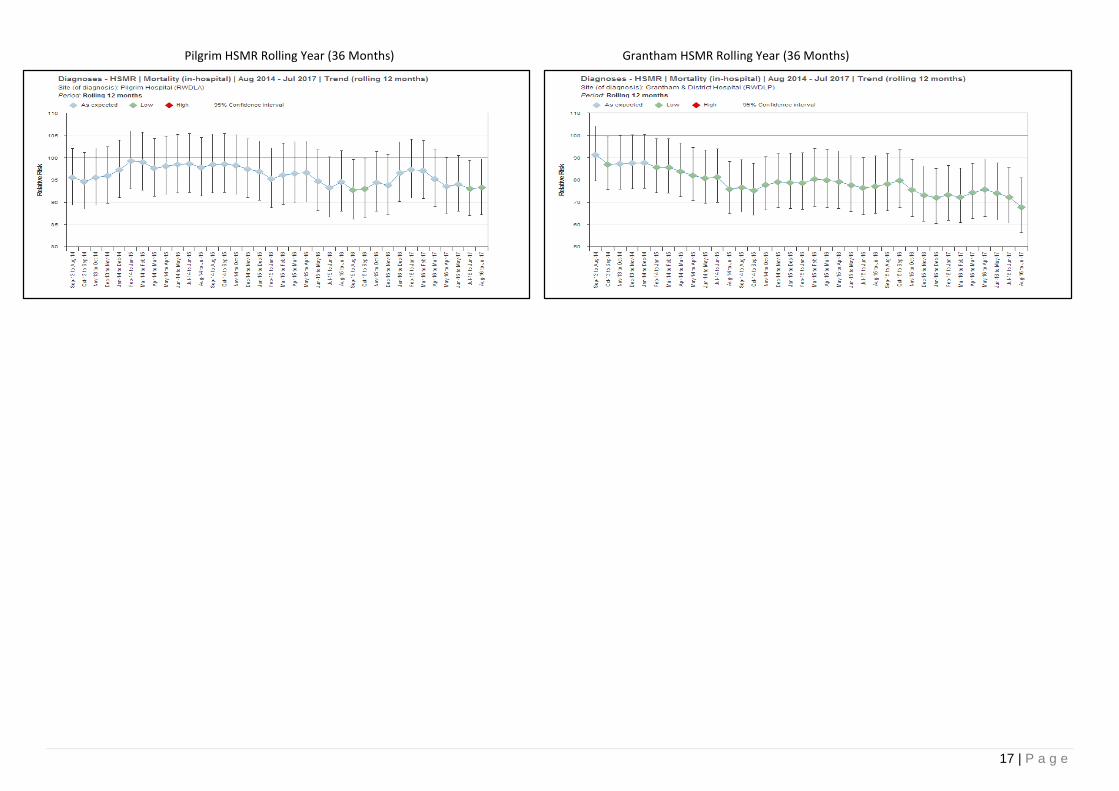
17 | P a g e
Pilgrim HSMR Rolling Year (36 Months) Grantham HSMR Rolling Year (36 Months)

18 | P a g e
Alerts ULHT
The Trust primary diagnoses groups that are outside of the Dr Foster confidence intervals are:
Other Perinatal Conditions: Second month of alerting at Trust level, driven by the pilgrim site with 16 mortalities and 8.89 over the predicted Dr Foster data. A meeting is to be held with W&C governance, QG governance, coding and Dr Foster to agree action plan
Respiratory Failure insufficiency arrest (adult): Second month alerting at Trust level. Driven by the Lincoln site; 42 mortalities with 13.88 over the predicted Dr Foster data. An in-depth review is currently underway due to the patient list sourced and notes requested.
Aortic peripheral and visceral artery aneurysms: First month of alerting at Trust level. Not driven by any Site; 25 mortalities with 9.57 over the predicted Dr Foster data. SITE Lincoln County Hospital: primary diagnoses groups that are outside of the Dr Foster confidence intervals are:
Actions underway
Biliary Tract Disease: This is cumulative throughout the time period with 23 mortalities and 12.39 over the predicted Dr Foster data. This has now been alerting for 7 months and is alerting at Trust level. An in-depth review is currently underway Quality Governance have produced a report for November PSC – action plan to be agreed.
Intestinal Obstruction without hernia: This has been alerting for 8 months; to date there are 24 mortalities and 11.37 over the predicted within this diagnosis group. An in-depth review has been completed with issues pertaining to the primary diagnosis coding and Palliative care coding. An action plan was agreed and Associate Medical Director and Quality Governance have met with the palliative care team and work is underway to check coded data against Palliative care team log.
Septicemia (except in labour): This is a cumulative alert and not alerting in a particular month; year to date there are 113 mortalities and 21.29 over the predicted Dr Foster data. This is the fourth month alerting. There is a sepsis committee who meets monthly and has a detailed action plan to improve compliance of sepsis. Sepsis coding rule changed in April 2017. QG has completed an overview which was presented at July PSC. Sepsis nurses completed a coding review and outputs were comorbidities not being documented.
Acute Cerebrovascular disease: This is the fourth month of alerting with 114 observed and 27.65 mortalities over the predicted Dr Foster data. Dr Foster Intelligence specialist and Quality Governance are meeting with Lincoln site stroke team to understand the data. The only notable difference between the data on the sites is the coding of patients been seen by the palliative care team. An in-depth review is underway patient list sourced and notes requested.
Fluid and electrolyte disorders: This is the fourth month of alerting with 17 observed and 9.28 mortalities over the predicted Dr Foster data. An in-depth review is underway patient list sourced and notes requested.
New
Senility and organic mental disorders: The first month of alerting with 19 mortalities with 7.88 over the Dr Foster predicted data.
Other gastrointestinal disorders: The first month of alerting with 16 mortalities and 7.93 over the Dr Foster predicted data.
Pilgrim hospital: primary diagnoses groups that are outside of the Dr Foster confidence intervals are:
Abdominal Pain: The is the third month of alerting with 5 observed and 3.62 mortalities over the predicted Dr Foster data.
COPD and bronchiectasis: This is the second month on alerting with 48 mortalities and 15.10 over the predicted Dr Foster data.
Peritonitis and intestinal abscess: This is the second month of alerting with 6 mortalities and 3.83 over the predicted Dr Foster data.
Grantham Hospital
No notifications
MetricNational Acute
(Non specialist)ULHT
HSMR 97.08 102.34
Elective Crude Rate % 0.20% 0.10%
Non elective Crude Rate % 6.40% 7.40%
% observed mortalities in hospital 3.50% 3.96%
% observed palliative coding 42.72% 31.67%
Avg comorb 0 score per observed % 1.20% 1.40%
Weekend HSMR 101.60 103.30
Weekday HSMR 95.50 101.90
Crude rate % 3.60% 4.00%
Spells Readmissions 28 days % 11.46% 10.74%
Residual coding % of spells 5.48% 3.46%
LOS short stay 0-2 days Observed % 1.02% 1.30%
LOS 3+ Observed % 7.69% 8.15%
Aug 16-Jul 17
19 | P a g e
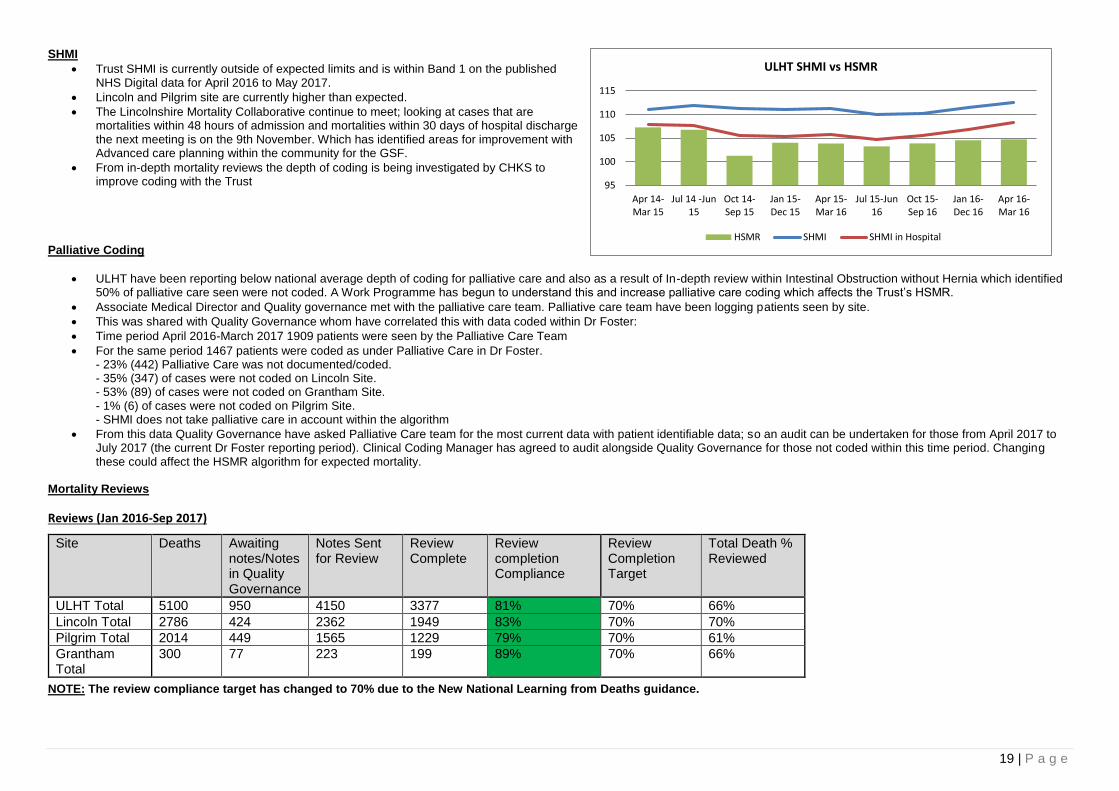
SHMI
Trust SHMI is currently outside of expected limits and is within Band 1 on the published NHS Digital data for April 2016 to May 2017.
Lincoln and Pilgrim site are currently higher than expected.
The Lincolnshire Mortality Collaborative continue to meet; looking at cases that are mortalities within 48 hours of admission and mortalities within 30 days of hospital discharge the next meeting is on the 9th November. Which has identified areas for improvement with Advanced care planning within the community for the GSF.
From in-depth mortality reviews the depth of coding is being investigated by CHKS to improve coding with the Trust
Palliative Coding
ULHT have been reporting below national average depth of coding for palliative care and also as a result of In-depth review within Intestinal Obstruction without Hernia which identified 50% of palliative care seen were not coded. A Work Programme has begun to understand this and increase palliative care coding which affects the Trust’s HSMR.
Associate Medical Director and Quality governance met with the palliative care team. Palliative care team have been logging patients seen by site.
This was shared with Quality Governance whom have correlated this with data coded within Dr Foster:
Time period April 2016-March 2017 1909 patients were seen by the Palliative Care Team
For the same period 1467 patients were coded as under Palliative Care in Dr Foster. - 23% (442) Palliative Care was not documented/coded. - 35% (347) of cases were not coded on Lincoln Site. - 53% (89) of cases were not coded on Grantham Site. - 1% (6) of cases were not coded on Pilgrim Site. - SHMI does not take palliative care in account within the algorithm
From this data Quality Governance have asked Palliative Care team for the most current data with patient identifiable data; so an audit can be undertaken for those from April 2017 to July 2017 (the current Dr Foster reporting period). Clinical Coding Manager has agreed to audit alongside Quality Governance for those not coded within this time period. Changing these could affect the HSMR algorithm for expected mortality.
Mortality Reviews
Reviews (Jan 2016-Sep 2017)
NOTE: The review compliance target has changed to 70% due to the New National Learning from Deaths guidance.
Site Deaths Awaiting notes/Notes in Quality Governance
Notes Sent for Review
Review Complete
Review completion Compliance
Review Completion Target
Total Death % Reviewed
ULHT Total 5100 950 4150 3377 81% 70% 66%
Lincoln Total 2786 424 2362 1949 83% 70% 70%
Pilgrim Total 2014 449 1565 1229 79% 70% 61%
Grantham Total
300 77 223 199 89% 70% 66%
95
100
105
110
115
Apr 14-Mar 15
Jul 14 -Jun15
Oct 14-Sep 15
Jan 15-Dec 15
Apr 15-Mar 16
Jul 15-Jun16
Oct 15-Sep 16
Jan 16-Dec 16
Apr 16-Mar 16
ULHT SHMI vs HSMR
HSMR SHMI SHMI in Hospital
20 | P a g e
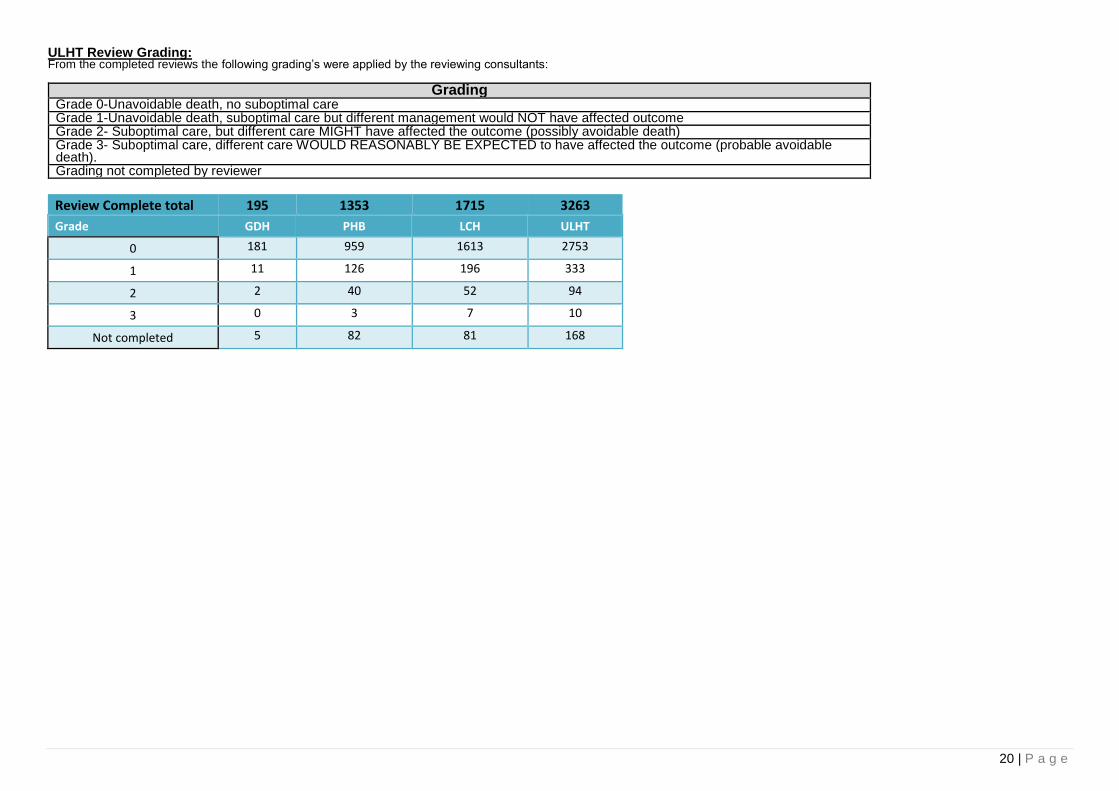
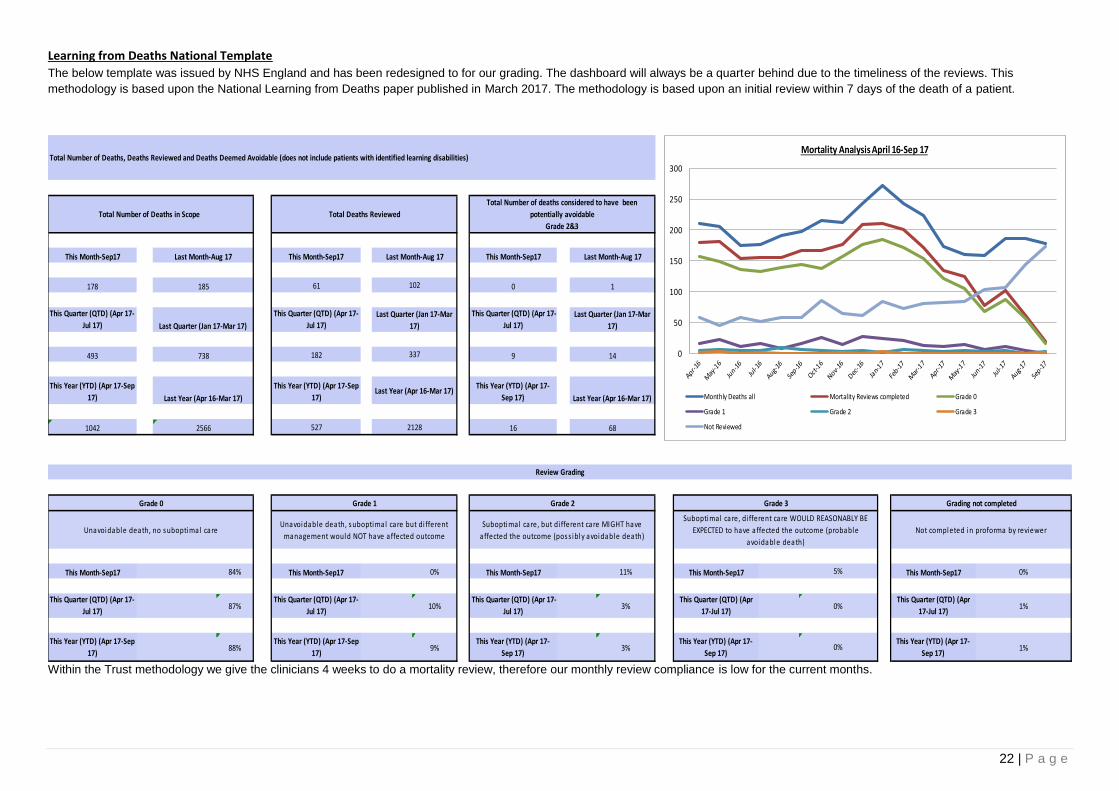
ULHT Review Grading: From the completed reviews the following grading’s were applied by the reviewing consultants:
Grading Grade 0-Unavoidable death, no suboptimal care Grade 1-Unavoidable death, suboptimal care but different management would NOT have affected outcome Grade 2- Suboptimal care, but different care MIGHT have affected the outcome (possibly avoidable death) Grade 3- Suboptimal care, different care WOULD REASONABLY BE EXPECTED to have affected the outcome (probable avoidable death). Grading not completed by reviewer
Review Complete total 195 1353 1715 3263
Grade GDH PHB LCH ULHT
0 181 959 1613 2753
1 11 126 196 333
2 2 40 52 94
3 0 3 7 10
Not completed 5 82 81 168
21 | P a g e
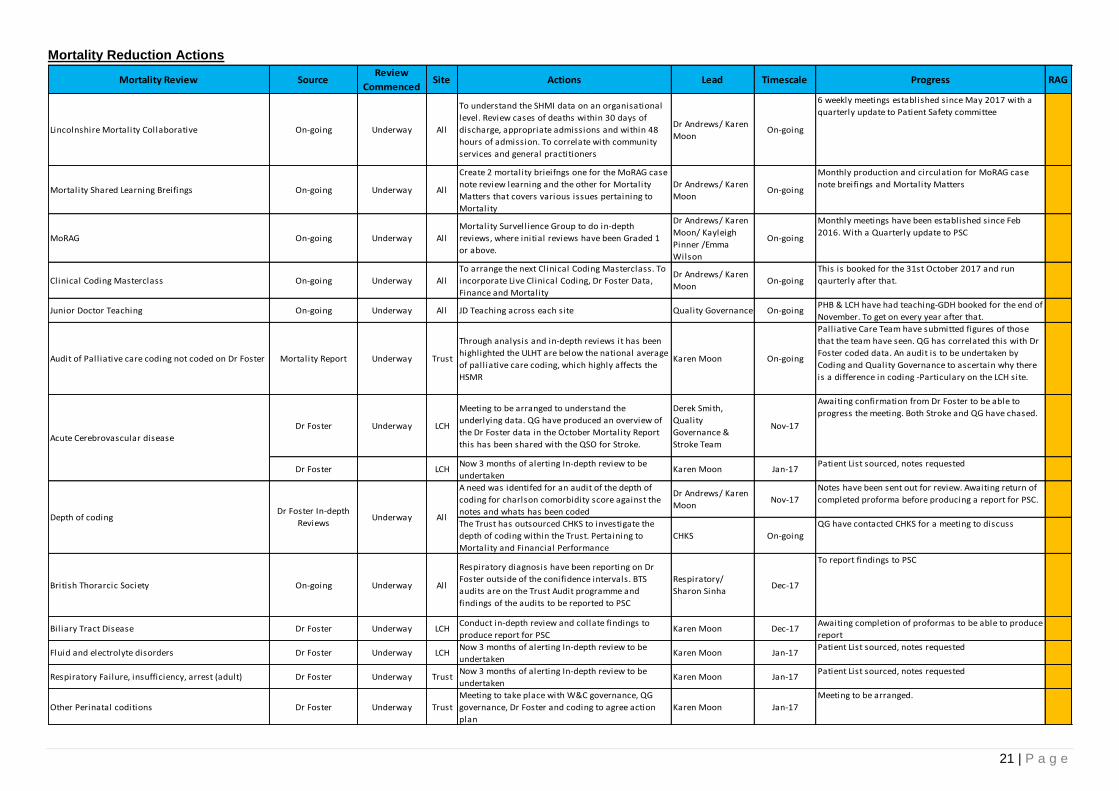
Mortality Reduction Actions
Mortality Review SourceReview
CommencedSite Actions Lead Timescale Progress RAG
Lincolnshire Mortality Collaborative On-going Underway All
To understand the SHMI data on an organisational
level. Review cases of deaths within 30 days of
discharge, appropriate admissions and within 48
hours of admission. To correlate with community
services and general practitioners
Dr Andrews/ Karen
MoonOn-going
6 weekly meetings established since May 2017 with a
quarterly update to Patient Safety committee
Mortality Shared Learning Breifings On-going Underway All
Create 2 mortality brieifngs one for the MoRAG case
note review learning and the other for Mortality
Matters that covers various issues pertaining to
Mortality
Dr Andrews/ Karen
MoonOn-going
Monthly production and circulation for MoRAG case
note breifings and Mortality Matters
MoRAG On-going Underway All
Mortality Survellience Group to do in-depth
reviews, where initial reviews have been Graded 1
or above.
Dr Andrews/ Karen
Moon/ Kayleigh
Pinner /Emma
Wilson
On-going
Monthly meetings have been established since Feb
2016. With a Quarterly update to PSC
Clinical Coding Masterclass On-going Underway All
To arrange the next Clinical Coding Masterclass. To
incorporate Live Clinical Coding, Dr Foster Data,
Finance and Mortality
Dr Andrews/ Karen
MoonOn-going
This is booked for the 31st October 2017 and run
qaurterly after that.
Junior Doctor Teaching On-going Underway All JD Teaching across each site Quality Governance On-goingPHB & LCH have had teaching-GDH booked for the end of
November. To get on every year after that.
Audit of Pall iative care coding not coded on Dr Foster Mortality Report Underway Trust
Through analysis and in-depth reviews it has been
highlighted the ULHT are below the national average
of palliative care coding, which highly affects the
HSMR
Karen Moon On-going
Palliative Care Team have submitted figures of those
that the team have seen. QG has correlated this with Dr
Foster coded data. An audit is to be undertaken by
Coding and Quality Governance to ascertain why there
is a difference in coding -Particulary on the LCH site.
Dr Foster Underway LCH
Meeting to be arranged to understand the
underlying data. QG have produced an overview of
the Dr Foster data in the October Mortality Report
this has been shared with the QSO for Stroke.
Derek Smith,
Quality
Governance &
Stroke Team
Nov-17
Awaiting confirmation from Dr Foster to be able to
progress the meeting. Both Stroke and QG have chased.
Dr Foster LCHNow 3 months of alerting In-depth review to be
undertakenKaren Moon Jan-17
Patient List sourced, notes requested
A need was identifed for an audit of the depth of
coding for charlson comorbidity score against the
notes and whats has been coded
Dr Andrews/ Karen
MoonNov-17
Notes have been sent out for review. Awaiting return of
completed proforma before producing a report for PSC.
The Trust has outsourced CHKS to investigate the
depth of coding within the Trust. Pertaining to
Mortality and Financial Performance
CHKS On-going
QG have contacted CHKS for a meeting to discuss
British Thorarcic Society On-going Underway All
Respiratory diagnosis have been reporting on Dr
Foster outside of the conifidence intervals. BTS
audits are on the Trust Audit programme and
findings of the audits to be reported to PSC
Respiratory/
Sharon SinhaDec-17
To report findings to PSC
Biliary Tract Disease Dr Foster Underway LCHConduct in-depth review and collate findings to
produce report for PSCKaren Moon Dec-17
Awaiting completion of proformas to be able to produce
report
Fluid and electrolyte disorders Dr Foster Underway LCHNow 3 months of alerting In-depth review to be
undertakenKaren Moon Jan-17
Patient List sourced, notes requested
Respiratory Failure, insufficiency, arrest (adult) Dr Foster Underway TrustNow 3 months of alerting In-depth review to be
undertakenKaren Moon Jan-17
Patient List sourced, notes requested
Other Perinatal coditions Dr Foster Underway Trust
Meeting to take place with W&C governance, QG
governance, Dr Foster and coding to agree action
plan
Karen Moon Jan-17
Meeting to be arranged.
Depth of codingDr Foster In-depth
ReviewsUnderway All
Acute Cerebrovascular disease
22 | P a g e
Learning from Deaths National Template
The below template was issued by NHS England and has been redesigned to for our grading. The dashboard will always be a quarter behind due to the timeliness of the reviews. This
methodology is based upon the National Learning from Deaths paper published in March 2017. The methodology is based upon an initial review within 7 days of the death of a patient.
Within the Trust methodology we give the clinicians 4 weeks to do a mortality review, therefore our monthly review compliance is low for the current months.
This Month-Sep17 This Month-Sep17 This Month-Sep17
178 61 0
This Quarter (QTD) (Apr 17-
Jul 17)
This Quarter (QTD) (Apr 17-
Jul 17)
This Quarter (QTD) (Apr 17-
Jul 17)
493 182 9
This Year (YTD) (Apr 17-Sep
17)
This Year (YTD) (Apr 17-Sep
17)
This Year (YTD) (Apr 17-
Sep 17)
1042 527 16
This Month-Sep17 84% This Month-Sep17 0% This Month-Sep17 11% This Month-Sep17 This Month-Sep17 0%
This Quarter (QTD) (Apr 17-
Jul 17)87%
This Quarter (QTD) (Apr 17-
Jul 17)10%
This Quarter (QTD) (Apr 17-
Jul 17)3%
This Quarter (QTD) (Apr
17-Jul 17)
This Quarter (QTD) (Apr
17-Jul 17)1%
This Year (YTD) (Apr 17-Sep
17)88%
This Year (YTD) (Apr 17-Sep
17)9%
This Year (YTD) (Apr 17-
Sep 17)3%
This Year (YTD) (Apr 17-
Sep 17)
This Year (YTD) (Apr 17-
Sep 17)1%
Suboptimal care, but di fferent care MIGHT have
affected the outcome (poss ibly avoidable death)
Suboptimal care, di fferent care WOULD REASONABLY BE
EXPECTED to have affected the outcome (probable
avoidable death)
5%
0%
0%
Not completed in proforma by reviewerUnavoidable death, no suboptimal careUnavoidable death, suboptimal care but di fferent
management would NOT have affected outcome
2566 2128 68
Review Grading
Grade 0 Grade 1 Grade 2 Grade 3 Grading not completed
738 337 14
Last Year (Apr 16-Mar 17)Last Year (Apr 16-Mar 17)
Last Year (Apr 16-Mar 17)
185 102 1
Last Quarter (Jan 17-Mar 17)
Last Quarter (Jan 17-Mar
17)
Last Quarter (Jan 17-Mar
17)
Total Number of Deaths, Deaths Reviewed and Deaths Deemed Avoidable (does not include patients with identified learning disabilities)
Total Number of Deaths in Scope Total Deaths Reviewed
Total Number of deaths considered to have been
potentially avoidable
Grade 2&3
Last Month-Aug 17 Last Month-Aug 17 Last Month-Aug 17
0
50
100
150
200
250
300
Mortality Analysis April 16-Sep 17
Monthly Deaths all Mortality Reviews completed Grade 0
Grade 1 Grade 2 Grade 3
Not Reviewed

23 | P a g e
Learning Disability Template
From April 2017 from the new National Learning from Deaths paper issued in March 2017. All patients that die within hospital that are coded with F819: Developmental disorder of
scholastic skills, unspecified are to be reported externally to the LeDeR programme. The LeDeR programme will contact us if there is a selection of deaths that they want to do a multi-
agency review with.
Mental Health deaths
This Month-Sep17 This Month-Sep17 This Month-Sep17
3 3 0
This Quarter (QTD) (Apr 17-
Jul 17)
This Quarter (QTD) (Apr 17-
Jul 17)
This Quarter (QTD) (Apr 17-
Jul 17)
6 4 0
This Year (YTD) (Apr 17-Aug
17)
This Year (YTD) (Apr 17-Aug
17)
This Year (YTD) (Apr 17-
Aug 17)
10 4 0
Last Quarter (Jan 17-Mar 17)
Last Quarter (Jan 17-Mar
17)
Last Quarter (Jan 17-Mar
17)
10 8 0
1 1 0
Last Year (Apr 16-Mar 17) Last Year (Apr 16-Mar 17) Last Year (Apr 16-Mar 17)
Last Month-Aug 17 Last Month-Aug 17 Last Month-Aug 17
2 0 0
Summary of total number of learning disability deaths and total number reviewed under the LeDeR methodology
Total Number of Deaths in scope Total Deaths Reviewed Through the LeDeR Methodology
(or equivalent)
Total Number of deaths considered to have been
potentially avoidable
Grade 2& 3
Total Number of Deaths, Deaths Reviewed and Deaths Deemed Avoidable for patients with identified learning disabilities
0
0.5
1
1.5
2
2.5
3
3.5
4
Learning Disabilities Mortality Reporting -Apr 16 to Aug 17
Mortality LD LD Mortality Reviews Completed Grade 0
Grade 1 Grade 2 Grade 3
Grade N/C
24 | P a g e
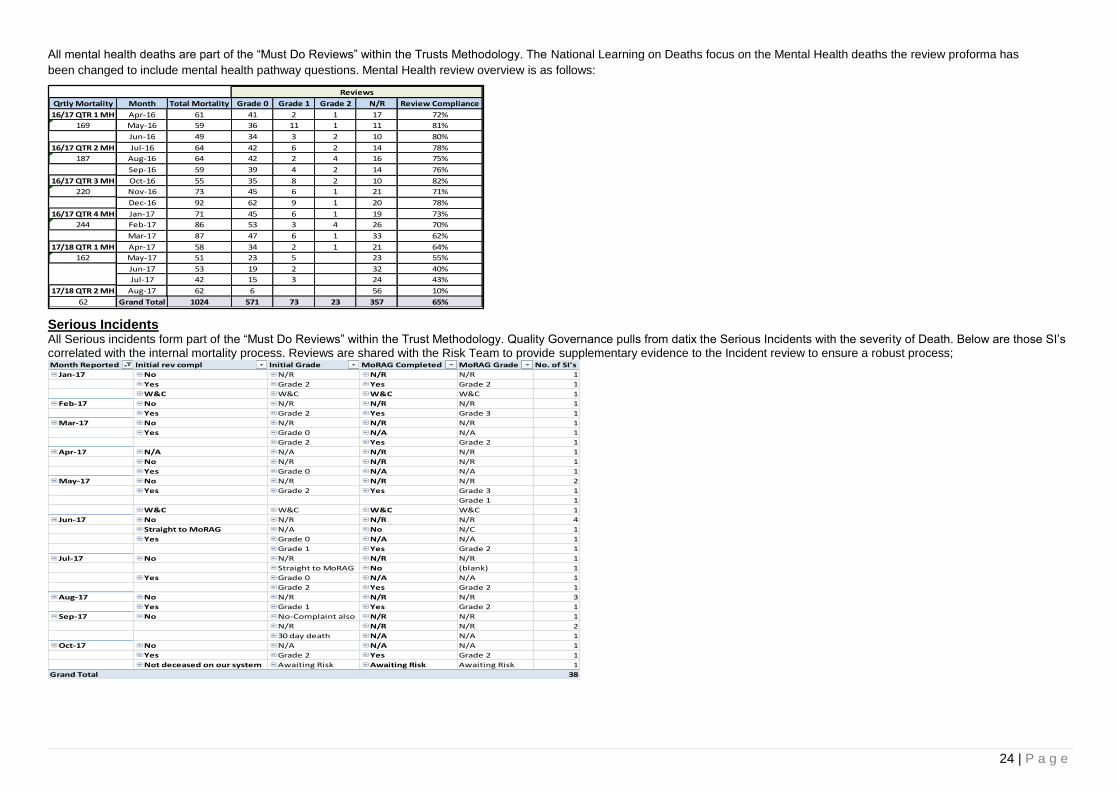
All mental health deaths are part of the “Must Do Reviews” within the Trusts Methodology. The National Learning on Deaths focus on the Mental Health deaths the review proforma has
been changed to include mental health pathway questions. Mental Health review overview is as follows:
Serious Incidents All Serious incidents form part of the “Must Do Reviews” within the Trust Methodology. Quality Governance pulls from datix the Serious Incidents with the severity of Death. Below are those SI’s correlated with the internal mortality process. Reviews are shared with the Risk Team to provide supplementary evidence to the Incident review to ensure a robust process;
Month Reported Initial rev compl Initial Grade MoRAG Completed MoRAG Grade No. of SI's
Jan-17 No N/R N/R N/R 1
Yes Grade 2 Yes Grade 2 1
W&C W&C W&C W&C 1
Feb-17 No N/R N/R N/R 1
Yes Grade 2 Yes Grade 3 1
Mar-17 No N/R N/R N/R 1
Yes Grade 0 N/A N/A 1
Grade 2 Yes Grade 2 1
Apr-17 N/A N/A N/R N/R 1
No N/R N/R N/R 1
Yes Grade 0 N/A N/A 1
May-17 No N/R N/R N/R 2
Yes Grade 2 Yes Grade 3 1
Grade 1 1
W&C W&C W&C W&C 1
Jun-17 No N/R N/R N/R 4
Straight to MoRAG N/A No N/C 1
Yes Grade 0 N/A N/A 1
Grade 1 Yes Grade 2 1
Jul-17 No N/R N/R N/R 1
Straight to MoRAG No (blank) 1
Yes Grade 0 N/A N/A 1
Grade 2 Yes Grade 2 1
Aug-17 No N/R N/R N/R 3
Yes Grade 1 Yes Grade 2 1
Sep-17 No No-Complaint also N/R N/R 1
N/R N/R N/R 2
30 day death N/A N/A 1
Oct-17 No N/A N/A N/A 1
Yes Grade 2 Yes Grade 2 1
Not deceased on our system Awaiting Risk Awaiting Risk Awaiting Risk 1
Grand Total 38
Qrtly Mortality Month Total Mortality Grade 0 Grade 1 Grade 2 N/R Review Compliance
16/17 QTR 1 MH Apr-16 61 41 2 1 17 72%
169 May-16 59 36 11 1 11 81%
Jun-16 49 34 3 2 10 80%
16/17 QTR 2 MH Jul-16 64 42 6 2 14 78%
187 Aug-16 64 42 2 4 16 75%
Sep-16 59 39 4 2 14 76%
16/17 QTR 3 MH Oct-16 55 35 8 2 10 82%
220 Nov-16 73 45 6 1 21 71%
Dec-16 92 62 9 1 20 78%
16/17 QTR 4 MH Jan-17 71 45 6 1 19 73%
244 Feb-17 86 53 3 4 26 70%
Mar-17 87 47 6 1 33 62%
17/18 QTR 1 MH Apr-17 58 34 2 1 21 64%
162 May-17 51 23 5 23 55%
Jun-17 53 19 2 32 40%
Jul-17 42 15 3 24 43%
17/18 QTR 2 MH Aug-17 62 6 56 10%
62 Grand Total 1024 571 73 23 357 65%
Reviews
25 | P a g e
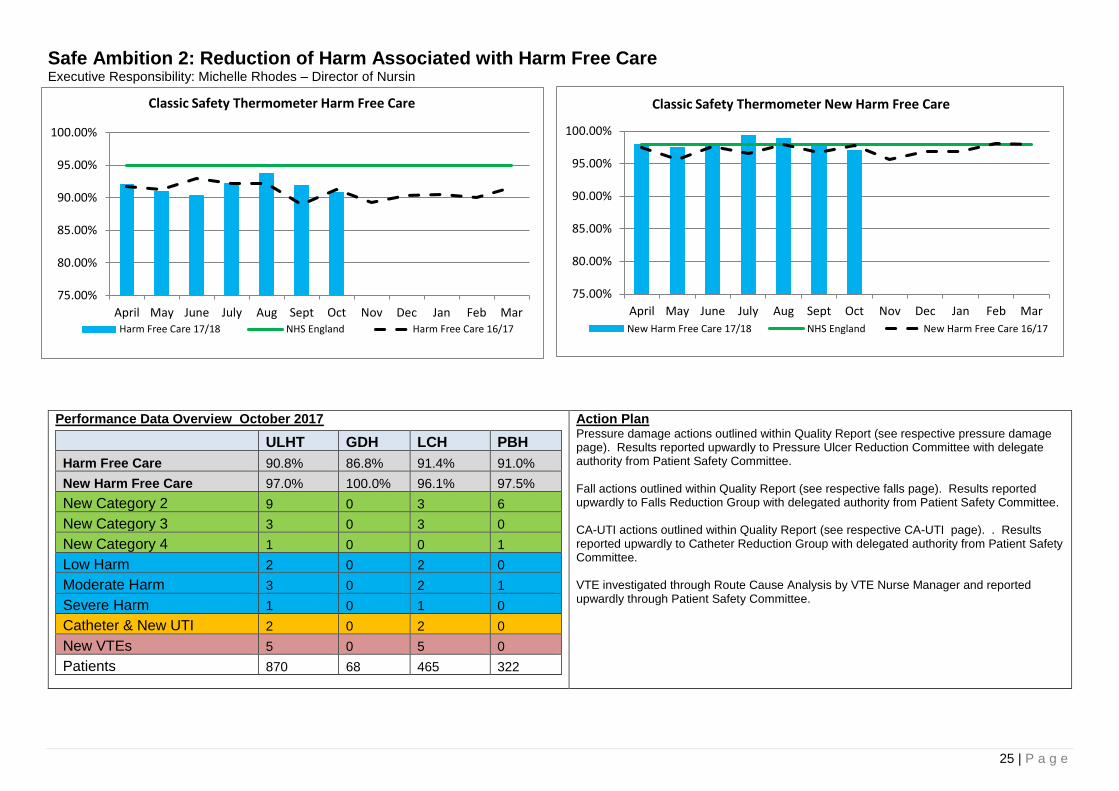
Safe Ambition 2: Reduction of Harm Associated with Harm Free Care Executive Responsibility: Michelle Rhodes – Director of Nursin
Performance Data Overview October 2017
ULHT GDH LCH PBH
Harm Free Care 90.8% 86.8% 91.4% 91.0%
New Harm Free Care 97.0% 100.0% 96.1% 97.5%
New Category 2 9 0 3 6
New Category 3 3 0 3 0
New Category 4 1 0 0 1
Low Harm 2 0 2 0
Moderate Harm 3 0 2 1
Severe Harm 1 0 1 0
Catheter & New UTI 2 0 2 0
New VTEs 5 0 5 0
Patients 870 68 465 322
Action Plan Pressure damage actions outlined within Quality Report (see respective pressure damage page). Results reported upwardly to Pressure Ulcer Reduction Committee with delegate authority from Patient Safety Committee. Fall actions outlined within Quality Report (see respective falls page). Results reported upwardly to Falls Reduction Group with delegated authority from Patient Safety Committee. CA-UTI actions outlined within Quality Report (see respective CA-UTI page). . Results reported upwardly to Catheter Reduction Group with delegated authority from Patient Safety Committee. VTE investigated through Route Cause Analysis by VTE Nurse Manager and reported upwardly through Patient Safety Committee.
75.00%
80.00%
85.00%
90.00%
95.00%
100.00%
April May June July Aug Sept Oct Nov Dec Jan Feb Mar
Classic Safety Thermometer New Harm Free Care
New Harm Free Care 17/18 NHS England New Harm Free Care 16/17
75.00%
80.00%
85.00%
90.00%
95.00%
100.00%
April May June July Aug Sept Oct Nov Dec Jan Feb Mar
Classic Safety Thermometer Harm Free Care
Harm Free Care 17/18 NHS England Harm Free Care 16/17
26 | P a g e
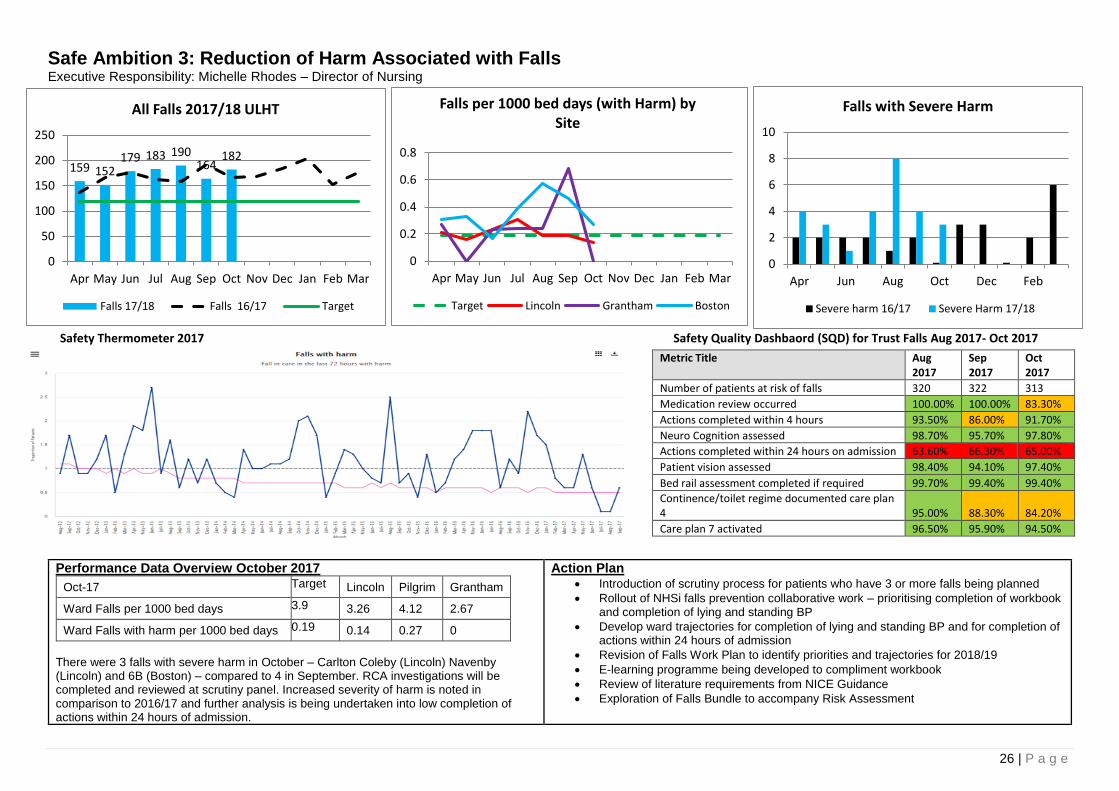
Safe Ambition 3: Reduction of Harm Associated with Falls Executive Responsibility: Michelle Rhodes – Director of Nursing
Safety Thermometer 2017 Safety Quality Dashbaord (SQD) for Trust Falls Aug 2017- Oct 2017
Metric Title Aug 2017
Sep 2017
Oct 2017
Number of patients at risk of falls 320 322 313
Medication review occurred 100.00% 100.00% 83.30%
Actions completed within 4 hours 93.50% 86.00% 91.70%
Neuro Cognition assessed 98.70% 95.70% 97.80%
Actions completed within 24 hours on admission 63.60% 66.30% 65.00%
Patient vision assessed 98.40% 94.10% 97.40%
Bed rail assessment completed if required 99.70% 99.40% 99.40%
Continence/toilet regime documented care plan 4 95.00% 88.30% 84.20%
Care plan 7 activated 96.50% 95.90% 94.50%
Performance Data Overview October 2017
Oct-17 Target Lincoln Pilgrim Grantham
Ward Falls per 1000 bed days 3.9 3.26 4.12 2.67
Ward Falls with harm per 1000 bed days 0.19 0.14 0.27 0
There were 3 falls with severe harm in October – Carlton Coleby (Lincoln) Navenby (Lincoln) and 6B (Boston) – compared to 4 in September. RCA investigations will be completed and reviewed at scrutiny panel. Increased severity of harm is noted in comparison to 2016/17 and further analysis is being undertaken into low completion of actions within 24 hours of admission.
Action Plan Introduction of scrutiny process for patients who have 3 or more falls being planned
Rollout of NHSi falls prevention collaborative work – prioritising completion of workbook and completion of lying and standing BP
Develop ward trajectories for completion of lying and standing BP and for completion of actions within 24 hours of admission
Revision of Falls Work Plan to identify priorities and trajectories for 2018/19
E-learning programme being developed to compliment workbook
Review of literature requirements from NICE Guidance
Exploration of Falls Bundle to accompany Risk Assessment
ULHT Performance National Performance
159 152179 183 190
164182
0
50
100
150
200
250
Apr May Jun Jul Aug Sep Oct Nov Dec Jan Feb Mar
All Falls 2017/18 ULHT
Falls 17/18 Falls 16/17 Target
0
0.2
0.4
0.6
0.8
Apr May Jun Jul Aug Sep Oct Nov Dec Jan Feb Mar
Falls per 1000 bed days (with Harm) by Site
Target Lincoln Grantham Boston
0
2
4
6
8
10
Apr Jun Aug Oct Dec Feb
Falls with Severe Harm
Severe harm 16/17 Severe Harm 17/18
27 | P a g e
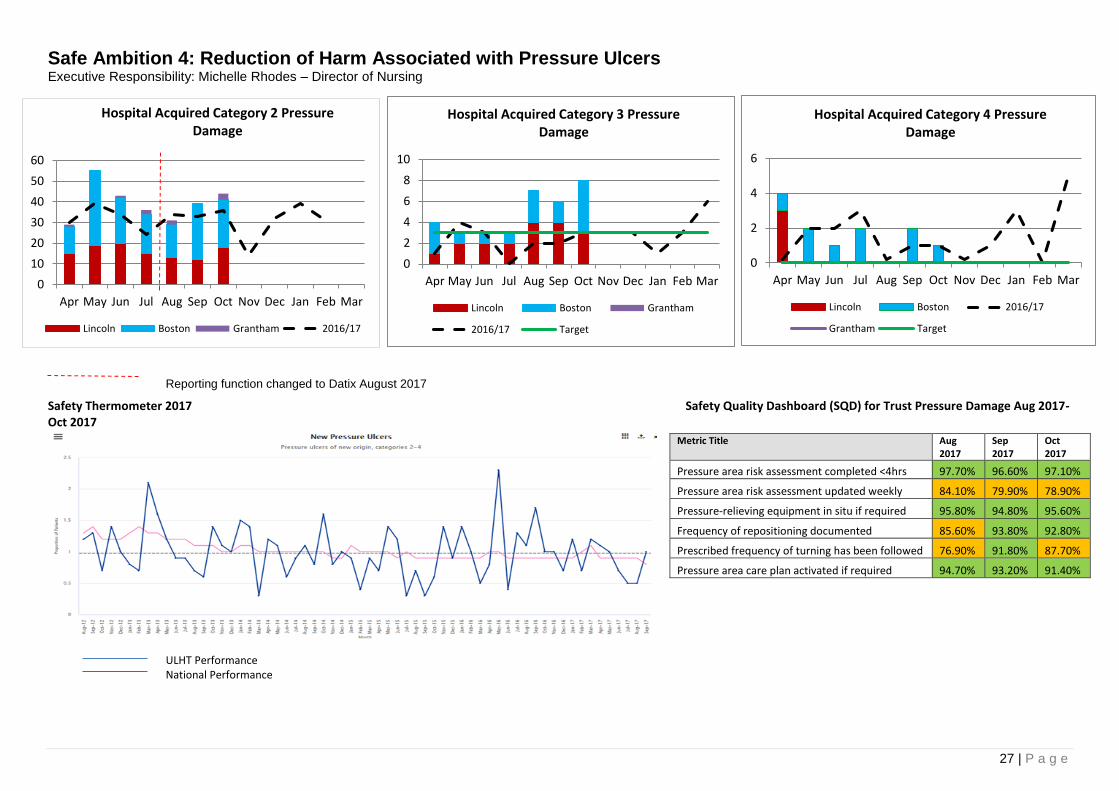
Safe Ambition 4: Reduction of Harm Associated with Pressure Ulcers Executive Responsibility: Michelle Rhodes – Director of Nursing
Safety Thermometer 2017 Safety Quality Dashboard (SQD) for Trust Pressure Damage Aug 2017- Oct 2017
Metric Title Aug 2017
Sep 2017
Oct 2017
Pressure area risk assessment completed <4hrs 97.70% 96.60% 97.10%
Pressure area risk assessment updated weekly 84.10% 79.90% 78.90%
Pressure-relieving equipment in situ if required 95.80% 94.80% 95.60%
Frequency of repositioning documented 85.60% 93.80% 92.80%
Prescribed frequency of turning has been followed 76.90% 91.80% 87.70%
Pressure area care plan activated if required 94.70% 93.20% 91.40%
ULHT Performance National Performance
Reporting function changed to Datix August 2017
0
10
20
30
40
50
60
Apr May Jun Jul Aug Sep Oct Nov Dec Jan Feb Mar
Hospital Acquired Category 2 Pressure Damage
Lincoln Boston Grantham 2016/17
0
2
4
6
8
10
Apr May Jun Jul Aug Sep Oct Nov Dec Jan Feb Mar
Hospital Acquired Category 3 Pressure Damage
Lincoln Boston Grantham
2016/17 Target
0
2
4
6
Apr May Jun Jul Aug Sep Oct Nov Dec Jan Feb Mar
Hospital Acquired Category 4 Pressure Damage
Lincoln Boston 2016/17
Grantham Target

28 | P a g e
Performance Data Overview October 2017 Site Cat 1 Cat 2 Cat 3 Cat 4
Lincoln 6 18 3 (Scampton, Burton, C/Coleby)
0
Grantham 1 3 0 0
Boston 9 23 5 (1B, 5B, 6B, 7a, Stroke)
1 (5B)
Louth 0 0 0 0
1 cat 4 PU and 8 category 3 pressure ulcers were reported in October which is an increase from recent months, however the scrutiny panels have not yet taken place to determine if these are avoidable and attributable to ULHT or not. Data suggests improved reporting of cat 1 and 2 PUs as Datix is embedded for reporting PU incidents. Highest incidence of avoidable cat 3 & 4 pressure damage since April has been reported on Shuttleworth who have reported 4 avoidable cat 3 PUs, and 8A who have reported 3 avoidable cat 4 PUs with an additional cat 3 PU scrutiny panel outcome pending. GDH have reported no cat 3 or 4 PUs since and July 2016.
Action Plan Deep dive into Shuttleworth and 8A performance underway by Matrons, report to
be presented to QGC
Target work by TVNs with ward teams where cat 3&4 PUs continue to be reported
Pressure ulcer prevention meetings re-established on the Lincoln & Pilgrim sites
Revision of monitoring tracker
Launch of Head of Nursing reports
Commence reporting of pressure damage incidence per 1000 bed days (including trajectory Cat 3/4)
PDSA PU prevention project to commence on the Pilgrim site
International Sop the Pressure Day awareness campaign & poster competition - 16.11.17
Additional training provided for HCSWs
Newsletter produced and circulated to share lessons learnt from scrutiny panels
Care plan developed & launched for use in A&E & emergency assessment units Nov 2017
0.000.020.040.060.080.100.120.140.160.18
Apr-17May-
17Jun-17 Jul-17 Aug-17 Sep-17 Oct-17 Nov-17 Dec-17 Jan-18 Feb-18 Mar-18
Cat 3 per 1000 beddays 0.06 0.04 0.06 0.06 0.16 0.12 0.00 0.00 0.00 0.00 0.00 0.00
Trajectory Cat 3 per 1000 bed days 0.05 0.05 0.05 0.05 0.05 0.05 0.05 0.05 0.05 0.05 0.05 0.05
Cat 4 per 1000 beddays 0.08 0.04 0.02 0.04 0.00 0.04 0.00 0.00 0.00 0.00 0.00 0.00
Trajectory Cat 3 per 1000 bed days 0.00 0.00 0.00 0.00 0.00 0.00 0.00 0.00 0.00 0.00 0.00 0.00
Avoidable Pressure Damage Incidence YTD
0
2
4
6
8
Ap
ril
May
Jun
e
July
Au
gust
Sep
tem
ber
Oct
ob
er
Ap
ril
May
Jun
e
July
Au
gust
Sep
tem
ber
Oct
ob
er
Lincoln County Hospital Pilgrim Hospital, Boston
HA Cat 3 & 4 Avoidable Scrutiny Panel Outcomes and Outstanding
Pressure ulcer (cat 4 hospital acquired) - Outstanding
Pressure ulcer (cat 4 hospital acquired) - Avoidable
Pressure ulcer (cat 3 hospital acquired) - Outstanding
Pressure ulcer (cat 3 hospital acquired) - Avoidable
29 | P a g e
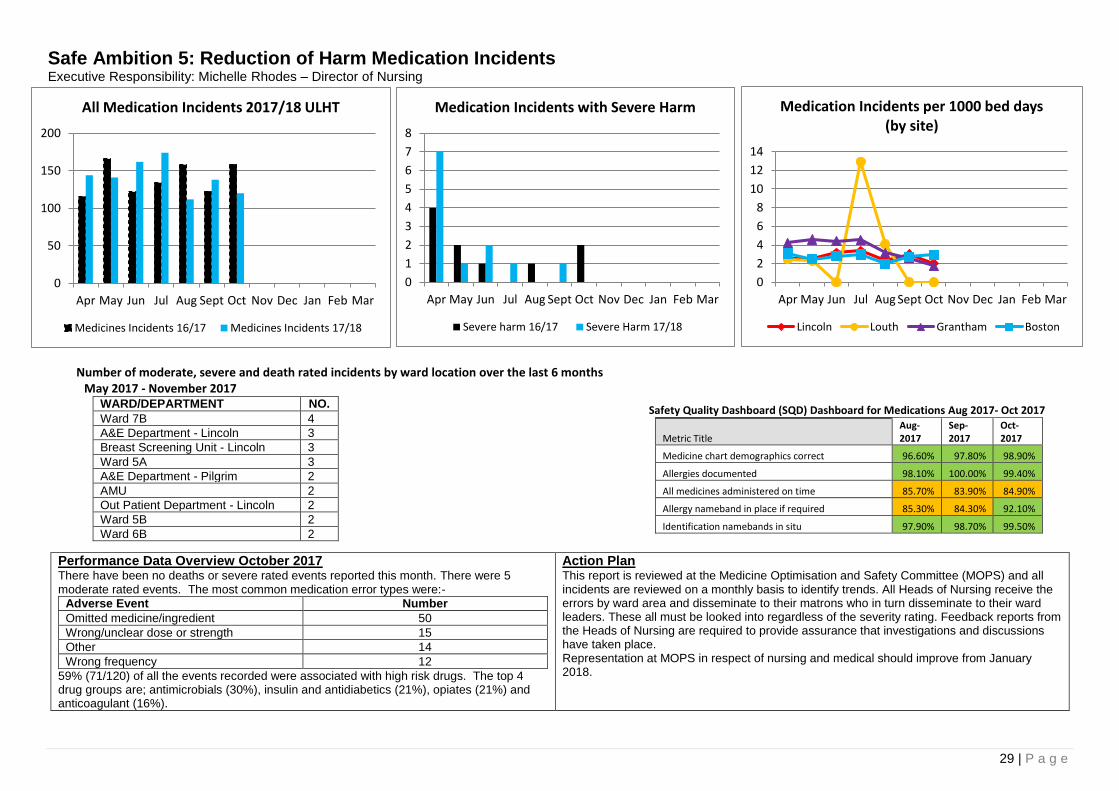
Safe Ambition 5: Reduction of Harm Medication Incidents Executive Responsibility: Michelle Rhodes – Director of Nursing
Number of moderate, severe and death rated incidents by ward location over the last 6 months May 2017 - November 2017
WARD/DEPARTMENT NO.
Ward 7B 4
A&E Department - Lincoln 3
Breast Screening Unit - Lincoln 3
Ward 5A 3
A&E Department - Pilgrim 2
AMU 2
Out Patient Department - Lincoln 2
Ward 5B 2
Ward 6B 2
Performance Data Overview October 2017 There have been no deaths or severe rated events reported this month. There were 5 moderate rated events. The most common medication error types were:-
Adverse Event Number
Omitted medicine/ingredient 50
Wrong/unclear dose or strength 15
Other 14
Wrong frequency 12
59% (71/120) of all the events recorded were associated with high risk drugs. The top 4 drug groups are; antimicrobials (30%), insulin and antidiabetics (21%), opiates (21%) and anticoagulant (16%).
Action Plan This report is reviewed at the Medicine Optimisation and Safety Committee (MOPS) and all incidents are reviewed on a monthly basis to identify trends. All Heads of Nursing receive the errors by ward area and disseminate to their matrons who in turn disseminate to their ward leaders. These all must be looked into regardless of the severity rating. Feedback reports from the Heads of Nursing are required to provide assurance that investigations and discussions have taken place. Representation at MOPS in respect of nursing and medical should improve from January 2018.
Safety Quality Dashboard (SQD) Dashboard for Medications Aug 2017- Oct 2017
Metric Title Aug-2017
Sep-2017
Oct-2017
Medicine chart demographics correct 96.60% 97.80% 98.90%
Allergies documented 98.10% 100.00% 99.40%
All medicines administered on time 85.70% 83.90% 84.90%
Allergy nameband in place if required 85.30% 84.30% 92.10%
Identification namebands in situ 97.90% 98.70% 99.50%
0
50
100
150
200
Apr May Jun Jul Aug Sept Oct Nov Dec Jan Feb Mar
All Medication Incidents 2017/18 ULHT
Medicines Incidents 16/17 Medicines Incidents 17/18
0
1
2
3
4
5
6
7
8
Apr May Jun Jul Aug Sept Oct Nov Dec Jan Feb Mar
Medication Incidents with Severe Harm
Severe harm 16/17 Severe Harm 17/18
0
2
4
6
8
10
12
14
Apr May Jun Jul Aug Sept Oct Nov Dec Jan Feb Mar
Medication Incidents per 1000 bed days (by site)
Lincoln Louth Grantham Boston
30 | P a g e
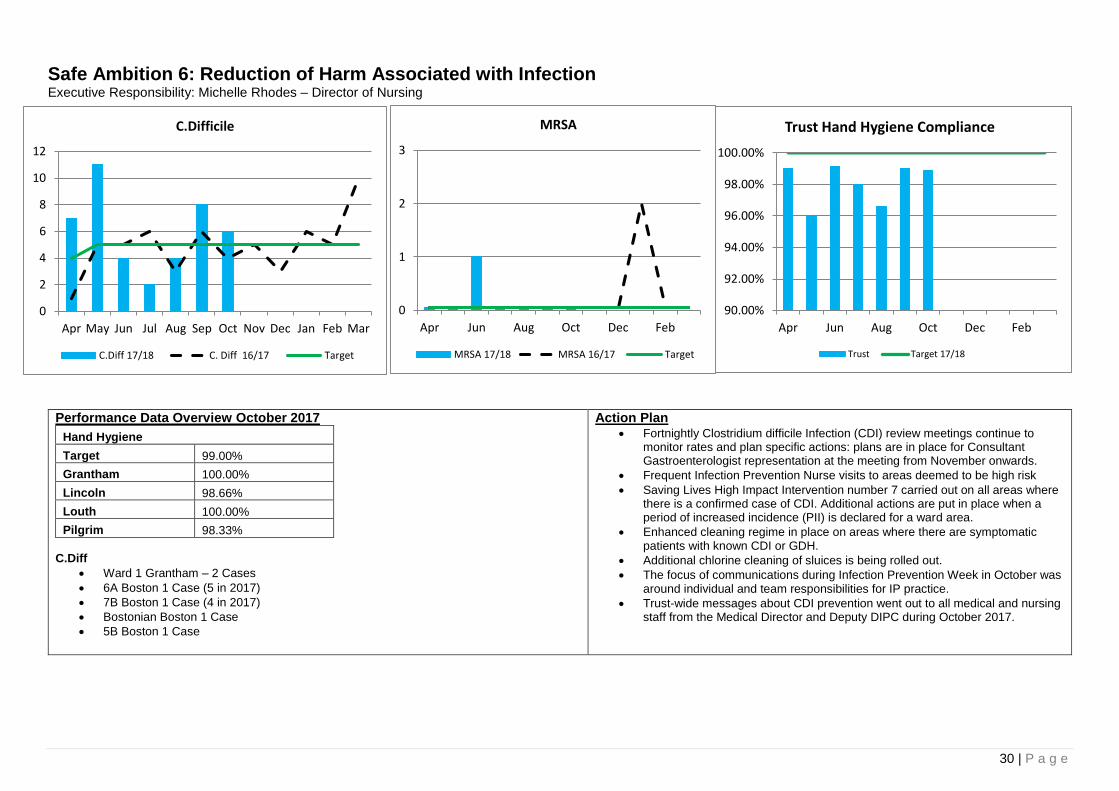
Safe Ambition 6: Reduction of Harm Associated with Infection Executive Responsibility: Michelle Rhodes – Director of Nursing
Performance Data Overview October 2017
Hand Hygiene
Target 99.00%
Grantham 100.00%
Lincoln 98.66%
Louth 100.00%
Pilgrim 98.33%
C.Diff
Ward 1 Grantham – 2 Cases
6A Boston 1 Case (5 in 2017)
7B Boston 1 Case (4 in 2017)
Bostonian Boston 1 Case
5B Boston 1 Case
Action Plan Fortnightly Clostridium difficile Infection (CDI) review meetings continue to
monitor rates and plan specific actions: plans are in place for Consultant Gastroenterologist representation at the meeting from November onwards.
Frequent Infection Prevention Nurse visits to areas deemed to be high risk
Saving Lives High Impact Intervention number 7 carried out on all areas where there is a confirmed case of CDI. Additional actions are put in place when a period of increased incidence (PII) is declared for a ward area.
Enhanced cleaning regime in place on areas where there are symptomatic patients with known CDI or GDH.
Additional chlorine cleaning of sluices is being rolled out.
The focus of communications during Infection Prevention Week in October was around individual and team responsibilities for IP practice.
Trust-wide messages about CDI prevention went out to all medical and nursing staff from the Medical Director and Deputy DIPC during October 2017.
90.00%
92.00%
94.00%
96.00%
98.00%
100.00%
Apr Jun Aug Oct Dec Feb
Trust Hand Hygiene Compliance
Trust Target 17/18
0
2
4
6
8
10
12
Apr May Jun Jul Aug Sep Oct Nov Dec Jan Feb Mar
C.Difficile
C.Diff 17/18 C. Diff 16/17 Target
0
1
2
3
Apr Jun Aug Oct Dec Feb
MRSA
MRSA 17/18 MRSA 16/17 Target
31 | P a g e
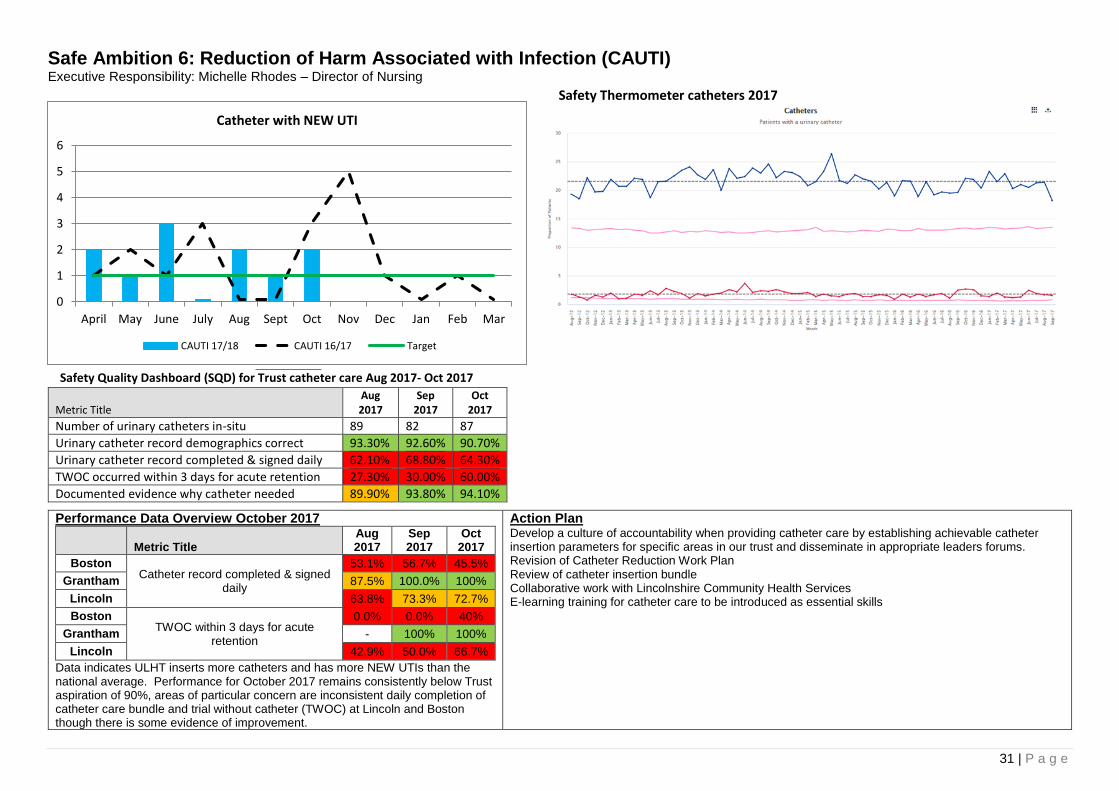
Safe Ambition 6: Reduction of Harm Associated with Infection (CAUTI) Executive Responsibility: Michelle Rhodes – Director of Nursing
Safety Thermometer catheters 2017
Safety Quality Dashboard (SQD) for Trust catheter care Aug 2017- Oct 2017
Metric Title Aug 2017
Sep 2017
Oct 2017
Number of urinary catheters in-situ 89 82 87
Urinary catheter record demographics correct 93.30% 92.60% 90.70%
Urinary catheter record completed & signed daily 62.10% 68.80% 64.30%
TWOC occurred within 3 days for acute retention 27.30% 30.00% 60.00%
Documented evidence why catheter needed 89.90% 93.80% 94.10%
Performance Data Overview October 2017
Metric Title Aug 2017
Sep 2017
Oct 2017
Boston Catheter record completed & signed
daily
53.1% 56.7% 45.5%
Grantham 87.5% 100.0% 100%
Lincoln 63.8% 73.3% 72.7%
Boston TWOC within 3 days for acute
retention
0.0% 0.0% 40%
Grantham - 100% 100%
Lincoln 42.9% 50.0% 66.7%
Data indicates ULHT inserts more catheters and has more NEW UTIs than the national average. Performance for October 2017 remains consistently below Trust aspiration of 90%, areas of particular concern are inconsistent daily completion of catheter care bundle and trial without catheter (TWOC) at Lincoln and Boston though there is some evidence of improvement.
Action Plan Develop a culture of accountability when providing catheter care by establishing achievable catheter insertion parameters for specific areas in our trust and disseminate in appropriate leaders forums. Revision of Catheter Reduction Work Plan Review of catheter insertion bundle Collaborative work with Lincolnshire Community Health Services E-learning training for catheter care to be introduced as essential skills
0
1
2
3
4
5
6
April May June July Aug Sept Oct Nov Dec Jan Feb Mar
Catheter with NEW UTI
CAUTI 17/18 CAUTI 16/17 Target
32 | P a g e
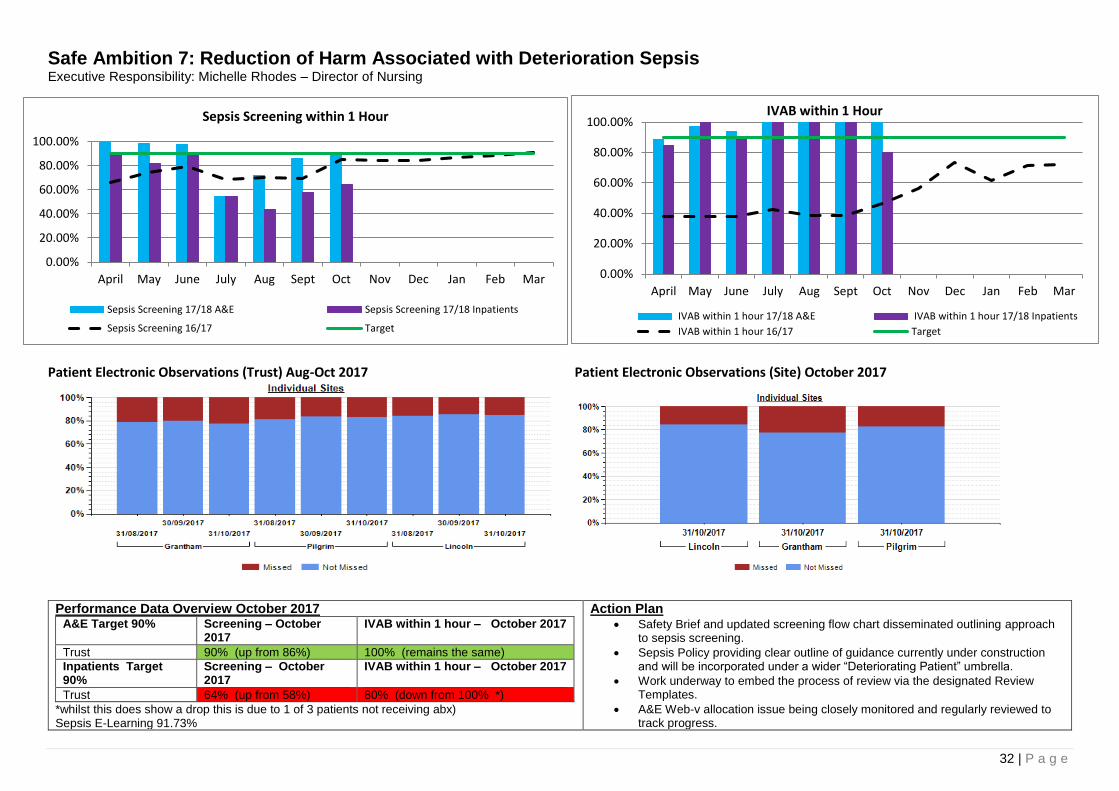
Safe Ambition 7: Reduction of Harm Associated with Deterioration Sepsis Executive Responsibility: Michelle Rhodes – Director of Nursing
Patient Electronic Observations (Trust) Aug-Oct 2017 Patient Electronic Observations (Site) October 2017
Performance Data Overview October 2017 A&E Target 90% Screening – October
2017 IVAB within 1 hour – October 2017
Trust 90% (up from 86%) 100% (remains the same)
Inpatients Target 90%
Screening – October 2017
IVAB within 1 hour – October 2017
Trust 64% (up from 58%) 80% (down from 100% *)
*whilst this does show a drop this is due to 1 of 3 patients not receiving abx) Sepsis E-Learning 91.73%
Action Plan Safety Brief and updated screening flow chart disseminated outlining approach
to sepsis screening.
Sepsis Policy providing clear outline of guidance currently under construction and will be incorporated under a wider “Deteriorating Patient” umbrella.
Work underway to embed the process of review via the designated Review Templates.
A&E Web-v allocation issue being closely monitored and regularly reviewed to track progress.
0.00%
20.00%
40.00%
60.00%
80.00%
100.00%
April May June July Aug Sept Oct Nov Dec Jan Feb Mar
Sepsis Screening within 1 Hour
Sepsis Screening 17/18 A&E Sepsis Screening 17/18 Inpatients
Sepsis Screening 16/17 Target
0.00%
20.00%
40.00%
60.00%
80.00%
100.00%
April May June July Aug Sept Oct Nov Dec Jan Feb Mar
IVAB within 1 Hour
IVAB within 1 hour 17/18 A&E IVAB within 1 hour 17/18 Inpatients
IVAB within 1 hour 16/17 Target
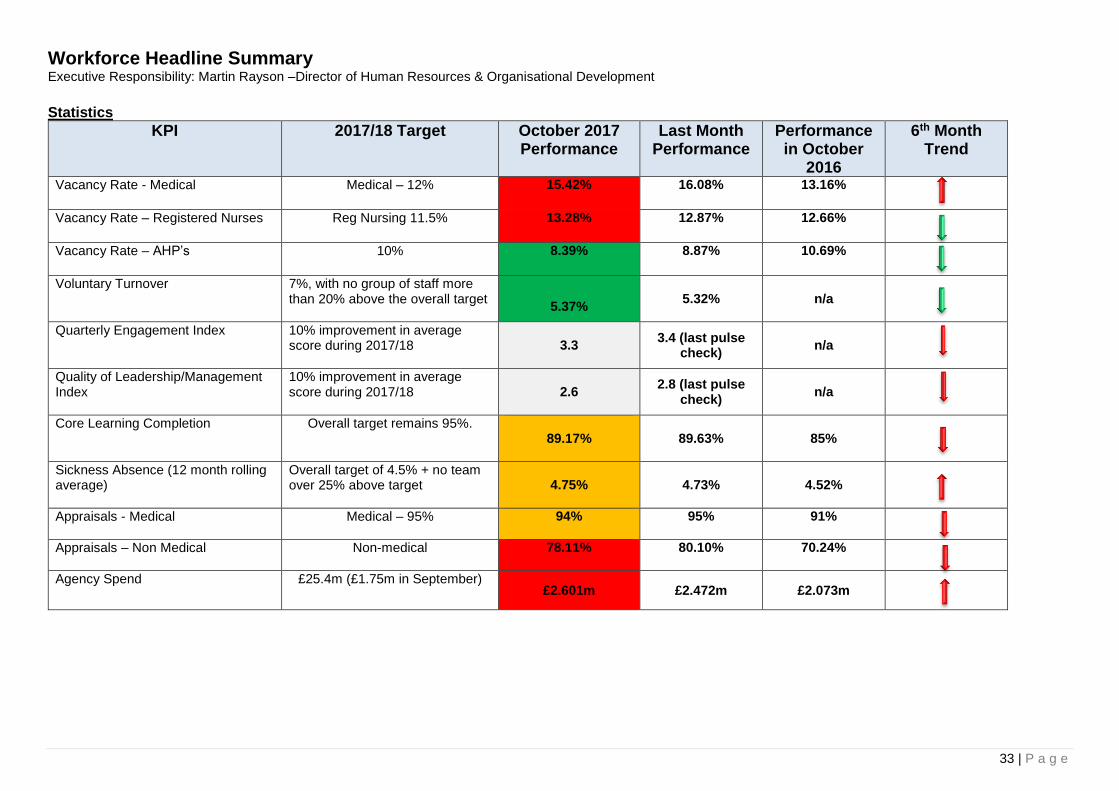
33 | P a g e
Workforce Headline Summary Executive Responsibility: Martin Rayson –Director of Human Resources & Organisational Development
Statistics
KPI 2017/18 Target October 2017 Performance
Last Month Performance
Performance in October
2016
6th Month Trend
Vacancy Rate - Medical Medical – 12%
15.42%
16.08% 13.16%
Vacancy Rate – Registered Nurses Reg Nursing 11.5% 13.28% 12.87% 12.66%
Vacancy Rate – AHP’s 10% 8.39% 8.87% 10.69%
Voluntary Turnover
7%, with no group of staff more than 20% above the overall target
5.37%
5.32%
n/a
Quarterly Engagement Index
10% improvement in average score during 2017/18
3.3 3.4 (last pulse
check) n/a
Quality of Leadership/Management Index
10% improvement in average score during 2017/18
2.6 2.8 (last pulse
check) n/a
Core Learning Completion
Overall target remains 95%.
89.17%
89.63%
85%
Sickness Absence (12 month rolling average)
Overall target of 4.5% + no team over 25% above target
4.75%
4.73%
4.52%
Appraisals - Medical
Medical – 95%
94%
95%
91%
Appraisals – Non Medical Non-medical
78.11% 80.10% 70.24%
Agency Spend
£25.4m (£1.75m in September) £2.601m £2.472m £2.073m
34 | P a g e
Commentary The overall vacancy rate reduced again in October. There have been improvements in the medical and AHP vacancy rate, reflecting the successful recruitment exercises we have recently undertaken. The registered nursing rate unfortunately has risen. We have started cohort recruitment for band 5s. Our strategy is to use agencies to support registered nurse recruitment. This is held up by the difficulty of authorising up-front investment at a time of financial constraint. In order to achieve target vacancy rates and given the number of vacancies where there is no active recruitment, we do need to undertake a robust workforce planning exercise and review the establishment. This is a priority for the remaining months of 2017/18. This is also crucial because our agency spend (notably on medical staff) is not reducing. Additional actions are being taken to drive down agency spend and these must start to impact in November and December. Although the 12 monthly rolling average sickness rate slightly increased again this month the winter of 2016/17 had a significantly higher absence rate than previous years. If sickness this coming winter returns to previous levels we should see a reduction in the 12 month rolling average by the end of the financial year. It should though be noted that flu was not a significant factor last year and it was a mild winter. Both core learning compliance rates and non-medical appraisal now have a downward trend for the last three to four months. This is very disappointing and we are seeking to hold managers accountable through the monthly performance meetings. We have longer term plans to review our approach to individual performance management and to set new core learning targets and this work is underway. There are of course time pressures on managers and staff, but we must find a way to increase participation rates in these key people management practices.
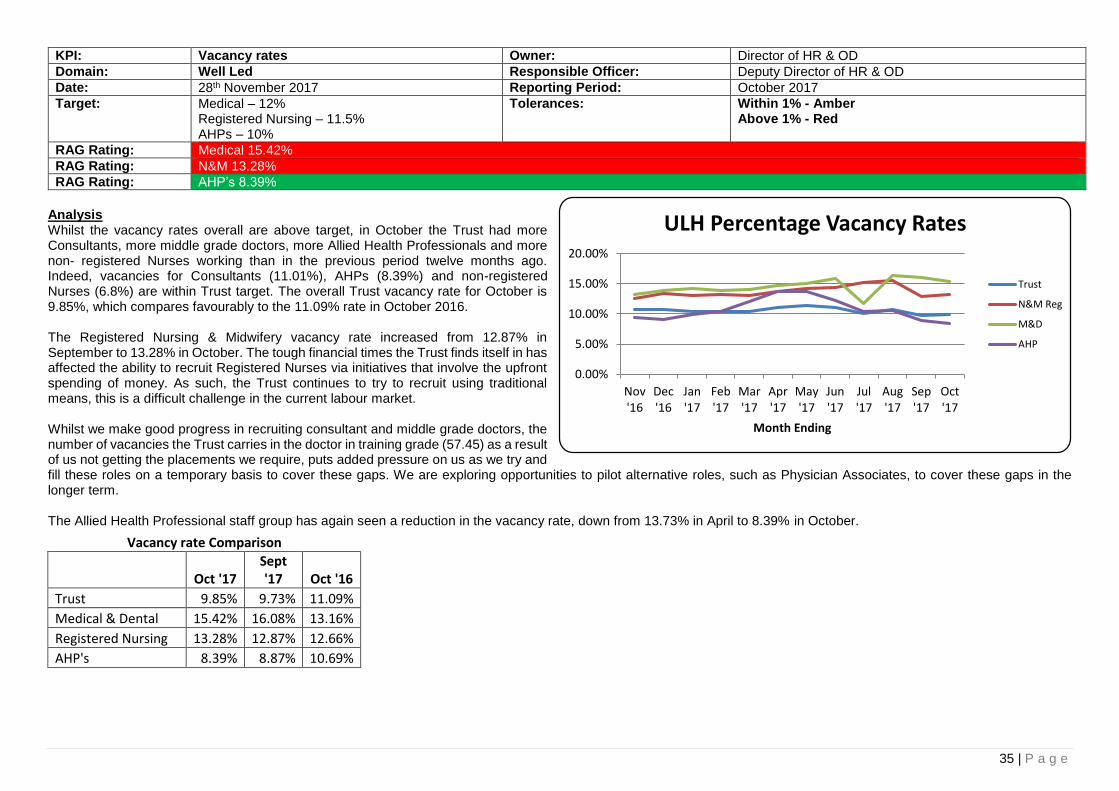
35 | P a g e
KPI: Vacancy rates Owner: Director of HR & OD
Domain: Well Led Responsible Officer: Deputy Director of HR & OD
Date: 28th November 2017 Reporting Period: October 2017
Target: Medical – 12% Registered Nursing – 11.5% AHPs – 10%
Tolerances: Within 1% - Amber Above 1% - Red
RAG Rating: Medical 15.42%
RAG Rating: N&M 13.28%
RAG Rating: AHP’s 8.39%
Analysis Whilst the vacancy rates overall are above target, in October the Trust had more Consultants, more middle grade doctors, more Allied Health Professionals and more non- registered Nurses working than in the previous period twelve months ago. Indeed, vacancies for Consultants (11.01%), AHPs (8.39%) and non-registered Nurses (6.8%) are within Trust target. The overall Trust vacancy rate for October is 9.85%, which compares favourably to the 11.09% rate in October 2016. The Registered Nursing & Midwifery vacancy rate increased from 12.87% in September to 13.28% in October. The tough financial times the Trust finds itself in has affected the ability to recruit Registered Nurses via initiatives that involve the upfront spending of money. As such, the Trust continues to try to recruit using traditional means, this is a difficult challenge in the current labour market. Whilst we make good progress in recruiting consultant and middle grade doctors, the number of vacancies the Trust carries in the doctor in training grade (57.45) as a result of us not getting the placements we require, puts added pressure on us as we try and fill these roles on a temporary basis to cover these gaps. We are exploring opportunities to pilot alternative roles, such as Physician Associates, to cover these gaps in the longer term. The Allied Health Professional staff group has again seen a reduction in the vacancy rate, down from 13.73% in April to 8.39% in October.
Vacancy rate Comparison
Oct '17 Sept '17 Oct '16
Trust 9.85% 9.73% 11.09%
Medical & Dental 15.42% 16.08% 13.16%
Registered Nursing 13.28% 12.87% 12.66%
AHP's 8.39% 8.87% 10.69%
0.00%
5.00%
10.00%
15.00%
20.00%
Nov'16
Dec'16
Jan'17
Feb'17
Mar'17
Apr'17
May'17
Jun'17
Jul'17
Aug'17
Sep'17
Oct'17
Month Ending
ULH Percentage Vacancy Rates
Trust
N&M Reg
M&D
AHP
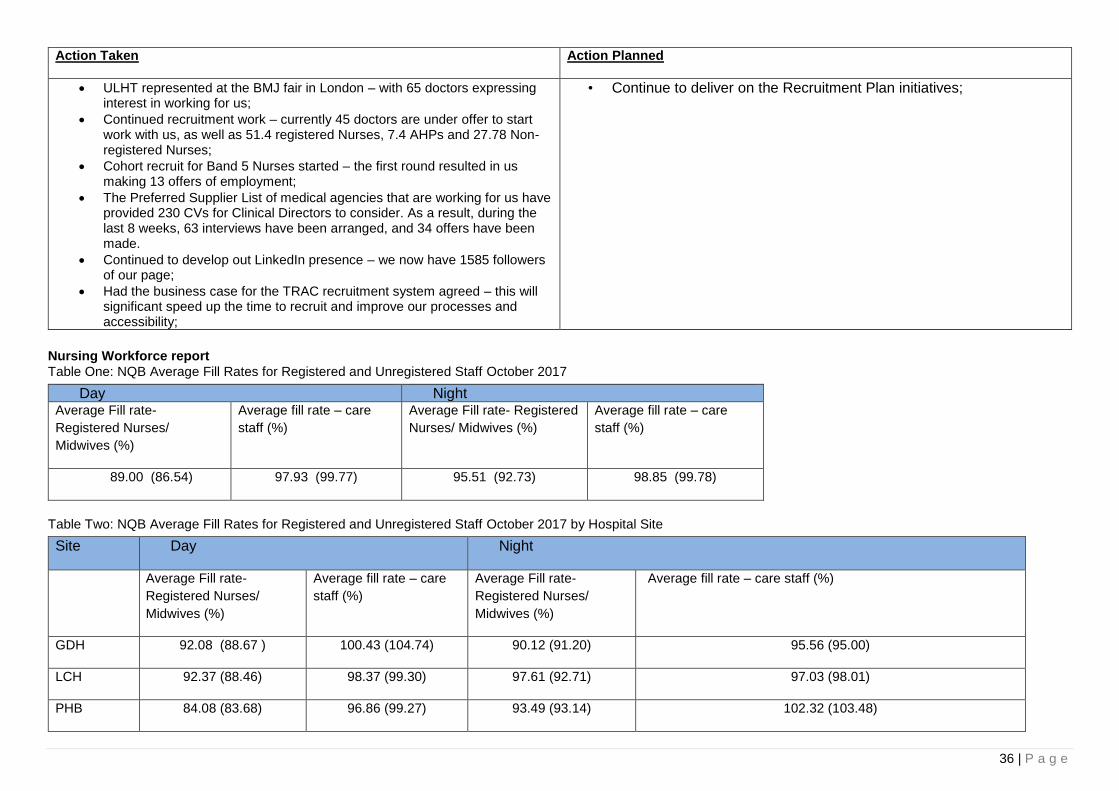
36 | P a g e
Action Taken
Action Planned
ULHT represented at the BMJ fair in London – with 65 doctors expressing interest in working for us;
Continued recruitment work – currently 45 doctors are under offer to start work with us, as well as 51.4 registered Nurses, 7.4 AHPs and 27.78 Non-registered Nurses;
Cohort recruit for Band 5 Nurses started – the first round resulted in us making 13 offers of employment;
The Preferred Supplier List of medical agencies that are working for us have provided 230 CVs for Clinical Directors to consider. As a result, during the last 8 weeks, 63 interviews have been arranged, and 34 offers have been made.
Continued to develop out LinkedIn presence – we now have 1585 followers of our page;
Had the business case for the TRAC recruitment system agreed – this will significant speed up the time to recruit and improve our processes and accessibility;
• Continue to deliver on the Recruitment Plan initiatives;
Nursing Workforce report
Table One: NQB Average Fill Rates for Registered and Unregistered Staff October 2017
Table Two: NQB Average Fill Rates for Registered and Unregistered Staff October 2017 by Hospital Site
Day Night Average Fill rate-
Registered Nurses/
Midwives (%)
Average fill rate – care
staff (%)
Average Fill rate- Registered
Nurses/ Midwives (%)
Average fill rate – care
staff (%)
89.00 (86.54) 97.93 (99.77) 95.51 (92.73) 98.85 (99.78)
Site Day Night
Average Fill rate-
Registered Nurses/
Midwives (%)
Average fill rate – care
staff (%)
Average Fill rate-
Registered Nurses/
Midwives (%)
Average fill rate – care staff (%)
GDH 92.08 (88.67 ) 100.43 (104.74) 90.12 (91.20) 95.56 (95.00)
LCH 92.37 (88.46) 98.37 (99.30) 97.61 (92.71) 97.03 (98.01)
PHB 84.08 (83.68) 96.86 (99.27) 93.49 (93.14) 102.32 (103.48)
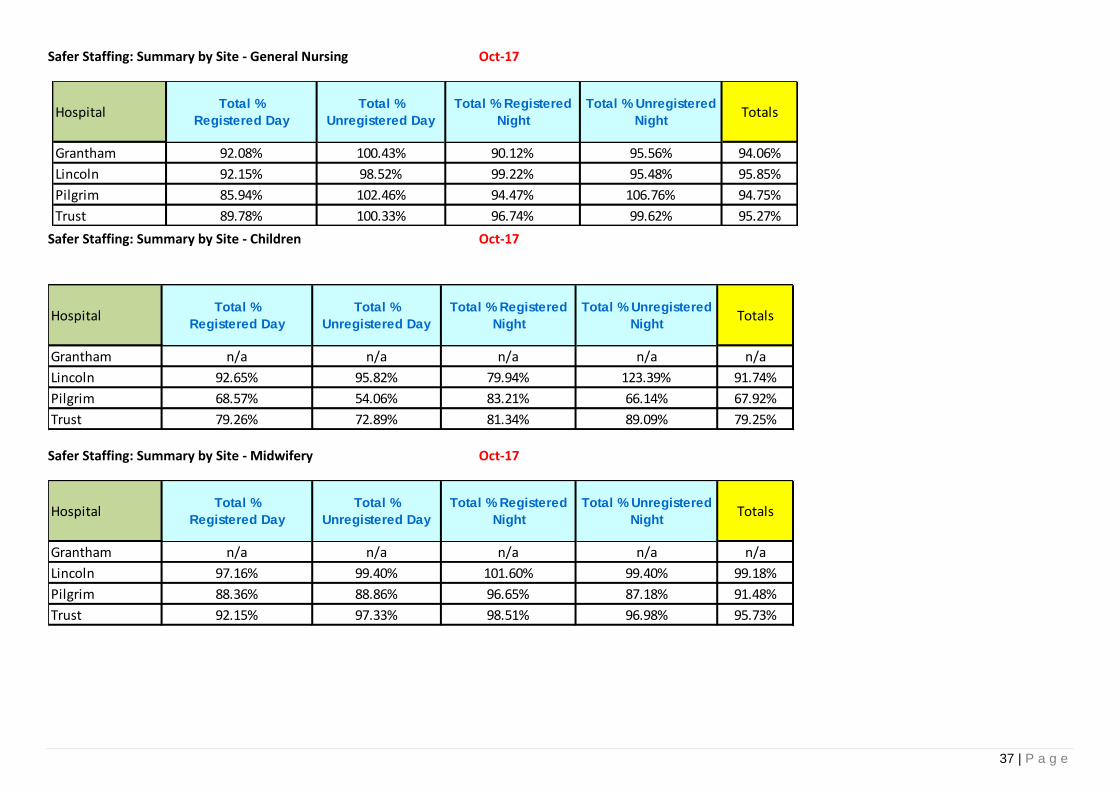
37 | P a g e
Safer Staffing: Summary by Site - General Nursing Oct-17
Safer Staffing: Summary by Site - Children Oct-17
Safer Staffing: Summary by Site - Midwifery Oct-17
Grantham 92.08% 100.43% 90.12% 95.56% 94.06%
Lincoln 92.15% 98.52% 99.22% 95.48% 95.85%
Pilgrim 85.94% 102.46% 94.47% 106.76% 94.75%
Trust 89.78% 100.33% 96.74% 99.62% 95.27%
TotalsHospitalTotal %
Registered Day
Total %
Unregistered Day
Total % Registered
Night
Total % Unregistered
Night
Grantham n/a n/a n/a n/a n/a
Lincoln 92.65% 95.82% 79.94% 123.39% 91.74%
Pilgrim 68.57% 54.06% 83.21% 66.14% 67.92%
Trust 79.26% 72.89% 81.34% 89.09% 79.25%
TotalsHospitalTotal %
Registered Day
Total %
Unregistered Day
Total % Registered
Night
Total % Unregistered
Night
Grantham n/a n/a n/a n/a n/a
Lincoln 97.16% 99.40% 101.60% 99.40% 99.18%
Pilgrim 88.36% 88.86% 96.65% 87.18% 91.48%
Trust 92.15% 97.33% 98.51% 96.98% 95.73%
TotalsHospitalTotal %
Registered Day
Total %
Unregistered Day
Total % Registered
Night
Total % Unregistered
Night
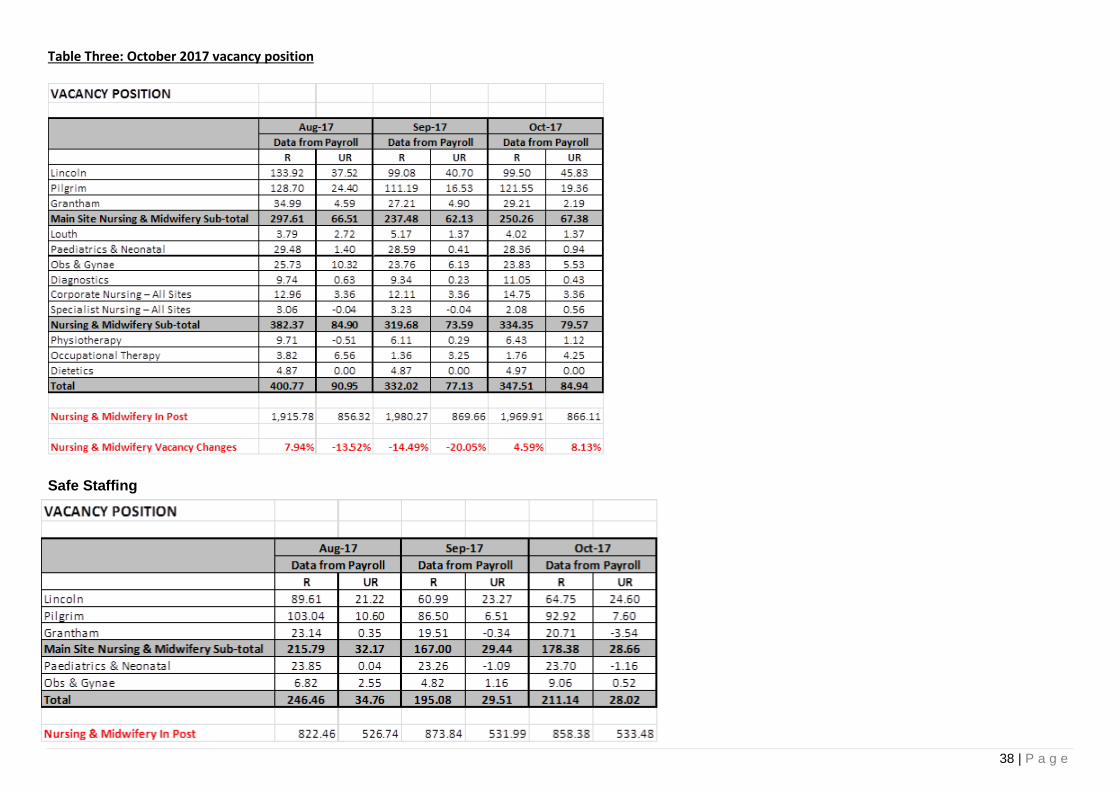
38 | P a g e
Table Three: October 2017 vacancy position
Safe Staffing

39 | P a g e
Table Four: Summary of October 2017 figures against Agency (framework and cap)
Table Five: Agency/bank/substantive skill mix by site. To further inform the staffing position, we calculate the percentage of registered temporary staffing deployed within Nursing along with the % of Registered Agency staff deployed at the Lincoln and Pilgrim sites.
Staff Group Week Commencing 02/10/2017 09/10/2017 16/10/2017 23/10/2017 30/10/2017
Nursing, Midwifery & Health Visiting Framework only 0 0 0 0 0
Nursing, Midwifery & Health Visiting Price cap only 407 394 362 384 352
Nursing, Midwifery & Health Visiting Both framework & price cap 0 0 0 0 0
Healthcare assistant and other support Framework only 0 0 0 0 0
Healthcare assistant and other support Price cap only 0 0 0 0 0
Healthcare assistant and other support Both framework & price cap 0 0 0 0 0
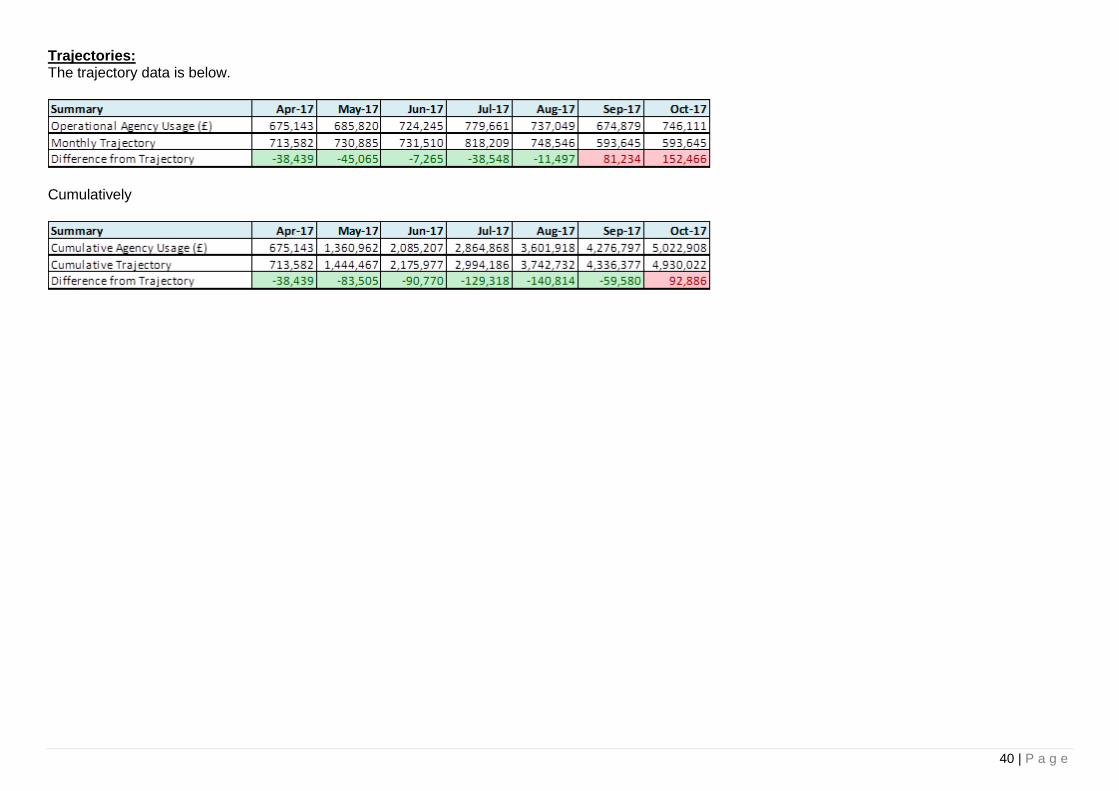
40 | P a g e
Trajectories: The trajectory data is below.
Cumulatively
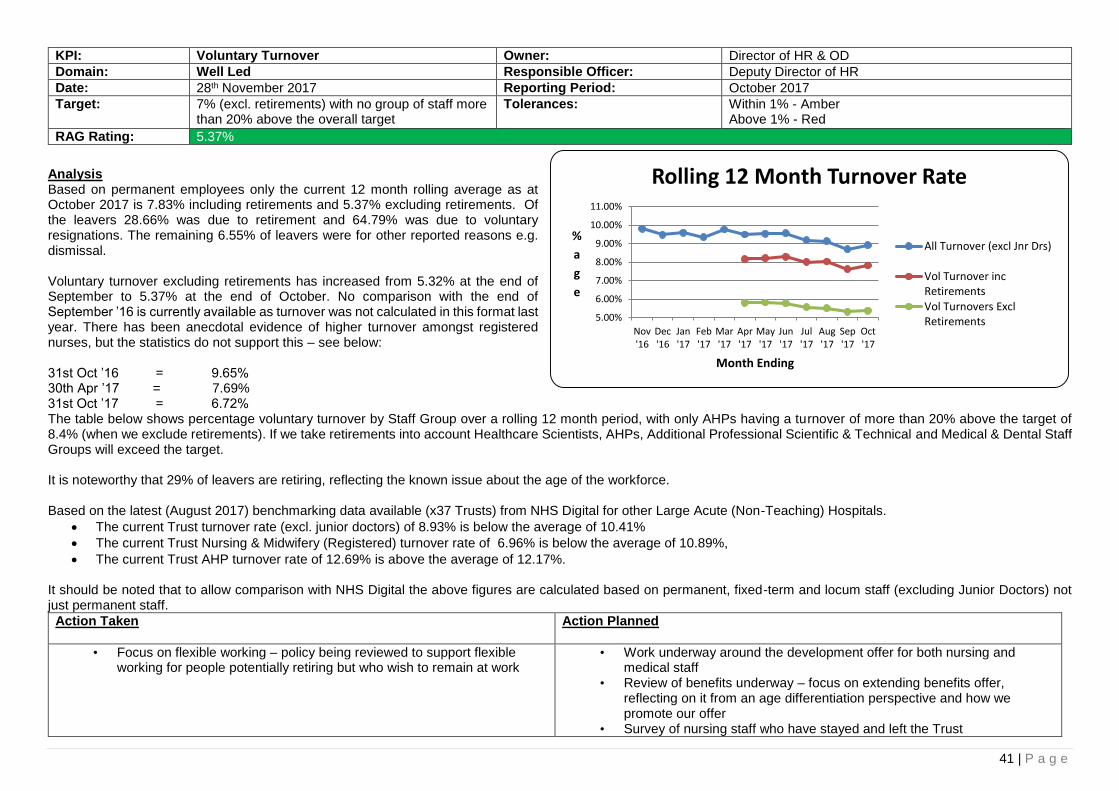
41 | P a g e
KPI: Voluntary Turnover Owner: Director of HR & OD
Domain: Well Led Responsible Officer: Deputy Director of HR
Date: 28th November 2017 Reporting Period: October 2017
Target: 7% (excl. retirements) with no group of staff more than 20% above the overall target
Tolerances: Within 1% - Amber Above 1% - Red
RAG Rating: 5.37%
Analysis Based on permanent employees only the current 12 month rolling average as at October 2017 is 7.83% including retirements and 5.37% excluding retirements. Of the leavers 28.66% was due to retirement and 64.79% was due to voluntary resignations. The remaining 6.55% of leavers were for other reported reasons e.g. dismissal. Voluntary turnover excluding retirements has increased from 5.32% at the end of September to 5.37% at the end of October. No comparison with the end of September ’16 is currently available as turnover was not calculated in this format last year. There has been anecdotal evidence of higher turnover amongst registered nurses, but the statistics do not support this – see below: 31st Oct ’16 = 9.65% 30th Apr ’17 = 7.69% 31st Oct ’17 = 6.72% The table below shows percentage voluntary turnover by Staff Group over a rolling 12 month period, with only AHPs having a turnover of more than 20% above the target of 8.4% (when we exclude retirements). If we take retirements into account Healthcare Scientists, AHPs, Additional Professional Scientific & Technical and Medical & Dental Staff Groups will exceed the target. It is noteworthy that 29% of leavers are retiring, reflecting the known issue about the age of the workforce. Based on the latest (August 2017) benchmarking data available (x37 Trusts) from NHS Digital for other Large Acute (Non-Teaching) Hospitals.
The current Trust turnover rate (excl. junior doctors) of 8.93% is below the average of 10.41%
The current Trust Nursing & Midwifery (Registered) turnover rate of 6.96% is below the average of 10.89%,
The current Trust AHP turnover rate of 12.69% is above the average of 12.17%. It should be noted that to allow comparison with NHS Digital the above figures are calculated based on permanent, fixed-term and locum staff (excluding Junior Doctors) not just permanent staff.
Action Taken
Action Planned
• Focus on flexible working – policy being reviewed to support flexible working for people potentially retiring but who wish to remain at work
• Work underway around the development offer for both nursing and medical staff
• Review of benefits underway – focus on extending benefits offer, reflecting on it from an age differentiation perspective and how we promote our offer
• Survey of nursing staff who have stayed and left the Trust
5.00%
6.00%
7.00%
8.00%
9.00%
10.00%
11.00%
Nov'16
Dec'16
Jan'17
Feb'17
Mar'17
Apr'17
May'17
Jun'17
Jul'17
Aug'17
Sep'17
Oct'17
%
a
g
e
Month Ending
Rolling 12 Month Turnover Rate
All Turnover (excl Jnr Drs)
Vol Turnover incRetirementsVol Turnovers ExclRetirements
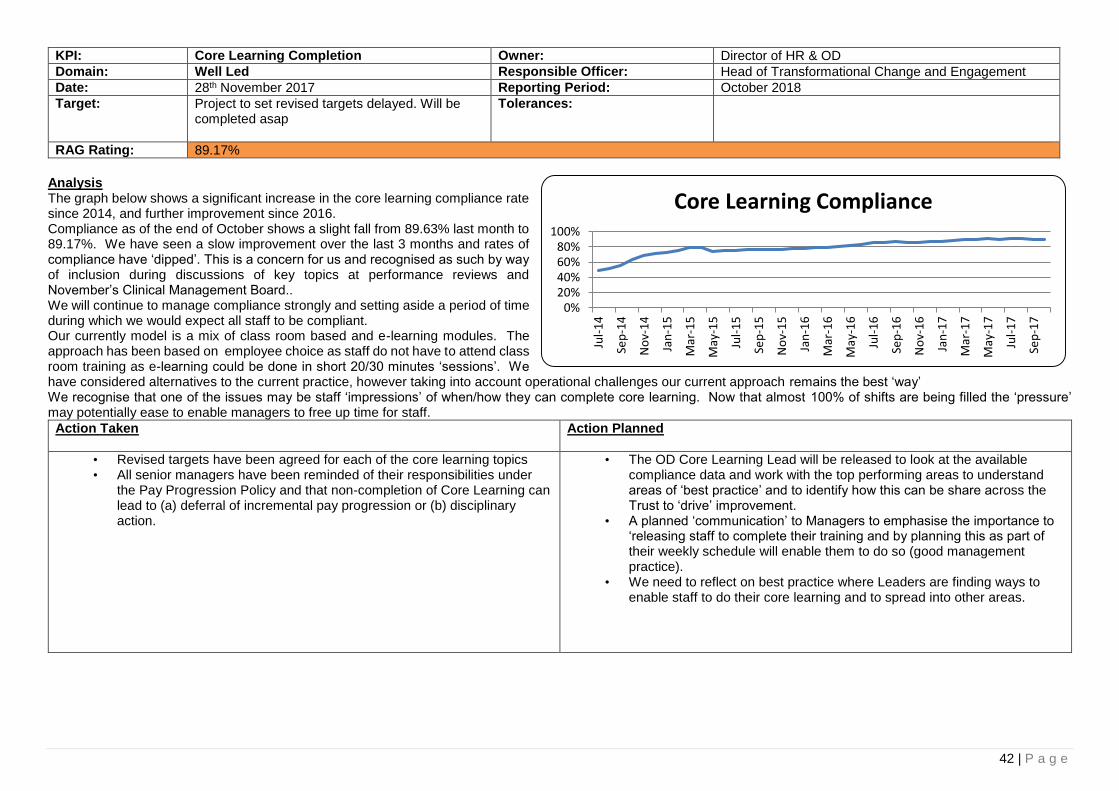
42 | P a g e
KPI: Core Learning Completion Owner: Director of HR & OD
Domain: Well Led Responsible Officer: Head of Transformational Change and Engagement
Date: 28th November 2017 Reporting Period: October 2018
Target: Project to set revised targets delayed. Will be completed asap
Tolerances:
RAG Rating: 89.17%
Analysis The graph below shows a significant increase in the core learning compliance rate since 2014, and further improvement since 2016. Compliance as of the end of October shows a slight fall from 89.63% last month to 89.17%. We have seen a slow improvement over the last 3 months and rates of compliance have ‘dipped’. This is a concern for us and recognised as such by way of inclusion during discussions of key topics at performance reviews and November’s Clinical Management Board.. We will continue to manage compliance strongly and setting aside a period of time during which we would expect all staff to be compliant. Our currently model is a mix of class room based and e-learning modules. The approach has been based on employee choice as staff do not have to attend class room training as e-learning could be done in short 20/30 minutes ‘sessions’. We have considered alternatives to the current practice, however taking into account operational challenges our current approach remains the best ‘way’ We recognise that one of the issues may be staff ‘impressions’ of when/how they can complete core learning. Now that almost 100% of shifts are being filled the ‘pressure’ may potentially ease to enable managers to free up time for staff.
Action Taken
Action Planned
• Revised targets have been agreed for each of the core learning topics • All senior managers have been reminded of their responsibilities under
the Pay Progression Policy and that non-completion of Core Learning can lead to (a) deferral of incremental pay progression or (b) disciplinary action.
• The OD Core Learning Lead will be released to look at the available compliance data and work with the top performing areas to understand areas of ‘best practice’ and to identify how this can be share across the Trust to ‘drive’ improvement.
• A planned ‘communication’ to Managers to emphasise the importance to ‘releasing staff to complete their training and by planning this as part of their weekly schedule will enable them to do so (good management practice).
• We need to reflect on best practice where Leaders are finding ways to enable staff to do their core learning and to spread into other areas.
0%20%40%60%80%
100%
Jul-
14
Sep
-14
No
v-1
4
Jan
-15
Mar
-15
May
-15
Jul-
15
Sep
-15
No
v-1
5
Jan
-16
Mar
-16
May
-16
Jul-
16
Sep
-16
No
v-1
6
Jan
-17
Mar
-17
May
-17
Jul-
17
Sep
-17
Core Learning Compliance

43 | P a g e
KPI: Sickness Absence Owner: Director of HR & OD
Domain: Well Led Responsible Officer: Assistant Director of HR
Date: 28th November 2017 Reporting Period: September 2017
Target: Overall target of 4.5% + no team over 25% above target
Tolerances: Within 0.5% - Amber Above 0.5% - Red
RAG Rating: 4.75%
Analysis The Trust annual rolling sickness rate of 4.75% (against 2017/18 target of 4.50%) has increased by 0.02% from the previous month. The 12 month rolling sickness rate as at the end of September 2017 has increased by 0.23% in comparison to the September 2016 figure (4.52%). The latest Benchmarking data as at July 2017 from NHS Digital (previously Health & Social Care Information Centre - HSCIC) indicates that ULHT has the 7th highest sickness rate (lowest at 3.03% and highest 5.57%) against an average of 4.28%. Of the eight staff groups the Trust has only two with sickness rates at or below the average, these being Administrative & Clerical and Healthcare Scientists. The benchmarking is done across x37 Large Acute Trusts.
Action Taken
Action Planned
Focus on the reduction of LTS cases by early intervention
Continuation of absence training as part of the leadership and management training, supporting having difficult conversations
Grantham hospital has reduced its sickness rate to 3.93% and a reduction in long term sickness cases by 65% since march 17
In March 2017 Estates and Facilities had 30 Active LTS cases and by the end of October 17 it has reduced to 10
October has seen a significant drop in LTS sickness cases in comparison to the previous months
8 further staff have been trained in mediation to support staff relationships and support retaining at work
• To implement a pilot for the streaming of reporting absences and triaging absences, based on outcomes this will be rolled out to the remaining sites
• 58% of front-line staff have had a flu vaccination. We need to vaccinate another 674 frontline staff by the end of Feb to reach the 70% target.
• Current focus and comms to be delivered on carrying out RTW’s as a campaign in increasing the completion of them
• To commence feedback to HON on LTS cases following the monthly review
• Based on trajectories and management of cases it is expected that this month’s figure showed evidence a reduction in the sickness rate
3.00%
3.50%
4.00%
4.50%
5.00%
Oct
'15
No
v '1
5
Dec
'15
Jan
'16
Feb
'16
Mar
'16
Ap
r'1
6
May
'16
Jun
'16
Jul '
16
Au
g '1
6
Sep
'16
Oct
'16
No
v '1
6
Dec
'16
Jan
'17
Feb
'17
Mar
'17
Ap
r'1
7
May
'17
Jun
'17
Jul'1
7
Au
g'1
7
Sep
'17
12 Months Ending
ULHT Annual Sickness Absence Rate(Target 4.5%)
Actual
Expon. (Actual)
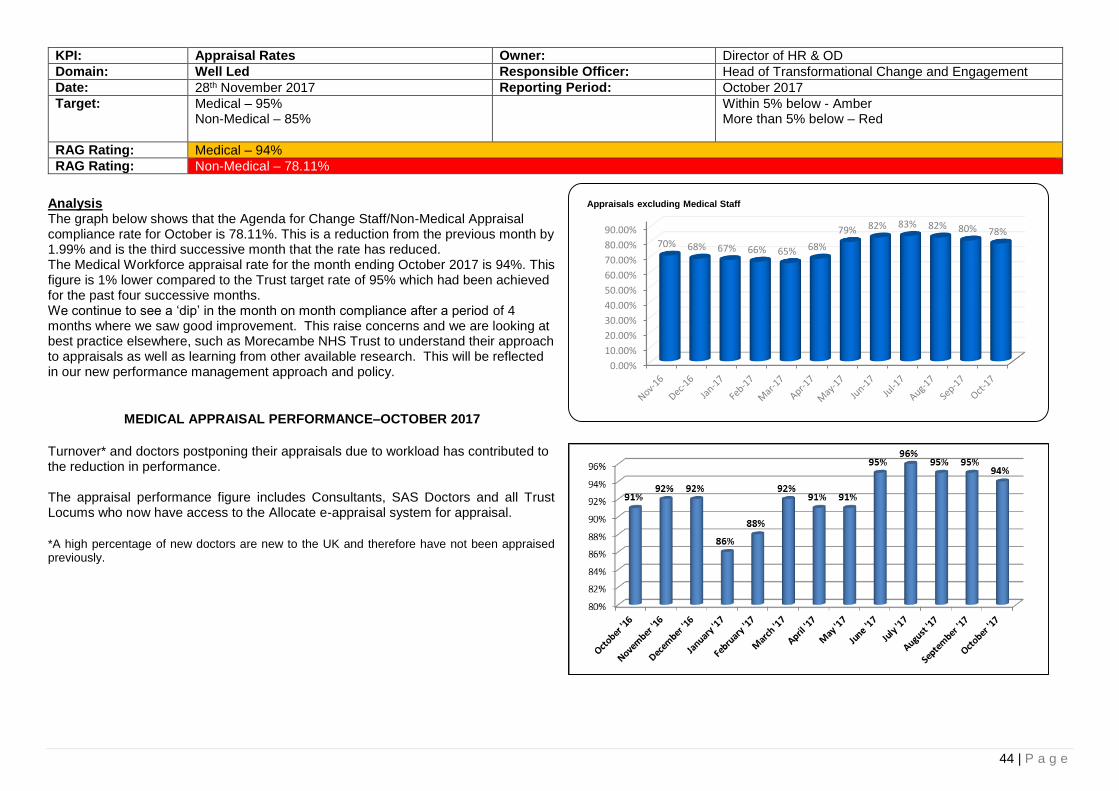
44 | P a g e
KPI: Appraisal Rates Owner: Director of HR & OD
Domain: Well Led Responsible Officer: Head of Transformational Change and Engagement
Date: 28th November 2017 Reporting Period: October 2017
Target: Medical – 95% Non-Medical – 85%
Within 5% below - Amber More than 5% below – Red
RAG Rating: Medical – 94%
RAG Rating: Non-Medical – 78.11%
Analysis The graph below shows that the Agenda for Change Staff/Non-Medical Appraisal compliance rate for October is 78.11%. This is a reduction from the previous month by 1.99% and is the third successive month that the rate has reduced. The Medical Workforce appraisal rate for the month ending October 2017 is 94%. This figure is 1% lower compared to the Trust target rate of 95% which had been achieved for the past four successive months. We continue to see a ‘dip’ in the month on month compliance after a period of 4 months where we saw good improvement. This raise concerns and we are looking at best practice elsewhere, such as Morecambe NHS Trust to understand their approach to appraisals as well as learning from other available research. This will be reflected in our new performance management approach and policy.
MEDICAL APPRAISAL PERFORMANCE–OCTOBER 2017
Turnover* and doctors postponing their appraisals due to workload has contributed to the reduction in performance. The appraisal performance figure includes Consultants, SAS Doctors and all Trust Locums who now have access to the Allocate e-appraisal system for appraisal.
*A high percentage of new doctors are new to the UK and therefore have not been appraised previously.
0.00%
10.00%
20.00%
30.00%
40.00%
50.00%
60.00%
70.00%
80.00%
90.00%
70% 68% 67% 66% 65% 68%
79% 82% 83% 82% 80% 78%
Appraisals excluding Medical Staff
45 | P a g e
Action Taken
Action Planned
Non-Medical
A new approach to Individual Performance Management has been drafted and feedback is being collated
League table of appraisals has been circulated
Senior managers have been notified of specific staff in their Directorates with outstanding appraisals
All senior managers were reminded of their responsibilities under the Pay Progression Policy to conduct annual appraisals and that not doing so could affect their incremental pay progression
Medical
Closer liaison with HR regarding notification of start dates for new doctors.
The schedule for appraisal has been brought forward from 6 months to 3 months to ensure doctors who are employed on short term contracts have the opportunity to participate in appraisal during their employment with ULHT.
Closer monitoring of sign off of appraisals. Reminders sent to Appraisers to complete Appraisal Output documentation and sign off appraisal documentation within 28 days of the appraisal meeting in order to meet the GMC requirements.
Notification of ‘Appraisal Due’ sent to Doctors 4 months prior to their appraisal month. Strict adherence to the escalation processes set out in the Medical Appraisal Policy, with particular focus on the allocation of appraiser to appraisee 6 weeks prior to the appraisal due date if the doctor has not confirmed appraisal details.
Non-Medical
Areas which were targeted with specific senior managers will be followed up to identify if there have been any improvements
The draft Performance Management approach will be revised to take account of feedback and wider consultation will take place
Medical • Proposal to meet newly appointed Doctors at Trust Induction in order to introduce
ourselves and highlight processes in respect of Medical Revalidation and Appraisal. There is a plan in place for each doctor, for whom this is their first post in the UK, to participate in appraisal within 3 months of their start date with the Trust.
• The Revalidation Office continues to closely monitor and take prompt action when appraisals are not undertaken as planned. The e-appraisal system allows the Administrator to track progress with timely completion of appraisal documentation. This enables early intervention and support to both appraisee and appraiser.
• Proposal to increase the administration support to the Revalidation Office (0.53 of Band 2) to ensure improved governance to Revalidation processes. Initial proposal not supported.
• Provide Clinical Directors with monthly reports of appraisal performance within their areas of responsibility.
• Continue to closely monitor appraisal progress on the e-allocate appraisal system. • Ensuring new and existing doctors receive continued support to use the new
Allocate system.

46 | P a g e
KPI: Agency Spend Owner: Director of HR/OD
Domain: Money & Resources Responsible Officer: Various leads on different aspects of agency spend
Date: 28th November 2017 Reporting Period: October 2017
RAG Rating: Actual spend of £2.601m, against target of £1.75m
Analysis The table below shows agency spend in the last 12 months. In October there has been an increase of £129,214, from the previous month, spend is significantly above target and £527,870 higher than the level of spend in October 2016. Of the £2,600,784 spent on Agency staff in October, £1,695,873 was spent on Medical and Dental staff, £664,225 was spent on Nursing staff (including HCSW’s), £64,714 was spent on STT staff and £175,972 was spent on Other staff (including Admin & Clerical staff).
Action Taken
Action Planned
Weekly pay introduced for nursing staff
All “other” agency spend been through a review process and spend reductions should flow through shortly
Continued action to reduce vacancy rates
• Medical agency spend review process revamped • Medical bank planned • Review of nursing agency rates underway • Review of establishment/workforce planning exercise underway for the
18/19 year.
0250000500000750000
10000001250000150000017500002000000225000025000002750000300000032500003500000
C
o
s
t
Month
ULH Agency Costs by Staff Group Total
Medical
Nursing
STT
Other
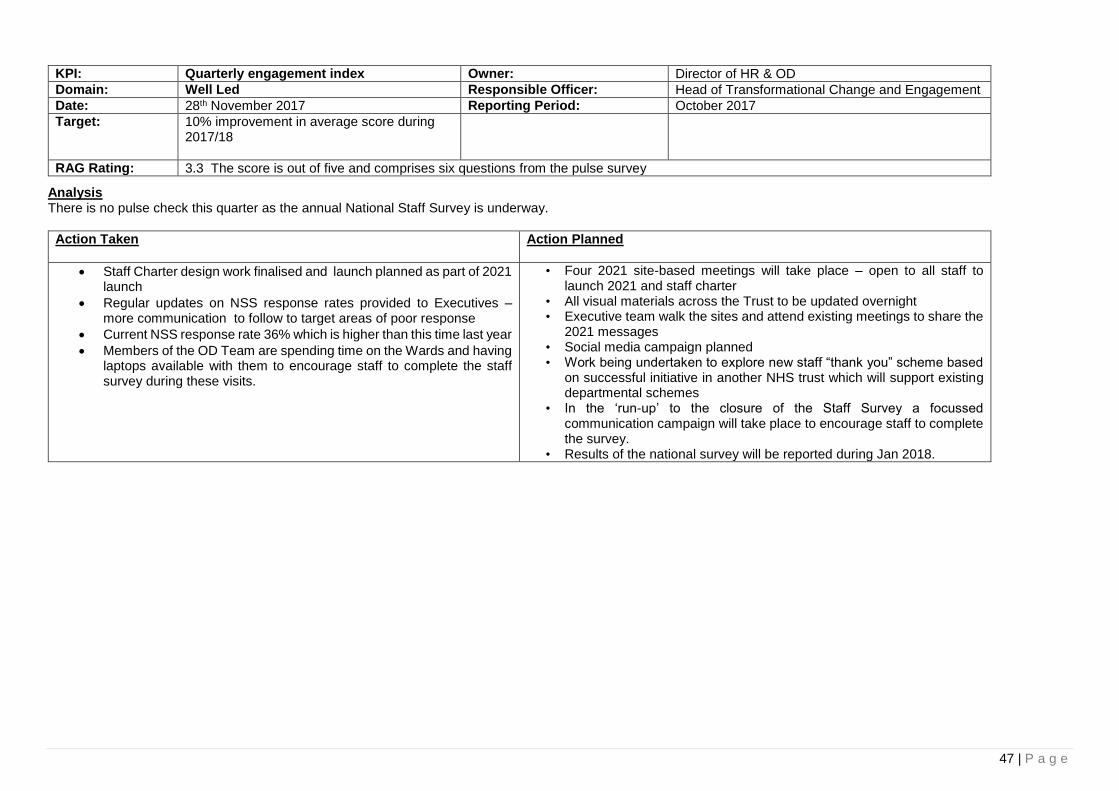
47 | P a g e
Analysis There is no pulse check this quarter as the annual National Staff Survey is underway.
Action Taken
Action Planned
Staff Charter design work finalised and launch planned as part of 2021 launch
Regular updates on NSS response rates provided to Executives – more communication to follow to target areas of poor response
Current NSS response rate 36% which is higher than this time last year
Members of the OD Team are spending time on the Wards and having laptops available with them to encourage staff to complete the staff survey during these visits.
• Four 2021 site-based meetings will take place – open to all staff to launch 2021 and staff charter
• All visual materials across the Trust to be updated overnight • Executive team walk the sites and attend existing meetings to share the
2021 messages • Social media campaign planned • Work being undertaken to explore new staff “thank you” scheme based
on successful initiative in another NHS trust which will support existing departmental schemes
• In the ‘run-up’ to the closure of the Staff Survey a focussed communication campaign will take place to encourage staff to complete the survey.
• Results of the national survey will be reported during Jan 2018.
KPI: Quarterly engagement index Owner: Director of HR & OD
Domain: Well Led Responsible Officer: Head of Transformational Change and Engagement
Date: 28th November 2017 Reporting Period: October 2017
Target: 10% improvement in average score during 2017/18
RAG Rating: 3.3 The score is out of five and comprises six questions from the pulse survey
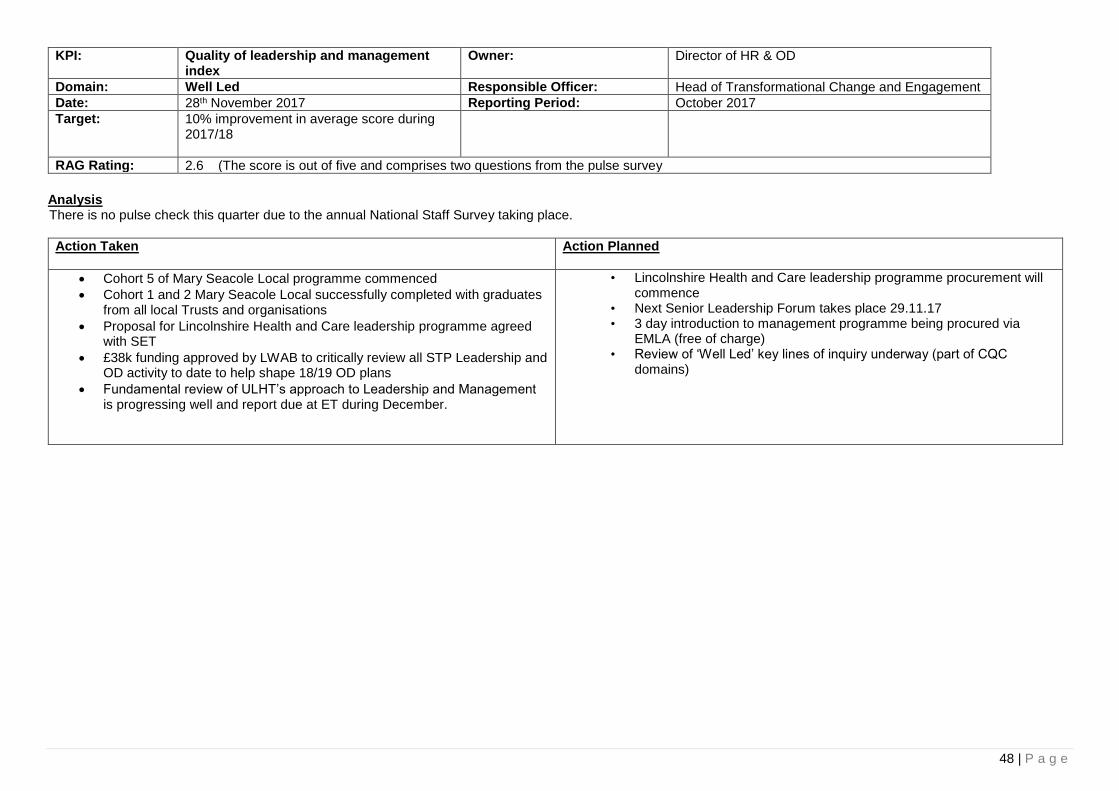
48 | P a g e
KPI: Quality of leadership and management index
Owner: Director of HR & OD
Domain: Well Led Responsible Officer: Head of Transformational Change and Engagement
Date: 28th November 2017 Reporting Period: October 2017
Target: 10% improvement in average score during 2017/18
RAG Rating: 2.6 (The score is out of five and comprises two questions from the pulse survey
Analysis There is no pulse check this quarter due to the annual National Staff Survey taking place.
Action Taken
Action Planned
Cohort 5 of Mary Seacole Local programme commenced
Cohort 1 and 2 Mary Seacole Local successfully completed with graduates from all local Trusts and organisations
Proposal for Lincolnshire Health and Care leadership programme agreed with SET
£38k funding approved by LWAB to critically review all STP Leadership and OD activity to date to help shape 18/19 OD plans
Fundamental review of ULHT’s approach to Leadership and Management is progressing well and report due at ET during December.
• Lincolnshire Health and Care leadership programme procurement will commence
• Next Senior Leadership Forum takes place 29.11.17 • 3 day introduction to management programme being procured via
EMLA (free of charge) • Review of ‘Well Led’ key lines of inquiry underway (part of CQC
domains)
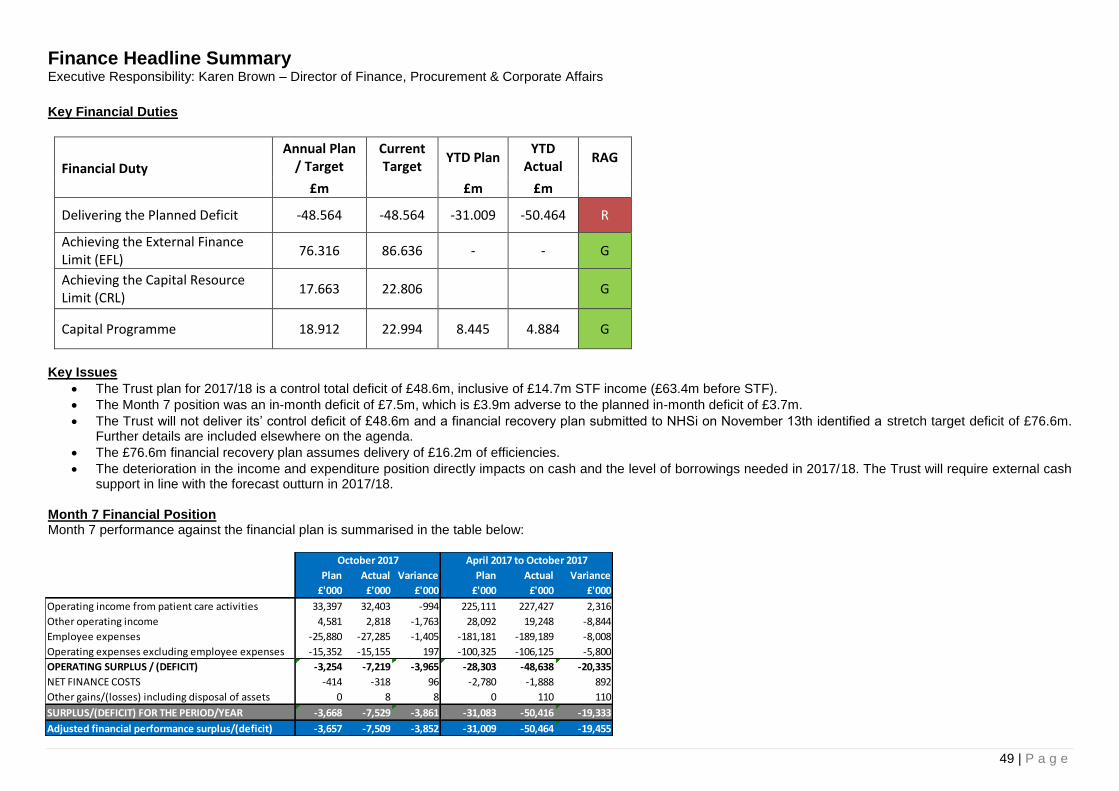
49 | P a g e
Finance Headline Summary Executive Responsibility: Karen Brown – Director of Finance, Procurement & Corporate Affairs
Key Financial Duties
Financial Duty
Annual Plan / Target
Current Target
YTD Plan YTD
Actual RAG
£m £m £m
Delivering the Planned Deficit -48.564 -48.564 -31.009 -50.464 R
Achieving the External Finance Limit (EFL)
76.316 86.636 - - G
Achieving the Capital Resource Limit (CRL)
17.663 22.806 G
Capital Programme 18.912 22.994 8.445 4.884 G
Key Issues
The Trust plan for 2017/18 is a control total deficit of £48.6m, inclusive of £14.7m STF income (£63.4m before STF).
The Month 7 position was an in-month deficit of £7.5m, which is £3.9m adverse to the planned in-month deficit of £3.7m.
The Trust will not deliver its’ control deficit of £48.6m and a financial recovery plan submitted to NHSi on November 13th identified a stretch target deficit of £76.6m. Further details are included elsewhere on the agenda.
The £76.6m financial recovery plan assumes delivery of £16.2m of efficiencies.
The deterioration in the income and expenditure position directly impacts on cash and the level of borrowings needed in 2017/18. The Trust will require external cash support in line with the forecast outturn in 2017/18.
Month 7 Financial Position Month 7 performance against the financial plan is summarised in the table below:
Plan Actual Variance Plan Actual Variance
£'000 £'000 £'000 £'000 £'000 £'000
Operating income from patient care activities 33,397 32,403 -994 225,111 227,427 2,316
Other operating income 4,581 2,818 -1,763 28,092 19,248 -8,844
Employee expenses -25,880 -27,285 -1,405 -181,181 -189,189 -8,008
Operating expenses excluding employee expenses -15,352 -15,155 197 -100,325 -106,125 -5,800
OPERATING SURPLUS / (DEFICIT) -3,254 -7,219 -3,965 -28,303 -48,638 -20,335
NET FINANCE COSTS -414 -318 96 -2,780 -1,888 892
Other gains/(losses) including disposal of assets 0 8 8 0 110 110
SURPLUS/(DEFICIT) FOR THE PERIOD/YEAR -3,668 -7,529 -3,861 -31,083 -50,416 -19,333
Adjusted financial performance surplus/(deficit) -3,657 -7,509 -3,852 -31,009 -50,464 -19,455
October 2017 April 2017 to October 2017
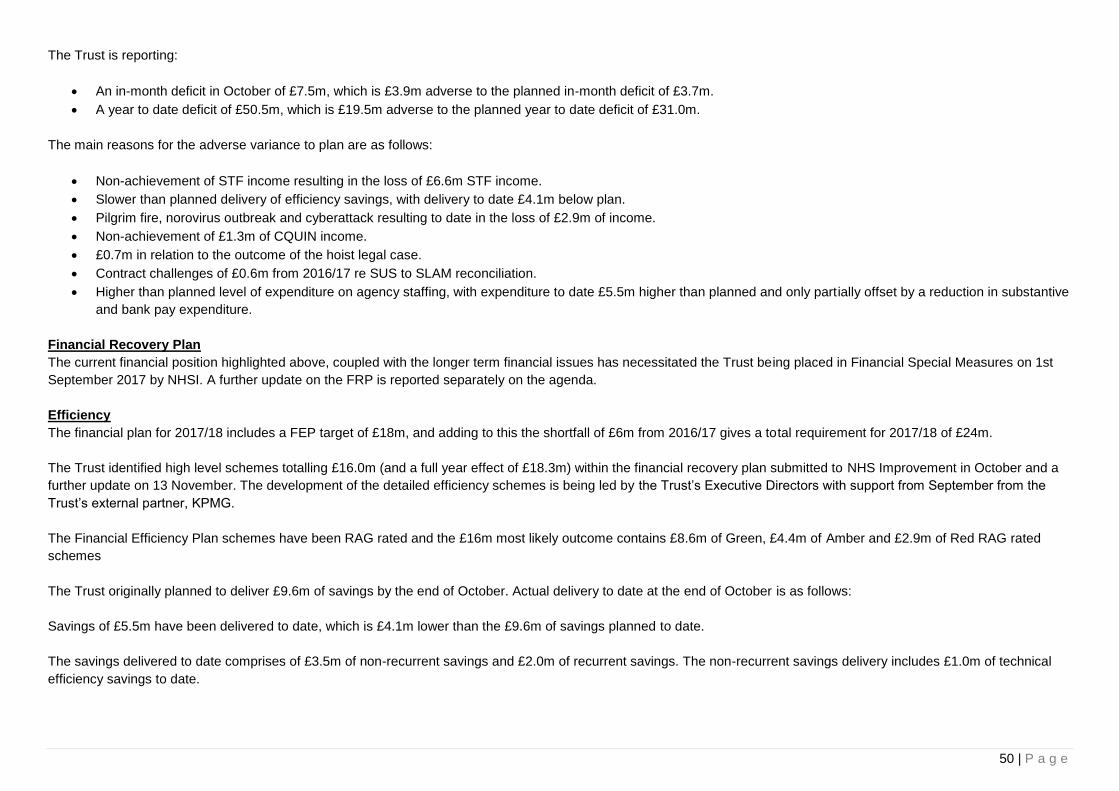
50 | P a g e
The Trust is reporting:
An in-month deficit in October of £7.5m, which is £3.9m adverse to the planned in-month deficit of £3.7m.
A year to date deficit of £50.5m, which is £19.5m adverse to the planned year to date deficit of £31.0m.
The main reasons for the adverse variance to plan are as follows:
Non-achievement of STF income resulting in the loss of £6.6m STF income.
Slower than planned delivery of efficiency savings, with delivery to date £4.1m below plan.
Pilgrim fire, norovirus outbreak and cyberattack resulting to date in the loss of £2.9m of income.
Non-achievement of £1.3m of CQUIN income.
£0.7m in relation to the outcome of the hoist legal case.
Contract challenges of £0.6m from 2016/17 re SUS to SLAM reconciliation.
Higher than planned level of expenditure on agency staffing, with expenditure to date £5.5m higher than planned and only partially offset by a reduction in substantive
and bank pay expenditure.
Financial Recovery Plan
The current financial position highlighted above, coupled with the longer term financial issues has necessitated the Trust being placed in Financial Special Measures on 1st
September 2017 by NHSI. A further update on the FRP is reported separately on the agenda.
Efficiency
The financial plan for 2017/18 includes a FEP target of £18m, and adding to this the shortfall of £6m from 2016/17 gives a total requirement for 2017/18 of £24m.
The Trust identified high level schemes totalling £16.0m (and a full year effect of £18.3m) within the financial recovery plan submitted to NHS Improvement in October and a
further update on 13 November. The development of the detailed efficiency schemes is being led by the Trust’s Executive Directors with support from September from the
Trust’s external partner, KPMG.
The Financial Efficiency Plan schemes have been RAG rated and the £16m most likely outcome contains £8.6m of Green, £4.4m of Amber and £2.9m of Red RAG rated
schemes
The Trust originally planned to deliver £9.6m of savings by the end of October. Actual delivery to date at the end of October is as follows:
Savings of £5.5m have been delivered to date, which is £4.1m lower than the £9.6m of savings planned to date.
The savings delivered to date comprises of £3.5m of non-recurrent savings and £2.0m of recurrent savings. The non-recurrent savings delivery includes £1.0m of technical
efficiency savings to date.
51 | P a g e
Capital
The spend to date of £4.9m inclusive of £1.3m Pre-commitments including £0.7m for Neonates and £0.4m Lincoln Specialist Rehab. £1.1m for Medical Equipment and £0.9m
for IT development. The remainder for Backlog Maintenance, CQC and Service Development & Modernisation total £1.6m. The spend to date of £34.9m is £3.5m lower than
plan.
The main drivers of the variance are as below:
CQC schemes are £0.9m lower than plan year to date mainly due to the slippage in the Pilgrim emergency call bells, Trust wide Digital Dictation and enabling works
to Lincoln 1st floor for 5th floor decant.
Backlog Maintenance including fire enforcement notice related expenditure are £1.7m behind the plan to date. Work is on-going at pace to ensure compliance within
the pre-determined timeframes.
IT Development/IT Service Development & Modernisation are £0.5m lower than plan to date. Continued Development of the Secondary ICT Server Room at Pilgrim
has been delayed as has the replacement of desktop PC’s with the New Clinical Desktop Environment.
Other minor schemes of £0.4m
Cash
At the close of October 2017 the Trust held cash of £2.1m. This includes external revenue support loans of £51.3m drawn over the first seven months.
The total ‘repayable’ borrowings through working capital loans, Salix loans and the uncommitted loan facility are currently £161.9m. The projected revenue borrowings
required in 2017/18 are £76.3m, of which £1.3m relates to deficit support from 2016/17. This has been revised in line with the forecast revenue position.
The Trust application for borrowing to address the Fire Enforcement Notice has been approved with £9.5m awarded in 2017/18.
The revenue cash draw down to support the forecast Income and expenditure during the year is shown below and highlights that the trust borrowings will increase in line with
the forecasted deficit for the year.
Agency
The table below shows that the upward trend on agency pay expenditure has been driven by an increase in agency expenditure in Medical staffing. Over the last six months,
despite rising to £2.0m in March and falling to £1.3m in July, agency expenditure on Medical staffing has averaged £1.5m per month in 2017/18.
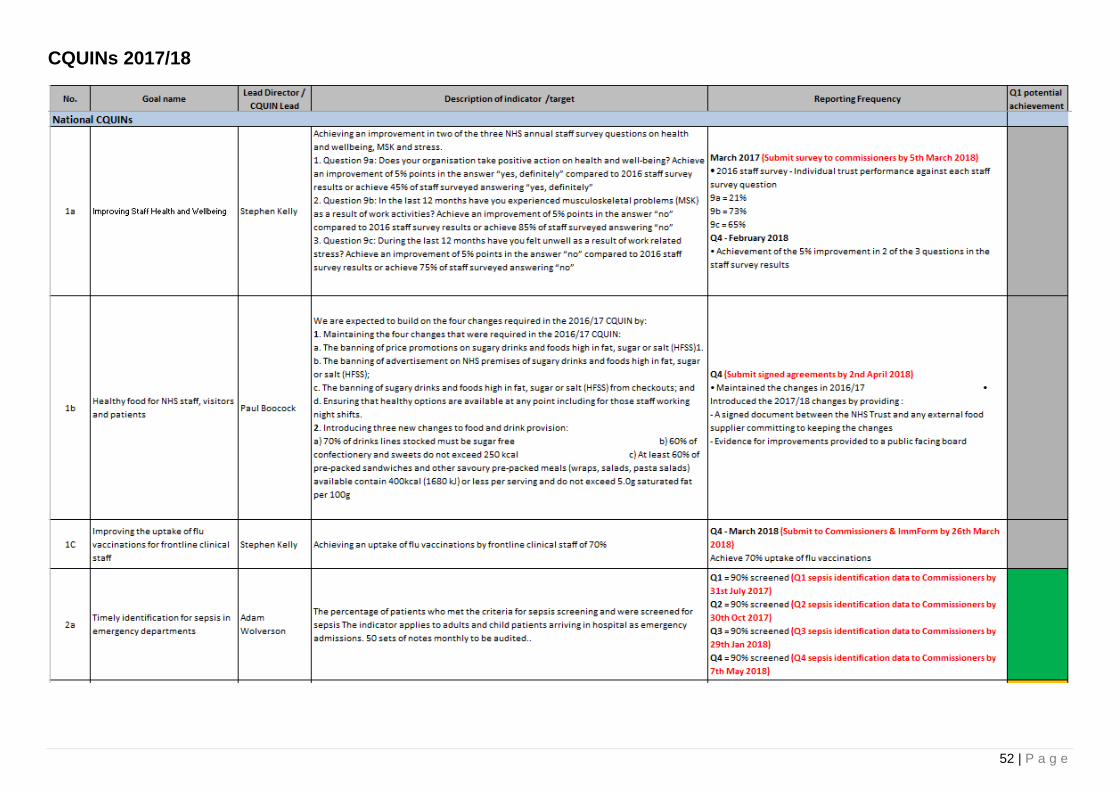
52 | P a g e
CQUINs 2017/18
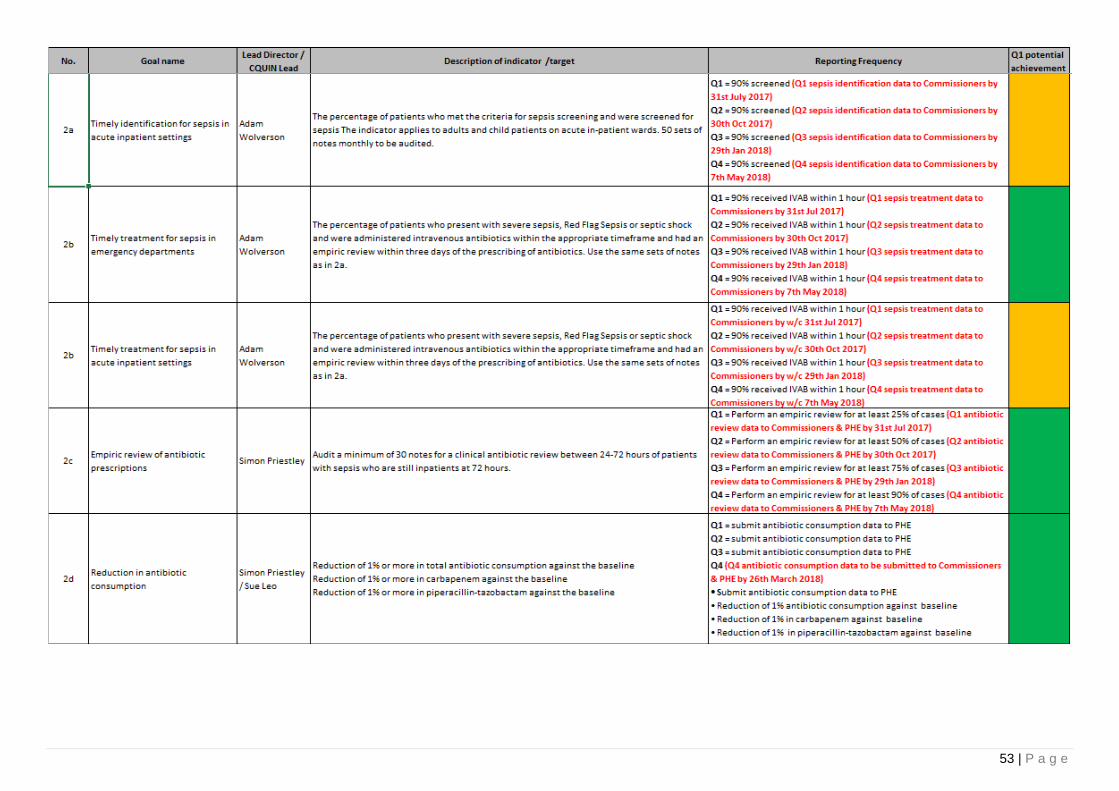
53 | P a g e
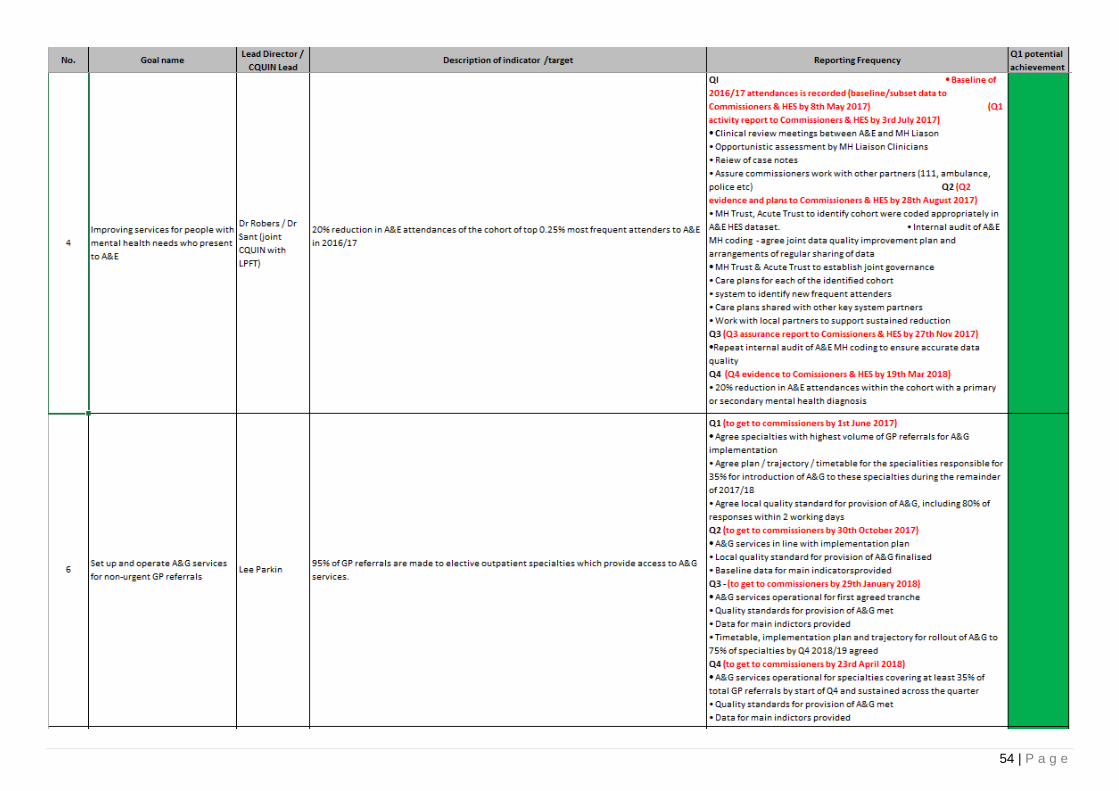
54 | P a g e
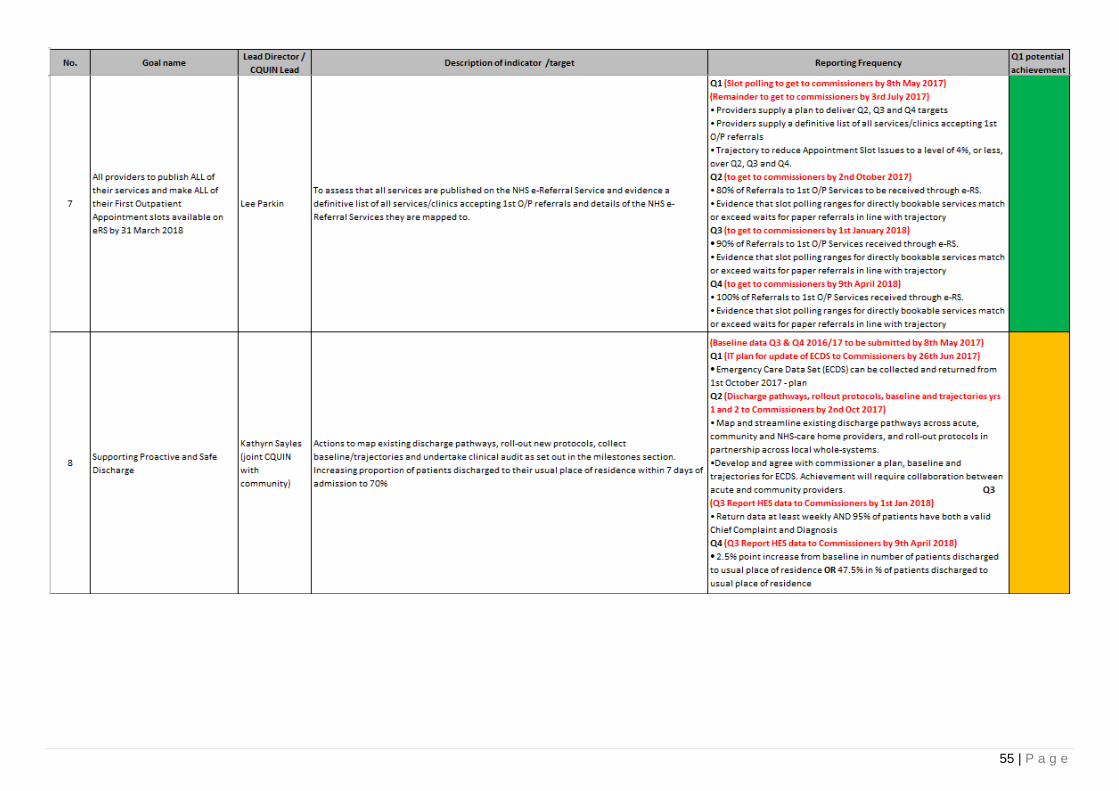
55 | P a g e

56 | P a g e
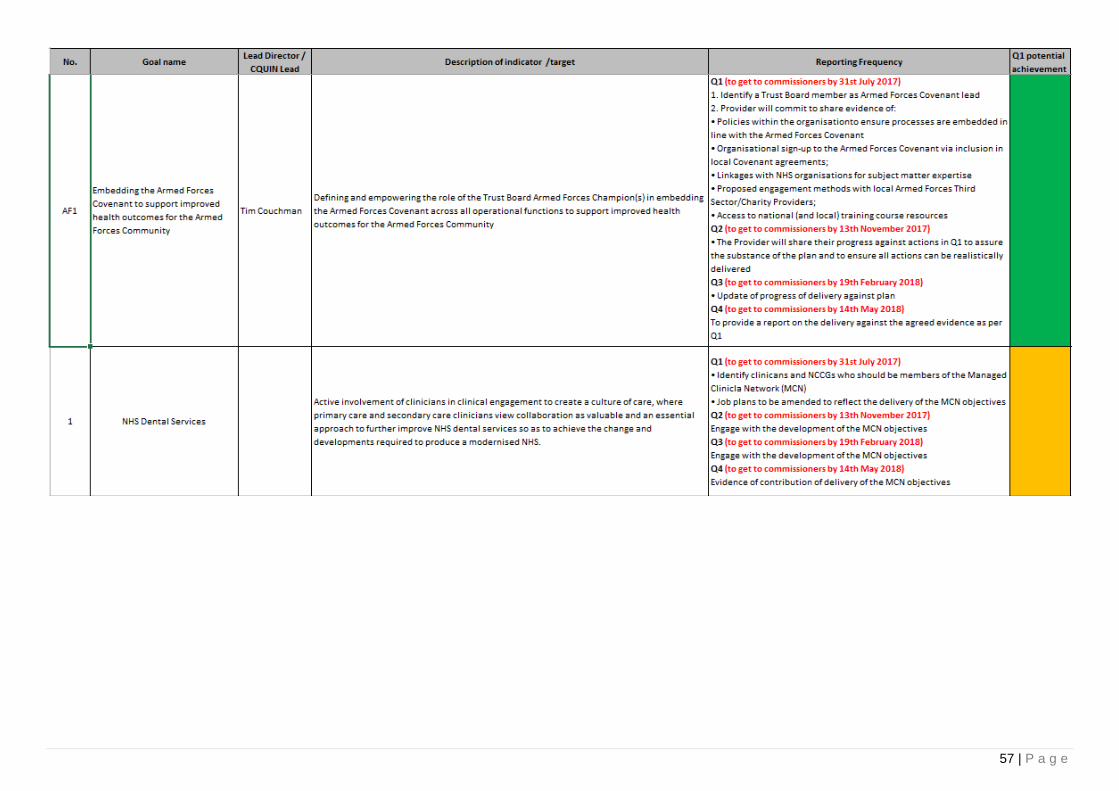
57 | P a g e
58 | P a g e
Equality Analysis Statement
United Lincolnshire Hospitals NHS Trust is fully committed to caring for all patients, service users, their families and carers, and staff in a manner which embraces, respects, promotes and celebrates equality and cultural diversity.
The Equality Act 2010 requires specific provision is made to consider the impact of services and functions for people who identify with one or more of the nine protected characteristics, and for public sector bodies to take proactive steps to:
• eliminate unlawful discrimination, harassment and victimisation and any other conduct prohibited by the Act;
• advance equality of opportunity between people who share a protected characteristic and people who do not share it; and
• foster good relations between people who share a protected characteristic and people who do not share it.
These are referred to as the three aims of the General Equality Duty.
The nine protected characteristics are:
Age
Disability
Gender reassignment
Marriage and civil partnership
Pregnancy and maternity
Race
Religion or belief
Sex
Sexual orientation
As a public sector body the Trust has a statutory duty to ensure all aspects of Trust business and functions are compliant with, and evidence due regard to, the Equality Act 2010.
As this performance paper is derived from a range of individual directorate reports, each report from respective directorates must be underpinned by equality analysis.
Trust Board is advised that whilst gaps in equality analysis currently exist, directorates should be held to account in respect of provision of structured and robust equality analysis to support their business.

59 | P a g e
Appendix 1. Glossary
MRSA bacteraemia Methicillin-resistant Staphylococcus aureus
MSSA Methicillin Sensitive Staphylococcus aureus
ECOLI Escherichia coli
UTIs Urinary tract infection
VTE Risk Assessment Venous thromboembolism
Overdue CAS alerts Central alerting system
SQD % Safety and Quality dashboard
eDD Electronic discharge document
PPCI Primary percutaneous coronary intervention
#NOF Fractured neck of femur
A&E Accident & Emergency
RTT Referral to Treatment
SHMI Summary Hospital level Mortality Indicator
LoS Length of Stay
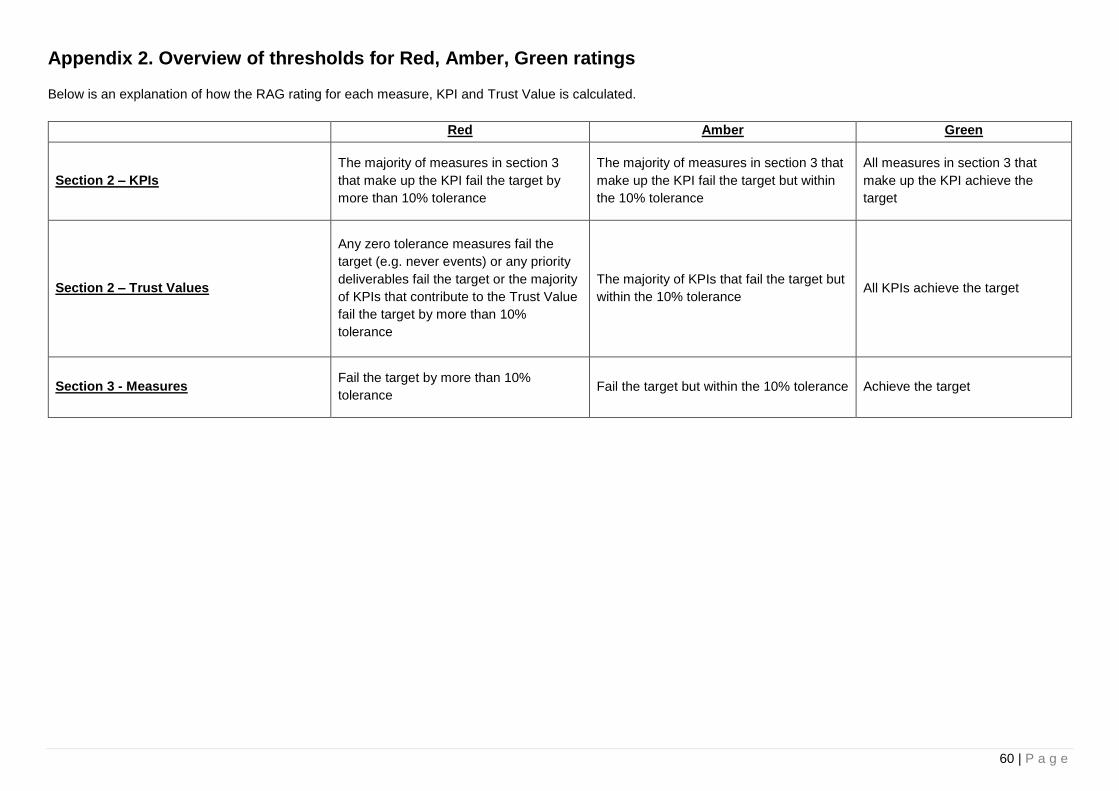
60 | P a g e
Appendix 2. Overview of thresholds for Red, Amber, Green ratings
Below is an explanation of how the RAG rating for each measure, KPI and Trust Value is calculated.
Red Amber Green
Section 2 – KPIs
The majority of measures in section 3
that make up the KPI fail the target by
more than 10% tolerance
The majority of measures in section 3 that
make up the KPI fail the target but within
the 10% tolerance
All measures in section 3 that
make up the KPI achieve the
target
Section 2 – Trust Values
Any zero tolerance measures fail the
target (e.g. never events) or any priority
deliverables fail the target or the majority
of KPIs that contribute to the Trust Value
fail the target by more than 10%
tolerance
The majority of KPIs that fail the target but
within the 10% tolerance All KPIs achieve the target
Section 3 - Measures Fail the target by more than 10%
tolerance Fail the target but within the 10% tolerance Achieve the target
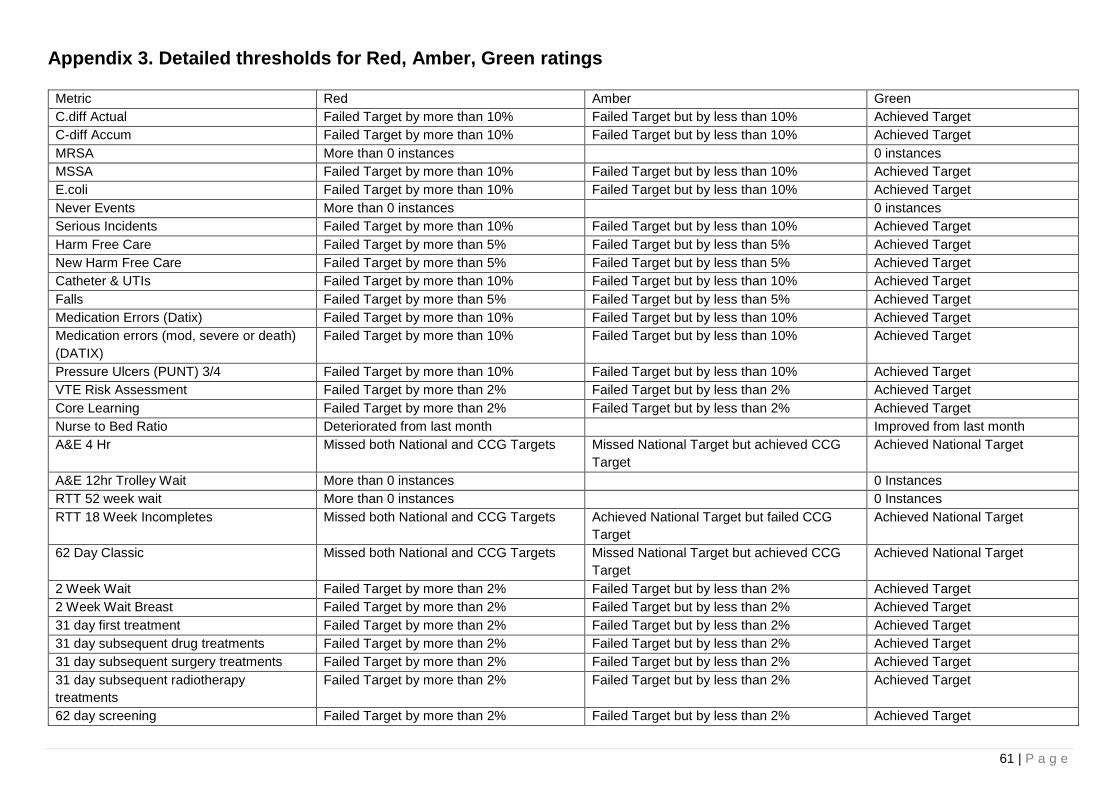
61 | P a g e
Appendix 3. Detailed thresholds for Red, Amber, Green ratings
Metric Red Amber Green
C.diff Actual Failed Target by more than 10% Failed Target but by less than 10% Achieved Target
C-diff Accum Failed Target by more than 10% Failed Target but by less than 10% Achieved Target
MRSA More than 0 instances 0 instances
MSSA Failed Target by more than 10% Failed Target but by less than 10% Achieved Target
E.coli Failed Target by more than 10% Failed Target but by less than 10% Achieved Target
Never Events More than 0 instances 0 instances
Serious Incidents Failed Target by more than 10% Failed Target but by less than 10% Achieved Target
Harm Free Care Failed Target by more than 5% Failed Target but by less than 5% Achieved Target
New Harm Free Care Failed Target by more than 5% Failed Target but by less than 5% Achieved Target
Catheter & UTIs Failed Target by more than 10% Failed Target but by less than 10% Achieved Target
Falls Failed Target by more than 5% Failed Target but by less than 5% Achieved Target
Medication Errors (Datix) Failed Target by more than 10% Failed Target but by less than 10% Achieved Target
Medication errors (mod, severe or death)
(DATIX)
Failed Target by more than 10% Failed Target but by less than 10% Achieved Target
Pressure Ulcers (PUNT) 3/4 Failed Target by more than 10% Failed Target but by less than 10% Achieved Target
VTE Risk Assessment Failed Target by more than 2% Failed Target but by less than 2% Achieved Target
Core Learning Failed Target by more than 2% Failed Target but by less than 2% Achieved Target
Nurse to Bed Ratio Deteriorated from last month Improved from last month
A&E 4 Hr Missed both National and CCG Targets Missed National Target but achieved CCG
Target
Achieved National Target
A&E 12hr Trolley Wait More than 0 instances 0 Instances
RTT 52 week wait More than 0 instances 0 Instances
RTT 18 Week Incompletes Missed both National and CCG Targets Achieved National Target but failed CCG
Target
Achieved National Target
62 Day Classic Missed both National and CCG Targets Missed National Target but achieved CCG
Target
Achieved National Target
2 Week Wait Failed Target by more than 2% Failed Target but by less than 2% Achieved Target
2 Week Wait Breast Failed Target by more than 2% Failed Target but by less than 2% Achieved Target
31 day first treatment Failed Target by more than 2% Failed Target but by less than 2% Achieved Target
31 day subsequent drug treatments Failed Target by more than 2% Failed Target but by less than 2% Achieved Target
31 day subsequent surgery treatments Failed Target by more than 2% Failed Target but by less than 2% Achieved Target
31 day subsequent radiotherapy
treatments
Failed Target by more than 2% Failed Target but by less than 2% Achieved Target
62 day screening Failed Target by more than 2% Failed Target but by less than 2% Achieved Target
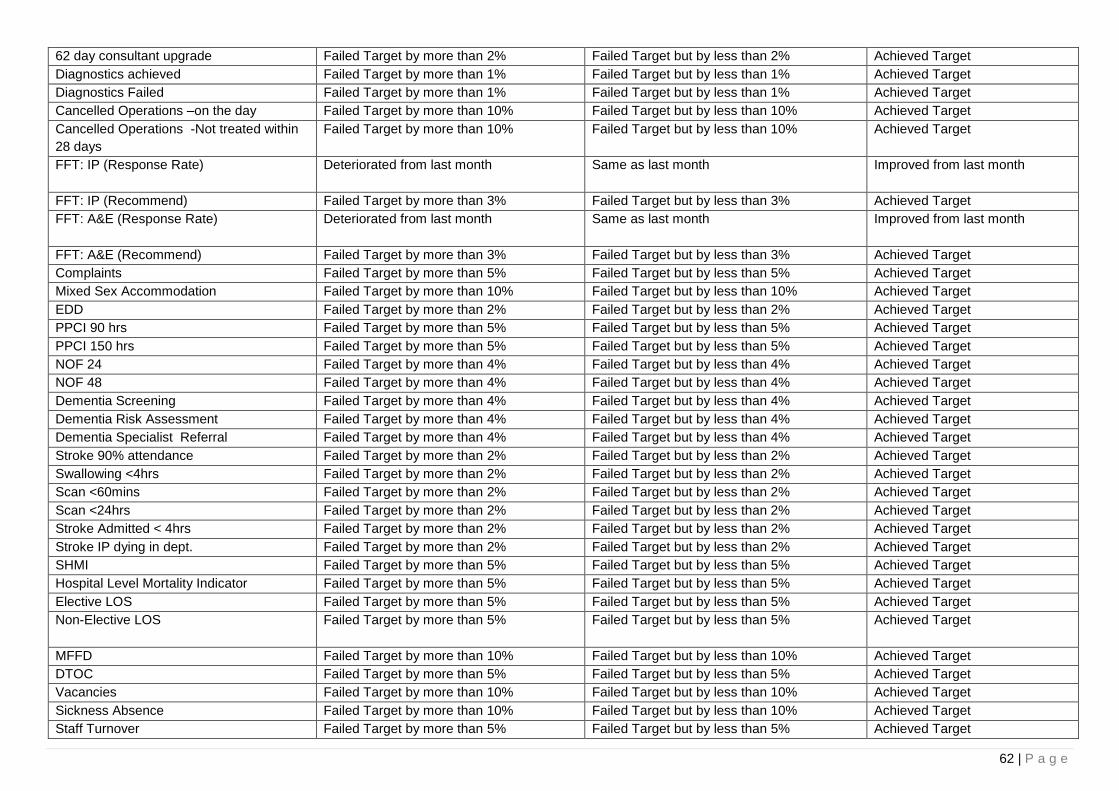
62 | P a g e
62 day consultant upgrade Failed Target by more than 2% Failed Target but by less than 2% Achieved Target
Diagnostics achieved Failed Target by more than 1% Failed Target but by less than 1% Achieved Target
Diagnostics Failed Failed Target by more than 1% Failed Target but by less than 1% Achieved Target
Cancelled Operations –on the day Failed Target by more than 10% Failed Target but by less than 10% Achieved Target
Cancelled Operations -Not treated within
28 days
Failed Target by more than 10% Failed Target but by less than 10% Achieved Target
FFT: IP (Response Rate) Deteriorated from last month Same as last month
Improved from last month
FFT: IP (Recommend) Failed Target by more than 3% Failed Target but by less than 3% Achieved Target
FFT: A&E (Response Rate) Deteriorated from last month Same as last month
Improved from last month
FFT: A&E (Recommend) Failed Target by more than 3% Failed Target but by less than 3% Achieved Target
Complaints Failed Target by more than 5% Failed Target but by less than 5% Achieved Target
Mixed Sex Accommodation Failed Target by more than 10% Failed Target but by less than 10% Achieved Target
EDD Failed Target by more than 2% Failed Target but by less than 2% Achieved Target
PPCI 90 hrs Failed Target by more than 5% Failed Target but by less than 5% Achieved Target
PPCI 150 hrs Failed Target by more than 5% Failed Target but by less than 5% Achieved Target
NOF 24 Failed Target by more than 4% Failed Target but by less than 4% Achieved Target
NOF 48 Failed Target by more than 4% Failed Target but by less than 4% Achieved Target
Dementia Screening Failed Target by more than 4% Failed Target but by less than 4% Achieved Target
Dementia Risk Assessment Failed Target by more than 4% Failed Target but by less than 4% Achieved Target
Dementia Specialist Referral Failed Target by more than 4% Failed Target but by less than 4% Achieved Target
Stroke 90% attendance Failed Target by more than 2% Failed Target but by less than 2% Achieved Target
Swallowing <4hrs Failed Target by more than 2% Failed Target but by less than 2% Achieved Target
Scan <60mins Failed Target by more than 2% Failed Target but by less than 2% Achieved Target
Scan <24hrs Failed Target by more than 2% Failed Target but by less than 2% Achieved Target
Stroke Admitted < 4hrs Failed Target by more than 2% Failed Target but by less than 2% Achieved Target
Stroke IP dying in dept. Failed Target by more than 2% Failed Target but by less than 2% Achieved Target
SHMI Failed Target by more than 5% Failed Target but by less than 5% Achieved Target
Hospital Level Mortality Indicator Failed Target by more than 5% Failed Target but by less than 5% Achieved Target
Elective LOS Failed Target by more than 5% Failed Target but by less than 5% Achieved Target
Non-Elective LOS
Failed Target by more than 5% Failed Target but by less than 5% Achieved Target
MFFD Failed Target by more than 10% Failed Target but by less than 10% Achieved Target
DTOC Failed Target by more than 5% Failed Target but by less than 5% Achieved Target
Vacancies Failed Target by more than 10% Failed Target but by less than 10% Achieved Target
Sickness Absence Failed Target by more than 10% Failed Target but by less than 10% Achieved Target
Staff Turnover Failed Target by more than 5% Failed Target but by less than 5% Achieved Target
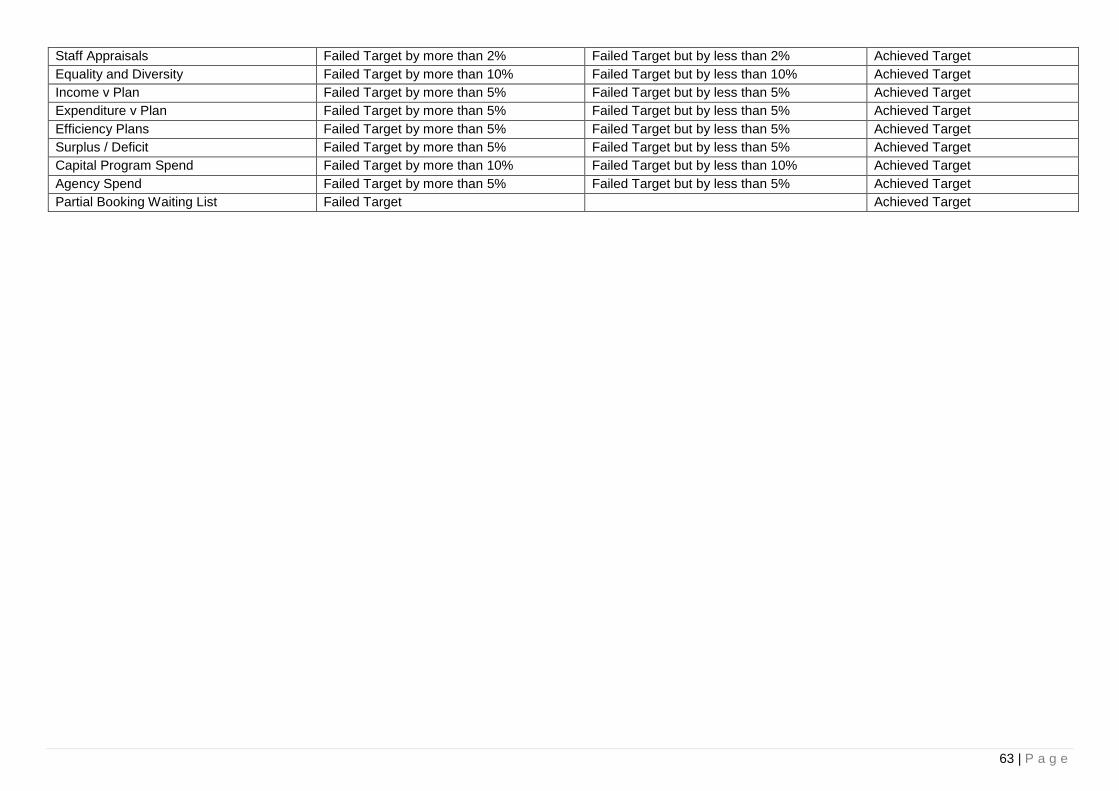
63 | P a g e
Staff Appraisals Failed Target by more than 2% Failed Target but by less than 2% Achieved Target
Equality and Diversity Failed Target by more than 10% Failed Target but by less than 10% Achieved Target
Income v Plan Failed Target by more than 5% Failed Target but by less than 5% Achieved Target
Expenditure v Plan Failed Target by more than 5% Failed Target but by less than 5% Achieved Target
Efficiency Plans Failed Target by more than 5% Failed Target but by less than 5% Achieved Target
Surplus / Deficit Failed Target by more than 5% Failed Target but by less than 5% Achieved Target
Capital Program Spend Failed Target by more than 10% Failed Target but by less than 10% Achieved Target
Agency Spend Failed Target by more than 5% Failed Target but by less than 5% Achieved Target
Partial Booking Waiting List Failed Target Achieved Target