united nations conference on trade and development ...unctad.org/en/docs/ditcted20051_en.pdf ·...
TRANSCRIPT
4 February 2005
ENGLISH ONLY
United Nations Conference on Trade and Development
BIOFUELS – ADVANTAGES AND TRADE BARRIERS*
Prepared by:
Suani Teixeira Coelho1
* The views expressed in this paper are those of the authors and do not necessarily reflect the views of the United Nations. 1 Deputy Secretary for the Environment, São Paulo State and Head of CENBIO – The Brazilian Reference Centre on Biomass – University of São Paulo. Co-authors: Oswaldo Lucon and Patricia Guardabassi, São Paulo State Secretary for the Environment. The authors wish to thank Prof. José Goldemberg, State Secretary for Environment of São Paulo State for his revision of this text. UNCTAD/DITC/TED/2005/1
Table of contents
Executive Summary ................................................................................................................................3 1. General presentation.......................................................................................................................4 2. Strategic benefits from biofuels .....................................................................................................5 3. Social benefits of biofuels for developing countries ......................................................................7 4. Environmental aspects of biofuels ...............................................................................................10 5. Economic aspects of alcohol production......................................................................................16 6. Electricity production from biomass – a good option for CDM projects.....................................18 7. Trade liberalization ......................................................................................................................20 8. Conclusion....................................................................................................................................24 List of Acronyms ..................................................................................................................................25 References.............................................................................................................................................26
Tables and Figures Table 1 Comparative chart....................................................................................................................11 Table 2 Emissions from vehicles running respectively with 50 per cent E100 and 50 per cent E22 ...13 Table 3 Carbon emissions from fossil fuel thermoelectric generation..................................................18 Figure 1 Oil flows throughout the world ................................................................................................6 Figures 2 and 3 Employment numbers (2001) for the Brazilian Ethanol Programme............................7 Figure 4 Brazilian market of flex-fuel vehicles ....................................................................................13 Figure 5 Harvested area in Brazil .........................................................................................................15 Figure 6 Ethanol learning curve............................................................................................................16 Figure 7 Fuel prices in Brazil and currency rates .................................................................................17 Figure 8 CO2 cost comparison of different biofuels .............................................................................21
Boxes Box 1 Ethanol fuel ..................................................................................................................................5 Box 2 Vegetable oils – isolated villages .................................................................................................9 Box 3 Flex-fuel vehicles .......................................................................................................................12 Box 4 Biodiesel.....................................................................................................................................14 Box 5 Electricity production from sugarcane bagasse in São Paulo State - Case Study ......................19
Executive Summary This paper was prepared for the session on biofuels during the Expert Meeting on the Developing Countries' Participation in New and Dynamic Sectors of World Trade, which will be held in Geneva on 7-9 February 2005. Among several new and dynamic sectors for developing countries' participation, renewable energies and biofuels appear as important issues. In addition to the environmental and strategic benefits to be derived from replacing fossil fuels with biofuels, particularly in the transportation and the energy sectors, their production and trade can bring about significant social benefits due to the perspectives of job creation mainly in rural areas of developing countries. The experience of the Alcohol Programme in Brazil is a positive example of such gains. However, despite all these advantages, developed countries are placing high barriers in the way of the international trade of biofuels. South-North and South-South biofuels trade is important for producers of biofuels in developing countries such as South Africa, India, China and Brazil (or potential biofuel producers), as it could contribute to the sustainable development of these countries, as well as provide environmental benefits to developed countries in the context of the global efforts to combat climate change. The Brazilian experience in biofuels production shows that it is possible to produce such fuels in a sustainable way and at a low cost. If we consider the steady decrease of production costs — as happened in the case of Brazilian ethanol — biofuels from developing countries could be commercialized in developed countries, contributing to the reduction of carbon emissions with low economic impacts. Also, the Brazilian experience can be repeated in other developing countries, enabling them to enhance their energy security with locally produced fuels and also to export biofuels to developed countries. Ethanol (from sugarcane and corn) and biodiesel (from rapeseed, soybean, castor or other vegetable oils) are the most important biofuels in use in the world today; this paper will, therefore, discuss these biofuels, as well as the possibilities of projects involving biomass, such as electricity production from biomass residues, which can also be the object of CDM (Clean Development Mechanism) projects under the Kyoto Protocol which enters into force on 16 February 2005. Based on the experience of the Brazilian Alcohol Programme, this paper addresses the benefits from the use of biofuels both for developed and developing countries: environmental (including climate change issues), social, economic and strategic (energy security). Also, it discusses the international trading barriers that stand in the way of the widespread adoption and use of biofuels, as well as provides subsidies for the debate on trade liberalization opportunities under the Doha Development Agenda.
3
1. General presentation UNCTAD's Background Note on "Strengthening participation of developing countries in dynamic and new sectors of world trade: trends, issues and policies" states that development gains can be derived from international trade and trade negotiations. One important way to realize such gains is to promote the participation of developing countries in the world trade. Renewable energy and biofuels are not only important issues in themselves but are among several new and dynamic sectors that developing countries would stand to benefit from if they participated in developing these kinds of fuels. Besides the environmental benefits from biofuels due to the partial replacement of fossil fuels (in transportation and energy sectors), biofuel production and trade could also give rise to significant social benefits due to the perspectives of job creation mainly in rural areas. The experience of the Brazilian Alcohol Programme is a concrete example of such gains. Despite all these advantages, the international trade of biofuels still faces high barriers from developed countries. There are several problems that limit the expansion of biofuels in developed countries: (a) they are almost exclusively dependent on internal producers (even in countries not naturally endowed for the growth of biomass); (b) restrictive regulations (e.g. limits in blends), often based on not entirely justifiable environmental reasons; and (c) R&D support directed preferentially to “clean fossil fuels”, which will maintain unsustainable consumption patterns. Both South-North and South-South trade are important for biofuel producing developing countries. Brazil’s experience in biofuel production shows that it is possible to produce these fuels in a sustainable way. Also considering the steady decline of production costs (as happened in the case of Brazilian ethanol), biofuels from developing countries can be commercialized in developed countries, thereby contributing to a reduction of carbon emissions in these countries. The Brazilian experience can be replicated in other developing countries enabling them to enhance their energy security with locally produced fuels, and also to export biofuels to developed countries which could eventually benefit from the clean development mechanism (CDM) of the Kyoto Protocol. The Kyoto Protocol establishes that developed countries must reduce their greenhouse gas emissions by at least 5 per cent from 1990 levels during the commitment period 2008-2012. The CDM defined in Article 12 provides for Annex I Parties to implement project activities that reduce emissions in non-Annex I Parties, in return for certified emission reductions (CERs). The CERs generated by such projects can be used by Annex I Parties to help meet their emissions targets under the Kyoto Protocol. Article 12 also stresses that such projects are to assist the developing country host Parties in achieving sustainable development and in contributing to the ultimate objective of the Convention. The discussion on biofuels is based mainly on the Brazilian experience of ethanol fuel (Box 1), as well as on best practice and existing barriers in the international market, despite the advantages that these fuels bring in the reduction of carbon emissions. A number of issues related to other biofuels currently under development, for example biodiesel and solid biomass residues, and their perspectives as CDM projects are also discussed. Biomass, for example, is a good alternative to fossil fuels because its carbon balance is almost null.
4

Box 1 Ethanol fuel
Ethanol is mainly produced from sugarcane in Brazil and from corn in the US. It is used as high-octane fuel in vehicles, replacing lead and/or MTBE. Nowadays, almost four million cars run on pure hydrated ethanol in Brazil, and in 1,350,000 vehicles in the form of flex fuel (see Box 3) and all gasoline in the country is blended with anhydrous ethanol (20 to 26 per cent of ethanol in volume basis – gasohol), as a result of the Brazilian Alcohol Programme.
This programme – considered as the world's largest commercial programme on biomass - was started in
1975 by the Federal Government to make ethanol from sugarcane. A similar programme exists in the US and the number of vehicles using ethanol is increasing. In Brazil, the decision to use sugarcane to produce ethanol in addition to sugar was a political and economic one involving very significant government investments. This decision was taken when the Federal Government decided to encourage the production of alcohol to replace gasoline, with the idea of reducing petroleum imports.
Ethanol makes excellent motor fuel but in many countries it is not economically competitive with
gasoline. In Brazil, because ethanol is produced from sugarcane, it presents the lowest production costs in the world. This is not only due to its high agricultural and industrial productivity, but also to the extremely favourable overall energy balance of the alcohol production. In the US, ethanol is produced from corn, with a large consumption of fossil fuels in the production process, and a much lower energy balance (Coelho and Goldemberg, 2004). Besides that, ethanol is a renewable fuel with much lower toxicity than fossil fuels.
Presently, production costs have been reduced and alcohol is economically competitive with
unsubsidized gasoline. In general, the performance of neat-ethanol vehicles is better than gasoline in terms of power, torque
and maximum speed, but worst on acceleration time (90 per cent) and fuel consumption (about 30 per cent higher).2
Multinational automobile industries based in Brazil have introduced all the necessary engine and
vehicle modifications for ethanol use. Gasohol vehicles running with up to 26% ethanol (in volume basis) require almost no changes, but more modifications are required for a larger share of ethanol in the fuel blend (Coelho and Walter, 2004).
2. Strategic benefits from biofuels Increasing the diversification of the energy matrix and reducing the reliance on fossil fuel will impact on energy security — i.e. the availability of energy at all times, in sufficient quantities and at affordable prices. These conditions must prevail over the long term if energy is to contribute to sustainable development. This is a critical subject because of the uneven distribution of fossil fuels resources among countries. The World Energy Assessment (WEA) has pointed out that: “views on the long-term availability of oil and natural gas continue to spark controversy and debate” (UNDP, UNDESA, WEC, 2002). Current trends indicate that the world will continue to depend on fossil fuels for decades to come, with the largest share of the world’s oil resources concentrated in a few areas of the globe. Nuclear fuels are also concentrated in a few countries and nuclear technology raises concerns related to the physical security and environmental aspects of their use.
2 Considering fuel consumption expressed in liters per 100 km. Neat-ethanol engines have higher compression ratio (12:1) than gasoline ones (10:1) due to ethanol’s higher octane number and, as consequence, are more efficient. Thus, fuel consumption ratio is not exactly equal to the ratio of fuels’ LHV.
5

World market prices for conventional energy sources, in particular oil, are quite volatile. This poses great risks for the world’s economic and political stability, with (sometimes) dramatic effects on energy-importing developing countries. In this context, renewable energies, including biofuels, can help diversify energy supply and increase energy security.
Dependence on imported fuels leaves many countries vulnerable to any possible disruption in supplies; if this happened it may result in physical hardships and economic burdens, especially in countries where the proportion of fossil fuels imports on their balance of payments is relatively high.
Almost two-thirds of the world’s oil resources are in the Middle East (Figure 1), mostly in the Gulf region (the Islamic Republic of Iran, Iraq, Kuwait, Oman, Saudi Arabia, and the United Arab Emirates). Although these six countries now account for only 27 per cent of global crude oil supplies, they are expected to double their share to 53 per cent by 2010. Figure 1 Oil flows throughout the world
Source: UNDP, UNDESA, WEC, 2002 The dependence of OECD countries on oil imports is also expected to increase over the next few years. In 2000, oil imports accounted for 52 per cent of their energy requirements, but this is expected to rise to 76 per cent by 2020. Crude oil imports from ACP countries are expected to increase to 72 per cent of their requirements in 2005 (up from 56 per cent in 1993) (IEA, 2002). The Middle East is expected to account for 92 per cent of the region’s imports. The Gulf region is expected to supply 18 million barrels a day to ACP countries by 2010. Non-OECD countries present a share of 41 per cent of the world oil consumption (World Oil Balance charts, 2004). Many countries now consider that it is important for them to reduce their overdependence on these energy sources, particularly oil importing developing countries that frequently spend a large proportion of their foreign currency reserves on oil imports.
6

In this context, the use of biofuels appears as an important strategic option to diversify the world's energy matrix (both for developed and developing countries), and they can be produced by several different countries, mainly the developing ones. 3. Social benefits of biofuels for developing countries
Job creation Firewood is the most commonly used fuel in rural areas in many least developed countries (LDCs); the indoor pollution created by burning firewood has a negative effect on health and impacts on people's quality of life as women and children spend a considerable amount of time collecting it. Large deforested areas in developing and LDC countries could be recovered by sugarcane crops — or any other crop which produces vegetable oils such as castor oil and others — in order to produce biofuels. In addition to the advantages afforded by the production of biofuels, it would also have a significant impact on employment opportunities, mainly in rural areas. In 2004, the Brazilian sugarcane sector is responsible for 700,000 jobs and around 3.5 million indirect jobs, corresponding to the production of 350 million tonnes of cane (UNICA, 2003 and Goldemberg, 2003). The current ratio of jobs created per unit of energy produced is much higher than in other energy sectors (Figure 2), and job generation in most other industries requires higher investments, as shown in Figure 3.
Figures 2 and 3 Employment numbers (2001) for the Brazilian Ethanol Programme
Coal
Hydroelectric power
Oil
Ethanol
50 100 150 jobs/energy (oil=1)
0
4
3
1
152 Chem/Petrochemistry
15
44
70
91
98
145
220
Ethanol / Agro-industry + industry
Consumer goods
Intermediate industry
Automotive Industry
Capital goods
Metallurgy
0 100 200 300 200
1000 US$/job
Source: (Goldemberg, 2002) Although rural workers in developing countries have, in general, very low incomes relative to workers in developed countries, wage levels in the sugarcane sector are comparatively higher than those in other rural sectors. Experience in Brazil has shown that, in large-scale sugarcane plantations, informal working conditions were replaced by a well-organized sector where labour laws are enforced. In addition to this, a new and interesting trend observed in rural areas of São Paulo State — the most industrialized state of the country — is that urban migration and higher quality jobs in the industrial sector have reduced the number of workers available to the sugarcane agricultural sector; this has obliged several mills to introduce mechanical harvesting which has been replaced later on by a
7
mechanical harvest of the green cane crop, with all the attending environmental benefits this brings (Braunbeck et al., 1999). Energy supply in rural areas The enhanced use of renewables (mainly biofuels) in rural areas is also closely linked to poverty reduction as greater access to energy services can:
• improve access to pumped drinking water – clean water and cooked food to reduce hunger (95 per cent of food needs cooking);
• reduce the time spent by women and children on basic survival activities (gathering firewood, fetching water, cooking, etc.);
• allow lighting increasing security and enabling the use of educational media and communication in school and home study at night; and
• reduce indoor pollution caused by firewood use, together with a reduction of deforestation.
More than two billion people in the world do not have access to affordable energy services, and this seriously affects their chances of benefiting from economic development and improved living standards. Women, older people and children suffer disproportionately because of their relative dependence on traditional fuels and their exposure to smoke from cooking, the main cause of respiratory diseases. Access to electricity through transmission distribution lines is unlikely to happen in many parts of the world for the foreseeable future, so access to modern decentralized small-scale energy technologies, particularly renewables (including biofuels), are an important element for successful and effective poverty alleviation policies (Goldemberg, 2002). Box 2 illustrates some existing examples in Brazilian Amazonia of energy conversion from locally available biomass in isolated villages.
8

Box 2 Vegetable oils – isolated villages
A good opportunity for biomass use in remote villages is the electricity generation from in natura3
vegetable oils in adapted diesel engines. The Amazon region in Brazil has an enormous diversity of native oil plants, favourable soil and weather conditions for the culture of highly productive oil plants with several environmental and social advantages. Energy production from vegetable oils is also a good example of sustainable use of biodiversity, because the energy can be used for agro-industrial activities in small units in remote community settlements.
There are several types of biomass (fruit shells, vegetable oils) available to produce energy and replace
the use of fossil fuels. In the case of vegetable oils, they can be used in adapted diesel engines, and without any further transformations (“in natura” oils), to generate electricity. Small communities in the Amazon region can extract oil from locally available nuts or other vegetable sources. Palm oil is one of the most easily available sources for power generation applications, this is because palm oil is currently the only crop, among those considered as fuel sources, that is already being used for oil extraction on large commercial plantations, with reliable yields and standardized production. Pilot units for small-scale generation (under 200 kW) are being tested in some municipalities in the Amazonia, using in natura vegetable oil fired in adapted diesel engines.
Around 1,000 small power plants, mainly using diesel oil, currently supply electricity to isolated cities
and villages in the Amazon. Around 700 of these units have capacities of less than 500 kW and are generally old and inefficient, emitting high levels of pollutants (Goldemberg, 2000). The cost of the electricity produced by these diesel units is high and, in some cases, too expensive for local inhabitants. In some cases, this cost is partially subsidized by special Federal Government programmes. For small villages where these subsidies are not offered, local inhabitants cannot pay for the diesel oil and the only available energy source is locally available biomass (vegetable oil or agricultural residues).
Projects have been formulated to resolve this problem (CENBIO, 2004); demonstration units for the
energy use of vegetable oil through conventional diesel engines adapted to operate with “in natura” palm oil have been developed and put to work in isolated communities in the Amazon. These units are potential candidates for CDM projects because they replace diesel oil.
One of the greatest social benefits brought by the projects is the launch of night school classes, attended
by the whole community. The success of these projects has so far confirmed expectations and this model was recommended for implementation in other communities in the Amazon region (CENBIO, 2004), offering real example on how to promote the Millennium Declaration Goals (MDGs).
The economic dimension of biomass use will largely depend on how far the village is from a larger
city. The price of diesel oil in this village is quite high because of transportation costs (it is usually transported by boat, in many cases diesel oil costs twice or three times the oil price in pump stations) and vegetable oils produced by local people are much cheaper. On the other hand, when a village is not so far from a larger city, it is more interesting to commercialize the vegetable oil, and use the proceeds of this sale to purchase diesel oil.
Considering that biofuels used by the communities frequently replace diesel oil, these projects are potential candidates for CDM projects with Annex I countries, not only in Brazil but in many other developing countries where such experiences can be replicated.
3 In natura vegetable oil is extracted and purified with no chemical treatment. This is to establish the difference between in natura oils and biodiesel, which is the product from the transesterification reaction.
9

4. Environmental aspects of biofuels Atmospheric Automotive Emissions
The main pollutants emitted in the combustion of fossil fuels are sulfur and nitrogen oxides, carbon monoxide and suspended particulate matter. As a secondary pollutant, ozone is formed in the troposphere from interaction among hydrocarbon, nitrogen oxides and sunlight. The environmental impacts of a host of energy-linked emissions — including suspended fine particles and precursors of ozone and acid deposition — contribute to local and regional air pollution and ecosystem degradation. Human health is threatened by high levels of pollution from fossil fuel combustion. Hence, the use of biofuels is amply justified for health and environmental reasons and not only because of depletion of oil reserves, and social and strategic reasons.
Vehicle emissions are responsible for many of the environmental problems faced by large cities like São Paulo, Mexico and New Delhi (Goldemberg et. al., 2003). In Brazil, it was possible to reduce lead additives by increasing the amount of alcohol in gasoline blend. Lead additives were then completely eliminated in 1991. Aromatic hydrocarbons (such as benzene), which are particularly toxic, were also eliminated and the sulfur content was reduced as well. In pure ethanol cars, sulfur emissions were completely eliminated. The addition of alcohol, in the place of lead, in commercial gasoline has reduced the total carbon monoxide, hydrocarbons and sulfur fleet emissions by significant proportions. Ambient lead concentrations in São Paulo Metropolitan Region have dropped from 1.4 g/m3 in 1978 to less than 0.10 g/m3 in 1991 as a result of the ethanol programme, according to CETESB (the Environmental Company of São Paulo State); this is far below the air quality standard of 1.5 g/m3. (Alonso, C.D. et al, 1991 and CETESB, 2003). Ethanol octane number exceeds that of gasoline and its vapor pressure is lower than gasoline, resulting in lower evaporative emissions. Its flammability is also much lower than that of gasoline, reducing the risk of vehicles catching fire. Additionally, there is no gum formation associated with ethanol and anti-oxidants and detergent additives are not required (Joseph Jr., 2003). One of the disadvantages in using pure ethanol is that aldehyde emissions are higher than those of gasoline (or gasohol), but it must be observed that these are predominantly acetaldehydes. Acetaldehydes emissions generate less adverse health effects when compared to the formaldehydes emitted from gasoline and diesel engines (CETESB, 2003, Goldemberg et. al., 2003). In addition to this, carbon monoxide (CO) emissions were drastically reduced. Before 1980, when gasoline was the only fuel in use, CO emissions were higher than 50 g/km; but went down to less than 5.8 g/km in 1995 (CETESB, 2003). Table 1 shows updated figures for gasohol and ethanol vehicles, showing environmental benefits of ethanol fuel. Ethanol vehicles produce almost no greenhouse gas emissions: in fact, in Brazil the use of 1 cubic meter of anhydrous ethanol prevents the emission of 0.7 tCequivalent, and hydrated prevents 0.46 tCeq/m3 (Macedo et. al., 2004). The almost null carbon balance makes alcohol from sugarcane a significant option for countries that must reduce their carbon emissions to meet targets under the Kyoto Protocol (Annex I countries). The Brazilian experience has shown that any gasoline vehicle can run with gasohol. It is also an important step towards the possibility of gradually introducing alcohol (biofuel) by countries seeking to meet Kyoto Protocol targets or those developing countries willing to attract investment through the Clean Development Mechanism.
10

Table 1 Comparative chart
Parameter GASOHOL
(E22)
HYDRADED ETHANOL
(E100)
LEGAL LIMITS in Brazil (Proconve III)
CO2 (g/km) 0.76 0.65 2.00 HC (g/km)* 0.13 0.15 0.30 NOx (g/km) 0.45 0.34 0.60 CHO (g/km)** 0.004 0.02 0.03 Evaporatives (g/test)*** 0.86 1.6 2.00 PM (g/km) 0.08 0.02 - SO2 (g/km) 0.064 0 - AUTONOMY (km/l or km/m3) 10.40 7.80 N.A. Fuel cost (R$/litter) 2.1 1.0 - Cost of km (R$/km) 0,20 0,13 -
Source: CETESB, 2004 Notes: *HC emissions measure VOCs.
**CHO emissions measure aldehydes. Formaldehyde is formed in gasohol vehicles and acetaldehyde, in pure ethanol vehicles. ***Gasohol vehicles require the use of a canister in order to reduce fuel evaporative emissions. Ethanol vehicles do not require this canister due to physic-chemical characteristics of pure ethanol. Gasohol (E22) is a blend of 22 per cent ethanol and 78 per cent gasoline (in volume). Brazil's currency is the Real (US$ 1 = R$ 2.69, in December, 2004).
Flex-fuel vehicles:
The introduction of energy crops (such as sugarcane plantations) and the gradual replacement of fossil fuels by blending it with biofuels (ethanol-gasoline, as in Brazil) could also bring significant advantages to developing countries facing the problem of deforestation. Flex-fuel vehicle technology is now sufficiently well developed to allow the gradual introduction of biofuels in any country.
11

Box 3 Flex-fuel vehicles
Flex-fuel technology has just been introduced in Brazil and the number of models in the country
available from different car manufacturers is rising.4 Despite early experiences there is a significant degree of optimism, as the early reluctance of customers to buy new ethanol vehicles has been mainly due to the fluctuation of the relative prices of ethanol/gasoline. Car manufacturers have an opportunity to save money as they could avoid the development of duplicate projects. In fact, some manufacturers have decided that certain models will only have flex-fuels engines. In 2004, there were no additional costs for flex-fuel vehicles (Coelho and Goldemberg, 2004).
Flex-fuel vehicles can operate with multiple fuels (or fuel blends). The technology was created in 1980
and there are around two million vehicles using it today in the US. In Brazil, they began to be commercialized in 2003 and there are, nowadays, 1,350,000 flex-fuel vehicles in a fleet of 22 million light vehicles, as shown in Figure 4 below (ANFAVEA, 2004).
The main fuels to be used include gasoline and several alternative fuels, such as: pure ethanol (already
used in Brazil in automotive vehicles); blend ethanol-gasoline (already in use in Brazil, in a percentage of 20 to 26 per cent ethanol); blend ethanol gasoline (E-85, with 85% ethanol existing in US); blend methanol-gasoline (also existing in the US, with 85% methanol). This methanol-gasoline blend presents lower perspectives of being introduced, because most of the automobile manufacturers do not allow its use in their motors. So ethanol appears as the main fuel to be used with gasoline (or replacing it) in flex-fuel vehicles (Coelho and Goldemberg, 2004).
Technically speaking, the difference between regular vehicles and flex-fuel vehicles is a small system
placed in the vehicle that enables the engine to adapt to the fuel blend being used. The greatest advantage of the flex-fuel vehicles is that these motors can operate with regular gasoline – when biofuels are not available or are not economically competitive (Coelho and Walter, 2004).
Brazilian flex-fuel cars provide an important advantage when compared to those produced in other countries. In Brazil, they are built to operate with any percentage of ethanol-gasoline blend and even with pure (hydrated) ethanol, which is not the case with similar vehicles in other countries, where flex-fuel cars can accept a maximum of 85% of ethanol blended with gasoline (Coelho and Goldemberg, 2004).
4 Volkswagen, General Motors, Fiat, Ford, Peugeot, Renault are some of manufacturers producing flex-fuel vehicles in Brazil, already approved by CETESB.
12

Figure 4 Brazilian market of flex-fuel vehicles
-
5.000
10.000
15.000
20.000
25.000
30.000
35.000
40.000
May/03
June
/03
July/
03
Aug/03
Sep/03
Oct/03
Nov/03
Dec/03
Jan/0
4
Feb/04
Mar/04
April/0
4
May/04
June
/04
July/
04.
Aug/04
Sep/04
Oct/04
Nov/04
Sold
Uni
ts
Source: ANFAVEA, 2004 Results from recent tests at CETESB on flex-fuel vehicle emissions (CETESB, 2004) show similar figures to those from neat-ethanol or gasohol vehicles. Table 2 below shows emissions from flex-fuels vehicles running with 50% neat-ethanol (E-100) – 50% gasohol (E22) (in volume). Table 2 Emissions from vehicles running respectively with 50 per cent E100 and 50 per cent E22
Pollutant Emission levels(g/km)
CO 0.15 – 0.74 HC 0.038 – 0.14 NOx 0.06 – 0.19
Source: CETESB, 2004 Biodiesel On the other hand, regarding diesel replacement (partially or totally), the current option in several countries seems to be biodiesel (Box 4). Biodiesel has been used in Europe and other countries (Coelho and Goldemberg, 2004), and there is now an increasing interest in Brazil, targetting its use in the transportation sector (collective transportation).
13
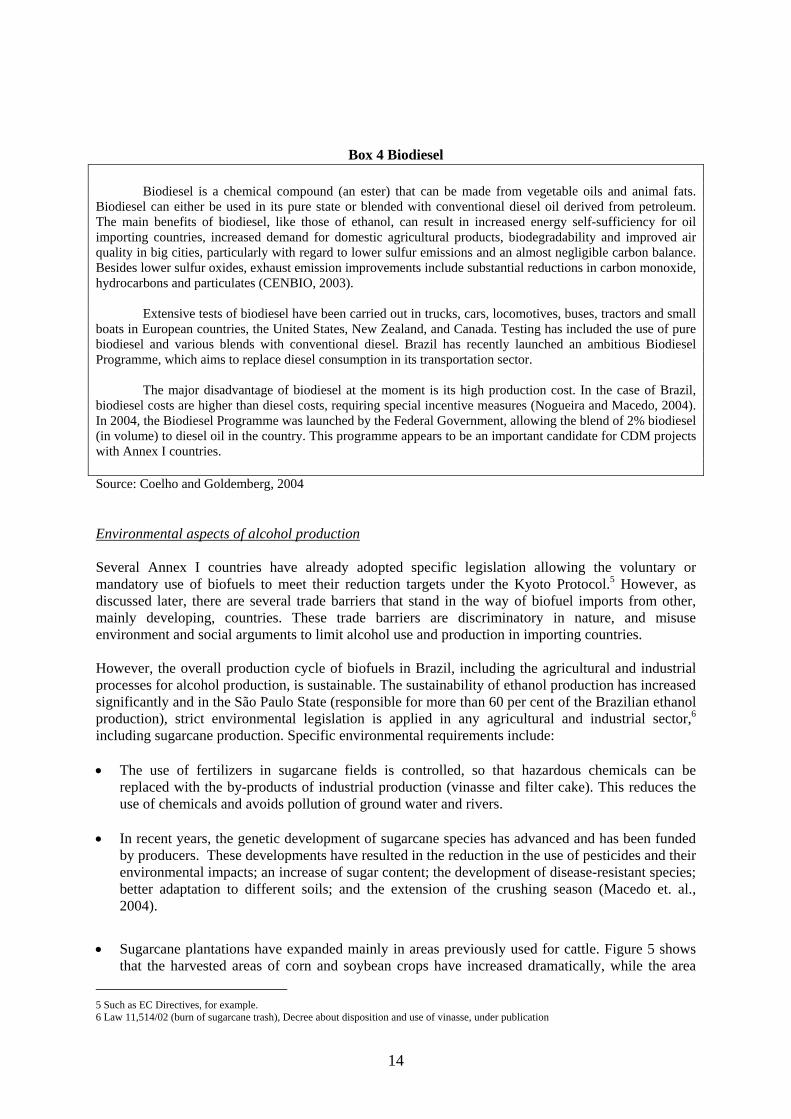
Box 4 Biodiesel
Biodiesel is a chemical compound (an ester) that can be made from vegetable oils and animal fats. Biodiesel can either be used in its pure state or blended with conventional diesel oil derived from petroleum. The main benefits of biodiesel, like those of ethanol, can result in increased energy self-sufficiency for oil importing countries, increased demand for domestic agricultural products, biodegradability and improved air quality in big cities, particularly with regard to lower sulfur emissions and an almost negligible carbon balance. Besides lower sulfur oxides, exhaust emission improvements include substantial reductions in carbon monoxide, hydrocarbons and particulates (CENBIO, 2003).
Extensive tests of biodiesel have been carried out in trucks, cars, locomotives, buses, tractors and small
boats in European countries, the United States, New Zealand, and Canada. Testing has included the use of pure biodiesel and various blends with conventional diesel. Brazil has recently launched an ambitious Biodiesel Programme, which aims to replace diesel consumption in its transportation sector.
The major disadvantage of biodiesel at the moment is its high production cost. In the case of Brazil,
biodiesel costs are higher than diesel costs, requiring special incentive measures (Nogueira and Macedo, 2004). In 2004, the Biodiesel Programme was launched by the Federal Government, allowing the blend of 2% biodiesel (in volume) to diesel oil in the country. This programme appears to be an important candidate for CDM projects with Annex I countries.
Source: Coelho and Goldemberg, 2004 Environmental aspects of alcohol production Several Annex I countries have already adopted specific legislation allowing the voluntary or mandatory use of biofuels to meet their reduction targets under the Kyoto Protocol.5 However, as discussed later, there are several trade barriers that stand in the way of biofuel imports from other, mainly developing, countries. These trade barriers are discriminatory in nature, and misuse environment and social arguments to limit alcohol use and production in importing countries.
However, the overall production cycle of biofuels in Brazil, including the agricultural and industrial processes for alcohol production, is sustainable. The sustainability of ethanol production has increased significantly and in the São Paulo State (responsible for more than 60 per cent of the Brazilian ethanol production), strict environmental legislation is applied in any agricultural and industrial sector,6
including sugarcane production. Specific environmental requirements include: •
•
•
The use of fertilizers in sugarcane fields is controlled, so that hazardous chemicals can be replaced with the by-products of industrial production (vinasse and filter cake). This reduces the use of chemicals and avoids pollution of ground water and rivers.
In recent years, the genetic development of sugarcane species has advanced and has been funded by producers. These developments have resulted in the reduction in the use of pesticides and their environmental impacts; an increase of sugar content; the development of disease-resistant species; better adaptation to different soils; and the extension of the crushing season (Macedo et. al., 2004).
Sugarcane plantations have expanded mainly in areas previously used for cattle. Figure 5 shows that the harvested areas of corn and soybean crops have increased dramatically, while the area
5 Such as EC Directives, for example. 6 Law 11,514/02 (burn of sugarcane trash), Decree about disposition and use of vinasse, under publication
14

harvested for other cultures, including sugarcane, has remained almost identical for the past 35 years. Environmental legislation specifically specifies that it is forbidden to engage in any type of deforestation.7 In São Paulo State, for example, each agricultural producer must guarantee a preserved area (corresponding to 20 per cent of the total area planted with sugarcane as a natural reserve to guarantee the local biodiversity). Additionally, isolated trees cannot be cut without permits from the state environmental agencies.8
Figure 5 Harvested area in Brazil
Harvested Area in Brazil
-
2.000
4.000
6.000
8.000
10.000
12.000
14.000
16.000
18.000
1930 1940 1950 1960 1970 1980 1990 2000
1000
ha
Rice Coffee Sugarcane Bean Corn Soybean Wheat
Source: IBGE
•
•
Environmental regulations also require that green cane harvesting, i.e., harvesting without previous field burning is gradually introduced. In São Paulo State, existing legislation9 foresees a gradual growth on mechanized harvesting, with full mechanization to be reached by 2021 in areas larger than 150 hectares with less than 12 per cent declivity, and ten years later in areas with less favourable terrain. Green cane harvesting will allow the recovery of sugarcane trash (leaves and the tips of the plant), and a deep increase on biomass availability for energy production in industrial process. In most of the northeast region (responsible for about 30 per cent of Brazilian production), green cane harvesting cannot be applied due to topographic conditions (Macedo et. al., 2004).
The industrial processes linked to alcohol production must adhere to the environmental requirements related to atmospheric and liquid effluents, among other impacts. Energy needs also have to be met from the use of sugarcane bagasse (a by-product of sugarcane crushing). This explains why fossil fuel consumption in the overall process is extremely low and the energy
7 In fact, the combination of high agricultural yields and high sugar content in the sugarcane resulted in a reduction of land use: in Brazil, the production of 300 million tonnes of sugarcane per year requires a surface equivalent to 0.8 per cent of all agricultural lands in the country (i.e., just about 5 million hectares). 8 DEPRN Order 44, September 25th, 1995, DEPRN Order 02, May 17th, 1986 9 State Law 11,241 - September 19th, 2002
15

balance is highly positive (11 units of energy to 1 unit of energy of fossil origin) (Macedo et. al., 2004).
5. Economic aspects of alcohol production Brazil has important lessons to share with other countries on the economic aspects of alcohol production. Ethanol production costs were close to US$ 100 a barrel in the initial stages of the Alcohol Programme in 1980. Until 1985, as production increased, prices paid to producers reflected average costs of production, (Goldemberg et. al., 2003). During this initial phase, prices fell slowly, only reflecting the gains in agro-industrial yield and economies of scale captured by producers, and these gains were transferred to consumers through a pricing regulation scheme. More recently, economies of scale and market liberalization has meant that the price paid to producers has fallen much more rapidly, as shown in Figure 6. Since the early 80's, the Alcohol Programme does not make use of any subsidy scheme.
Figure 6 Ethanol learning curve
Ethanol cumulative productio Ethanol price paid to producersYear ( in million m3 ) ( 2001 US$ / m3 )1980 2.668 632,38
Price Paid to Alcohol Producers in Brazil
100
1000
1000 10000 100000 1000000
Ethanol cumulative prodution (in million m³)
Etha
nol p
rice
paid
to p
rodu
cers
(200
1 U
S$/m
³)
2001
1980
1999
19851983
2000
1986
19901996
Source: Goldemberg et al, 2003.
The total amount of investments in the agricultural and industrial sectors for the production of ethanol for vehicle use in the period 1975-1989 reached a total of US$ 4.92 billion (2001 US$) directly invested in the programme. On the other hand, oil imports avoided meant savings amounting to US$ 52.1 billion (January 2003 US$) from 1975 to 2002 (Goldemberg et. al., 2003). There are, currently, no subsidies for anhydrous or hydrated ethanol production. Hydrated ethanol is sold for 60 to 70 percent of the price of gasohol at the pump. These results show the economic competitiveness of ethanol when compared to gasoline. Figure 7 shows a comparison of the main transportation fuels used in Brazil in terms of the price paid in local currency (Real), and the exchange rates against the North American dollar; it convincingly demonstrates the long-term competitiveness of ethanol fuel (Goldemberg et. al., 2003).
16

Figure 7 Fuel prices in Brazil and currency rates
0,0
0,5
1,0
1,5
2,0
2,5
3,0
3,5
4,0
may
/98
jul/9
8
sep/
98
nov/
98
jan/
99
mar
/99
may
/99
jul/9
9
sep/
99
nov/
99
jan/
00
mar
/00
may
/00
jul/0
0
sep/
00
nov/
00
jan/
01
mar
/01
may
/01
jul/0
1
sep/
01
nov/
01
jan/
02
mar
/02
may
/02
jul/0
2
sep/
02
nov/
02
jan/
03
Date
R$
Gasoline (R$/l) Hydrated Ethanol (R$/l) Diesel (R$/l) currency avg. (R$/US$)
Source: Goldemberg et al, 2003a These cost reductions were due mainly to a significant increase in agricultural yield, which is a function of soil quality, weather conditions and agricultural practices, and is also strongly influenced by agricultural management. The average productivity in Brazil is around 65 t/ha (Moreira and Goldemberg, 1999) but can be as high as 100-110 t/ha in the State of São Paulo (Braunbeck et al., 1999b). However, yield figures should not be strictly compared with other countries, as sugarcane cultivation in Brazil is not irrigated. Yields have grown about 33 per cent in São Paulo State since the beginning of the alcohol programme, mainly due to the development of new species and the improvement of agricultural practices (Macedo et. al., 2004). Productivity gains and cost reductions were also achieved as a result of the introduction of operation research techniques in agricultural management and the use of satellite images for species identification in cultivated areas. Similar decision-making tools have been applied in relation to harvesting, planting and application rates for herbicides and fertilizers. This experience with ethanol in Brazil could be replicated in other developing countries, because many of these countries already have sugarcane plantations and could gradually start to produce alcohol fuel both for domestic supply and for export, on the condition, that trade barriers are lifted and technology is made available.
17
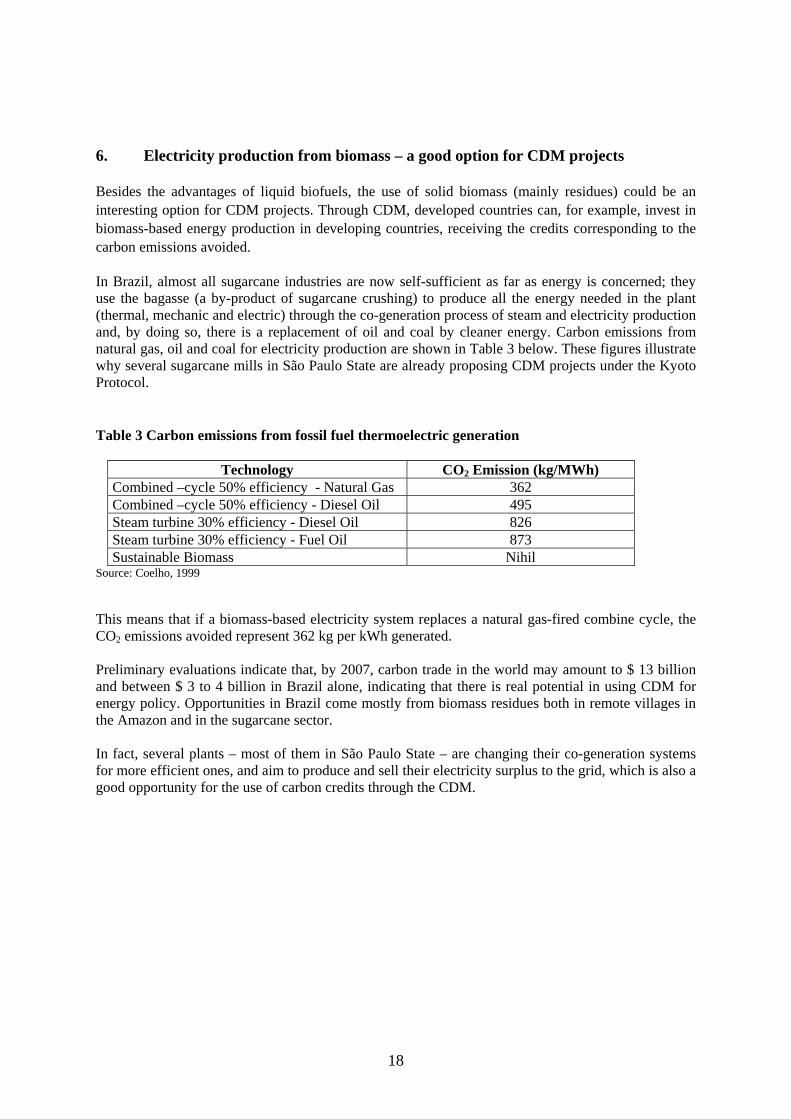
6. Electricity production from biomass – a good option for CDM projects Besides the advantages of liquid biofuels, the use of solid biomass (mainly residues) could be an interesting option for CDM projects. Through CDM, developed countries can, for example, invest in biomass-based energy production in developing countries, receiving the credits corresponding to the carbon emissions avoided.
In Brazil, almost all sugarcane industries are now self-sufficient as far as energy is concerned; they use the bagasse (a by-product of sugarcane crushing) to produce all the energy needed in the plant (thermal, mechanic and electric) through the co-generation process of steam and electricity production and, by doing so, there is a replacement of oil and coal by cleaner energy. Carbon emissions from natural gas, oil and coal for electricity production are shown in Table 3 below. These figures illustrate why several sugarcane mills in São Paulo State are already proposing CDM projects under the Kyoto Protocol.
Table 3 Carbon emissions from fossil fuel thermoelectric generation
Technology CO2 Emission (kg/MWh) Combined –cycle 50% efficiency - Natural Gas 362 Combined –cycle 50% efficiency - Diesel Oil 495 Steam turbine 30% efficiency - Diesel Oil 826 Steam turbine 30% efficiency - Fuel Oil 873 Sustainable Biomass Nihil
Source: Coelho, 1999 This means that if a biomass-based electricity system replaces a natural gas-fired combine cycle, the CO2 emissions avoided represent 362 kg per kWh generated. Preliminary evaluations indicate that, by 2007, carbon trade in the world may amount to $ 13 billion and between $ 3 to 4 billion in Brazil alone, indicating that there is real potential in using CDM for energy policy. Opportunities in Brazil come mostly from biomass residues both in remote villages in the Amazon and in the sugarcane sector. In fact, several plants – most of them in São Paulo State – are changing their co-generation systems for more efficient ones, and aim to produce and sell their electricity surplus to the grid, which is also a good opportunity for the use of carbon credits through the CDM.
18

Box 5 Electricity production from sugarcane bagasse in São Paulo State - Case Study UNDP Brazil and the Brazilian company "Bioenergia Cogeradora", a Brazilian private company
created by the Group Balbo in Sertãozinho, São Paulo State, developed an innovative project to reduce greenhouse gas emissions. The project is aimed at improving the efficiency of sugarcane bagasse burners in order to produce energy in a co-generation system and provide surplus electricity to the grid on a commercial basis.
This initiative undertaken in Brazil is part of a UN inter-agency project funded by the United Nations
Foundation (UNF)/United Nations Fund for International Partnerships (UNFIP) with technical support from UNCTAD, UNIDO, and the World Business Council for Sustainable Development (WBCSD).
Prior to the launch of this project, "Bioenergia Cogeradora" produced 10MW from sugarcane bagasse.
With a US$ 10 million investment and an upgrading of existing production processes, they now co-generate 31MW by burning the same amount of bagasse. Since May 2002, Bioenergia Cogeradora consumes 30 per cent of the energy it generates and sells 70 per cent to the grid (through CPFL, a privately-owned utility in São Paulo State).
The project incorporates a number of dimensions in support of sustainable development and is
compatible with CDM sustainable development criteria, as it includes: technological advances; enhanced agricultural practices; improved environmental management systems; and transparent social and labour standards.
The project is committed to a more efficient energy production from a renewable source thus tripling
the energy generated with the same biomass throughput. It also allows for the removal of an estimated 50,000 tons of carbon equivalent from the atmosphere per year, which could be converted into credits under the current rules of the CDM. Such credits have a market value and enabled the Grupo Balbo to amortize its initial investment.
Since most Brazilian sugarcane mills were built when the Alcohol Programme was launched in the
1970s, existing capital equipment is largely obsolete and nearing the end of their useful lifetime. This project illustrates the real opportunity of changing existing co-generation systems for more efficient ones, in order to produce and sell electricity surplus to the grid and obtain the carbon credits with market value through the CDM.
Source: UNCTAD Climate Change Programme (www.unctad.org/ghg) Distillery owners showed no interest in generating electricity surplus to sell to the grid until the late 1990s. Local electricity utilities did not, likewise, consider the option of purchasing electricity seriously due to the abundance of hydroelectricity and the lack of a proper institutional framework (Coelho, 1999). However, due to the recent changes in the Brazilian electric sector legislation (Law 10,438 – PROINFA), local utilities and the sugarcane sector are now interested in producing and commercializing surplus electricity. However, the current level of commercialized surplus electricity of around 500 MW in the country is still much lower than the sector's technical potential of 4,000 MW (CENBIO, 2001). Considering the recently approved law (PROINFA law) in 2002, which is now in the process of being implemented, perspectives for investments in co-generation seem interesting, particularly in taking advantage of the CDM credits under the Kyoto Protocol. Other types of biomass can also be used for electricity production. Residues from sawmills and other agro-industries, biomass from wood plantations (managed in a sustainable way) and biogas from landfills can also be used, creating good investment opportunities in Brazil.
19
7. Trade liberalization Under the Kyoto Protocol, industrialized countries must reduce their carbon emissions. Many of these countries have already passed specific legislation establishing voluntary or mandatory replacement of fossil fuels by biofuels. Importing biofuels from other, mainly developing countries, could help them reach their targets, however, many biofuel exporting countries still face technical trade barriers. To prevent asymmetry between trade liberalization objectives and Kyoto Protocol reduction targets, new approaches and policy space are warranted in order to ensure that trade liberalization efforts and policies in implementing Kyoto Protocol become truly and mutually supportive. Biofuels are: (1) a form of energy that is easily transported and stored, thus tradable; (2) environmentally preferable products; and (3) obtained from agricultural feedstocks, which in many cases compete internationally with subsidized products. Therefore, they are affected by protective legislation and are subjected to the rules currently under discussion in the WTO's Doha Work Programme. This includes negotiation on certain trade and environment issues, starting with the aimed liberalization of trade in environmental goods and services (EGS). It is therefore necessary to define the scope and clarify existing WTO provisions in order to clearly consider biofuels as EGS, and thereby making it possible for them to benefit from progressive world trade liberalization, as foreseen in paragraph 31 of WTO's Doha Declaration.10 Developed countries and international organizations such as the OECD and UNCTAD have a key role to play in achieving this. Multilateral Environmental Agreements (MEAs) such as the Kyoto Protocol or targets for renewables are very important driving forces to achieving sustainable development through the increased use of biofuels.11 Biofuels under the WTO´s Agenda for trade liberalization of environmental goods and services (EGS) Biofuels have become a high priority issue in the US, the EU and in a number of other countries around the world, due to concerns about oil dependence, reduction in CO2 emissions or restrictions on other octane enhancement additives and oxygenation. Bioethanol is a low-cost solution to a number of problems; it can, for example, help to protect parts against corrosion; contribute to catalyst improvements and cetane enhancers for diesel engines; and can be used to help start engines in cold climates and to make possible adjustments in vapor pressure of the base gasoline to prevent high HC evaporative emissions and ozone formation.12 The acetaldehyde from ethanol is also less toxic and carcinogenic than the formaldehyde in gasoline. Compared to conventional fossil fuels, it provides high-octane performance at a relatively low cost.
10 TRADE AND ENVIRONMENT. DOHA DECLARATION PAR. 31. With a view to enhancing the mutual supportiveness of trade and environment, we agree to negotiations, without prejudging their outcome, on: (i) the relationship between existing WTO rules and specific trade obligations set out in multilateral environmental agreements (MEAs). The negotiations shall be limited in scope to the applicability of such existing WTO rules as among parties to the MEA in question. The negotiations shall not prejudice the WTO rights of any Member that is not a party to the MEA in question; (ii) procedures for regular information exchange between MEA Secretariats and the relevant WTO committees, and the criteria for the granting of observer status; (iii) the reduction or, as appropriate, elimination of tariff and non-tariff barriers to environmental goods and services (World Trade Organization, Ministerial Declaration, Ministerial Conference, Fourth Session, Doha, 9 - 14 November 2001. WT/MIN (01)/DEC/1, 20 November 2001 (01-5859). 11 Renewable energies are closely related to the Millennium Development Goals (MDGs). During the 2002 Johannesburg World Summit for Sustainable Development (WSSD) was proposed the so-called Brazilian Energy Initiative, a 10 per cent global target for renewable energy (www.worldenergy.org/wec-geis/focus/wssd/goldemberg.pdf). Such policy encompasses simultaneously cleaner energy, sustainable patterns of consumption, job creation, energy security and free trade. At regional level, the Latin America and the Caribbean region have approved in May 2002 a 10 per cent target on renewable energies. (http://www.renewables2004.de/pdf/platform_declaration.pdf) 12 The problem of mostly occurs over the first 1% ethanol; above 8%, fuel vapor pressure with ethanol (high evaporative emissions), read on the Reid Vapor Pressure (RVP) scale, begins to drop again (Haug, 2003).
20
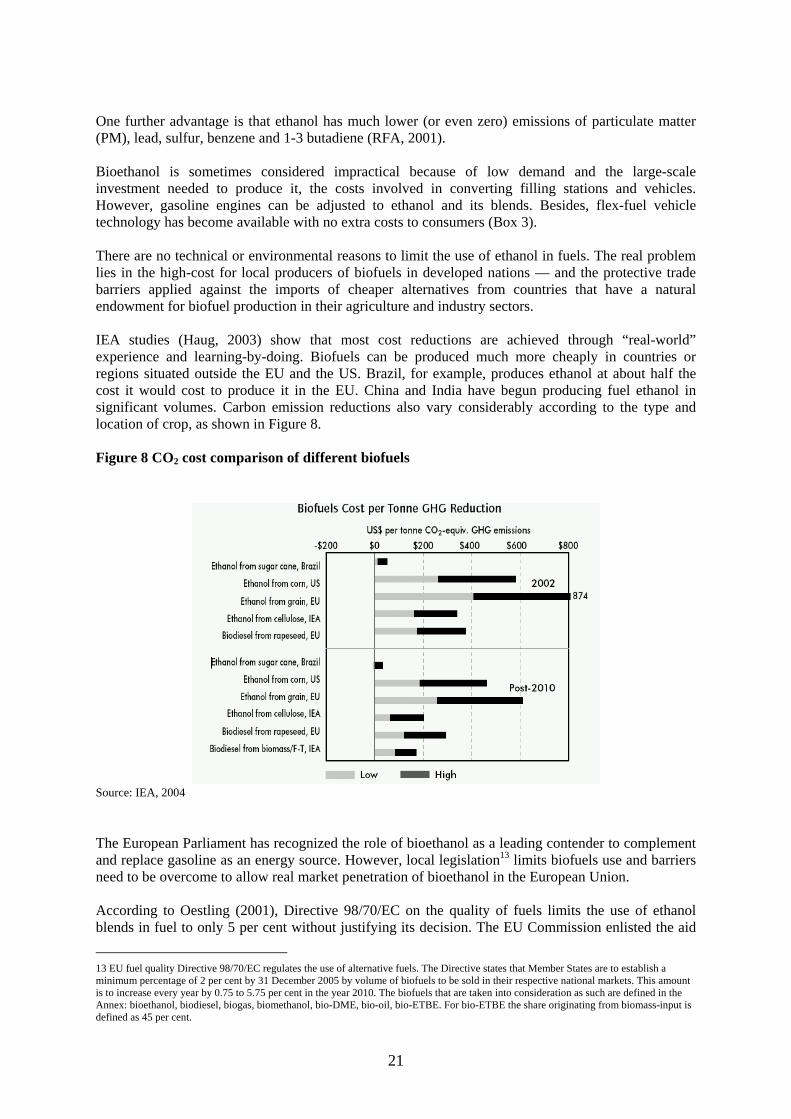
One further advantage is that ethanol has much lower (or even zero) emissions of particulate matter (PM), lead, sulfur, benzene and 1-3 butadiene (RFA, 2001). Bioethanol is sometimes considered impractical because of low demand and the large-scale investment needed to produce it, the costs involved in converting filling stations and vehicles. However, gasoline engines can be adjusted to ethanol and its blends. Besides, flex-fuel vehicle technology has become available with no extra costs to consumers (Box 3). There are no technical or environmental reasons to limit the use of ethanol in fuels. The real problem lies in the high-cost for local producers of biofuels in developed nations — and the protective trade barriers applied against the imports of cheaper alternatives from countries that have a natural endowment for biofuel production in their agriculture and industry sectors. IEA studies (Haug, 2003) show that most cost reductions are achieved through “real-world” experience and learning-by-doing. Biofuels can be produced much more cheaply in countries or regions situated outside the EU and the US. Brazil, for example, produces ethanol at about half the cost it would cost to produce it in the EU. China and India have begun producing fuel ethanol in significant volumes. Carbon emission reductions also vary considerably according to the type and location of crop, as shown in Figure 8. Figure 8 CO2 cost comparison of different biofuels
Source: IEA, 2004 The European Parliament has recognized the role of bioethanol as a leading contender to complement and replace gasoline as an energy source. However, local legislation13 limits biofuels use and barriers need to be overcome to allow real market penetration of bioethanol in the European Union. According to Oestling (2001), Directive 98/70/EC on the quality of fuels limits the use of ethanol blends in fuel to only 5 per cent without justifying its decision. The EU Commission enlisted the aid
13 EU fuel quality Directive 98/70/EC regulates the use of alternative fuels. The Directive states that Member States are to establish a minimum percentage of 2 per cent by 31 December 2005 by volume of biofuels to be sold in their respective national markets. This amount is to increase every year by 0.75 to 5.75 per cent in the year 2010. The biofuels that are taken into consideration as such are defined in the Annex: bioethanol, biodiesel, biogas, biomethanol, bio-DME, bio-oil, bio-ETBE. For bio-ETBE the share originating from biomass-input is defined as 45 per cent.
21

of the oil industry and car companies when formulating Directive 98/70/EC,14 which formed the basis of the Auto Oil legislative package. The Auto Oil Directive15 forbids higher blending rates, even though they have been tested on a large scale with positive results, including significant GHG emission reductions. In 2000, ethanol and biodiesel accounted for less than 1 per cent of gasoline and diesel consumption in the EU; production capacities are, however, rising fast. Meeting objectives such as the proposed EU indicative target of 5.75 per cent oil displacement by 2010 will require large-scale, rapid investment in conversion facilities, and this represents quite a challenge (Haug, 2003). To meet this target, governments will have to act aggressively, creating a climate for increased production or import of feedstocks and encouraging rapid investment in conversion facilities. Domestic production will not suffice to meet this target and the EU's Common Agricultural Policy might have to be revised. Increased crop production for biofuels may lead to reductions in other agricultural subsidies. The European draft directive on the promotion of the use of biofuels in vehicle transport was criticized for its “highly dubious environmental policy”. An amendment included the mandatory adoption of environmental impact assessments, including a full-life cycle analysis of the use of biofuels. A biofuel with a favourable environmental impact will be given preference by specific tax exemptions (Van Thuijl et al, 2003). The European Commission proposed a policy to promote the use of biofuels in the transport sector in 2001, allowing Member States to apply a reduced rate of excise duty on certain mineral oils containing biofuels and on biofuels (European Commission, 2001).16 On 12 September 2002, an EU directive proposal17 required public reporting of a uniform environmental impact assessment with a full life-cycle analysis of biofuels, to be developed by the European Commission. A biofuel with a favourable environmental effect can be given preference by granting specific tax exemptions (Van Thuijl et a1, 2003). In 2003, two Commission decisions allowed British and German biofuels to benefit from up to 100 per cent cuts in excise duties. The first decision concerned a British request for reduced excise duties on bioethanol in the UK, to be granted automatically to any producer or importer of bioethanol in the UK for five years starting from January 2005. The second referred to a German request for total exemption of excise duties on mineral oils used in the production of pure and blended biofuels, from 1 January 2004 to 31 December 2009 (EurActiv, 200318). Ethanol imports do not usually enjoy the same fiscal benefits as those produced locally. According to the IEA (2004), ethanol import duties are US$ 0.10 per liter in European Union, US$ 0.14/litre in the United States, US$ 0.06/l in Canada, US$ 0.23/l in Australia and zero in Japan and New Zealand. In the EU there is a preferential treatment for ethanol imports from EBA (Everything But Arms) and ACP (Africa, Caribbean and Pacific) countries, which are exempted from duties. Internal production is subsidized through tax reductions of as much as EUR 0.65/l in Germany, Stlg 0.2/l in the UK, EUR 0.38/l in France and EUR 0.525/l in Sweden. In the US, E10G blends (gasoline with 10% ethanol) have partial tax exemption of US$0.052/l if locally produced biofuel is used. To counteract this subsidy, the US taxes ethanol imports at a rate of US$ 0.54/gallon (around US$ 0.18/l, equivalent to
14 The report of the Committee on the Environment, Public Health and Consumer Protection (PE A4-0096/1997) on Directive 98/70/EC emphasizes that it is not possible to rely exclusively on the analysis produced by such a limited set of stakeholders (Oestling, 2001). 15 EC "Communication from the Commission; A review of the Auto Oil II programme", COM (2000) 626 final, 2000. 16 Commission of the European Communities (2001b). Proposal for a Council directive amending Directive 92/81/EEC with regard to the possibility of applying a reduced rate of excise duty on certain mineral oils containing biofuels and on biofuels. 2001/0266 (CNS), 7 November 2001. Brussels. http://www2.europarl.eu.int/omk/sipade2?PUBREF=-//EP//TEXT+REPORT+A5-2002-0218+0+DOC+SGML+V0//EN 17 Commission of the European Communities (2001a). Amended proposal for a Directive of the European Parliament and of the Council on the promotion of the use of biofuels for transport COM(2002)508 final 2001/0265(COD) 18 EurActiv (2003). Biofuels to benefit from preferential tax regimes. EurActiv, 13 March 2003 http://www.euractiv.com/Article?tcmuri=tcm:29-115538-16&type=News
22

the Brazilian production cost), but exempts ethanol imports from the Caribbean under the CBERA (Nastari, P.M., 2004).19
With the mandate to work towards global trade liberalization and environmental sustainability, the WTO - World Trade Organization’s Fourth Ministerial Conference adopted in November 2001 the Doha Ministerial Declaration, which agreed to negotiations on the reduction or, as appropriate, elimination of tariff and non-tariff barriers to environmental goods and services (EGS).20 However, win-win negotiations among developed and developing countries still require clearer scope definitions and more precise classification of environmental goods and services. There is no agreed understanding on the nature of environmentally preferable products (EPPs), neither of EGS. While the OECD/Eurostat Group refers to the environmental goods and services industry, UNCTAD considers biofuels as EPPs, as superior to petroleum-based products.21 In any case, the definition of EGS is not restricted to any sector within the environmental industry, but an “agglomeration of providers of many types of goods, services, and technologies.” In 1999, an OECD/EUROSTAT Informal Working Group defined environmental goods and services industry as comprising of “activities which produce goods and services to measure, prevent, limit, minimize or correct environmental damage to water, air, and soil as well as problems related to waste, noise and eco-systems.” These organizations issued a classification manual describing the main categories of environmental goods, not developed for the purposes of trade or customs purposes, dividing the EGS in three categories: (a) pollution management; (b) cleaner technologies and cleaner/resource efficient products; and (c) resource management. The category of resource management encompasses renewable energy plants; heat/energy savings and equipments, sustainable agriculture and forestry and eco-tourism. The difficulty lies in the fact that, unlike pollution abatement equipment, the technologies and goods included in these categories are exclusively used for environmental purposes. Cleaner, efficient and sustainable goods serve as substitutes for their dirtier, inefficient and unsustainable like products. Even not including biofuels in the accounting, estimated global expenditures on the environment are in the range of US$ 525 billion per year and are expected to surpass US$ 600 billion by 2005 (OECD, 2003). There is no doubt that agreements on agriculture are of key importance to the success of the Doha round. Developed countries are looking for better market access for technologies, consulting services and protected intellectual property. Developing countries want to broaden the scope of EGS to products, which they can be exported, and to services such as ecotourism. Behind the win-win talks, there is a playing field where imports should be reduced and exports expanded, and where strengthened capacity is required to comply with stricter environmental requirements (Vikhlyaev, 2004). The environment is increasingly affecting technical regulations and standards of goods, as shown in the notifications from the WTO´s Environmental Database (WTO, 2002). The OECD (2003) advocates that large-scale environmental technologies represent a regulatory and supply-driven market, whereas environmental goods are demand-driven at the consumer level, thereby reflecting a kind of bottom-up approach to achieving environmental goals, based on relative
19 Currency conversion: EUR 1 ~ US$ 1.3389 USD; GBP 1 = US$ 1.9126. Reference date 22 Dec 2004. Source: http://www.x-rates.com/calculator.html . A list of ACP countries is available at http://europa.eu.int/comm/development/body/country/country_en.cfm. EBA least developing countries EU preference regulation (EC 416/2001) can be found at http://europa.eu.int/comm/trade/issues/global/gsp/eba/index_en.htm. The Caribbean Basin Recovery Act (US Public Law 98-67 Title II, enacted on 5 Aug 1983) is available at http://www.apparelsearch.com/caribbean_basin_economic_recovery_act_cbera.htm 20 Doha Ministerial Declaration, Paragraph 31 (iii): “With a view to enhancing the mutual supportiveness of trade and environment, we agree to negotiations, without prejudging their outcome, on: (iii) the reduction or, as appropriate, elimination of tariff and non-tariff barriers to environmental goods and services” 21 UNCTAD (1995 and Vikhlyaev, 2004) defines EPPs as products which cause significantly less environmental harm at some stage of their life cycle than alternative products that serve the same purpose, or products the production and sale of which contribute significantly to the preservation of the environment. Life cycle encompasses production, processing, consumption or disposal. Less environmental harm considers: (a) use of natural resources and energy; (b) amount and hazardousness of waste generated by the product along its life cycle; (c) impact on human and animal health; and (d) preservation of the environment.
23

rather than absolute benchmarks. This is partially correct, but only when considering the absence of mandatory policies. In the case of biofuels, for example, environmental goals are achieved through possible compulsory blend requirements in petrol derivatives. Examples of large-scale environmental technologies are low-NOx burners and stack emission control systems for power plants. Enterprise owners utilize such technologies generally because they are legally mandated to do so, or because these are the best (sometimes the only) available products in the market. Demand-driven environmental goods are, for example, ecolabelled organic agricultural products or those made from recycled materials. Consumer usually has a broader choice. This is the case where there are, for example, flexible fuel vehicles. But sometimes there are policies that make compulsory the use of a given good. This is the case of the Brazilian E25, a blend of 25% of ethanol in gasoline. Flexible fuel vehicles may use blends ranging from E25 to pure hydrated ethanol (E100), but it is impossible (by law) to use pure gasoline or blends of less than 25% of ethanol. Such policies provide the necessary incentive to move positively in the learning curve of biofuels. EGS are a central issue in terms of trade and sustainable development that cannot be dissociated from the challenges of the United Nations Millennium Development Declaration and the 2002 Johannesburg’s World Summit on Sustainable Development (WSSD). In this Conference, it became clear that sustainable development called for strong commitments such as tangible targets and timeframes for renewable energy and basic sanitation. A more general commitment to market access is one of the foundations of the Doha Development Round agenda. It includes supporting the accelerated liberalization of trade in green goods of special interest to developing countries. Biofuels offer a unique opportunity to simultaneously enhance exports from developing countries, promote rural development, diversify sources of energy supply, meet Kyoto Protocol reduction targets and promote real investment through the Clean Development Mechanism. 8. Conclusion
The full potential and advantages of renewable energies are hindered at present because the costs of fossil fuels do not reflect their full cost. They are subsidized in several parts of the world and the “externalities” associated with them, such as additional health and environmental costs, are not taken into consideration.
Also, policies for biofuels usually focus more on side effects, such as local agricultural subsidies or improved R&D, than on the central focus, which is the fast improvements in the learning curve through liberalized international trade and exploring the full potential of biofuel production in developing countries.
Removing subsidies from fossil fuels would make renewables (mainly biofuels) competitive in many areas. Generally speaking, the use of renewables might benefit from multilateral and regional cooperation, and the realistic implementation of WTO's Doha Work Programme and the 2002 WSSD Plan of Implementation.
24

List of Acronyms ANEEL – Brazilian Energy Regulatory Agency CDM – Clean Development Mechanism CENBIO – The Brazilian National Center for Reference in Biomass CETESB – The São Paulo State Environment Agency CO – Carbon monoxide CO2 – Carbon dioxide DMD – Doha Ministerial Declaration EGS – Environmental Goods and Services EU – European Union IBGE – Brazilian Institute of Geography and Statistics IEA – International Energy Agency HC – Hydrocarbon LDC – Least Developed Countries LHV – Low Heat Value MEA – Multilateral Environmental Agreements OECD – Organization for Economic Co-operation and Development PM – Particulate matter PROINFA – Alternative Sources for Electric Generation Incentive Program UNCTAD – United Nations Conference on Trade and Development UNDP – United Nations Development Program WEA – World Energy Assessment WSSD – World Summit on Sustainable Development WTO – World Trade Organization
25
References
Alonso, C.D.; Romano, J.; Godinho, R.; (1991) Chumbo na atmosfera de São Paulo – uma comparação dos teores encontrados antes e depois da introdução de etanol como combustível. In: 16º Congresso Brasileiro de Engenharia Sanitária e Ambiental;1991,Goiânia. ANFAVEA (2004) Anuário Estatístico, available at www.anfavea.com.br Braunbeck, O.; Bauen, A.; Rosillo-Calle, F.; Cortez, L. A. (1999), Prospects for Green Cane Harvesting and Cane Residue use in Brazil. Biomass and Bioenergy, Local, v.17, n.6, p.495-506. CENBIO (2004) Electricity Generation from Vegetable Oils in the Amazon (in Portuguese), Study under development by CENBIO/USP, COPPE/UFRJ and Amazonian institutions, funded by FINEP, Ministry of Science and Technology. CENBIO (2003) Estudo de pré-viabilidade ambiental comparativo entre o diesel tipo D e o éster etílico de óleo de soja São Paulo, July, 2003. CENBIO (2001) Levantamento do Potencial Real de Cogeração de Excedentes no Setor Sucroalcooleiro Final Report, São Paulo, September, 2001 CETESB (2004) personal communication CETESB (2003) Relatório de Qualidade do Ar no Estado de São Paulo. Coelho, S.T and Goldemberg, J. (2004) Alternative Fuels, Encyclopedia of Energy, Vol. 1, 3600 pages ISBN, 0-12-176480-X, Elsevier. Coelho and Walter (2004) Brazil – A Country Profile on Sustainable Development, Chapter 4, IAEA, Vienna, under publication. Coelho, S. T. (1999) Mecanismos para Implementação da Cogeração de Eletricidade a Partir de Biomassa - Um Modelo para o Estado de São Paulo. Ph.D. thesis, University of São Paulo (USP), 1999 .172 p. Available at: http://www.iee.usp.br/biblioteca/producao/1999/teses/suani.PDF European Commission (2000) Communication from the Commission; a review of the Auto Oil II programme, COM(2000)626 final, 2000. Available at http://europa.eu.int/comm/environment/autooil Goldemberg, J. (2003) The Case for Renewables, Thematic Background Paper to the Conference Renewables 2004, Bonn. Goldemberg et al., (2003) “Ethanol learning curve- the Brazilian experience”, Biomass and Bioenergy, Vol. 26/3 pp. 301-304. Goldemberg, J. (2002) The Brazilian energy initiative—support report. Paper Presented at the Johannesburg 2002 World Summit for Sustainable Development. Secretaria de Meio Ambiente, São Paulo (The Brazilian São Paulo State Environmental Secretariat). Goldemberg, J. (2000) personal communication. Haug, M. (2003) Prospects for Biofuels. Results to date from IEA´s transports biofuel project. Discussion Day on Biofuels, Maison de la Chimie, Paris, 13 May 2003. International Energy Agency. http://www.iea.org/dbtw-wpd/Textbase/speech/2003/haug/biofuels.pdf
26
IBGE, Produção Agrícola – Culturas Temporárias e Permanentes,multi-year. IEA (2004) Biofuels for Transport - An International Perspective. International Energy Agency, ISBN 92-64-01512-4. Extracts available at http://library.iea.org/dbtw-wpd/bookshop/add.aspx?id=176 IEA (2002) Energy balances from Non-OECD Countries. International Energy Agency, Paris Joseph Jr. (2003) personal communication. Macedo, Isaías de Carvalho; Leal, Manoel Regis Lima Verde e Silva, João Eduardo Azevedo Ramos da (2004). Assessment of greenhouse gas emissions in the production and use of fuel ethanol in Brazil. São Paulo: Secretaria de Meio Ambiente, March, 2004. 37p. www.unica.com.br/i_pages/files/pdf_ingles.pdf Moreira, J.R., Goldemberg, J. (1999). The Alcohol Program. Energy Policy 1999;27(4):229–45. 43. Nastari, PM (2004). Information Services on the Sugar and Ethanol Industries in Brazil. Personal Communication from Plinio Mario Nastari, from Seminar “Brazil and Energy on the 21st Century: Sugar and Ethanol” 2 Dec 2004, Palácio do Itamaraty, Brasília. Email address [email protected] website http://www.datagro.com.br/ingl/index2.asp Nogueira, L.A.H. and Macedo, I.C. (2004) Avaliação do Biodiesel no Brasil, Brasília. www.planalto.gov.br/secom/nae OECD/EUROSTAT (1999) The Environmental Goods and Services Industry, Manual for Data Collection and Analysis, Paris, 1999. OECD (2003) The Market Access Challenge in the Doha Development Agenda. OECD Global Forum on Trade. CCNM/GF/TR (2003) 1/PART2/FINAL 04-Jukl-2003. Available at http://www.olis.oecd.org/olis/2003doc.nsf/43bb6130e5e86e5fc12569fa005d004c/159dfebeee99a03dc1256d590054d2ce/$FILE/JT00147082.DOC Oestling, A. (2001) Bioethanol added to fuel. Directorate General for Research-Directorate. European Parliament Briefing Note N° 07/2001 EN. PE nr. 297.566 February 2001. Available at http://www.europarl.eu.int/stoa/publi/pdf/briefings/07_en.pdf RFA (2001) Ethanol and the Environment. Renewable Fuels Association http://www.ethanolrfa.org/factfic_envir.html UNDP, UNDESA and WEC (2002) World Energy Assessment 2000, New York, UNDP, ISBN 9211261260, http://www.undp.org/seed/eap/activities/wea UNCTAD (1995). Environmental Preferable Products (EPPs) as a Trade Opportunity for Developing Countries. Report by UNCTAD Secretariat, UNCTAD/COM/70, Geneva. UNICA (2003) – São Paulo Sugarcane Agroindustry Union (personal communication) www. unica.com.br. Van Thuijl, E.; Roos, C.J.; Beurskens, L.W.M. (2003). An overview of biofuel technologies, markets and policies in Europe. ECN Policy Studies ECN-C--03-008. Energy research Center of the Netherlands, January 2003, p.54, http://www.ecn.nl/docs/library/report/2003/c03008.pdf
27

Vikhlyaev, A. (2004) Environmental Goods and Services: Defining Negotiations or Negotiating Definitions? UNCTAD Secretariat. Available at http://r0.unctad.org/trade_env/test1/publications/TER2003eversion/Lead2.htm World Oil Balance charts, 2004. Available at http://omrpublic.iea.org/World/Table1.xls WTO (2002) World Trade Organization’s Environmental Database for 2001, WT/CTE/EDB/1.
28