united nations economic commission for europe statistical division why is disseminating millennium...
TRANSCRIPT

United Nations Economic Commission for EuropeStatistical DivisionUnited Nations Economic Commission for EuropeStatistical Division
Why is disseminating Millennium Development Goal indicators
important? Why should dissemination be
proactive?Training Workshop on Disseminating MDG Indicators and
Statistical Information
Astana, Kazakhstan, 23-25 November 2009
Petteri Baer, Regional Adviser, UNECE

23.11.2009 Petteri Baer - UNECE Statistical Division Slide 2
…and the same goes for MDG Indicators…
Only used statistical information is useful statistical information!

23.11.2009 Petteri Baer - UNECE Statistical Division Slide 3
Who needs MDG Indicators & statistical information?
Decision makers• In Business• In Administration• In Politics The Policy Cycle
Research and Educational Institutions
The Media Citizens NGOs…

23.11.2009 Petteri Baer - UNECE Statistical Division Slide 4
What do we mean by the Policy Cycle?
Policy is “a course or principle of action adopted by a government, party, business or individual”
Policies may aim to retain the status quo or implement a programme of reform or change
In reality, the policy cycle is often a messy process
23.11.2009 Petteri Baer - UNECE Statistical Division Slide 5
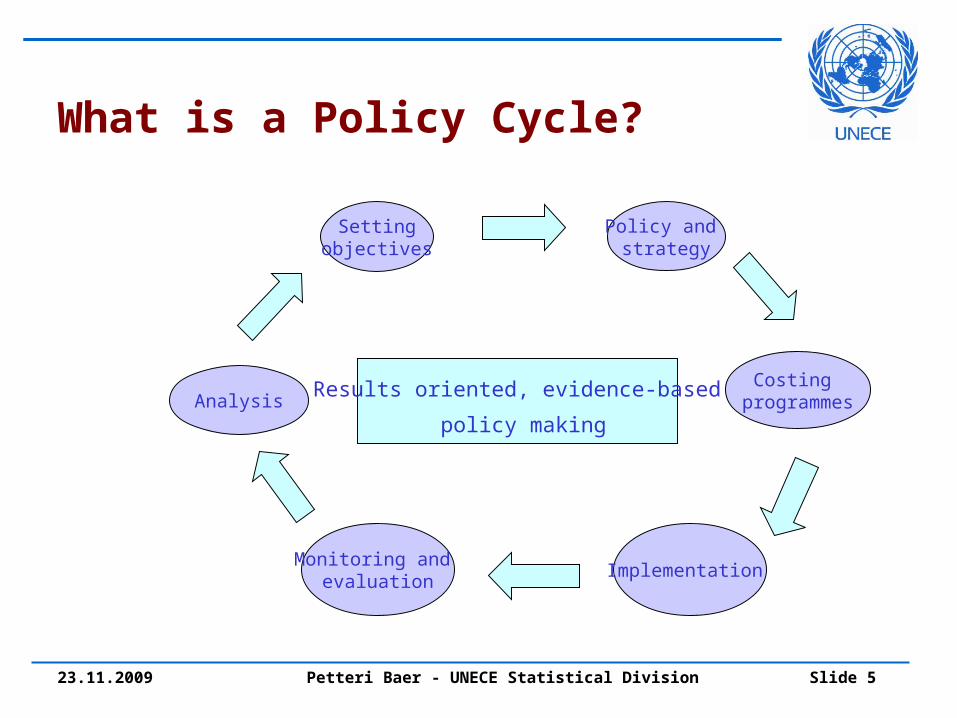
What is a Policy Cycle?
Settingobjectives
Costing programmes
Implementation Monitoring and
evaluation
Analysis
Policy and strategy
Results oriented, evidence-based
policy making

23.11.2009 Petteri Baer - UNECE Statistical Division Slide 6
What is an effective and efficient Policy Cycle?
Know clearly where we are: analysis
Know where we want to go: objectives
Understand the steps needed to get there: policies and strategies
Capacity to follow the steps: sound implementation procedures
Know where we are at any time: effective monitoring system
Learning from experience to inform and improve the next generation of policies and programmes

23.11.2009 Petteri Baer - UNECE Statistical Division Slide 7
What is an inclusive and accountable Policy Cycle?
Inclusive means that all relevant actors and stakeholders
• should be consulted and participate at various stages of the cycle
Accountable requires
• open and transparent procedures

23.11.2009 Petteri Baer - UNECE Statistical Division Slide 8
What is Evidence-Based Policy Making? In recent years there has been an effort to improve the
policy cycle in many countries by moving to “evidence-based policy making”
Evidence-based policy helps people make well-informed decisions about policy, programmes and projects by
• putting evidence from good and reliable information sources and
• research based evidence at the heart of policy development and implementation
A shift to evidence-based policy making will increase the possibility of meeting the MDG goals

23.11.2009 Petteri Baer - UNECE Statistical Division Slide 9
The Policy Cycle: Analysing the situation
Setting objectives
Fully costed programmes
Implementation
Analysis PRSP process: the theory
Policy and strategy
“Where are we now?”
• Including quantitative and qualitative analysis
• Characteristics of the population
• Macro, social, political constraints
• Current national strategies
Monitoring and evaluation

23.11.2009 Petteri Baer - UNECE Statistical Division Slide 10
The Policy Cycle:Setting objectives
Setting objectives
Fully costed programmes
Policy implementation
Monitoring
AnalysisPRSP process:
the theory
Policy and strategy
“Where do we want to go?”
• Set priorities and objectives
• Define medium- and long-term goals (for growth, poverty reduction etc)
• Integrate MDGs

23.11.2009 Petteri Baer - UNECE Statistical Division Slide 11
The Policy Cycle:Developing policies and strategies
Setting objectives
Fully costed programmes
Policy implementation
Monitoring and evaluation
Analysis PRSP process: the theory
Policy and strategy
“What do we need to do to reach objectives?”
• Examine existing programmes
• Identify priority policies and programmes
• Research: evidence-based policy making

23.11.2009 Petteri Baer - UNECE Statistical Division Slide 12
The Policy Cycle:Costing programmes
Setting objectives
Costing programmes
ImplementationMonitoring
AnalysisPRSP process:
the theory
Policy and strategy
“How much is it going to cost and where is the financing
coming from?”
• Cost the range of policies and programmesthat have been identified
• Align with budget process

23.11.2009 Petteri Baer - UNECE Statistical Division Slide 13
The Policy Cycle: Implementation
Policy formulation
Fully costed programmes
ImplementationMonitoring
Analysis
PRSP process: the theory
Policy and strategy
• Following the steps to deliver the policies and programmes
• Pilot testing and implementing new programmes

23.11.2009 Petteri Baer - UNECE Statistical Division Slide 14
The Policy Cycle: Monitoring and Evaluation
Setting objectives
Communication
Policy implementation
Monitoring
Analysis
Financing
“Are we following the steps set out and moving in the right direction?”
“Have we reached objectives?”
“Do we need to review objectives?”
“How can we improve progress against objectives?”
Monitoring and evaluation

23.11.2009 Petteri Baer - UNECE Statistical Division Slide 15
How does an MDG strategy fit into the national policy cycle?
Developing a strategy for meeting the MDGs usually has involved / involves three stages (+follow-up):
• Setting a baseline and National targets
• Conducting a needs assessment
• Building policies and programmes around needs assessments

23.11.2009 Petteri Baer - UNECE Statistical Division Slide 16
Important issues for the information providers on Indicators of MDGs
We should learn to know the need structures of our important users and user groups
We should make our information easily accessible for them
And we should put ourselves in continuous interaction with them in order to get to know them better

23.11.2009 Petteri Baer - UNECE Statistical Division Slide 17
User demands – how can they be found out?
Is knowing user demands important – or not?
Not a simple task Which users’ voices
are heard? How good is the
coverage of our information sources?

23.11.2009 Petteri Baer - UNECE Statistical Division Slide 18
More and more statistical publication takes place on the internet…
This is a very positive development
Availability and accessibility of official statistics has grown substantially
In the beginning of the year 2008
• >500 Million internet hosts in the world!
This also increases pressure on timeliness
Internet hosts in the Worldin the beginning of each year
* Millions *
0.00002 0.03 0.716
147
433
0
50
100
150
200
250
300
350
400
450
500
1982 1987 1992 1997 2002 2007

23.11.2009 Petteri Baer - UNECE Statistical Division Slide 19
So - isn’t it enough if we provide information on our web site? Searching on Google…
“Inflation”• 30 Million answers• Ergebnisse 1 - 10 von ungefähr
30‘700'000 für Inflation. (0.26 Sekunden)
“Social statistics”• 73 Million answers• Ergebnisse 1 - 10 von ungefähr
73‘100'000 für Social Statistics. (0.08 Sekunden)
• For USA “only” 4 Million
• For Switzerland “only” 1 Million
• For Kazakhstan “only” 0.2 Million

23.11.2009 Petteri Baer - UNECE Statistical Division Slide 20
And note:– There are other traps on the way!
Just putting your information on your web site does not automatically mean it is utilized
Even though your web information is utilized, it does not mean that your most important users make use of it

23.11.2009 Petteri Baer - UNECE Statistical Division Slide 21
All potentialusers
These guysare real users
Heavy user
Traps on the way, continued
You may cover only a tinyshare of your potential users- but not recognize it!

23.11.2009 Petteri Baer - UNECE Statistical Division Slide 22
Traps on the way, continued
Counting the popularity of your web site by “hits” may deceive you because • a substantial part of
the “fabulous growth” comes from search engines checking if you have any new information

23.11.2009 Petteri Baer - UNECE Statistical Division Slide 23
To develop understandable messages may also not be all that easy in the jungle of statistical information

23.11.2009 Petteri Baer - UNECE Statistical Division Slide 24
How do we perceive ourselves? How do decision makers perceive our services?
How important is our role in real decision making?
In practical terms? How covering is our
information on users? Do we know enough
about our potential users, our potential customers?

23.11.2009 Petteri Baer - UNECE Statistical Division Slide 25
User demands – the basic ones
User friendly Easily accessible Understandable and clear Focused on the essentials With visual presentations Impressive Balanced
23.11.2009 Petteri Baer - UNECE Statistical Division Slide 26
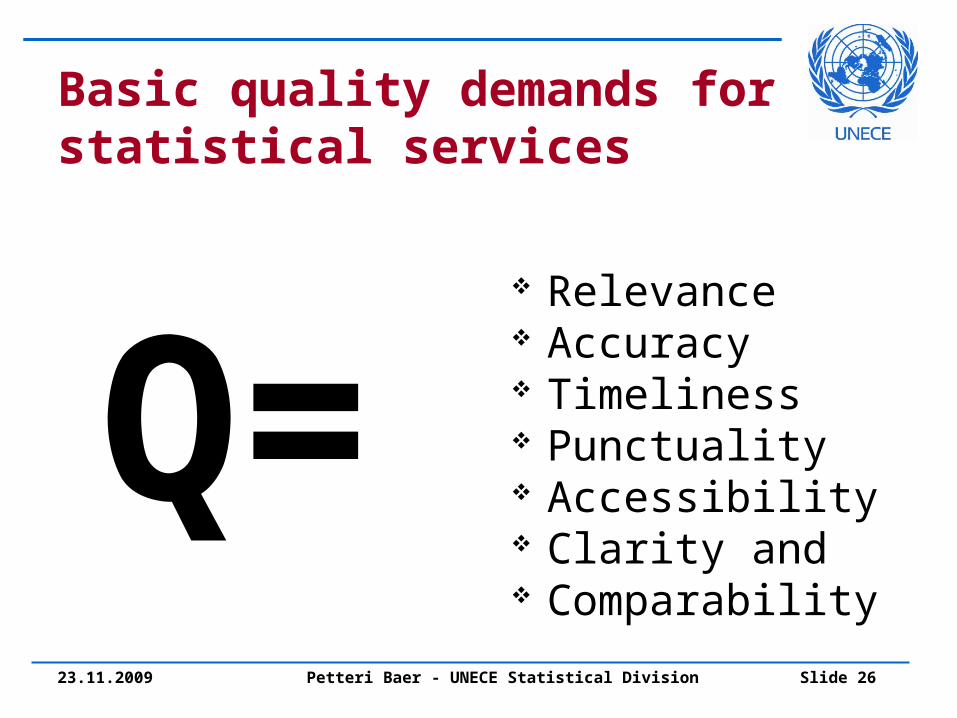
Basic quality demands for statistical services
Q=
Relevance Accuracy Timeliness Punctuality Accessibility Clarity and Comparability

23.11.2009 Petteri Baer - UNECE Statistical Division Slide 27
Trade-offs almost every day
Timeliness is a must – but what about accuracy?
Relevance is a must – but what about needs specific only to one or a few users?
Remember:Only used statistics is useful statistics

23.11.2009 Petteri Baer - UNECE Statistical Division Slide 28
User friendly statistical services
…can be established only through interaction with users• Interaction with real users• Not with solely our
imagination on them• Not only governmental
users• Not only the ones we by
tradition are mainly used to

23.11.2009 Petteri Baer - UNECE Statistical Division Slide 29
Who bears the responsibility that communication with users works well?
The future… The importance… Our place in society
is at stake… Users’ judgement
may well define, how our statistical services are perceived and used

23.11.2009 Petteri Baer - UNECE Statistical Division Slide 30
Who bears the responsibility that communication with users works well? (2) Is it the individual
statistician, the subject-matter expert?
Program managers? Information & PR Unit? Or – Is it a challenge for
the top management?• Who should bring in a
systematic approach on building user relations, if it is missing?
3.6.1999
Source: Seppo Määttä & Timo Ojala (1999). TASAPAINOISEN ONNISTUMISEN HAASTE - Johtamin en julkisellasektoril la ja Balanced Scorecard. Edita Oy.
MissionMandate
Responsibilities
CapabilitiesResources
STRATEGIC SCOPE

23.11.2009 Petteri Baer - UNECE Statistical Division Slide 31
A modulated approach - basics for efficient user services The importance of
• A good information architecture
• Effective databases• Metadata information
available• Linking identifications
exist between different data
• XML helps to build electronic bridges

23.11.2009 Petteri Baer - UNECE Statistical Division Slide 32
The importance of user friendly Database services Statistical agencies produce quite a lot of
statistical information Different users have different aspects of
interest, they want information• By industries, By enterprise sizes• By regions• Comparisons over different time periods• International comparisons• And numerous other aspects…
PC-Axis, PX-Web… User friendly services!

23.11.2009 Petteri Baer - UNECE Statistical Division Slide 33
Often it is not easy, especially if information providers work in silos - and behave as that would be ideal

23.11.2009 Petteri Baer - UNECE Statistical Division Slide 34
Internet has in recent years pushed for building corporate imagos
It has also highlighted the often very different approaches different departments/divisions/units may have on ways of publishing data
Sometimes these differences are reflected on the web site of the NSI!

23.11.2009 Petteri Baer - UNECE Statistical Division Slide 35
Tools assisting work for better satisfaction of user needs
Customer databases• Information on regular and heavy users
Customer Relationship Management system ( CRM)• For good and systematic follow-up and
planning of interaction with regular and heavy users
• Example NSO:s: Canada, Finland, Estonia Business Intelligence systems

23.11.2009 Petteri Baer - UNECE Statistical Division Slide 36
But – that’s already another story
Thank you for your attention
Remember:• Only used statistics is
useful statistics Final question – who will
have the responsibility for systematic satisfaction of user needs on information on MDG Indicators & on Statistical Information in general?
A learningCustomerRelationship