united republic of tanzania - tanzania online · pdf file · 2010-04-16united...
TRANSCRIPT
UNITED REPUBLIC OF TANZANIA MINISTRY OF INDUSTRY, TRADE AND MARKETING
ANALYSIS OF THE SERVICES SECTOR WITH A VIEW TO MAKING COMMITMENTS IN THE CONTEXT OF TRADE
LIBERALIZATION AT BILATERAL, REGIONAL AND MULTILATERAL TRADE NEGOTIATIONS
THE CASE OF TANZANIA
TABLE OF CONTENTS PAGE EXECUTIVE SUMMARY................................................................................................................. v 1. INTRODUCTION ...................................................................................................................... 1 2. TRADE IN SERVICES IN TANZANIA: FACTS, FIGURES AND INTERNATIONAL TRADE
PROFILE. ................................................................................................................................. 4 3. INTERNATIONAL LEGAL FRAMEWORK GOVERNING TRADE IN SERVICES: THE GENERAL
AGREEMENT ON TRADE IN SERVICES .................................................................................. 8
3.1 THE NON DISCRIMINATORY RULES IN INTERNATIONAL TRADE IN SERVICES... 8 3.1.1. MOST FAVORED NATION AND NATIONAL TREATMENT ............................. 8 3.1.2. PROGRESSIVE LIBERALIZATION ................................................................. 9 3.1.3. SCHEDULES OF COMMITMENTS ................................................................ 10 3.1.4. BINDING NATURE OF SCHEDULES AND THE DIFFICULT ROLL-BACK
PROCESS..................................................................................................... 11 4 SECTORAL ANALYSIS........................................................................................................... 13
4.1 COMMUNICATIONS SECTOR ............................................................................... 13 4.1.1 INVESTMENTS IN THE SECTOR................................................................... 14 4.1.2 OPPORTUNITIES AND CHALLENGES/RISKS IN THE TELECOMMUNICATIONS
SUB SECTOR ................................................................................................ 18 4.2 CONSTRUCTION SECTOR .................................................................................... 20
4.2.1 SECTOR PERFORMANCE ............................................................................ 21 4.2.2 OPPORTUNITIES AND CHALLENGES/RISKS............................................... 23
4.3 TOURISM SECTOR ................................................................................................ 25 4.3.1 THE STRATEGIES TOWARDS IMPROVING TOURISM SERVICES IN
TANZANIA................................................................................................... 26 4.3.2 PERFORMANCE OF THE SECTOR................................................................ 27 4.3.3 OPPORTUNITIES AND CHALLENGES/RISKS............................................... 29
4.4 TRANSPORT SERVICES ........................................................................................ 30 4.4.1 REFORMS IN THE SECTOR.......................................................................... 30 4.4.2 STATUS OF THE TRANSPORT SECTOR BY TYPE ........................................ 31 4.4.3 PROPOSED POLICY OPTIONS FOR GOVERNMENT DECISIONS.................. 43
4.5 HEALTH SECTOR................................................................................................. 44 4.5.1 HUMAN RESOURCE GAPS IN BOTH GOVERNMENT AND PRIVATE HEALTH
FACILITIES AS AT DECEMBER 2006............................................................ 47 4.5.2 INVOLVEMENT OF HEALTH SECTOR IN INTERNATIONAL TRADE ............. 48 4.5.3 HEALTH SERVICES IN THE WTO............................................................... 48 4.5.4 POLICY OPTIONS TO BALANCE MODE 4 WITH OBLIGATIONS TO PROVIDE
UNIVERSAL ACCESS TO BASIC HEALTH SERVICES. ................................. 50 4.6 EDUCATIONAL SECTOR ...................................................................................... 52
4.6.1 FORMAL EDUCATION AND TRAINING SYSTEM ......................................... 53 4.6.2 OBJECTIVES AND SUCCESSES OF EDUCATIONAL DEVELOPMENT
PROGRAMMES............................................................................................ 53 4.6.3 OPPORTUNITIES AND CHALLENGES/RISKS............................................... 57
4.7 FINANCIAL SECTOR ............................................................................................ 59 4.7.1 FINANCIAL SECTOR PERFORMANCE .......................................................... 61

4.7.2 OPPORTUNITIES AND CHALLENGES/RISKS............................................... 62 5. CONCLUSIONS AND RECOMMENDATIONS ........................................................................... 64
iii
ACRONYMS AQSRB - Architect and Quantity Surveyors Registration Board CMSA - Capital Market and Securities Authority CEMAC - Economic and Monetary Community of Central Africa CIDF - Construction Industry Development Fund CRB - Construction Registration Board DRC - Democratic Republic of Congo EAC - East African Community ECOWAS - Economic Community of West African States ERB - Engineers Registration Board ERPs - Economic Recovery Programmes ESA - Eastern and Southern African GATS - General Agreement on Trade in Services GDP - Gross Domestic Product IMF - International Monetary Fund IMO - International Maritime Organization IRP - Integrated Roads Project MFN - Most Favoured Nation MMEM - Primary Educational Development programme/plan MMES - Secondary education Development programme/plan MOID - Ministry of Infrastructure Development KADCO - Kilimanjaro International Airport Development Company NCC - National Construction Council NESP - National Economic Survival Programme PHSDP - Primary Health Services Development plan PMP - Port Modernization Project PSO - Public Service Obligations PPPs - Public Private Partnership PSRC - Tanzania Parastatal Sector Reform Commission RAHCO - Reli Assets Holding Company Ltd RRP - Railway Restructuring Project SADC - Southern African Development Community SACCOS - Savings and Credit Cooperative Societies SAP - Structural Adjustments Programmes SMEs - Small and Medium Enterprises SUMATRA - Surface and Marine Transport Regulatory Authority) TAMESA. - Tanzania electrical, Mechanical and Electronics Services Agency TAZARA - Tanzania and Zambia Railway Authority TBA - Tanzania Building Agency, TCAA - Tanzania Civil Aviation Authority. TCRA - Tanzania Communications Regulatory Authority TICTS - Tanzania International Container Terminal Services TGDLC - Tanzania Global Distance Learning Center TMA - Tanzania Meteorological Agency TRL - Tanzania Railway Limited TSIP - Transport Sector Investment Programme VETA - Vocational Education Training Authority WB - World Bank WTO - World Trade Organisation
EXECUTIVE SUMMARY Trade in services is a new and dynamic sector making bigger contributions to the gross domestic product of countries. However, for LDCs severe challenges remain in the services sector particularly related to regulatory capacity. A new trend in various trade negotiations is to seek market access and national treatment commitments from LDCs in various sectors. In responding to these requests, either at the WTO, EPAs or bilateral level, LDCs have to remain in tune with the reality of their weaknesses in capacity and carefully assess the ability of commitments to make positive contribution to their economic development.
An important question that has occupied literary discourse on issues of services liberalization is that of sequencing patterns. It is well accepted that in order for liberalization of trade in services to contribute to the economic growth and development of LDCs, it is important to front load the development of regulatory capacity to tame the risks that may come with liberalization.
In this study, we respond to a request by Tanzania’s Ministry of Trade to assist in analysing the sectoral detail of various sectors with a view to pointing out key policy issues, and negotiation positions that can be taken at various negotiations. The study looks at telecommunications, construction, tourism, transport, health, education and financial services. In each of these sectors, the situation of the sector in terms of regulatory capacity, opportunities and challenges is analysed, on the basis of which, policy options are proposed for government decisions. Out of the various options proposed, a key option is singled out which in a snap shot summarises our considered findings.
In many of the cases, it comes out clearly that a key challenge is non understanding of the GATS, and maybe more importantly, the utility of the instrument vis a vis the intended benefits and objectives.-which are to attract foreign direct investment which in turn is expected to engine economic growth ad development.
There are some areas where commitments may be contemplated but this would have to be pre-conditioned on the attainment of regulatory capacity and the meeting of universal service obligations. Some sectors are more difficult than others. In some cases, the issue is more one of request than offer-particularly where Tanzania has export interest such as in mode 4.
In sum, the study finds that while commitments may be contemplated in some sectors, rigorous programs to develop regulatory capacity and skilful scheduling will be inescapable.
1. INTRODUCTION
The services sector is a new and dynamic sector that is making significant contributions to the economies of various countries, including developing ones. There is no hard and fast way to define services. In many cases, the easiest way is to define them by juxtaposition with what they are not: goods. Services would typically involve more intangible tradables such as banking, insurance, telecommunications, medical and distribution services.
The World Trade Organisations’ (WTO) General Agreement on Trade in Services (GATS) defines services against the mode in which they are provided. Services can be provided from the territory of one Member into any other Member (mode 1-cross border), in the territory of one Member to the service consumer of any other Member (mode 2-consumption abroad), by a service supplier of one Member through commercial presence in the territory of any other Member ( mode 3-commercial presence) and by a service supplier of one Member, through presence of natural persons of a Member in the territory of any other Member (mode 4-presence of natural persons). The modal definition of services in the GATS emphasises their tradability.
In many cases, trade in services has an inextricable link to trade in goods: such as the link between medical and distribution services, services incidental to agriculture and transportation services and retail services for goods and the role of financial services therein.
There are difficulties in measuring with precision the actual contribution of trade in services to countries owing especially to the intangible nature of services, which makes it difficult to use certain policy instruments, like tariffs, to quantify and assess contributions to individual economies, which can then be aggregated to regional blocks. There is also the traditional problem of non-stockability of services, which many times require simultaneous production and consumption, making quantification difficult. The highly informal nature of many services activities makes it even more difficult to calculate its contributions, as well as the large amount of behind the border measures, mainly through discriminatory regulatory practices, which are all difficult to quantify.
In cross border supply (Mode 1), the fluidity of this movement makes it almost impossible to quantify. Although some statistics can be tracked in cases of consumption abroad (mode 2), from the consumers of tourism and education, these may not be the only sectors in which consumption abroad is utilized as a supply mode. There may also be a cross-link between tourism and medical services, and the difficulty in capturing exact contributions of each sector remains. In the case of setting up commercial presence, (mode 3), foreign direct investment statistics are an information source, although even these do not cover the entire picture, as there may be firms that are not necessarily part of foreign subsidiaries-therefore not mode 3 in the strict sense, and yet governments would normally include these in their calculations. Presence of natural persons (mode 4) is even harder to capture as it is difficult to draw the line between the broad temporary presence of natural persons and those providing services in GATS mode 4.
All the above notwithstanding, there are some studies that show the importance of trade in services at global, regional and country specific levels. The World Bank (2007) estimates that the contribution of services to the GDP calculations of developed countries is between 60 to 70 percent and the figure in developing and least developed countries are estimated to be
1
between 36 to 40 per cent.
The UNCTAD LDC report of 2006 showed that the economically productive population engaged in agriculture would be outpaced by other sectors, pointing out the services sector as a key scorer.
According to the World Development Indicators of 2003, the share of services measured as a percentage of gross domestic product (GDP) calculations for ACP countries of which Tanzania is part, was in the range of 50 per cent with key sectors within the region being travel/tourism, transport, financial services, telecommunication services, and leading contenders being Caribbean countries. The services sector is also a leading provider of employment in the ACP region.1
Rapid growth in the services sector is partly due to progress made in communication sectors (telecommunications and information technology) making it easier for suppliers to operate outside their domestic markets. In India for example, information technology-enabled services are responsible for a third of the total services exports. The value added in exports of services increased GDP growth by 0.2 and 0.6 percentage points annually over the 1980s and 1990s respectively.
Some figures in the ACP region are as follows: In the Economic and Monetary Community of Central Africa (CEMAC), an annual growth rate of 6.5% is experienced in the services sector, contributing to GDP formation, with predominant sectors being distribution and transportation services. These sectors amount to an average of 65% of the production of services in the sub-region.
In the Economic Community of West African States (ECOWAS), Nigeria registers a contribution of 33.3% of the services sector to GDP, with key sectors being finance and insurance, as well as the energy sector arising from natural endowments of oil. In Senegal, the services sector generates at least two-thirds of GDP, and is expected to continue growing, especially in the area of telecommunications. Cote d’Ivoire has a diversified financial sector. Cape Verde is particularly strong in transportation, travel and other commercial services.
In the Eastern and Southern African (ESA) region, World Bank statistics indicate that the services sector contributes up to an average of 50% to the GDP of many ESA countries.2 In addition to all these figures, there are significant indirect effects on poverty reduction in the form of remittances from workers in foreign jurisdictions, domestic employment and direct and indirect consumption.
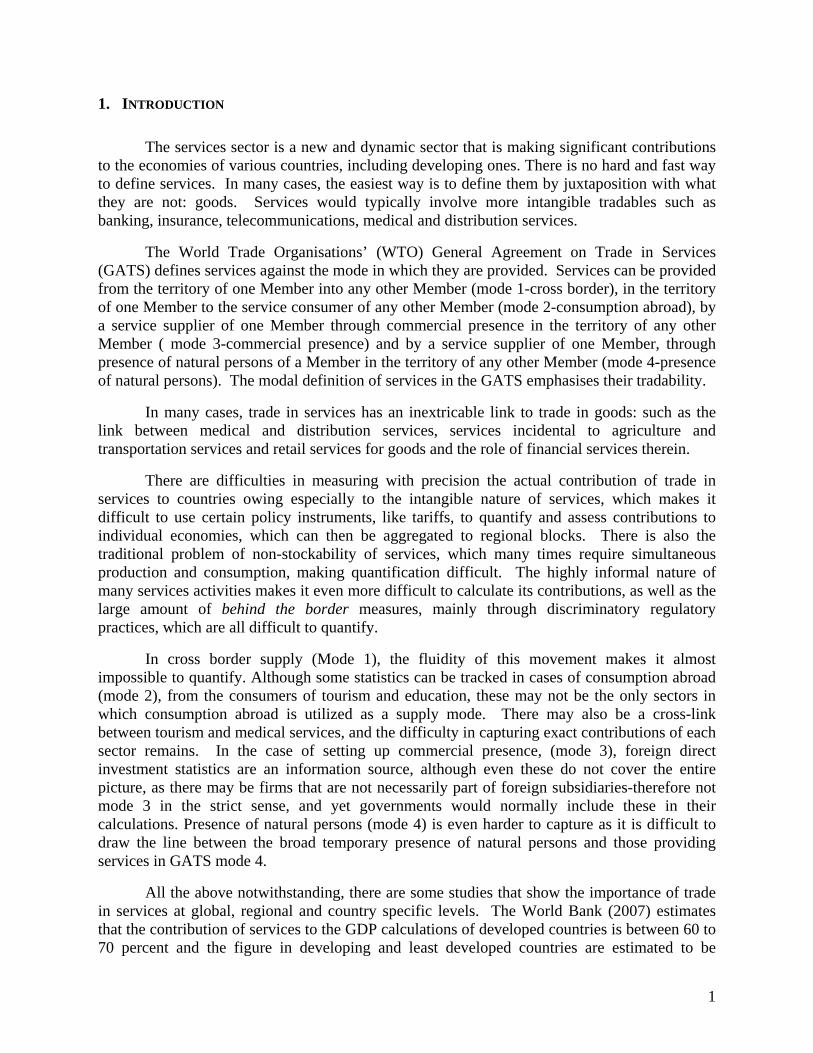
Compared to trade in goods, the services sector is recording faster growth rates. In the figure 1 below, we see the share of services value added in GDP as at 2003. 1 World Development Indicators 2003, quoted in Special and Differential Treatment in Post Cotonou services Negotiations, ODI, 2004. 2 World Bank WDI 2005, online available http://www.worldbank.org
2
© W TO/OMC 2
Share of Services Value Added in GDP Country groups and Pakistan, 2003 (percentage)
Services and TIS
0 %10 %20 %30 %40 %50 %60 %70 %80 %90 %
1 00 %
W orld High inco me Midd leinco me
L ow income Pakistan
Services Agriculture Industry
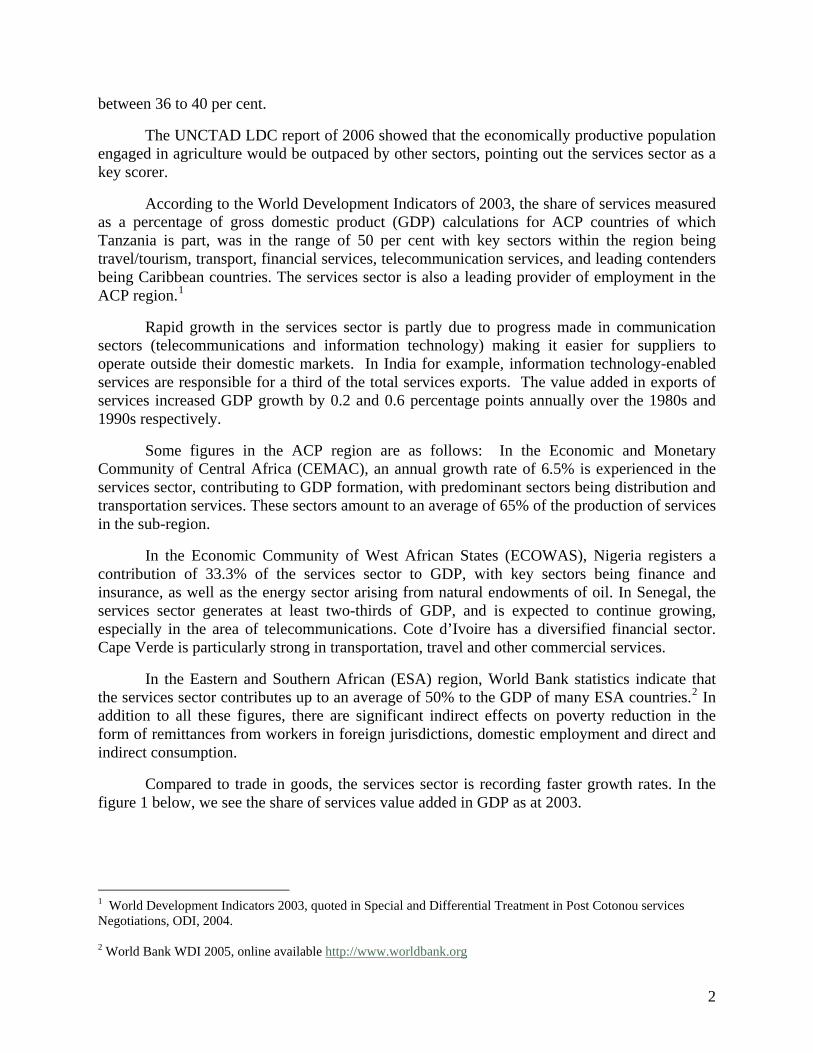
Source: WTO/OMC The activities’ contribution to LDCs in GDP terms.
Activity's contribution to LDC's GDP (%) 2005
0
5
10
15
20
25
30
35
40
45
50
Least developed countries: UN classification
IndustryAgricultureServices
Source: World Development Indicators (WDI) database online, 2006.
3
2. TRADE IN SERVICES IN TANZANIA: FACTS, FIGURES AND INTERNATIONAL TRADE PROFILE.
The Tanzania Economic Survey (2006) indicates that growth in the services sector (e.g. hotels, restaurants and the tourism sector) was by 8.4% in 2006 compared to 8.2% in 2005. The Construction sector grew by 10% in 2006 compared to 10.3% in 2005. Transport and Communications sector grew by 7.5% compared to 6.4% in 2005 (the increase in growth resulted from improvements in the road sector and investments in mobile phones coupled with rehabilitation of communications infrastructure in the country). The financial and business services sector grew by 5.5% in 2006 compared to 5.3% in 2005. The finance, insurance and real estate sub-sectors grew by 5.9 and 5.2% in 2006 compared to 5.7 and 5.0% respectively in 2005. The growth rate of public administration and other services sectors grew by 5.1% in 2006.
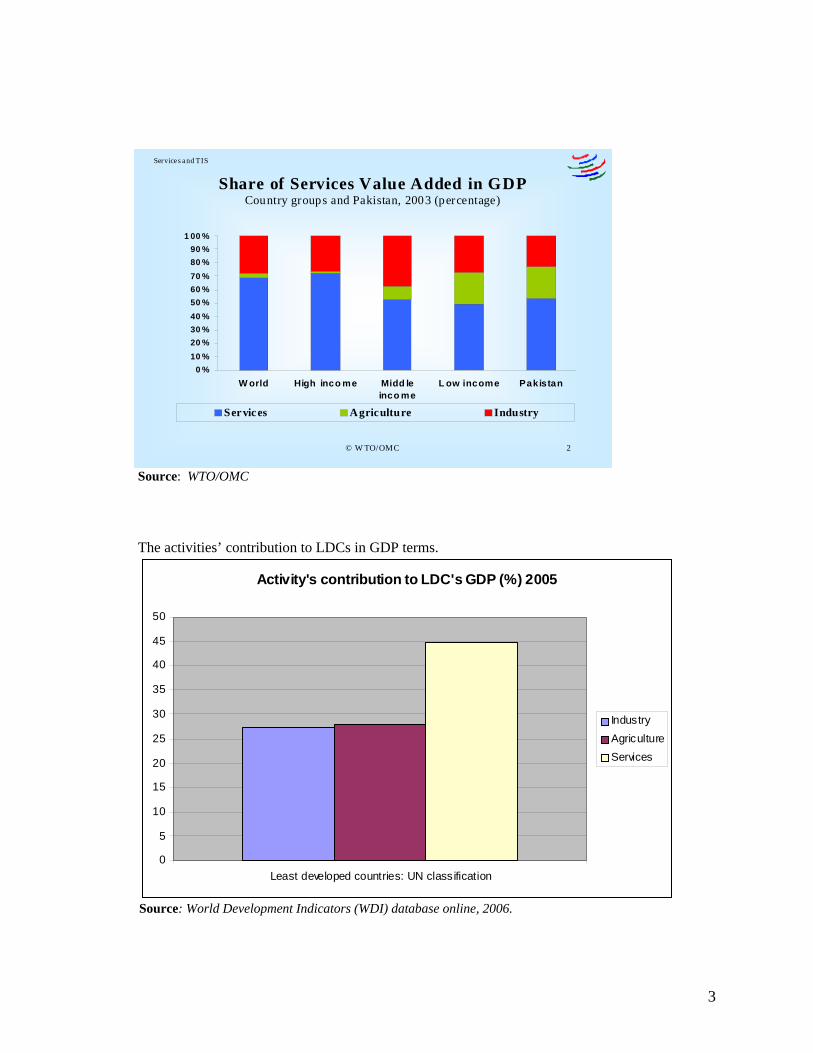
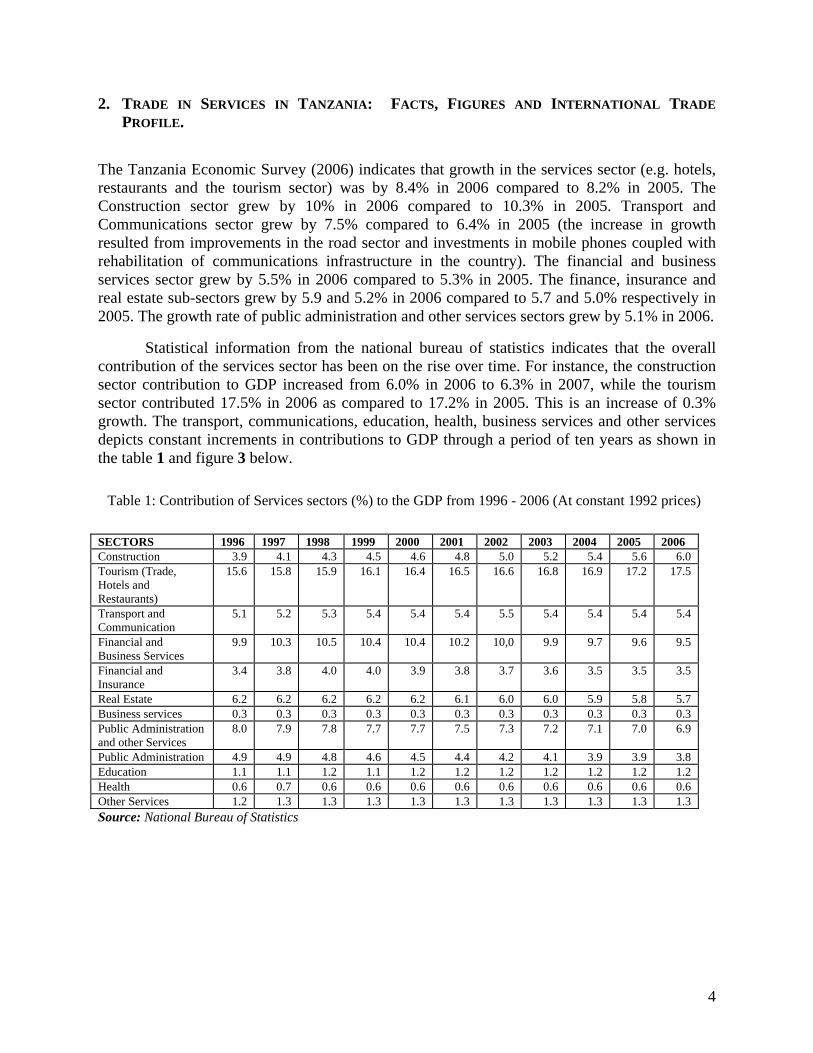
Statistical information from the national bureau of statistics indicates that the overall contribution of the services sector has been on the rise over time. For instance, the construction sector contribution to GDP increased from 6.0% in 2006 to 6.3% in 2007, while the tourism sector contributed 17.5% in 2006 as compared to 17.2% in 2005. This is an increase of 0.3% growth. The transport, communications, education, health, business services and other services depicts constant increments in contributions to GDP through a period of ten years as shown in the table 1 and figure 3 below.
Table 1: Contribution of Services sectors (%) to the GDP from 1996 - 2006 (At constant 1992 prices)
SECTORS 1996 1997 1998 1999 2000 2001 2002 2003 2004 2005 2006 Construction 3.9 4.1 4.3 4.5 4.6 4.8 5.0 5.2 5.4 5.6 6.0 Tourism (Trade, Hotels and Restaurants)
15.6 15.8 15.9 16.1 16.4 16.5 16.6 16.8 16.9 17.2 17.5
Transport and Communication
5.1 5.2 5.3 5.4 5.4 5.4 5.5 5.4 5.4 5.4 5.4
Financial and Business Services
9.9 10.3 10.5 10.4 10.4 10.2 10,0 9.9 9.7 9.6 9.5
Financial and Insurance
3.4 3.8 4.0 4.0 3.9 3.8 3.7 3.6 3.5 3.5 3.5
Real Estate 6.2 6.2 6.2 6.2 6.2 6.1 6.0 6.0 5.9 5.8 5.7 Business services 0.3 0.3 0.3 0.3 0.3 0.3 0.3 0.3 0.3 0.3 0.3 Public Administration and other Services
8.0 7.9 7.8 7.7 7.7 7.5 7.3 7.2 7.1 7.0 6.9
Public Administration 4.9 4.9 4.8 4.6 4.5 4.4 4.2 4.1 3.9 3.9 3.8 Education 1.1 1.1 1.2 1.1 1.2 1.2 1.2 1.2 1.2 1.2 1.2 Health 0.6 0.7 0.6 0.6 0.6 0.6 0.6 0.6 0.6 0.6 0.6 Other Services 1.2 1.3 1.3 1.3 1.3 1.3 1.3 1.3 1.3 1.3 1.3 Source: National Bureau of Statistics
4
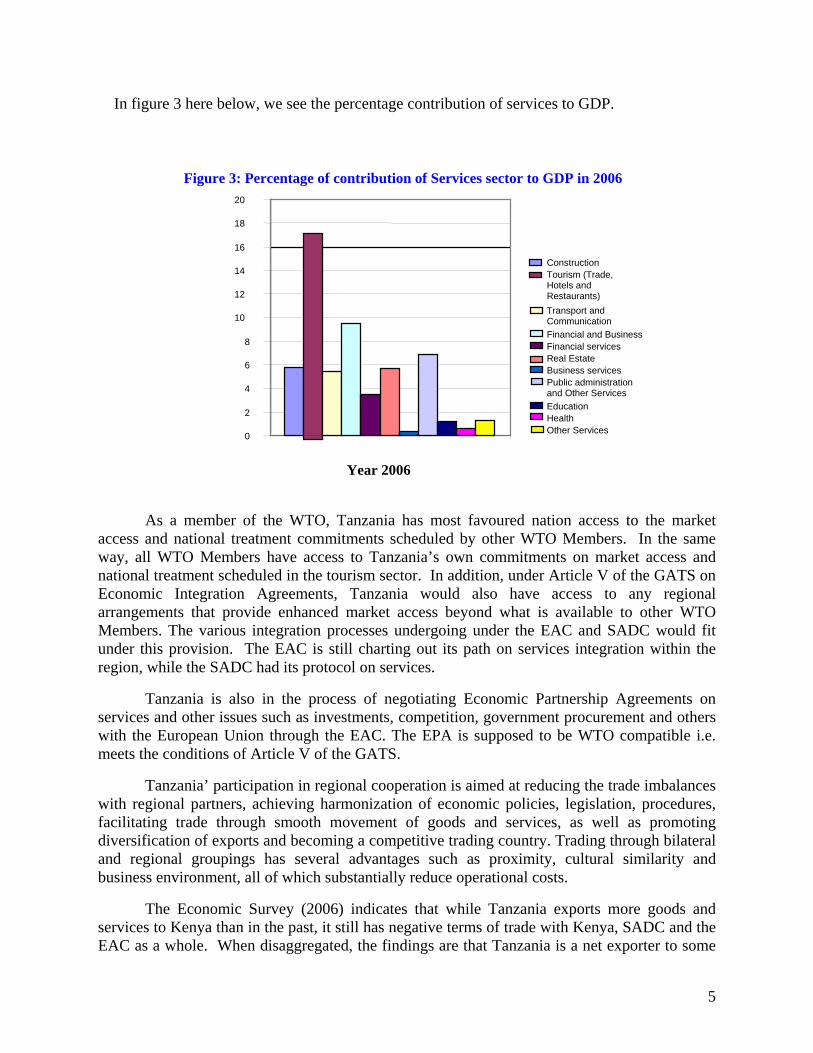
In figure 3 here below, we see the percentage contribution of services to GDP.
Figure 3: Percentage of contribution of Services sector to GDP in 2006 20
18
16ConstructionTH
ourism (Trade, otels and
Restaurants)
14
12
Transport and Communication Financial and Business Financial servicesReal EstateBusiness services Public administration
nd Other Services a EducationHealthOther Services
10
8
6
4
2
0
Year 2006
As a member of the WTO, Tanzania has most favoured nation access to the market access and national treatment commitments scheduled by other WTO Members. In the same way, all WTO Members have access to Tanzania’s own commitments on market access and national treatment scheduled in the tourism sector. In addition, under Article V of the GATS on Economic Integration Agreements, Tanzania would also have access to any regional arrangements that provide enhanced market access beyond what is available to other WTO Members. The various integration processes undergoing under the EAC and SADC would fit under this provision. The EAC is still charting out its path on services integration within the region, while the SADC had its protocol on services.
Tanzania is also in the process of negotiating Economic Partnership Agreements on services and other issues such as investments, competition, government procurement and others with the European Union through the EAC. The EPA is supposed to be WTO compatible i.e. meets the conditions of Article V of the GATS.
Tanzania’ participation in regional cooperation is aimed at reducing the trade imbalances with regional partners, achieving harmonization of economic policies, legislation, procedures, facilitating trade through smooth movement of goods and services, as well as promoting diversification of exports and becoming a competitive trading country. Trading through bilateral and regional groupings has several advantages such as proximity, cultural similarity and business environment, all of which substantially reduce operational costs.
The Economic Survey (2006) indicates that while Tanzania exports more goods and services to Kenya than in the past, it still has negative terms of trade with Kenya, SADC and the EAC as a whole. When disaggregated, the findings are that Tanzania is a net exporter to some
5
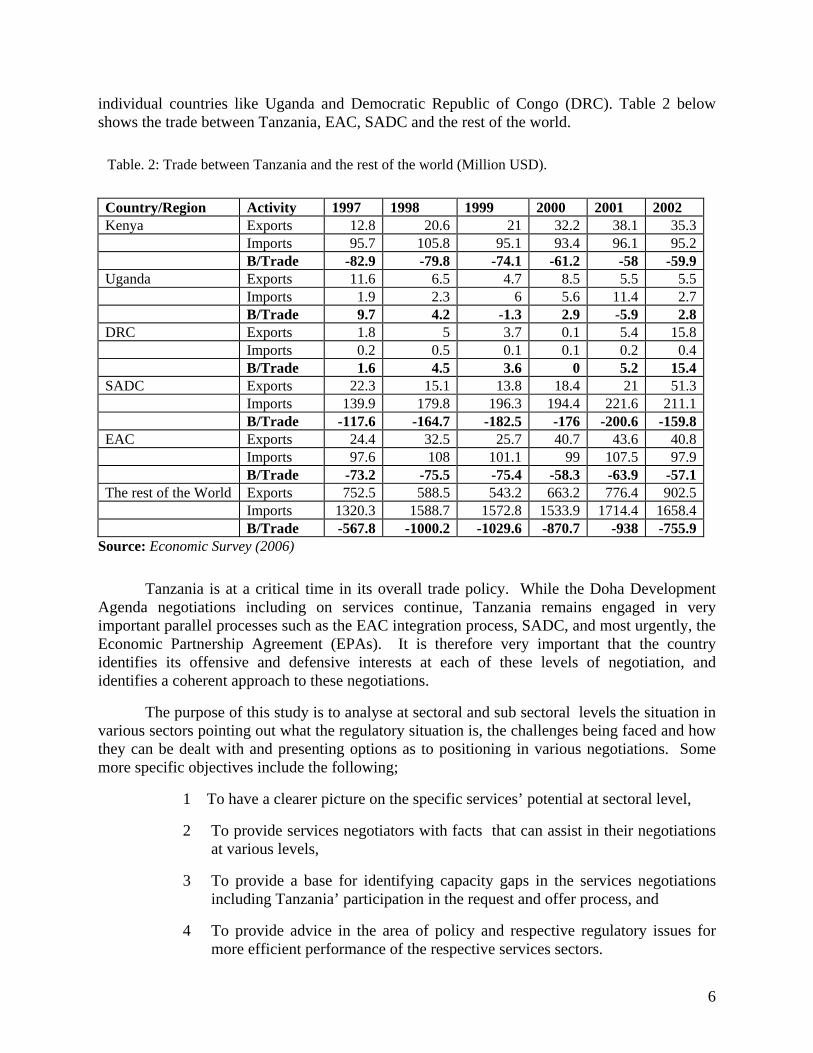
individual countries like Uganda and Democratic Republic of Congo (DRC). Table 2 below shows the trade between Tanzania, EAC, SADC and the rest of the world.
Table. 2: Trade between Tanzania and the rest of the world (Million USD).
Country/Region Activity 1997 1998 1999 2000 2001 2002 Kenya Exports 12.8 20.6 21 32.2 38.1 35.3 Imports 95.7 105.8 95.1 93.4 96.1 95.2 B/Trade -82.9 -79.8 -74.1 -61.2 -58 -59.9Uganda Exports 11.6 6.5 4.7 8.5 5.5 5.5 Imports 1.9 2.3 6 5.6 11.4 2.7 B/Trade 9.7 4.2 -1.3 2.9 -5.9 2.8DRC Exports 1.8 5 3.7 0.1 5.4 15.8 Imports 0.2 0.5 0.1 0.1 0.2 0.4 B/Trade 1.6 4.5 3.6 0 5.2 15.4SADC Exports 22.3 15.1 13.8 18.4 21 51.3 Imports 139.9 179.8 196.3 194.4 221.6 211.1 B/Trade -117.6 -164.7 -182.5 -176 -200.6 -159.8EAC Exports 24.4 32.5 25.7 40.7 43.6 40.8 Imports 97.6 108 101.1 99 107.5 97.9 B/Trade -73.2 -75.5 -75.4 -58.3 -63.9 -57.1The rest of the World Exports 752.5 588.5 543.2 663.2 776.4 902.5 Imports 1320.3 1588.7 1572.8 1533.9 1714.4 1658.4 B/Trade -567.8 -1000.2 -1029.6 -870.7 -938 -755.9
Source: Economic Survey (2006)
Tanzania is at a critical time in its overall trade policy. While the Doha Development Agenda negotiations including on services continue, Tanzania remains engaged in very important parallel processes such as the EAC integration process, SADC, and most urgently, the Economic Partnership Agreement (EPAs). It is therefore very important that the country identifies its offensive and defensive interests at each of these levels of negotiation, and identifies a coherent approach to these negotiations.
The purpose of this study is to analyse at sectoral and sub sectoral levels the situation in various sectors pointing out what the regulatory situation is, the challenges being faced and how they can be dealt with and presenting options as to positioning in various negotiations. Some more specific objectives include the following;
1 To have a clearer picture on the specific services’ potential at sectoral level,
2 To provide services negotiators with facts that can assist in their negotiations at various levels,
3 To provide a base for identifying capacity gaps in the services negotiations including Tanzania’ participation in the request and offer process, and
4 To provide advice in the area of policy and respective regulatory issues for more efficient performance of the respective services sectors.
6
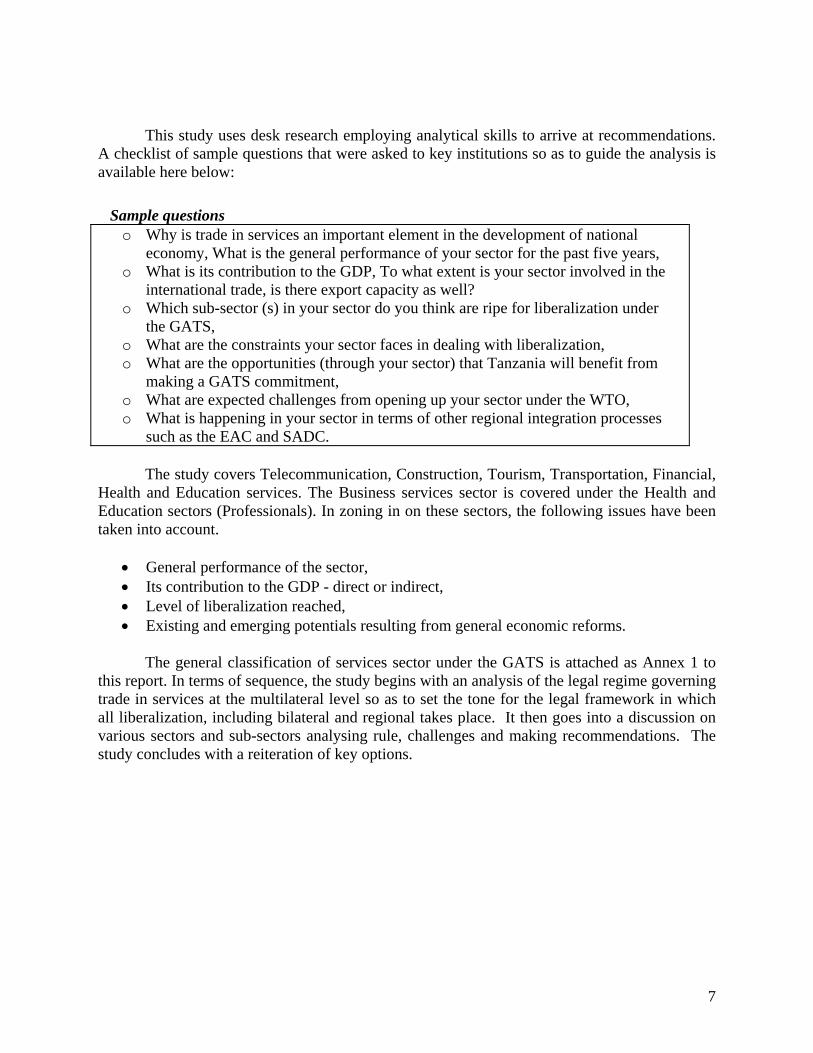
This study uses desk research employing analytical skills to arrive at recommendations. A checklist of sample questions that were asked to key institutions so as to guide the analysis is available here below:
Sample questions o Why is trade in services an important element in the development of national
economy, What is the general performance of your sector for the past five years, o What is its contribution to the GDP, To what extent is your sector involved in the
international trade, is there export capacity as well? o Which sub-sector (s) in your sector do you think are ripe for liberalization under
the GATS, o What are the constraints your sector faces in dealing with liberalization, o What are the opportunities (through your sector) that Tanzania will benefit from
making a GATS commitment, o What are expected challenges from opening up your sector under the WTO, o What is happening in your sector in terms of other regional integration processes
such as the EAC and SADC.
The study covers Telecommunication, Construction, Tourism, Transportation, Financial, Health and Education services. The Business services sector is covered under the Health and Education sectors (Professionals). In zoning in on these sectors, the following issues have been taken into account.
• General performance of the sector, • Its contribution to the GDP - direct or indirect, • Level of liberalization reached, • Existing and emerging potentials resulting from general economic reforms.
The general classification of services sector under the GATS is attached as Annex 1 to this report. In terms of sequence, the study begins with an analysis of the legal regime governing trade in services at the multilateral level so as to set the tone for the legal framework in which all liberalization, including bilateral and regional takes place. It then goes into a discussion on various sectors and sub-sectors analysing rule, challenges and making recommendations. The study concludes with a reiteration of key options.
7
3. INTERNATIONAL LEGAL FRAMEWORK GOVERNING TRADE IN SERVICES: THE GENERAL AGREEMENT ON TRADE IN SERVICES
The GATS is the only legal instrument that governs multilateral trade in services. It lays out trade rules, to which WTO Members must adhere, in conducting, managing and regulating their trade in services within and beyond borders. For WTO Members (about 151 across the globe, with many others in accession negotiations), including Tanzania, services liberalization under the GATS has got to abide by the core non discriminatory principles of most favoured nation and national treatment. 3.1 THE NON DISCRIMINATORY RULES IN INTERNATIONAL TRADE IN SERVICES 3.1.1. MOST FAVORED NATION AND NATIONAL TREATMENT According to Article II of the GATS, any treatment that a WTO Member accords to any country shall be extended immediately and unconditionally to all other WTO Members’ services and services suppliers, such that no Member is treated in a less favourable manner than others. This is the most favoured nation (MFN) principle, which guarantees, at least in theory, equal access to international services markets for all WTO Members. Overall, the MFN is an important principle and attraction for countries in joining the WTO, because even if you give a non-Member better treatment, MFN requires that this is extended to all other WTO Members, and not vice versa. There are a limited number of exceptions to the MFN principle permitted under the GATS, such as the provisions in the Annex on MFN exemptions, which allowed Members, prior to the entry into force of the GATS, to list exemptions in accordance therewith. In general, MFN exemptions are frowned upon by the WTO Membership and an agenda for their elimination is part of the Doha Development Agenda’s GATS negotiations.
Another increasingly important departure from the MFN principle lies in the proliferation of preferential trade Agreements that have a services trade component. Article V of the GATS provides that benefits extended among partners through such Agreements need not be extended to other WTO Members. If the East African Community undertakes liberalization as part of its integration process, the details of this will have to fulfil the requirements of Article V, be notified to the WTO but not necessarily extended to other WTO Members. About 58 economic integration Agreements under Article V of the GATS have been notified to the WTO.
The GATS also contains a national treatment provision, according to which, Members must accord to services and service suppliers of any other Member, in respect to all measures affecting the supply of services, treatment no less favourable than it accords its own like services and service suppliers. Importantly, this obligation only applies to services sectors in which Members have made specific commitments in a schedule, and is subject to any conditions that may be inscribed in Members' schedules. In other words, national treatment is negotiable under the GATS, because the sectors to which it applies and the degree of national treatment applied in these sectors, are and continue to be determined through negotiations amongst Members.
The GATS does not contain a priori, any obligation to open any sectors, and to provide unconditional market access and national treatment. It is up to Members to decide which sectors
8
they are willing to open up (commit) to other Members, and the conditions on such access. When a national treatment condition is made, in the absence of any exceptions, such as through preferential trade Agreements, it applies on an MFN basis. Tanzania is therefore under no legal obligation to make any commitments but can do so if it deems this is in the interest of its national development objectives.
In the absence of inscription as limitation in a Member’s schedule, the GATS prohibits maintenance of the following:
1. limitations such as numerical quotas, monopolies, exclusive service suppliers, 2. economic needs tests (ENTs), 3. limitations on the total value of service transactions or assets in the form of
numerical quotas, 4. limitations on the total number of services operations, and 5. on the number of natural persons that may be employed in a particular service
sector. 3.1.2. PROGRESSIVE LIBERALIZATION
Negotiations under the GATS are guided by the principle of progressive liberalisation. In Article XIX: 1, Members agree to achieve progressively higher levels of liberalisation, in successive Rounds of negotiations; through reduction or elimination of the adverse effects of measures on trade in services and the provision of effective market access. For example, in the Uruguay Round, countries made market access and national treatment commitments. The expectation is that in the Doha, and successive Rounds, more commitments will be made. The principle of progressive liberalisation is meant to allow WTO Members to be in charge of the pace, extent, scope and timing of the liberalization commitments that they may choose to make in the GATS. In the making of commitments on the basis of the principle of progressive liberalisation, developing countries are given flexibility to open fewer sectors, liberalise fewer transactions, and progressively extend market access in line with their development situation and to attach conditions aimed at increasing their own participation in international trade, when making market access available to foreign services suppliers. However, developing countries would have to inscribe in their schedule, any such limitations and conditions. Additional flexibility is given to least developed countries (LDCs)-by recognizing their difficulty in making commitments, and in general, accepting the results of negotiated specific commitments.
Furthermore, in terms of the Doha negotiations, there is no expectation that LDCs will make commitments. According to Paragraph 26 of the Hong Kong Ministerial Declaration, Members recognize the particular economic situation of LDCs, including the difficulties they face, and acknowledge that they are not expected to undertake new commitments. As such, Tanzania is not under any real pressure in the WTO to make any commitments-which should allow for time to make carefully thought decisions such that liberalization commitments serve to enhance the countries’ development objectives. It must be noted though that new pressures are apparent in the EPA process-although coherence would dictate that Tanzania thinks in its own interest and proceeds in a manner that is positive and not merely to respond to pressures from Europe.
9
3.1.3. SCHEDULES OF COMMITMENTS
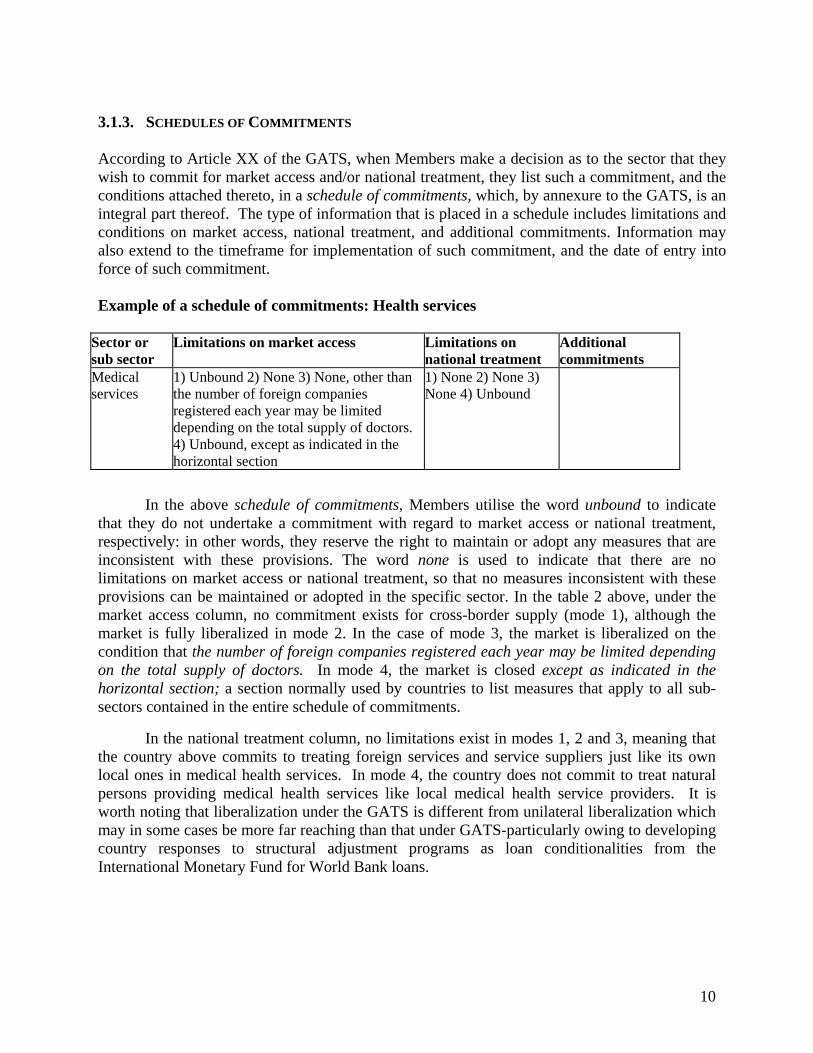
According to Article XX of the GATS, when Members make a decision as to the sector that they wish to commit for market access and/or national treatment, they list such a commitment, and the conditions attached thereto, in a schedule of commitments, which, by annexure to the GATS, is an integral part thereof. The type of information that is placed in a schedule includes limitations and conditions on market access, national treatment, and additional commitments. Information may also extend to the timeframe for implementation of such commitment, and the date of entry into force of such commitment. Example of a schedule of commitments: Health services
Sector or sub sector
Limitations on market access Limitations on national treatment
Additional commitments
Medical services
1) Unbound 2) None 3) None, other than the number of foreign companies registered each year may be limited depending on the total supply of doctors. 4) Unbound, except as indicated in the horizontal section
1) None 2) None 3) None 4) Unbound
In the above schedule of commitments, Members utilise the word unbound to indicate
that they do not undertake a commitment with regard to market access or national treatment, respectively: in other words, they reserve the right to maintain or adopt any measures that are inconsistent with these provisions. The word none is used to indicate that there are no limitations on market access or national treatment, so that no measures inconsistent with these provisions can be maintained or adopted in the specific sector. In the table 2 above, under the market access column, no commitment exists for cross-border supply (mode 1), although the market is fully liberalized in mode 2. In the case of mode 3, the market is liberalized on the condition that the number of foreign companies registered each year may be limited depending on the total supply of doctors. In mode 4, the market is closed except as indicated in the horizontal section; a section normally used by countries to list measures that apply to all sub-sectors contained in the entire schedule of commitments.
In the national treatment column, no limitations exist in modes 1, 2 and 3, meaning that the country above commits to treating foreign services and service suppliers just like its own local ones in medical health services. In mode 4, the country does not commit to treat natural persons providing medical health services like local medical health service providers. It is worth noting that liberalization under the GATS is different from unilateral liberalization which may in some cases be more far reaching than that under GATS-particularly owing to developing country responses to structural adjustment programs as loan conditionalities from the International Monetary Fund for World Bank loans.
10
3.1.4. BINDING NATURE OF SCHEDULES AND THE DIFFICULT ROLL-BACK PROCESS According to Article XXI of the GATS, Members can only modify a commitment inscribed in their schedules after a three year lapse from the time the commitment comes into force. Article XXI requires that the modifying Member notifies its intent to modify the schedule to the Council for Trade in Services (CTS) at least three months before the intended date of implementation of such modification or withdrawal, and enters into negotiations with any Member who claims that the modification/withdrawal will affect their trade. The objective of the negotiations is to reach agreement on necessary compensatory adjustment. The idea is to maintain, overall, a general level of mutually advantageous commitments not less favorable to trade than was available in the withdrawing/modifying Member’s schedule prior to such withdrawal/modification. Any compensatory adjustment is applied to all WTO Members on an MFN basis. In the event of failure to agree on compensation, any affected Member can request arbitration. If the modification goes on without respect for the arbitral award, an affected Member who has participated in such arbitration may modify or withdraw substantially equivalent benefits applying solely to the initial modifying Member. This applies irrespective of the MFN principle.
The rules are that once a commitment is made, it is very difficult to go back on. While the door is not closed for Members to deal with issues of modification/withdrawal of commitments, it is most certainly an issue that WTO members do not take lightly. Therefore, any commitments that Tanzania makes will need to be well thought through resulting from a rigorous and thorough assessment process, including overall and at sector specific level weighing the pros and cons, ability to handle results of the commitments from a regulatory perspective-attaching conditions to such access in line with national development objectives.
LIBERALIZATION OF SERVICES SECTORS IN TANZANIA After independence, the government of Tanzania through its parastatals and institutions committed itself to be the sole provider of goods and services to its people. Government was the sole supplier of socio-economic services, director of development, protector of all industries, owner of enterprises, and sole employer in the country. As a result, the public service was over extended, over burdened, over centralized leading to inefficiency and ineffectiveness. The situation led to a decline in governments’ ability to manage economic activities caused by lack of financial and human resources to finance and manage socio-economic activities and dilapidated socio-economic infrastructure. This resulted in poor services delivery.
Maliyamkono and Bagachwa (1990), World Bank (1984), World Bank (1992) indicate that, in ranking of the world’s poorest countries, the position of Tanzania changed dramatically in the 1980s dropping from 14th poorest in 1982, with a GNP per capita of $280, to the 2nd poorest in 1990, with a GNP per capita of $110. In previous years, particularly the 1960s and 1970s, real GDP per capita was growing at an average annual rate of 1.5 - 1.9%. However in the period between 1981 and1986, it registered a negative annual growth rate of 2%.
It was during this period that Tanzania’ government started negotiations with the
11
International financial institutions of the World Bank (WB) and International Monetary Fund (IMF) leading to the 1981 National Economic Survival Programme (NESP) followed by 1982 Structural Adjustments Programmes (SAP) and the Economic Recovery programmes (ERPs). As the names suggest, all these programmes were aimed at economic recovery and improvement.
To implement these programs, the government decided to liberalize its economy in an attempt to address the economic gaps already identified. This led to a policy change from command to open market economy. Liberalization aimed at inviting private sector participation in economic development activities, coupled with attracting more Foreign Direct Investment (FDI) in the country, hence more competition.
Through competition, consumers expected to enjoy a quality and affordable service-which remains the most important goal of the government. A key objective of the reforms is to transform and expand the supply base so as to fill the gaps experienced between 1961 and 1980. These reforms have steered a redefinition of government’ role, stepping back and focusing on regulation, monitoring and evaluation leaving the private sector to run business activities of the economy.
In 1992, government issued its Policy Statement regarding parastatatal reforms which set the direction for an ambitious privatization and reform programme aiming at improving operational efficiency of the economy, reducing the burden of state-owned enterprises (SOEs) on the budget and expanding the private sector role. In order to spearhead the privatization process, government created the Tanzania Parastatal Sector Reform Commission (PSRC) in 1992 to supervise the privatization processes in Mainland Tanzania and oversee performance of the remaining parastatals. It acted as the principal advisor to government on policies and legislation affecting parastatal business enterprises.
The services sector was not left behind in this wave of privatization of previously state owned enterprises. This period saw Tanzania undertake what is termed as unilateral (autonomous) liberalization. In the WTO context, Tanzania only committed to accept foreign presence for set up of four stars and above hotels in the tourism sector.
Liberalizing services trade has advantages if properly managed, some of which include increased efficiency in micro and macroeconomic terms. However, there can also be adverse effects especially for LDCs like Tanzania with limited capacity to manage the results of such liberalization. Some of the known disadvantages include marginalization of the domestic services providers through stiff competition, market dominance by foreign services providers, and further alienation of the poorer people in accessing even basic services.
12
4 SECTORAL ANALYSIS This chapter provides detailed information for each of the services sectors as obtained from the field. In terms of sequence, we deal with factual information for each of the sectors, opportunities and risks of liberalisation and then proposed policy options for the government. At the end of each section we point out the opportunities, challenges and key option. 4.1 COMMUNICATIONS SECTOR
The importance of the communications sector as a facilitator of fast economic development for Tanzania is clear. The sector plays an important role in facilitating other sectors of the economy through providing communications infrastructure and services to allow fast information flow, exchange and sharing amongst customers for increased efficiency, improved performance and productivity. Liberalization In this sector is at heightened levels starting specifically in 2005.
Most of its services are provided by the private sector, and because of the high minimum costs required in setting up operation, majority ownership is foreign in nature although there are cases where some domestic players have ownership in shares.
The communications sector is governed by the Telecommunications policy (1997), ICT policy (2003), Information Broadcasting policy (2004) and Postal policy (2003). It is regulated by Tanzania Communications Regulatory Authority (TCRA) which is a body set up by the Tanzania Communications Regulatory Act (2003). All sub-sectors (telecommunications, Postal, courier, information and communications technologies, encompassing broadcasting services) are now treated as one sector due to sharing converged technology, services and regulation.
The introduction of ICT in Tanzania facilitated the fast growth of communications services. ICT services are now reaching some rural areas through several multi-purpose community based tele-centers/community information centers. Currently, there are 12 centers countrywide located in Mtuwetu (Mtwara), Kinampanda (Singida), Mpwapwa (Dodoma), Isaka (Shinyanga), Nchuchuma (Ludewa), Hai (Kilimanjaro), Wete (Pemba), Mikindani (Mtwra), Sengerema (Mwanza), Kasulu Teachers Training college (Kigoma), Ngara UNHCR (Kagera), and Rungwe (Mbeya).
Government in collaboration with stakeholders intends to establish more centers. The process of establishing and running these centers is done through the Public Private Partnership (PPPs) approach aimed at building an information base in the country. Tele centers provide computer training, internet services, secretarial services, web printing and radio broadcasts and market information to communities. There is still room for further expansion of communications services in Tanzania considering the size of the country and the fast growing demand for communications services resulting from the growing population.
13

4.1.1 INVESTMENTS IN THE SECTOR
i) Electronic Services.
From the field, it was found that a lot of investment has been attracted to the communications sector; especially in telecommunications sub-sector in the areas of mobile telephony. In this regard, policy, legislation and regulatory framework have been key factors driving this process. For example, Celtel is now providing services through borderless mobile network covering Tanzania, Kenya, Uganda, DRC, Gabon and Republic of Congo. Other players include Tigo, Zantel, Vodacom etc. Those providing fixed and mobile services include TTCL while others that originally provided mobile telephony are also branching out into data services such as Vodacom and Zantel.
Table 3 and figure 4 below show trends in consumers per institution.
Table 3: The trend of consumers of telecommunications services 2001- 06
YEAR TIGO VODACOM ZANTEL CELTEL TTCL
(Fixed) TOTAL
2001 89,056 180,000 6,501 - 177,802 453,3622002 160,000 300,000 26,770 120,089 161,590 768,4492003 210,000 700,000 68,000 320,000 147,006 1,445,0062004 303,000 1,050,000 85,000 504,000 148,360 2,090,3602005 422,500 1,562,435 96,109 882,693 154,420 3,118,1572006 760,874 2,975,580 355,993 1,516,832 157,287 5,766,566Sept. 07
992,036 3,693,062 553,975 2,250,828 233,890 7,723,791
Source: From the respective institutions.
14

Figure 4: Trends of consumers of telecommunications services
NO. OF SUBSRIBERS
0
500,000
1,000,000
1,500,000
2,000,000
2,500,000
3,000,000
3,500,000
4,000,000
2001 2002 2003 2004 2005 2006 Sept.07YEARS
TIGO
VODACOM
ZANTEL
CELTEL
TTCL(Fixed)
S U B S R I B E R S
The figure above shows that on average, the number of consumers of services has been
growing over 7 years. Growth is attributed to introduction of mobile phones following liberalization of the sector which allowed private sector participation, supported by the favorable regulatory framework existing. The graph indicates that among the services providers; VODACOM is the leading followed by CELTEL and TIGO. ZANTEL is also rising over TTCL.
Available data reveals that subscription is growing at very high rates. However, there is still a huge gap meaning that there is more demand than supply of telecommunication services. The table 4 below explains this further.
Table 4 : Tanzania Population Vs Subscriptions
Year Population Subscribers Non-subscribers % of subscribers 2003 34,876,231 1,442,006 33,434,225 4.1 2004 36,049,581 2,090,360 33,959,221 5.8 2005 37,267,530 3,544,147 33,723,383 9.5 2006 38,523,907 5,766,566 32,757,341 14.9 September-07 39,816,363 7,723,791 32,092,572 19.4
Source: Adapted from TCRA
15
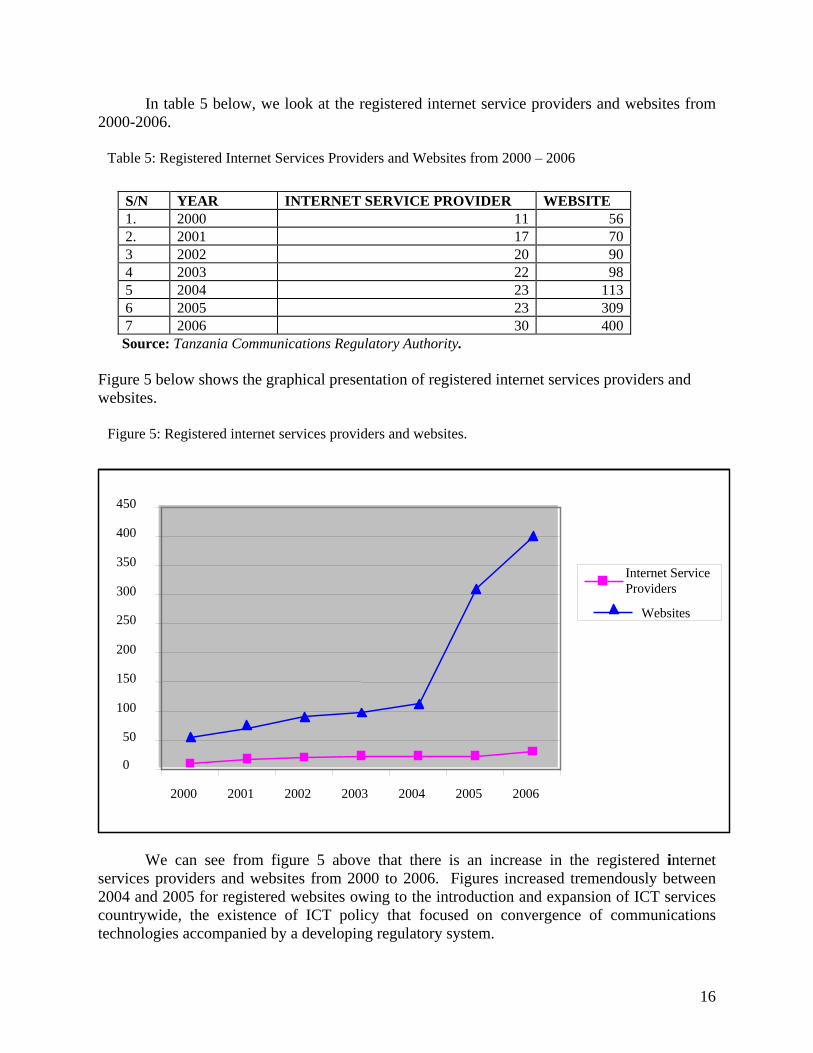
In table 5 below, we look at the registered internet service providers and websites from 2000-2006.
Table 5: Registered Internet Services Providers and Websites from 2000 – 2006
S/N YEAR INTERNET SERVICE PROVIDER WEBSITE 1. 2000 11 56 2. 2001 17 70 3 2002 20 90 4 2003 22 98 5 2004 23 113 6 2005 23 309 7 2006 30 400 Source: Tanzania Communications Regulatory Authority.
Figure 5 below shows the graphical presentation of registered internet services providers and websites.
Figure 5: Registered internet services providers and websites.
0
50
100
150
200
250
300
350
400
450
2000 2001 2002 2003 2004 2005 2006
Internet Service Providers
Websites
We can see from figure 5 above that there is an increase in the registered internet services providers and websites from 2000 to 2006. Figures increased tremendously between 2004 and 2005 for registered websites owing to the introduction and expansion of ICT services countrywide, the existence of ICT policy that focused on convergence of communications technologies accompanied by a developing regulatory system.
16
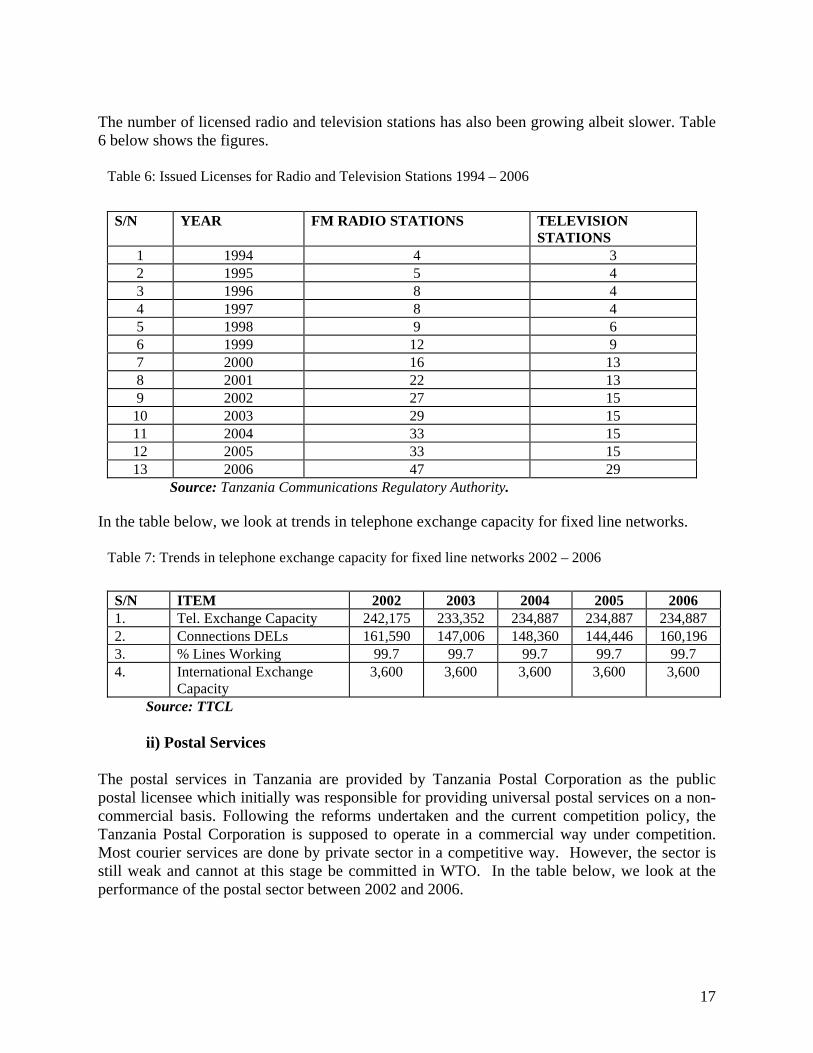
The number of licensed radio and television stations has also been growing albeit slower. Table 6 below shows the figures.
Table 6: Issued Licenses for Radio and Television Stations 1994 – 2006
S/N YEAR FM RADIO STATIONS TELEVISION
STATIONS 1 1994 4 3 2 1995 5 4 3 1996 8 4 4 1997 8 4 5 1998 9 6 6 1999 12 9 7 2000 16 13 8 2001 22 13 9 2002 27 15
10 2003 29 15 11 2004 33 15 12 2005 33 15 13 2006 47 29
Source: Tanzania Communications Regulatory Authority. In the table below, we look at trends in telephone exchange capacity for fixed line networks.
Table 7: Trends in telephone exchange capacity for fixed line networks 2002 – 2006
S/N ITEM 2002 2003 2004 2005 2006 1. Tel. Exchange Capacity 242,175 233,352 234,887 234,887 234,887 2. Connections DELs 161,590 147,006 148,360 144,446 160,196 3. % Lines Working 99.7 99.7 99.7 99.7 99.7 4. International Exchange
Capacity 3,600 3,600 3,600 3,600 3,600
Source: TTCL ii) Postal Services
The postal services in Tanzania are provided by Tanzania Postal Corporation as the public postal licensee which initially was responsible for providing universal postal services on a non-commercial basis. Following the reforms undertaken and the current competition policy, the Tanzania Postal Corporation is supposed to operate in a commercial way under competition. Most courier services are done by private sector in a competitive way. However, the sector is still weak and cannot at this stage be committed in WTO. In the table below, we look at the performance of the postal sector between 2002 and 2006.
17
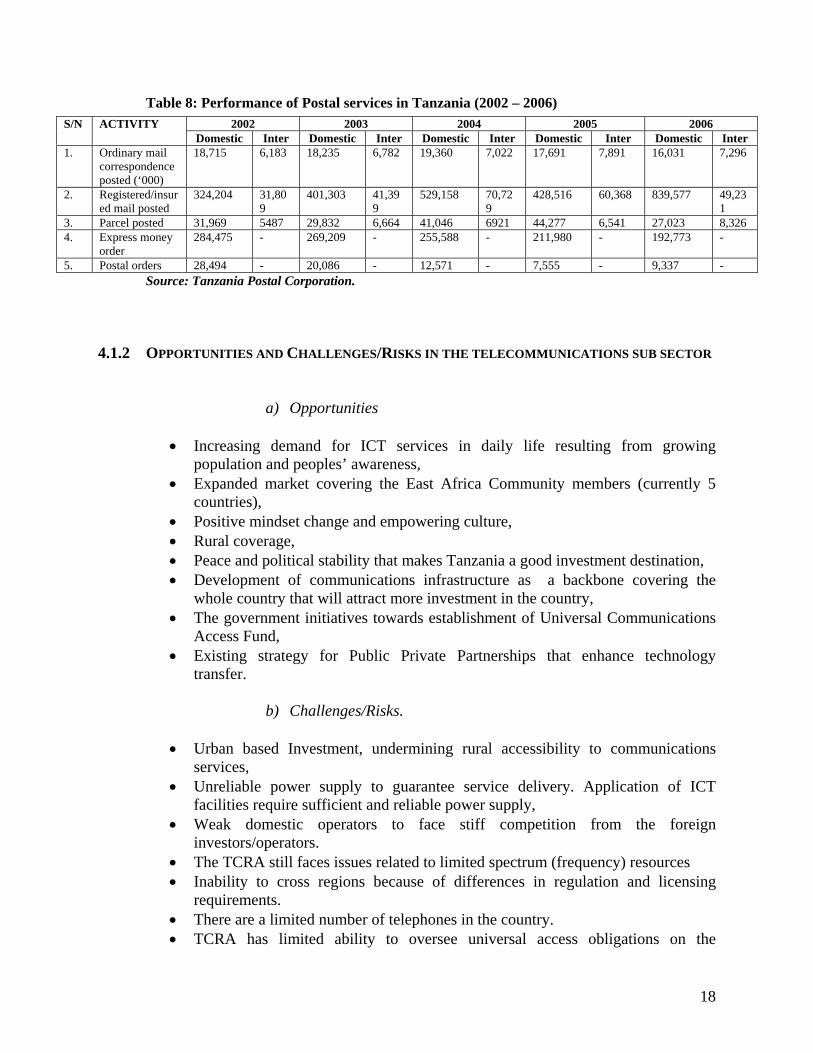
Table 8: Performance of Postal services in Tanzania (2002 – 2006)
Source: Tanzania Postal Corporation.
2002 2003 2004 2005 2006 S/N ACTIVITY Domestic Inter Domestic Inter Domestic Inter Domestic Inter Domestic Inter
1. Ordinary mail correspondence posted (‘000)
18,715 6,183 18,235 6,782 19,360 7,022 17,691 7,891 16,031 7,296
2. Registered/insured mail posted
324,204 31,809
401,303 41,399
529,158 70,729
428,516 60,368 839,577 49,231
3. Parcel posted 31,969 5487 29,832 6,664 41,046 6921 44,277 6,541 27,023 8,326 4. Express money
order 284,475 - 269,209 - 255,588 - 211,980 - 192,773 -
5. Postal orders 28,494 - 20,086 - 12,571 - 7,555 - 9,337 -
4.1.2 OPPORTUNITIES AND CHALLENGES/RISKS IN THE TELECOMMUNICATIONS SUB SECTOR
a) Opportunities
• Increasing demand for ICT services in daily life resulting from growing population and peoples’ awareness,
• Expanded market covering the East Africa Community members (currently 5 countries),
• Positive mindset change and empowering culture, • Rural coverage, • Peace and political stability that makes Tanzania a good investment destination, • Development of communications infrastructure as a backbone covering the
whole country that will attract more investment in the country, • The government initiatives towards establishment of Universal Communications
Access Fund, • Existing strategy for Public Private Partnerships that enhance technology
transfer.
b) Challenges/Risks.
• Urban based Investment, undermining rural accessibility to communications services,
• Unreliable power supply to guarantee service delivery. Application of ICT facilities require sufficient and reliable power supply,
• Weak domestic operators to face stiff competition from the foreign investors/operators.
• The TCRA still faces issues related to limited spectrum (frequency) resources • Inability to cross regions because of differences in regulation and licensing
requirements. • There are a limited number of telephones in the country. • TCRA has limited ability to oversee universal access obligations on the
18
operators. It is viewed as difficult to present universal access obligations. Plans are underway from the Universal Service Commission Access Act of 2006 signed in 2007 to charge 0.5% of gross annual revenues of each operator, so that this can go to under-served areas.
• Liberalization of communications comes with liberalization of gadgets such a mobile phones, which come with health, cultural and environment costs.
• Limited familiarity of regulators with the GATS and relevant legal instruments such as the Annex on basic telecommunications and the telecommunications reference paper.
c) Proposed policy options for government decisions
• It is important for regulators to place universal service obligations on service
providers for universal access either through conditions for extending coverage to rural areas, or a fast track of the plans for the universal service fund.
• Need for heavy government investment in rural electrification and extension of sustainable power supply across the country so as to backstop the provision of telecommunication and other ICT related services,
• In the context of the WTO negotiations, the issue of making commitments in telecommunications does not only relate to market access and national treatment but also the obligations under the Annex on telecommunications-which sets deeper regulatory disciplines on telecommunications applying to all measures of a Member that affect access to and use of public telecommunications transport networks and services.
• There is need to have a more focused and targeted discussion on the import of the Annex on telecommunications to Tanzania’s regulatory regime. Key questions here would be the extent to which the two are aligned? What the gaps are, the challenges that Tanzania would face in dealing with the detail of the Annex e.t.c. This is important because being an Annex; it is an integral part of the GATS Agreement providing notes and supplementary provisions to the Agreement.
• It is important to note that in many of the requests in the telecom sector, Members not only seek market access and national treatment concessions but also additional commitments of a regulatory nature, particularly under the Telecom Reference paper. This sets out deeper regulatory disciplines including the application of universal service and others. It appeared that the regulators needed more familiarity with this text. As such, an exercise along the lines of the Annex mentioned above (i.e. analysis of the extent to which the two are aligned needs to be done) for the telecom reference paper prior to making a decision on committing this sector in the GATS.
• There are gaps in understanding the role of conditions to commitments. It came out that regulators were not comfortable with imposing conditions on providers, and yet gaps remain that such conditions could contribute to filling. It is a right of countries to impose conditions to opening markets, a unique one being universal access to telecommunication services. (Recall the provisions of Article XIX: 2 of the GATS).
• There is need for national laws that positively discriminate in favour of local
19
service suppliers where they are available, and that restrict the possibility of foreigners taking on jobs in this sector that can be done by Tanzanians. At the level of the WTO, this would require scheduling unbound to national treatment-meaning that Tanzania retains the right to discriminate in favour of local services and services suppliers where they exist, and unbound except for senior managers and other skilled technicians where Tanzanians are not available, and
• There is need for government to strengthen the capacity of the bureau of standards so as to check the heath hazards that come with telecommunication technologies particularly mobile phones.
d) Key Option
Align Tanzania’s telecommunications regulation to international ones such as the Annex on telecommunications and the telecomm reference paper before committing the sector. In tandem, undertake rigorous training of the regulators on the GATS. If the decision is made to commit the sub-sector, need for careful use of flexibilities, especially inscribing unbound to national treatment and possibly a later coming into force of the commitment at such time as the regulation and regulators are strengthened.
4.2 CONSTRUCTION SECTOR The construction industry is a fundamental economic sector facilitating performance and enhancing intra and inter sectoral trade such as agriculture, industry e.t.c. The sector is governed by the construction policy of 2003 and several pieces of legislation including; Public procurement Act No. 21 of 2004, Engineers registration Act No. 15 of 1997, Architects and Quantity surveyor registration Act No. 16 of 1997, Contractors Registration Act No. 17 of 1997, National Construction Council Act No. 20 of 1979, Professional surveyor registration Act No. 2 of 1977 and Tanzania Bureau of Standards Act No. 3 of 1975. All these documents provide rules for monitoring and evaluation of the construction sector in Tanzania.
The goal of the construction industry development policy is to develop an internationally competitive industry that can undertake most of the construction projects in Tanzania and export its services and products. This sector is important as it can transform various physical resources into constructed physical economic and social infrastructure necessary for socio-economic development. It comprises of buildings, civil works, and institutions that deal directly or indirectly with construction activities. Institutions under construction industry in Tanzania include; Construction Registration Board (CRB), Engineers Registration Board (ERB), Architect and Quantity Surveyors Registration Board (AQSRB), National Construction Council (NCC), National Board of Material Management (NBMM), Tanzania Building Agency (TBA), and Tanzania electrical, Mechanical and electronics Services Agency (TEMESA).
The National Construction Council is one of the oldest in developing countries and within sub Sahara Africa and South East Asia; it has the oldest experience starting in 1981. The
20
aim is to develop the local construction industry. It has also gone through a process shift from a formally centralized to liberalized economy. The organization oversees roads, bridges, buildings, land improvement and water related projects. Their function is to provide support for others by making available construction related services to all other sectors for social and physical related infrastructure. Key players involve project promoters, contractors, designers, material and equipment suppliers and a large informal sector which produces the material to use in production especially of residential houses.
The majority of enterprises in the construction sector in Tanzania are small with few in the medium category capable of undertaking works valued at more than Tshs. 300 million. Currently there are about 4,300 registered contactors and 250 consultants (engineers, architects, quantity surveyors). Local firms (contractors and consultants) constitute 95% of the total number of registered construction industry firms. However, they undertake construction projects worth 10% in terms of monetary value. Foreign firms which constitute only 5% of the total registered firms take the 90% share. In this case, there is need to empower the domestic registered contractors to participate fully in economic activities.
The sector’ involvement in international trade is as an importer of construction services, materials. The sector does not export services.
4.2.1 SECTOR PERFORMANCE
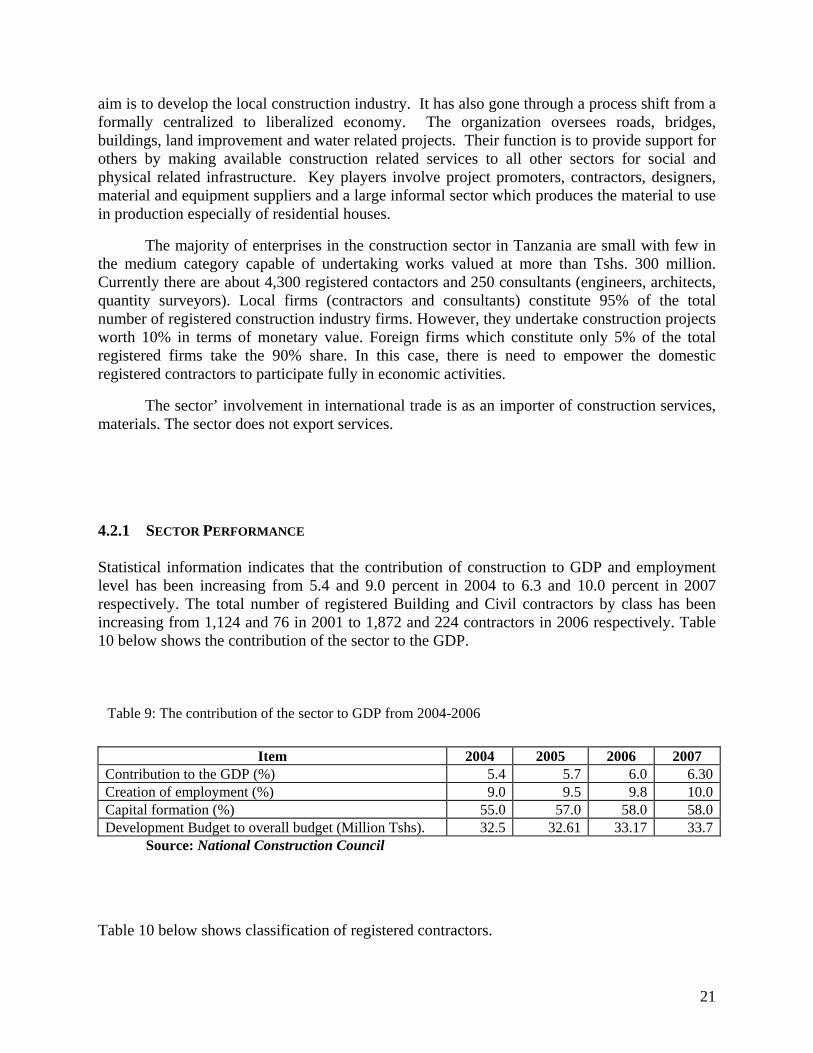
Statistical information indicates that the contribution of construction to GDP and employment level has been increasing from 5.4 and 9.0 percent in 2004 to 6.3 and 10.0 percent in 2007 respectively. The total number of registered Building and Civil contractors by class has been increasing from 1,124 and 76 in 2001 to 1,872 and 224 contractors in 2006 respectively. Table 10 below shows the contribution of the sector to the GDP.
Table 9: The contribution of the sector to GDP from 2004-2006
Item 2004 2005 2006 2007
Contribution to the GDP (%) 5.4 5.7 6.0 6.30Creation of employment (%) 9.0 9.5 9.8 10.0Capital formation (%) 55.0 57.0 58.0 58.0Development Budget to overall budget (Million Tshs). 32.5 32.61 33.17 33.7
Source: National Construction Council Table 10 below shows classification of registered contractors.
21
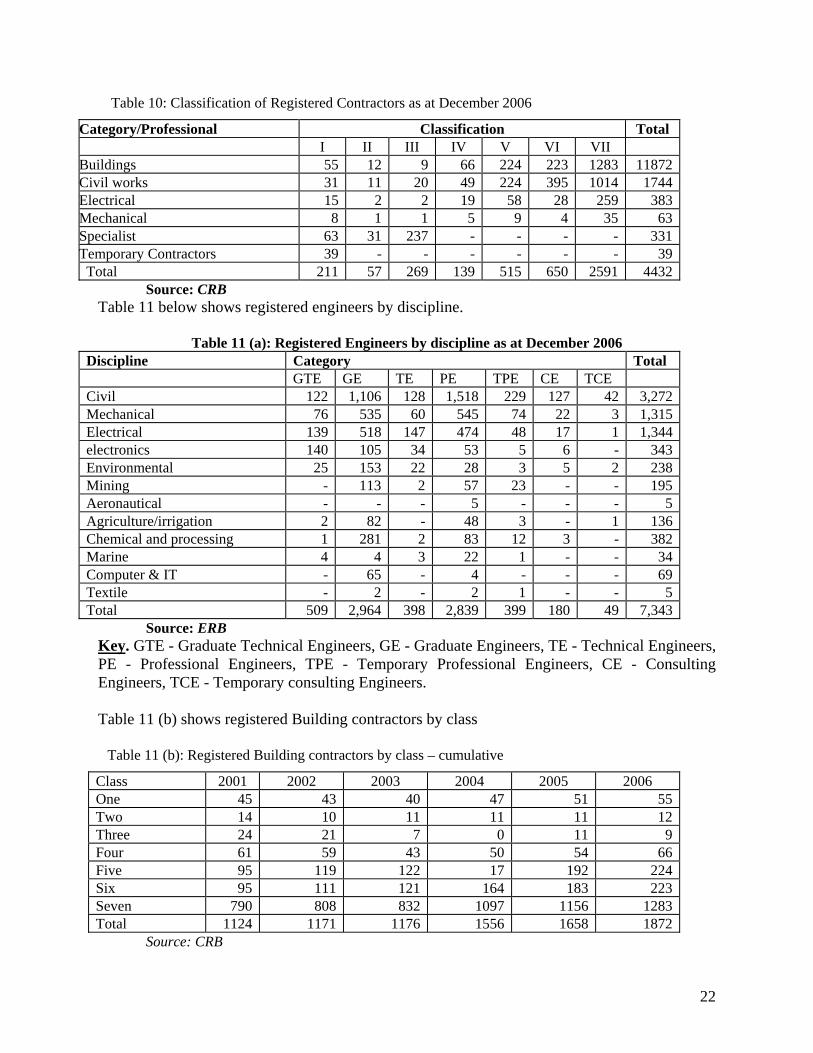
Table 10: Classification of Registered Contractors as at December 2006
Category/Professional Classification Total I II III IV V VI VII
Buildings 55 12 9 66 224 223 1283 11872Civil works 31 11 20 49 224 395 1014 1744Electrical 15 2 2 19 58 28 259 383Mechanical 8 1 1 5 9 4 35 63Specialist 63 31 237 - - - - 331Temporary Contractors 39 - - - - - - 39Total 211 57 269 139 515 650 2591 4432
Source: CRB Table 11 below shows registered engineers by discipline.
Table 11 (a): Registered Engineers by discipline as at December 2006 Discipline Category Total GTE GE TE PE TPE CE TCE Civil 122 1,106 128 1,518 229 127 42 3,272Mechanical 76 535 60 545 74 22 3 1,315Electrical 139 518 147 474 48 17 1 1,344electronics 140 105 34 53 5 6 - 343Environmental 25 153 22 28 3 5 2 238Mining - 113 2 57 23 - - 195Aeronautical - - - 5 - - - 5Agriculture/irrigation 2 82 - 48 3 - 1 136Chemical and processing 1 281 2 83 12 3 - 382Marine 4 4 3 22 1 - - 34Computer & IT - 65 - 4 - - - 69Textile - 2 - 2 1 - - 5Total 509 2,964 398 2,839 399 180 49 7,343
Source: ERB Key. GTE - Graduate Technical Engineers, GE - Graduate Engineers, TE - Technical Engineers, PE - Professional Engineers, TPE - Temporary Professional Engineers, CE - Consulting Engineers, TCE - Temporary consulting Engineers. Table 11 (b) shows registered Building contractors by class
Table 11 (b): Registered Building contractors by class – cumulative
Class 2001 2002 2003 2004 2005 2006 One 45 43 40 47 51 55Two 14 10 11 11 11 12Three 24 21 7 0 11 9Four 61 59 43 50 54 66Five 95 119 122 17 192 224Six 95 111 121 164 183 223Seven 790 808 832 1097 1156 1283Total 1124 1171 1176 1556 1658 1872
Source: CRB
22
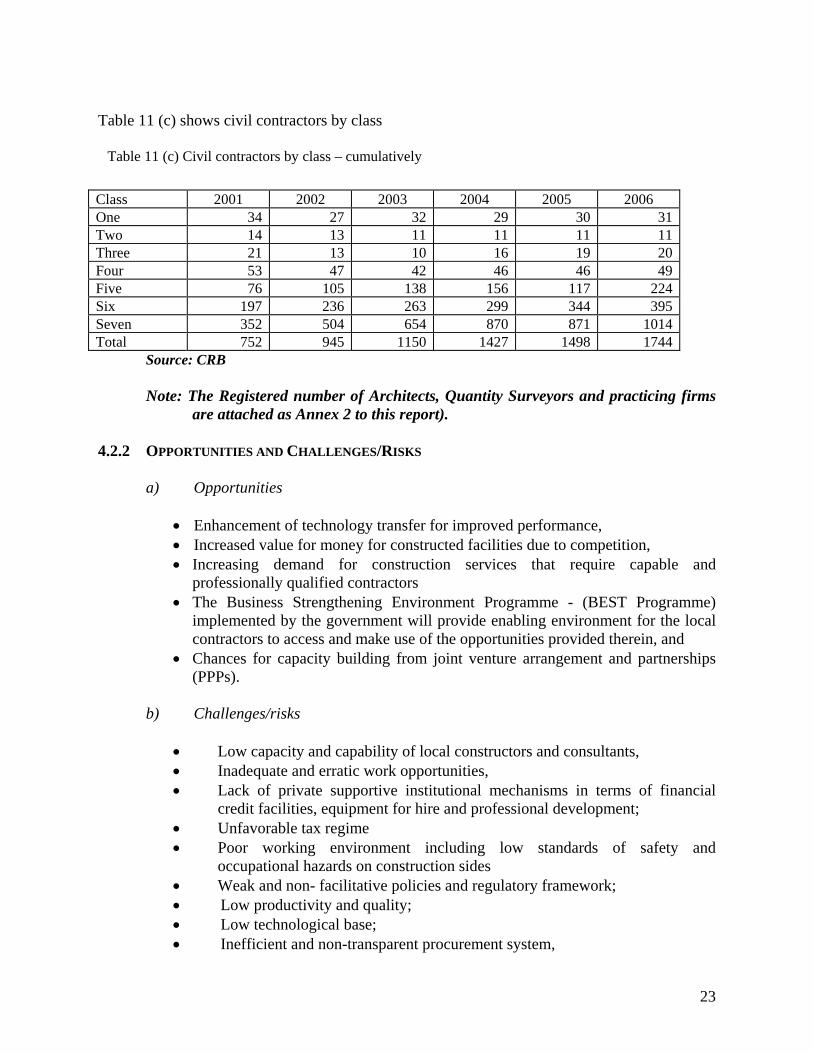
Table 11 (c) shows civil contractors by class
Table 11 (c) Civil contractors by class – cumulatively
Class 2001 2002 2003 2004 2005 2006 One 34 27 32 29 30 31Two 14 13 11 11 11 11Three 21 13 10 16 19 20Four 53 47 42 46 46 49Five 76 105 138 156 117 224Six 197 236 263 299 344 395Seven 352 504 654 870 871 1014Total 752 945 1150 1427 1498 1744
Source: CRB Note: The Registered number of Architects, Quantity Surveyors and practicing firms
are attached as Annex 2 to this report).
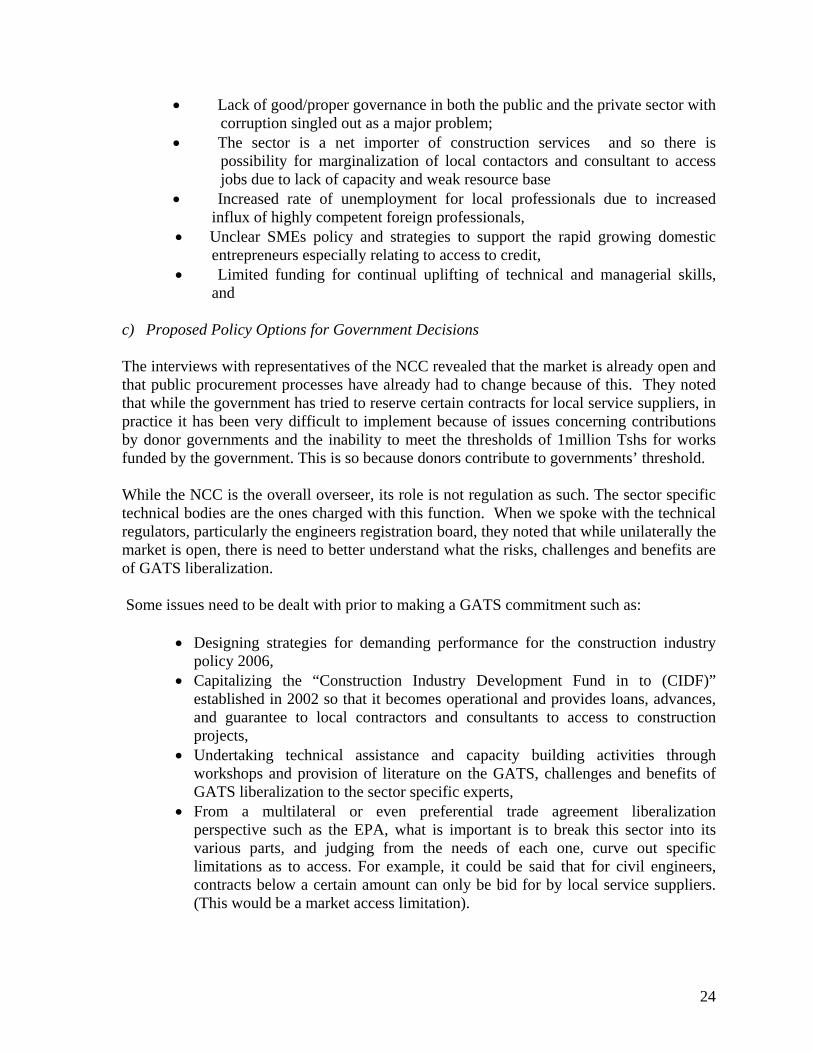
4.2.2 OPPORTUNITIES AND CHALLENGES/RISKS
a) Opportunities
• Enhancement of technology transfer for improved performance, • Increased value for money for constructed facilities due to competition, • Increasing demand for construction services that require capable and
professionally qualified contractors • The Business Strengthening Environment Programme - (BEST Programme)
implemented by the government will provide enabling environment for the local contractors to access and make use of the opportunities provided therein, and
• Chances for capacity building from joint venture arrangement and partnerships (PPPs).
b) Challenges/risks
• Low capacity and capability of local constructors and consultants, • Inadequate and erratic work opportunities, • Lack of private supportive institutional mechanisms in terms of financial
credit facilities, equipment for hire and professional development; • Unfavorable tax regime • Poor working environment including low standards of safety and
occupational hazards on construction sides • Weak and non- facilitative policies and regulatory framework; • Low productivity and quality; • Low technological base; • Inefficient and non-transparent procurement system,
23
• Lack of good/proper governance in both the public and the private sector with corruption singled out as a major problem;
• The sector is a net importer of construction services and so there is possibility for marginalization of local contactors and consultant to access jobs due to lack of capacity and weak resource base
• Increased rate of unemployment for local professionals due to increased influx of highly competent foreign professionals,
• Unclear SMEs policy and strategies to support the rapid growing domestic entrepreneurs especially relating to access to credit,
• Limited funding for continual uplifting of technical and managerial skills, and
c) Proposed Policy Options for Government Decisions The interviews with representatives of the NCC revealed that the market is already open and that public procurement processes have already had to change because of this. They noted that while the government has tried to reserve certain contracts for local service suppliers, in practice it has been very difficult to implement because of issues concerning contributions by donor governments and the inability to meet the thresholds of 1million Tshs for works funded by the government. This is so because donors contribute to governments’ threshold. While the NCC is the overall overseer, its role is not regulation as such. The sector specific technical bodies are the ones charged with this function. When we spoke with the technical regulators, particularly the engineers registration board, they noted that while unilaterally the market is open, there is need to better understand what the risks, challenges and benefits are of GATS liberalization. Some issues need to be dealt with prior to making a GATS commitment such as:
• Designing strategies for demanding performance for the construction industry policy 2006,
• Capitalizing the “Construction Industry Development Fund in to (CIDF)” established in 2002 so that it becomes operational and provides loans, advances, and guarantee to local contractors and consultants to access to construction projects,
• Undertaking technical assistance and capacity building activities through workshops and provision of literature on the GATS, challenges and benefits of GATS liberalization to the sector specific experts,
• From a multilateral or even preferential trade agreement liberalization perspective such as the EPA, what is important is to break this sector into its various parts, and judging from the needs of each one, curve out specific limitations as to access. For example, it could be said that for civil engineers, contracts below a certain amount can only be bid for by local service suppliers. (This would be a market access limitation).
24
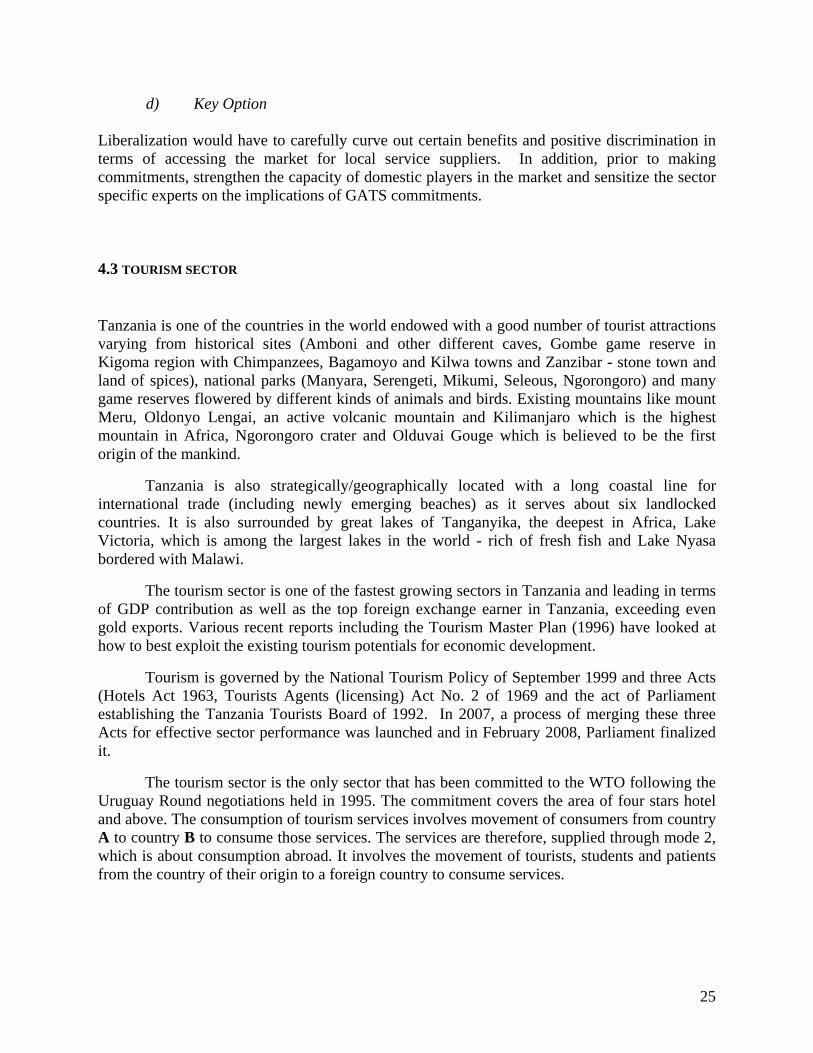
d) Key Option Liberalization would have to carefully curve out certain benefits and positive discrimination in terms of accessing the market for local service suppliers. In addition, prior to making commitments, strengthen the capacity of domestic players in the market and sensitize the sector specific experts on the implications of GATS commitments. 4.3 TOURISM SECTOR
Tanzania is one of the countries in the world endowed with a good number of tourist attractions varying from historical sites (Amboni and other different caves, Gombe game reserve in Kigoma region with Chimpanzees, Bagamoyo and Kilwa towns and Zanzibar - stone town and land of spices), national parks (Manyara, Serengeti, Mikumi, Seleous, Ngorongoro) and many game reserves flowered by different kinds of animals and birds. Existing mountains like mount Meru, Oldonyo Lengai, an active volcanic mountain and Kilimanjaro which is the highest mountain in Africa, Ngorongoro crater and Olduvai Gouge which is believed to be the first origin of the mankind.
Tanzania is also strategically/geographically located with a long coastal line for international trade (including newly emerging beaches) as it serves about six landlocked countries. It is also surrounded by great lakes of Tanganyika, the deepest in Africa, Lake Victoria, which is among the largest lakes in the world - rich of fresh fish and Lake Nyasa bordered with Malawi.
The tourism sector is one of the fastest growing sectors in Tanzania and leading in terms of GDP contribution as well as the top foreign exchange earner in Tanzania, exceeding even gold exports. Various recent reports including the Tourism Master Plan (1996) have looked at how to best exploit the existing tourism potentials for economic development.
Tourism is governed by the National Tourism Policy of September 1999 and three Acts (Hotels Act 1963, Tourists Agents (licensing) Act No. 2 of 1969 and the act of Parliament establishing the Tanzania Tourists Board of 1992. In 2007, a process of merging these three Acts for effective sector performance was launched and in February 2008, Parliament finalized it.
The tourism sector is the only sector that has been committed to the WTO following the Uruguay Round negotiations held in 1995. The commitment covers the area of four stars hotel and above. The consumption of tourism services involves movement of consumers from country A to country B to consume those services. The services are therefore, supplied through mode 2, which is about consumption abroad. It involves the movement of tourists, students and patients from the country of their origin to a foreign country to consume services.
25
4.3.1 THE STRATEGIES TOWARDS IMPROVING TOURISM SERVICES IN TANZANIA As part of implementing Tourism policy, the government has designed several strategies to make sure that tourism services are improved to international standards. Some of these strategies include;
• Classifications of tourist hotels, • Preparations and dissemination of tourism related information, • Training, • Development of Tourism Development Programme, • Tourism Promotional activities. • Merging of three Acts for efficient sector performance, • Promotion of Domestic Tourism, • Encouraging Qatar airways to fly from Doha to Dar es Salaam • Promotion of the sector through “CNN International and “CNN – Domestic America”
for six month since Sept. 2007.
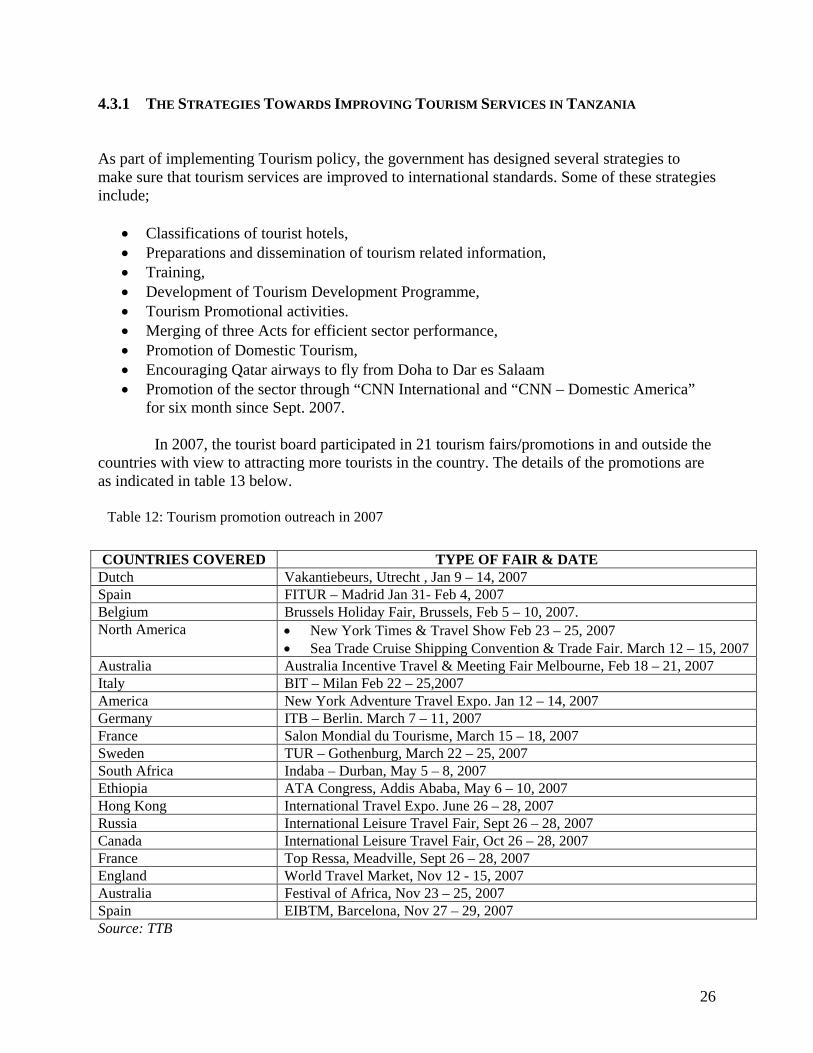
In 2007, the tourist board participated in 21 tourism fairs/promotions in and outside the countries with view to attracting more tourists in the country. The details of the promotions are as indicated in table 13 below.
Table 12: Tourism promotion outreach in 2007
COUNTRIES COVERED TYPE OF FAIR & DATE
Dutch Vakantiebeurs, Utrecht , Jan 9 – 14, 2007 Spain FITUR – Madrid Jan 31- Feb 4, 2007 Belgium Brussels Holiday Fair, Brussels, Feb 5 – 10, 2007. North America • New York Times & Travel Show Feb 23 – 25, 2007
• Sea Trade Cruise Shipping Convention & Trade Fair. March 12 – 15, 2007 Australia Australia Incentive Travel & Meeting Fair Melbourne, Feb 18 – 21, 2007 Italy BIT – Milan Feb 22 – 25,2007 America New York Adventure Travel Expo. Jan 12 – 14, 2007 Germany ITB – Berlin. March 7 – 11, 2007 France Salon Mondial du Tourisme, March 15 – 18, 2007 Sweden TUR – Gothenburg, March 22 – 25, 2007 South Africa Indaba – Durban, May 5 – 8, 2007 Ethiopia ATA Congress, Addis Ababa, May 6 – 10, 2007 Hong Kong International Travel Expo. June 26 – 28, 2007 Russia International Leisure Travel Fair, Sept 26 – 28, 2007 Canada International Leisure Travel Fair, Oct 26 – 28, 2007 France Top Ressa, Meadville, Sept 26 – 28, 2007 England World Travel Market, Nov 12 - 15, 2007 Australia Festival of Africa, Nov 23 – 25, 2007 Spain EIBTM, Barcelona, Nov 27 – 29, 2007 Source: TTB
26
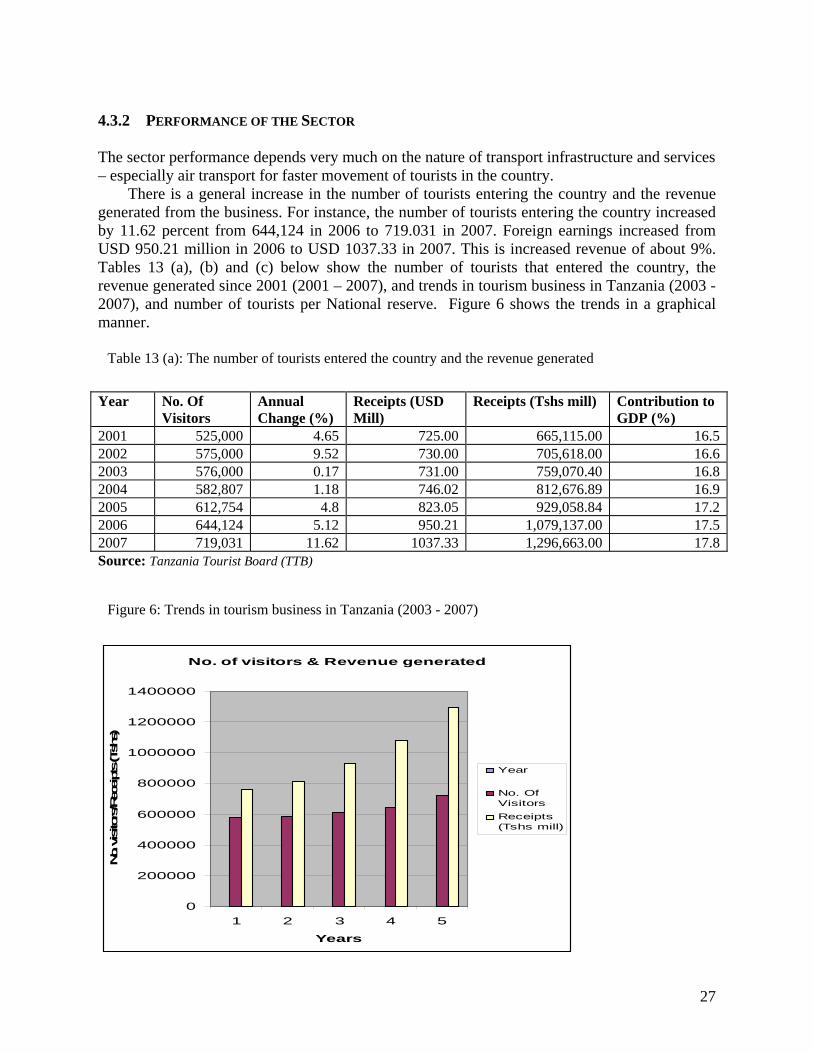
4.3.2 PERFORMANCE OF THE SECTOR The sector performance depends very much on the nature of transport infrastructure and services – especially air transport for faster movement of tourists in the country.
There is a general increase in the number of tourists entering the country and the revenue generated from the business. For instance, the number of tourists entering the country increased by 11.62 percent from 644,124 in 2006 to 719.031 in 2007. Foreign earnings increased from USD 950.21 million in 2006 to USD 1037.33 in 2007. This is increased revenue of about 9%. Tables 13 (a), (b) and (c) below show the number of tourists that entered the country, the revenue generated since 2001 (2001 – 2007), and trends in tourism business in Tanzania (2003 - 2007), and number of tourists per National reserve. Figure 6 shows the trends in a graphical manner.
Table 13 (a): The number of tourists entered the country and the revenue generated
Year No. Of
Visitors Annual Change (%)
Receipts (USD Mill)
Receipts (Tshs mill) Contribution to GDP (%)
2001 525,000 4.65 725.00 665,115.00 16.52002 575,000 9.52 730.00 705,618.00 16.62003 576,000 0.17 731.00 759,070.40 16.82004 582,807 1.18 746.02 812,676.89 16.92005 612,754 4.8 823.05 929,058.84 17.22006 644,124 5.12 950.21 1,079,137.00 17.52007 719,031 11.62 1037.33 1,296,663.00 17.8Source: Tanzania Tourist Board (TTB)
Figure 6: Trends in tourism business in Tanzania (2003 - 2007)
No. of visitors & Revenue generated
0
200000
400000
600000
800000
1000000
1200000
1400000
1 2 3 4 5
Years
No. visito
rs/R
eceipts (Tsh
s)
Year
No. OfVisitorsReceipts(Tshs mill)
27
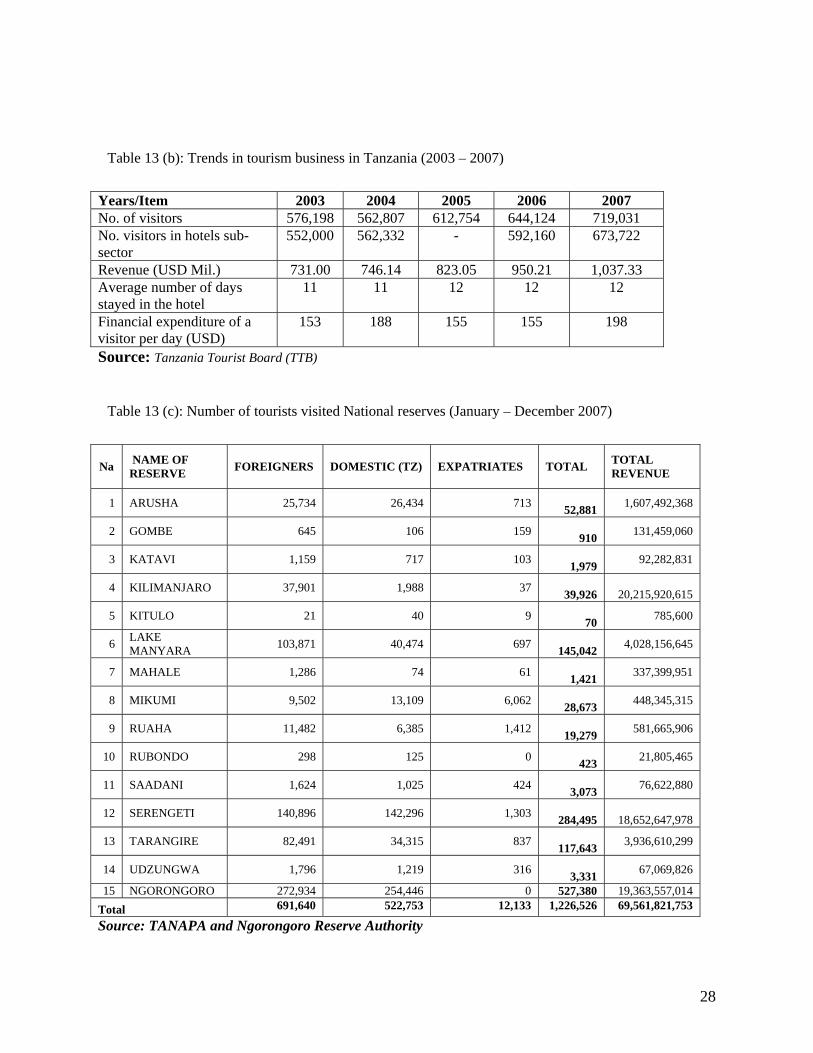
Table 13 (b): Trends in tourism business in Tanzania (2003 – 2007)
Years/Item 2003 2004 2005 2006 2007 No. of visitors 576,198 562,807 612,754 644,124 719,031 No. visitors in hotels sub-sector
552,000 562,332 - 592,160 673,722
Revenue (USD Mil.) 731.00 746.14 823.05 950.21 1,037.33 Average number of days stayed in the hotel
11 11 12 12 12
Financial expenditure of a visitor per day (USD)
153 188 155 155 198
Source: Tanzania Tourist Board (TTB)
Table 13 (c): Number of tourists visited National reserves (January – December 2007)
Na NAME OF RESERVE FOREIGNERS DOMESTIC (TZ) EXPATRIATES TOTAL TOTAL
REVENUE
1 ARUSHA 25,734 26,434 713 52,881 1,607,492,368
2 GOMBE 645 106 159 910 131,459,060
3 KATAVI 1,159 717 103 1,979 92,282,831
4 KILIMANJARO 37,901 1,988 37 39,926
20,215,920,615
5 KITULO 21 40 9 70 785,600
6 LAKE MANYARA 103,871 40,474 697
145,042 4,028,156,645
7 MAHALE 1,286 74 61 1,421 337,399,951
8 MIKUMI 9,502 13,109 6,062 28,673 448,345,315
9 RUAHA 11,482 6,385 1,412 19,279 581,665,906
10 RUBONDO 298 125 0 423 21,805,465
11 SAADANI 1,624 1,025 424 3,073 76,622,880
12 SERENGETI 140,896 142,296 1,303 284,495
18,652,647,978
13 TARANGIRE 82,491 34,315 837 117,643 3,936,610,299
14 UDZUNGWA 1,796 1,219 316 3,331 67,069,826
15 NGORONGORO 272,934 254,446 0 527,380 19,363,557,014 Total 691,640 522,753 12,133 1,226,526 69,561,821,753
Source: TANAPA and Ngorongoro Reserve Authority
28
4.3.3 OPPORTUNITIES AND CHALLENGES/RISKS
a) Opportunities
• Tanzania is approved as a safety destination by source markets, • Enhancement of technology transfer for improved performance, • Increased number of tourism services, • Improved efficiency in tourism operations, • Existence of un-promoted tourist attractions found in different parts of Tanzania
that can generate income up on promotion, • Existence of plan for joint marketing of the East African States by introduction of
Quality Assurance and Control through facility grading and classification schemes as per Article 115 of the EAC Treaty,
• Increased revenue.
b) Challenges/Risks
• Insufficient budget allocation especially for promotional activities as well as those that indirectly converge such as transport infrastructure.
• Insufficient tourism promotion coverage, • Poor institutional and technical capabilities, • Limited tourism products mix (dependence on limited products), • Inadequate regional and international tourist linkages, • Marginalization of local tourism enterprises due to increased competition, • Possible erosion of cultural traits, • Possible environmental degradation due to increased number of tourists.
c) Proposed Policy Options for Government Decisions
In our discussions with officials from the tourism board, it was clear that they are neither familiar with the GATS, nor use it in their promotion activities. As such, it is questionable the extent to which the GATS commitments have been a key factor in attracting tourists or even investments in tourism. There is also need for heightened activities in promoting the domestic tourism industry, and increasing the linkages with other related sectors in the country. In comparable terms, it is worth noting that tourism is one of those sectors that have attracted the most commitments in the GATS by other members.
Tanzania may wish to seek commitments from other WTO Members or in other regional integration programs, for mode 2 so as to possibly enhance further flows of tourists. Such requests would have to address other important issues such as portability of health insurance which has been known to limit the utility of tourism.
29

d) Key Option
Tanzania should seek mode 2 commitments from negotiating partners, as well as enhance supporting infrastructure on the ground to make the tourism industry more effective.
4.4 TRANSPORT SERVICES The Transport sector plays a great role in day to day economic development activities. It is one of the pillars of the economy and investment in this sector has a multiplier effect in the entire economy. It is the major facilitator of the productive, commercial and administrative sectors impacting on physical supply and distribution of goods and services to and from the market domestically and internationally. The transport sector’ growth rate has been fairly constant for the last six years at around 6.2 percent. This growth should have been ahead of overall GDP growth rate which stood at 6.2 percent (2006) in order to avoid the situation where it could obstruct the development of other sectors.
Since trade entails the movement of goods and services to and from the market, it is of no doubt that a developed, safe, reliable, effective, efficient and fully integrated transport system; infrastructure and services are the key factors for the promotion and facilitation of domestic as well as international trade. Development of the sector is therefore necessary. A well developed transport system reduces operational costs and saves time; something that is critical to business.
The sector is governed by the National Transport Policy (2003) which covers all modes of transport i.e. road, marine, railway and air transport. There are two regulators; Surface and Marine Transport Regulatory Authority (SUMATRA) and Tanzania Civil Aviation Authority (TCAA).
The transport sector is huge and very complex characterized by its geographical extent, the diversity of competing modes and by the alternative patterns of ownership and operation in public and private sectors. 4.4.1 REFORMS IN THE SECTOR.
Tanzania has implemented a number of transport development and maintenance programmes aimed at enhancing the provision of efficient, cost effective and safe transport systems in the country. These include Transport Sector Recovery Programme (1987), Integrated Roads Project (IRP) Phase I and II (1991 - 2002), Railway Restructuring Project (RRP), Port Modernization Project (PMP), the TAZARA Ten-Year Development Programme and the current Ten year Transport Sector Investment Programme (TSIP).
The reforms have also been ongoing for creation of institutions, laws, regulation and procedures that are consistent and compatible with each other in order to create a conducive investment climate and growth of the sector. The reforms include formation of relevant regulatory authorities and operational entities, executive agencies and privatization of commercial activities that can best be done by the private sector.
Notwithstanding these efforts, the transport sector is still characterized by high cost-low
30
quality services due to the existence of high backlog of infrastructure maintenance and rehabilitation, inadequate capacity caused by low level of investment in resources, and low level of enforcement of safety, environmental sustainability and gender issues. In view of these characteristics, the Ministry of Infrastructure Development (MOID), responsible for the sector’s development formulated a National transport policy (2003). As part of its implementation strategy, the Ministry is implementing the Transport Sector Investment Programme (TSIP) for developing the transport sector in a holistic manner.
4.4.2 STATUS OF THE TRANSPORT SECTOR BY TYPE
4.4.2.1 Maritime Transport. The Maritime transport sector is governed by the National Transport Policy (2003) and regulated by the Surface and Marine Transport Regulatory Authority (SUMATRA 2003). One of the roles of the Regulator is to provide licenses to the operators who wish to provide marine transport services. The license provides a number of safety issues as well as conditions on which services should be provided. The sector is also regulated through the following instruments;
• Merchant Shipping Act 2003 and IMO conventions which regulates safety of ports, passengers, vessels and environment,
• SUMATRA Act which regulates the economics of the ports, • Shipping Agency Act, 2004 which regulates the shipping agency businesses, • Ports Act, 2004 regulating ports operations..
Tanzania is endowed with nearly 800 nautical miles (1,810 km) of Indian Ocean coastal
line. It has four major ports namely; Dar es Salaam, Mtwara, Tanga and Zanzibar for deep sea and coastal transport and other smaller ports of Kilwa, Lindi, Pangani and Bagamoyo. Dar es Salaam port, which is the biggest has 11 berths of which 8 are for break-bulk (6,400,000 tonnes) and 3 for containers (120,000 TEUS) The port also has an oil jet with capacity of handling larger tankers of up to 40,000 DWT.
Port development in conjunction with maritime shipping transport is one of the major
modes for carriage of inter and intra regional trade with great impact to a country’s economy. Maritime ports are strategically located between water transportation and inland modes of transport such as rail, road, pipelines and air. Ports are a major gateway for the country’s international trade in addition to providing services to local and transit traffic, shippers and consignees, shipping lines, etc.
The Dar es Salaam port handles 90% of the country total ocean freight averaging 40
million tones/year. Total Traffic is quite unbalanced between imports (about 83%) and export (16.6%). An increased share of total traffic is shipped in containers of which about 70% is for Tanzania and the remaining for transit to landlocked countries of Zambia, Malawi, DRC, Rwanda, Burundi and Uganda.
31
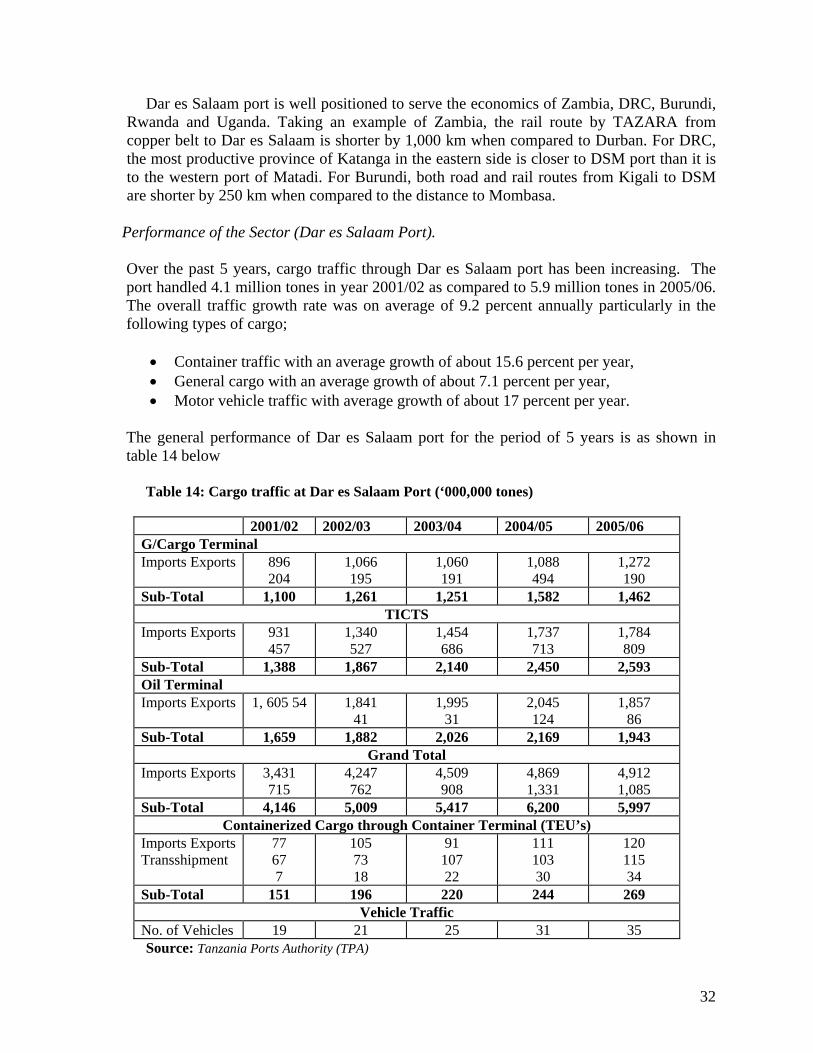
Dar es Salaam port is well positioned to serve the economics of Zambia, DRC, Burundi, Rwanda and Uganda. Taking an example of Zambia, the rail route by TAZARA from copper belt to Dar es Salaam is shorter by 1,000 km when compared to Durban. For DRC, the most productive province of Katanga in the eastern side is closer to DSM port than it is to the western port of Matadi. For Burundi, both road and rail routes from Kigali to DSM are shorter by 250 km when compared to the distance to Mombasa.
Performance of the Sector (Dar es Salaam Port).
Over the past 5 years, cargo traffic through Dar es Salaam port has been increasing. The port handled 4.1 million tones in year 2001/02 as compared to 5.9 million tones in 2005/06. The overall traffic growth rate was on average of 9.2 percent annually particularly in the following types of cargo;
• Container traffic with an average growth of about 15.6 percent per year, • General cargo with an average growth of about 7.1 percent per year, • Motor vehicle traffic with average growth of about 17 percent per year.
The general performance of Dar es Salaam port for the period of 5 years is as shown in table 14 below
Table 14: Cargo traffic at Dar es Salaam Port (‘000,000 tones)
2001/02 2002/03 2003/04 2004/05 2005/06 G/Cargo Terminal Imports Exports 896
204 1,066 195
1,060 191
1,088 494
1,272 190
Sub-Total 1,100 1,261 1,251 1,582 1,462 TICTS
Imports Exports 931 457
1,340 527
1,454 686
1,737 713
1,784 809
Sub-Total 1,388 1,867 2,140 2,450 2,593 Oil Terminal Imports Exports 1, 605 54 1,841
41 1,995
31 2,045 124
1,857 86
Sub-Total 1,659 1,882 2,026 2,169 1,943 Grand Total
Imports Exports 3,431 715
4,247 762
4,509 908
4,869 1,331
4,912 1,085
Sub-Total 4,146 5,009 5,417 6,200 5,997 Containerized Cargo through Container Terminal (TEU’s)
Imports Exports Transshipment
77 67 7
105 73 18
91 107 22
111 103 30
120 115 34
Sub-Total 151 196 220 244 269 Vehicle Traffic
No. of Vehicles 19 21 25 31 35 Source: Tanzania Ports Authority (TPA)
32
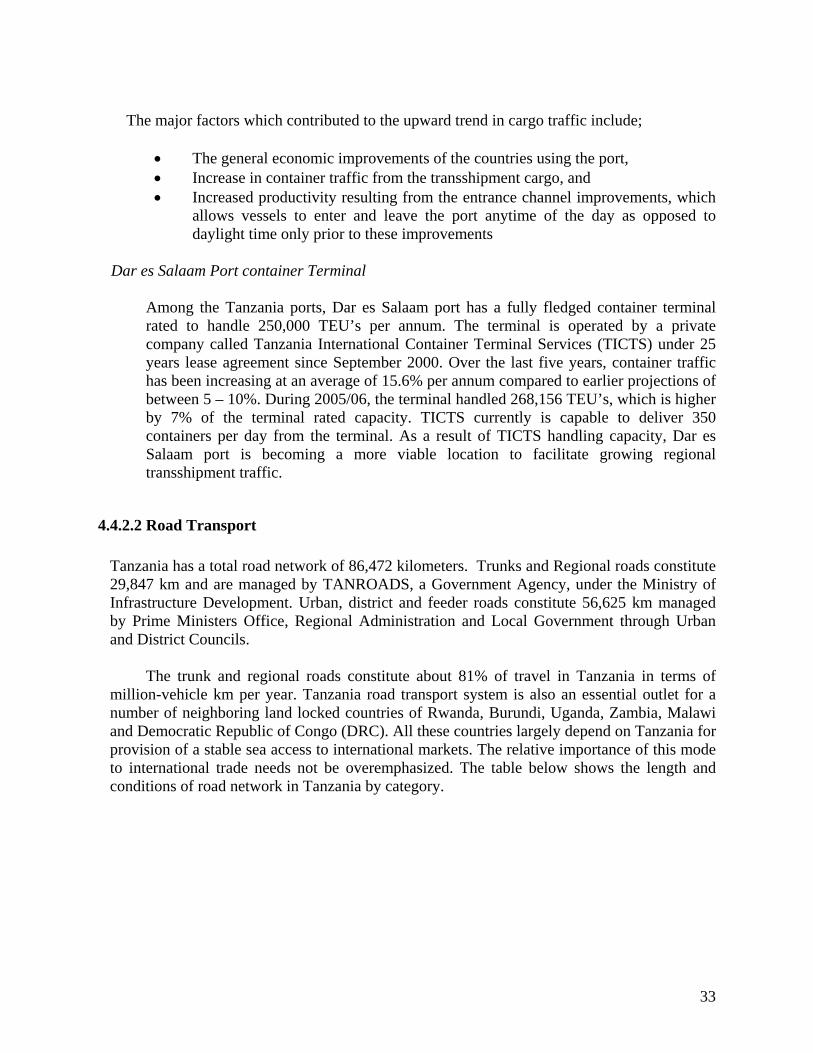
The major factors which contributed to the upward trend in cargo traffic include;
• The general economic improvements of the countries using the port, • Increase in container traffic from the transshipment cargo, and • Increased productivity resulting from the entrance channel improvements, which
allows vessels to enter and leave the port anytime of the day as opposed to daylight time only prior to these improvements
Dar es Salaam Port container Terminal
Among the Tanzania ports, Dar es Salaam port has a fully fledged container terminal rated to handle 250,000 TEU’s per annum. The terminal is operated by a private company called Tanzania International Container Terminal Services (TICTS) under 25 years lease agreement since September 2000. Over the last five years, container traffic has been increasing at an average of 15.6% per annum compared to earlier projections of between 5 – 10%. During 2005/06, the terminal handled 268,156 TEU’s, which is higher by 7% of the terminal rated capacity. TICTS currently is capable to deliver 350 containers per day from the terminal. As a result of TICTS handling capacity, Dar es Salaam port is becoming a more viable location to facilitate growing regional transshipment traffic.
4.4.2.2 Road Transport
Tanzania has a total road network of 86,472 kilometers. Trunks and Regional roads constitute 29,847 km and are managed by TANROADS, a Government Agency, under the Ministry of Infrastructure Development. Urban, district and feeder roads constitute 56,625 km managed by Prime Ministers Office, Regional Administration and Local Government through Urban and District Councils.
The trunk and regional roads constitute about 81% of travel in Tanzania in terms of
million-vehicle km per year. Tanzania road transport system is also an essential outlet for a number of neighboring land locked countries of Rwanda, Burundi, Uganda, Zambia, Malawi and Democratic Republic of Congo (DRC). All these countries largely depend on Tanzania for provision of a stable sea access to international markets. The relative importance of this mode to international trade needs not be overemphasized. The table below shows the length and conditions of road network in Tanzania by category.
33
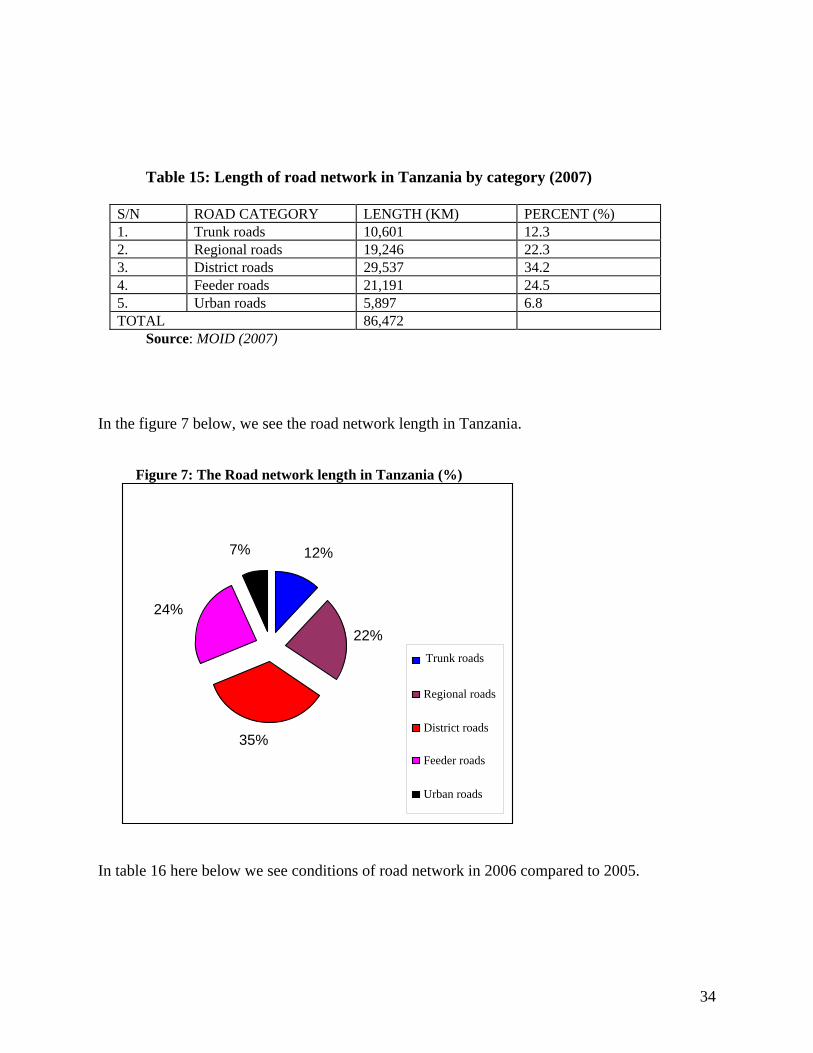
Table 15: Length of road network in Tanzania by category (2007)
S/N ROAD CATEGORY LENGTH (KM) PERCENT (%) 1. Trunk roads 10,601 12.3 2. Regional roads 19,246 22.3 3. District roads 29,537 34.2 4. Feeder roads 21,191 24.5 5. Urban roads 5,897 6.8 TOTAL 86,472
Source: MOID (2007)
In the figure 7 below, we see the road network length in Tanzania. Figure 7: The Road network length in Tanzania (%)
12%
22%
35%
24%
7%
Trunk roads
Regional roads
District roads
Feeder roads
Urban roads
In table 16 here below we see conditions of road network in 2006 compared to 2005.
34
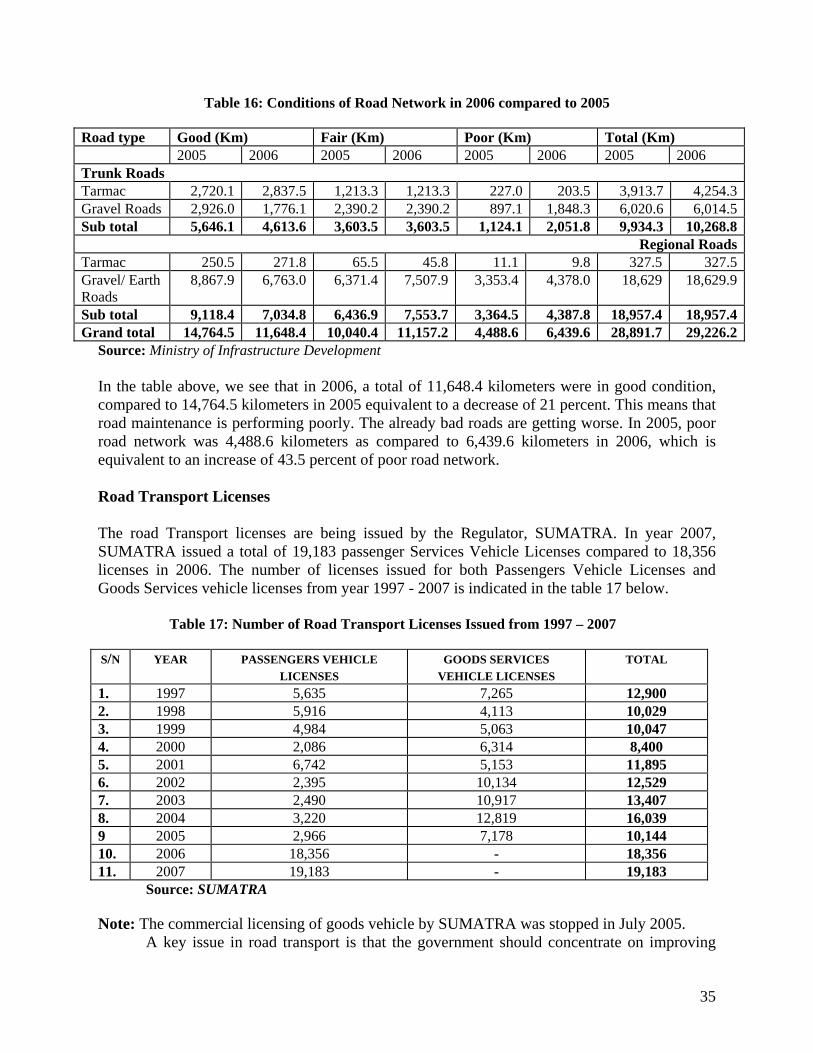
Table 16: Conditions of Road Network in 2006 compared to 2005
Road type Good (Km) Fair (Km) Poor (Km) Total (Km) 2005 2006 2005 2006 2005 2006 2005 2006 Trunk Roads Tarmac 2,720.1 2,837.5 1,213.3 1,213.3 227.0 203.5 3,913.7 4,254.3Gravel Roads 2,926.0 1,776.1 2,390.2 2,390.2 897.1 1,848.3 6,020.6 6,014.5Sub total 5,646.1 4,613.6 3,603.5 3,603.5 1,124.1 2,051.8 9,934.3 10,268.8
Regional RoadsTarmac 250.5 271.8 65.5 45.8 11.1 9.8 327.5 327.5Gravel/ Earth Roads
8,867.9 6,763.0 6,371.4 7,507.9 3,353.4 4,378.0 18,629 18,629.9
Sub total 9,118.4 7,034.8 6,436.9 7,553.7 3,364.5 4,387.8 18,957.4 18,957.4Grand total 14,764.5 11,648.4 10,040.4 11,157.2 4,488.6 6,439.6 28,891.7 29,226.2
Source: Ministry of Infrastructure Development In the table above, we see that in 2006, a total of 11,648.4 kilometers were in good condition, compared to 14,764.5 kilometers in 2005 equivalent to a decrease of 21 percent. This means that road maintenance is performing poorly. The already bad roads are getting worse. In 2005, poor road network was 4,488.6 kilometers as compared to 6,439.6 kilometers in 2006, which is equivalent to an increase of 43.5 percent of poor road network.
Road Transport Licenses The road Transport licenses are being issued by the Regulator, SUMATRA. In year 2007, SUMATRA issued a total of 19,183 passenger Services Vehicle Licenses compared to 18,356 licenses in 2006. The number of licenses issued for both Passengers Vehicle Licenses and Goods Services vehicle licenses from year 1997 - 2007 is indicated in the table 17 below.
Table 17: Number of Road Transport Licenses Issued from 1997 – 2007
S/N YEAR PASSENGERS VEHICLE
LICENSES GOODS SERVICES
VEHICLE LICENSES TOTAL
1. 1997 5,635 7,265 12,900 2. 1998 5,916 4,113 10,029 3. 1999 4,984 5,063 10,047 4. 2000 2,086 6,314 8,400 5. 2001 6,742 5,153 11,895 6. 2002 2,395 10,134 12,529 7. 2003 2,490 10,917 13,407 8. 2004 3,220 12,819 16,039 9 2005 2,966 7,178 10,144 10. 2006 18,356 - 18,356 11. 2007 19,183 - 19,183
Source: SUMATRA
Note: The commercial licensing of goods vehicle by SUMATRA was stopped in July 2005. A key issue in road transport is that the government should concentrate on improving
35
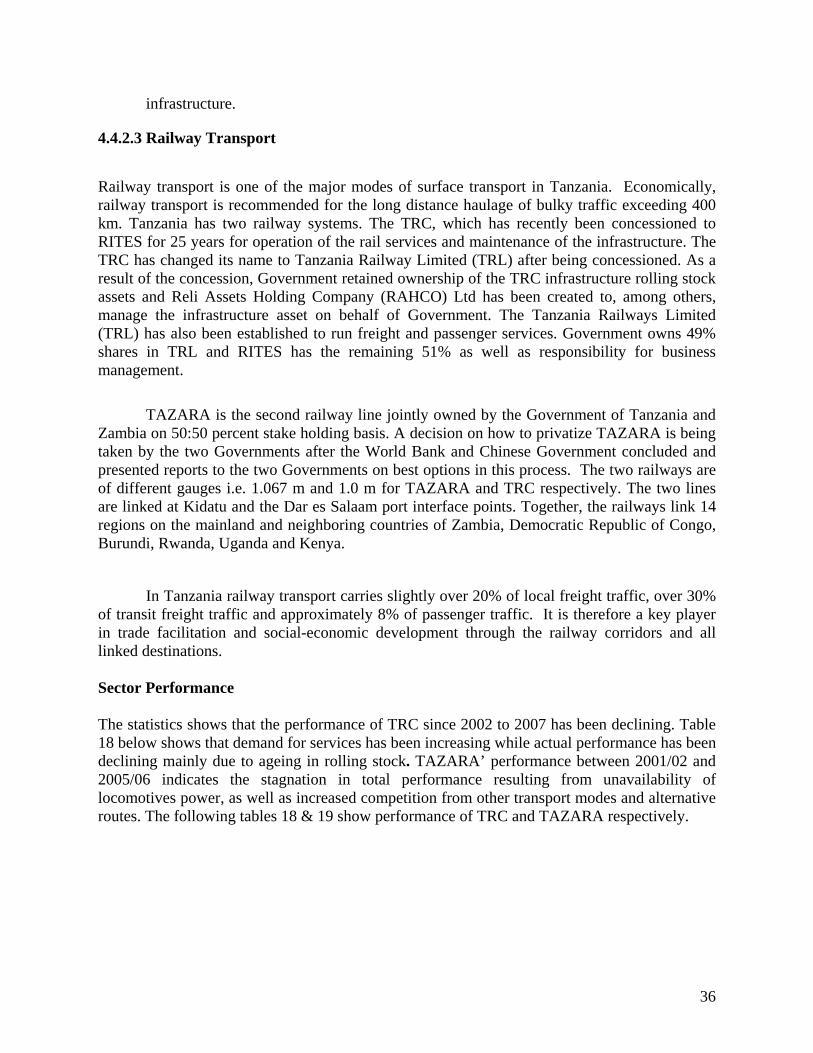
infrastructure.
4.4.2.3 Railway Transport Railway transport is one of the major modes of surface transport in Tanzania. Economically, railway transport is recommended for the long distance haulage of bulky traffic exceeding 400 km. Tanzania has two railway systems. The TRC, which has recently been concessioned to RITES for 25 years for operation of the rail services and maintenance of the infrastructure. The TRC has changed its name to Tanzania Railway Limited (TRL) after being concessioned. As a result of the concession, Government retained ownership of the TRC infrastructure rolling stock assets and Reli Assets Holding Company (RAHCO) Ltd has been created to, among others, manage the infrastructure asset on behalf of Government. The Tanzania Railways Limited (TRL) has also been established to run freight and passenger services. Government owns 49% shares in TRL and RITES has the remaining 51% as well as responsibility for business management.
TAZARA is the second railway line jointly owned by the Government of Tanzania and
Zambia on 50:50 percent stake holding basis. A decision on how to privatize TAZARA is being taken by the two Governments after the World Bank and Chinese Government concluded and presented reports to the two Governments on best options in this process. The two railways are of different gauges i.e. 1.067 m and 1.0 m for TAZARA and TRC respectively. The two lines are linked at Kidatu and the Dar es Salaam port interface points. Together, the railways link 14 regions on the mainland and neighboring countries of Zambia, Democratic Republic of Congo, Burundi, Rwanda, Uganda and Kenya.
In Tanzania railway transport carries slightly over 20% of local freight traffic, over 30% of transit freight traffic and approximately 8% of passenger traffic. It is therefore a key player in trade facilitation and social-economic development through the railway corridors and all linked destinations. Sector Performance The statistics shows that the performance of TRC since 2002 to 2007 has been declining. Table 18 below shows that demand for services has been increasing while actual performance has been declining mainly due to ageing in rolling stock. TAZARA’ performance between 2001/02 and 2005/06 indicates the stagnation in total performance resulting from unavailability of locomotives power, as well as increased competition from other transport modes and alternative routes. The following tables 18 & 19 show performance of TRC and TAZARA respectively.
36
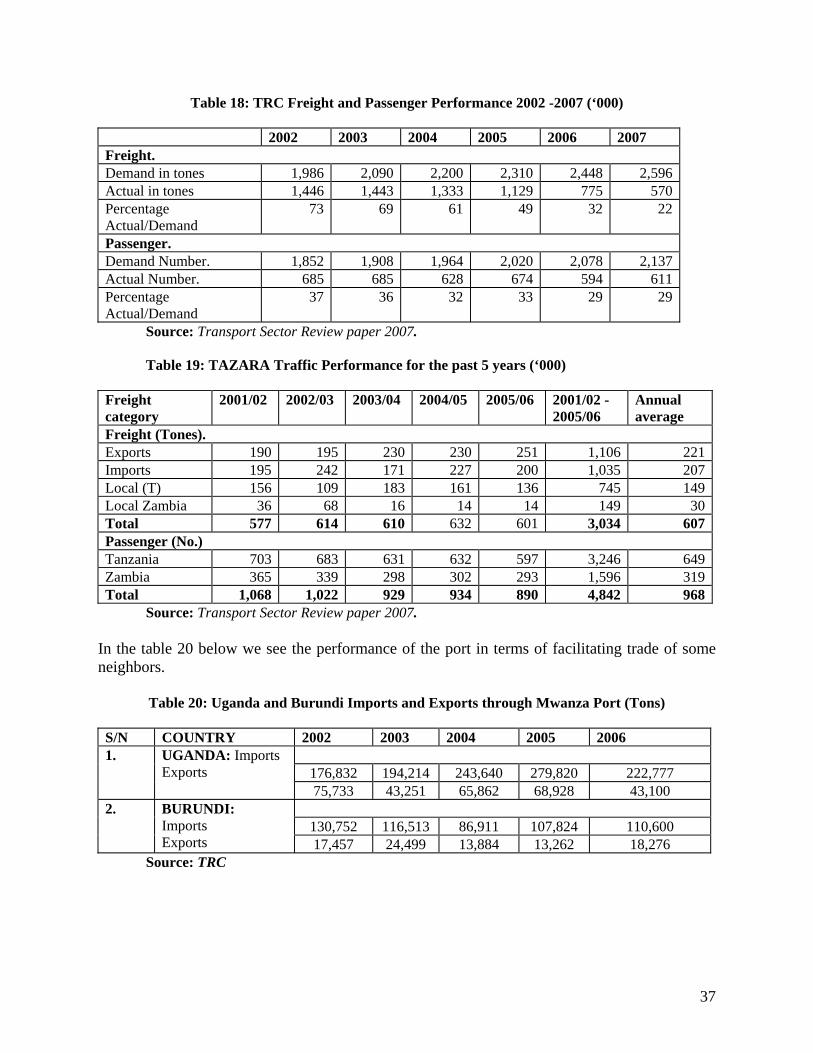
Table 18: TRC Freight and Passenger Performance 2002 -2007 (‘000)
2002 2003 2004 2005 2006 2007 Freight. Demand in tones 1,986 2,090 2,200 2,310 2,448 2,596Actual in tones 1,446 1,443 1,333 1,129 775 570Percentage Actual/Demand
73 69 61 49 32 22
Passenger. Demand Number. 1,852 1,908 1,964 2,020 2,078 2,137Actual Number. 685 685 628 674 594 611Percentage Actual/Demand
37 36 32 33 29 29
Source: Transport Sector Review paper 2007.
Table 19: TAZARA Traffic Performance for the past 5 years (‘000)
Freight category
2001/02 2002/03 2003/04 2004/05 2005/06 2001/02 - 2005/06
Annual average
Freight (Tones). Exports 190 195 230 230 251 1,106 221Imports 195 242 171 227 200 1,035 207Local (T) 156 109 183 161 136 745 149Local Zambia 36 68 16 14 14 149 30Total 577 614 610 632 601 3,034 607Passenger (No.) Tanzania 703 683 631 632 597 3,246 649Zambia 365 339 298 302 293 1,596 319Total 1,068 1,022 929 934 890 4,842 968
Source: Transport Sector Review paper 2007. In the table 20 below we see the performance of the port in terms of facilitating trade of some neighbors.
Table 20: Uganda and Burundi Imports and Exports through Mwanza Port (Tons)
S/N COUNTRY 2002 2003 2004 2005 2006
176,832 194,214 243,640 279,820 222,777
1. UGANDA: Imports Exports
75,733 43,251 65,862 68,928 43,100
130,752 116,513 86,911 107,824 110,600 2. BURUNDI:
Imports Exports 17,457 24,499 13,884 13,262 18,276
Source: TRC
37
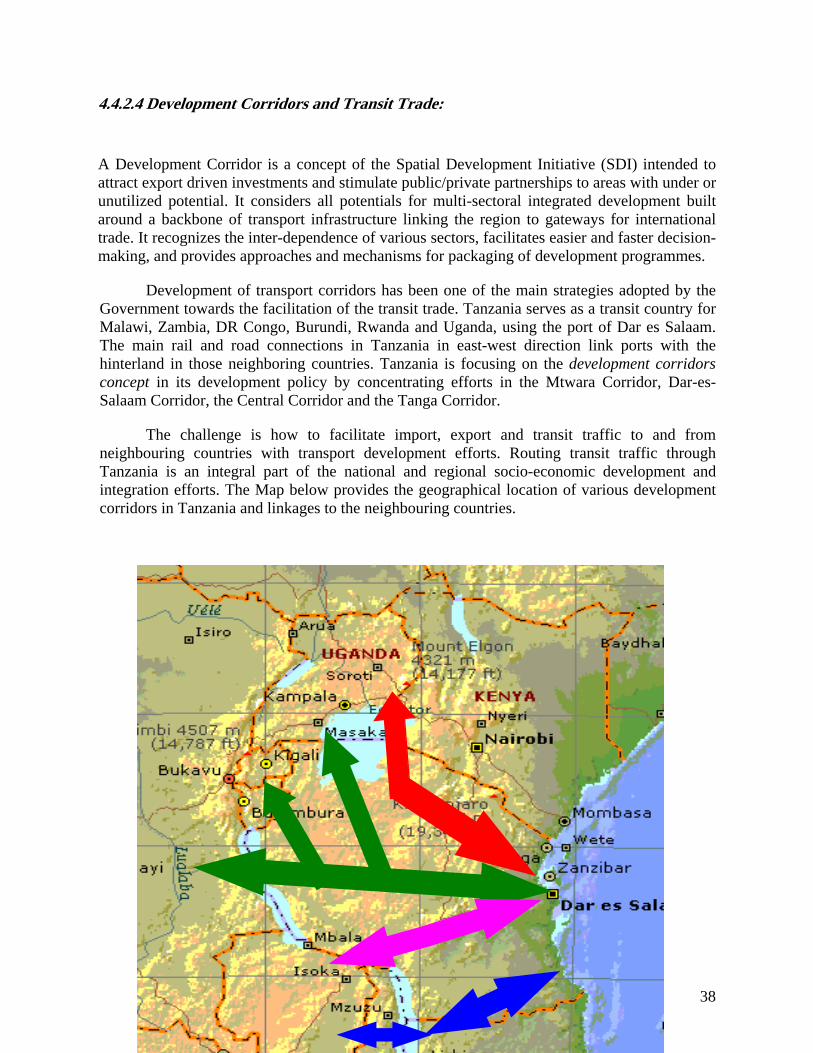
4.4.2.4 Development Corridors and Transit Trade:
A Development Corridor is a concept of the Spatial Development Initiative (SDI) intended to attract export driven investments and stimulate public/private partnerships to areas with under or unutilized potential. It considers all potentials for multi-sectoral integrated development built around a backbone of transport infrastructure linking the region to gateways for international trade. It recognizes the inter-dependence of various sectors, facilitates easier and faster decision-making, and provides approaches and mechanisms for packaging of development programmes.
Development of transport corridors has been one of the main strategies adopted by the Government towards the facilitation of the transit trade. Tanzania serves as a transit country for Malawi, Zambia, DR Congo, Burundi, Rwanda and Uganda, using the port of Dar es Salaam. The main rail and road connections in Tanzania in east-west direction link ports with the hinterland in those neighboring countries. Tanzania is focusing on the development corridors concept in its development policy by concentrating efforts in the Mtwara Corridor, Dar-es-Salaam Corridor, the Central Corridor and the Tanga Corridor.
The challenge is how to facilitate import, export and transit traffic to and from neighbouring countries with transport development efforts. Routing transit traffic through Tanzania is an integral part of the national and regional socio-economic development and integration efforts. The Map below provides the geographical location of various development corridors in Tanzania and linkages to the neighbouring countries.
38
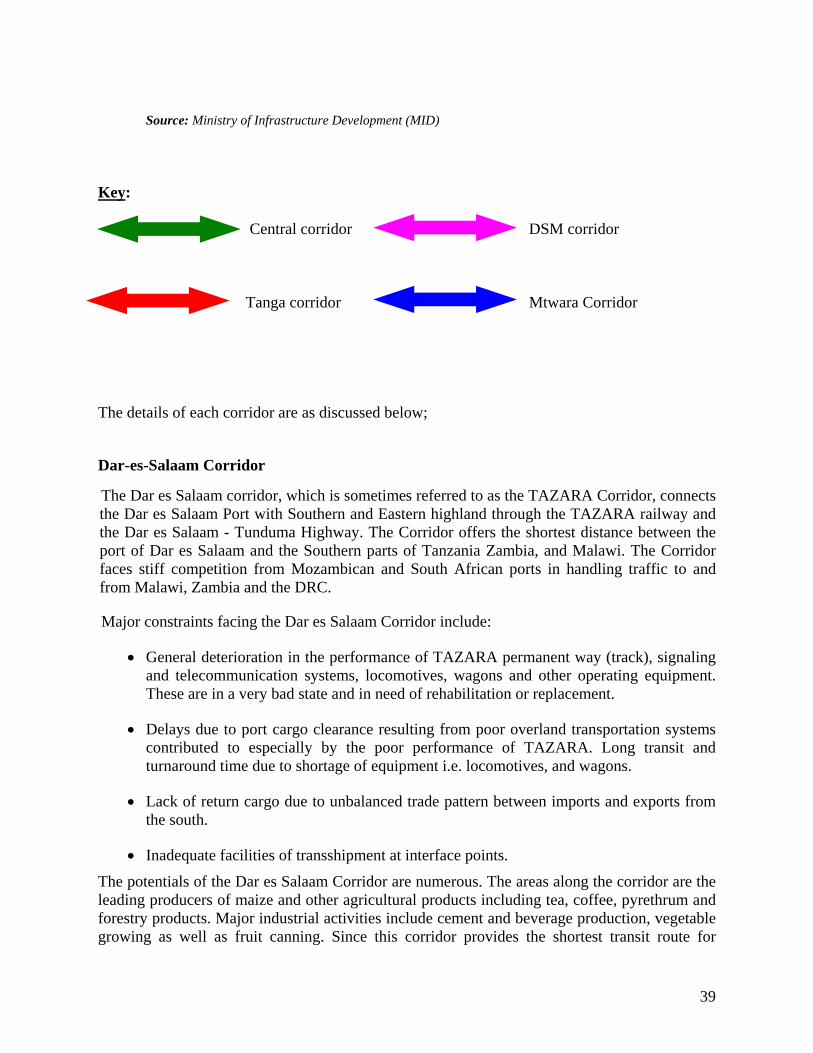
Source: Ministry of Infrastructure Development (MID)
Key: Central corridor DSM corridor Tanga corridor Mtwara Corridor The details of each corridor are as discussed below;
Dar-es-Salaam Corridor
The Dar es Salaam corridor, which is sometimes referred to as the TAZARA Corridor, connects the Dar es Salaam Port with Southern and Eastern highland through the TAZARA railway and the Dar es Salaam - Tunduma Highway. The Corridor offers the shortest distance between the port of Dar es Salaam and the Southern parts of Tanzania Zambia, and Malawi. The Corridor faces stiff competition from Mozambican and South African ports in handling traffic to and from Malawi, Zambia and the DRC.
Major constraints facing the Dar es Salaam Corridor include:
• General deterioration in the performance of TAZARA permanent way (track), signaling and telecommunication systems, locomotives, wagons and other operating equipment. These are in a very bad state and in need of rehabilitation or replacement.
• Delays due to port cargo clearance resulting from poor overland transportation systems contributed to especially by the poor performance of TAZARA. Long transit and turnaround time due to shortage of equipment i.e. locomotives, and wagons.
• Lack of return cargo due to unbalanced trade pattern between imports and exports from the south.
• Inadequate facilities of transshipment at interface points.
The potentials of the Dar es Salaam Corridor are numerous. The areas along the corridor are the leading producers of maize and other agricultural products including tea, coffee, pyrethrum and forestry products. Major industrial activities include cement and beverage production, vegetable growing as well as fruit canning. Since this corridor provides the shortest transit route for
39
Zambia and Malawi, investments to tap the potentials of the corridors are desired. However, the importance of this corridor at the regional level lies in the packaging of both infrastructure and economic projects that are viable and attractive for direct foreign Investments.
Central Corridor The Central Corridor originates from the Port of Dar es Salaam and takes the central line route extending to eastern DRC, Burundi via Kigoma on Lake Tanganyika, to Rwanda via Isaka Dry Port, and to Uganda via Mwanza on Lake Victoria. The corridor offers the shortest distances between the Port of Dar and the landlocked countries as follows:
Dar - Kigoma - Bujumbura by road/rail and lake: 1,436 km
Dar - Kigoma - Kalemie by road/rail and lake: 1,374 km
Dar - Isaka - Kigali by rail and road 1,463 km
Dar - Mwanza - Port Bell by rail and Lake 1,581 km
The major constraints facing the corridor are:
• Poor condition of the infrastructure for both rail and road, • Delays to cargo inter-modal exchange especially at the port of Dar es Salaam due to
shortage of wagons and low availability of locomotives, • Delays to cargo clearance at the port of Dar es Salaam due to incompetence of some
Clearing and Forwarding Agents and cumbersome documentation procedures, • Lack of navigational aids on the lakes (Tanganyika and Victoria) resulting into unsafe
operations. • Silting on Lake Victoria at Mwanza, and Tanganyika at Kigoma and Kalemie. • Damaged rails and bridges of the Congo Railways (SNCC) on East DRC. • Poor condition of the road between Rusumo and Kigali in Rwanda. • Untimely follow up of the issue of the Corridors agreed on at bilateral meetings.
Tanga Corridor The corridor has great potential to handle cargo from Uganda, Kenya, Burundi and Rwanda through Lake Victoria regions using the Tanga port. Projects that need to be implemented to remove critical bottlenecks along this corridor include: the development of a new deep-water port at Tanga, and construction of Tanga- Arusha - Musoma Rail line. Along the route, there are high agricultural potentials, tourist attractions, mineral deposits which make investment in transport infrastructure such as railway line, economically viable. At the moment there is a railway line joining Tanga and Arusha handling cargo. There is a good tarmac road stretching from Tanga to Arusha - Makuyuni to Ngorongoro gate. There are also airports at Tanga, Kilimanjaro, Arusha, Moshi, Lake Manyara and Musoma.
40
The constraints include:
• Absence of deep water berth at Tanga port, • Absence of a railway stretch linking Arusha with Uganda, Rwanda and Burundi, • Environmental concerns for the possible railway alignment between Arusha and
Musoma, • Absence of dedicated funds for conducting a study to determine socio-economic and
environmental viability, • The airports along the corridor (Arusha, Musoma and Bukoba) need a lot of
improvement.
Mtwara Corridor
This is one of the corridors identified to serve SADC countries. The corridor covers parts of northern Malawi, Mozambique, Tanzania and North-Eastern Zambia under the Spatial Development Initiatives (SDI). Port development, road and rail construction are critical components for exploitation of the potentials along the corridor.
Specific constraints are:
• Limited Mtwara Port capacity, • Absence of both rail and road network linking the port to the hinterland, • Mbamba Bay port needs to be developed to allow for transit traffic from Mkata Bay in
Malawi, to Mtwara and eventually to overseas, • Unimproved transport infrastructure between the Southern regions of Tanzania and
Mozambique.
4.4.2.5 Air Transport
Air transport is the fastest worldwide transportation service. It caters for long distances, where time saving for passengers and perishable/valuable goods is a critical element especially for business. It also provides easy accessibility to distant and remote areas where surface transport is limited. Such areas include accessibility to agricultural, manufacturing, tourism, and mineral deposits which play a great role in economic growth. It facilitates international trade and makes business travel easier and efficient. The contribution of the air transport sub-sector in Tanzania GDP has remained negligible for the past five years: below 1%.
The Tanzania National Transport Policy 2003 (NTP) provides the framework for air transport sub sector operations and management in the country. It provides policy guidelines on air transport liberalization, environmental concerns, infrastructure development and ownership, and public service obligations (PSO). The sector is regulated by Tanzania Civil Aviation Authority (TCAA) which also provides air navigation services including air traffic management, aeronautical information services, communication, navigation and surveillance (CNS) systems.
Tanzania mainland has a total of 368 aerodromes, which are classified into four major groups namely International Airports, Major Domestic Airports, Strategically Located aerodromes and Small airstrips. In terms of administration, ownership and management
41
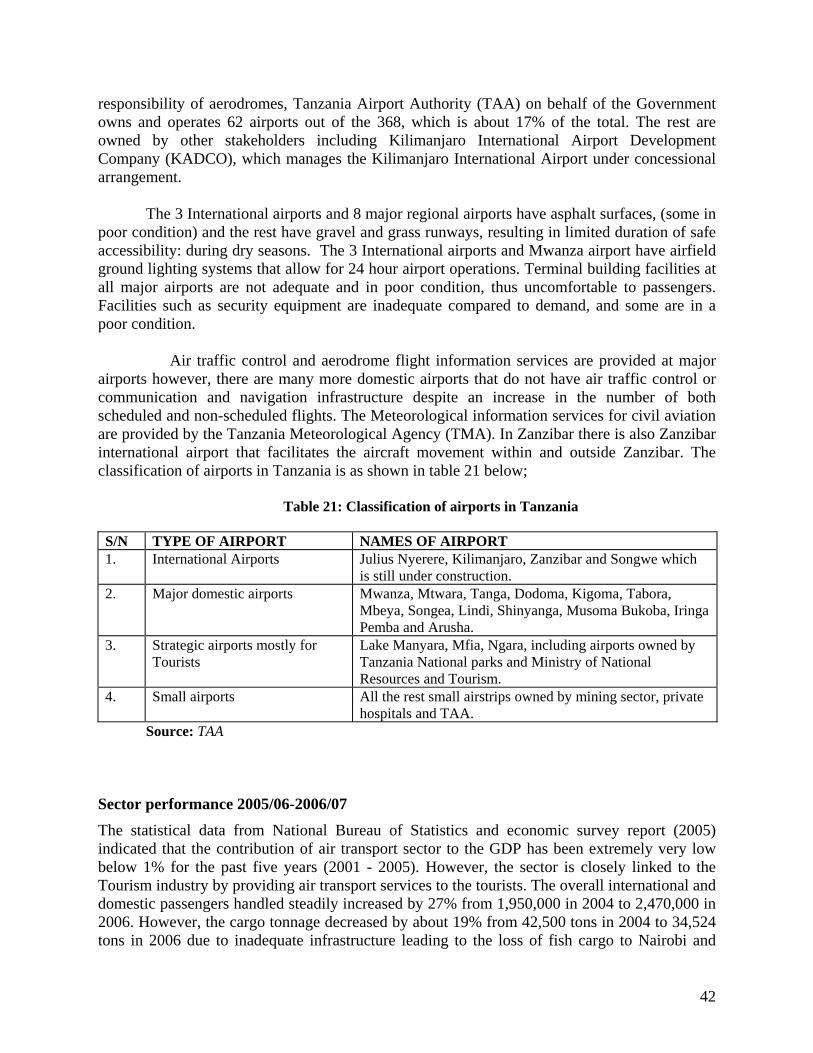
responsibility of aerodromes, Tanzania Airport Authority (TAA) on behalf of the Government owns and operates 62 airports out of the 368, which is about 17% of the total. The rest are owned by other stakeholders including Kilimanjaro International Airport Development Company (KADCO), which manages the Kilimanjaro International Airport under concessional arrangement.
The 3 International airports and 8 major regional airports have asphalt surfaces, (some in
poor condition) and the rest have gravel and grass runways, resulting in limited duration of safe accessibility: during dry seasons. The 3 International airports and Mwanza airport have airfield ground lighting systems that allow for 24 hour airport operations. Terminal building facilities at all major airports are not adequate and in poor condition, thus uncomfortable to passengers. Facilities such as security equipment are inadequate compared to demand, and some are in a poor condition. Air traffic control and aerodrome flight information services are provided at major airports however, there are many more domestic airports that do not have air traffic control or communication and navigation infrastructure despite an increase in the number of both scheduled and non-scheduled flights. The Meteorological information services for civil aviation are provided by the Tanzania Meteorological Agency (TMA). In Zanzibar there is also Zanzibar international airport that facilitates the aircraft movement within and outside Zanzibar. The classification of airports in Tanzania is as shown in table 21 below;
Table 21: Classification of airports in Tanzania
S/N TYPE OF AIRPORT NAMES OF AIRPORT 1. International Airports Julius Nyerere, Kilimanjaro, Zanzibar and Songwe which
is still under construction. 2. Major domestic airports Mwanza, Mtwara, Tanga, Dodoma, Kigoma, Tabora,
Mbeya, Songea, Lindi, Shinyanga, Musoma Bukoba, Iringa Pemba and Arusha.
3. Strategic airports mostly for Tourists
Lake Manyara, Mfia, Ngara, including airports owned by Tanzania National parks and Ministry of National Resources and Tourism.
4. Small airports All the rest small airstrips owned by mining sector, private hospitals and TAA.
Source: TAA
Sector performance 2005/06-2006/07
The statistical data from National Bureau of Statistics and economic survey report (2005) indicated that the contribution of air transport sector to the GDP has been extremely very low below 1% for the past five years (2001 - 2005). However, the sector is closely linked to the Tourism industry by providing air transport services to the tourists. The overall international and domestic passengers handled steadily increased by 27% from 1,950,000 in 2004 to 2,470,000 in 2006. However, the cargo tonnage decreased by about 19% from 42,500 tons in 2004 to 34,524 tons in 2006 due to inadequate infrastructure leading to the loss of fish cargo to Nairobi and
42
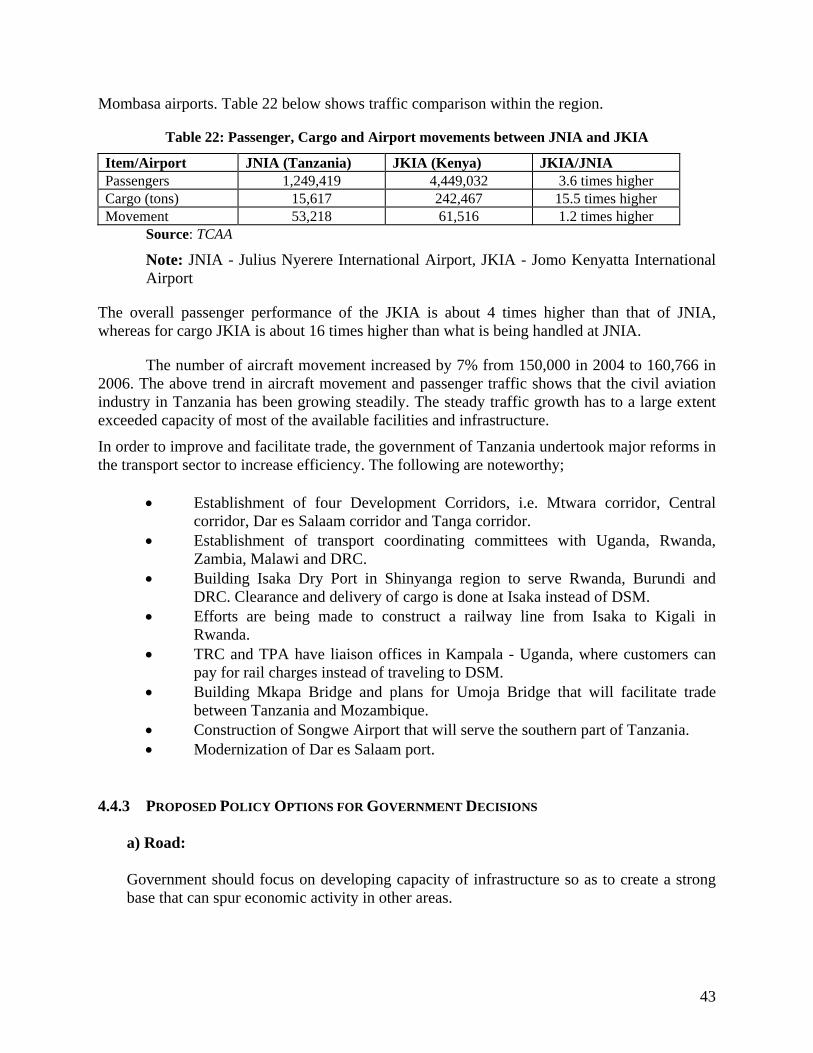
Mombasa airports. Table 22 below shows traffic comparison within the region.
Table 22: Passenger, Cargo and Airport movements between JNIA and JKIA
Item/Airport JNIA (Tanzania) JKIA (Kenya) JKIA/JNIA Passengers 1,249,419 4,449,032 3.6 times higher Cargo (tons) 15,617 242,467 15.5 times higher Movement 53,218 61,516 1.2 times higher
Source: TCAA
Note: JNIA - Julius Nyerere International Airport, JKIA - Jomo Kenyatta International Airport
The overall passenger performance of the JKIA is about 4 times higher than that of JNIA, whereas for cargo JKIA is about 16 times higher than what is being handled at JNIA.
The number of aircraft movement increased by 7% from 150,000 in 2004 to 160,766 in 2006. The above trend in aircraft movement and passenger traffic shows that the civil aviation industry in Tanzania has been growing steadily. The steady traffic growth has to a large extent exceeded capacity of most of the available facilities and infrastructure.
In order to improve and facilitate trade, the government of Tanzania undertook major reforms in the transport sector to increase efficiency. The following are noteworthy;
• Establishment of four Development Corridors, i.e. Mtwara corridor, Central corridor, Dar es Salaam corridor and Tanga corridor.
• Establishment of transport coordinating committees with Uganda, Rwanda, Zambia, Malawi and DRC.
• Building Isaka Dry Port in Shinyanga region to serve Rwanda, Burundi and DRC. Clearance and delivery of cargo is done at Isaka instead of DSM.
• Efforts are being made to construct a railway line from Isaka to Kigali in Rwanda.
• TRC and TPA have liaison offices in Kampala - Uganda, where customers can pay for rail charges instead of traveling to DSM.
• Building Mkapa Bridge and plans for Umoja Bridge that will facilitate trade between Tanzania and Mozambique.
• Construction of Songwe Airport that will serve the southern part of Tanzania. • Modernization of Dar es Salaam port.
4.4.3 PROPOSED POLICY OPTIONS FOR GOVERNMENT DECISIONS
a) Road: Government should focus on developing capacity of infrastructure so as to create a strong base that can spur economic activity in other areas.
43

b) Railway: The two mainlines are still in process of legal uncertainty with TAZARA awaiting finalisation with the government of Zambia, and the other having been concessioned for a 25 year lease. The government can only consider trading its 49% shares and all of this would have to be looked at within the details of the contracts involved. These legal uncertainties would have to be sorted out first prior to any commitment. To the extent that there are other railway lines, government may consider inviting more competition into this.
c) Maritime: TICTS has a 25 year lease since September 2000. Discussions with officials from SUMATRA indicated that the sector has a lot of complications and is not ready for GATS liberalization. It can be assumed that the same concerns would apply to the EPAs; working together with SUMATRA, further discussion should be had on how to enhance the capacity of this sector. There is a Regional Maritime Institute (DMI), which provides marine professionals who are can be employed any where in the maritime industry, as such, Tanzania can seek mode 4 commitments from others in this area. Air transport: Need to develop airport facilities including air traffic control and navigation infrastructure. In the GATS, air transport is governed by the plurilateral Agreement on Air Transport and Tanzania is not a party thereto. Any contemplation of liberalization of this sector would have to consider the details of this Agreement but benefit would hinge on developing capacity, competitiveness and supporting infrastructure in the air transport sector.
d) Key Option
The above recommendations apply at the various sub-sectoral levels.
4.5 HEALTH SECTOR
The Health sector is a key service sector for the economic development of any country. The level of development of any country is a function of the labour force existing within the country. In other words, human resource is the most important working capital. Physical and mental capabilities are important for productivity/output.
Health service provision is managed by the Ministry of Health and Social welfare through its national health policy of 1990 and is regulated by a number of institutions;
• Registrar of Private Hospitals • National Food Control Commission • Optical Council of Tanzania
44
• Medical Council of Tanganyika • Pharmacy Board • Nurses and Midwives Council • Private Health Laboratories Board • Health Laboratory Technologists Council, and • Chief Government Chemist.
The agencies/Institutions under the Ministry are;
• Government Chemistry Laboratory • Food and Drugs Agency • Muhimbili National Hospital • Medical Stores Department, • Muhimbili Orthopedic Institute, • The Ocean Road Cancer Institute, • Tanzania Food and Nutrition Centre (TFNC), • National Institute for Medical Research, and • Mbeya Referral Hospital
Professional Associations under the Ministry include;
• Tanzania Registered Nurses Association (TARENA) • Medical Association of Tanzania (MAT) • Medical Laboratory Association (MELSAT) • Clinical Officers Association of Tanzania (COATA).
The sector vision is to have health services of high quality, effective and accessible to
all, delivered by a well performing and sustainable national health system.
The overall objective of the health policy in Tanzania is to improve the health and well-being of all Tanzanians, with a focus on those most at risk (addressing maternal health and under fives) and encourage the health system to be more responsive to the needs of the people, while implementing the Millennium Development Goals. The specific objectives are to;
• Reduce infant and material morbidity and mortality and increase life expectancy through the provision of adequate and equitable maternal and child health services, promotion of adequate nutrition, control of communicable diseases and treatment of common conditions,
• Ensure that health services are available and accessible to all people wherever they are in the country, whether in urban or rural areas,
• Move towards self sufficiency in manpower by training all the cadres required at all levels nationally,
• Sensitize the community on common preventable health problems and improve the capabilities at all levels of society to assess and to analyze problems and to design appropriate action through genuine community involvement,
45
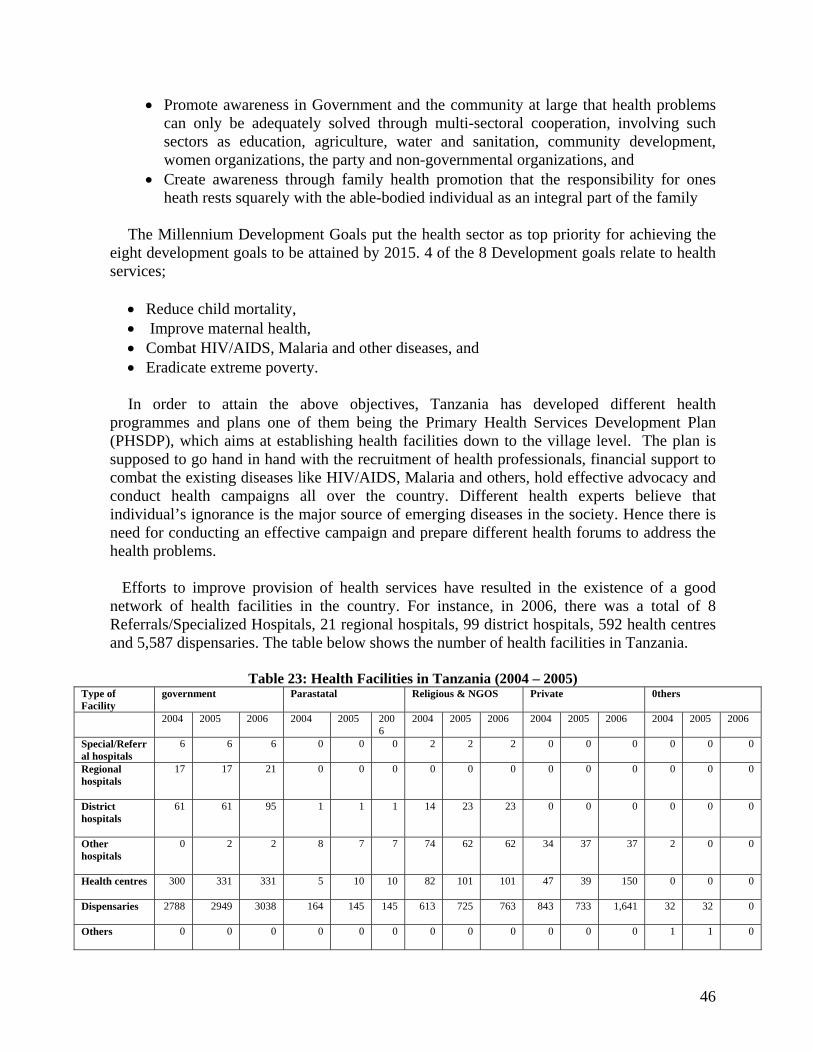
• Promote awareness in Government and the community at large that health problems can only be adequately solved through multi-sectoral cooperation, involving such sectors as education, agriculture, water and sanitation, community development, women organizations, the party and non-governmental organizations, and
• Create awareness through family health promotion that the responsibility for ones heath rests squarely with the able-bodied individual as an integral part of the family
The Millennium Development Goals put the health sector as top priority for achieving the
eight development goals to be attained by 2015. 4 of the 8 Development goals relate to health services;
• Reduce child mortality, • Improve maternal health, • Combat HIV/AIDS, Malaria and other diseases, and • Eradicate extreme poverty.
In order to attain the above objectives, Tanzania has developed different health programmes and plans one of them being the Primary Health Services Development Plan (PHSDP), which aims at establishing health facilities down to the village level. The plan is supposed to go hand in hand with the recruitment of health professionals, financial support to combat the existing diseases like HIV/AIDS, Malaria and others, hold effective advocacy and conduct health campaigns all over the country. Different health experts believe that individual’s ignorance is the major source of emerging diseases in the society. Hence there is need for conducting an effective campaign and prepare different health forums to address the health problems.
Efforts to improve provision of health services have resulted in the existence of a good network of health facilities in the country. For instance, in 2006, there was a total of 8 Referrals/Specialized Hospitals, 21 regional hospitals, 99 district hospitals, 592 health centres and 5,587 dispensaries. The table below shows the number of health facilities in Tanzania.
Table 23: Health Facilities in Tanzania (2004 – 2005) Type of Facility
government Parastatal Religious & NGOS Private 0thers
2004 2005 2006 2004 2005 2006
2004 2005 2006 2004 2005 2006 2004 2005 2006
Special/Referral hospitals
6
6 6 0 0 0 2 2 2 0 0 0 0 0 0
Regional hospitals
17 17 21 0 0 0 0 0 0 0 0 0 0 0 0
District hospitals
61 61 95 1 1 1 14 23 23 0 0 0 0 0 0
Other hospitals
0 2 2 8 7 7 74 62 62 34 37 37 2 0 0
Health centres
300 331 331 5 10 10 82 101 101 47 39 150 0 0 0
Dispensaries
2788 2949 3038 164 145 145 613 725 763 843 733 1,641 32 32 0
Others
0 0 0 0 0 0 0 0 0 0 0 0 1 1 0
46
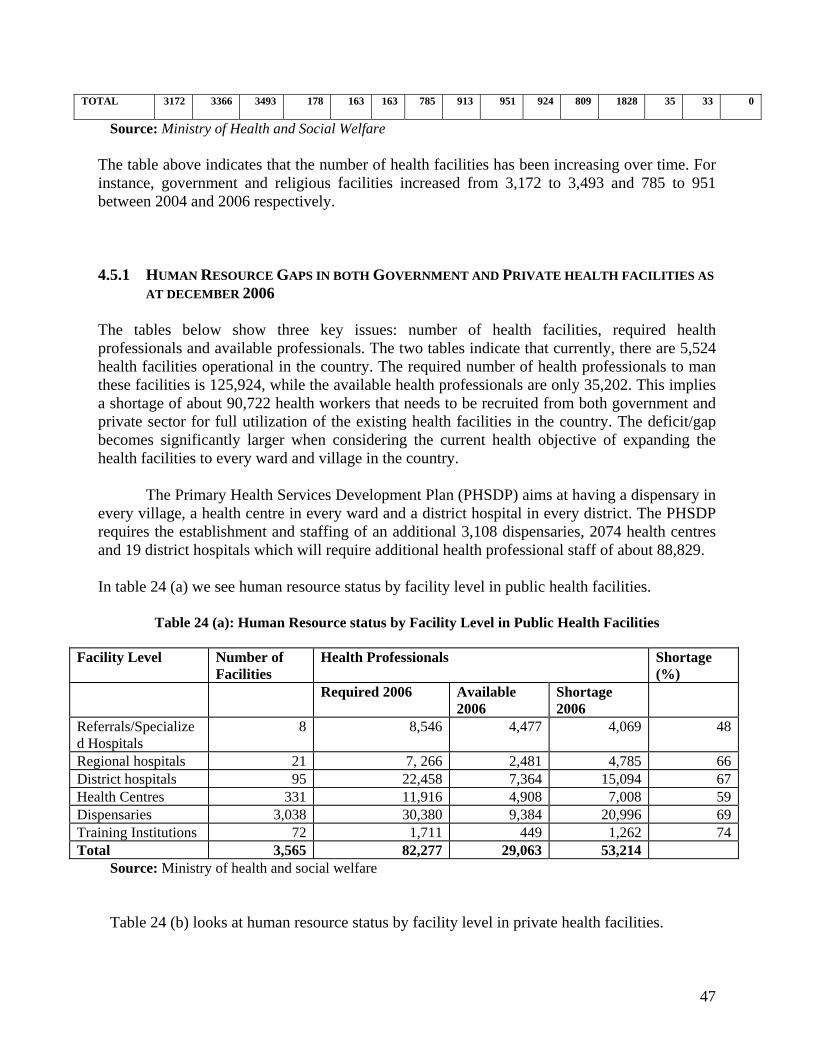
TOTAL
3172 3366 3493 178 163 163 785 913 951 924 809 1828 35 33 0
Source: Ministry of Health and Social Welfare
The table above indicates that the number of health facilities has been increasing over time. For instance, government and religious facilities increased from 3,172 to 3,493 and 785 to 951 between 2004 and 2006 respectively. 4.5.1 HUMAN RESOURCE GAPS IN BOTH GOVERNMENT AND PRIVATE HEALTH FACILITIES AS
AT DECEMBER 2006
The tables below show three key issues: number of health facilities, required health professionals and available professionals. The two tables indicate that currently, there are 5,524 health facilities operational in the country. The required number of health professionals to man these facilities is 125,924, while the available health professionals are only 35,202. This implies a shortage of about 90,722 health workers that needs to be recruited from both government and private sector for full utilization of the existing health facilities in the country. The deficit/gap becomes significantly larger when considering the current health objective of expanding the health facilities to every ward and village in the country.
The Primary Health Services Development Plan (PHSDP) aims at having a dispensary in every village, a health centre in every ward and a district hospital in every district. The PHSDP requires the establishment and staffing of an additional 3,108 dispensaries, 2074 health centres and 19 district hospitals which will require additional health professional staff of about 88,829.
In table 24 (a) we see human resource status by facility level in public health facilities.
Table 24 (a): Human Resource status by Facility Level in Public Health Facilities
Facility Level Number of Facilities
Health Professionals Shortage (%)
Required 2006 Available 2006
Shortage 2006
Referrals/Specialized Hospitals
8 8,546 4,477 4,069 48
Regional hospitals 21 7, 266 2,481 4,785 66District hospitals 95 22,458 7,364 15,094 67Health Centres 331 11,916 4,908 7,008 59Dispensaries 3,038 30,380 9,384 20,996 69Training Institutions 72 1,711 449 1,262 74Total 3,565 82,277 29,063 53,214
Source: Ministry of health and social welfare Table 24 (b) looks at human resource status by facility level in private health facilities.
47
Table 24 (b): Human Resource Status by Facility Level in Private Health Facilities
Facility Level Number of Facilities
Health Professionals Shortage (%)
Required 2006 Available 2006
Shortage 2006
Hospitals 132 26,004 3,251 22,753 87.5Health Centres 150 5,400 758 4,642 86.0Dispensaries 1,641 11,487 1,842 9,645 84.0Training 85.9Institutions
36 756 288 468 61.9
Total 1,959 43,647 6,139 37,508 85.9Source: Ministry of health and social welfare
4.5.2 INVOLVEMENT OF HEALTH SECTOR IN INTERNATIONAL TRADE Although the government is trying to ensure that there are enough health professionals in the country to match with demand, gaps remain in almost all cadre. The health training institutions output has been increasing over time. For example, in 2000, there were 30 Medical Officers, 4 Dentists, 14 Pharmacists and 486 Clinic Officers compared to 122 Medical Officers, 13 Dentists, 49 Pharmacists and 635 Clinic Officers in 2006 respectively. (See Annex 3 on Health Training Institutions Outputs per Cadre) It is thought that the gaps in health professionals are due partly to movement of professionals outside the country to seek greener pastures. The supply of professional health services is done through many routes, a GATS one being mode 4, which involves presence of natural persons. In the health sector, this involves nurses, doctors, dentists and other health professionals. Some of the reasons given for this movement are;
• Expanding health facilities to meet the demand from the growing population unmatched with increments in enrolment meaning those available are over loaded,
• The low salary and benefits package that makes other destinations attractive.
Officials from the Ministry of Health and Welfare noted the difficulty in reporting the outflow of health professionals because there are no formal records. In Tanzania, existing health policy and law prohibits the movement of health professionals, with reasons that they are highly needed to curb the existing gaps. However, following the current globalisation concept, it becomes difficult to restrict movement unless the problem is jointly addressed by all countries. 4.5.3 HEALTH SERVICES IN THE WTO Owing to sensitivities inherent in trading in health services, the health sector is one of those that have drawn the least commitments, particularly when compared to the total number of countries that have made commitments in other sectors of the GATS such as tourism. As at 2005, only 52 out of 137 WTO Members at that time, (counting EC 12 as one) had undertaken commitments on hospital services. Many large developed countries like Canada, Switzerland, Norway,
48
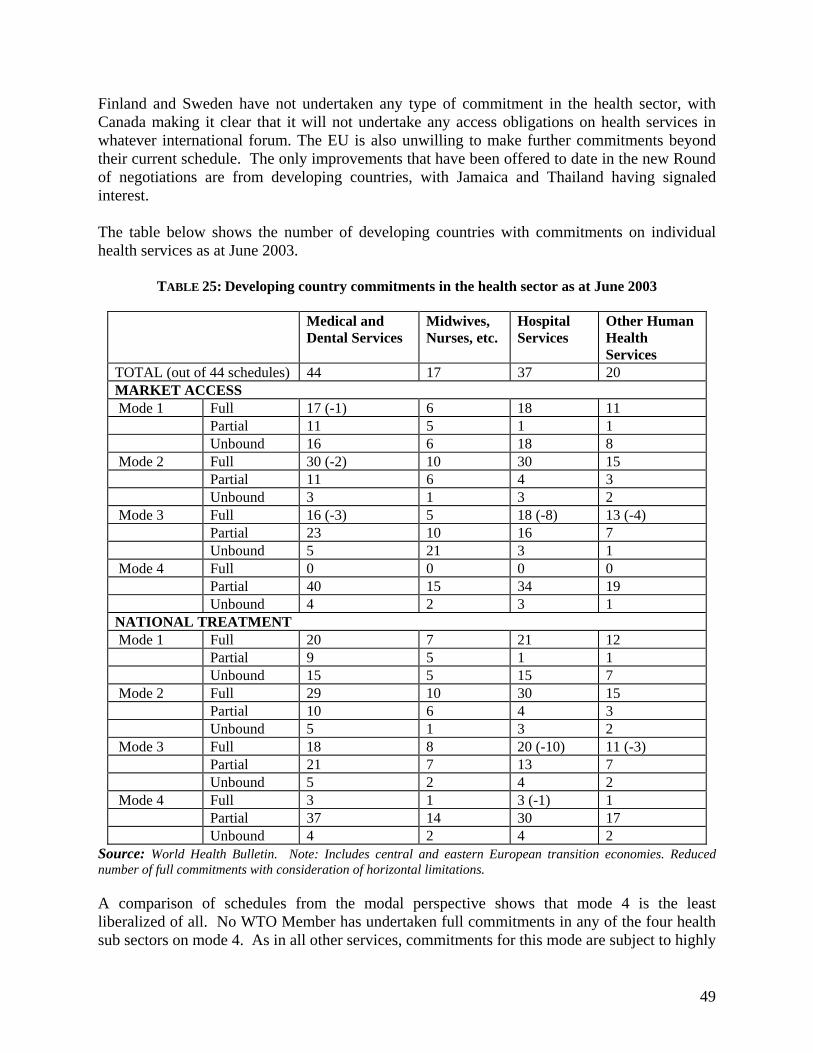
Finland and Sweden have not undertaken any type of commitment in the health sector, with Canada making it clear that it will not undertake any access obligations on health services in whatever international forum. The EU is also unwilling to make further commitments beyond their current schedule. The only improvements that have been offered to date in the new Round of negotiations are from developing countries, with Jamaica and Thailand having signaled interest.
The table below shows the number of developing countries with commitments on individual health services as at June 2003.
TABLE 25: Developing country commitments in the health sector as at June 2003
Medical and Dental Services
Midwives, Nurses, etc.
Hospital Services
Other Human Health Services
TOTAL (out of 44 schedules) 44 17 37 20 MARKET ACCESS Mode 1 Full 17 (-1) 6 18 11 Partial 11 5 1 1 Unbound 16 6 18 8 Mode 2 Full 30 (-2) 10 30 15 Partial 11 6 4 3 Unbound 3 1 3 2 Mode 3 Full 16 (-3) 5 18 (-8) 13 (-4) Partial 23 10 16 7 Unbound 5 21 3 1 Mode 4 Full 0 0 0 0 Partial 40 15 34 19 Unbound 4 2 3 1 NATIONAL TREATMENT Mode 1 Full 20 7 21 12 Partial 9 5 1 1 Unbound 15 5 15 7 Mode 2 Full 29 10 30 15 Partial 10 6 4 3 Unbound 5 1 3 2 Mode 3 Full 18 8 20 (-10) 11 (-3) Partial 21 7 13 7 Unbound 5 2 4 2 Mode 4 Full 3 1 3 (-1) 1 Partial 37 14 30 17 Unbound 4 2 4 2
Source: World Health Bulletin. Note: Includes central and eastern European transition economies. Reduced number of full commitments with consideration of horizontal limitations.
A comparison of schedules from the modal perspective shows that mode 4 is the least liberalized of all. No WTO Member has undertaken full commitments in any of the four health sub sectors on mode 4. As in all other services, commitments for this mode are subject to highly
49
restrictive limitations. Many WTO Members have limited their mode 4 commitments to very highly skilled suppliers possessing knowledge that is hardly available in the domestic context such as contractual service suppliers-linked to commercial presence-with very high minimum qualifications. In contrast, mode 2 in health services is quite liberalized, possibly because the service is consumed outside a country. Most developed countries have no limitations particularly on market access in this mode. In such a case, such countries commit themselves not to deter their residents from traveling abroad to consume health services. Mode 1 registers high non-bindings, limiting scope for new developments such as in telemedicine.
In spite of the limited mode 4 commitments, health professionals still find their way across borders probably working in government referral hospitals and other public outfits. 4.5.4 POLICY OPTIONS TO BALANCE MODE 4 WITH OBLIGATIONS TO PROVIDE UNIVERSAL
ACCESS TO BASIC HEALTH SERVICES. As Tanzania struggles with the loss of this valuable human resource, there is need to consider the following options:
• Country-wide enhancement of health care facilities through various government progrmmes/projects,
• Country wide enhancement of health care professionals through increased recruitment of doctors and use of auxiliaries such as nursing assistants, hospital attendants and people who can demonstrate that, after their training, they will remain in their district,
• Increased budgetary allocations for the health sector, • Heightened political commitment to providing universal access, • Enhanced private sector participation with support form government, • Enhanced government involvement in structuring movement (through getting
involved in bilateral and other cooperation agreements which tie in temporariness and return to sending countries-coupled with flanking policies such as training more professionals, making it attractive to young students to read the science subjects involved, cooperation with the International Organization for Migration (IOM) for returning professionals,
Where governments choose to introduce foreign presence into the health sector, GATS flexibilities should be used to condition access to universal service obligations. Tanzania can also condition establishment of commercial presence (mode 3), in accordance with the flexibilities in Article XIX: 2 of the GATS, to the following regulatory options.
a) minimum amounts of capital that such foreign investment must have, preferably
insisting on fairly large establishments (read amounts) that can afford the extra burden of implementing universal service obligations,
b) limitations on the numbers (minimum or maximum, depending on what the country seeks to achieve: filling domestic gaps, or creating jobs for locals respectively) of foreign health professionals that can be admitted to practice in these establishments,
c) minimum numbers of locals that must be employed in these establishments, d) provisions that such private health facilities will not benefit from government
50
subsidies, e) inclusion of obligations that all health service suppliers at a certain level, e.g
doctors, working in foreign owned private facilities have to devote a minimum number of hours a week to work in public hospitals and clinics,
f) conditions as to having a minimum number of beds for free treatment for the needy in all foreign owned hospital facilities,
g) Requirements to offer free consultation and medicines to patients for communicable and infectious diseases,
h) obligations to offer some basic medical services in remote rural areas, (this could also be done through strategic consideration as to location in the grant of licenses to foreign owned applications; outside urban areas),
i) mandatory requirements for the training of local health professionals with a view to contributing to career development, or,
j) Setting price ceilings and monitoring the strict observance of affordability in health care.
Tanzania can also condition the coming into force (i.e become legally binding and
enforceable under the WTO’ dispute settlement mechanism) at a future date, when a certain level of adequacy in regulatory capacity to ensure the operation of the above policy options, vis a vis beneficiaries of the commitment, is achieved.
Government would need to, in tandem, set up domestic policies that contribute to ensuring return of health service suppliers such as social and regulatory incentives as in Argentina’s case, where the National Commission for the Return of Argentineans Living Abroad was created in 1994, providing incentives such as payment of moving and establishment costs, and family travel costs.
There is also the Return and Reintegration of Qualified African Nationals (RQAN) program, which ‘aims to develop a country’s economy by seeking persons who are highly trained and qualified either to return or find positions in each country that will benefit from that persons’ training. Tanzania can seek the services of this program under IOM.
Policies that create obligation on health service suppliers who have benefited from government subsidies in the course of their training to provide health services in the public sector for a certain number of years, before branching off into private practice, or taking on contracts abroad are also worth considering.
In country specialty training is also important to provide skills that were previously only available abroad.
Other incentives such as provision of low interest loans to nationals for setting up health facilities in rural areas, financial incentives such as competitive salaries for health workers, bonuses, pension, medical insurance, allowances, fellowships, loans and scholarships, strengthening work autonomy, encouraging career development, providing opportunities for training abroad, upgrading facilities with practical tools and implements to carry out day to day work, including such basic things as gloves, cotton wool, surgical tools, adapting working time and shift work (for nurses), reducing violence in the workplace, and open leadership,
51
The ministry of health would have to be further supported in having regulatory oversight over these policies.
Key Option
Mainstream policies that can enhance supply of professionals domestically make domestic situation attractive to limit movement, structure temporariness into the movement through bilateral cooperation agreements and create flanking policies that condition movement on certain obligations. If commitments are to be made in the WTO, they should be conditioned on fulfilling certain universal access/service obligations.
4.6 EDUCATIONAL SECTOR Educational service is a key socio-economic service. Human mental and physical capabilities are the pre-requisite for the development of any national economy. Some of the problems the society is facing today, like poverty is a result of ignorance, which imply the lack of appropriate knowledge and skills for proper reasoning and decision making processes.
The provision of educational services in Tanzania is operated under the Ministry of Education and Vocational Training and the Ministry of Science, Technology and Higher Education, which currently changed its name to include Communications matters. Other sectors which are fully involved in the management and supervision of educational services in Tanzania are the Prime Minister’s Office, Regional Administration and Local Government, Communities, Non-governmental organizations (NGO’s) and individuals under the coordination of central government. The Education Sector is governed by a number of policies and legislations:
i). Educational Policies.
• National Higher Education Policy, 1999; • Technical Education Policy; • Science and Technology Policy
ii). Legislations
• Education Act of 1969 and of 1978; • National Examinations Council Act of 1973; • Universal Primary Education Act of 1974; and • The Institute of Adult Education Act of 1973.
Tanzania’s education and training system comprises of a dual structure and sequence of education and training levels; formal and non-formal. There are three channels constituting the
52

education and training system. These are Professional, Vocational and the Non-formal. 4.6.1 FORMAL EDUCATION AND TRAINING SYSTEM The formal education system is the main channel that provides academic education services ranging from kindergarten school to university level. Considering that early years of life are critical for the development of a child’s mental and other potentials, Tanzania decided to implement the 2-7-4-2-3+ structure. The first 2 years are for pre-primary school, which is for the 5-6 year old children (kindergarten), 7 years are for primary school, 4 years for the ordinary secondary level (ordinary level), 2 years are for advanced secondary school level (Advanced level) and the last 3 years and above are for universities and colleges. a) Vocational Education and Training This channel provides skills and knowledge for wage employment, self-employment and further vocational and professional advancement. It covers the commercial and technical work-study and training programmes undertaken by Ministries, NGO’s and Private organizations. The sector is operating under the Vocational Education Training Authority (VETA). The role of VETA is coordination and harmonization of Vocational, Technical Education and training in the country. b) Non-formal education system. The non-formal education is provided through two main channels namely; informal and adult education systems. Informal system is the one through which an individual learns by interaction with his/her environment. Adult education covers enabling an individual to learn how to read, write and count. It provides skills that enable individuals to master their environment, and hence create a sense of independence. c) Educational Development Programmes/Plans In order to improve the performance of the education sector through implementation of sector policies, several initiatives/programmes and plans were designed particularly the Educational Sector Development Programme (ESDP) of 1997, Primary Educational Development programme/plan - MMEM (2002 -2006), and Secondary Education Development programme/plan - MMES (2004 - 2009). 4.6.2 OBJECTIVES AND SUCCESSES OF EDUCATIONAL DEVELOPMENT PROGRAMMES The objectives of all these programmes are to ensure enough educational facilities throughout the country to support the expanding educational needs. The expansion of these facilities should also go hand-in-hand with training of enough educational professionals to man the facilities. a) Primary Educational Development Programme (MMEM). From the inception of the MMEM in 2002 to 2005, 45,000 classes and 8,527 teachers’ houses
53
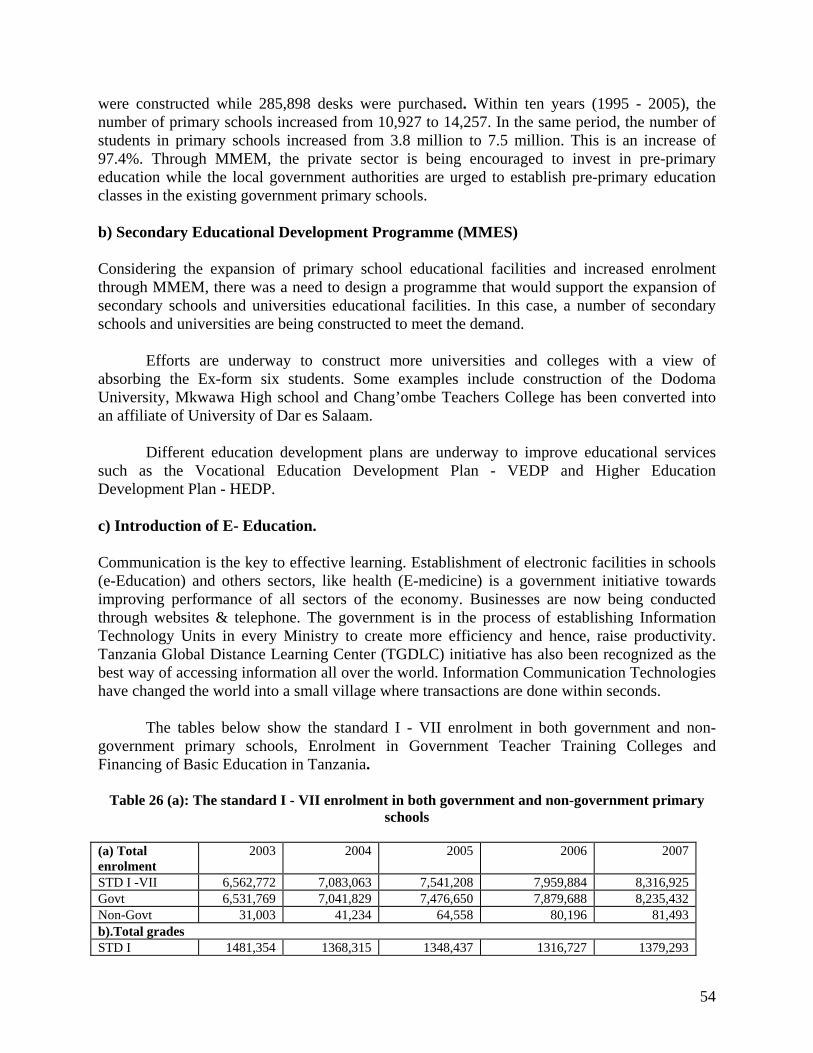
were constructed while 285,898 desks were purchased. Within ten years (1995 - 2005), the number of primary schools increased from 10,927 to 14,257. In the same period, the number of students in primary schools increased from 3.8 million to 7.5 million. This is an increase of 97.4%. Through MMEM, the private sector is being encouraged to invest in pre-primary education while the local government authorities are urged to establish pre-primary education classes in the existing government primary schools. b) Secondary Educational Development Programme (MMES) Considering the expansion of primary school educational facilities and increased enrolment through MMEM, there was a need to design a programme that would support the expansion of secondary schools and universities educational facilities. In this case, a number of secondary schools and universities are being constructed to meet the demand.
Efforts are underway to construct more universities and colleges with a view of absorbing the Ex-form six students. Some examples include construction of the Dodoma University, Mkwawa High school and Chang’ombe Teachers College has been converted into an affiliate of University of Dar es Salaam.
Different education development plans are underway to improve educational services such as the Vocational Education Development Plan - VEDP and Higher Education Development Plan - HEDP. c) Introduction of E- Education. Communication is the key to effective learning. Establishment of electronic facilities in schools (e-Education) and others sectors, like health (E-medicine) is a government initiative towards improving performance of all sectors of the economy. Businesses are now being conducted through websites & telephone. The government is in the process of establishing Information Technology Units in every Ministry to create more efficiency and hence, raise productivity. Tanzania Global Distance Learning Center (TGDLC) initiative has also been recognized as the best way of accessing information all over the world. Information Communication Technologies have changed the world into a small village where transactions are done within seconds.
The tables below show the standard I - VII enrolment in both government and non-government primary schools, Enrolment in Government Teacher Training Colleges and Financing of Basic Education in Tanzania.
Table 26 (a): The standard I - VII enrolment in both government and non-government primary
schools
(a) Total enrolment
2003 2004 2005 2006 2007
STD I -VII 6,562,772 7,083,063 7,541,208 7,959,884 8,316,925 Govt 6,531,769 7,041,829 7,476,650 7,879,688 8,235,432 Non-Govt 31,003 41,234 64,558 80,196 81,493 b).Total grades STD I 1481,354 1368,315 1348,437 1316,727 1379,293
54
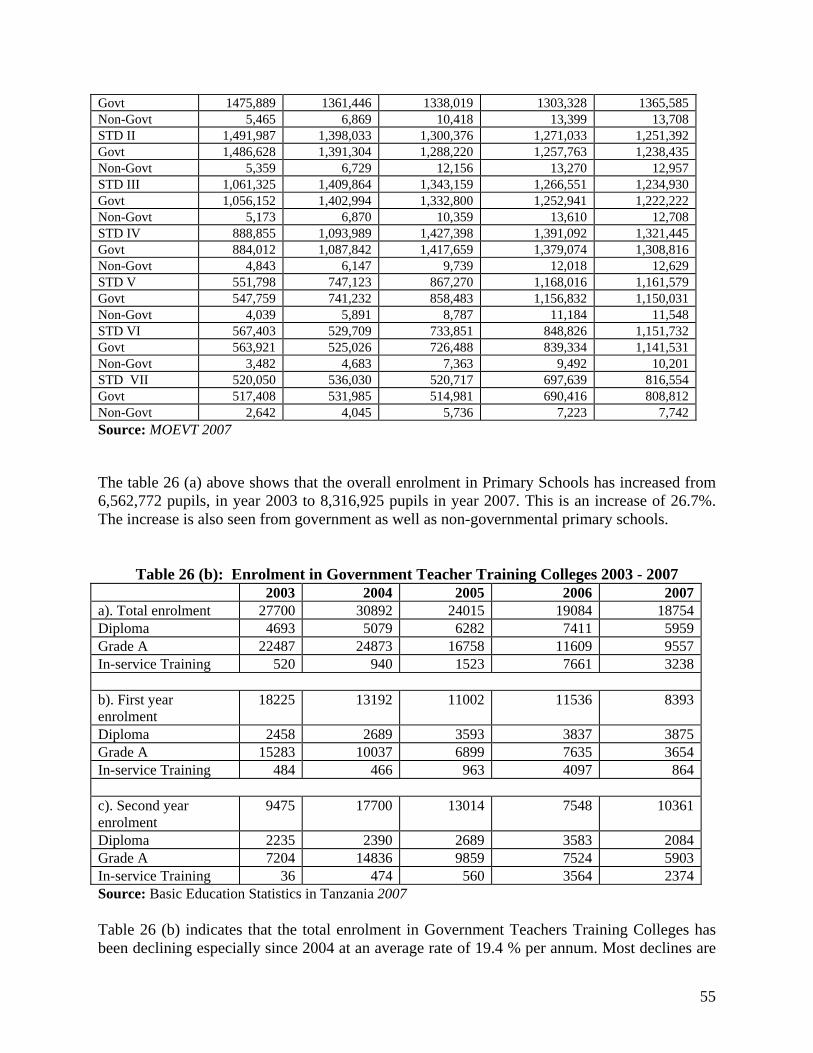
Govt 1475,889 1361,446 1338,019 1303,328 1365,585 Non-Govt 5,465 6,869 10,418 13,399 13,708 STD II 1,491,987 1,398,033 1,300,376 1,271,033 1,251,392 Govt 1,486,628 1,391,304 1,288,220 1,257,763 1,238,435 Non-Govt 5,359 6,729 12,156 13,270 12,957 STD III 1,061,325 1,409,864 1,343,159 1,266,551 1,234,930 Govt 1,056,152 1,402,994 1,332,800 1,252,941 1,222,222 Non-Govt 5,173 6,870 10,359 13,610 12,708 STD IV 888,855 1,093,989 1,427,398 1,391,092 1,321,445 Govt 884,012 1,087,842 1,417,659 1,379,074 1,308,816 Non-Govt 4,843 6,147 9,739 12,018 12,629 STD V 551,798 747,123 867,270 1,168,016 1,161,579 Govt 547,759 741,232 858,483 1,156,832 1,150,031 Non-Govt 4,039 5,891 8,787 11,184 11,548 STD VI 567,403 529,709 733,851 848,826 1,151,732 Govt 563,921 525,026 726,488 839,334 1,141,531 Non-Govt 3,482 4,683 7,363 9,492 10,201 STD VII 520,050 536,030 520,717 697,639 816,554 Govt 517,408 531,985 514,981 690,416 808,812 Non-Govt 2,642 4,045 5,736 7,223 7,742 Source: MOEVT 2007 The table 26 (a) above shows that the overall enrolment in Primary Schools has increased from 6,562,772 pupils, in year 2003 to 8,316,925 pupils in year 2007. This is an increase of 26.7%. The increase is also seen from government as well as non-governmental primary schools.
Table 26 (b): Enrolment in Government Teacher Training Colleges 2003 - 2007 2003 2004 2005 2006 2007a). Total enrolment 27700 30892 24015 19084 18754Diploma 4693 5079 6282 7411 5959Grade A 22487 24873 16758 11609 9557In-service Training 520 940 1523 7661 3238
b). First year enrolment
18225 13192 11002 11536 8393
Diploma 2458 2689 3593 3837 3875Grade A 15283 10037 6899 7635 3654In-service Training 484 466 963 4097 864
c). Second year enrolment
9475 17700 13014 7548 10361
Diploma 2235 2390 2689 3583 2084Grade A 7204 14836 9859 7524 5903In-service Training 36 474 560 3564 2374Source: Basic Education Statistics in Tanzania 2007 Table 26 (b) indicates that the total enrolment in Government Teachers Training Colleges has been declining especially since 2004 at an average rate of 19.4 % per annum. Most declines are
55

seen in the Diploma undergraduates especially in 2007.
d) Financing of Basic Education in Tanzania.
The amount of money set aside for financing basic education has been increasing, albeit narrowly in the total government budget. The table 26 (c) below shows the trends of financing of education services over the past ten (10) years.
Table 26 (c): Financing of Basic Education in Tanzania
YEAR TOTAL GOVERNMENT
BUDGET MOEVT BUDGET %OF TOTAL BUDGET
1996/97 730,878 17,204.16 2.41997/98 975,639 21,961.53 2.31998/99 927,732 26,794.34 2.91999/00 1,168,778 35,109.40 3.02000/01 1,307,214 51.382.70 3.92001/02 1,462,767 65,863.60 4.52002/03 2,106,291 123,556.70 5.92003/04 2,607,205 106,719.70 4.12004/05 3,347,538 160,344.21 4.82005/06 4,176,050 175,434.51 4.22006/07 4,850,588 239,650.70 4.9Source: Basic Education Statistics in Tanzania 2007
56
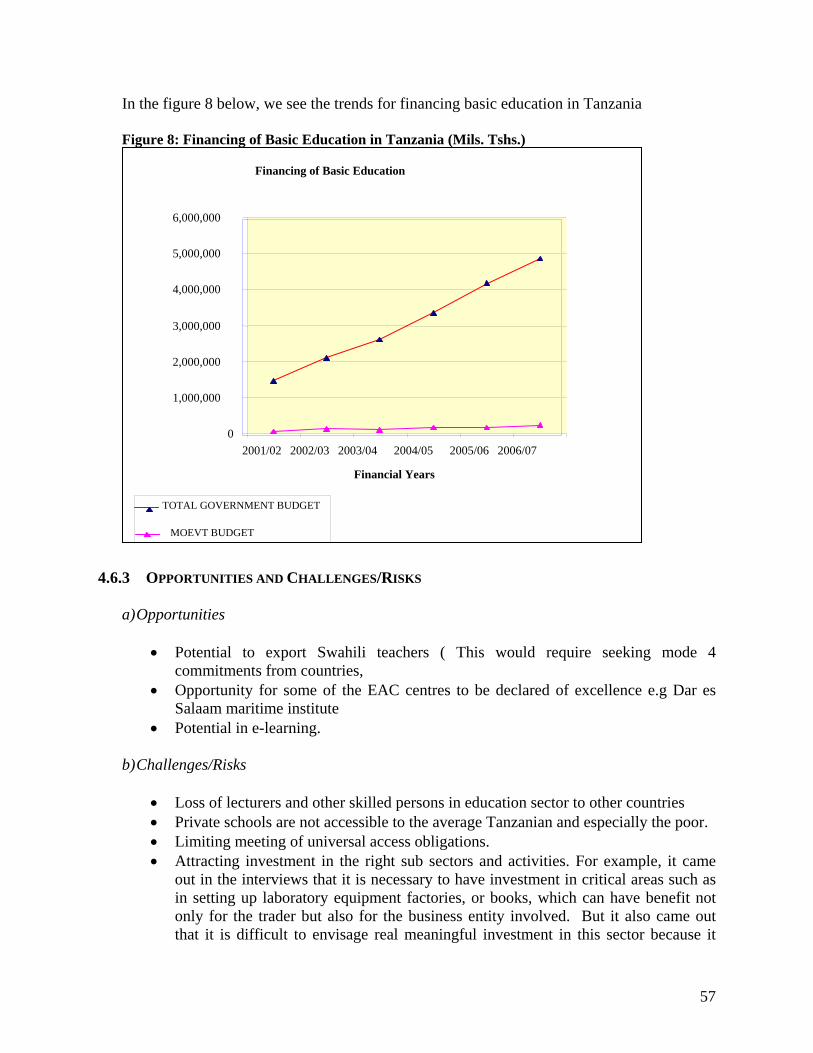
In the figure 8 below, we see the trends for financing basic education in Tanzania Figure 8: Financing of Basic Education in Tanzania (Mils. Tshs.)
Financing of Basic Education
0
1,000,000
2,000,000
3,000,000
4,000,000
5,000,000
6,000,000
2001/02 2002/03 2003/04 2004/05 2005/06 2006/07
Financial Years
TOTAL GOVERNMENT BUDGET
MOEVT BUDGET
4.6.3 OPPORTUNITIES AND CHALLENGES/RISKS
a) Opportunities
• Potential to export Swahili teachers ( This would require seeking mode 4
commitments from countries, • Opportunity for some of the EAC centres to be declared of excellence e.g Dar es
Salaam maritime institute • Potential in e-learning.
b) Challenges/Risks
• Loss of lecturers and other skilled persons in education sector to other countries • Private schools are not accessible to the average Tanzanian and especially the poor. • Limiting meeting of universal access obligations. • Attracting investment in the right sub sectors and activities. For example, it came
out in the interviews that it is necessary to have investment in critical areas such as in setting up laboratory equipment factories, or books, which can have benefit not only for the trader but also for the business entity involved. But it also came out that it is difficult to envisage real meaningful investment in this sector because it
57
requires large subsidization for quality.
c) Proposed options government decisions
• Need to have a specific sectoral strategy on export in education services as is the case e.g. in Uganda, Rwanda, identifying niche levels and means to get these markets.
• If a GATS or other commitment is to be made, it should be in modes where Tanzania can benefit such as mode 3 but regulation would have to deal with universal service obligations etc
• Develop requests for mode 4 to other countries for Swahili teachers • Seek mode 2 commitments for others to come and consume Tanzania education services
especially at higher levels.
d) Key Option
Sector specific further analysis of strengths of each level vs. obligations to assess where the country has a niche. Seek Mode 4 and 2 commitments in negotiations. Consider mode 3 commitments, but with more detailed discussion with ministry and regulators on appropriateness and level. Foreign presence should only be with conditions as to provision of universal access to education services-the details of which would have to be designed by law or regulation.
58
4.7 FINANCIAL SECTOR A financial services sector comprises of products such as banking and insurance. It covers suppliers of financial services like credit institutions, investment bank and different funds (pension, hedge & mutual), insurance companies, the Central bank and other international financial institutions like World Bank and International Monetary Fund (IMF). The sector is governed by monetary & competition policies and several legislations as highlighted in the next paragraphs.
A well-functioning financial services sector enhances economic development by improving productivity, facilitating domestic and international transactions, broadening availability of credit for small and medium size enterprises and households, especially from the LDCs, mobilizing and channeling domestic savings, attracting foreign direct investments (FDI) and efficiency. For the financial services reforms and liberalization to generate pro-development outcomes, they should be supported by appropriate macroeconomic, regulatory and supervisory policies. For Tanzania, this remains a challenge. The challenges associated by weak regulations and institutional management, limited skills and difficulties in properly managing capital-account liberalization. African financial services are generally weak. According to UNCTAD (2007), only 6 percent of Tanzania population has access to banking, but some of the privatization programmes undertaken in 1980s/1990s improved the situation.
Tanzania has been implementing a number of policy measures to create a stable liberalized external sector. From mid 1980s, there has been gradual liberalization of the external sector by reducing the foreign exchange controls, which resulted into the replacement of the Exchange Control Ordinance (cap. 274) by the Foreign Exchange Act of 1992. These reforms went hand in hand with liberalization of foreign exchange system shifting from fixed exchange rate system to a market- oriented exchange rate in 1993. In 1996, Tanzania went further with liberalization measures by adopting Article VIII of the International Monetary Fund (IMF) that requires liberalization of all current account transactions. This was followed by partial liberalization of the capital/financial account that allowed foreigners to participate in direct investment activities in the country.
There are various laws and regulations governing the sector. These extend to supervisory roles, banking and financial institutions as well as foreign exchange regulations and other domestic regulations or prudential measures including circulars elaborate the role of services supplies as a matter of transparency. The reforms in terms of laws and regulations in the financial services sector with their objectives are summarized as follows. The Laws include the following;
1 Bank of Tanzania Act, 1965 as amended in 1978. The Act was repealed and replaced by the Bank on Tanzania Act, 1995, which expressly specifies functions and objectives among others as regulation and supervision of banks and financial institutions in Tanzania.
2 The Banking and financial Institutions Act, 1991 (BFIA, 1991). It consolidated the
59
law related to business of banking, to harmonize the operations of all financial institutions in Tanzania, to foster sound banking activities, to regulate credit operations and other banking related activities.
3 The Foreign Exchange Act, 1992 was passed by the Parliament for making better
provisions for the more efficient management and administration of dealings and other acts in relation to gold, foreign currency, securities, payments, debts, import, export, among others,
Regulations include the following:
1. The Management of Risk Assets Regulations, 2001. These regulations came into being on 1st May 2001 and repealed the Guidelines on Management of Risk Assets, Classification of Loans and other Risk assets, provisioning for Losses and Accrual of interest issued on 18th October 1991. The objectives of these regulations are to provide prudential guidance on management of risk assets and bases for providing for losses on loans and other risk assets.
2. The Capital Adequacy Regulations, 2001. These regulations came into effect on 1st
May 2001 and repealed Guidelines for Measuring Capital Adequacy issued on 1st October 1993 and the Addendum to Circular No. 3 on capital adequacy issued on 27th March 1996. The principal objective of these regulations is to provide the depositing public with reasonable protection by enhancing the capability of banks and financial institutions to absorb unexpected losses and thus minimize the incidence of bank failure.
3. The Credit Concentration and other Exposure Limits Regulations, 2001. These
regulations came into effect on 1st May 2001 and repealed the Guidelines on Concentration of Credit and other Exposure Limits, issued on 22nd December 1992.
4. The Liquid Asset Ratio Regulations, 2000. These regulations came into effect on 1st
September 2000. The main objective of the regulations is to provide guidance on measuring and monitoring liquidity of banks and financial institutions and the maximum ratio of losses to deposits.
5. The Publication of Financial Statements Regulations, 2000. These regulations came
into effect on 1st September 2000. The main objective of the regulations is to keep the general public informed on the conditions and performance of banks and financial institutions. Quarterly publications are required for un-audited balance sheet, income statement and cash flow statement, while audited financial statements are to be published annually.
6 The Independent Auditors Regulations, 2000. These regulations came into effect on
1st September 2000. The main objective of these regulations is to guide banks and financial institutions to appoint independent auditors that are professional recognized and registered by the national Board of Accountants and Auditors and also by the Bank of Tanzania. Bank auditing requires more than commercial enterprise auditing and as such only audit firms that meet registration requirements by the Bank of Tanzania may
60

be appointed to audit banks and financial institutions. 7. Banking and Financial Institutions Regulations, 1997. It sets conditions of entry or
exit into banking industry in Tanzania. Generally, it deals with all matters relating to licensing of new entrants in the banking system and conditions necessary for fare competition and sound operations.
The main objectives of these regulations include; encourage risk diversification and curtail
excessive concentration of risk exposure of any bank or financial institution to one customer or group of customers regulations thereby stability of the financial system, make credit available to a broader group or borrowers, regulate equity investments of banks and financial institutions and to avoid undue concentration of economic power, and regulate the amount of investments in fixed assets and prevent the use of depositors’ money in acquiring such assets.
The government revised all these laws and regulations so as to allowing financial institutions to operate on a commercial basis, making business and management decisions free from outside intervention within the norms of prudential supervision. 4.7.1 FINANCIAL SECTOR PERFORMANCE The government initiated financial reforms in 1991 with a view to creating an effective and efficient financial system in the country. The reforms in the financial sector resulted into Macroeconomic and currency stability. There has been an increase in investment in the sector due to favorable macroeconomic policies. Banking services have been expanded as witnessed by the establishment of about thirty three private local and foreign commercial banks in the country that guarantees competition.
Reforms also resulted in the establishment of Dar es Salaam Stock Exchange (DSE). It was incorporated in1996 as a private company limited by guarantee and not having a share capital under the Companies Ordinance (Cap 212). DSE is non-profit making body created to facilitate the government implementation of the economic reforms and in future to encourage the wider share ownership of privatized and all the companies in Tanzania and facilitate rising of medium and long-term capital. The formation of DSE followed the enactment of the Capital Markets and Securities Act. 1994 and establishment of the Capital Market and Securities Authority (CMSA), the industry regulatory body charged with promoting conditions for the development of capital markets in Tanzania and regulating the industry.
As a strategy toward supporting the growing demand for capital, the government of Tanzania has already appointed four banks with a guarantee to lend micro-credits. These banks include; Tanzania Postal Bank (TPB), Cooperative Rural Development Bank (CRDB) which has been privatized with a name of CRDB Bank Limited following the liberalization of banking services, National Micro-Finance Bank (NMB) and National Bank of Commerce (NBC). To increase the access to credit, the government has encouraged people to open up savings and credit cooperative societies {SACCOS}.The decision by his excellence, President Jakaya Kikwete of setting aside special funds to support the entrepreneurs all over the country is an additional effort towards supporting the needy. The table below shows the performance of the financial sector in Tanzania.
61
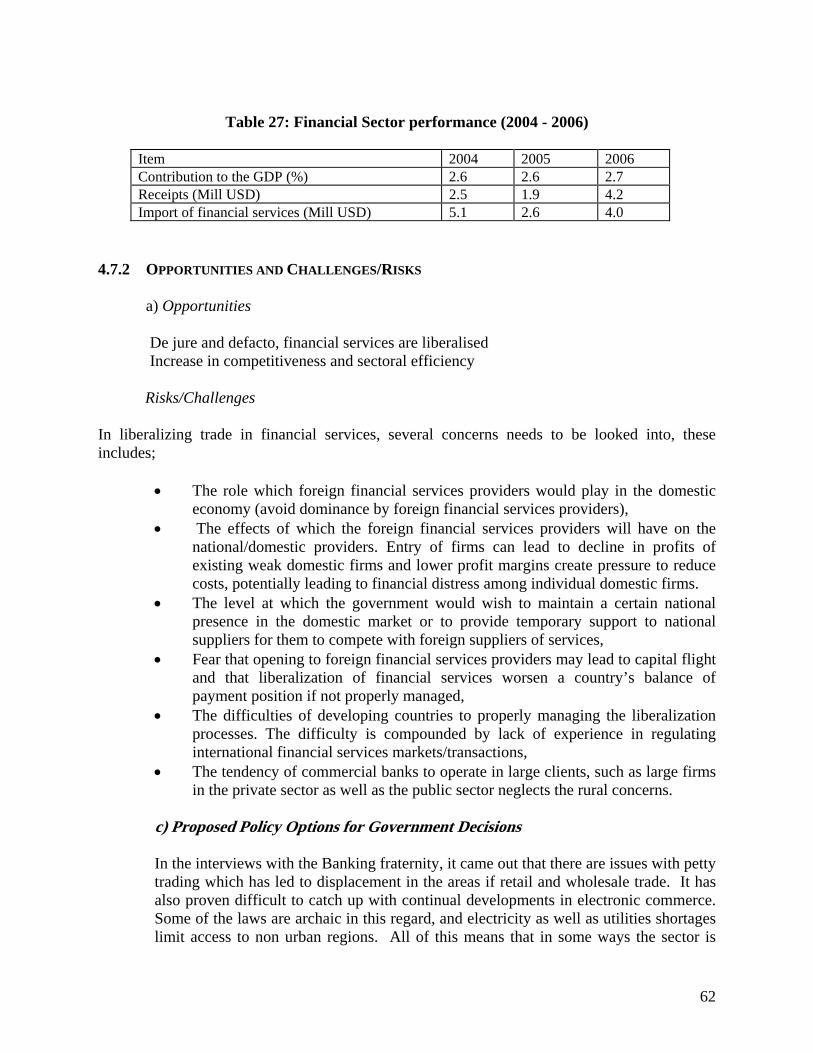
Table 27: Financial Sector performance (2004 - 2006)
Item 2004 2005 2006 Contribution to the GDP (%) 2.6 2.6 2.7 Receipts (Mill USD) 2.5 1.9 4.2 Import of financial services (Mill USD) 5.1 2.6 4.0
4.7.2 OPPORTUNITIES AND CHALLENGES/RISKS
a) Opportunities De jure and defacto, financial services are liberalised Increase in competitiveness and sectoral efficiency
Risks/Challenges
In liberalizing trade in financial services, several concerns needs to be looked into, these includes;
• The role which foreign financial services providers would play in the domestic
economy (avoid dominance by foreign financial services providers), • The effects of which the foreign financial services providers will have on the
national/domestic providers. Entry of firms can lead to decline in profits of existing weak domestic firms and lower profit margins create pressure to reduce costs, potentially leading to financial distress among individual domestic firms.
• The level at which the government would wish to maintain a certain national presence in the domestic market or to provide temporary support to national suppliers for them to compete with foreign suppliers of services,
• Fear that opening to foreign financial services providers may lead to capital flight and that liberalization of financial services worsen a country’s balance of payment position if not properly managed,
• The difficulties of developing countries to properly managing the liberalization processes. The difficulty is compounded by lack of experience in regulating international financial services markets/transactions,
• The tendency of commercial banks to operate in large clients, such as large firms in the private sector as well as the public sector neglects the rural concerns.
c) Proposed Policy Options for Government Decisions In the interviews with the Banking fraternity, it came out that there are issues with petty trading which has led to displacement in the areas if retail and wholesale trade. It has also proven difficult to catch up with continual developments in electronic commerce. Some of the laws are archaic in this regard, and electricity as well as utilities shortages limit access to non urban regions. All of this means that in some ways the sector is
62
moving faster than the regulators. It has proven difficult to condition investors to location in local and rural areas. The regulators were very cautious of proposing GATS commitments noting that this is not the sort of decision that can be done though a short study. They indicated that there is need for an ongoing process of training and capacity building that can deal with the multilateral implications of GATS commitments so as to make well informed decisions. d) Key Option Regulators do not feel it is the time to make a GATS commitment. Need to engage the stakeholders more specifically on the details and implications of making commitments in the banking sector, including explanation of benefits if any, so as to make a decision. This has to precede a decision to or not to make commitments in the GATS or any other fora.
63

5. CONCLUSIONS AND RECOMMENDATIONS In sum, we have looked at the services sector in Tanzania both factually and analytically. An overarching finding is that most if not all the sectors are already liberalised in law or by fact. The issue is whether this liberalization should be taken to the next level, i.e. bound at the WTO. We have seen the implications of binding market access and national treatment at the WTO, and the process of withdrawal or modification of concessions. We have also seen that the GATS has an inbuilt process that allows members to attach conditions, particularly developing countries, to the commitments they make in the pursuit of national development objectives and priorities. We have seen however that these conditions have to be clear and unequivocal, and once scheduled, are very difficult to go back on. An issue that came out of almost all stakeholders was the question of benefits of GATS liberalisation. It can be said with fairly strong accuracy that the GATS as a legal instrument is not one that is known in most sectors. Even the sector in which Tanzania has made commitments, it is clear that the GATS is not necessarily a reference point in promoting tourism activities, and more importantly that there is no information as to the causal link that making this GATS commitment has had for attraction of investment in four star hotels. In literary discourse, the link between GATS commitments and FDI attraction has not been made yet. As such, it is important that Tanzania’s intentions of binding some of the sectors in the multilateral context be well informed by the implications. An argument that has been made on the importance of binding commitments in the GATS is that it helps the country to lock in its reforms so that it can create certainty and predictability in the market. This is true and is probably a more sound justification than the attempt to create links with flows of foreign direct investment. Some of the sectors such as tourism possibly have much less risk in liberalisation compared to essential services such as health and education. Others are flawed with legal difficulties that would make a commitment currently create potential exposure to dispute settlement processes. Other sectors are very technical and the stakeholders need to be fully sensitised on the GATS type of liberalisation, benefits and implications thereof. Some modes are also less risky than others even from a regulatory perspective such as mode 2 where the consumer enters into the territory of Tanzania to consume a service and as such are easier contributions to make. All issues raised at the GATS level, particularly challenges and options for government decisions apply to regional integration processes as well, including the EPAs.
64
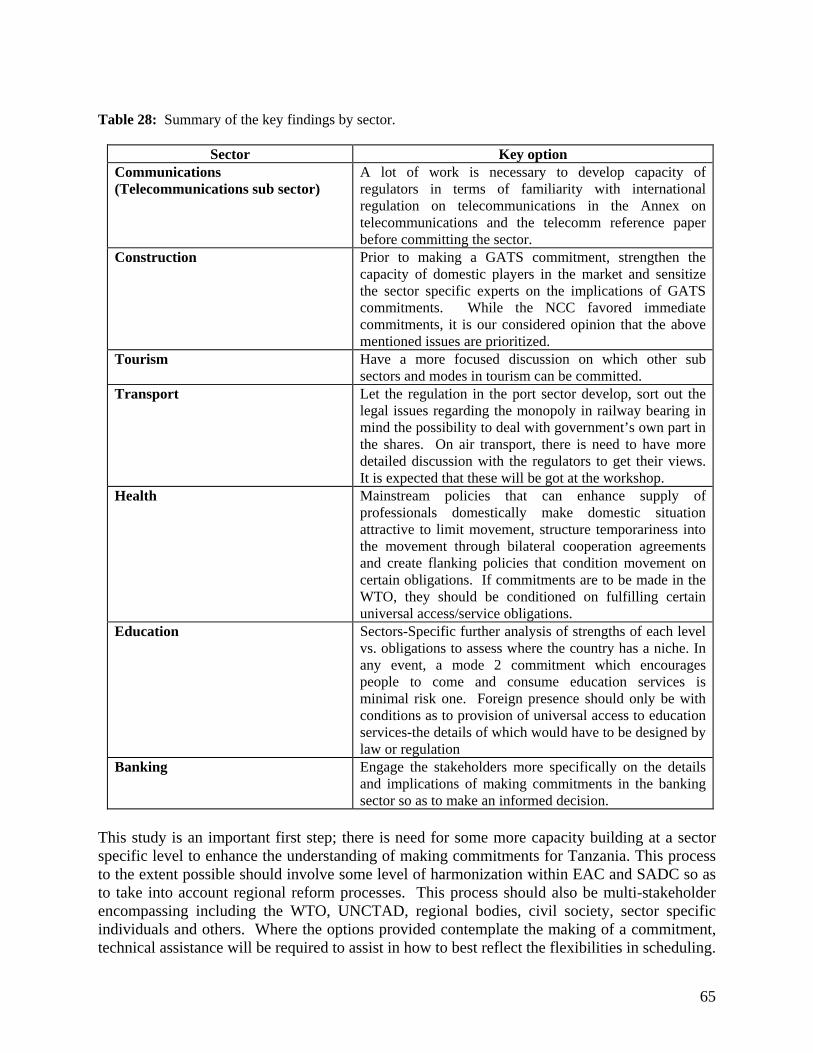
Table 28: Summary of the key findings by sector.
Sector Key option Communications (Telecommunications sub sector)
A lot of work is necessary to develop capacity of regulators in terms of familiarity with international regulation on telecommunications in the Annex on telecommunications and the telecomm reference paper before committing the sector.
Construction Prior to making a GATS commitment, strengthen the capacity of domestic players in the market and sensitize the sector specific experts on the implications of GATS commitments. While the NCC favored immediate commitments, it is our considered opinion that the above mentioned issues are prioritized.
Tourism Have a more focused discussion on which other sub sectors and modes in tourism can be committed.
Transport Let the regulation in the port sector develop, sort out the legal issues regarding the monopoly in railway bearing in mind the possibility to deal with government’s own part in the shares. On air transport, there is need to have more detailed discussion with the regulators to get their views. It is expected that these will be got at the workshop.
Health Mainstream policies that can enhance supply of professionals domestically make domestic situation attractive to limit movement, structure temporariness into the movement through bilateral cooperation agreements and create flanking policies that condition movement on certain obligations. If commitments are to be made in the WTO, they should be conditioned on fulfilling certain universal access/service obligations.
Education Sectors-Specific further analysis of strengths of each level vs. obligations to assess where the country has a niche. In any event, a mode 2 commitment which encourages people to come and consume education services is minimal risk one. Foreign presence should only be with conditions as to provision of universal access to education services-the details of which would have to be designed by law or regulation
Banking Engage the stakeholders more specifically on the details and implications of making commitments in the banking sector so as to make an informed decision.
This study is an important first step; there is need for some more capacity building at a sector specific level to enhance the understanding of making commitments for Tanzania. This process to the extent possible should involve some level of harmonization within EAC and SADC so as to take into account regional reform processes. This process should also be multi-stakeholder encompassing including the WTO, UNCTAD, regional bodies, civil society, sector specific individuals and others. Where the options provided contemplate the making of a commitment, technical assistance will be required to assist in how to best reflect the flexibilities in scheduling.
65
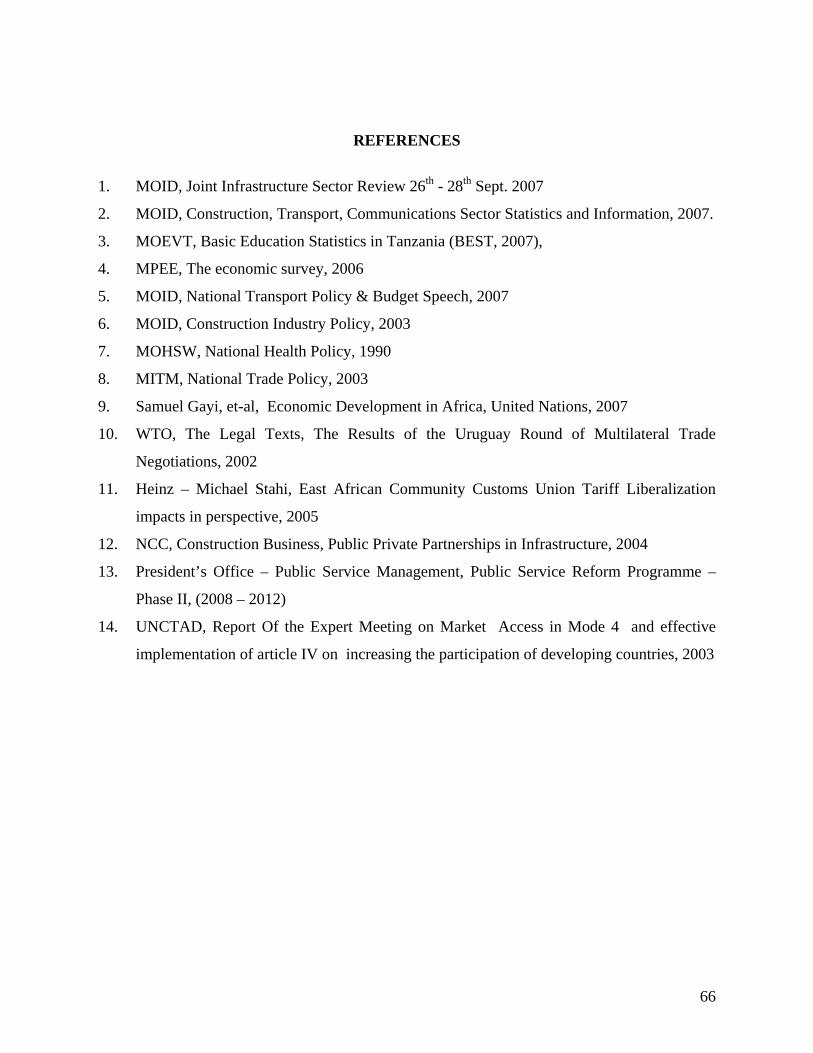
REFERENCES
1. MOID, Joint Infrastructure Sector Review 26th - 28th Sept. 2007
2. MOID, Construction, Transport, Communications Sector Statistics and Information, 2007.
3. MOEVT, Basic Education Statistics in Tanzania (BEST, 2007),
4. MPEE, The economic survey, 2006
5. MOID, National Transport Policy & Budget Speech, 2007
6. MOID, Construction Industry Policy, 2003
7. MOHSW, National Health Policy, 1990
8. MITM, National Trade Policy, 2003
9. Samuel Gayi, et-al, Economic Development in Africa, United Nations, 2007
10. WTO, The Legal Texts, The Results of the Uruguay Round of Multilateral Trade
Negotiations, 2002
11. Heinz – Michael Stahi, East African Community Customs Union Tariff Liberalization
impacts in perspective, 2005
12. NCC, Construction Business, Public Private Partnerships in Infrastructure, 2004
13. President’s Office – Public Service Management, Public Service Reform Programme –
Phase II, (2008 – 2012)
14. UNCTAD, Report Of the Expert Meeting on Market Access in Mode 4 and effective
implementation of article IV on increasing the participation of developing countries, 2003
66
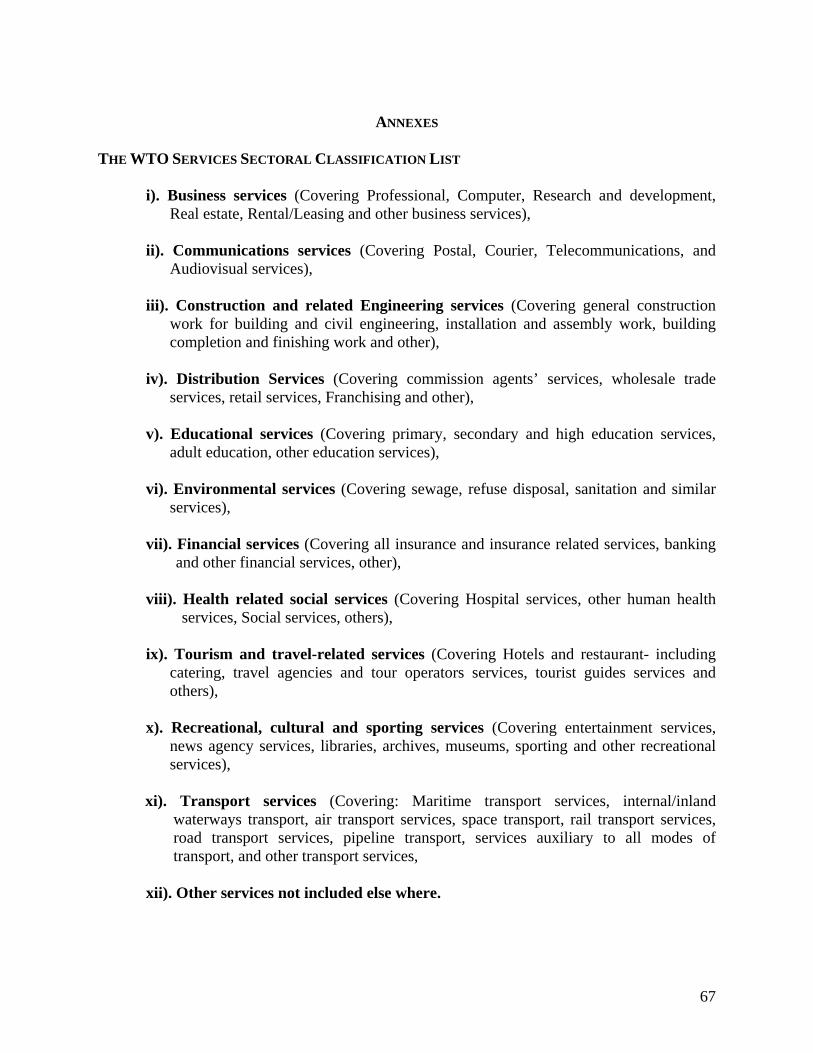
ANNEXES
THE WTO SERVICES SECTORAL CLASSIFICATION LIST
i). Business services (Covering Professional, Computer, Research and development, Real estate, Rental/Leasing and other business services),
ii). Communications services (Covering Postal, Courier, Telecommunications, and
Audiovisual services), iii). Construction and related Engineering services (Covering general construction
work for building and civil engineering, installation and assembly work, building completion and finishing work and other),
iv). Distribution Services (Covering commission agents’ services, wholesale trade
services, retail services, Franchising and other), v). Educational services (Covering primary, secondary and high education services,
adult education, other education services), vi). Environmental services (Covering sewage, refuse disposal, sanitation and similar
services), vii). Financial services (Covering all insurance and insurance related services, banking
and other financial services, other), viii). Health related social services (Covering Hospital services, other human health
services, Social services, others), ix). Tourism and travel-related services (Covering Hotels and restaurant- including
catering, travel agencies and tour operators services, tourist guides services and others),
x). Recreational, cultural and sporting services (Covering entertainment services,
news agency services, libraries, archives, museums, sporting and other recreational services),
xi). Transport services (Covering: Maritime transport services, internal/inland
waterways transport, air transport services, space transport, rail transport services, road transport services, pipeline transport, services auxiliary to all modes of transport, and other transport services,
xii). Other services not included else where.
67
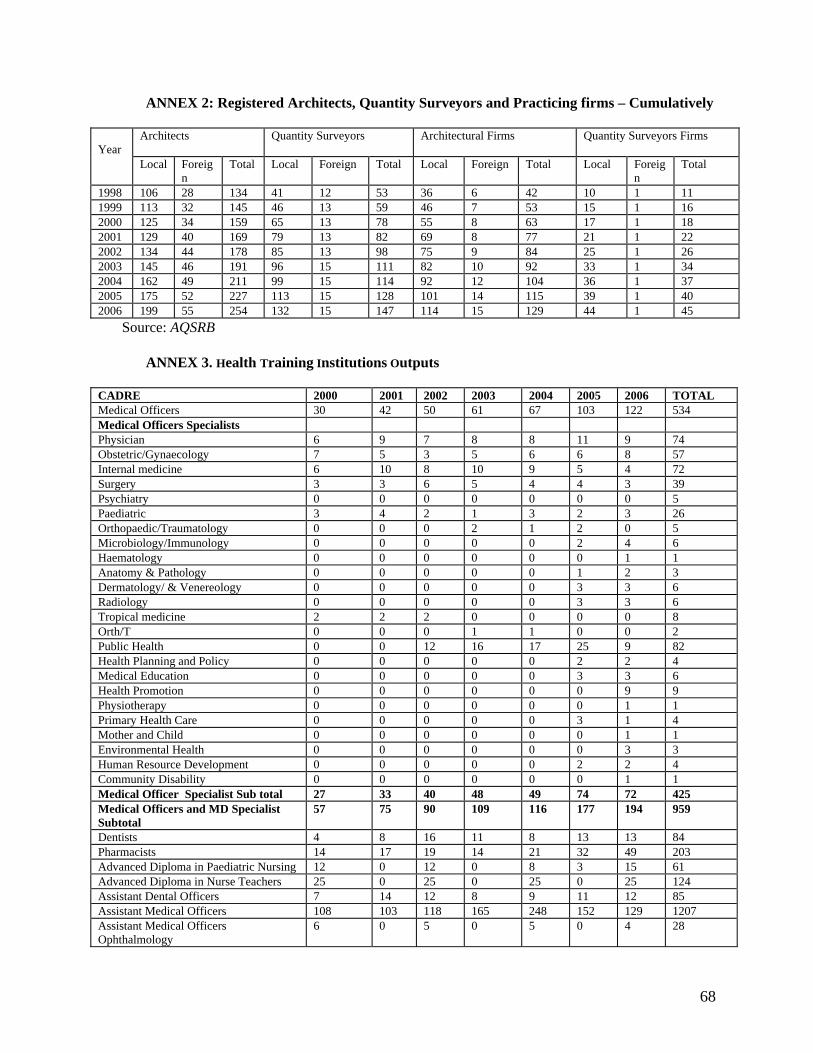
ANNEX 2: Registered Architects, Quantity Surveyors and Practicing firms – Cumulatively
Year
Architects Quantity Surveyors Architectural Firms Quantity Surveyors Firms
Local Foreign
Total Local Foreign Total Local Foreign Total Local Foreign
Total
1998 106 28 134 41 12 53 36 6 42 10 1 11 1999 113 32 145 46 13 59 46 7 53 15 1 16 2000 125 34 159 65 13 78 55 8 63 17 1 18 2001 129 40 169 79 13 82 69 8 77 21 1 22 2002 134 44 178 85 13 98 75 9 84 25 1 26 2003 145 46 191 96 15 111 82 10 92 33 1 34 2004 162 49 211 99 15 114 92 12 104 36 1 37 2005 175 52 227 113 15 128 101 14 115 39 1 40 2006 199 55 254 132 15 147 114 15 129 44 1 45
Source: AQSRB
ANNEX 3. Health Training Institutions Outputs
CADRE 2000 2001 2002 2003 2004 2005 2006 TOTAL Medical Officers 30 42 50 61 67 103 122 534 Medical Officers Specialists Physician 6 9 7 8 8 11 9 74 Obstetric/Gynaecology 7 5 3 5 6 6 8 57 Internal medicine 6 10 8 10 9 5 4 72 Surgery 3 3 6 5 4 4 3 39 Psychiatry 0 0 0 0 0 0 0 5 Paediatric 3 4 2 1 3 2 3 26 Orthopaedic/Traumatology 0 0 0 2 1 2 0 5 Microbiology/Immunology 0 0 0 0 0 2 4 6 Haematology 0 0 0 0 0 0 1 1 Anatomy & Pathology 0 0 0 0 0 1 2 3 Dermatology/ & Venereology 0 0 0 0 0 3 3 6 Radiology 0 0 0 0 0 3 3 6 Tropical medicine 2 2 2 0 0 0 0 8 Orth/T 0 0 0 1 1 0 0 2 Public Health 0 0 12 16 17 25 9 82 Health Planning and Policy 0 0 0 0 0 2 2 4 Medical Education 0 0 0 0 0 3 3 6 Health Promotion 0 0 0 0 0 0 9 9 Physiotherapy 0 0 0 0 0 0 1 1 Primary Health Care 0 0 0 0 0 3 1 4 Mother and Child 0 0 0 0 0 0 1 1 Environmental Health 0 0 0 0 0 0 3 3 Human Resource Development 0 0 0 0 0 2 2 4 Community Disability 0 0 0 0 0 0 1 1 Medical Officer Specialist Sub total 27 33 40 48 49 74 72 425 Medical Officers and MD Specialist Subtotal
57 75 90 109 116 177 194 959
Dentists 4 8 16 11 8 13 13 84 Pharmacists 14 17 19 14 21 32 49 203 Advanced Diploma in Paediatric Nursing 12 0 12 0 8 3 15 61 Advanced Diploma in Nurse Teachers 25 0 25 0 25 0 25 124 Assistant Dental Officers 7 14 12 8 9 11 12 85 Assistant Medical Officers 108 103 118 165 248 152 129 1207 Assistant Medical Officers Ophthalmology
6 0 5 0 5 0 4 28
68
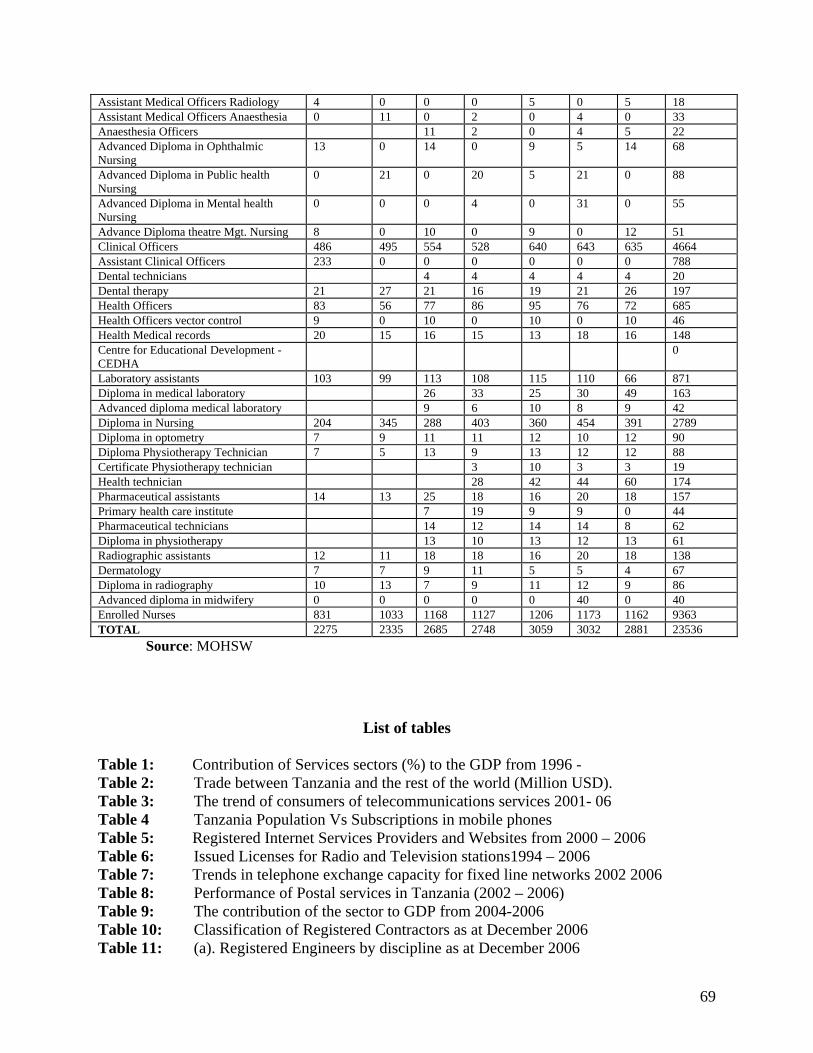
Assistant Medical Officers Radiology 4 0 0 0 5 0 5 18 Assistant Medical Officers Anaesthesia 0 11 0 2 0 4 0 33 Anaesthesia Officers 11 2 0 4 5 22 Advanced Diploma in Ophthalmic Nursing
13 0 14 0 9 5 14 68
Advanced Diploma in Public health Nursing
0 21 0 20 5 21 0 88
Advanced Diploma in Mental health Nursing
0 0 0 4 0 31 0 55
Advance Diploma theatre Mgt. Nursing 8 0 10 0 9 0 12 51 Clinical Officers 486 495 554 528 640 643 635 4664 Assistant Clinical Officers 233 0 0 0 0 0 0 788 Dental technicians 4 4 4 4 4 20 Dental therapy 21 27 21 16 19 21 26 197 Health Officers 83 56 77 86 95 76 72 685 Health Officers vector control 9 0 10 0 10 0 10 46 Health Medical records 20 15 16 15 13 18 16 148 Centre for Educational Development - CEDHA
0
Laboratory assistants 103 99 113 108 115 110 66 871 Diploma in medical laboratory 26 33 25 30 49 163 Advanced diploma medical laboratory 9 6 10 8 9 42 Diploma in Nursing 204 345 288 403 360 454 391 2789 Diploma in optometry 7 9 11 11 12 10 12 90 Diploma Physiotherapy Technician 7 5 13 9 13 12 12 88 Certificate Physiotherapy technician 3 10 3 3 19 Health technician 28 42 44 60 174 Pharmaceutical assistants 14 13 25 18 16 20 18 157 Primary health care institute 7 19 9 9 0 44 Pharmaceutical technicians 14 12 14 14 8 62 Diploma in physiotherapy 13 10 13 12 13 61 Radiographic assistants 12 11 18 18 16 20 18 138 Dermatology 7 7 9 11 5 5 4 67 Diploma in radiography 10 13 7 9 11 12 9 86 Advanced diploma in midwifery 0 0 0 0 0 40 0 40 Enrolled Nurses 831 1033 1168 1127 1206 1173 1162 9363 TOTAL 2275 2335 2685 2748 3059 3032 2881 23536
Source: MOHSW
List of tables Table 1: Contribution of Services sectors (%) to the GDP from 1996 - Table 2: Trade between Tanzania and the rest of the world (Million USD). Table 3: The trend of consumers of telecommunications services 2001- 06 Table 4 Tanzania Population Vs Subscriptions in mobile phones Table 5: Registered Internet Services Providers and Websites from 2000 – 2006 Table 6: Issued Licenses for Radio and Television stations1994 – 2006 Table 7: Trends in telephone exchange capacity for fixed line networks 2002 2006 Table 8: Performance of Postal services in Tanzania (2002 – 2006) Table 9: The contribution of the sector to GDP from 2004-2006 Table 10: Classification of Registered Contractors as at December 2006 Table 11: (a). Registered Engineers by discipline as at December 2006
69

(b). Registered Building contractors by class – cumulative (c). Civil contractors by class – cumulatively
Table 12: Tourism promotion outreach in 2007 Table 13: (a). The number of tourists entered the country and the revenue generated
(b). Trends in tourism business in Tanzania (2003 – 2007) (c): Number of tourists visited National reserves (January – December 2007)
Table 14: Cargo traffic at Dar es Salaam Port (‘000,000 tones) Table 15: Length of road network in Tanzania by category (2007) Table 16: Conditions of Road Network in 2006 compared to 2005 Table 17: Number of Road Transport Licenses Issued from 1997 – 2007 Table 18: TRC (TRL) Freight and Passenger Performance 2002 -2007 (‘000) Table 19: TAZARA Traffic Performance for the past 5 years (‘000) Table 20: Uganda and Burundi Imports and Exports through Mwanza Port (Tones) Table 21: Classification of airports in Tanzania
Table 22: Passenger, Cargo and Airport movements between JNIA and JKIA
Table 23: Health Facilities in Tanzania (2004 – 2005)
Table 24: (a). Human Resource status by Facility Level in Public Health Facilities (b). Human Resource Status by Facility Level in Private Health Facilities
Table 25: Developing country commitments in the Health sector as at June 2003--49 Table 26 (a). The standard I - VII enrolment in both government and non-government
(b). Enrolment in Government Teacher Training Colleges 2003 – 2007 (c). Financing of Basic Education in Tanzania
Table 27: Financial Sector performance (2004 - 2006) Table 28: Summary of the key findings by sector
List of figures. Figure 1: The share of services value added in GDP as at 2003, country group Figure 2: Percentage of contribution of Services sector to DGP Figure 3: The trends of consumers of telecommunications services Figure 4: The registered internet services providers and websites Figure 5: Trends in tourism business in Tanzania (2003 - 2007) Figure 6: The Road network length in Tanzania (%) Figure 7: Map of the Development corridors in Tanzania Figure 8: Financing of Basic Education in Tanzania
70