united states department of commerce · united states department of commerce national oceanic &...
TRANSCRIPT

UNITED STATES DEPARTMENT OF COMMERCE NATIONAL OCEANIC & ATMOSPHERIC ADMINISTRATION
NATIONAL OCEAN SERVICE NATIONAL GEODETIC SURVEY
INTERNATIONAL EARTH ROTATION & REFERENCE SYSTEM SERVICES
PIE TOWN, NM LOCAL SITE SURVEY REPORT
Kendall L. Fancher
Charles E. Geoghegan
Dates of Data Collection: May, 2016
Date of Report: June, 2016
i
Introduction ..................................................................................................................................... 3
Site Description ............................................................................................................................... 3
2. Instrumentation ........................................................................................................................... 3
2.1. Tacheometers ........................................................................................................................... 3
2.1.1. Description ............................................................................................................................ 3
2.1.3. Auxiliary Equipment .............................................................................................. 4
2.2.1. Receivers ................................................................................................................ 4
2.2.2. Antennas ................................................................................................................. 4
2.2.3. Analysis software, mode of operation .................................................................... 4
2.3. Leveling ............................................................................................................................ 4
2.3.1. Leveling Instruments .............................................................................................. 4
2.3.2. Leveling Staffs ........................................................................................................ 4
2.3.3. Checks carried out before measurements ............................................................... 4
2.5. Forced Centering Devices ................................................................................................. 5
2.6. Targets, Reflectors ............................................................................................................ 5
3. Measurement Setup ..................................................................................................................... 5
3.1. Ground Network ............................................................................................................... 5
3.1.1. Listing ..................................................................................................................... 6
3.1.2. Map of Network .................................................................................................................... 8
Figure 7 – Pietown ITRF site ground control network map. ................................................... 8
3.2. Representation of Technique Reference Points ................................................................ 9
3.2.1. VLBI ....................................................................................................................... 9
Figure 7 – SGT 7234 25-m radio telescope ............................................................................. 9
3.2.2 GPS .......................................................................................................................... 9
4. Observations ............................................................................................................................. 10
4.1. Conventional Survey ...................................................................................................... 10
Figure 9 – Horizontal control map ......................................................................................... 10
4.2. Leveling .......................................................................................................................... 10
Figure 10 – Vertical control map ........................................................................................... 11
4.3. GPS ................................................................................................................................. 11
4.4. General Comments ......................................................................................................... 11
5. Terrestrial Survey...................................................................................................................... 12
5.1. Analysis software ............................................................................................................ 12

ii
5.1.2. Topocentric Coordinates and Covariance ............................................................ 12
5.1.3. Correlation Matrix ................................................................................................ 12
5.2. GPS Observations ........................................................................................................... 12
5.3. Additional Parameters .................................................................................................... 13
5.3.1. VLBA antenna Axis Offset Computation ............................................................ 13
5.4. Transformation ............................................................................................................... 13
5.5. Description of SINEX generation ................................................................................... 13
5.6. Discussion of Results ...................................................................................................... 13
6. Planning Aspects ....................................................................................................................... 16
7. References ................................................................................................................................. 16
7.1. Name of person(s) responsible for observations ............................................................ 16
7.2. Name of person(s) responsible for analysis .................................................................... 17
7.3. Location of observation data and results archive ........................................................... 17
Attachment A. ............................................................................................................................... 18

3
Introduction
During May, 2016, the National Geodetic Survey conducted a high precision local site survey at the
National Radio Astronomy Observatory’s Very Long Baseline Array site in Pie Town, New Mexico.
Data collection consisted of leveling using a digital barcode leveling system, traverse procedures using a
high precision tacheometer and static Global Positioning System (GPS) observations using survey grade
duel frequency instrumentation. The objective of the survey was to establish high precision local ties,
referenced to the International Terrestrial Reference Frame (ITRF2008), for the reference points
associated with a radio telescope, sometimes used for Very Long Baseline Interferometry (VL BI), a
Global Navigation Network System (GNSS) antenna and new and historic ground control marks. This
report documents the instrumentation and methodologies used to collect the geo-spatial data set and the
data reduction and analysis procedures used to compute the local ties.
Site Description
Site Name: Pietown (New Mexico)
Country Name: UNITED STATES OF AMERICA
Longitude: E 251° 53’
Latitude: N 34° 18’
Tectonic plate: NOAM
SGT
Instrument Name DOMES# Description/a.k.a.
GPS PIE1 40456M001 Instrument Reference Mark
GPS PIEA GPS Antenna Reference Point
VLBI 7234 40456S001 Conventional Reference Point Table 1 – Space Geodetic Technique Instrument (SGT) located at the site.
2. Instrumentation
2.1. Tacheometers
2.1.1. Description
Leica TDM5005
S/N: 441698
Specifications
Angular measurement uncertainty: ± 0.7”
Distance standard deviation of a single measurement: 1 mm + 2 ppm
Distance offset selected for project, +34.4 mm

4
2.1.2. Calibrations
The tacheometer was originally calibrated by Leica Geosystem AG Heerbrugg, Switzerland.
Inspection date: 08/20/2008
In April, 2016 this instrument’s EDMI was evaluated using the NGS Corbin Calibration
Baseline and the EDMI was found to be measuring distances within the manufacturer’s
specifications.
2.1.3. Auxiliary Equipment
Wild NL Collimator, S/N: 279330, Pointing accuracy, 1: 200,000
Hygrometer/Barometer: Omega Nomad, model # OM-CP-PRHTEMP101, S/N P37543
Thermometer: DORIC 450, S/N 00662, with thermistor sensor fabricated by NGS
2.2. GPS Units
2.2.1. Receivers
Trimble NetR5
P/N: 62800-00
S/Ns: 4619K01307, 4624K01648, and 4624K01584 and 462K01631
Specifications for Static GPS Surveying
Horizontal: +/- 5 mm + 0.5 ppm RMS
Vertical: +/- 5 mm + 1 ppm RMS
2.2.2. Antennas
Topcon GPS/GLONASS/Galileo choke ring antenna, model CR-G3
P/N: 1-044301-01
S/Ns 383-1614, -1626 and -1628
2.2.3. Analysis software, mode of operation
Post-processing and adjustment were undertaken using NGS’s Online Positioning User Service
(OPUS) Projects, an interactive web page. OPUS Projects uses as an underlying multi-baseline
processor NGS’s Program for Adjustment of GPS Ephemerides (PAGES) software.
2.3. Leveling
2.3.1. Leveling Instruments
Leica DNA03 digital level, P/N: 723289
Height measurement accuracy, +/-0.3 mm per km, double-run.
2.3.2. Leveling Staffs
Leica GWCL92 92-cm Invar Bar Code Rod
S/N: 30721
Leica GPCL3 3-m Invar Bar Code Rod
S/N: 30579
2.3.3. Checks carried out before measurements
Prior to observations the instrument’s reticle was to checked to ensure it was coincident with the
instrument’s horizontal line of sight. Instrument collimation test procedures, using the
Kukkamaki procedure, were undertaken daily, prior to data collection. Leveling rod bubbles
were checked daily, prior to use.
5
2.4. Tripods
Standard wooden surveying tripods, with collapsible legs, were used to support surveying
instrumentation centered over all ground network marks.
2.5. Forced Centering Devices
At each tripod setup, a Leica GDF321 tribrach was plumbed precisely over a survey mark disk using a
Wild NL Collimator. The tribrach was “leveled up” using a Leica Geosystems GZR3 carrier with
longitudinal bubble. That is, the carrier’s standing axis was brought into alignment with the local
gravity vector using the tribrach’s footscrews.
To facilitate precise measurement of the height of instruments/reflectors above each mark, a tribrach
adapter was locked into the tribrach, the top of same serving as a vertical point of reference. Digital
leveling equipment was used to transfer a height difference from the survey mark to the vertical point of
reference associated with the tribrach adapter. To determine a total height of instruments/reflectors
above the mark, an offset constant of 0.1675m was added to the leveled height difference. The constant
was previously determined by NGS and represents the distance from the tribrach adapter’s vertical point
of reference to either the center of the tilt axis of the tacheometer’s telescope or the center of a
target/reflector.
2.6. Targets, Reflectors
Leica GDH1P retro-reflectors, model #555631
Specifications
Centering of Optics: < ± 0.03mm
Distance Offset: -34.4 mm
Leica GRT144, Carrier with Stub
Centering Accuracy: ± 1.0 mm
All tacheometer observations were made to Leica GPH1P precision reflectors serving as both target and
reflector. The manufacturer-provided offset value of -34.4 mm for the GPH1P was validated prior to the
survey. Reflectors were affixed to tribrachs using GRT144 carriers.
To minimize potential loss of precision in distance measurement, care was taken to precisely point all
reflectors back to the tacheometer. To that end, reflectors used for SGT 7234 CRP measurements were
affixed to radio-controlled, pan-tilt units and remotely controlled by the observer to point reflectors back
to the tacheometer after each motion of the radio telescope.
3. Measurement Setup
3.1. Ground Network
Ground network marks are monumented for future reference. The terrestrial survey ties them together in
a local coordinate system using high precision horizontal angles and distance measurements. Height
differences between the marks were determined by precise leveling techniques. Ground network marks
are used to tie Space Geodetic Technique (SGT) instruments to the network, and indirectly, to each
other. One non-monumented, or temporary mark, (TP01) was used this survey to facilitate horizontal
angle measurements to PIE1 IRM and PIETOWN CORS ARP.

6
3.1.1. Listing
Current Survey
Main-Scheme Marks
DOMES
IERS
4-char
code
Current
Survey
id
Code
Previous Survey
Point Name
NGS
PID
Ground Network Marks
PIE TOWN VLBA RM 1 n/a n/a PTR1 PIE TOWN VLBA RM 1 ER0692
PIE TOWN VLBA RM 2 n/a n/a PTR2 PIE TOWN VLBA RM 2 ER0693
PIE TOWN VLBA RM 3 n/a n/a PTR3 PIE TOWN VLBA RM 3 ER0694
PIE TOWN VLBA RM 4 n/a n/a PTR4 -new this survey-- n/a
PIE TOWN VLBA RM 5 n/a n/a PTR5 -new this survey- n/a
SGT Instrument Reference Mark
PIE1 IRM 40456M001 PIE1 PIE1 -new this survey- n/a
SGT Conventional Reference Points
PIETOWN CORS ARP n/a n/a PIEA -new this survey- AF9512
SGT 7234 CRP 40456S001 7234 7234 PIE TOWN VLBA ANT 7234 ER0695 Table 2 – Listing of Ground Network Marks, SGT Instrument Reference Marks and SGT Conventional Reference Points.
Ground Network Marks
PIE TOWN VLBA RM 1(PTR1):
The mark is a dimple, set in the
top center of a rounded stainless
steel rod inside a grease filled
PVC sleeve. The setting depth of
the rod and sleeve are unknown.
The mark is set in the center of a
PVC pipe with an aluminum logo
cover. The aluminum logo cover
is stamped PIE TOWN N.M.
VLBA RM 1 8 90 7234.
Figure 1 – PIE TOWN VLBA RM 1
PIE TOWN VLBA RM 2(PTR2):
The mark is a dimple, cast in the top
center of a NASA-SFC brass disk,
set flush in the top of a concrete
post type monument and inside a
PVC pipe with aluminum logo
cover. The setting depth of the
concrete post is unknown. The brass
disk is stamped PIE TOWN NM
VLBA RM 2. The aluminum logo
cover is stamped PIE TOWN NM.
VLBA RM2 7234 AUG 1990.
Figure 2 – PIE TOWN VLBA RM 2

7
PIE TOWN VLBA RM 3(PTR3):
The mark is a dimple, cast in the
top center of a NASA-SFC brass
disk, set flush in the top of a
concrete post type monument and
inside a PVC pipe with aluminum
logo cover. The setting depth of the
concrete post is unknown. The
brass disk is stamped PIE TOWN
N.M. VLBA RM 3. The aluminum
logo cover is stamped PIE TOWN
N. M. VLBA RM 3 AUG 1990
7234.
Figure 3 – PIE TOWN VLBA RM 3
PIE TOWN VLBA RM 4(PTR4):
The mark is a dimple, cast in the
top center of a NGS brass geodetic
control disk, set flush in the top of
a concrete post type monument set
to a depth of 1.2 m. The disk is
stamped PIE TOWN VLBA RM 4
2016.
Figure 4 – PIE TOWN VLBA RM 4
PIE TOWN VLBA RM 5(PTR5): The
mark is a dimple, cast in the top
center of a NGS brass geodetic
control disk, set flush in the top of a
concrete post type monument set to a
depth of 1.2 m. The disk is stamped
PIE TOWN VLBA RM 5 2016.
Figure 5 – PIE TOWN VLBA RM 5

8
Instrument Reference Marks
PIE 1: The Instrument Reference
Mark (IRM) is a dimple cast into the
top center of a stainless steel plate set
in the top center of a concrete pier set
to a depth of 3.0 m. The plate is
inscribed VLBA SITE GPS
STATION MARK JPL 4009-S 1992.
Figure 6 – PIE1 IRM mark
3.1.2. Map of Network
Figure 7 – Pietown ITRF site ground control network map.

9
3.2. Representation of Technique Reference Points
The conventional reference point (CRP), a.k.a. invariant reference point, is a theoretical point. For the
Pie Town VLBA instrument, the CRP can be defined as the intersection of the azimuth axis with the
common perpendicular of the azimuth and elevation axis (Johnston et al, 2004).
3.2.1. VLBI
SGT 7234 - The National Radio Astronomy Observatory
operates the Very Long Baseline Array (VLBA). SGT
7234 is one of 10 instruments comprising the VLBA. This
instrument is used for a variety of astronomic science
including periodic VLBI measurements. SGT 7234 is a
25-m AZEL type antenna. This instrument does not have
an associated IRM.
Coordinates for the CRP associated with SGT 7234 were
determined indirectly this survey by means of a circle
fitting routine, using horizontal/vertical angle and distance
measurements to targets affixed to the antenna during
different rotational sequences.
Figure 7 – SGT 7234 25-m radio telescope
3.2.2 GPS
PIE1 - The National Aeronautical & Space
Administration’s Jet Propulsion Laboratory operates
GPS tracking station. The station is included in the
International GNSS Service (IGS) tracking network.
The antenna type at time of this survey was an Ashtech
model ASH701945E_M NONE (S/N CR520022114). The
Antenna Reference Point (ARP) is reported by the IGS to be
centered horizontally over the IRM, with a vertical offset of
0.061 m.
Without removal of the antenna, the IRM is not accessible for
direct occupation of survey Instrumentation. Coordinates for
the IRM associated with PIE1 were determined this survey
by intersection method from ground network marks PIE
TOWN VLBA RM 1, PIE TOWN VLBA RM 4 and a
temporary mark (TP01). A site log for PIE1 is available at
the IGS web page:
https://igscb.jpl.nasa.gov/igscb/station/log/pie1_20160211.log Figure 8 – IGS network station PIE1

10
4. Observations
4.1. Conventional Survey
The conventional survey consisted of measuring horizontal/vertical angles and distances using a high
precision tacheometer, employing traverse procedures between and/or to all features of interest. All
angular and distance measurements were observed a minimum of four repetitions and incorporated
double centering of the tacheometer, otherwise known as measuring in both phase I and phase II. For
distance measurements, meteorological data were input into the tacheometer and refractive index
corrections were applied internally at time of field measurement. Data collection software GeoObs
v1.04.02 was used for recording field measurements and field level data quality checks. A complete list
of unadjusted and adjusted tacheometer field observations consisting of directions, zenith distances,
slope distances and instrument/target heights are available in Star*Net output file Pietown.lst.
Figure 9 – Horizontal control map
4.2. Leveling
Leveling data was collected for the purpose of determining high precision height difference information
referenced to the geoid. Leveling between all ground control network mark, PIE1 IRM and PIETOWN
CORS ARP were performed to Federal Geodetic Control Sub-committee (FGCS) First Order, Class 1
standards.
Three “double run” level loops were completed, with the first loop beginning at PIE TOWN VLBA RM
1 then to PIE TOWN VLBA RM 5 then to PIE TOWN VLBA RM 4, closing back to PIE TOWN
VLBA RM 1. A second loop was run from PIE TOWN VLBA RM 5 then to PIE1 IRM, then to
PIETOWN CORS ARP, closing back to PIE TOWN VLBA RM 5. A Third loop was run from PIE
TOWN VLBA RM 4 then to PIE TOWN VLBA RM 3 then to PIE TOWN VLBA RM 2, closing back
to PIE TOWN VLBA RM 1. Two double run spurs were run. The first spur was run off of the third

11
loop to PIE TOWN VLBI from PIE TOWN VLBA RM 2. The second loop was run off of the first loop
from PIE TOWN VLBA RM 5 to TP01.
The measured height differences between marks were incorporated into a classical 3-dimensional
adjustment of the terrestrial data. A complete listing of unadjusted leveling observations is available in
Leica output file Pietown.abs.
Figure 10 – Vertical control map
4.3. GPS
GPS data was collected for the purpose of determining high-precision, 3-dimensional IGS08(epoch date
of survey 2016/05/18, aka eds) coordinates for ground network marks marks (PIE TOWN VLBA RM 1,
PIE TOWN VLBA RM 2, PIE TOWN VLBA RM 3 and PIE TOWN VLBA RM 5). GPS data
collection consisted of simultaneous and long-session observations conducted over multiple days. GPS
derived coordinates for the four marks was used to align or transform the local terrestrial network to
ITRF2008(eds).
4.4. General Comments
As noted earlier, determining the local coordinates of the SGT 7234 CRP was achieved using an indirect
approach. The “circle fit” theory is straight-forward. A point, as it revolves about an axis, scribes a
perfect arc. The arc defines a perfect circle and a plane simultaneously. The axis can then be seen as it
passes through the center of the circle, orthogonal to the plane. By assigning coordinates to the points
observed along an arc rotated about an axis, one can assign parameters to the axis relative to an
established local coordinate system. Tacheometer measurements project coordinates from the local

12
ground network to a target attached to a geodetic technique instrument as it moves about the
instrument’s axis, thereby providing the necessary information to locate a single axis. The same
procedure must be done for the opposing axis of the instrument in the same local reference frame. The
point along the primary axis that is orthogonal to the secondary axis is the CRP associated with the SGT.
In practice, a complex system of precise observations involving three targets secured to the telescope,
measurements from at least two ground network marks, and numerous measurements per axis serve to
ensure a millimeter level of positional precision is achieved. SGT 7234 CRP was determined in this
manner.
5. Terrestrial Survey
5.1. Analysis software
Commercially available, least squares adjustment software Star*Net (version 8,1,2,990) was used to
perform a classical 3-dimensional adjustment of the terrestrial data. Measurements included in the
adjustment consisted of terrestrial observations of all ground network marks, intermediate target points
affixed to the VLBA antenna. The adjustment produced geodetic coordinates and variance-covariance
information for all features surveyed. The adjustment included height differences between ground
network marks determined by leveling and included PIE1 IRM and PIETOWN CORS ARP. Terrestrial
adjustment parameters and results can be found in Star*Net output file Pietown.lst. Terrestrial
adjustment variance-covariance estimates can be found in the Star*Net output file Pietown.dmp.
AXIS 1.07 software, developed by Geoscience Australia (GA), was used to perform 3-dimensional arc
fitting to compute a number of axes in space, which were in turn used to estimate the CRP associated
with the SGT 73234. A Star*Net output file (Pietown.dmp) containing coordinate and variance-
covariance estimates for intermediate targets affixed to the SLR was converted to VCV format file
(Pietown.vcv) using NGS software HALF2VCV and used as initial input. Circle fitting constraints can
be found in AXIS input file setup.axs. Circle fitting parameters and results can be found in section 3.0
“Least Squares Estimation” of AXIS output file output.axs.
5.1.2. Topocentric Coordinates and Covariance
Topocentric coordinates and covariance information, from the classical adjustment of the terrestrial data,
for ground network marks, VLBA targets can be found in section 2.1 “SOLUTION PARAMETER
SUMMARY” and section 2.2 SOLUTION VARIANCE COVARIANCE MATRIX REDUCTION” in
AXIS output file output.axs.
5.1.3. Correlation Matrix
Reduced correlation matrix information for the ground network marks, the CRP associated with SGT
7234 can be found in section 6. “SINEX GENERATION” in AXIS output file output.axs.
5.2. GPS Observations
NGS’s Online Positioning User’s Service (OPUS) Projects was used to post-process and analyze GPS
data and to compute least-squares, 3-dimensional estimates of mark positions. Resulting adjusted
positions can be found in (OPUS) Projects output file “network-final.snx”.
13
5.3. Additional Parameters
5.3.1. VLBA antenna Axis Offset Computation
AXIS software was used to compute the offset distance between the elevation and azimuthal axis. The
offset value was computed to be 2.1380 ± 0.3 mm. The International VLBI Service reports the axial
offset to be 2.1377 +- 0.0089 m. Offset computation results can be found in section 3.7
“IVP/TOUCH/INTERSECT PARAMETER VALUES AND THEIR PRECISION” of the AXIS output
file output.axs.
5.3.2. GPS Antenna Reference Point Offset from Instrument Mark Computation
NGS Program INVERS3d was used to compute offset values from PIE1 IRM to PIETOWN CORS
ARP. Final coordinates for these marks, provided in Table 5, was used as input. Offset values were
computed to be delta north 0.0001 m, delta east 0.0000 m and delta up 0.0609 m. The International
GNSS Service reports offset values to be delta north 0.000 m, delta east 0.000 m and delta up 0.061 m.
5.4. Transformation
Local tie vectors from the terrestrial survey were accurately aligned, or transformed, from a geodetic
frame to ITRF2008(eds) using AXIS software. For the alignment, AXIS requires coordinates in the
desired reference frame and epoch date, at a minimum of four co-observed sites (PIE TOWN VLBA
RM 1, PIE TOWN VLBA RM 2, PIE TOWN VLBA RM 3 and PIE TOWN VLBA RM 5). The spatial
integrity of the terrestrial survey is maintained throughout the transformation process. Transformation
parameters and results can be found in section 5. “FRAME ALIGNMENT” in the AXIS output file
output.axs.
5.5. Description of SINEX generation
AXIS was used to generate a final solution output file in SINEX format with full variance-covariance
matrix information. The following SINEX file naming convention, adopted by GSA for local survey
data, was also used for this survey.
XXXNNNNYYMMFV.SNX
Where:
XXX is a three-character organization designation
NNNN is a four-character site designation
YY is the year of the survey
MM is the month of the survey
F is the frame code (G for global, L for local)
V is the file version
Axis generated SINEX file NGSPIE1605GA.snx is found in Attachment A.
5.6. Discussion of Results
Least-Squares Estimates of Terrestrial Observations
A classical 3-dimensional adjustment of terrestrial observation was conducted using Star*Net. The
adjustment produced geodetic coordinates, in a geodetic reference frame, for all stations included in the
survey and the targets intended for use in determination of SGT 7234 CRP. A statistical summary from
the adjustment is included in Table 3.
14
Adjustment Statistical Summary
==============================
Iterations = 2
Number of Stations = 74
Number of Observations = 1295
Number of Unknowns = 357
Number of Redundant Obs = 938
Observation Count Sum Squares Error
of StdRes Factor
Coordinates 3 0.000 0.000
Directions 512 78.772 0.461
Distances 486 10.395 0.172
Az/Bearings 1 0.000 0.000
Zeniths 271 129.044 0.811
Level Data 22 1.245 0.279
Total 1295 219.456 0.484
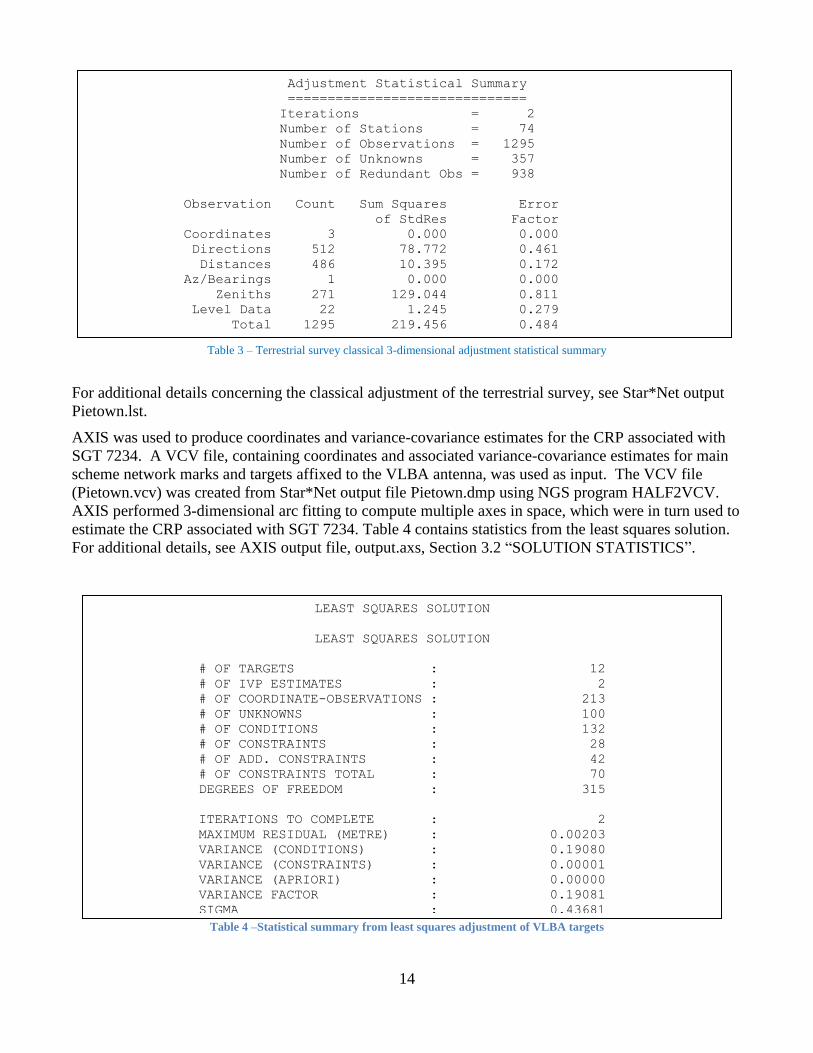
Table 3 – Terrestrial survey classical 3-dimensional adjustment statistical summary
For additional details concerning the classical adjustment of the terrestrial survey, see Star*Net output
Pietown.lst.
AXIS was used to produce coordinates and variance-covariance estimates for the CRP associated with
SGT 7234. A VCV file, containing coordinates and associated variance-covariance estimates for main
scheme network marks and targets affixed to the VLBA antenna, was used as input. The VCV file
(Pietown.vcv) was created from Star*Net output file Pietown.dmp using NGS program HALF2VCV.
AXIS performed 3-dimensional arc fitting to compute multiple axes in space, which were in turn used to
estimate the CRP associated with SGT 7234. Table 4 contains statistics from the least squares solution.
For additional details, see AXIS output file, output.axs, Section 3.2 “SOLUTION STATISTICS”.
Table 4 –Statistical summary from least squares adjustment of VLBA targets
LEAST SQUARES SOLUTION
LEAST SQUARES SOLUTION
# OF TARGETS : 12
# OF IVP ESTIMATES : 2
# OF COORDINATE-OBSERVATIONS : 213
# OF UNKNOWNS : 100
# OF CONDITIONS : 132
# OF CONSTRAINTS : 28
# OF ADD. CONSTRAINTS : 42
# OF CONSTRAINTS TOTAL : 70
DEGREES OF FREEDOM : 315
ITERATIONS TO COMPLETE : 2
MAXIMUM RESIDUAL (METRE) : 0.00203
VARIANCE (CONDITIONS) : 0.19080
VARIANCE (CONSTRAINTS) : 0.00001
VARIANCE (APRIORI) : 0.00000
VARIANCE FACTOR : 0.19081
SIGMA : 0.43681
15
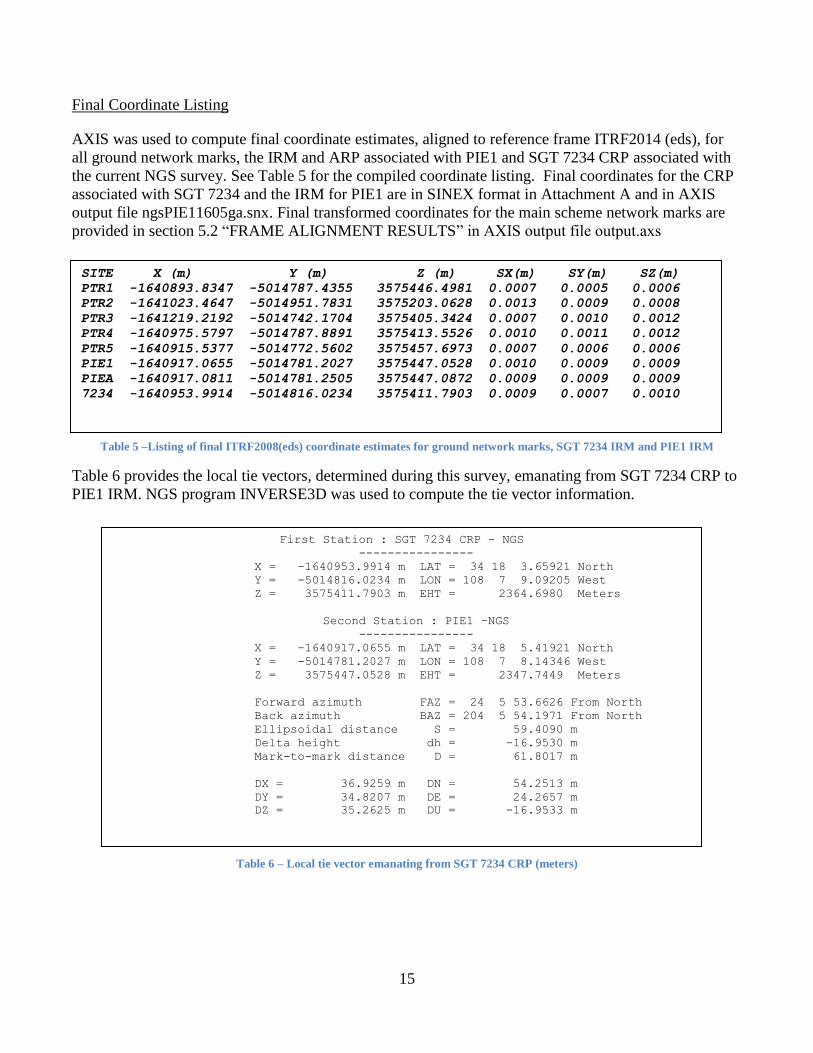
Final Coordinate Listing
AXIS was used to compute final coordinate estimates, aligned to reference frame ITRF2014 (eds), for
all ground network marks, the IRM and ARP associated with PIE1 and SGT 7234 CRP associated with
the current NGS survey. See Table 5 for the compiled coordinate listing. Final coordinates for the CRP
associated with SGT 7234 and the IRM for PIE1 are in SINEX format in Attachment A and in AXIS
output file ngsPIE11605ga.snx. Final transformed coordinates for the main scheme network marks are
provided in section 5.2 “FRAME ALIGNMENT RESULTS” in AXIS output file output.axs
Table 5 –Listing of final ITRF2008(eds) coordinate estimates for ground network marks, SGT 7234 IRM and PIE1 IRM
Table 6 provides the local tie vectors, determined during this survey, emanating from SGT 7234 CRP to
PIE1 IRM. NGS program INVERSE3D was used to compute the tie vector information.
Table 6 – Local tie vector emanating from SGT 7234 CRP (meters)
SITE X (m) Y (m) Z (m) SX(m) SY(m) SZ(m)
PTR1 -1640893.8347 -5014787.4355 3575446.4981 0.0007 0.0005 0.0006
PTR2 -1641023.4647 -5014951.7831 3575203.0628 0.0013 0.0009 0.0008
PTR3 -1641219.2192 -5014742.1704 3575405.3424 0.0007 0.0010 0.0012
PTR4 -1640975.5797 -5014787.8891 3575413.5526 0.0010 0.0011 0.0012
PTR5 -1640915.5377 -5014772.5602 3575457.6973 0.0007 0.0006 0.0006
PIE1 -1640917.0655 -5014781.2027 3575447.0528 0.0010 0.0009 0.0009
PIEA -1640917.0811 -5014781.2505 3575447.0872 0.0009 0.0009 0.0009
7234 -1640953.9914 -5014816.0234 3575411.7903 0.0009 0.0007 0.0010
First Station : SGT 7234 CRP - NGS
----------------
X = -1640953.9914 m LAT = 34 18 3.65921 North
Y = -5014816.0234 m LON = 108 7 9.09205 West
Z = 3575411.7903 m EHT = 2364.6980 Meters
Second Station : PIE1 -NGS
----------------
X = -1640917.0655 m LAT = 34 18 5.41921 North
Y = -5014781.2027 m LON = 108 7 8.14346 West
Z = 3575447.0528 m EHT = 2347.7449 Meters
Forward azimuth FAZ = 24 5 53.6626 From North
Back azimuth BAZ = 204 5 54.1971 From North
Ellipsoidal distance S = 59.4090 m
Delta height dh = -16.9530 m
Mark-to-mark distance D = 61.8017 m
DX = 36.9259 m DN = 54.2513 m
DY = 34.8207 m DE = 24.2657 m
DZ = 35.2625 m DU = -16.9533 m

16
6. Planning Aspects
Contact information
The primary contact for information regarding SGT 7234 is NRAO employee Eric Carlow. Eric’s
contact information is:’
Eric Carlowe
National Radio Astronomy Observatory (NRAO)
Array Operations Center
P.O. Box O
1003 Lopezville Road
Socorro, NM 87801-0387
Phone: (575) 835-7000, Fax: (575) 835-7027
Recommendations:
Plan all measurements to VLBA antenna targets around weekly maintenance days to minimize impact
on the NRAO data collection mission. At time of this survey, every Wednesday is a maintenance day.
Once each month the VLBA has two consecutive maintenance days during a single week. This would be
the optimal week to conduct the local site survey.
The tripod setup at PIETOWN VLBA RM 1 will need to be at least 2.0 m above the mark to ensure line
of sight to PIE TOWN VLBA RM 2 is above the chain link fence encircling the VLBA observatory.
Line of sight between PIETOWN VLBA RM 2 and PIETOWN VLBA RM 3 will likely have to be
cleared by next survey. Possible obstructions consist of the canopies of several trees on line.
Line of sight between PIETOWN VLBA RM 3 and PIETOWN VLBA RM 5 will likely have to be
cleared by next survey. Possible obstructions consist of the canopies of several trees on line.
Watch out for snakes on sunny warm days. There are rattlesnakes in the vicinity of the VLBA
observatory.
7. References
7.1. Name of person(s) responsible for observations
Kendall Fancher ([email protected])
Charles Geoghegan ([email protected])
National Geodetic Survey
15351 Office Drive
Woodford, VA 22580
Phone – (540) 373-1243

17
7.2. Name of person(s) responsible for analysis
Kendall Fancher ([email protected])
Charles Geoghegan ([email protected])
National Geodetic Survey
15351 Office Drive
Woodford, VA 22580
Phone – (540) 373-1243
7.3. Location of observation data and results archive
Output files referenced in this report:
http://www.ngs.noaa.gov/corbin/iss/index.shtml
Observation files associated with this survey:
National Geodetic Survey
Instrumentation & Methodologies Branch
15351 Office Drive
Woodford, VA 22580
Phone – (540) 373-1243

18
Attachment A.
%=SNX 1.00 AUS 16:172:57300 AUS 16:139:00000 16:140:00000 C 00006 2 X
+FILE/REFERENCE
DESCRIPTION Terrestrial Survey Tie
OUTPUT SSC SINEX
CONTACT ________________________________________________
SOFTWARE axis version 1.07
HARDWARE ________________________________________________
INPUT Terrestrial Survey Solution
-FILE/REFERENCE
+FILE/COMMENT
* axis software by John Dawson Geoscience Australia
-FILE/COMMENT
+SITE/ID
PIE1 A 40456M001 C GNSS Instrument Refere -108 7 8.1 34 18 5.4 2347.7
7234 A 40456S001 C SGT 7234 CRP
-108 7 9.1 34 18 3.7 2364.7
-SITE/ID
+SITE/DATA
PIE1 A 1 PIE1 A 1 16:139:00000 16:140:00000 --- 16:139:43200
7234 A 1 7234 A 1 16:139:00000 16:140:00000 --- 16:139:43200
-SITE/DATA
+SOLUTION/EPOCHS
PIE1 A 1 C 16:139:00000 16:140:00000 16:139:43200
7234 A 1 C 16:139:00000 16:140:00000 16:139:43200
-SOLUTION/EPOCHS
+SOLUTION/STATISTICS
VARIANCE FACTOR 1.908053253357270e-01
SQUARE SUM OF RESIDUALS 6.010367748075401e+01
NUMBER OF OBSERVATIONS 321
NUMBER OF UNKNOWNS 6
-SOLUTION/STATISTICS
+SOLUTION/ESTIMATE
1 STAX PIE1 A 1 16:139:43200 m 2 -1.64091706549504e+06 9.59363e-04
2 STAY PIE1 A 1 16:139:43200 m 2 -5.01478120268742e+06 9.03997e-04
3 STAZ PIE1 A 1 16:139:43200 m 2 3.57544705283907e+06 9.32030e-04
4 STAX 7234 A 1 16:139:43200 m 2 -1.64095399142191e+06 9.06023e-04
5 STAY 7234 A 1 16:139:43200 m 2 -5.01481602343514e+06 7.15315e-04
6 STAZ 7234 A 1 16:139:43200 m 2 3.57541179031717e+06 9.78733e-04
-SOLUTION/ESTIMATE
+SOLUTION/MATRIX_ESTIMATE U COVA
1 1 9.20376707650880e-07 2.07620271541434e-08 7.26287814561936e-08
1 4 2.77989442316806e-07 3.36108831645191e-08 8.19318969226927e-08
2 2 8.17209744300323e-07 3.03785261102758e-08 3.61015789427474e-08
2 5 1.96542436495191e-07 2.82669615644369e-08
3 3 8.68680620905794e-07 6.24586819052541e-08 2.14337557711471e-08
3 6 2.38545257156616e-07
4 4 8.20877423198746e-07 1.85909835789488e-08 1.56946216763721e-07
5 5 5.11676185200101e-07 3.38287198820833e-08
6 6 9.57918161417759e-07
-SOLUTION/MATRIX_ESTIMATE U COVA
%ENDSNX