united states housing market outlook - bbva research
TRANSCRIPT

First Quarter
2016
Housing Market Outlook
United States
U.S. Housing Market Outlook
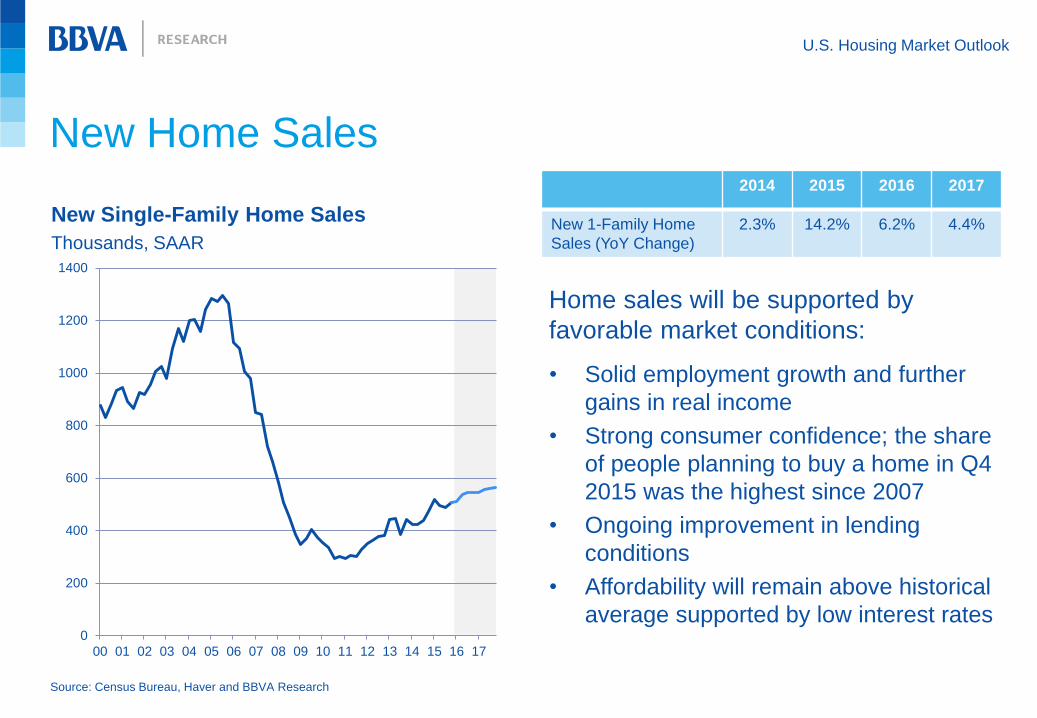
New Home Sales
Home sales will be supported by
favorable market conditions:
• Solid employment growth and further
gains in real income
• Strong consumer confidence; the share
of people planning to buy a home in Q4
2015 was the highest since 2007
• Ongoing improvement in lending
conditions
• Affordability will remain above historical
average supported by low interest rates
Source: Census Bureau, Haver and BBVA Research
New Single-Family Home Sales
Thousands, SAAR
2014 2015 2016 2017
New 1-Family Home
Sales (YoY Change)
2.3% 14.2% 6.2% 4.4%
0
200
400
600
800
1000
1200
1400
00 01 02 03 04 05 06 07 08 09 10 11 12 13 14 15 16 17
U.S. Housing Market Outlook
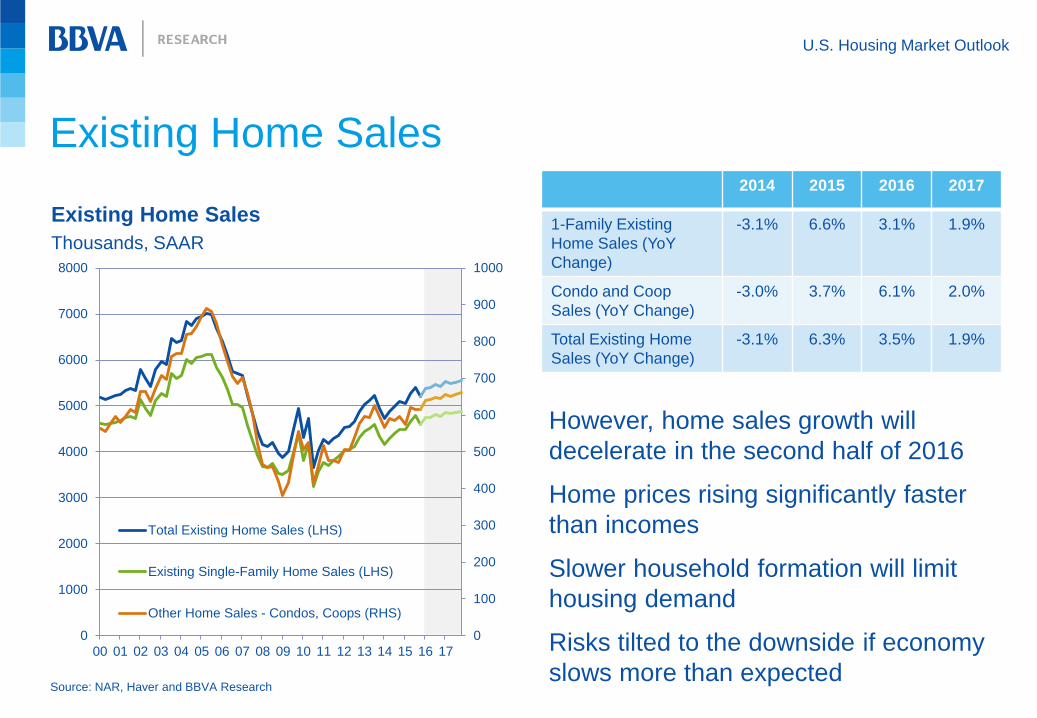
Existing Home Sales
Source: NAR, Haver and BBVA Research
However, home sales growth will
decelerate in the second half of 2016
Home prices rising significantly faster
than incomes
Slower household formation will limit
housing demand
Risks tilted to the downside if economy
slows more than expected
Existing Home Sales
Thousands, SAAR
2014 2015 2016 2017
1-Family Existing
Home Sales (YoY
Change)
-3.1% 6.6% 3.1% 1.9%
Condo and Coop
Sales (YoY Change)
-3.0% 3.7% 6.1% 2.0%
Total Existing Home
Sales (YoY Change)
-3.1% 6.3% 3.5% 1.9%
0
100
200
300
400
500
600
700
800
900
1000
0
1000
2000
3000
4000
5000
6000
7000
8000
00 01 02 03 04 05 06 07 08 09 10 11 12 13 14 15 16 17
Total Existing Home Sales (LHS)
Existing Single-Family Home Sales (LHS)
Other Home Sales - Condos, Coops (RHS)
U.S. Housing Market Outlook
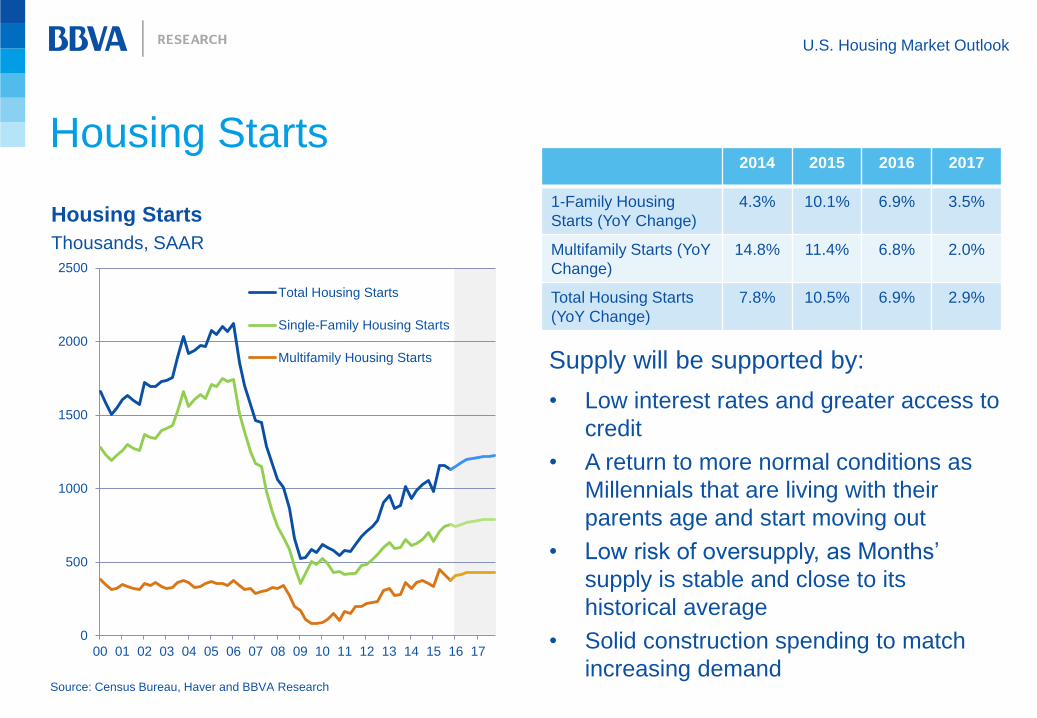
Housing Starts
Source: Census Bureau, Haver and BBVA Research
Supply will be supported by:
• Low interest rates and greater access to
credit
• A return to more normal conditions as
Millennials that are living with their
parents age and start moving out
• Low risk of oversupply, as Months’
supply is stable and close to its
historical average
• Solid construction spending to match
increasing demand
Housing Starts
Thousands, SAAR
2014 2015 2016 2017
1-Family Housing
Starts (YoY Change)
4.3%
10.1% 6.9% 3.5%
Multifamily Starts (YoY
Change)
14.8% 11.4% 6.8% 2.0%
Total Housing Starts
(YoY Change)
7.8% 10.5% 6.9% 2.9%
0
500
1000
1500
2000
2500
00 01 02 03 04 05 06 07 08 09 10 11 12 13 14 15 16 17
Total Housing Starts
Single-Family Housing Starts
Multifamily Housing Starts
U.S. Housing Market Outlook
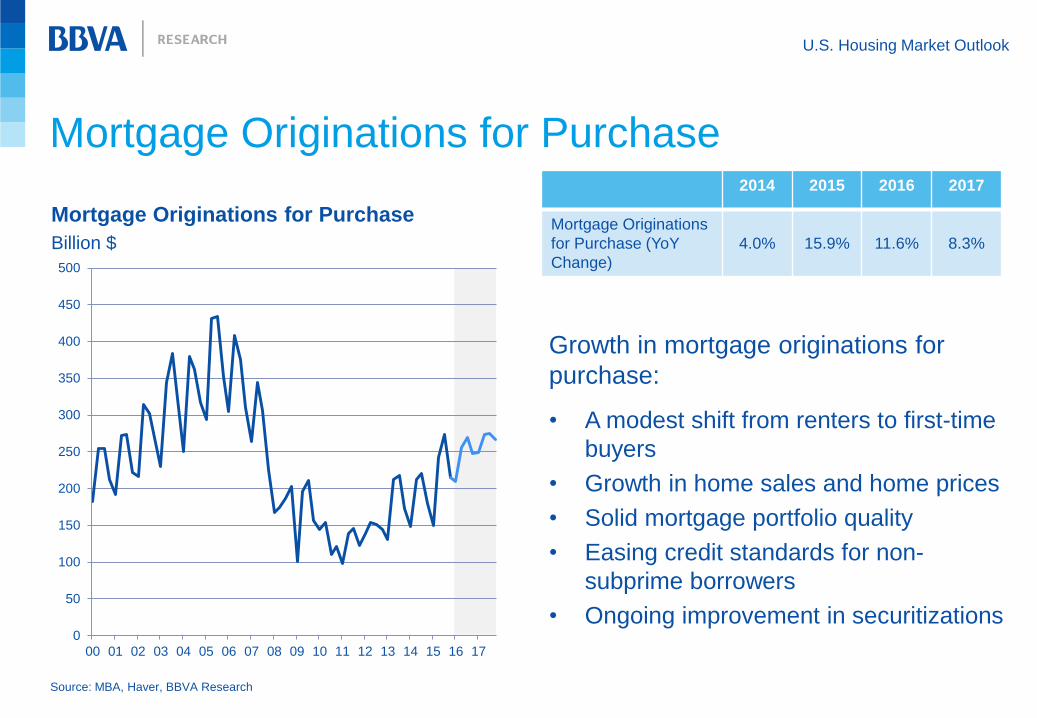
Mortgage Originations for Purchase
Source: MBA, Haver, BBVA Research
Growth in mortgage originations for
purchase:
• A modest shift from renters to first-time
buyers
• Growth in home sales and home prices
• Solid mortgage portfolio quality
• Easing credit standards for non-
subprime borrowers
• Ongoing improvement in securitizations
Mortgage Originations for Purchase
Billion $
2014 2015 2016 2017
Mortgage Originations
for Purchase (YoY
Change)
4.0% 15.9% 11.6% 8.3%
0
50
100
150
200
250
300
350
400
450
500
00 01 02 03 04 05 06 07 08 09 10 11 12 13 14 15 16 17
U.S. Housing Market Outlook
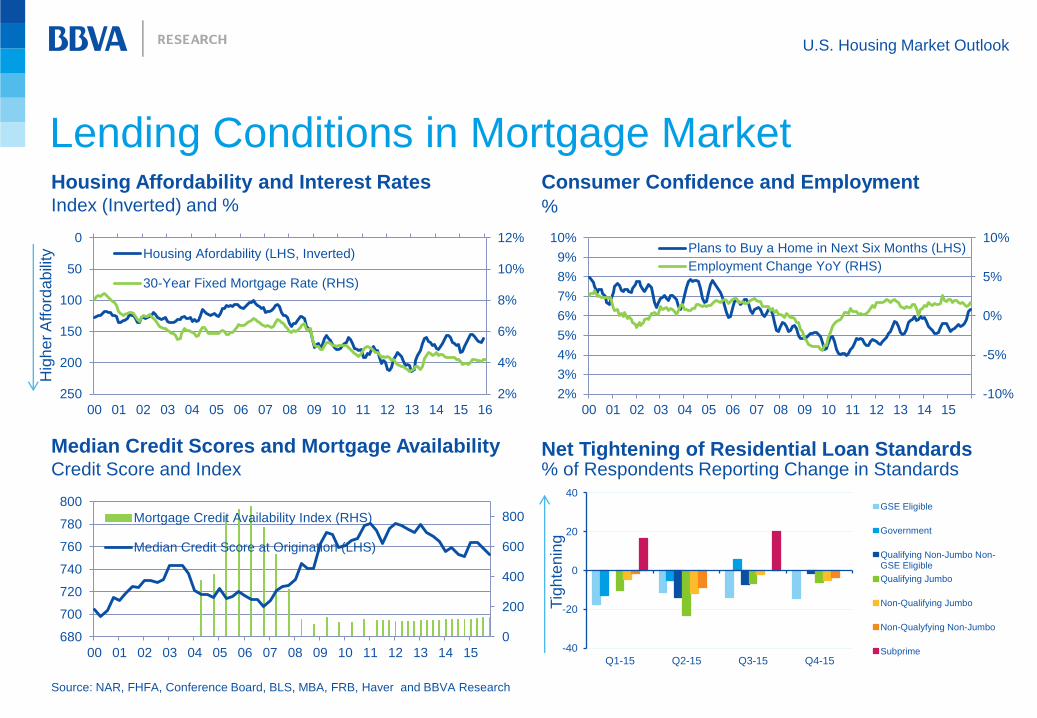
Housing Affordability and Interest Rates
Lending Conditions in Mortgage Market
Index (Inverted) and %
Net Tightening of Residential Loan Standards % of Respondents Reporting Change in Standards
Consumer Confidence and Employment
%
Median Credit Scores and Mortgage Availability
Source: NAR, FHFA, Conference Board, BLS, MBA, FRB, Haver and BBVA Research
Credit Score and Index
0
200
400
600
800
680
700
720
740
760
780
800
00 01 02 03 04 05 06 07 08 09 10 11 12 13 14 15
Mortgage Credit Availability Index (RHS)
Median Credit Score at Origination (LHS)
2%
4%
6%
8%
10%
12%0
50
100
150
200
250
00 01 02 03 04 05 06 07 08 09 10 11 12 13 14 15 16
Housing Afordability (LHS, Inverted)
30-Year Fixed Mortgage Rate (RHS)
-10%
-5%
0%
5%
10%
2%
3%
4%
5%
6%
7%
8%
9%
10%
00 01 02 03 04 05 06 07 08 09 10 11 12 13 14 15
Plans to Buy a Home in Next Six Months (LHS)
Employment Change YoY (RHS)
Hig
he
r A
ffo
rdab
ility
-40
-20
0
20
40
Q1-15 Q2-15 Q3-15 Q4-15
GSE Eligible
Government
Qualifying Non-Jumbo Non-GSE Eligible
Qualifying Jumbo
Non-Qualifying Jumbo
Non-Qualyfying Non-Jumbo
Subprime
Tig
hte
nin
g
U.S. Housing Market Outlook
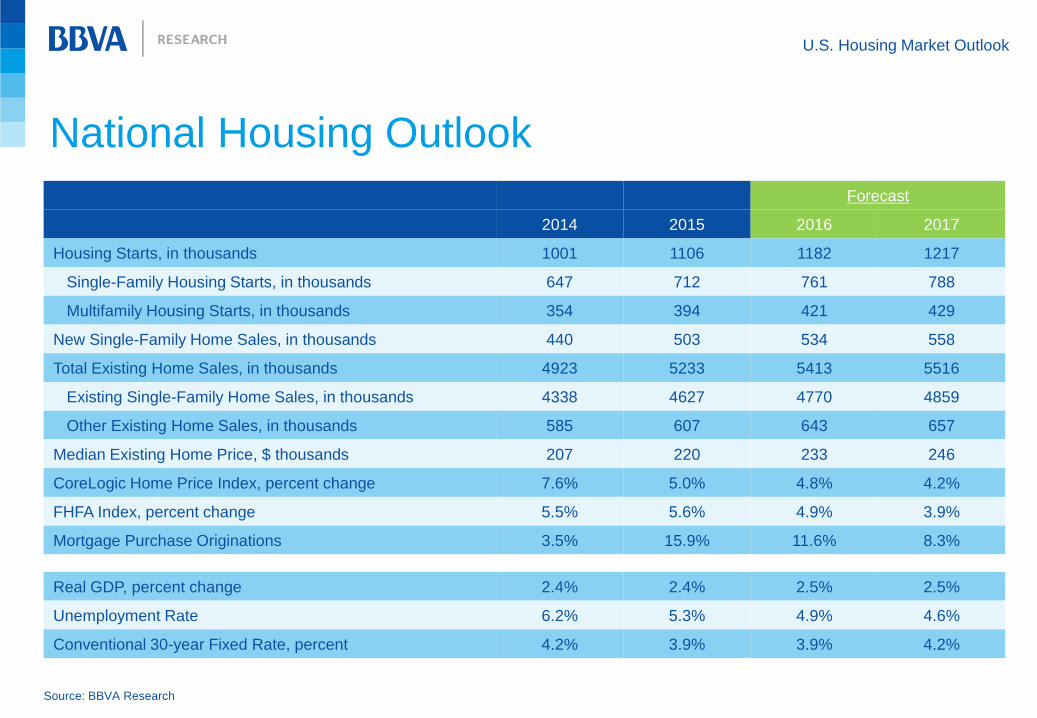
National Housing Outlook
Forecast
2014 2015 2016 2017
Housing Starts, in thousands 1001 1106 1182 1217
Single-Family Housing Starts, in thousands 647 712 761 788
Multifamily Housing Starts, in thousands 354 394 421 429
New Single-Family Home Sales, in thousands 440 503 534 558
Total Existing Home Sales, in thousands 4923 5233 5413 5516
Existing Single-Family Home Sales, in thousands 4338 4627 4770 4859
Other Existing Home Sales, in thousands 585 607 643 657
Median Existing Home Price, $ thousands 207 220 233 246
CoreLogic Home Price Index, percent change 7.6% 5.0% 4.8% 4.2%
FHFA Index, percent change 5.5% 5.6% 4.9% 3.9%
Mortgage Purchase Originations 3.5% 15.9% 11.6% 8.3%
Real GDP, percent change 2.4% 2.4% 2.5% 2.5%
Unemployment Rate 6.2% 5.3% 4.9% 4.6%
Conventional 30-year Fixed Rate, percent 4.2% 3.9% 3.9% 4.2%
Source: BBVA Research
U.S. Housing Market Outlook
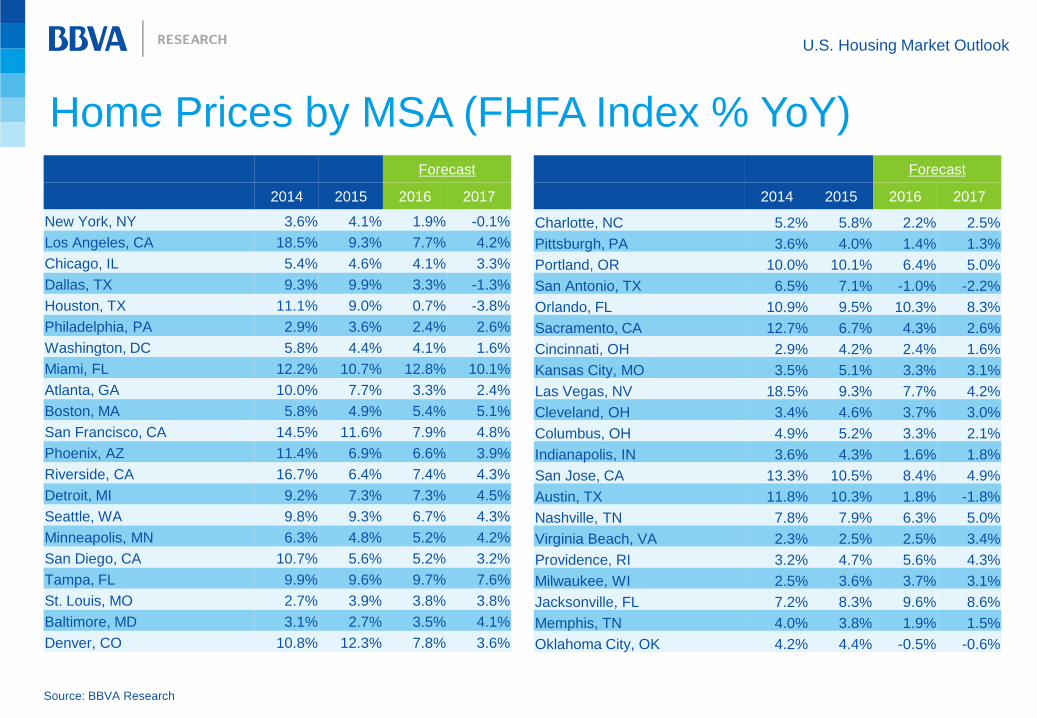
Home Prices by MSA (FHFA Index % YoY)
Source: BBVA Research
Forecast
2014 2015 2016 2017
New York, NY 3.6% 4.1% 1.9% -0.1%
Los Angeles, CA 18.5% 9.3% 7.7% 4.2%
Chicago, IL 5.4% 4.6% 4.1% 3.3%
Dallas, TX 9.3% 9.9% 3.3% -1.3%
Houston, TX 11.1% 9.0% 0.7% -3.8%
Philadelphia, PA 2.9% 3.6% 2.4% 2.6%
Washington, DC 5.8% 4.4% 4.1% 1.6%
Miami, FL 12.2% 10.7% 12.8% 10.1%
Atlanta, GA 10.0% 7.7% 3.3% 2.4%
Boston, MA 5.8% 4.9% 5.4% 5.1%
San Francisco, CA 14.5% 11.6% 7.9% 4.8%
Phoenix, AZ 11.4% 6.9% 6.6% 3.9%
Riverside, CA 16.7% 6.4% 7.4% 4.3%
Detroit, MI 9.2% 7.3% 7.3% 4.5%
Seattle, WA 9.8% 9.3% 6.7% 4.3%
Minneapolis, MN 6.3% 4.8% 5.2% 4.2%
San Diego, CA 10.7% 5.6% 5.2% 3.2%
Tampa, FL 9.9% 9.6% 9.7% 7.6%
St. Louis, MO 2.7% 3.9% 3.8% 3.8%
Baltimore, MD 3.1% 2.7% 3.5% 4.1%
Denver, CO 10.8% 12.3% 7.8% 3.6%
Forecast
2014 2015 2016 2017
Charlotte, NC 5.2% 5.8% 2.2% 2.5%
Pittsburgh, PA 3.6% 4.0% 1.4% 1.3%
Portland, OR 10.0% 10.1% 6.4% 5.0%
San Antonio, TX 6.5% 7.1% -1.0% -2.2%
Orlando, FL 10.9% 9.5% 10.3% 8.3%
Sacramento, CA 12.7% 6.7% 4.3% 2.6%
Cincinnati, OH 2.9% 4.2% 2.4% 1.6%
Kansas City, MO 3.5% 5.1% 3.3% 3.1%
Las Vegas, NV 18.5% 9.3% 7.7% 4.2%
Cleveland, OH 3.4% 4.6% 3.7% 3.0%
Columbus, OH 4.9% 5.2% 3.3% 2.1%
Indianapolis, IN 3.6% 4.3% 1.6% 1.8%
San Jose, CA 13.3% 10.5% 8.4% 4.9%
Austin, TX 11.8% 10.3% 1.8% -1.8%
Nashville, TN 7.8% 7.9% 6.3% 5.0%
Virginia Beach, VA 2.3% 2.5% 2.5% 3.4%
Providence, RI 3.2% 4.7% 5.6% 4.3%
Milwaukee, WI 2.5% 3.6% 3.7% 3.1%
Jacksonville, FL 7.2% 8.3% 9.6% 8.6%
Memphis, TN 4.0% 3.8% 1.9% 1.5%
Oklahoma City, OK 4.2% 4.4% -0.5% -0.6%
U.S. Housing Market Outlook
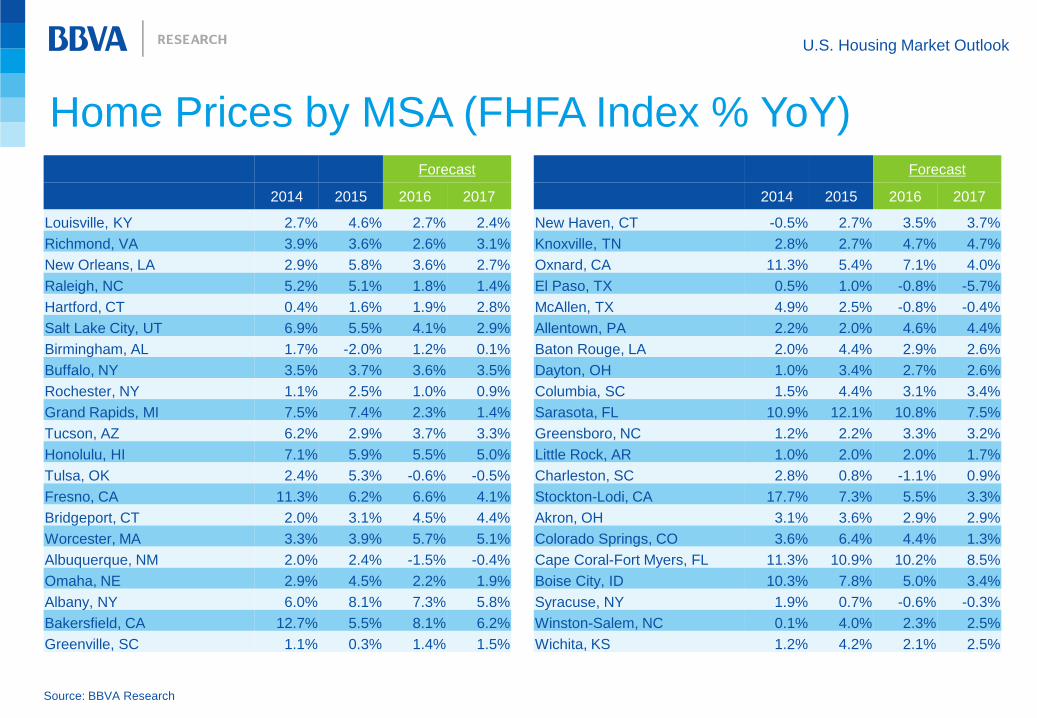
Home Prices by MSA (FHFA Index % YoY)
Source: BBVA Research
Forecast
2014 2015 2016 2017
Louisville, KY 2.7% 4.6% 2.7% 2.4%
Richmond, VA 3.9% 3.6% 2.6% 3.1%
New Orleans, LA 2.9% 5.8% 3.6% 2.7%
Raleigh, NC 5.2% 5.1% 1.8% 1.4%
Hartford, CT 0.4% 1.6% 1.9% 2.8%
Salt Lake City, UT 6.9% 5.5% 4.1% 2.9%
Birmingham, AL 1.7% -2.0% 1.2% 0.1%
Buffalo, NY 3.5% 3.7% 3.6% 3.5%
Rochester, NY 1.1% 2.5% 1.0% 0.9%
Grand Rapids, MI 7.5% 7.4% 2.3% 1.4%
Tucson, AZ 6.2% 2.9% 3.7% 3.3%
Honolulu, HI 7.1% 5.9% 5.5% 5.0%
Tulsa, OK 2.4% 5.3% -0.6% -0.5%
Fresno, CA 11.3% 6.2% 6.6% 4.1%
Bridgeport, CT 2.0% 3.1% 4.5% 4.4%
Worcester, MA 3.3% 3.9% 5.7% 5.1%
Albuquerque, NM 2.0% 2.4% -1.5% -0.4%
Omaha, NE 2.9% 4.5% 2.2% 1.9%
Albany, NY 6.0% 8.1% 7.3% 5.8%
Bakersfield, CA 12.7% 5.5% 8.1% 6.2%
Greenville, SC 1.1% 0.3% 1.4% 1.5%
Forecast
2014 2015 2016 2017
New Haven, CT -0.5% 2.7% 3.5% 3.7%
Knoxville, TN 2.8% 2.7% 4.7% 4.7%
Oxnard, CA 11.3% 5.4% 7.1% 4.0%
El Paso, TX 0.5% 1.0% -0.8% -5.7%
McAllen, TX 4.9% 2.5% -0.8% -0.4%
Allentown, PA 2.2% 2.0% 4.6% 4.4%
Baton Rouge, LA 2.0% 4.4% 2.9% 2.6%
Dayton, OH 1.0% 3.4% 2.7% 2.6%
Columbia, SC 1.5% 4.4% 3.1% 3.4%
Sarasota, FL 10.9% 12.1% 10.8% 7.5%
Greensboro, NC 1.2% 2.2% 3.3% 3.2%
Little Rock, AR 1.0% 2.0% 2.0% 1.7%
Charleston, SC 2.8% 0.8% -1.1% 0.9%
Stockton-Lodi, CA 17.7% 7.3% 5.5% 3.3%
Akron, OH 3.1% 3.6% 2.9% 2.9%
Colorado Springs, CO 3.6% 6.4% 4.4% 1.3%
Cape Coral-Fort Myers, FL 11.3% 10.9% 10.2% 8.5%
Boise City, ID 10.3% 7.8% 5.0% 3.4%
Syracuse, NY 1.9% 0.7% -0.6% -0.3%
Winston-Salem, NC 0.1% 4.0% 2.3% 2.5%
Wichita, KS 1.2% 4.2% 2.1% 2.5%
U.S. Housing Market Outlook
Home Prices by MSA (FHFA Index % YoY)
Source: BBVA Research
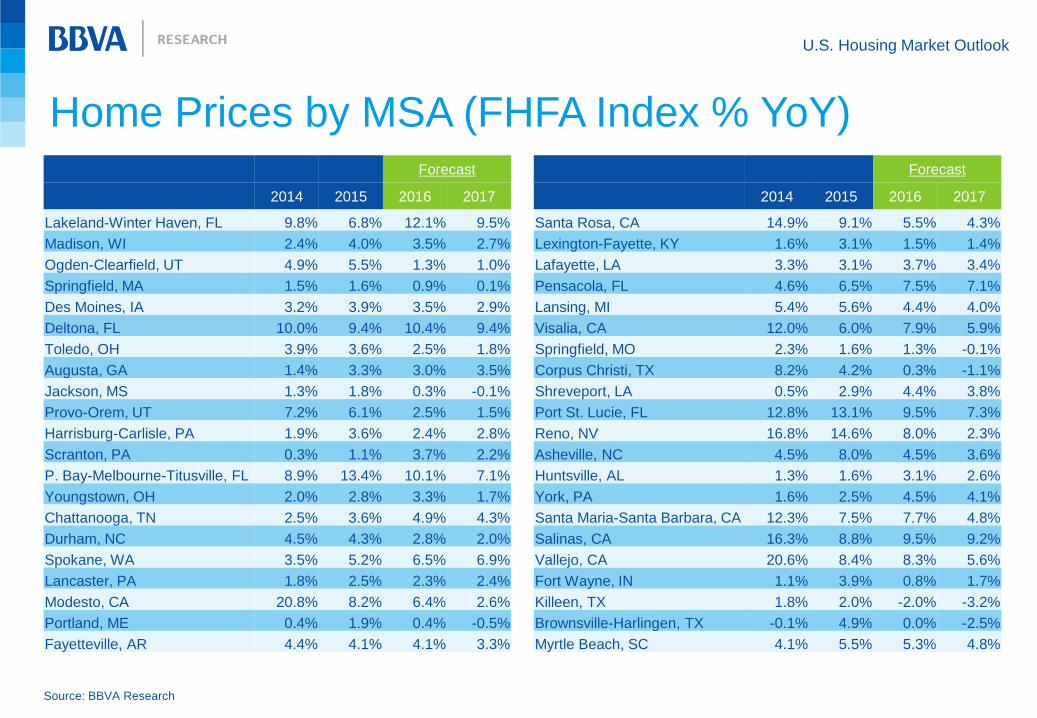
Forecast
2014 2015 2016 2017
Lakeland-Winter Haven, FL 9.8% 6.8% 12.1% 9.5%
Madison, WI 2.4% 4.0% 3.5% 2.7%
Ogden-Clearfield, UT 4.9% 5.5% 1.3% 1.0%
Springfield, MA 1.5% 1.6% 0.9% 0.1%
Des Moines, IA 3.2% 3.9% 3.5% 2.9%
Deltona, FL 10.0% 9.4% 10.4% 9.4%
Toledo, OH 3.9% 3.6% 2.5% 1.8%
Augusta, GA 1.4% 3.3% 3.0% 3.5%
Jackson, MS 1.3% 1.8% 0.3% -0.1%
Provo-Orem, UT 7.2% 6.1% 2.5% 1.5%
Harrisburg-Carlisle, PA 1.9% 3.6% 2.4% 2.8%
Scranton, PA 0.3% 1.1% 3.7% 2.2%
P. Bay-Melbourne-Titusville, FL 8.9% 13.4% 10.1% 7.1%
Youngstown, OH 2.0% 2.8% 3.3% 1.7%
Chattanooga, TN 2.5% 3.6% 4.9% 4.3%
Durham, NC 4.5% 4.3% 2.8% 2.0%
Spokane, WA 3.5% 5.2% 6.5% 6.9%
Lancaster, PA 1.8% 2.5% 2.3% 2.4%
Modesto, CA 20.8% 8.2% 6.4% 2.6%
Portland, ME 0.4% 1.9% 0.4% -0.5%
Fayetteville, AR 4.4% 4.1% 4.1% 3.3%
Forecast
2014 2015 2016 2017
Santa Rosa, CA 14.9% 9.1% 5.5% 4.3%
Lexington-Fayette, KY 1.6% 3.1% 1.5% 1.4%
Lafayette, LA 3.3% 3.1% 3.7% 3.4%
Pensacola, FL 4.6% 6.5% 7.5% 7.1%
Lansing, MI 5.4% 5.6% 4.4% 4.0%
Visalia, CA 12.0% 6.0% 7.9% 5.9%
Springfield, MO 2.3% 1.6% 1.3% -0.1%
Corpus Christi, TX 8.2% 4.2% 0.3% -1.1%
Shreveport, LA 0.5% 2.9% 4.4% 3.8%
Port St. Lucie, FL 12.8% 13.1% 9.5% 7.3%
Reno, NV 16.8% 14.6% 8.0% 2.3%
Asheville, NC 4.5% 8.0% 4.5% 3.6%
Huntsville, AL 1.3% 1.6% 3.1% 2.6%
York, PA 1.6% 2.5% 4.5% 4.1%
Santa Maria-Santa Barbara, CA 12.3% 7.5% 7.7% 4.8%
Salinas, CA 16.3% 8.8% 9.5% 9.2%
Vallejo, CA 20.6% 8.4% 8.3% 5.6%
Fort Wayne, IN 1.1% 3.9% 0.8% 1.7%
Killeen, TX 1.8% 2.0% -2.0% -3.2%
Brownsville-Harlingen, TX -0.1% 4.9% 0.0% -2.5%
Myrtle Beach, SC 4.1% 5.5% 5.3% 4.8%
U.S. Housing Market Outlook
Home Prices by MSA (FHFA Index % YoY)
Source: BBVA Research
Forecast
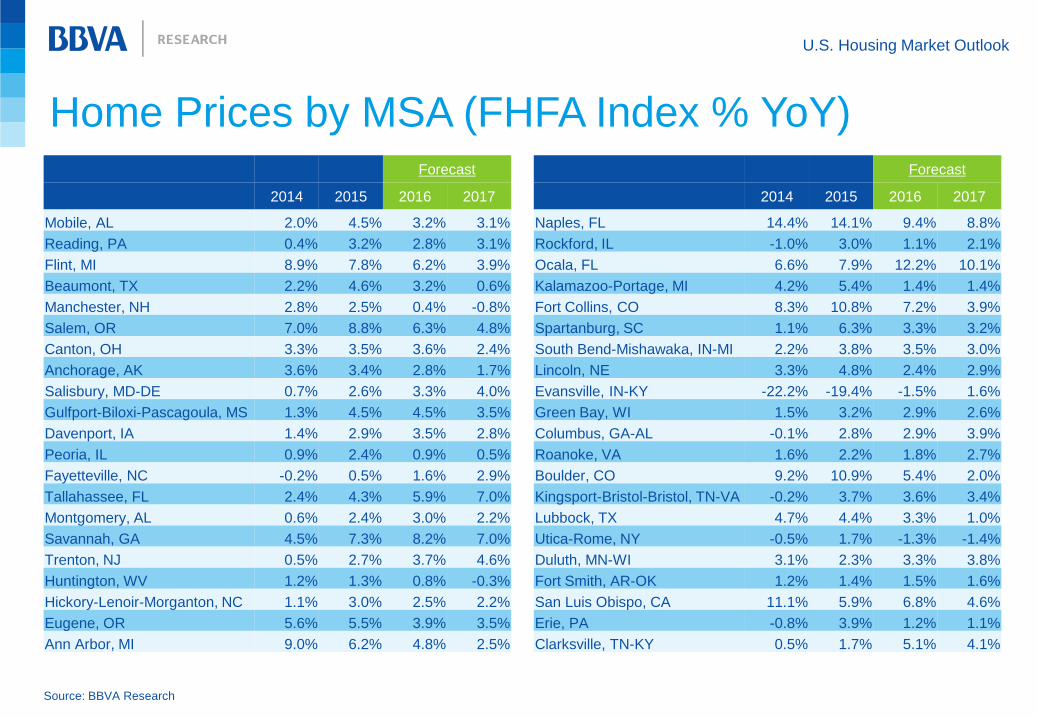
2014 2015 2016 2017
Mobile, AL 2.0% 4.5% 3.2% 3.1%
Reading, PA 0.4% 3.2% 2.8% 3.1%
Flint, MI 8.9% 7.8% 6.2% 3.9%
Beaumont, TX 2.2% 4.6% 3.2% 0.6%
Manchester, NH 2.8% 2.5% 0.4% -0.8%
Salem, OR 7.0% 8.8% 6.3% 4.8%
Canton, OH 3.3% 3.5% 3.6% 2.4%
Anchorage, AK 3.6% 3.4% 2.8% 1.7%
Salisbury, MD-DE 0.7% 2.6% 3.3% 4.0%
Gulfport-Biloxi-Pascagoula, MS 1.3% 4.5% 4.5% 3.5%
Davenport, IA 1.4% 2.9% 3.5% 2.8%
Peoria, IL 0.9% 2.4% 0.9% 0.5%
Fayetteville, NC -0.2% 0.5% 1.6% 2.9%
Tallahassee, FL 2.4% 4.3% 5.9% 7.0%
Montgomery, AL 0.6% 2.4% 3.0% 2.2%
Savannah, GA 4.5% 7.3% 8.2% 7.0%
Trenton, NJ 0.5% 2.7% 3.7% 4.6%
Huntington, WV 1.2% 1.3% 0.8% -0.3%
Hickory-Lenoir-Morganton, NC 1.1% 3.0% 2.5% 2.2%
Eugene, OR 5.6% 5.5% 3.9% 3.5%
Ann Arbor, MI 9.0% 6.2% 4.8% 2.5%
Forecast
2014 2015 2016 2017
Naples, FL 14.4% 14.1% 9.4% 8.8%
Rockford, IL -1.0% 3.0% 1.1% 2.1%
Ocala, FL 6.6% 7.9% 12.2% 10.1%
Kalamazoo-Portage, MI 4.2% 5.4% 1.4% 1.4%
Fort Collins, CO 8.3% 10.8% 7.2% 3.9%
Spartanburg, SC 1.1% 6.3% 3.3% 3.2%
South Bend-Mishawaka, IN-MI 2.2% 3.8% 3.5% 3.0%
Lincoln, NE 3.3% 4.8% 2.4% 2.9%
Evansville, IN-KY -22.2% -19.4% -1.5% 1.6%
Green Bay, WI 1.5% 3.2% 2.9% 2.6%
Columbus, GA-AL -0.1% 2.8% 2.9% 3.9%
Roanoke, VA 1.6% 2.2% 1.8% 2.7%
Boulder, CO 9.2% 10.9% 5.4% 2.0%
Kingsport-Bristol-Bristol, TN-VA -0.2% 3.7% 3.6% 3.4%
Lubbock, TX 4.7% 4.4% 3.3% 1.0%
Utica-Rome, NY -0.5% 1.7% -1.3% -1.4%
Duluth, MN-WI 3.1% 2.3% 3.3% 3.8%
Fort Smith, AR-OK 1.2% 1.4% 1.5% 1.6%
San Luis Obispo, CA 11.1% 5.9% 6.8% 4.6%
Erie, PA -0.8% 3.9% 1.2% 1.1%
Clarksville, TN-KY 0.5% 1.7% 5.1% 4.1%
U.S. Housing Market Outlook
Home Prices by MSA (FHFA Index % YoY)
Source: BBVA Research
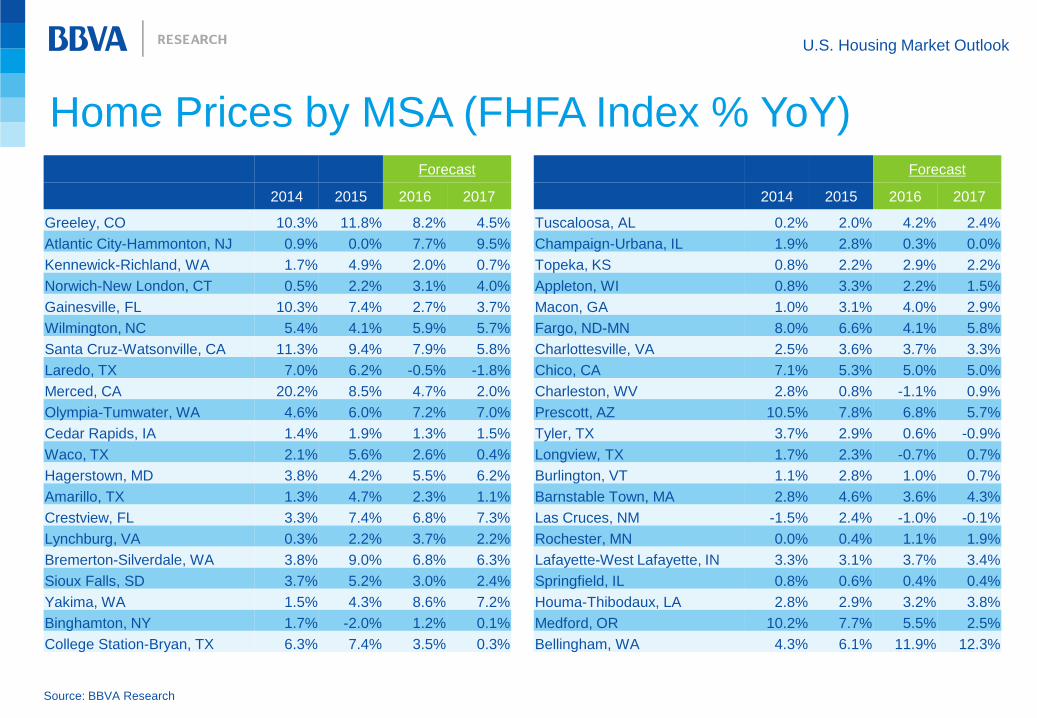
Forecast
2014 2015 2016 2017
Greeley, CO 10.3% 11.8% 8.2% 4.5%
Atlantic City-Hammonton, NJ 0.9% 0.0% 7.7% 9.5%
Kennewick-Richland, WA 1.7% 4.9% 2.0% 0.7%
Norwich-New London, CT 0.5% 2.2% 3.1% 4.0%
Gainesville, FL 10.3% 7.4% 2.7% 3.7%
Wilmington, NC 5.4% 4.1% 5.9% 5.7%
Santa Cruz-Watsonville, CA 11.3% 9.4% 7.9% 5.8%
Laredo, TX 7.0% 6.2% -0.5% -1.8%
Merced, CA 20.2% 8.5% 4.7% 2.0%
Olympia-Tumwater, WA 4.6% 6.0% 7.2% 7.0%
Cedar Rapids, IA 1.4% 1.9% 1.3% 1.5%
Waco, TX 2.1% 5.6% 2.6% 0.4%
Hagerstown, MD 3.8% 4.2% 5.5% 6.2%
Amarillo, TX 1.3% 4.7% 2.3% 1.1%
Crestview, FL 3.3% 7.4% 6.8% 7.3%
Lynchburg, VA 0.3% 2.2% 3.7% 2.2%
Bremerton-Silverdale, WA 3.8% 9.0% 6.8% 6.3%
Sioux Falls, SD 3.7% 5.2% 3.0% 2.4%
Yakima, WA 1.5% 4.3% 8.6% 7.2%
Binghamton, NY 1.7% -2.0% 1.2% 0.1%
College Station-Bryan, TX 6.3% 7.4% 3.5% 0.3%
Forecast
2014 2015 2016 2017
Tuscaloosa, AL 0.2% 2.0% 4.2% 2.4%
Champaign-Urbana, IL 1.9% 2.8% 0.3% 0.0%
Topeka, KS 0.8% 2.2% 2.9% 2.2%
Appleton, WI 0.8% 3.3% 2.2% 1.5%
Macon, GA 1.0% 3.1% 4.0% 2.9%
Fargo, ND-MN 8.0% 6.6% 4.1% 5.8%
Charlottesville, VA 2.5% 3.6% 3.7% 3.3%
Chico, CA 7.1% 5.3% 5.0% 5.0%
Charleston, WV 2.8% 0.8% -1.1% 0.9%
Prescott, AZ 10.5% 7.8% 6.8% 5.7%
Tyler, TX 3.7% 2.9% 0.6% -0.9%
Longview, TX 1.7% 2.3% -0.7% 0.7%
Burlington, VT 1.1% 2.8% 1.0% 0.7%
Barnstable Town, MA 2.8% 4.6% 3.6% 4.3%
Las Cruces, NM -1.5% 2.4% -1.0% -0.1%
Rochester, MN 0.0% 0.4% 1.1% 1.9%
Lafayette-West Lafayette, IN 3.3% 3.1% 3.7% 3.4%
Springfield, IL 0.8% 0.6% 0.4% 0.4%
Houma-Thibodaux, LA 2.8% 2.9% 3.2% 3.8%
Medford, OR 10.2% 7.7% 5.5% 2.5%
Bellingham, WA 4.3% 6.1% 11.9% 12.3%
U.S. Housing Market Outlook
Home Prices by MSA (FHFA Index % YoY)
Source: BBVA Research
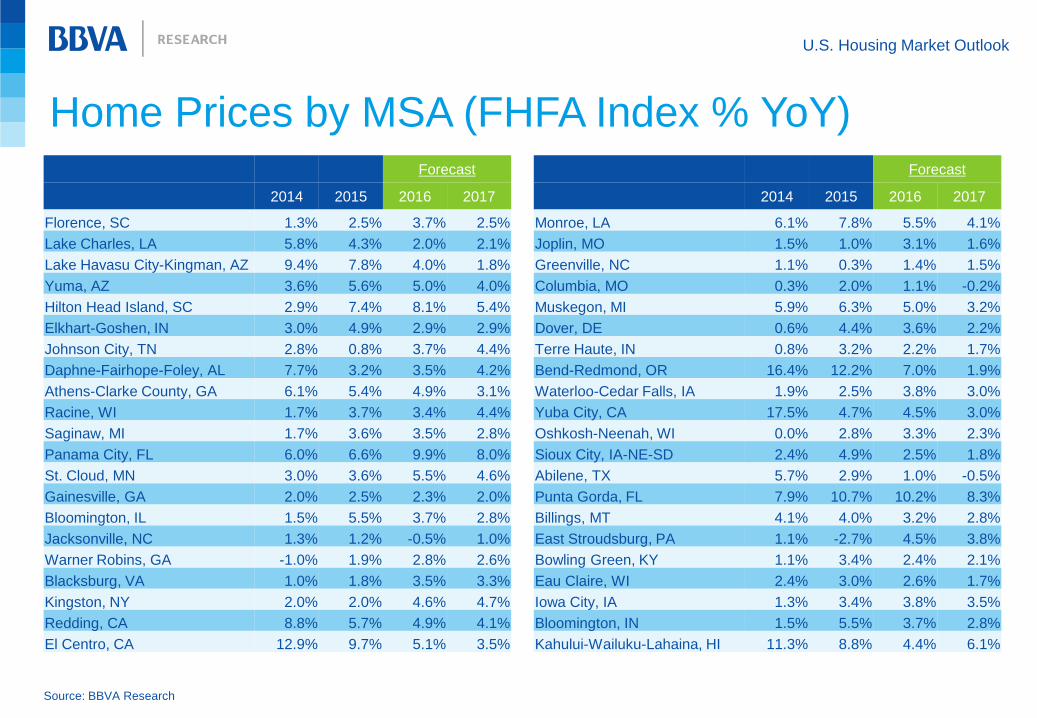
Forecast
2014 2015 2016 2017
Florence, SC 1.3% 2.5% 3.7% 2.5%
Lake Charles, LA 5.8% 4.3% 2.0% 2.1%
Lake Havasu City-Kingman, AZ 9.4% 7.8% 4.0% 1.8%
Yuma, AZ 3.6% 5.6% 5.0% 4.0%
Hilton Head Island, SC 2.9% 7.4% 8.1% 5.4%
Elkhart-Goshen, IN 3.0% 4.9% 2.9% 2.9%
Johnson City, TN 2.8% 0.8% 3.7% 4.4%
Daphne-Fairhope-Foley, AL 7.7% 3.2% 3.5% 4.2%
Athens-Clarke County, GA 6.1% 5.4% 4.9% 3.1%
Racine, WI 1.7% 3.7% 3.4% 4.4%
Saginaw, MI 1.7% 3.6% 3.5% 2.8%
Panama City, FL 6.0% 6.6% 9.9% 8.0%
St. Cloud, MN 3.0% 3.6% 5.5% 4.6%
Gainesville, GA 2.0% 2.5% 2.3% 2.0%
Bloomington, IL 1.5% 5.5% 3.7% 2.8%
Jacksonville, NC 1.3% 1.2% -0.5% 1.0%
Warner Robins, GA -1.0% 1.9% 2.8% 2.6%
Blacksburg, VA 1.0% 1.8% 3.5% 3.3%
Kingston, NY 2.0% 2.0% 4.6% 4.7%
Redding, CA 8.8% 5.7% 4.9% 4.1%
El Centro, CA 12.9% 9.7% 5.1% 3.5%
Forecast
2014 2015 2016 2017
Monroe, LA 6.1% 7.8% 5.5% 4.1%
Joplin, MO 1.5% 1.0% 3.1% 1.6%
Greenville, NC 1.1% 0.3% 1.4% 1.5%
Columbia, MO 0.3% 2.0% 1.1% -0.2%
Muskegon, MI 5.9% 6.3% 5.0% 3.2%
Dover, DE 0.6% 4.4% 3.6% 2.2%
Terre Haute, IN 0.8% 3.2% 2.2% 1.7%
Bend-Redmond, OR 16.4% 12.2% 7.0% 1.9%
Waterloo-Cedar Falls, IA 1.9% 2.5% 3.8% 3.0%
Yuba City, CA 17.5% 4.7% 4.5% 3.0%
Oshkosh-Neenah, WI 0.0% 2.8% 3.3% 2.3%
Sioux City, IA-NE-SD 2.4% 4.9% 2.5% 1.8%
Abilene, TX 5.7% 2.9% 1.0% -0.5%
Punta Gorda, FL 7.9% 10.7% 10.2% 8.3%
Billings, MT 4.1% 4.0% 3.2% 2.8%
East Stroudsburg, PA 1.1% -2.7% 4.5% 3.8%
Bowling Green, KY 1.1% 3.4% 2.4% 2.1%
Eau Claire, WI 2.4% 3.0% 2.6% 1.7%
Iowa City, IA 1.3% 3.4% 3.8% 3.5%
Bloomington, IN 1.5% 5.5% 3.7% 2.8%
Kahului-Wailuku-Lahaina, HI 11.3% 8.8% 4.4% 6.1%

U.S. Housing Market Outlook
Home Prices by MSA (FHFA Index % YoY)
Source: BBVA Research
Forecast
2014 2015 2016 2017
Pueblo, CO 3.1% 7.9% 5.9% 4.8%
Midland, TX 9.2% 1.7% 4.0% 0.8%
Janesville-Beloit, WI 1.6% 4.7% 4.5% 3.6%
Jackson, MI 1.4% 0.8% 0.4% 1.0%
State College, PA 1.6% 3.9% -0.2% 0.3%
Vineland-Bridgeton, NJ -1.8% 3.4% 6.2% 4.4%
Burlington, NC 1.1% 2.8% 1.0% 0.7%
Niles-Benton Harbor, MI 3.6% 3.9% 2.6% 2.7%
Albany, GA 0.1% -0.5% -0.4% 0.8%
Alexandria, LA 2.1% 2.6% 3.0% 2.2%
Madera, CA 15.1% 5.0% 7.2% 10.1%
Auburn-Opelika, AL 2.8% 2.4% 3.5% 2.9%
Odessa, TX 7.7% 4.5% 2.0% -0.2%
Bangor, ME 2.3% 0.0% 5.3% 3.5%
Decatur, AL 0.2% 3.0% 1.3% 0.7%
Chambersburg, PA 2.3% 2.0% 6.7% 5.1%
St. George, UT 8.4% 5.7% -1.4% -2.5%
Elizabethtown-Fort Knox, KY -0.3% 2.1% 2.8% 2.9%
Wichita Falls, TX 3.6% -0.8% 0.6% -1.4%
Jefferson City, MO -0.4% 2.6% 1.8% 1.6%
Hanford-Corcoran, CA 8.8% 5.0% 6.5% 6.1%
Forecast
2014 2015 2016 2017
Monroe, MI 6.1% 7.8% 5.5% 4.1%
Rocky Mount, NC 0.1% -0.8% 4.2% 3.0%
Texarkana, TX-AR 2.9% 2.6% 5.1% 3.0%
Hattiesburg, MS 1.1% 2.7% 1.8% 1.3%
Grand Junction, CO 1.9% 6.2% 6.5% 6.4%
Santa Fe, NM 1.0% 4.4% -1.0% -0.2%
Dothan, AL -0.2% 2.5% 3.9% 2.0%
Florence-Muscle Shoals, AL 2.6% 1.8% 1.6% 1.1%
Coeur d'Alene, ID 7.8% 7.3% 7.8% 5.4%
Wheeling, WV-OH 7.1% 4.0% -0.2% -0.6%
Sebastian-Vero Beach, FL 10.7% 11.4% 9.4% 8.7%
Rapid City, SD 3.0% 3.7% 3.9% 3.8%
Valdosta, GA -1.7% 4.2% 3.2% 3.1%
Dalton, GA 5.0% 1.5% 4.4% 4.8%
Napa, CA 15.3% 7.2% 7.2% 4.8%
Homosassa Springs, FL 3.1% 10.7% 14.8% 12.9%
Idaho Falls, ID 2.2% 4.4% 4.6% 4.3%
Johnstown, PA -0.4% 3.6% 1.8% 1.2%
Flagstaff, AZ 8.6% 7.9% 7.7% 6.4%
Morgantown, WV 2.5% 4.1% -1.4% -0.3%
La Crosse-Onalaska, WI-MN 2.5% 2.8% 2.7% 2.0%
U.S. Housing Market Outlook
Home Prices by MSA (FHFA Index % YoY)
Source: BBVA Research
Forecast
2014 2015 2016 2017
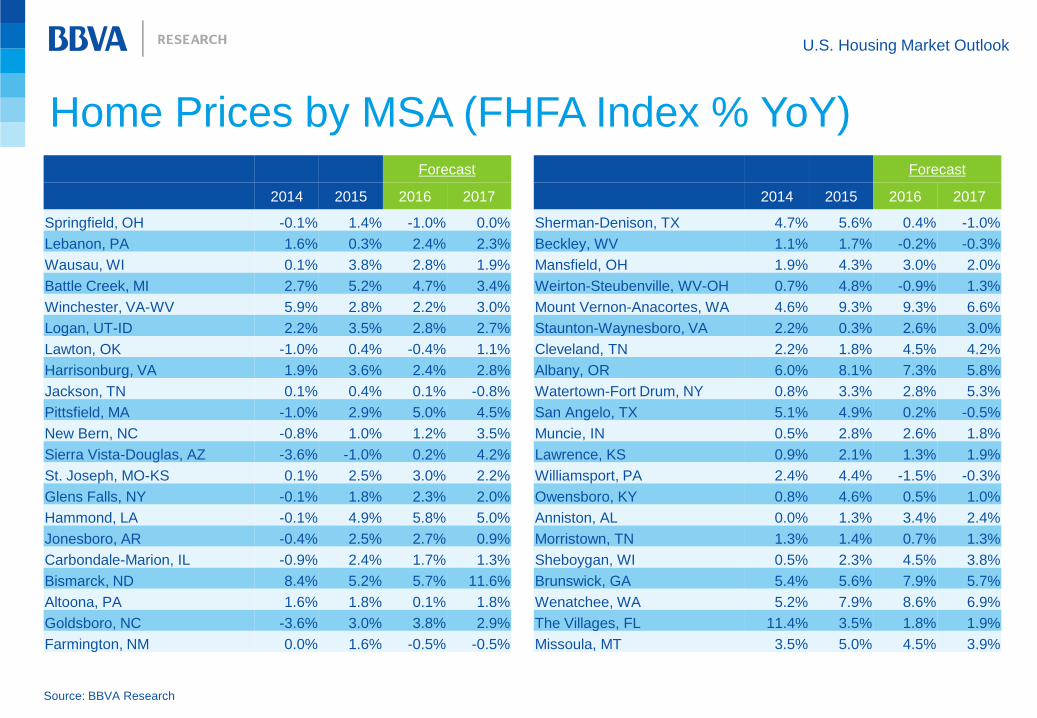
Springfield, OH -0.1% 1.4% -1.0% 0.0%
Lebanon, PA 1.6% 0.3% 2.4% 2.3%
Wausau, WI 0.1% 3.8% 2.8% 1.9%
Battle Creek, MI 2.7% 5.2% 4.7% 3.4%
Winchester, VA-WV 5.9% 2.8% 2.2% 3.0%
Logan, UT-ID 2.2% 3.5% 2.8% 2.7%
Lawton, OK -1.0% 0.4% -0.4% 1.1%
Harrisonburg, VA 1.9% 3.6% 2.4% 2.8%
Jackson, TN 0.1% 0.4% 0.1% -0.8%
Pittsfield, MA -1.0% 2.9% 5.0% 4.5%
New Bern, NC -0.8% 1.0% 1.2% 3.5%
Sierra Vista-Douglas, AZ -3.6% -1.0% 0.2% 4.2%
St. Joseph, MO-KS 0.1% 2.5% 3.0% 2.2%
Glens Falls, NY -0.1% 1.8% 2.3% 2.0%
Hammond, LA -0.1% 4.9% 5.8% 5.0%
Jonesboro, AR -0.4% 2.5% 2.7% 0.9%
Carbondale-Marion, IL -0.9% 2.4% 1.7% 1.3%
Bismarck, ND 8.4% 5.2% 5.7% 11.6%
Altoona, PA 1.6% 1.8% 0.1% 1.8%
Goldsboro, NC -3.6% 3.0% 3.8% 2.9%
Farmington, NM 0.0% 1.6% -0.5% -0.5%
Forecast
2014 2015 2016 2017
Sherman-Denison, TX 4.7% 5.6% 0.4% -1.0%
Beckley, WV 1.1% 1.7% -0.2% -0.3%
Mansfield, OH 1.9% 4.3% 3.0% 2.0%
Weirton-Steubenville, WV-OH 0.7% 4.8% -0.9% 1.3%
Mount Vernon-Anacortes, WA 4.6% 9.3% 9.3% 6.6%
Staunton-Waynesboro, VA 2.2% 0.3% 2.6% 3.0%
Cleveland, TN 2.2% 1.8% 4.5% 4.2%
Albany, OR 6.0% 8.1% 7.3% 5.8%
Watertown-Fort Drum, NY 0.8% 3.3% 2.8% 5.3%
San Angelo, TX 5.1% 4.9% 0.2% -0.5%
Muncie, IN 0.5% 2.8% 2.6% 1.8%
Lawrence, KS 0.9% 2.1% 1.3% 1.9%
Williamsport, PA 2.4% 4.4% -1.5% -0.3%
Owensboro, KY 0.8% 4.6% 0.5% 1.0%
Anniston, AL 0.0% 1.3% 3.4% 2.4%
Morristown, TN 1.3% 1.4% 0.7% 1.3%
Sheboygan, WI 0.5% 2.3% 4.5% 3.8%
Brunswick, GA 5.4% 5.6% 7.9% 5.7%
Wenatchee, WA 5.2% 7.9% 8.6% 6.9%
The Villages, FL 11.4% 3.5% 1.8% 1.9%
Missoula, MT 3.5% 5.0% 4.5% 3.9%
U.S. Housing Market Outlook
Home Prices by MSA (FHFA Index % YoY)
Source: BBVA Research
Forecast
2014 2015 2016 2017
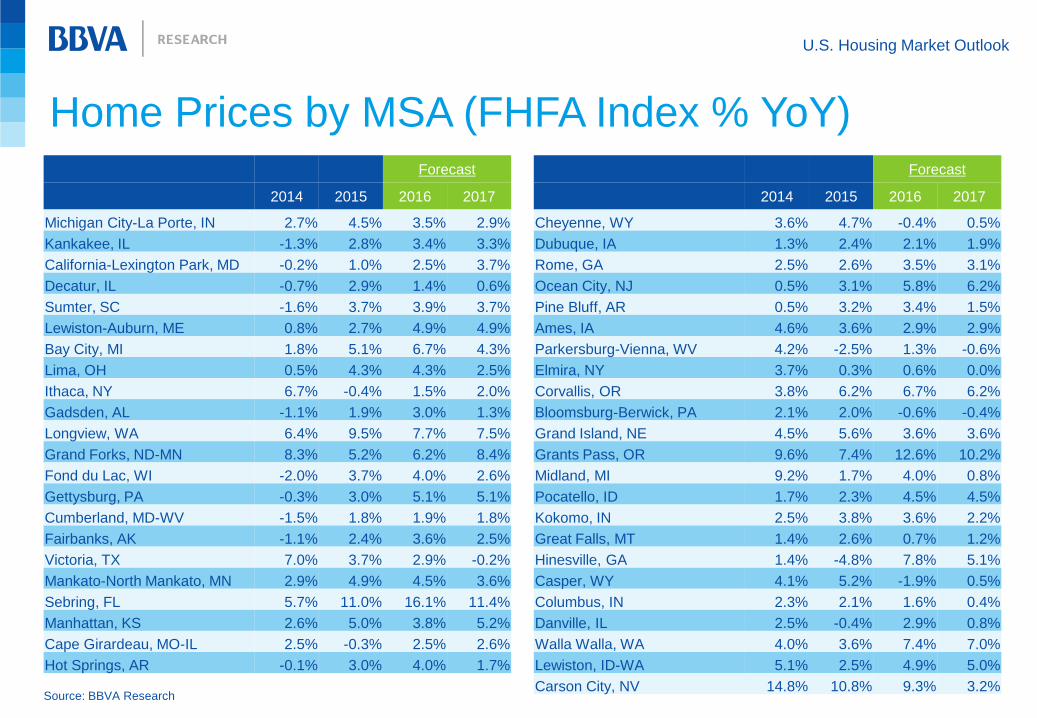
Michigan City-La Porte, IN 2.7% 4.5% 3.5% 2.9%
Kankakee, IL -1.3% 2.8% 3.4% 3.3%
California-Lexington Park, MD -0.2% 1.0% 2.5% 3.7%
Decatur, IL -0.7% 2.9% 1.4% 0.6%
Sumter, SC -1.6% 3.7% 3.9% 3.7%
Lewiston-Auburn, ME 0.8% 2.7% 4.9% 4.9%
Bay City, MI 1.8% 5.1% 6.7% 4.3%
Lima, OH 0.5% 4.3% 4.3% 2.5%
Ithaca, NY 6.7% -0.4% 1.5% 2.0%
Gadsden, AL -1.1% 1.9% 3.0% 1.3%
Longview, WA 6.4% 9.5% 7.7% 7.5%
Grand Forks, ND-MN 8.3% 5.2% 6.2% 8.4%
Fond du Lac, WI -2.0% 3.7% 4.0% 2.6%
Gettysburg, PA -0.3% 3.0% 5.1% 5.1%
Cumberland, MD-WV -1.5% 1.8% 1.9% 1.8%
Fairbanks, AK -1.1% 2.4% 3.6% 2.5%
Victoria, TX 7.0% 3.7% 2.9% -0.2%
Mankato-North Mankato, MN 2.9% 4.9% 4.5% 3.6%
Sebring, FL 5.7% 11.0% 16.1% 11.4%
Manhattan, KS 2.6% 5.0% 3.8% 5.2%
Cape Girardeau, MO-IL 2.5% -0.3% 2.5% 2.6%
Hot Springs, AR -0.1% 3.0% 4.0% 1.7%
Forecast
2014 2015 2016 2017
Cheyenne, WY 3.6% 4.7% -0.4% 0.5%
Dubuque, IA 1.3% 2.4% 2.1% 1.9%
Rome, GA 2.5% 2.6% 3.5% 3.1%
Ocean City, NJ 0.5% 3.1% 5.8% 6.2%
Pine Bluff, AR 0.5% 3.2% 3.4% 1.5%
Ames, IA 4.6% 3.6% 2.9% 2.9%
Parkersburg-Vienna, WV 4.2% -2.5% 1.3% -0.6%
Elmira, NY 3.7% 0.3% 0.6% 0.0%
Corvallis, OR 3.8% 6.2% 6.7% 6.2%
Bloomsburg-Berwick, PA 2.1% 2.0% -0.6% -0.4%
Grand Island, NE 4.5% 5.6% 3.6% 3.6%
Grants Pass, OR 9.6% 7.4% 12.6% 10.2%
Midland, MI 9.2% 1.7% 4.0% 0.8%
Pocatello, ID 1.7% 2.3% 4.5% 4.5%
Kokomo, IN 2.5% 3.8% 3.6% 2.2%
Great Falls, MT 1.4% 2.6% 0.7% 1.2%
Hinesville, GA 1.4% -4.8% 7.8% 5.1%
Casper, WY 4.1% 5.2% -1.9% 0.5%
Columbus, IN 2.3% 2.1% 1.6% 0.4%
Danville, IL 2.5% -0.4% 2.9% 0.8%
Walla Walla, WA 4.0% 3.6% 7.4% 7.0%
Lewiston, ID-WA 5.1% 2.5% 4.9% 5.0%
Carson City, NV 14.8% 10.8% 9.3% 3.2%

U.S. Housing Market Outlook
First Quarter
2016
Housing Market Outlook
United States