universidad de cantabria escuela de doctorado
TRANSCRIPT
UNIVERSIDAD DE CANTABRIA
ESCUELA DE DOCTORADO
Departamento de Ingenierías Química y Biomolecular
DESIGN OF HYBRID SEPARATION PROCESSES INCORPORATING MEMBRANE
TECHNOLOGIES
“Diseño de procesos híbridos de separación incorporando tecnologías de membrana”
Memoria de tesis doctoral presentada para optar al título de Doctor
por la Universidad de Cantabria
Programa de Doctorado en Ingeniería Química, de la Energía y de Procesos
(BOE núm. 16, de 19 de enero de 2015. RUCT: 5601000)
Adham Tilovovich Norkobilov
Director de tesis:
Prof. Eugenio Daniel Gorri Cirella
Santander, 2017


Acknowledgements
Foremost, I would like to express my sincere gratitude to my supervisor Dr. Daniel Gorri
for the continuous support of my doctoral study and research, for his patient guidance,
motivation, enthusiasm, and immense knowledge. His guidance helped me in all the time
of research and writing of this thesis. I have been extremely lucky to have a supervisor who
cared so much about my work, and who responded to my questions and queries so promptly.
Of course, I would also like to thank all the members of my department, Chemical and
Biomolecular Engineering Department. The University, staff, and students really made my
stay in Santander, one I will always remember and keep in my soul forever.
My sincere thanks also goes to Prof. Inmaculada Ortiz and Prof. Angel Irabien, for their
indispensable suggestions and advices during my study period at the University of
Cantabria (UC) (Spain). And also, my sincere gratitude to Raul Zarca and Dra. Clara Casado
for helping me to prepare pervaporation membranes.
Special thanks to the Advanced Separation Processes Research Group in the Chemical &
Biomolecular Department of the UC under the frame of the projects CTM2013-44081-R
(MINECO, Spain-FEDER 2014–2020) and CTQ2016-75158-R supported by the Spanish
Ministry of Economy and Competitiveness (MINECO). Special thanks to the
administration of EDUC and SILKROUTE Project (Erasmus Mundus Action 2
Programme) for giving such chance from doctoral study. Special thanks go to Gemma
Castro, Pablo Dias, Eugenio Bringas (UC) and Elisa Zambon (coordinator for the
SILKROUTE EM scholarship, UNIPD), for granting me that rare opportunity.
I would also like to thank all of professors from my home University (TCTI), for their
comments and wise advice during my study period both of at TCTI and UC.
I must express my gratitude to my wife and our kids, for their continued encouragement
and prays.
Lastly, thanks to my mother, brothers and sisters for all the moral support and the amazing
chances they have given me over the years. Without their support and blessings, none of
this would have been possible.


Dedicated to my family, my wife and our
kids


vii
Abstract
This doctoral thesis work is aimed to design new separation processes that result from
the integration of conventional operations (such as distillation) with other membrane
separation operations (such as pervaporation) leading to new hybrid processes that allow
the separation of complex mixtures (such as azeotropic mixtures) to achieve energy
savings compared to conventional processes with the consequent economic profit. The
research described in this thesis was carried out at the Advanced Separation Processes
Research Group in the Chemical & Biomolecular Department of the University of
Cantabria (Spain) under the frame of the projects CTM2013-44081-R (MINECO,
Spain-FEDER 2014–2020) and CTQ2016-75158-R supported by the Spanish Ministry
of Economy and Competitiveness (MINECO). Also, the PhD candidate has been
granted with a doctoral research fellowship from the SILKROUTE Project funded by
the European Commission through the Erasmus Mundus Action 2 Programme.
In order to achieve the proposed objectives, the ETBE production process has been
adopted as a case study, which is of great industrial importance and where energy costs
have a great impact on the final product price. Based on previous studies by the PAS
research group, experimental information on the separation process of ethanol/ETBE
mixtures was used to develop a new mathematical model that reliably describes the
pervaporation process using commercial membranes according to the operating
conditions. In the next stage this model together with the material and energy balance
equations were used to develop a user model in the Aspen Custom Modeler simulator.
After validation, this model was exported to the Aspen Plus environment, in order to be
able to implement in this simulation environment the different flowsheets that describe
the alternative hybrid processes that have been proposed. Thus, using tools such as the
Activated Energy Analysis, the energy consumptions of the different alternatives were
evaluated. To broaden the scope of this work, a comparative study with the production
viii
process based on reactive distillation was also included. Finally, we analyzed the options
of performing energy integration using the Aspen Energy Analyzer tool, proposing
different scenarios to generate the heat exchange networks.
Through the use of the different tools previously described, it has been possible to
simulate both the conventional ETBE production process and the two alternatives
proposed, i.e., the hybrid distillation/pervaporation process and the alternative based on
reactive distillation. Using sensitivity analysis tools, it has been possible to determine
the most appropriate operating conditions in each case. The energy analysis of the
different flowsheets has revealed the potential of energy integration to reduce energy
consumption. Finally, the economic analysis has shown the comparative advantages of
the scheme based on a hybrid process, which would be applicable to new production
plants as well as to do a revamping of existing facilities based on the conventional
process.
ix
Resumen
El objetivo general de este trabajo ha sido diseñar nuevos procesos de separación que
resulten de la integración de operaciones convencionales (como destilación) con otras
operaciones de separación con membranas (tales como pervaporación) que den como
resultado nuevos procesos híbridos que permitan llevar a cabo la separación de mezclas
complejas (tales como mezclas azeotrópicas) consiguiendo un ahorro energético
respecto a los procesos convencionales con el consiguiente beneficio económico. La
investigación descrita en esta tesis fue desarrollada en el grupo de investigación
Procesos Avanzados de Separación, en el Departamento de Ingenierías Química y
Biomolecular de la Universidad de Cantabria, en el marco de los proyectos CTM2013-
44081-R (MINECO, Spain-FEDER 2014–2020) y CTQ2016-75158-R, financiados por
el Ministerio de Economía y Competitividad (MINECO). También el candidato a
doctor, Adham Norkobilov, ha disfrutado de una beca para estudios de doctorado en el
marco del SILKROUTE Project, financiado por la Comisión Europea a través del
Erasmus Mundus Action 2 Programme.
Para alcanzar los objetivos planteados se ha adoptado como caso de estudio el proceso
de producción de ETBE, el cual reviste gran importancia industrial y donde los cotes
energéticos tienen una gran incidencia en precio final del producto. Basándose en
estudios previos por parte del grupo de investigación PAS, se utilizó información
experimental sobre el proceso de separación de mezclas etanol/ETBE para desarrollar
un nuevo modelo matemático que describe de forma fiable el proceso de pervaporación
mediante membranas comerciales en función de las condiciones de operación. En la
siguiente etapa este modelo junto con las ecuaciones de balances de materia y energía
se emplearon para desarrollar un modelo de usuario en el simulador Aspen Custom
Modeler. Luego de validarlo, este modelo fue exportado al entorno de Aspen Plus, para
así poder implementar en este ambiente de simulación los diferentes flowsheets que

x
describen los procesos híbridos alternativos que se han propuesto. De esta forma,
mediante herramientas como el Activated Energy Analysis se evaluaron los consumos
energéticos de las diferentes alternativas. Para hacer más amplio el alcance de este
trabajo, también se incluyo un estudio comparativo con el proceso de producción basado
en la destilación reactiva. Finalmente, se analizó las opciones de llevar a cabo
integración energética haciendo uso de la herramienta Aspen Energy Analyzer,
planteando diferentes escenarios para generar las redes de intercambio de calor.
A través del uso de las diferentes herramientas descritas previamente se ha conseguido
simular tanto el proceso convencional de producción de ETBE como las dos alternativas
planteadas, es decir, el proceso híbrido destilación/pervaporación y la alternativa basada
en destilación reactiva. Usando herramientas de análisis de sensibilidad se ha logrado
determinar las condiciones de operación más adecuadas en cada caso. El análisis
energético de los diferentes flowsheets ha revelado el potencial de la integración
energética para disminuir los consumos energéticos. Finalmente, el análisis económico
ha mostrado las ventajas comparativas del esquema basado en un proceso híbrido, lo
cual sería aplicable tanto a nuevas plantas de producción como también para hacer un
revamping de instalaciones existentes basadas en el proceso convencional.
xi
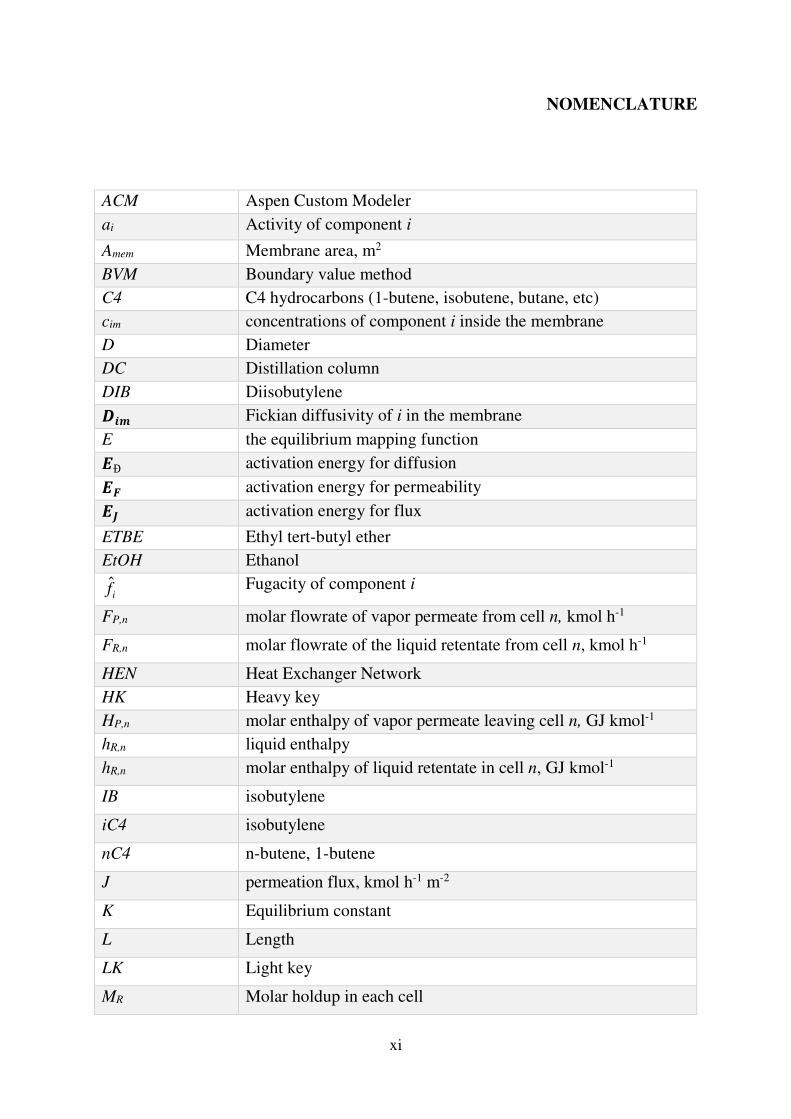
NOMENCLATURE
ACM Aspen Custom Modeler
ai Activity of component i
Amem Membrane area, m2
BVM Boundary value method
C4 C4 hydrocarbons (1-butene, isobutene, butane, etc)
cim concentrations of component i inside the membrane
D Diameter
DC Distillation column
DIB Diisobutylene
��� Fickian diffusivity of i in the membrane
E the equilibrium mapping function
�Рactivation energy for diffusion
�� activation energy for permeability
�� activation energy for flux
ETBE Ethyl tert-butyl ether
EtOH Ethanol
if̂ Fugacity of component i
FP,n molar flowrate of vapor permeate from cell n, kmol h-1
FR,n molar flowrate of the liquid retentate from cell n, kmol h-1
HEN Heat Exchanger Network
HK Heavy key
HP,n molar enthalpy of vapor permeate leaving cell n, GJ kmol-1
hR,n liquid enthalpy
hR,n molar enthalpy of liquid retentate in cell n, GJ kmol-1
IB isobutylene
iC4 isobutylene
nC4 n-butene, 1-butene
J permeation flux, kmol h-1 m-2
K Equilibrium constant
L Length
LK Light key
MR Molar holdup in each cell

xii
MTBE Methyl tert-butyl ether
N Number of theoretical stages
P Pressure
pº Saturated vapor pressure
��� Vapor pressure of pure i at temperature T(K)
PSD Pressure-swing distillation
PV Pervaporation
Qi Permeance of component i in the membrane
RD Reactive distillation
RLmin Minimum reflux ratio
RGmin Minimum reboil ratio
Rop Operational reflux ratio
S Maximum allowable stress
Sim Sorption coefficient or the solubility in the membrane
TAME Tert-amyl methyl ether
TBA Tertiary butyl alcohol
Tbp Boiling temperature of mixture (bubble-point)
Tdp
Condensation temperature of mixture (dew-point)
TCI Total capital investment
tw Thickness of the wall of a vessel
VLE Vapor-liquid equilibrium
x Liquid composition
y Vapor composition
ZP,n Permeate composition
ZR,n Retentate composition
α Separation coefficient
� Average relative volatility
��� Molar latent heat of vaporization
��� Enthalpy of adsorption
�� Partial pressure difference
��� Molar concentration gradient of component i over the
membrane
� Density
γ Activity coefficient

xiii
TABLE OF CONTENTS
Acknowledgements iii
Abstract | Resumen vii
Nomenclature xi
1 GENERAL INTRODUCTION 1
1.1. Background to the Research 2
1.2. Motivation and Research Objectives 6
1.3. Outline of the Thesis 8
References 9
2 INSIGHTS INTO THE SEPARATION OF AZEOTROPIC MIXTURES AND PRESENTATION OF THE CASE STUDY 11
2.1. Introduction 12
2.2. Separation of azeotropic mixtures 12
2.2.1. Thermodynamic basis 13
2.2.2. Ternary mixtures 16
2.2.3. Separation techniques for azeotropic mixtures 19
2.3. Principles and fundamentals of pervaporative separation of
liquid mixtures 22
2.3.1. Pervaporation: prospects of industrial applications 24
2.3.2. Modeling of pervaporation process 28
2.4. Membrane integrated hybrid process as a prospective
separation technique for azeotropic mixtures 31
2.5. On the production and uses of ethyl tert-butyl ether (ETBE) 33
2.5.1. Production of ETBE 36
2.5.2. Chemical reactions in the production of ETBE 37
References 39

xiv
3 ANALYSIS OF THE CONVENTIONAL PROCESS FOR THE PRODUCTION OF ETBE 47
3.1. Introduction 48
3.2. Simulation of reaction system 49
3.3. Simulation of debutanizer column 50
3.3.1. Shortcut methods for distillation column design 53
3.3.2. Distillation column design by boundary value approach 55
3.3.3. Rigorous methods for distillation calculations: RadFrac
method 57
3.3.4. Operating conditions for the debutanizer distillation
column 58
3.4. Ethanol recuperation system 61
3.5. Simulation results 63
3.6. Heat integration 65
3.6.1. Synthesis of heat exchanger networks (HENs) 65
3.6.2. Heat exchanger pinch diagram 66
References 71
4 MEMBRANE INTEGRATED HYBRID PROCESS FOR THE PRODUCTION OF ETBE 73
4.1. Introduction 74
4.2. Membranes for the separation of ether/alcohol containing
mixtures by pervaporation 74
4.3. Pervap 2256 membrane 79
4.4. PV and distillation hybrid process options for the ETBE
production 80
4.5. Modelling and simulation 82
4.5.1. Thermodynamic method 84
4.5.2. Modeling the reaction unit 84
4.5.3. Modeling of the debutanizer distillation column 85
4.5.4. Modeling mass transport in the pervaporation unit 85
4.6 Simulation results 91
4.7. Heat integration optimization for hybrid process 101
References 104

xv
5 REACTIVE DISTILLATION PROCESS FOR THE PRODUCTION OF ETBE 111
5.1. Introduction 112
5.2. Fundamentals of reactive distillation 113
5.2.1. Chemical equilibrium 113
5.2.2. Stoichiometric lines 114
5.3. Simulation of RD process for ETBE production 115
5.4. Thermodynamic equilibrium 118
5.5. Phase equilibrium 118
5.6. Pre-reactor and RD column 120
5.7. Effect of design parameters on RD column performance 120
5.8. Heat integration optimization for RD process 124
References 126
6 TECHNO-ECONOMIC ANALYSIS FOR THE
PRESSURE-SWING, REACTIVE DISTILLATION AND
PERVAPORATION INTEGRATED HYBRID PROCESS 129
6.1. Introduction 130
6.2. Equipment Sizing and Selection 131
6.3. Equipment costs for the PSD process 133
6.4. Equipment costs for the PV integrated hybrid process 136
6.5. Equipment costs for the RD process 138
6.6. Costing and project evaluation for ETBE production 139
6.7. Raw materials and energy analysis in the ETBE production 144
References 146
7 DISCUSSION AND CONCLUDING REMARKS 147
7.1. Modelling of membrane module 148
7.2. ETBE purification using a PV integrated hybrid process 149
7.3. Economic analysis 149
7.4. Environmental analysis in the ETBE production 150
References 152


- 1 -
CHAPTER 1 GENERAL INTRODUCTION
Chapter contents
1.1. Background to the research
1.2. Motivation and Research Objectives
1.3. Outline of the Thesis
References

- 2 -
1.1. Background to the Research
The current concerns about sustainability of fossil fuels, in addition to the legislation aimed at
reducing greenhouse gas emissions, have forced the industry to search for renewable fuels with
smaller carbon footprints to replace (either completely or partially) the conventional fuels
(Bardin et al., 2014). Oxygenate additives contain oxygen as part of their chemical structure
and are usually employed as gasoline additives. These additives increment the octane rating and
combustion quality and reduce the particulate emission and carbon monoxide production (Yee
et al., 2013). Tertiary alkyl ethers, such as methyl tert-butyl ether (MTBE) and ethyl tert-butyl
ether (ETBE), are commonly used as octane improvers for liquid fuels. As consequence of the
negative impacts that MTBE has on the environment (Donahue et al., 2002), ETBE has become
a popular alternative oxygenate additive for gasoline. In addition, it has higher heating value
and lower oxygen content than MTBE, lower water solubility and faster degradation in soils.
Figure 1.1. Process flow diagram for ETBE production by conventional pressure swing
process
ETBE is mainly produced by an etherification catalytic reaction followed by a purification
process by means of a distillation, consisting of consequent distillation columns with different
pressures to separation ETBE from ETBE/ethanol/hydrocarbon mixtures (Figure 1.1). In this
process, a hydrocarbon feed forms a mixture of mainly n-butene, isobutylene and ethanol feed
contains mainly ethanol and little amount of water. These are reacted in liquid phase over a
catalyst using consequent adiabatic and isothermal reactors and separated in distillation methods

- 3 -
(Streicher et al., 2009). The reaction product consists ETBE, inert n-butene, unreacted ethanol,
unreacted isobutylene, isobutylene dimerization and hydration products. This mixture fed to
debutanizer to separate hydrocarbon effluent as distillate, while bottom stream passed to second
distillation to obtain ETBE product as a target component. The second column separates the
ETBE product as a bottom product and ethanol containing mixture passed to third column as an
overhead product. The third column separates a high purity ethanol as a bottom product and
recycles to the reaction system, while the distillate stream of this column returns to the second
column.
The separation of ETBE and other products from the reaction products represents a large
amount of the energy costs for the ETBE plant.
In order to increase the thermodynamic efficiency of separation and decrease the energy
consumption of the distillation column, following approaches have been proposed (Humphrey
and Siebert, 1992):
- Improve the energy-efficiency of the distillation process.
- Completely replace the distillation technology.
- Augment the distillation technology with other separation technologies to form
efficient hybrid systems.
The first approach has been investigated in some depth (Recker et al., 2015). Heat integration
and complex column configurations have proven to be very successful in reducing the energy
requirements for conventional distillation arrangements. However, for the ETBE case study
these options are limited by the presence of azeotropes.
In the second method, an extractive distillation column can be used as alcohol removal unit
(Arias et al., 2001; Kochar et al., 1981). In this process, ETBE is recovered as the bottoms
product of the debutanizer distillation unit and the ethanol-rich C4 distillate is sent to the ethanol
recovery section (Figure 1.2). Water is used to extract the ethanol excess and recycle it back to
the process. At the top of the ethanol/water separation column, the ethanol/water azeotrope is
recycled to the reactor section; this is a major drawback of the conventional process because
water will react with butenes (in the catalytic reactor) to form tertiary butyl alcohol (TBA)
(Cunill et al., 1993). Thus, the use of wet ethanol results in decreased isobutene conversion and
ether product purity. Therefore, the use of pervaporation to selectively recover a significant
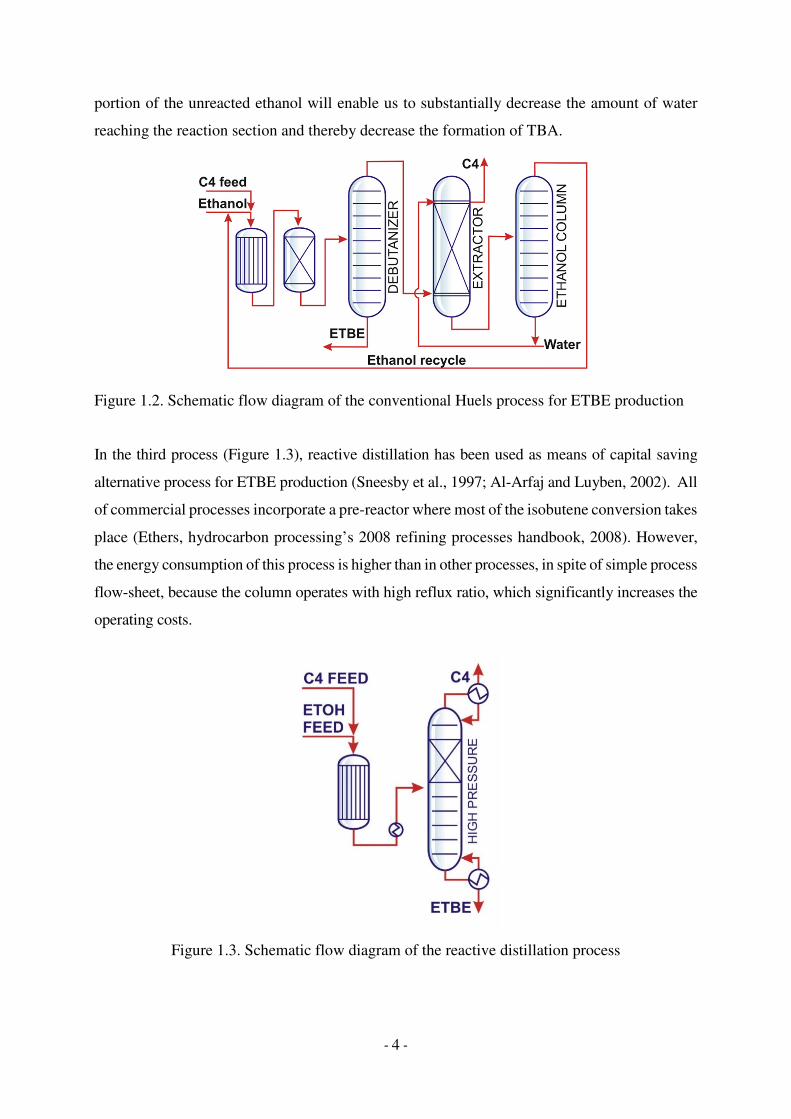
- 4 -
portion of the unreacted ethanol will enable us to substantially decrease the amount of water
reaching the reaction section and thereby decrease the formation of TBA.
Figure 1.2. Schematic flow diagram of the conventional Huels process for ETBE production
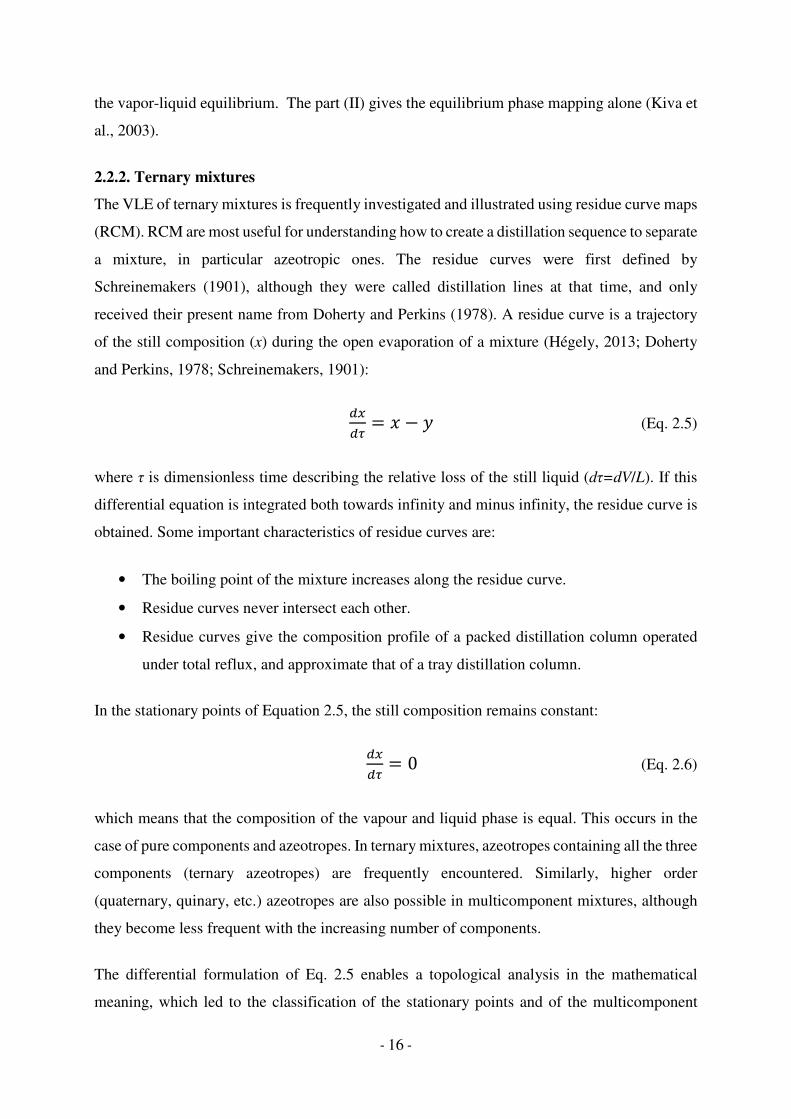
In the third process (Figure 1.3), reactive distillation has been used as means of capital saving
alternative process for ETBE production (Sneesby et al., 1997; Al-Arfaj and Luyben, 2002). All
of commercial processes incorporate a pre-reactor where most of the isobutene conversion takes
place (Ethers, hydrocarbon processing’s 2008 refining processes handbook, 2008). However,
the energy consumption of this process is higher than in other processes, in spite of simple process
flow-sheet, because the column operates with high reflux ratio, which significantly increases the
operating costs.
Figure 1.3. Schematic flow diagram of the reactive distillation process

- 5 -
A general comparison of these separation techniques is shown in Table 1.1.
A combination of distillation and membrane technologies could represent an alternative option.
Several limitations have been prevented from replacing sequential distillation processes with
membrane processes. Hybrid pervaporation distillation processes offer an opportunity to
exploit the characteristics of both technologies in an efficient way. A number of studies on
hybrid membrane-distillation applications in an ETBE plant have been highlighted by Lipnizki
et al., (1999) a n d González and Ortiz (2002) . Possible applications include alcohol
selective membranes for the pervaporation of alcohols from ether-alcohol mixtures (ethanol-
ETBE and methanol-MTBE). In such applications, hybrid membrane–distillation separation
systems, which are the main focus of this thesis, have been shown to improve product purity at
a reduced energy requirement.
Table 1.1. Comparison of separation processes in the ether production technologies
Technology Advantages Disadvantages References
Conventional pressure swing distillation
• Higher amount of
product recovery
• High purity
• Can operate at
high pressures
• A wide range of
flow rates can be
used
• High capital cost
• High energy
consumption
Recker et al., 2015
Streicher et al., 1995
Extractive distillation or Hüls process
• Separation
enhanced
• Easy operation
• High capital and
operating costs
• Limited solvent
selectivity/capacity
Kochar et al., 1982
Arias et al., 2001
Reactive distillation • Higher product
recovery
• High purity
• Simple process
• High energy
consumption
• Higher sensitivity
of reaction to
physical and
chemical
performances
Al Arfaj and Luyben,
2002;
Sneesby et al., 1997

- 6 -
1.2. Motivation and Research Objectives
The majority of published research on ETBE production hybrid processes focuses on ETBE-
ethanol separation. There are few studies on the influences of hydrocarbon fraction to
pervaporation. Hybrid membrane-distillation processes are not yet well established for
ETBE/ethanol/hydrocarbon separation due to the complexity of the experimental studies of
this multicomponent mixture. However, it is of great interest to verify whether a hybrid
system is economically attractive if a proper and stable membrane material is available.
Moreover, simulation based study for ETBE production is a useful method to calculation and
prediction of the process performance. In addition, research studies on hybrid systems for
ether-alcohol separations can provide insight into membrane development needs, as shown
recently by González and Ortiz (2002) and Alonso (2003). Therefore, this thesis explores the
potential advantages of membrane incorporated hybrid separation processes for ETBE
production.
The scope of this thesis is to systematically explore the performance of various hybrid
membrane-distillation schemes, as well as to generate conceptual process designs that could
help in deciding quickly whether an alternative flow-sheet is economically attractive. Most
of the published research carried out to date on the design of hybrid membrane-distillation
process seeks to identify the most cost – effective design option using previous design
experience and conventional design approaches (González and Ortiz, 2002; Roizard et al., 1998;
Verhoef et al., 2008). Hybrid flow-sheet design using conventional process simulation
software is computationally extensive for a complex column design (trial and error required)
and thus few alternative design options can be explored.
The major challenge in developing a systematic method for membrane combined hybrid
separation system design and optimisation comes from the following aspects:
- selecting a proper membrane modelling and solution procedure that is convenient for
carrying out process design and optimisation;
- adjusting shortcut methods for column design to provide more accurate predictions;
- a different type of design alternatives;
- complex compositions within the process flow-sheet;
- heat integration opportunities.

- 7 -
Existing hybrid membrane integrated process design and optimization methodologies
(González and Ortiz, 2001; Koczka et al., 2007; Koch et al., 2013, Verhoef et al., 2008) do
not consider the opportunity for heat integration. In low-temperature processes, there might
be a great opportunity to reduce the energy cost of the process by recovering heat between the
separation systems and between the refrigeration system and the separation systems. However,
heat integration makes the design more complex due to the requirement of a heat recovery
model and refrigeration design model in addition to the separation unit models. This research
aims to overcome some of the shortcoming of the previous work by developing a systematic
approach to model, evaluate and optimize hybrid membrane-distillation processes, while
taking into account heat recovery opportunities.
The objectives of this work are the following:
1. Establish models for all relevant unit operations. Develop a simple and robust membrane
model for multicomponent mixtures and different flow patterns. Adapt existing shortcut
models for distillation columns.
2. Develop a systematic design methodology for identifying technically and economically
attractive separation flow-sheets integrating membrane separations and distillation.
3. Develop a systematic approach to incorporate heat integration options during process
design.
4. Develop an optimization framework to find the optimum flow-sheet structure and
operating conditions to achieve the desired separation specifications. Important degrees of
freedom in design, including membrane types, membrane permeate pressures, fraction of
feed permeated or membrane area, side draw rate and column operating pressure will be
variables to be optimized.
5. Implement the optimization approaches in a suitable software environment.
6. Apply the design framework to different process alternatives for ETBE production
processes.
- 8 -
1.3. Outline of the Thesis
Chapter 1 describes a general background, the motivation and objectives of the research.
Chapter 2 then reviews general theory of azeotropic properties, thermodynamic basis, separation
of azeotropic mixtures, principles and fundamentals of pervaporative separation, the previously
published studies on hybrid Pervaporation-Distillation systems and existing approaches to
membrane and distillation modelling. In addition, literature on ETBE production processes is
also reviewed.
Chapter 3 reports pressure-swing distillation process calculations and simulation results for
ETBE production. The rigorous simulation of the process is performed and the effects of
operational parameters are studied.
Simulation of different PV-distillation hybrid processes and comparison of all processes in
terms of overall energy requirement is presented in Chapter 4.
Chapter 5 presents a generalized model of reactive distillation process as a combination and
extension of the models of Sneesby et al. (1997). The results are validated with the results
obtained by base reference using rigorous simulations.
Economic analysis and comparison of the conventional pressure-swing, membrane integrated
hybrid and reactive distillation processes including detailed sizing and designs of the equipment
are described in Chapter 6.
Finally, the general conclusions drawn from the study along with the contribution to research
is summarized in Chapter 7.

- 9 -
References
1. Ethers. Hydrocarbon processing’s 2008 Refining processes handbook. Gulf Publishing,
Houston, pp. 141-147 (2008).
2. Al-Arfaj MA, Luyben WL. Control study of ethyl tert-butyl ether reactive distillation. Ind
Eng Chem Res 41: 3784-3796 (2002).
3. Arias J, Moreira MT, Feijoo G. Simulación del proceso de síntesis del ETBE. Ingeniería
Química 385: 94-101 (2001).
4. Bardin ME, El-Dein Hussin AMTA, Gushchin PA, Vinokurov VA, Burluka AA. Technical
aspects of ethyl tert-butyl ether (ETBE) for large-scale use as gasoline improver. Energy
Technology 2: 194-204 (2014).
5. Cunill F, Vila M, Izquierdo JF, Iborra M, Tejero J. Effect of water presence on methyl tert-
butyl ether and ethyl tert-butyl ether liquid-phase syntheses. Ind Eng Chem Res 32: 564-569
(1993).
6. Donahue CJ, D'Amico T, Exline JA. Synthesis and characterization of a gasoline oxygenate,
ethyl tert-butyl ether. J Chem Educ 79: 724-726 (2002).
7. González B, Ortiz I. Modelling and simulation of a hybrid process (pervaporation-
distillation) for the separation of azeotropic mixtures of alcohol-ether. J Chem Technol
Biotechnol 77: 29-42 (2002).
8. Humphrey JL, Siebert AF. Separation technologies; an opportunity for energy
savings. Chemical Engineering Progress 88: 260-271 (1992).
9. Koch K, Sudhoff D, Kreiß S, Górak A, Kreis P. Optimisation-based design method for
membrane-assisted separation processes. Chem Eng Process: Process Intensif 67: 2-15 (2013).
10. Kochar NK, Bronx NY, Marcel RL, Bergenfield N.J., inventors; Process for gasoline
blending stocks. U.S. Patent No. 4,334,890 (1981).
11. Koczka K, Mizsey P, Fonyo Z. Rigorous modelling and optimization of hybrid separation
processes based on pervaporation. Cent Eur J Chem 5: 1124-1147 (2007).

- 10 -
12. Lipnizki F, Field RW, Ten P-. Pervaporation-based hybrid process: A review of process
design, applications and economics. J Membr Sci 153: 183-210 (1999).
13. Recker S, Skiborowski M, Redepenning C, Marquardt W. A unifying framework for
optimization-based design of integrated reaction–separation processes. Comput Chem Eng 81:
260-271 (2015).
14. Roizard D, Jonquières A, Léger C, Noezar I, Néel J. Design and preparation of highly
selective membranes for the separation of alcohol/ether mixtures by pervaporation. Afinidad 55:
422-432 (1998).
15. Sneesby MG, Tadé MO, Datta R, Smith TN. ETBE synthesis via reactive distillation. 1.
steady-state simulation and design aspects. Ind Eng Chem Res 36: 1855-1869 (1997).
16. Streicher C., Asselineau L., Forestiere A. Separation of alcohol/ether/hydrocarbon mixtures
in industrial etherification processes for gasoline production. Pure and Applied Chemistry 67:
985-992 (2009).
17. Verhoef A, Degrève J, Huybrechs B, van Veen H, Pex P, Van der Bruggen B. Simulation
of a hybrid pervaporation-distillation process. Comput Chem Eng 32: 1143-1154 (2008).
18. Yee KF, Mohamed AR, Tan SH. A review on the evolution of ethyl tert-butyl ether (ETBE)
and its future prospects. Renew Sust Energ Rev 22 :604-620 (2013).

- 11 -
CHAPTER 2 INSIGHTS INTO THE SEPARATION OF AZEOTROPIC MIXTURES AND PRESENTATION OF THE CASE STUDY
Chapter contents
2.1. Introduction
2.2. Separation of azeotropic mixtures
2.2.1. Thermodynamic basis
2.2.2. Ternary mixtures
2.2.3. Separation techniques for azeotropic mixtures
2.3. Principles and fundamentals of pervaporative separation of liquid mixtures
2.3.1. Pervaporation: prospects of industrial applications
2.3.2. Modeling of pervaporation process
2.4. Membrane integrated hybrid process as a prospective separation technique
for azeotropic mixtures
2.5. On the production and uses of ethyl tert-butyl ether (ETBE)
2.5.1. Production of ETBE
2.5.2. Chemical reactions in the production of ETBE
References

- 12 -
2.1. Introduction
The separation of azeotropic mixtures using conventional methods is still a challenging issue
in process design. The separation of close-boiling mixtures is extremely expensive in terms of
both capital and operating costs, especially in the case of refrigeration cooling requirements.
As introduced in Chapter 1, three approaches can be used to improve the thermodynamic
efficiency of the separation system. Among these, the combination of hybrid separation
methods (Pervaporation (PV)-distillation) has gained considerable attention recently. Various
studies have shown the economic advantages of implementing a hybrid PV-distillation system
for separating mixtures with low relative volatilities. This work will focus on ethanol/ETBE/C4
separation. In this chapter, general theories of azeotropic conditions, the separation techniques
of azeotropic mixtures, general principles and theories of PV process, relevant research on the
design and modeling of hybrid PV-distillation systems are reviewed and discussed.
2.2. Separation of azeotropic mixtures
The separation of liquid mixtures is an essential task in the industrial production. A lot of
research work have been carried out to develop processes to meet the requirements of the
industry. Among all of available liquid separation techniques, distillation is the most widely
used method for purifying liquids. Despite its widespread use, distillation consumes large
amounts of energy that are estimated to be as much as 30% of the industry’s overall energy use
and 90% to 95% of the total energy used for separation processes in chemical process industries
(Ognisty, 1995). Distillation is, however, limited in its use when the mixtures to be separated
exhibit complex phenomena. An example of these situations is when the mixtures exhibit
azeotropic behavior.
Azeotropes (from Greek a - prefix, meaning the negation or absence of any property, zéō- boil
and τρόπος -turn, change), liquid mixtures characterized by the equality of the compositions of
the equilibrium liquid and vapor phases. When they are distilled, a condensate of the same
composition as the stock solution is formed. The presence of azeotropic mixtures significantly
complicates the separation of liquid mixtures and requires the use of special separation methods.
Azeotropic mixtures can be found in both binary and multicomponent systems. Some
substances that inclined to the formation of azeotropic mixtures are representatives of a single
homologous series. In multicomponent systems, it is possible to observe the phenomena of
polyazeotropy, when homologues and their isomers from different series can form a large

- 13 -
number of binary and multicomponent azeotropic mixtures that span a wide concentration
interval (Mahdi et al., 2015).
2.2.1. Thermodynamic basis
The thermodynamic theory of equilibrium between a liquid and vapor makes it possible to
reveal the basic laws of phase equilibrium and to study the types of phase diagrams. In fact,
each type reflects the physico-chemical nature of the multicomponent mixture, which directly
affects the nature of the phase flow processes between liquid and vapor. The process of
distillation is based on phase transformations of liquid-vapor, but this process is multilateral,
and the connection of individual parts, especially in the case of azeotropic mixtures, is rather
complex and has been relatively little studied.
According to Kiva et al. (2003), the compositions of liquid and vapor in phase equilibrium are
defined by the vapor-liquid equilibrium condition that can be expressed as:
� = �(�, �, �) (Eq. 2.1)
where, x and y are the liquid and vapor composition vectors, and P and T are the system pressure
and temperature, respectively. P, T and x are not independent at the equilibrium state since:
∑ �� = 1 �!" (Eq. 2.2)
For example, T and y may be determined as a function of P and x. Thus, at isobaric conditions
the liquid composition x can be used as the independent variable:
� = #(�),� = �%&(�) = �'&(�) (Eq. 2.3)
or
� = ((�),� = �'&(�) = �%&(�) (Eq. 2.4)
where,
E - the equilibrium mapping function, that assigns a composition in the liquid phase to the
corresponding equilibrium vapor phase composition;

- 14 -
C=E-1 – the inverse equilibrium mapping function, that assigns a composition in the vapor
phase to the corresponding equilibrium liquid phase composition.
�%&-boiling temperature of mixture (bubble-point);
�'&-condensation temperature of mixture (dew-point);
y-vapor composition.
For any liquid composition x, there is a point (T, x) on the boiling temperature surface �%&(�) and a corresponding point (T, y) on the condensation (dew-point) temperature surface �'&(�) that are connected by an equilibrium vector, also called a vapor-liquid tie-line. The projection
of this equilibrium vector onto the composition space represents the equilibrium mapping
vector )*+++++,, that is the graph of the function # ∶ � → �. In this sense, the condensation
temperature surface �'&(�)is simply an equilibrium E-mapping of the boiling temperature
surface �%&(�). The two temperature surfaces merge at the points of pure components where
�� = �� = 1 for component i and �/ = �/ = 0 for all other components 1 ≠ 3.
According to Gibbs-Konovalov law formulated in the 1880s (Prigogine and Defay, 1954; Tester
and Modell, 1997) the existence of a singular point of the boiling temperature function
�%&(�)leads to a singular point of the condensation temperature function �'&(�). At the
singular points, the liquid and its equilibrium vapor compositions are equal and the temperature
surfaces are in contact. The existence of such singular points not connected to pure components
is called azeotropy, and the corresponding compositions where y=x are called azeotropes.
The existence of azeotropes complicates the shape of the boiling and condensation temperature
surfaces and the structure of the vapor-liquid envelope between them, and the equilibrium
mapping functions. The envelope of the equilibrium temperature surfaces defines the operating
region in T – x,y space in which any real distillation process must operate. This motivates a
more careful analysis of the VLE behavior. For the prediction of feasible separations upon
distillation of azeotropic mixtures we need a qualitative characterization of the VLE, preferable
a graphical representation.
The possibility of making a graphic representation of a VLE depends on the number of
components in the mixture. In a mixture of n components, the composition space is (n-1)-
dimensional because the sum of mole fractions must be equal to unity. For binary mixtures, the
composition space is one-dimensional (Kiva et al., 2003).

- 15 -
The types of binary azeotropes can be summarised in the following list:
1. Minimum boiling homogeneous azeotrope (e.g. ethanol – water)
2. Minimum boiling heteroazeotrope (e.g. benzene – water)
3. Minimum boiling homoazeotrope in a partially miscible system (e.g. tetrahydrofuran –
water)
4. Maximum boiling homoazeotrope (e.g. acetone – chloroform)
5. Maximum boiling homoazeotrope in a partially miscible system (e.g. hydrogen chloride –
water)
6. Double azeotrope (e.g. benzene – hexafluorobenzene)
Graphical representations of the VLE for the most common types of binary mixtures are
presented in Figure 2.1.
(I)
(II)
a) b) c)
Figure 2.1. The dew and boiling point curves and vapour – liquid equilibrium curves for (a)
minimum boiling homoazeotropic (b) maximum boiling homoazeotropic and (c)
heteroazeotropic mixtures.
The part (I) of this figure shows a combined graph of the boiling and condensation temperatures
and the vapor-liquid equilibrium phase mapping. This part gives a complete representation of
- 16 -
the vapor-liquid equilibrium. The part (II) gives the equilibrium phase mapping alone (Kiva et
al., 2003).
2.2.2. Ternary mixtures
The VLE of ternary mixtures is frequently investigated and illustrated using residue curve maps
(RCM). RCM are most useful for understanding how to create a distillation sequence to separate
a mixture, in particular azeotropic ones. The residue curves were first defined by
Schreinemakers (1901), although they were called distillation lines at that time, and only
received their present name from Doherty and Perkins (1978). A residue curve is a trajectory
of the still composition (x) during the open evaporation of a mixture (Hégely, 2013; Doherty
and Perkins, 1978; Schreinemakers, 1901):
'4'5 = � − � (Eq. 2.5)
where τ is dimensionless time describing the relative loss of the still liquid (dτ=dV/L). If this
differential equation is integrated both towards infinity and minus infinity, the residue curve is
obtained. Some important characteristics of residue curves are:
• The boiling point of the mixture increases along the residue curve.
• Residue curves never intersect each other.
• Residue curves give the composition profile of a packed distillation column operated
under total reflux, and approximate that of a tray distillation column.
In the stationary points of Equation 2.5, the still composition remains constant:
'4'5 = 0 (Eq. 2.6)
which means that the composition of the vapour and liquid phase is equal. This occurs in the
case of pure components and azeotropes. In ternary mixtures, azeotropes containing all the three
components (ternary azeotropes) are frequently encountered. Similarly, higher order
(quaternary, quinary, etc.) azeotropes are also possible in multicomponent mixtures, although
they become less frequent with the increasing number of components.
The differential formulation of Eq. 2.5 enables a topological analysis in the mathematical
meaning, which led to the classification of the stationary points and of the multicomponent
- 17 -
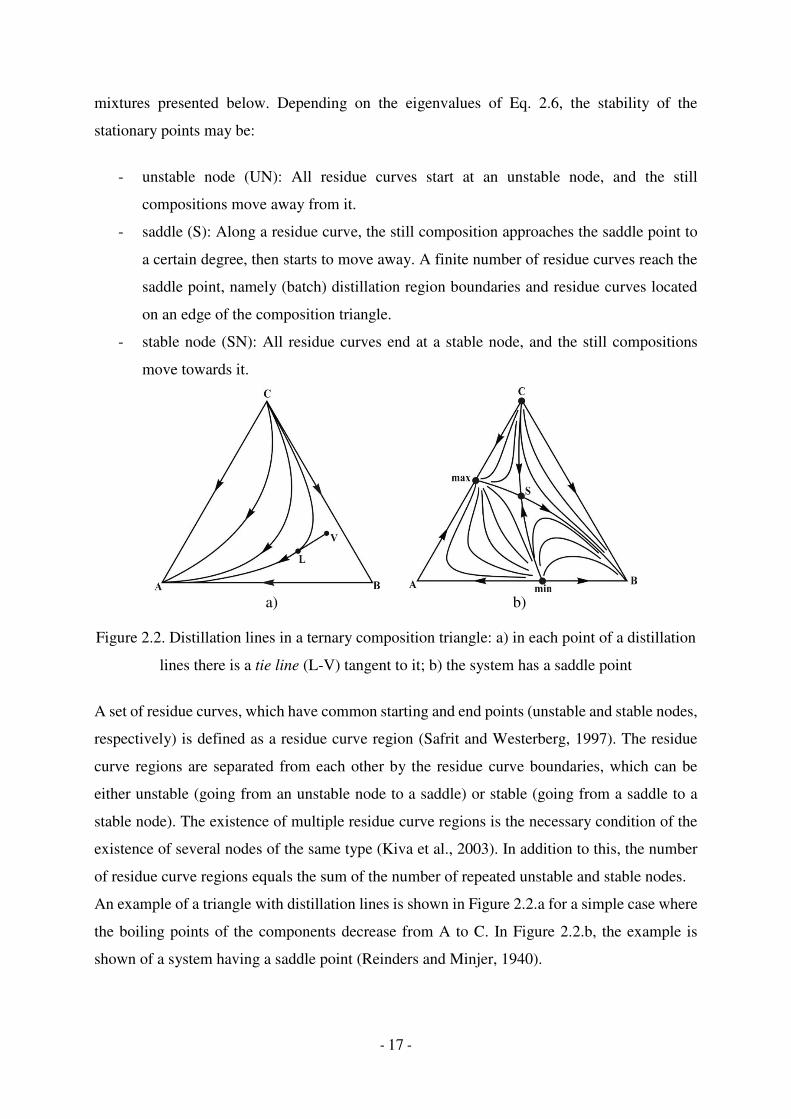
mixtures presented below. Depending on the eigenvalues of Eq. 2.6, the stability of the
stationary points may be:
- unstable node (UN): All residue curves start at an unstable node, and the still
compositions move away from it.
- saddle (S): Along a residue curve, the still composition approaches the saddle point to
a certain degree, then starts to move away. A finite number of residue curves reach the
saddle point, namely (batch) distillation region boundaries and residue curves located
on an edge of the composition triangle.
- stable node (SN): All residue curves end at a stable node, and the still compositions
move towards it.
a) b)
Figure 2.2. Distillation lines in a ternary composition triangle: a) in each point of a distillation
lines there is a tie line (L-V) tangent to it; b) the system has a saddle point
A set of residue curves, which have common starting and end points (unstable and stable nodes,
respectively) is defined as a residue curve region (Safrit and Westerberg, 1997). The residue
curve regions are separated from each other by the residue curve boundaries, which can be
either unstable (going from an unstable node to a saddle) or stable (going from a saddle to a
stable node). The existence of multiple residue curve regions is the necessary condition of the
existence of several nodes of the same type (Kiva et al., 2003). In addition to this, the number
of residue curve regions equals the sum of the number of repeated unstable and stable nodes.
An example of a triangle with distillation lines is shown in Figure 2.2.a for a simple case where
the boiling points of the components decrease from A to C. In Figure 2.2.b, the example is
shown of a system having a saddle point (Reinders and Minjer, 1940).

- 18 -
Figure 2.3. The Serafimov classes and their occurrence in Reshetov’s statistics (Hilmen et al.,
2002).
� - Unstable node; �- stable node; �- saddle point.

- 19 -
Serafimov classified in the early 1970s all the thermodynamically possible topological
structures of residue curve maps for ternary mixtures into 26 classes (Kiva et al., 2003; Hégely,
2013; Serafimov, 1996; Hilmen et al., 2002) presented in Figure 2.3, along with their
occurrence among known ternary mixtures. The first number represents the number of binary
azeotropes, the second number the number of ternary azeotropes, while the last one and the
letter distinguish different sub-cases. The Serafimov classes do not distinguish the so-called
antipodal structures, which are the exact opposite of each other. An antipodal structure can be
obtained by changing the stabilities of nodes (from unstable to stable and vice versa), and
reversing the directions of residue curves. The refined classification of Zharov and Serafimov
(1975) takes into account the antipodal structures, as well, and comprises of 49 types of residue
curve maps (ZS-types). Biazeotropy is not taken into account in these classifications (Zharov
and Serafimov, 1975).
2.2.3. Separation techniques for azeotropic mixtures
In the process industry close-boiling mixtures are often encountered, for example, because the
mixtures are composed of hydrocarbons having similar molecular structures. On the other hand,
the chemical industry, frequently deals with components of different types, which often produce
azeotropes. Common examples are the azeotropes between alcohol – water, alcohol – ether,
alcohol – hydrocarbon, ether – hydrocarbon compounds and many others.
Azeotropes occur because of nonideal phase equilibrium resulting from the molecular
interaction (either repulsion or attraction) of dissimilar chemical components. The emerging
biofuel processes typically have fermentation products that form azeotropes with the water,
which is present in large excess in the fermentor. The most important example is ethanol, which
forms a minimum-boiling homogeneous binary azeotrope with water. Butanol is another
biofuel example that forms an azeotrope with water. The nonideality in this system is so large
that the azeotrope is heterogeneous, forming two liquid phases. If among the molecules the
repulsive forces are predominant, the azeotrope will be minimum boiling and can be either
homogeneous or heterogeneous. If among the molecules the attractive forces are predominant,
the azeotrope will be maximum boiling. Since there are many types of azeotropes with a variety
of physical properties, there will be many ways to achieve separation. Homogeneous binary
azeotropes can be separated using several methods (Luyben and Chien, 2010):

- 20 -
1. Pressure-swing distillation: If the composition of the azeotrope changes significantly
with pressure, two columns operating at two different pressures (P1, P2) can achieve
separation (Figure 2.4). Pressure-swing distillation can be applied to both minimum
boiling and maximum-boiling homogeneous azeotropic mixtures. With minimum-
boiling systems, the distillate streams and in maximum-boiling systems, the bottoms
streams are recycled.
Generally, the amount of recycle depends on the composition of the initial mixtures fed
to the separation and the differences in the concentration of component A in the
azeotropes at the two selected pressures. Smaller difference may cause higher amount
of recycling (Luyben, 2012).
a) b)
Figure 2.4. Pressure-swing distillation process for the separation of a minimum boiling
azeotropic mixture: b. vapor-liquid equilibrium diagram, a. column sequence.
2. Homogeneous azeotropic distillation: A third component (E) called a light-entrainer is
added, which carries one of the components overhead in a distillation column.
Figure 2.5. Azeotropic distillation process
- 21 -
A two-column system is used. High-purity heavy and light products are produced from the
bottom of the first and the top of the second column, respectively (Figure 2.5). As separating
agents (entrainer), substances forming homoazeotropes with components A and B (these may
be azeotropes with a maximum or minimum of boiling points) or heteroazeotropes that are triple
mixtures of the separated components A and B with a light entrainer E can be used. In all cases,
one of components of the separated mixture in the azeotropic distillation column can be
obtained in a substantially pure form.
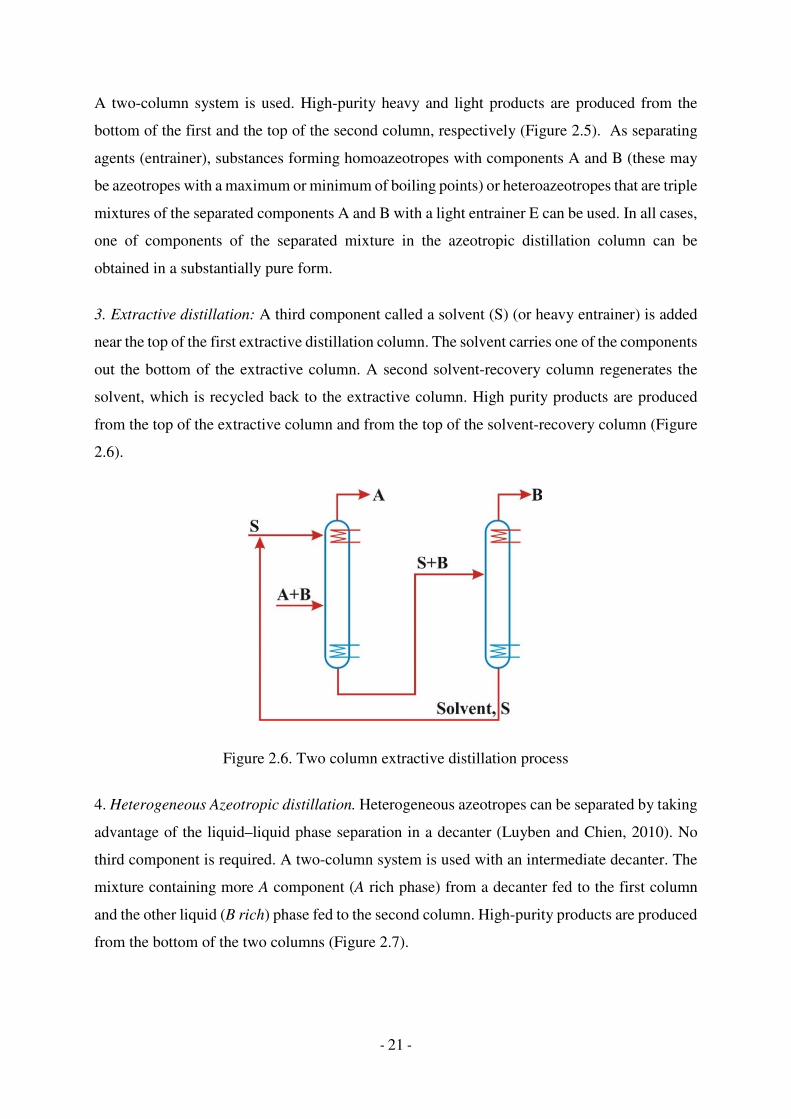
3. Extractive distillation: A third component called a solvent (S) (or heavy entrainer) is added
near the top of the first extractive distillation column. The solvent carries one of the components
out the bottom of the extractive column. A second solvent-recovery column regenerates the
solvent, which is recycled back to the extractive column. High purity products are produced
from the top of the extractive column and from the top of the solvent-recovery column (Figure
2.6).
Figure 2.6. Two column extractive distillation process
4. Heterogeneous Azeotropic distillation. Heterogeneous azeotropes can be separated by taking
advantage of the liquid–liquid phase separation in a decanter (Luyben and Chien, 2010). No
third component is required. A two-column system is used with an intermediate decanter. The
mixture containing more A component (A rich phase) from a decanter fed to the first column
and the other liquid (B rich) phase fed to the second column. High-purity products are produced
from the bottom of the two columns (Figure 2.7).

- 22 -
Figure 2.7. Process flow-sheet for heterogeneous azeotropes
Beyond the special distillation processes presented above, other methods exist, as well, for the
separation of azeotropic and closed-boiling mixtures. These include the pervaporation
integrated hybrid process, reactive distillation and adsorptive distillation, the first two of them
and conventional pressure-swing distillation processes for the production of ETBE will be
discussed in the next chapters.
2.3. Principles and fundamentals of pervaporative separation of liquid mixtures
Pervaporation through a membrane is a membrane process for separation of liquid solutions,
the driving force of which is the difference of chemical potentials. The process of separation is
carried out as follows: on one side of the membrane, the initial liquid mixture is contacted with
the selective surface of a dense membrane. Liquid mixture is kept in direct contact with the
surface of a membrane and the passed component is removed in the other side of the membrane
as a vapor. The concentrated initial mixture is called retentate, and the vapors passing through
the membrane are called permeates. Moreover, the key product can be both of retentate and
permeate. The principle of pervaporation separation is shown in Figure 2.8.
Figure 2.8. Schematic diagram of the separation of a liquid mixture using pervaporation
process
- 23 -
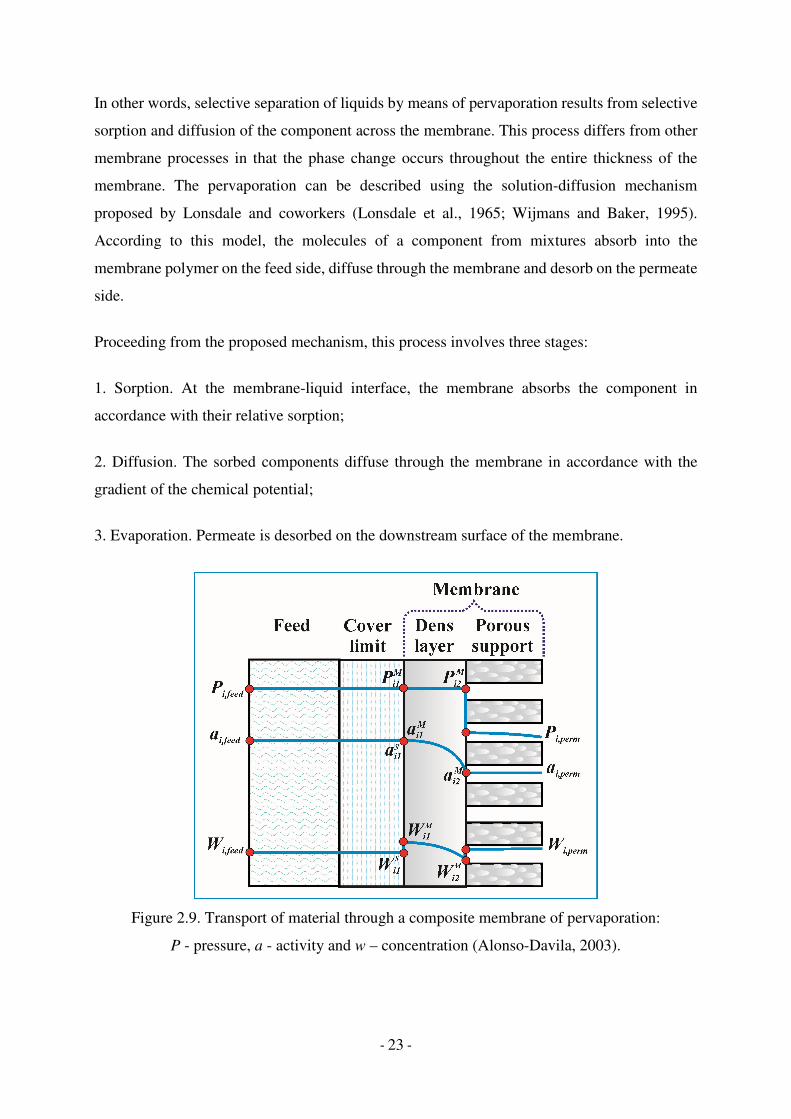
In other words, selective separation of liquids by means of pervaporation results from selective
sorption and diffusion of the component across the membrane. This process differs from other
membrane processes in that the phase change occurs throughout the entire thickness of the
membrane. The pervaporation can be described using the solution-diffusion mechanism
proposed by Lonsdale and coworkers (Lonsdale et al., 1965; Wijmans and Baker, 1995).
According to this model, the molecules of a component from mixtures absorb into the
membrane polymer on the feed side, diffuse through the membrane and desorb on the permeate
side.
Proceeding from the proposed mechanism, this process involves three stages:
1. Sorption. At the membrane-liquid interface, the membrane absorbs the component in
accordance with their relative sorption;
2. Diffusion. The sorbed components diffuse through the membrane in accordance with the
gradient of the chemical potential;
3. Evaporation. Permeate is desorbed on the downstream surface of the membrane.
Figure 2.9. Transport of material through a composite membrane of pervaporation:
P - pressure, a - activity and w – concentration (Alonso-Davila, 2003).

- 24 -
The schematic diagram of this process is illustrated in Figure 2.9. The transport of material in
each of these stages can be affected by the presence of other components in the feed, since the
coupling effect can be present, because the components besides interacting with the membrane
could also interact among them (Mulder and Smolders, 1984). In most cases the influence of
desorption is not important and can be neglected (Alonso-Davila, 2003).
The separation factor and productivity (permeation flux) depend on sorption and diffusion of
the components. Sorption depends on the thermodynamic properties, namely, on the solubility
parameters of the solute in the membrane material. On the other hand, the diffusion coefficient
of the penetrants depend on the size, shape, molecular mass of the solute, as well as the
membrane material.
2.3.1. Pervaporation: prospects of industrial applications
The term pervaporation was first used by Kober in 1917 for the name of the observed
phenomenon during the laboratory experiment (Kober, 1917). His assistant Eberlein observed
that a liquid in a collodion bag, which was suspended in the air, evaporated, although the bag
was hermetically closed. It was not possible to find the hole in the bag. There was only one
reasonable conclusion that evaporation occurred through the material from which the colloidal
bag was made. Kober was not the first researcher to observe this phenomenon, but the first to
realize its potential for the separation of liquid mixtures that otherwise are difficult to separate,
and to separate them under moderate conditions (Nunes and Peinemann, 2006).
Despite the discovered phenomenon, pervaporation did not find application for quite a long
time. In 1935, Farber recognized the potential of the pervaporation technology for separation
and concentration of protein and enzyme solutions (Farber, 1935). In 1949, Schwob in his
doctoral dissertation showed the successful use of pervaporation for dehydration of alcohol
(Schwob, 1949). Between 1958 and 1962, Binning and coworkers studied the process of
pervaporation for the separation of hydrocarbon mixtures using membranes from hydrophobic
materials like polyethylene. The experimental studies shown that the pervaporation process can
be provided at the temperatures up to 150 °C, which the permeation rates were high enough.
The preferably temperature was between 50 and 120ºC. They were able to establish that there
is a difference in permeation rate between paraffins, aromatic compounds and olefins. Linear
hydrocarbons penetrated faster than branched isomers. This led them to the potential use of
pervaporation to improve the octane rating of gasoline. However, all this was a laboratory study
- 25 -
of pervaporation, although they led to the receipt of several patents (Binning and Stuckey, 1960;
Binning and Johnston, 1961; Binning et al., 1961; Binning et al., 1962).
A real breakthrough for pervaporation technology came in the 1970s, when the possibility of
using it became apparent to many areas of the chemical industry. In 1976, Aptel first proposed
the use of pervaporation for the separation of azeotropic mixtures (Aptel et al., 1976). In
addition, scientists were interested in the possibility of separating hard-to-separate mixtures
such as 1,3-butadiene from isobutene, and also benzene from cyclohexane (Rautenbach and
Albrecht, 1980; Brun et al., 1974).
Due to its simplicity in operation, the possibility of working at moderate temperatures and
operating without additional chemicals, pervaporation was found to be a good alternative for
conventional energy consuming processes such as distillation, or complex methods involving
additional materials cycles, like extraction.
The accumulated knowledge over the years of research, as well as the appearance of more
efficient membranes with an asymmetric structure, motivated the construction of an
experimental industrial plant. In 1982, one of the first such installations was launched as a
demonstration unit for alcohol dehydration with a productivity of 1200 L/day and purity of 99.2
wt. %. One of the advantages of this process, in addition to the high purity of ethanol, was the
low energy consumption compared to traditional azeotropic distillation. Next plant installations
with a capacity ranging from 2000 to 15000 L/day appeared in 1980s. In 1988 in the sugar
refinery of Bethéniville (France), the first large-scale pervaporation unit for the dehydration of
ethanol to a purity of 99.8 wt%, with a capacity of 150,000 L/day, was installed (Feng and
Huang, 1997; Kujawski, 2000; Jonquières et al., 2002). Another successful example of the use
of pervaporation was the removal of a by-product from the reactor for the controlled shift of a
reversible chemical reaction in accordance with the Le Chatelier-Braun principle. This allows
even a full conversion. In 1994, a plant was installed in which water was continuously removed
from a esterification reaction mixture in order to shift the reaction equilibrium towards the
desired product (Jonquières et al., 2002).
In addition to dehydration, a hydrophobic pervaporation, mainly based on
polydimethylsiloxane (PDMS) membranes, was developed. They were used to extract organic
compounds from aqueous mixtures (Lipnizki et al., 1999; Lipnizki, 1999; Peng et al., 2003).
For example, in the case of removal of trichlorethylene from groundwater, spiral-wound PDMS

- 26 -
membranes were used, at a plant in California (USA) in 1993 (Feng and Huang, 1997;
Kujawski, 2000; Jonquières et al., 2002).
Apart from hydrophilic and hydrophobic membranes, a third type of membrane was also
developed for the separation of organic-organic mixtures. These membranes are called
organoselective. Among other applications, these membranes can be used to purification of
ethyl tert-butyl ether (ETBE), a fuel octane enhancer, to replace previously applied tetraethyl
lead (TEL). The feasibility of using pervaporation for the purification of ETBE was
demonstrated at the pilot-scale plant by the Institut Français du Pétrole. This allowed the first
organoselective membranes to be commercialized to remove methanol and ethanol from
organic mixtures (Smitha et al., 2004).
This thesis work has been carried out in the research group Procesos Avanzados de Separación
(PAS) of the Universidad de Cantabria. In recent years, this research group has carried out
numerous studies on the applications of pervaporation in processes such as: 1) Dehydration of
organic solvents with polymer membranes (Gorri et al., 2005; Urtiaga et al., 2007) Dehydration
of organic solvents with inorganic membranes (Urtiaga et al., 2003; Casado et al., 2005); 3)
Removal of VOCs from aqueous solutions (Urtiaga et al., 1999 and 2003); 4) Separation of
organic-organic mixtures (Gorri et al., 2006).
In accordance with the separation objectives, the hydrophilic and organophilic pervaporation
may be alternative processes for distillation, rectification, azeotropic and extractive distillation,
extraction and adsorption (Huang, 1991).
Compared with these processes pervaporation has several advantages:
The high efficiency of the process compared to alternative separation processes in the separation
of azeotropic mixtures. Pervaporative separation efficiency is mainly determined by the
properties of membranes and the operating conditions. Thus, physicochemical properties of the
separated components and mixtures substantially play a lesser role than in other separation
processes, which opens the possibility of separating azeotropic mixtures. Thus, in the case of
joint use of separation processes, pervaporation allows not only to increase the efficiency of the
equipment used, but also can be used for pre-azeotropic concentrating, breaking azeotropes and
post-azeotropic concentration (Jansen et al., 1992).
Nonchemical environment. Generally, in pervaporation no additional reagents are used, except
in cases where the addition of these reagents is forced taking to increase the selectivity of
separation (Wytcherley and McCandless, 1992). In turn, the alternative processes like

- 27 -
azeotropic and extractive distillation, extraction, and some others, are based on the use of
auxiliary components and their subsequent regeneration, which not only greatly complicates
the separation technology, but also increases the production potential environmental hazard.
Compactness of equipment. In a rectification, distillation or other separation process the surface
area of vapor - liquid contact phases is achieved through the use of a variety of tray and packed
contact devices. For instance, in conventional separation processes, the specific surface area of
contact phase can be available up to 1500-1700 m2/m3 (Billingham and Lockett, 2002; Sulzer
Chemtech, 2012 ). In membrane devices, the specific surface area of the membrane can be up
to 30000 m2/m3 (Mulder, 1996).
Advantages of energy consumption. Unlike distillation, where the whole mixture is separated
by multiple evaporation, in pervaporation energy is spent only on the evaporation of the
permeate.
Low potential heat. Distillation, rectification and pervaporation are processes with phase
transitions, the energy is fed in the form of heat. Thus, in pervaporation in contrast to
distillation, there is no need to heat to the boiling point of separated mixture, which opens the
possibility of using low potential heat (Huang, 1991).
Operational advantages. The modularity of membrane enables systems to simply add or switch
off membrane devices to increase or reduce the performance of separation process (Peinemann
and Nunes, 2010).
On the other hand, membrane technologies have some drawbacks, such as temperature
limitation, chemical incompatibilities, membrane fouling, upper solid limits, membrane
producing price (Nath, 2008). In addition, despite the universality and flexibility of the process
of pervaporation, the capital costs can be much higher than distillation. Therefore, the next step
in applying pervaporation is to use it in conjunction with other separation processes. Such a
hybrid of traditional processes of separation of liquids with pervaporation can give a greater
cost savings and a much higher purity of the target product, since the strengths of both processes
are used (Fontalvo and Keurentjes, 2015; Koch et al., 2013).

- 28 -
2.3.2. Modeling of pervaporation process
The main separation characteristics of the membrane are the permeate flux through the
membrane J and separation coefficient α, calculated according to the following expressions
(Van der Bruggen and Luis, 2015):
7 = −8 '9'4 (Eq. 2.7)
:�// = <=/<>4=/4> (Eq. 2.8)
where L is the phenomenological coefficient and (dX/dx) is the driving force, expressed as the
gradient of X (temperature, concentration, pressure) along a coordinate x perpendicular to the
transport barrier. Phenomenological equations are not confined to describing mass transport but
can also be used to describe heat flux, volume flux, momentum flux and electrical flux.
yi and yj are the compositions of components i and j in the permeate and xi and xj are the
compositions of the components in the feed. These compositions can be described by means
of mole fractions, mass fractions or volume fractions. The separation factor is chosen in such a
way that its value is greater than unity and so that component i permeates preferentially. If
:�// = 1, no separation can occur. The separation factor used in pervaporation is similar to the
relative volatility used for conventional distillation.
Moreover, the flux in pervaporation can be often expressed as following:
7� = −?�@AB� (Eq. 2.9)
where AB� is the molar concentration gradient of component i over the membrane and ?�@ is
the Fickian diffusivity of i in the membrane. This leads to the following simple expression:
7� = C=D(E=DFGGHIE=DJGKD)L (Eq. 2.10)
where B�@MNN' and B�@&NO@ are the concentrations of component i inside the membrane on the feed
side and on the permeate side, respectively. The concentration inside the membrane can be
obtained by Henry’s law:

- 29 -
B�@ = P�@�� (Eq. 2.11)
WhereP�@ is the sorption coefficient or the solubility, a measure of the amount of penetrant
sorbed by the membrane under equilibrium conditions and Q� is the partial pressure of species
i in the phase adjoining the interface.
The resulting equation is the classical representation of the solution diffusion transport
mechanism:
7� = R=DC=DL (��MNN' − ��&NO@) = SNO@NT%�UV<
L (��MNN' − ��&NO@) (Eq. 2.12)
��MNN' − ��&NO@ = W�� is the partial pressure difference over the membrane, which is,
calculated as:
��MNN' = ��X���YT& (Eq. 2.13)
��&NO@ = ���VZVTU&NO@ (Eq. 2.14)
where
�� – the molar fraction of component i in a multicomponent feed;
X�– the activity coefficient at temperature T(K);
��YT& – the vapour pressure of pure i at temperature T(K);
�� – the molar fraction of component i in the permeate,
�VZVTU&NO@ – the total permeate pressure.
The activity coefficients can be calculated with an appropriate thermodynamic method, for
example, in ether/alcohol mixtures, UNIFAC and UNIFAC Dortmund methods can be applied
(Gonzalez and Ortiz, 2002; Alonso-Davila, 2003). For pure species the partial pressure
difference W�� reduces to the vapor pressure ��YT& (when �VZVTU&NO@ ≪ ��MNN'). Vapor pressure of
pure compounds can be calculated with the Clausius-Clapeyron equation (Doherty and Malone,
2001):
'U S=\]J'(^_)
= − `a\]Jb (Eq. 2.15)
- 30 -
where WcYT& is the molar latent heat of vaporization (i.e. energy required to vaporize one mole
of the liquid at a point (T, P) on the VLE curve), and T is the absolute temperature. According
to this equation, WcYT& decreases with increasing temperature from the triple point to the
critical point.
Carrying out the integration and then take the antilog of both sides, the resulting expression is:
��YT& = −de�Q f`a\]Jbg h (Eq. 2.16)
where A is the preexponential factor.
Permeation fluxes always increase with temperature. The temperature dependency of the flux
is composed of a sorption related factor, a diffusion related factor, and the heat of vaporization,
which can be written as:
7� = P�iexp fI`ambg h?�iexp fInÐbg hdexp fI`a\]J
bg h (Eq. 2.17)
or
7� = o�iexp fInpbg hdexp fI`a\]J
bg h (Eq. 2.18)
where P�i, ?�i, o�i are the preexponential factors, WcR is the enthalpy of adsorption, #Ð the
activation energy for diffusion, and #q = #Ð + WcR the activation energy for permeability.
Thus, the total flux follows an Arrhenius (exponential) type of relation:
7� = 7iexp fInsbg h (Eq. 2.19)
where #t = #q + WcYT& = #Ð + WcR + WcYT&is the activation energy for flux and 7i is the
preexponential factor.
The difference in activation energy for flux and permeability is the heat of vaporization WcYT&.
Therefore, the most general and objective way to compare membrane systems relates to the
energy difference #q, which is a combination of the activation energy for diffusion (#Ð), and
the enthalpy of adsorption (WcR). Since adsorption processes are exothermic, the enthalpy of
adsorption is negative (Baker et al., 2010; Van de Bruggen and Luis, 2015). Feng and Huang
- 31 -
analyzed the data for a large number of systems and concluded that the numerical values of Ej
are in the range of 4-92 kJ/mol (Feng and Huang, 1996).
2.4. Membrane integrated hybrid process as a prospective separation technique for azeotropic mixtures
As previously described, conventional separation processes have been widely applied to the
separation of azeotropic mixtures despite their high-energy consumption. However, with the
emergence and advancement of membrane technologies there is a new trend in trying to apply
membranes as the separation techniques for complex separating mixtures. These processes
offers significant potential for the separation of close-boiling or azeotropic mixtures. In contrast
to distillation, pervaporation is not limited by vapor-liquid equilibrium and can thus overcome
azeotropes and distillation boundaries. High selectivity, low energy consumption, and a
compact and modular design are further advantages of membrane separation. On the other hand,
stand-alone membrane processes are usually not economically attractive if a significant large
membrane area and both of high purity and flux for target component are required [49-50].
Recent studies show that most of the membrane technologies were combined with other
separation methods can increase their overall performance.
Several membrane-integrated hybrid separation systems have been reported in literature,
including PV-distillation for solvent mixtures (Lipnizki et al., 1999; Gonzalez and Ortiz, 2002;
Servel et al., 2014), membrane-reverse osmosis process for water treatment and desalination
manufacture (Ang et al., 2015), ultrafiltrarion-coagulation/ozonation for the treatment of
contaminated water (Guo et al., 2013), distillation assisted by organic solvent nanofiltration for
the separation of homogenous catalysts from the reaction solvent (Priske et al., 2010),
chromatography-racemization-nanofiltration for enantiomeric mixtures (Nimmig and
Kaspereit, 2013), etc. Extensive research on PV/VP integrated distillation hybrid process has
been performed particularly. Mostly, this hybrid process has been studied with respect to
overcome azeotropic conditions. A rigorous review of the design, economics and applications
of PV integrated distillation hybrid process has been presented by Lipnizki et al. (1999).
Another study on recent situation of this technique has been reported by Gorak and col. (Kreiz
and Górak, 2006; Górak et al., 2007; Lutze and Gorak, 2013; Koch et al., 2013).
- 32 -
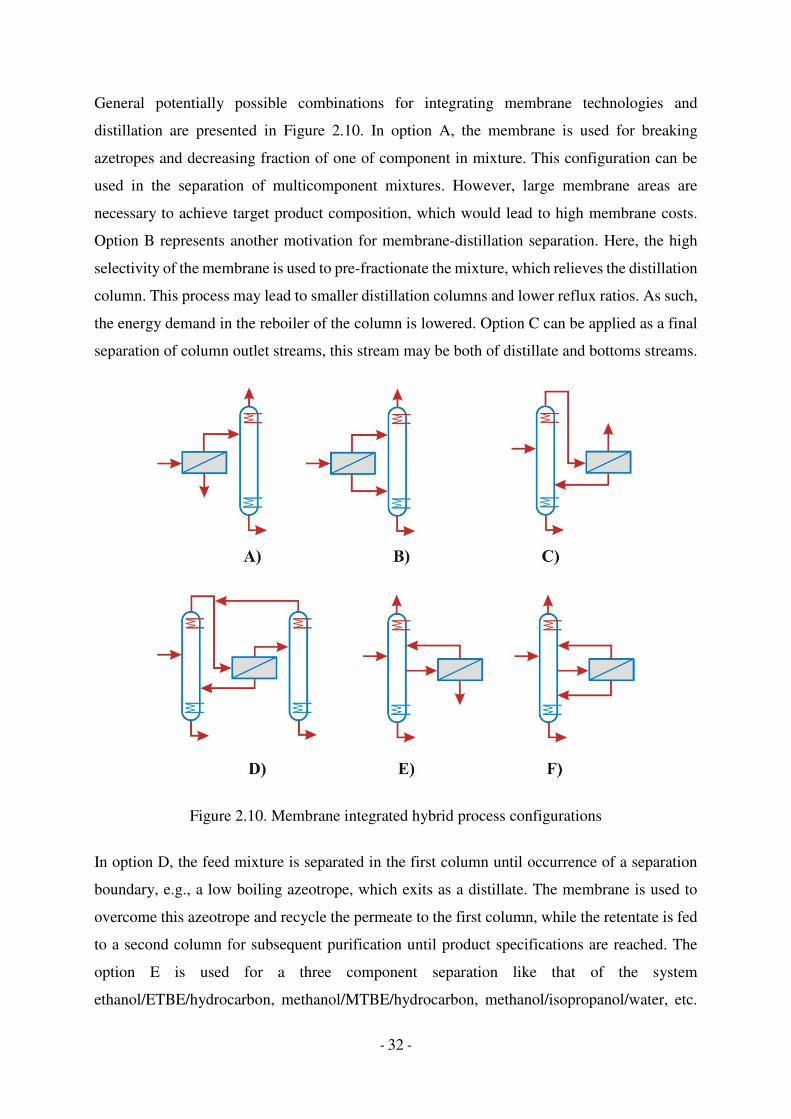
General potentially possible combinations for integrating membrane technologies and
distillation are presented in Figure 2.10. In option A, the membrane is used for breaking
azetropes and decreasing fraction of one of component in mixture. This configuration can be
used in the separation of multicomponent mixtures. However, large membrane areas are
necessary to achieve target product composition, which would lead to high membrane costs.
Option B represents another motivation for membrane-distillation separation. Here, the high
selectivity of the membrane is used to pre-fractionate the mixture, which relieves the distillation
column. This process may lead to smaller distillation columns and lower reflux ratios. As such,
the energy demand in the reboiler of the column is lowered. Option C can be applied as a final
separation of column outlet streams, this stream may be both of distillate and bottoms streams.
Figure 2.10. Membrane integrated hybrid process configurations
In option D, the feed mixture is separated in the first column until occurrence of a separation
boundary, e.g., a low boiling azeotrope, which exits as a distillate. The membrane is used to
overcome this azeotrope and recycle the permeate to the first column, while the retentate is fed
to a second column for subsequent purification until product specifications are reached. The
option E is used for a three component separation like that of the system
ethanol/ETBE/hydrocarbon, methanol/MTBE/hydrocarbon, methanol/isopropanol/water, etc.
- 33 -
In this option, a quasi-binary mixture is withdrawn as sidestream and separated through the
membrane. Permeate or retentate stream can be recycled to distillation, and other one recycled
to the initial system (for example, a reaction system) or separated as desired product. In
addition, both of these permeate and retentate streams can be recycled to the distillation column
(option F) (Kreiz and Górak, 2006; Koch et al., 2013).
2.5. On the production and uses of ethyl tert-butyl ether (ETBE)
Public concern against air pollution has boosted research efforts worldwide to improve the
quality of motor fuels. One of solutions for the overcoming such problem is to use oxygenate
blends as fuel additives.
The main fuel additives are alcohols, especially ethanol, which can be added to gasoline for its
economy, and to improve some of its parameters. However, applying this product as a fuel
additive has some disadvantages, like a high vapor pressure and high solubility in water.
In 1990, Clean Air Act Amendments were enacted to emphasize the utilization of the
oxygenated reformulated gasoline to achieve a better fuel combustion and improve air quality
(Bell et al., 2004). The volatile organic compounds (VOC) emissions can be reduced by setting
the blending Reid vapor pressure (bRvp) to a value not higher than 9.0 psi. Thus, these
amendments catalyzed the development of MTBE industries, which changed the role of MTBE
from an octane booster to a gasoline oxygenate (Yee et al., 2013). In Europe, MTBE production
capacity is 2.8 million tons, however, new capacities are not introduced, and the operating
capacity is reduced, which is largely due to increasing demand for ethyl tert-butyl ether (ETBE).
The capacity for the production of ETBE reached about 2.26 million tons in 2006 (for
comparison, 0.35 million tons of ETBE in 2000). On the other hand, in recent years, there is a
tendency to reduce the consumption of MTBE in industrialized countries.
The capacity for the production of ETBE reached about 2.26 million tons in 2006 (for
comparison, 0.35 million tons of ETBE in 2000). Tertiary-amyl ether (TAME) is less widely
used in Europe. The capacity for its production in Europe is estimated at 0.5 million tons (0.28
million tons in 2000). Table 2.1 presents data on the location and productivity of the plants for
these oxygenates.
The largest capacities for the production of MTBE are concentrated in the Netherlands, and for
the production of ETBE in France, Spain and Germany. These countries have almost

- 34 -
completely switched to the production of ETBE. TAME is produced in three countries - in
Germany, Italy and Finland.
Table 2.1. Capacity for production of MTBE, ETBE and TAME in Europe (Stupp et al.,
2012).
COUNTRIES MTBE ETBE TAME
1000 tons/year
Austria 65 - -
Belgium 270 183 -
Bulgaria 82 - -
Czech Republic 92 - -
Finland - 94 110
France - 836 -
Germany 358 200 160
Greece 110 - -
Hungary 84 55 -
Italy 223 133 278
Lithuania 80 - -
Netherlands 842 138 -
Poland - 120 -
Portugal - 50 -
Romania 220 - -
Serbia 35 - -
Slovakia - 52 -
Spain - 422 -
Sweden - 50 -
United Kingdom 304 - -
Belorussia 41 - -
Ukrain 24 - -
TOTAL: 2830 2333 548

- 35 -
Ecological studies have shown that MTBE is highly toxic substances (dose 20 mg per liter is
considered lethal) can cause kidney and liver cancer. It quickly evaporates from open containers
and is easily soluble in water. Getting in the ground water in case of accidents or spills of MTBE
gasoline subsequently falls into the water intake facilities and drinking water (Lethbridge,
2000).
As consequence of the negative impacts that MTBE has on the environment (Donahue et al.,
2002), ETBE has become a popular alternative oxygenate additive for gasoline. In addition, it
has higher heating value and lower oxygen content. Considering that the maximum allowed
oxygen content in gasoline is 2.7%, the maximum content of ETBE is 17 vol. % and of MTBE
is about 15 %. Currently, there are no data about ETBE toxicity and adverse environmental
impacts (Fayolle-Guichard, 2012). The characteristics of oxygen-containing compounds are
shown below (Table 2.2).
Table 2.2. Properties of oxygen-containing compounds (Alonso-Dávila, 2003; Yee et al.,
2013).
MTBE ETBE
Density, kg/m3 740 736
Normal boiling temperature, ºС 55.3 72.8
Vapor pressure, 105 Pa (at 50 ºC) 0.855 0.469
Heat of combustion, lower kJ/L 26 260 26 910
Heat of evaporation kJ/kg 337 321
Octane rate 109 112
RON 118 118
MON 101 101
Boiling point, ºC 55.2 69-70
Flash point, ºC -10 -19
Oxygen content, % 18.2 15.7
Water solubility, mg/L 42 23.7
The higher boiling point of ETBE (72.8ºC) with respect to MTBE and the lower saturated
vapor pressure make it possible to include additional fractions of butane in the gasoline

- 36 -
formulation. Thus, from the oxygen-containing compounds represented by qualitative
characteristics, ETBE has an undoubted advantage.
2.5.1. Production of ETBE
Ethyl tert-butyl ether (ETBE) offers the possibility of using as an oxygenate gasoline additive.
In general, etherification is an exothermic reversible reaction that converts alcohol to ether.
Figure 2.11 shows a simplified schematic diagram of ETBE production. ETBE is produced
through the reaction of isobutene (IB) or tert-butyl alcohol (TBA) with excess ethanol. In
industry, ETBE is produced by a reversible reaction of isobutene (IB) and ethanol catalyzed by
a strong acidic macroporous ion exchange resin in liquid phase at 10 bar (Fite et al., 1994;
Cunill et al., 1993; Jensen and Datta, 1995).
Figure 2.11. Simplified schematic diagram of ETBE production
This synthesis is followed by a series of separation processes to obtain ETBE with the target
purity, and the excess ethanol is recycled to the reactor (Yee et al., 2013).
A separation process is required to separate the desire product from the reaction mixtures, which
contain unreacted or excess raw materials and the by-products of the reaction. A drawback in
the conventional ETBE manufactures is the energy intensive product recovery process, making
ETBE expensive. The purification process of ETBE involves the separation of ETBE, mixed
C4 hydrocarbons and unreacted ethanol. Unfortunately, the unreacted ethanol forms azeotropic
mixtures with ETBE that are difficult to separate by distillation. For this reason, in this work
we have evaluated two alternatives that are part of the tools for the process intensification, such
as the production of ETBE by means of: i) a pervaporation integrated hybrid process, and ii)
reactive distillation.
The separation techniques are discussed in detail in Chapters 3-5.

- 37 -
2.5.2. Chemical reactions in the production of ETBE
As above mentioned, ETBE is formed in an exothermic, reversible and highly selective reaction
between isobutene and ethanol in liquid phase, catalyzed by an ion exchange resin. Due to the
content of light hydrocarbons, the reaction mixture should be kept under pressure (10 bar) to
be in the liquid phase. As is the case with other ethers (MTBE), also the side reactions leading
to the formation of di-isobutene (DIB) and tert-butyl alcohol (TBA) may take place. The overall
scheme of conversion in the synthesis of ETBE can be represented as:
1(u + #vwc ↔ #�y# (Eq. 2.20)
1(u + czw ↔ �yd (Eq. 2.21)
21(u →?|y (Eq. 2.22)
The etherification reaction is limited by the thermodynamic equilibrium in the range of
temperatures typically used in the industrial field. Thus, the equilibrium conversion at 343 K
for a stoichiometric mixture of reactants is only 84.7% (Jensen and Datta, 1995; Sneesby et al.,
1997). Several experimental studies on the chemical equilibrium in ETBE formation reaction
have been reported in the literature (Jensen and Datta, 1995; Izquierdo et al., 1994; Vila et al.,
1993). Izquierdo et al. (1994) reported a study where equilibrium constants for the liquid-phase
synthesis of ETBE were determined experimentally in the temperature range 313 -353 K and
at 1.6 MPa, using as source of isobutylene a C4 olefinic cut proceeding from a steam cracking
unit. The UNIFAC estimates of activity coefficients were used to describe the liquid-phase
nonideality. As a result of that study the authors proposed the following expression to describe
the dependence of the activity-based equilibrium constant with temperature:
[ ]TK 21.4262exp1040.7 5−×= (Eq. 2.23)
The secondary reaction of isobutene dimerization (Eq. 2.3) is favored at low concentration of
ethanol and at high temperature and is also equilibrium limited (Rehfinger and Hoffmann,
1990). For this reason, a slight excess of ethanol is usually used in the reaction mixture to inhibit
the isobutene dimerization reaction. Colombo et al. (1983) proposed an expression for the
equilibrium constant of the dimerization which has previously been estimated from the free
energies of formation, as follows:

- 38 -
TTTK 0356.0ln2.178644.58192633.95ln −−+= (Eq. 2.24)
Abufares and Douglas (1995) verified that this correlation predicts well the formation of di-
isobutene in a column reactive for the production of MTBE, and later this equation was used
by Sneesby et al. (1997) to simulate the ETBE process.
Both the reactive mixture and other process streams have a highly non-ideal behavior, so a
careful selection of an appropriate thermodynamic method is a fundamental step in our study.
The ETBE system is susceptible to form azeotropes due to nonidealities in the liquid phase.
Several experimental studies have reported the characteristics of the binary azeotropes formed
between ethanol and ETBE (Gmehling et al., 1995; Oh and Park, 1998; Kammerer et al., 1999;
Rarey et al., 1999) and between ethanol and isobutene (Fischer et al., 1996). In the case of
ethanol/ETBE mixtures, these compounds form an azeotropic mixture containing 20.4 wt.%
ethanol at 94.7 kPa and 65 ºC (Rarey et al., 1999). The UNIFAC model predicts the presence
of these azeotropes and also suggests an azeotrope between ethanol and 1-butene at high
pressure. As consequence of the presence of azeotropes, these mixtures cannot be separated by
simple distillation and more advanced alternatives such as pressure-swing distillation or hybrid
processes that combine distillation and pervaporation are required. In this work we have chosen
the UNIFAC-Dortmund group contribution method considering that this thermodynamic
method is able to predict the non-ideal behavior of the ethanol/ETBE/C4 mixtures at moderate
pressures (Gmehling et al., 1995, Oh and Park, 1998).
- 39 -
References
1. Abufares AA, Douglas PL. Mathematical modelling and simulation of an MTBE catalytic
distillation process using speedup and aspen plus. Trans Inst Chem Eng Part A 73: 3-12 (1995).
2. Alonso-Dávila PA. Diseño de un proceso óptimo para la producción de éter etil tert-
butílico. Tesis Doctoral, Universidad de Cantabria (2003).
3. Ang WL, Mohammad AW, Hilal N, Leo CP. A review on the applicability of
integrated/hybrid membrane processes in water treatment and desalination
plants. Desalination 363: 2-18 (2015).
4. Aptel P, Challard N, Cuny J, Neel J. Application of the pervaporation process to separate
azeotropic mixtures. J Membr Sci 1: 271-287 (1976).
5. Baker RW, Wijmans JG, Huang Y. Permeability, permeance and selectivity: A preferred way
of reporting pervaporation performance data. J Membr Sci 348: 346-352 (2010).
6. Bell ML, Mc Dermott A, Zeger S, Samet J, Dominici F. Ozone and short-term mortality in
95 US urban communities, 1987-2000. J Am Med Assoc 292: 2372-2378 (2004).
7. Billingham JF, Lockett MJ. Structured packing system for reduced distillation column height.
Patent EP1195563 A2 (2002).
8. Binning RC, Jennings JF, Martin EC. Process for removing water from organic chemicals.
US Patent No 3.035.060 (1962).
9. Binning RC, Johnston WF. Aromatic separation process. US Patent No 2.970.106 (1961).
10. Binning RC, Stuckey JM. Method of separating hydrocarbons using ethyl cellulose selective
membrane. US Patent No 2.958.657 (1960).
11. Binning R, Lee R, Jennings J, Martin E. Separation of liquid mixtures by permeation. Ind
Eng Chem 53: 45-50 (1961).
12. Brun JP, Bulvestre G, Kergreis A, Guillou M. Hydrocarbons separation with polymer
membranes. I. Butadiene–isobutene separation with nitrile rubber membranes. J Appl Polym
Sci 18: 1663-1683 (1974).

- 40 -
13. Casado C, Urtiaga A, Gorri D, Ortiz I. Pervaporative dehydration of organic mixtures using
a commercial silica membrane: Determination of kinetic parameters. Sep Purif Technol 42: 39-
45 (2005).
14. Colombo F, Corl L, Dalloro L, Delogu P. Equilibrium constant for the methyl tert-butyl
ether liquid-phase synthesis by use of UNIFAC. Ind Eng Chem Fundam 22: 219-223 (1983).
15. Doherty MF, Perkins JD. On the dynamics of distillation processes- I. The simple
distillation of multicomponent nonreacting, homogeneous liquid mixtures. Chem Eng Sci 33:
281-301 (1978).
16. Donahue CJ, D'Amico T, Exline JA. Synthesis and characterization of a gasoline oxygenate,
ethyl tert-butyl ether. J Chem Educ 79: 724-726 (2002).
17. Farber L. Applications of pervaporation. Science 82: 158 (1935).
18. Fayolle-Guichard F, Durand J, Cheucle M, Rosell M, Michelland RJ, Tracol J, Le Roux F,
Grundman G, Atteia O, Richnow HH, Dumestre A, Benoit Y. Study of an aquifer contaminated
by ethyl tert-butyl ether (ETBE): Site characterization and on-site bioremediation. J Hazard
Mater 201–202: 236-243 (2012).
19. Feng X, Huang RYM. Liquid separation by membrane pervaporation: A review. Ind Eng
Chem Res 36: 1048-1066 (1997).
20. Fischer K, Park SJ, Gmehling J. Vapor-liquid equilibria for binary systems containing
methanol or ethanol, tert-butyl methyl ether or tert-amyl methyl ether, and butane or 2-
methylpropene at 363 K. ELDATA Int. Electron. J. Phys Chem Data 2: 135-148 (1996).
21. Fite C, Iborra M, Tejero J, Izquierdo JF, Cunill F. Kinetics of the liquid-phase synthesis of
ethyl tert-butyl ether (ETBE). Ind Eng Chem Res 33: 581-591 (1994).
22. Fontalvo J, Keurentjes JTF. A hybrid distillation–pervaporation system in a single unit for
breaking distillation boundaries in multicomponent mixtures. Chem Eng Res Design 99: 158-
164 (2015).
23. Gmehling J, Menke J, Krafczyk J, Fischer K. A data bank for azeotropic data - status and
applications. Fluid Phase Equilib 103: 51-76 (1995).

- 41 -
24. González B, Ortiz Uribe I. Mathematical modeling of the pervaporative separation of
methanol-methylterbutyl ether mixtures. Ind Eng Chem Res 40: 1720-1731 (2001).
25. Górak, A., Hoffmann, A. and Kreis, P. Prozessintensivierung: Reaktive und
membranunterstützte rektifikation. Chemie Ingenieur Technik 79: 1581-1600 (2007).
26. Gorri D, Ibáñez R, Ortiz I. Comparative study of the separation of methanol–methyl acetate
mixtures by pervaporation and vapor permeation using a commercial membrane. J Membr
Sci 280: 582-593 (2006).
27. Gorri D, Urtiaga A, Ortiz I. Pervaporative recovery of acetic acid from an acetylation
industrial effluent using commercial membranes. Ind Eng Chem Res 44: 977-985 (2005).
28. Guo J, Wang L, Zhu J, Zhang J, Sheng D, Zhang X. Highly integrated hybrid process with
ceramic ultrafiltration-membrane for advanced treatment of drinking water: A pilot study. J
Environ Sci Health Part A Toxic Hazard Subst Environ Eng 48: 1413-1419 (2013).
29. Hégely L. Improvement of batch distillation separation of azeotropic mixtures. PhD
Thesis. The Institut National Politechnique de Toulouse (2013).
30. Hilmen EK, Kiva VN, Skogestad S. Topology of ternary VLE diagrams: Elementary
cells. AIChE J 48: 752-759 (2002).
31. Huang RYM. Pervaporation membrane separation processes. Elsevier, Amsterdam, (1991).
32. Izquierdo JF, Cunill F, Vila M, Iborra M, Tejero J. Equilibrium constants for methyl tert-
butyl ether and ethyl tert-butyl ether liquid-phase syntheses using C4 olefinic cut. Ind Eng Chem
Res 33: 2830-2835 (1994).
33. Jansen AE, Versteeg WF, van Engelenburg B, Hanemaaijer JH, ter Meulen BP. Methods to
improve flux during alcohol/water azeotrope separation by vapor permeation. J Membr Sci 68:
229-239 (1992).
34. Järvelin H. Commercial production of ethers, in H. Hamid and M.A. Ali (eds.), Handbook
of MTBE and other gasoline oxygenates. CRC Press, New York, pp. 203-222 (2004).
- 42 -
35. Jonquières A, Clément R, Lochon P, Néel J, Dresch M, Chrétien B. Industrial state-of-the-
art of pervaporation and vapour permeation in the western countries. J Membr Sci 206: 87-117
(2002).
36. Kammerer K, Schnabel S, Silkenbäumer D, Lichtenthaler RN. Vapor-liquid equilibria of
binary mixtures containing an alcohol and a branched ether. Experimental results and
modeling. Fluid Phase Equilib 162: 289-301 (1999).
37. Kiva VN, Hilmen EK, Skogestad S. Azeotropic phase equilibrium diagrams: A
survey. Chem Eng Sci 58: 1903-1953 (2003).
38. Kober PA. Pervaporation, perstillation, and percrystallisation. J Am Chem Soc 39: 944-948
(1917).
39. Koch K, Sudhoff D, Kreiß S, Górak A, Kreis P. Optimisation-based design method for
membrane-assisted separation processes. Chem Eng Process: Process Intensif 67: 2-15 (2013).
40. Kreis P, Górak A. Hybrid membrane-distillation processes. AIChE Annual Meeting,
Conference Proceedings (2006).
41. Kreis P, Górak A. Process analysis of hybrid separation processes: Combination of
distillation and pervaporation. Chem Eng Res Des 84: 595-600 (2006).
42. Kujawski W. Application of pervaporation and vapor permeation in environmental
protection. Pol J Environ Stud 9: 13-26 (2000).
43. Lei Z, Li C, Chen B. Extractive distillation: A review. Sep Purif Rev 32: 121-213 (2003).
44. Lethbridge G. MTBE and groundwater contamination in the UK. Pet Rev 54: 50-52 (2000).
45. Lipnizki F, Field RW, Ten P. Pervaporation-based hybrid process: A review of process
design, applications and economics. J Membr Sci 153: 183-210 (1999).
46. Lipnizki F, Hausmanns S, Ten P, Field RW, Laufenberg G. Organophilic pervaporation:
Prospects and performance. Chem Eng J 73: 113-29 (1999).
47. Lonsdale HK, Merten U, Riley RL. Transport properties of cellulose acetate osmotic
membranes. J Appl Polym Sci 9: 1341-1362 (1965).

- 43 -
48. Luo GS, Niang M, Schaetzel P. Development of cellulose acetate propionate membrane for
separation of ethanol and ethyl tert-butyl ether mixtures. Sep Sci Technol 32: 1143-1156 (1997).
49. Lutze P, Gorak A. Reactive and membrane-assisted distillation: Recent developments and
perspective. Chem Eng Res Design 91: 1978-1797 (2013).
50. Luyben WL, Chien I. Design and control of distillation systems for separating azeotropes.
John Wiley & Sons, Hoboken, New Jersey, (2010).
51. Luyben WL. Pressure-swing distillation for minimum- and maximum-boiling
homogeneous azeotropes. Ind Eng Chem Res 51: 10881-10886 (2012).
52. Mahdi T, Ahmad A, Nasef MM, Ripin A. State-of-the-art technologies for separation of
azeotropic mixtures. Sep Purif Rev 44: 308-330 (2015).
53. Mulder M. Basic principles of membrane technology. Kluwer Academic Publishers,
Dordrecht (1996).
54. Mulder M, Smolders C. On the mechanism of separation of ethanol/water mixtures by
pervaporation I. calculations of concentration profiles. J Membr Sci 17: 289-307 (1984).
55. Nath K. Membrane separation processes. PHI Learning, New Delhi, (2008).
56. Nimmig S, Kaspereit M. Continuous production of single enantiomers at high yields by
coupling single column chromatography, racemization, and nanofiltration. Chem Eng Process:
Process Intensif 67: 89-98 (2013).
57. Nunes SP, Peinemann K. Membrane technology: In the chemical industry, 2nd ed. Edited
by Tarleton S., Wiley-VCH, Weinheim, pp. 101-154 (2006).
58. Ognisty TP. Analyze distillation columns with thermodynamics. Chem Eng Prog 91: 40-
46 (1995).
59. Oh J, Park S. Isothermal vapor-liquid equilibria at 333.15 K and excess molar volumes at
298.15 K of ethyl tert-butyl ether (ETBE) + alcoh-1-ol (C1-C4) mixtures. J Chem Eng Data 43:
1009-1013 (1998).
- 44 -
60. Pabby AK, Rizvi SSH, Sastre AM. Handbook of membrane separations: Chemical,
pharmaceutical, food, and biotechnological applications. CRC Press, Boca Raton, FL, pp. 108-
109 (2009).
61. Peinemann K, Nunes SP. Membrane technology: Membranes for water treatment. Wiley-
VCH, Weinheim, (2010).
62. Peng M, Vane LM, Liu SX. Recent advances in VOCs removal from water by
pervaporation. J Hazard Mater 98: 69-90 (2003).
63. Prigogine I, Defay R. Chemical thermodynamics. Longmans & Green, London, (1954).
64. Priske M, Wiese K, Drews A, Kraume M, Baumgarten G. Reaction integrated separation of
homogenous catalysts in the hydroformylation of higher olefins by means of organophilic
nanofiltration. J Membr Sci 360: 77-83 (2010).
65. Rarey J, Horstmann S, Gmehling J. Vapor-liquid equilibria and vapor pressure data for the
systems ethyl tert-butyl ether + ethanol and ethyl tert-butyl ether + water. J Chem Eng Data 44:
532-538 (1999).
66. Rautenbach R, Albrecht R. Separation of organic binary mixtures by pervaporation. J
Membr Sci 7: 203-223 (1980).
67. Rehfinger A, Hoffmann U. Formation of di-isobutene, main by-product of methyl tertiary
butyl ethyl ether synthesis catalyzed by ion exchange resin. Chem Eng Technol 13: 150-156
(1990).
68. Reinders W, de Minjer CH. Vapour-liquid equilibria in ternary systems: II. The system
acetone-chloroform-benzene. Recueil des Travaux Chimiques des Pays-Bas 59: 369-391
(1940).
69. Safrit BT, Westerberg AW. Algorithm for generating the distillation regions for azeotropic
multicomponent mixtures. Ind Eng Chem Res 36: 1827-1840 (1997).
70. Schreinemakers FAH. Dampfdrücke im system: Wasser, aceton und phenol. Zeitschrift für
physikalische Chemie, Stöchiometrie und Verwandtschaftslehre 39: 440-464 (1901).
- 45 -
71. Schwob Y. Sur l’hemipermeabilite a l’eau membranes de cellulose regeneree. Doctoral
thesis, Université de Toulouse (1949).
72. Serafimov LA. Thermodynamic and topological analysis of liquid–vapor phase equilibrium
diagrams and problems of rectification of multicomponent mixtures. Book: Mathematical
Methods in Contemporary Chemistry. Ed. by Kuchanov SI., Gordon and Breach Publishers,
Amsterdam, pp. 557-605 (1996).
73. Servel C, Roizard D, Favre E, Horbez D. Improved energy efficiency of a hybrid
pervaporation/distillation process for acetic acid production: Identification of target membrane
performances by simulation. Ind Eng Chem Res 53: 7768-7779 (2014).
74. Smitha B, Suhanya D, Sridhar S, Ramakrishna M. Separation of organic-organic mixtures
by pervaporation - a review. J Membr Sci 241: 1-21 (2004).
75. Sneesby MG, Tadé MO, Datta R, Smith TN. ETBE synthesis via reactive distillation. 1.
steady-state simulation and design aspects. Ind Eng Chem Res 36: 1855-1869 (1997).
76. Stupp D, Gass M, Leiteritz H, Pijls C, Thornton S, Smith J, Dunk M, Grosjean T, Den Haan
K. Gasoline ether oxygenate occurrence in europe, and a review of their fate and transport
characteristics in the environment. CONCAWE Reports, Report No 4/12 (2012).
77. Sulzer Chemtech. Structured packings for distillation, absorption and reactive distillation.
Sulzer Chemtech, Switzerland (2012).
78. Tester JW, Modell M. Thermodynamics and its applications. 3rd ed. Prentice Hall, Upper
Saddle River, N.J., (1997).
79. Touchal S, Roizard D, Perrin L. Pervaporation properties of polypyrrolidinone-based
membranes for EtOH/ ETBE mixtures separation. J Appl Polym Sci 99: 3622-3630 (2006).
80. Urtiaga A, Gorri D, Ortiz I. Mass-transfer modeling in the pervaporation of VOCs from
diluted solutions. AIChE J 48: 572-581 (2002).
81. Urtiaga A, Gorri ED, Casado C, Ortiz I. Pervaporative dehydration of industrial solvents
using a zeolite NaA commercial membrane. Sep Purif Technol 32: 207-213 (2003).

- 46 -
82. Urtiaga AM, Gorri ED, Beasley JK, Ortiz I. Mass transfer analysis of the pervaporative
separation of chloroform from aqueous solutions in hollow fiber devices. J Membr Sci 156:
275-291 (1999).
83. Urtiaga AM, Gorri ED, Gómez P, Casado C, Ibáñez R, Ortiz I. Pervaporation technology
for the dehydration of solvents and raw materials in the process industry. Dry Technol 25: 1819-
1828 (2007).
84. Van der Bruggen B, Luis P. Chapter four - Pervaporation. Ed. By Tarleton S., Academic
Press, Oxford, pp. 101-154 (2015).
85. Vila M, Cunill F, Izquierdo J-, Tejero J, Iborra M. Equilibrium constants for ethyl tert-butyl
ether liquid-phase synthesis. Chem Eng Commun 124: 223-232 (1993).
86. Wijmans JG, Baker RW. The solution-diffusion model: A review. J Membr Sci 107: 1-21
(1995).
87. Wynn N. Pervaporation comes of age. Chem Eng Prog 97: 66-72 (2001).
88. Wytcherley RW, McCandless FP. The separation of meta- and para-xylene by
pervaporation in the presence of CBr4, a selective feed-complexing agent. J Membr Sci 67: 67-
74 (1992).
89. Yee KF, Mohamed AR, Tan SH. A review on the evolution of ethyl tert-butyl ether (ETBE)
and its future prospects. Renew Sust Energ Rev 22: 604-620 (2013).
90. Zereshki S, Figoli A, Madaeni SS, Galiano F, Drioli E. Pervaporation separation of
ethanol/ETBE mixture using poly(lactic acid)/poly(vinyl pyrrolidone) blend membranes. J
Membr Sci 373: 29-35 (2011).
91. Zharov VT, Serafimov LA. Physicochemical foundations of simple distillation and
rectification. Chemistry Publishing, Leningrad (1975) (in Russian).

- 47 -
CHAPTER 3 ANALYSIS OF THE CONVENTIONAL PROCESS FOR THE PRODUCTION
OF ETBE
Chapter contents
3.1. Introduction
3.2. Simulation of reaction system
3.3. Simulation of debutanizer column
3.3.1. Shortcut methods for distillation column design
3.3.2. Distillation column design by boundary value approach
3.3.3. Rigorous methods for distillation calculations: RadFrac method
3.3.4. Operating conditions for the debutanizer distillation column
3.4. Ethanol recuperation system
3.5. Simulation results
3.6. Heat integration
3.6.1. Synthesis of heat exchanger networks (HENs)
3.6.2. Heat exchanger pinch diagram
References
- 48 -
3.1. Introduction
As mentioned in Chapter 1, a number of separation methods have been employed to separate
the azeotropic mixtures, including extractive distillation, azeotropic heterogeneous distillation,
pressure-swing distillation and so on. Extractive distillation can be used to separate the
azeotrope when a suitable solvent is introduced, which can enhance the relative volatility by
establishing an equilibrium in a ternary system. However, adding an extractive component into
a separation system has some drawbacks. The third component may give rise to side reactions,
although in a small extent, which could adversely affect product quality. Therefore, sometimes
it is desirable to avoid adding another component. There are several techniques that do not
require the introduction of other components. If the mixture is so highly nonideal that it
produces a heterogeneous azeotrope, a two-column/decanter system can be used. Another
method for separating azeotropes without the addition of other components is pressure-swing
distillation (PSD). A PSD process have been applied as one of the simplest and most economical
techniques for separating binary azeotropes, providing that the azeotropic composition is
sensitive enough to changes in the operating pressure (Kiss, 2013). In this process, two columns
operating at two different pressures are used. High-purity product streams are produced from
one end of the columns, and recycle streams with compositions near the two azeotropes are
produced from the other end (Luyben, 2012). This has been the option adopted by a good
number of plants built under license from the Institut Français du Pétrole (IFP).
A typical configuration of a conventional pressure-swing process for ETBE production is
shown in Figure 3.1. This process consists of two reactors connected in series in order to ensure
high conversions. The first reactor is used to carry out most of the reaction. Due to the
exothermic characteristics of the ETBE forming reaction, the use of a multitubular reactor is
preferred, which allows the removal of part of the heat generated. This type of reactor consists
of a set of small diameter tubes filled with catalyst, arranged in a housing through which cooling
water is circulated (Miracca et al., 1996). The second reactor can mostly be operated
adiabatically as much less heat is liberated and a packed-bed reactor is more economical
(Sneesby et al, 1997). The packed bed allows more catalyst to be used so that the reactor can
be operated at lower temperatures to improve the reaction equilibrium and maximize
conversion. The first reactor operates up to 90 °C, while the second reactor operates at 40-50
°C.

- 49 -
Figure 3.1. The conventional process for the production of ETBE with continuous pressure-
swing distillation for product purification.
3.2. Simulation of reaction system
Although conventional processes typically include two reactors in series, for simulation
purposes we have used a single equilibrium reactor as a simplified model which can represent
the overall performance of the reaction system. Two parallel reactions, the formation of ETBE
and dimerization were considered as equilibrium limited and for the hydration reaction it was
assumed that practically all the water is converted to TBA (Alonso-Davila, 2003; Quitain et al.,
1999). Thus, a REquil reactor model (Aspen Plus) with chemical equilibrium constants from
literature (Vila et al., 1993; Izquierdo et al., 1994) was used to calculate the products
composition and the total molar flow-rate. The REquil reactor does not take into account
reaction kinetics, even though the results provide a useful reference to be compared with
experimental results, since this equilibrium reactor model can adequately describe conversion
changes based on the amount of recycled ethanol.
We have assumed that the equilibrium reactor operates at 10 bar and 46 ºC, so that water can
be used as coolant utility. The output stream from the reaction zone is fed to a distillation
column (debutanizer column) to obtain a bottom stream where ETBE is the main component.
The distillate stream from this column may contain an appreciable amount of unreacted ethanol
and must be recovered (Table 3.1).
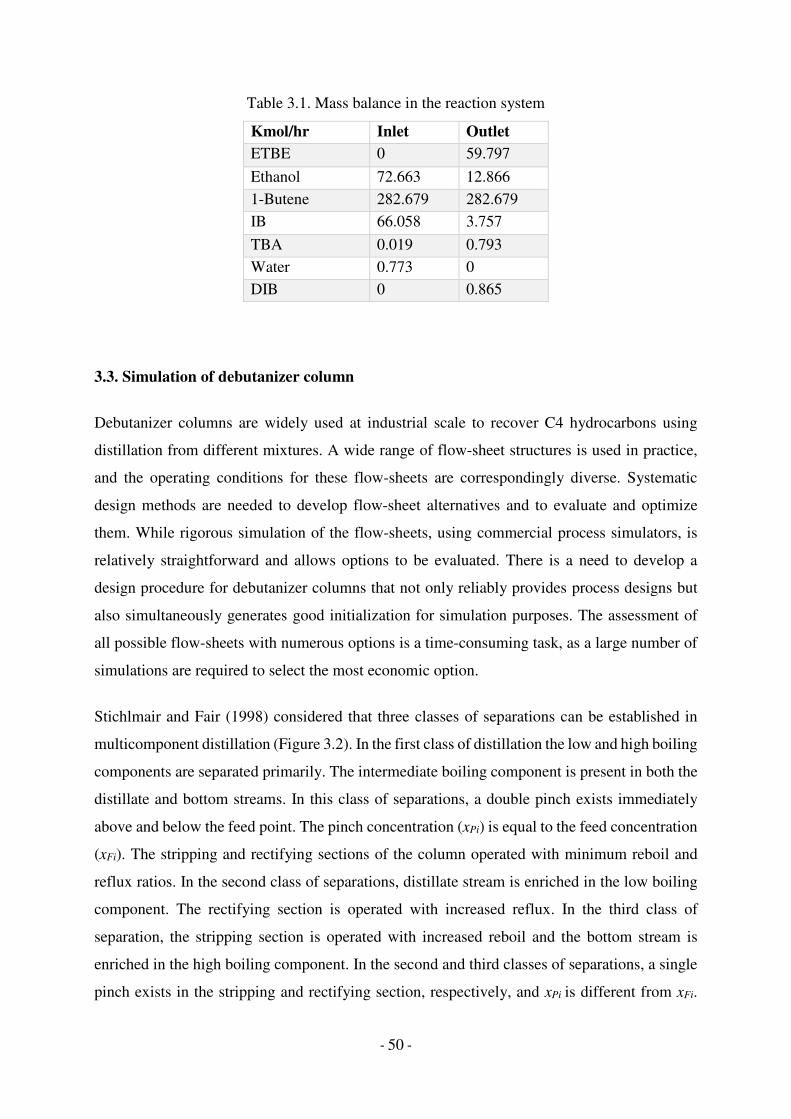
- 50 -
Table 3.1. Mass balance in the reaction system
Kmol/hr Inlet Outlet ETBE 0 59.797
Ethanol 72.663 12.866
1-Butene 282.679 282.679
IB 66.058 3.757
TBA 0.019 0.793
Water 0.773 0
DIB 0 0.865
3.3. Simulation of debutanizer column
Debutanizer columns are widely used at industrial scale to recover C4 hydrocarbons using
distillation from different mixtures. A wide range of flow-sheet structures is used in practice,
and the operating conditions for these flow-sheets are correspondingly diverse. Systematic
design methods are needed to develop flow-sheet alternatives and to evaluate and optimize
them. While rigorous simulation of the flow-sheets, using commercial process simulators, is
relatively straightforward and allows options to be evaluated. There is a need to develop a
design procedure for debutanizer columns that not only reliably provides process designs but
also simultaneously generates good initialization for simulation purposes. The assessment of
all possible flow-sheets with numerous options is a time-consuming task, as a large number of
simulations are required to select the most economic option.
Stichlmair and Fair (1998) considered that three classes of separations can be established in
multicomponent distillation (Figure 3.2). In the first class of distillation the low and high boiling
components are separated primarily. The intermediate boiling component is present in both the
distillate and bottom streams. In this class of separations, a double pinch exists immediately
above and below the feed point. The pinch concentration (xPi) is equal to the feed concentration
(xFi). The stripping and rectifying sections of the column operated with minimum reboil and
reflux ratios. In the second class of separations, distillate stream is enriched in the low boiling
component. The rectifying section is operated with increased reflux. In the third class of
separation, the stripping section is operated with increased reboil and the bottom stream is
enriched in the high boiling component. In the second and third classes of separations, a single
pinch exists in the stripping and rectifying section, respectively, and xPi is different from xFi.

- 51 -
Column operation with minimum internal vapor and liquid flow has considerable importance,
because of using minimal reflux or reboil ratios causes to decrease of energy consumption.
Figure 3.2. Pinch location at different modes of column operation
In this research work, the effluent from the reaction section has a composition of 79.4 mol %
of C4 hydrocarbons, 16.6 mol % ETBE, 3.6 mol % ethanol, 0.2 mol % TBA and 0.2 DIB.
Reaction outlet is fed to a debutanizer column. The separation products are a distillate
containing the C4 and ethanol and the bottom stream containing substantially all the ETBE and
small amounts of TBA and DIB, which were formed in the reactor. The ETBE-ethanol system
forms an azeotrope at ETBE-ethanol molar compositions of 43-57 %, respectively. This
azeotrope determine a distillation boundary in a residue curve diagram.
Residue curve maps are a useful tool for various purposes, such as: a) for testing of the
consistency of experimental azeotropic data; b) predicting the order and content of the cuts in
batch distillation; c) checking whether a given mixture is separable by distillation; d) prediction
of attainable compositions, and qualitative prediction of composition profile shape; e)
identifying the limiting separation achievable by distillation, and f) synthesizing separation
sequences combining distillation with other methods (Doherty and Malone, 2001; Dimian,
2003; Luyben, 2006).
Figure 3.3 shows the residue curve diagram of the ETBE-ethanol-C4 system at a pressure of 8
kg/cm2. This ternary system clearly shows that the azeotrope turns the intermediate-boiling pure

- 52 -
component (ethanol) into a stable node. This mixture has two stable nodes, which means that
some residue curves will go to the other. This has the effect of dividing the composition triangle
into two distinct regions divided by the single curve that connects the unstable node at the point
of butene to the saddle at the azeotrope. This curve is called a simple distillation boundary
(separatrix) (Doherty and Malone, 2001). All feed compositions that lie above the distillation
boundary generate residue curves that go to ethanol while all feed compositions below the
boundary have residue curves that go to ETBE. Therefore, the feed composition determines
whether the final product (i.e., the last drop of liquid in the still) is pure intermediate boiler
(ethanol) or pure high boiler component (ETBE).
Figure 3.3. Residue curve diagram for C4/ETBE/ethanol at a pressure of 8 kg/cm2
Residue curves diagrams are used to represent qualitatively feasible distillation processes from
a ternary mixture. The residue curves are combined with the mass balance (distilled feed and
bottom are colineal). The mass balance intercepts the same residue curve, with one end in the
distillate and the other in the bottoms.
Before the rigorous simulation of the distillation column, the conceptual design of the column
is necessary to determine the parameters, which directly influence the dimensions (design
mode) or its operation (analysis mode). These parameters are the reflux ratio, minimum number
of theoretical stages and minimum energy demand. In order to develop a systematic method for
the design of distillation column, different methods have been studied.

- 53 -
3.3.1. Shortcut methods for distillation column design
Shortcut methods for distillation design rely on simplifying assumptions to solve the column
design equations. Analyzing a distillation problem on the basis of these methods is useful for
preliminary estimations and for determining the column operating limits. Fenske-Underwood-
Gilliland method and graphical McCabe-Thiele diagram are the most common shortcut design
methods. These methods can be applied to determine main parameters of distillation systems
in ternary and multicomponent mixtures as well (Stichlmair and Fair, 1998).
Accordignly, Stichlmair and Fair (1998), the minimum reflux ratio for multicomponent
mixtures is calculated as follows:
}L@� = 4~=I<p =<p =I4p = Eq. 3.1
where, �C� – is the liquid phase mole fraction of component i in the distillate;
�q�� – is the equilibrium state vapor phase mole fraction of component i in the feed;
�q�� – is the equilibrium state liquid phase mole fraction of component i in the feed;
By setting the distillate concentration �C� of high boiler component (c), the minimum reflux
ratio is:
}L@� = 4~�I<p �<p �I4p � Eq. 3.2
The distillate concentration of low boiler (a) and intermediate boiler (b) components are
calculated by the following equations:
�CT = }L@� (�q�T − �q�T) + �q�T Eq. 3.3
�C% = }L@� (�q�% − �q�%) + �q�% Eq. 3.4
These equations are represented by a straight line through �q�� and �q�� in the triangular diagram
on which the feed F and the distillate D have to lie.
The minimum reboil ratio can be determined using liquid phase mole fraction of component i
in the bottoms stream:

- 54 -
}�@� = 4p =I4�=<p =I4p = Eq. 3.5
By setting the bottom fraction ��� of low boiler component (a), the minimum reboil ratio and
bottom liquid fractions for b and c are (Eqs. 3.6-3.8):
}�@� = 4p ]I4�]<p ]I4p ] Eq. 3.6
��% = −}�@� (�q�% − �q�%) + �q�% Eq. 3.7
��E = −}�@� (�q�E − �q�E) + �q�E Eq. 3.8
After the minimum reflux ratio is estimated, a value for an operational reflux ratio can be chosen
and the corresponding number of theoretical stages required for a design can be estimated. For
ternary mixtures, it is possible to compute the profiles for the target compositions and the
specified reflux ratio. A more approximate method, which can also be used for mixtures
containing more than three components, is based on the correlation reported by Gilliland et al.
in 1940. (Doherty and Malone, 2001; Robinson and Gilliland, 1950).
The data shown in Figure 3.4 give an idea of the uncertainty involved in using the correlation.
Eqs. 3.9 (Dytnerskiy, 1993) and 3.10 (Eduljee, 1975) are equations based on the Gilliland
correlation for calculation of operational reflux ratio and number of theoretical stages,
respectively:
}Z& = 1.35}@� + 0.35 Eq. 3.9
�I�D=���" = 0.75 �1 − fbIbD=�
b�" hi.����� Eq. 3.10

- 55 -
Figure 3.4. Gilliland correlation for the number of theoretical stages (Perry et al., 1997)
Fenske’s equation can be used to estimate minimal number of theoretical stages�@� :
�@� =U ���~,����,���·�
��,���~,����
U (���/���) − 1 Eq. 3.11
For more accurate calculations, the averaged value of the relative volatility can be used:
:�L�,a� = �:L�,a�q · :L�,a�C · :L�,a��� Eq. 3.12
where, :L�,a�q , :L�,a�C and:L�,a�� – are relative volatilities in the feed, distillate and bottoms
streams, respectively.
3.3.2. Distillation column design by boundary value approach
For the calculation of the minimum reflux, Levy et al. (1985) presented the boundary value
method (BVM), based on finite difference approximations of column composition profiles in
the form of ordinary difference equations under the assumption of constant molar overflow. In
this method, the liquid composition profiles of a ternary mixture can be plotted on a triangular
diagram (Figure 3.5). Composition profiles are calculated starting from the fully specified
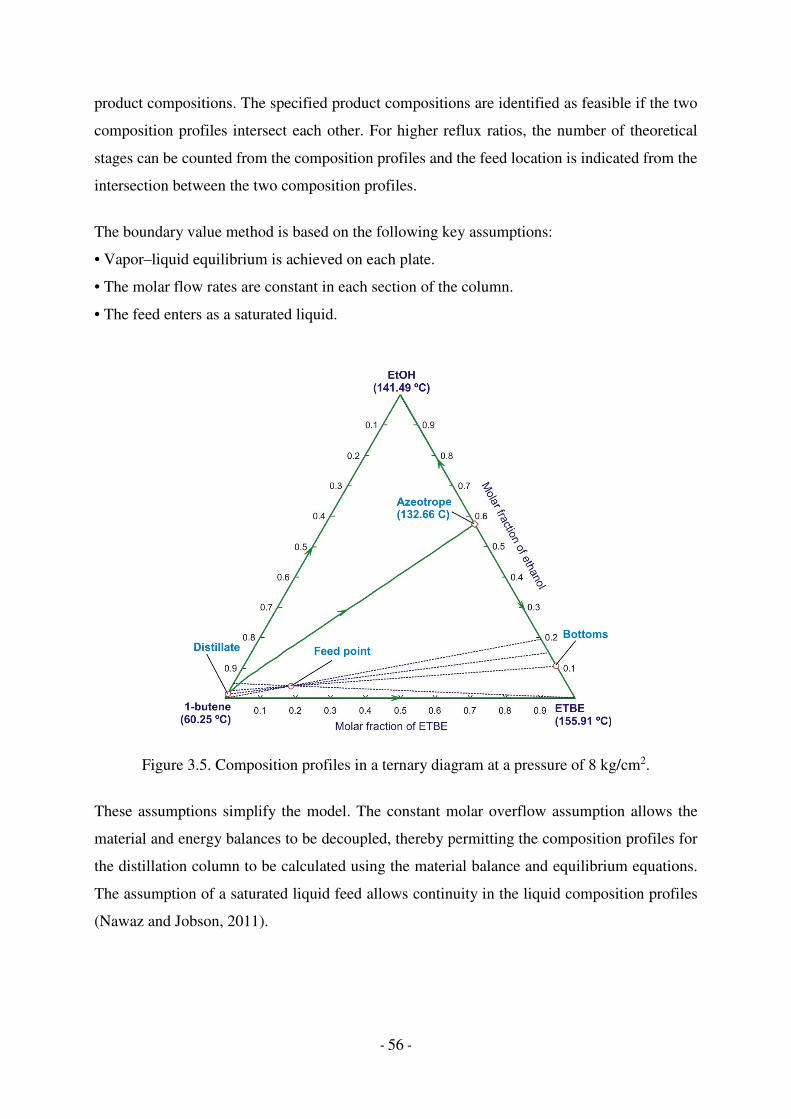
- 56 -
product compositions. The specified product compositions are identified as feasible if the two
composition profiles intersect each other. For higher reflux ratios, the number of theoretical
stages can be counted from the composition profiles and the feed location is indicated from the
intersection between the two composition profiles.
The boundary value method is based on the following key assumptions:
• Vapor–liquid equilibrium is achieved on each plate.
• The molar flow rates are constant in each section of the column.
• The feed enters as a saturated liquid.
Figure 3.5. Composition profiles in a ternary diagram at a pressure of 8 kg/cm2.
These assumptions simplify the model. The constant molar overflow assumption allows the
material and energy balances to be decoupled, thereby permitting the composition profiles for
the distillation column to be calculated using the material balance and equilibrium equations.
The assumption of a saturated liquid feed allows continuity in the liquid composition profiles
(Nawaz and Jobson, 2011).

- 57 -
3.3.3. Rigorous methods for distillation calculations: RadFrac method
The rigorous calculation of the operation conditions in the distillation columns was developed
using the RadFrac module based on the inside–out equilibrium method that utilizes MESH
equations (Material balances, phase Equilibrium relations, mole-fraction Sums, and enthalpy
(H) balances). It is based on the inside-out formulation of Boston and Sullivan (1974), which
employs a reorganization of the basic equations and the sequence of calculation. A detailed
description of the method can be found in Seader and Henley (1998). In this method the
complex physical properties are approximated by simple models in the outer loop while MESH
equations are solved in the inner loop (Venkataraman et al., 1990).
Aspen Plus provides several modules for multistage separation processes. These modules are:
a) DSTWU, Distl, and RadFrac for shortcut and rigorous methods for distillation, absorption,
and stripping applications; b) Extract for extraction applications; c) MultiFrac, SCFrac, and
PetroFrac for advance fractionation applications and c) BatchSep for batch distillation.
The RadFrac model is the main separation block in Aspen Plus and it is useful tool for the
simulation of absorption, stripping, extractive distillation, azeotropic distillation, and ordinary
distillation processes. By using this block, any number of feeds and side product streams can
be included. The block can perform simulation, sizing, and rating of tray and packed columns.
The number of specifications required depends on the degrees of freedom available and can be
based on the distillate/bottom rates, the reflux/boilup rates, the reflux/boilup ratio, the
condenser/reboiler duties, or any combinations of above mentioned. In addition, the pressure
profile inside the column must be specified. The condenser and reboiler can also be configured.
Default configurations are automatically input according to the exchanger types selected. Total
and partial condenser types, the degrees of sub cooling for condenser, and distillation column
without condenser can be specified. Two types of reboiler: kettle and thermosiphon are
available. No specifications are needed when a reboiler is used, but the thermosiphon requires
determination of its configuration and one or two specifications (Hussain, 2011).
The RadFrac model allows connection of side product streams to any stage and other auxiliary
side streams (pseudo streams) that can be used as a report data and does not affect simulation.
Two important features, such as, Design Specs, and Tray and Packing Sizing and Rating are
available with the RadFrac model. The Design Specs feature allows manipulating the columns
specifications to obtain required output. For instance, to obtain 98 mol% C4 (1-butene) in

- 58 -
distillate from the multicomponent C4/ETBE/ethanol system, the mole purity of 0.98 of 1-
butene in the distillate stream have to be set in a Design Spec and reflux ratio range from 0.1
to 0.9 can be indicated in a Vary field. The sizing and rating capabilities can be used to design
or size some aspects of the column internals. By running the simulation, the tray diameter,
column diameter, downcomer area, and weir height can be calculated. The rating calculations
will give some operating parameters such as the flooding factor, maximum backup in the
downcomer area, and pressure drop.
3.3.4. Operating conditions for the debutanizer distillation column
Before any design calculations can be made on a fractionation problem, a tower operating
pressure must be determined. Almost all chemical vapor–liquid separations become easier (e.g.,
have higher relative volatilities) as temperature decreases. As a result, a low pressure is
preferred in practice in order to provide low temperatures (Figure 3.6). Nevertheless, lower
column pressures also give lower reflux-drum and condenser temperatures. While temperatures
down to about 40–50 ºC can be achieved by using inexpensive cooling water, operating at
temperatures lower than this range would require the use of chilled water or expensive
refrigerant for the heat removal in the condenser. Consequently, this sets a lower limit to the
operating pressure that is actually economically feasible (Luyben, 2011).
Figure 3.6. PT envelope for the multicomponent mixture exiting the reactor section (Table 3.1)
In a distillation column, the temperature at top of the column is the lowest, while the
temperature at bottom of the column is the highest. Consequently, the pressure must be set in

- 59 -
such a way that the temperature in the base of the column does not exceed the temperature limit
– this being linked to bottoms composition. The pressure drop along the column (e.g., through
the trays or packing internals) sets the pressure of the reflux-drum, which is lower than the base
pressure of the distillation column. The temperature of the reflux drum is then actually
determined by the distillate composition at the top pressure. Expensive refrigeration must be
used if this temperature is below that achievable by using cooling water. Such conditions mean
that the separation is very expensive in terms of energy, as expensive heat is provided in the
reboiler and then removed in the refrigerated condenser (Kister, 1992a, 1992b; Luyben, 2011).
In the debutanizer column the operating pressure range depends on the cooling medium in the
condenser and the heating medium in the reboiler. Typically, the pressure in the condenser is
set to have a sufficiently large temperature gradient and use cooling water as the cooling
medium. The heating medium of the reboiler is usually steam and its conditions are set after
taking into account the pressure drop in the column. The requirements of the heating and
condensation medium limit the possible range of operating pressures, but in order to determine
this, one must take into account the effect of the pressure on the azeotrope and relative volatility.
At a pressure of 10 kg/cm2 the 1-butene/ethanol azeotrope contains 1.05 mol % of ethanol.
Table 3.2. Composition of the ETBE product required for the formulation of gasoline
Component wt. %
ETBE 95.2
TBA+ethanol 4
Hydrocarbons 0.1
DIB 0.7
Water 0.02
The selection of an operating pressure depends on many factors and it is not possible to find an
optimum operating pressure for the debutanizer column. The choice of an appropriate operating
pressure should consider several factors, such as feed composition and product specifications.
C4 stream contains about 1 mol % of isobutene. Increases in the ethanol/isobutene molar ratio
did not significantly alter the composition of the distillate, but increased the amount of ethanol
in the bottom of the column. Table 3.2 presents the product specifications required for ETBE
to be used in gasoline formulation.

- 60 -
In simulation, we can approach the optimum values for the operating conditions by means of
sensitivity analysis methods. Only thing is initial parameters should be defined. As mentioned
before, molar reflux ratio of the distillation column influences to product purity in the distillate
and the bottoms streams.
Figure 3.7. Sensitivity analysis results curve for the debutanizer molar reflux ratio
Figure 3.8. Liquid mole fraction of components and temperature profile in the debutanizer
column
The calculated reflux ratio and number of plates of the debutanizer column were set to 0.5 and
26, respectively. The value adopted for the reflux ratio corresponds to 1.5 times the minimum
reflux ratio. These values are in agreement with the results reported by Alonso-Davila (2003).
To determine the effect of the reflux ratio on the concentration of ETBE and C4 hydrocarbon

- 61 -
in the distillate, a sensitivity analysis was performed with the Aspen Plus software. The results
of the sensitivity analysis are presented in Figure 3.7.
It is observed from the figure that there is a very low content of ETBE in the distillate. The
pressure in the column condenser was set at 8 kg/cm2, while the pressure drop was taken from
the column operating data and is equal to 0.7 kg/cm2. The composition and temperature profiles
in the debutanizer are presented in Figure 3.8.
3.4. Ethanol recuperation system
The bottom ETBE product from the debutanizer always contains significant amounts of ethanol
(typically between 5 and 15 wt %). Ethanol and ETBE form azeotropes (e.g. at 22.4 wt %
ethanol under atmospheric pressure) so that they cannot be separated by simple distillation
(Streicher et al, 1995). Between the possible separation schemes for this azeotropic mixture, we
have adopted for the conventional process that scheme based on PSD process, that is to say, a
separation scheme that includes two distillation columns and that is based on the change of
ethanol/ETBE azeotropic composition with the pressure (Pucci et al, 1992).
Figure 3.9. T-xy diagram for the ETBE-ethanol mixture at pressures of 1.013 and 7.5 bar
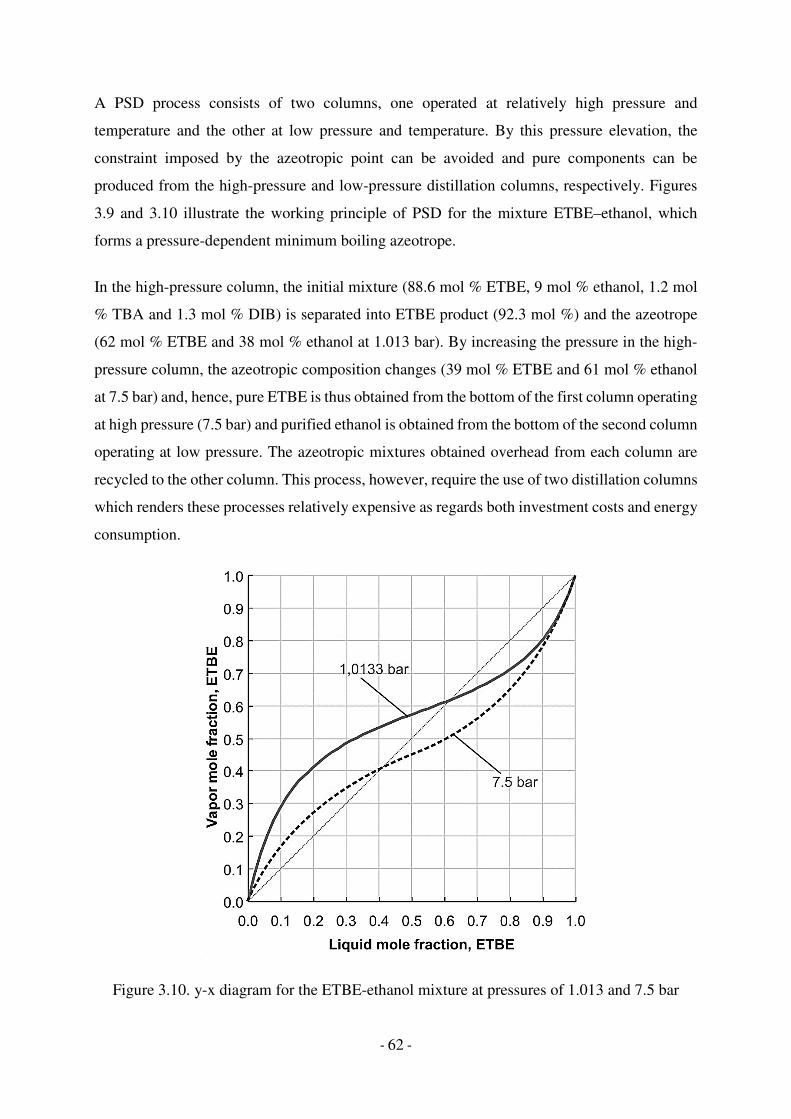
- 62 -
A PSD process consists of two columns, one operated at relatively high pressure and
temperature and the other at low pressure and temperature. By this pressure elevation, the
constraint imposed by the azeotropic point can be avoided and pure components can be
produced from the high-pressure and low-pressure distillation columns, respectively. Figures
3.9 and 3.10 illustrate the working principle of PSD for the mixture ETBE–ethanol, which
forms a pressure-dependent minimum boiling azeotrope.
In the high-pressure column, the initial mixture (88.6 mol % ETBE, 9 mol % ethanol, 1.2 mol
% TBA and 1.3 mol % DIB) is separated into ETBE product (92.3 mol %) and the azeotrope
(62 mol % ETBE and 38 mol % ethanol at 1.013 bar). By increasing the pressure in the high-
pressure column, the azeotropic composition changes (39 mol % ETBE and 61 mol % ethanol
at 7.5 bar) and, hence, pure ETBE is thus obtained from the bottom of the first column operating
at high pressure (7.5 bar) and purified ethanol is obtained from the bottom of the second column
operating at low pressure. The azeotropic mixtures obtained overhead from each column are
recycled to the other column. This process, however, require the use of two distillation columns
which renders these processes relatively expensive as regards both investment costs and energy
consumption.
Figure 3.10. y-x diagram for the ETBE-ethanol mixture at pressures of 1.013 and 7.5 bar

- 63 -
3.5. Simulation results
Taking into account the above aspects, we have performed the simulation of the conventional
process using the Aspen Plus process simulator. We have adopted as reference process the one
in operation at “Petróleos del Norte SA” (a petrochemical Spanish company) which employs a
C4 hydrocarbon stream as feedstock, with 19 % molar content of isobutene as well as the
provision of ethanol in excess (~10 %), as it has been reported by García-Echevarría in 2003.
Accordingly, the production target was to achieve a productivity of 6400 kg h-1 of ETBE with
a minimum purity of 95.2 wt%. It is assumed that all C4-C6 hydrocarbons except isobutene are
inert (Sneesby et al, 1997). Therefore, all the inert C4 hydrocarbons are lumped, based on their
similarities, and represented here by 1-butene.
To carry out the simulation of the debutanizer distillation column for the recovery of C4 as
distillate from C4/ETBE/ethanol mixtures, the RadFrac model (Aspen Plus), which describes
the full performance of the column through rigorous mathematical methods, have been used.
The column operation is simulated at constant internal reflux ratio of 0.5 and pressure between
7 bar and 9 bar, with 26 separation stages, including condenser and reboiler.
Figure 3.11. Components and temperature profile in the high-pressure column (DC2)
The following two distillation columns, which operate according to pressure-swing mode to
achieve ETBE purification and ethanol recovery, have also been simulated by adopting the
RadFrac model. Each of these columns has 16 ideal separation stages, while the operating

- 64 -
pressure is 7.5 bar for the ETBE purification column (high-pressure column, DC2) and 1 atm
for the ethanol recovery column (low-pressure column, DC3). The 3rd column distillate is
partly supplied as reflux to the head of the DC3 column and is in part recycled to the head of
the DC2 column. The purified ETBE is collected at the bottom of the DC2 column. As a bottom
product from the DC3 column, the purified ethanol is recycled to the reaction zone. The
composition and temperature profiles in the high pressure and low pressure columns are shown
in Figures 3.11 and 3.12, respectively.
Figure 3.12. Components and temperature profile in the low-pressure column (DC3)
Figure 3.13. Material balances for the conventional process for the production of ETBE with
pressure swing distillation for product purification (compositions are given as wt.%)
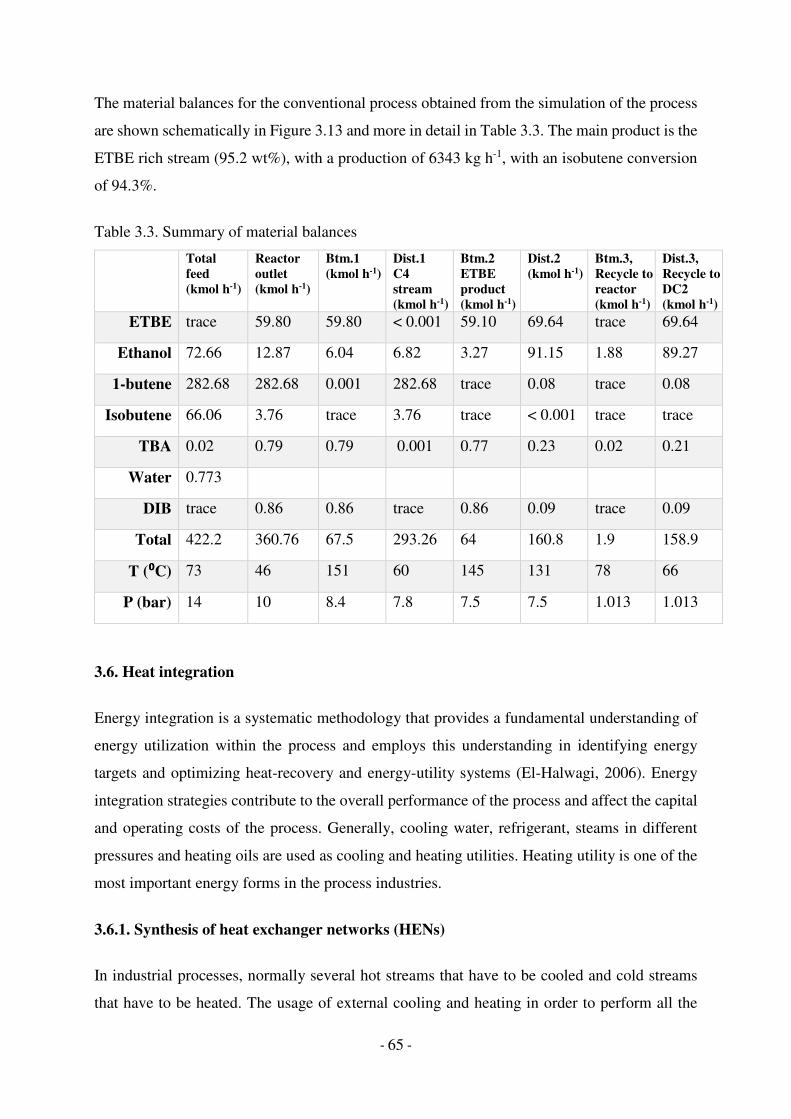
- 65 -
The material balances for the conventional process obtained from the simulation of the process
are shown schematically in Figure 3.13 and more in detail in Table 3.3. The main product is the
ETBE rich stream (95.2 wt%), with a production of 6343 kg h-1, with an isobutene conversion
of 94.3%.
Table 3.3. Summary of material balances
Total feed (kmol h-1)
Reactor outlet (kmol h-1)
Btm.1 (kmol h-1)
Dist.1 C4 stream (kmol h-1)
Btm.2 ETBE product (kmol h-1)
Dist.2 (kmol h-1)
Btm.3, Recycle to reactor (kmol h-1)
Dist.3, Recycle to DC2 (kmol h-1)
ETBE trace 59.80 59.80 < 0.001 59.10 69.64 trace 69.64
Ethanol 72.66 12.87 6.04 6.82 3.27 91.15 1.88 89.27
1-butene 282.68 282.68 0.001 282.68 trace 0.08 trace 0.08
Isobutene 66.06 3.76 trace 3.76 trace < 0.001 trace trace
TBA 0.02 0.79 0.79 0.001 0.77 0.23 0.02 0.21
Water 0.773
DIB trace 0.86 0.86 trace 0.86 0.09 trace 0.09
Total 422.2 360.76 67.5 293.26 64 160.8 1.9 158.9
T (⁰⁰⁰⁰C) 73 46 151 60 145 131 78 66
P (bar) 14 10 8.4 7.8 7.5 7.5 1.013 1.013
3.6. Heat integration
Energy integration is a systematic methodology that provides a fundamental understanding of
energy utilization within the process and employs this understanding in identifying energy
targets and optimizing heat-recovery and energy-utility systems (El-Halwagi, 2006). Energy
integration strategies contribute to the overall performance of the process and affect the capital
and operating costs of the process. Generally, cooling water, refrigerant, steams in different
pressures and heating oils are used as cooling and heating utilities. Heating utility is one of the
most important energy forms in the process industries.
3.6.1. Synthesis of heat exchanger networks (HENs)
In industrial processes, normally several hot streams that have to be cooled and cold streams
that have to be heated. The usage of external cooling and heating in order to perform all the

- 66 -
heating and cooling duties is not cost effective. Integration of heating and cooling tasks may
lead to significant cost reduction. The key concept is to transfer heat from the process hot
streams to the process cold streams before the external utilities are used. The result of this heat
integration is the simultaneous reduction of heating and cooling duties of the external utilities.
In order to providing of HENs, the following aspects must be determined: a) heating/cooling
utilities to be used; b) optimal heat load to be removed/added by each utility; c) the way of
matching for hot and cold streams or stream pairings; d) the optimal system configuration to be
employed. However, to obtain optimal HEN design the utility consumption, the number of heat
exchangers and annual capital cost should also be minimized (El-Halwagi, 2006; Linnhoff and
Hindmarsh, 1983; Ravagnani et al., 2005).
Figure 3.14. Synthesis of HENs
Numerous methods for the synthesis of HENs have been reported in the literature, which have
been summarized in several review studies (Nishida et al., 1981; Linnhof and col., 1978-1989;
Gundersen and Naess, 1988; Douglas, 1988; El-Halwagi, 2006; Stichlmair and Fair, 1998). One
of the key advances in synthesizing HENs is the identification of minimum utility targets ahead
of designing the network using the thermal pinch analysis.
3.6.2. Heat exchanger pinch diagram
In this work, pinch analysis has been applied to evaluate various heat integration options for
the ETBE production using the pressure-swing distillation (PSD) process for the product
purification. The simulation program Aspen Energy Analyzer has been used to create heat
exchanger networks from process models generated in Aspen Plus. The total direct cost of the

- 67 -
heat exchanger networks has been estimated using correlations for costs that have been reported
in the literature (Towler and Sinnott, 2008).
Figure 3.15. Grid diagram for HEN design (base PSD process)
Heat sources and sinks in the plants were covered either solely by utilities or both utilities and
heat integration, by heat exchange. Based on the Composite curves in Figure 3.16, approximate
targets for minimum external heating and cooling seem to be in the range about 5.5 – 5.8 MW.
Figure 3.16. Composite curves for target design
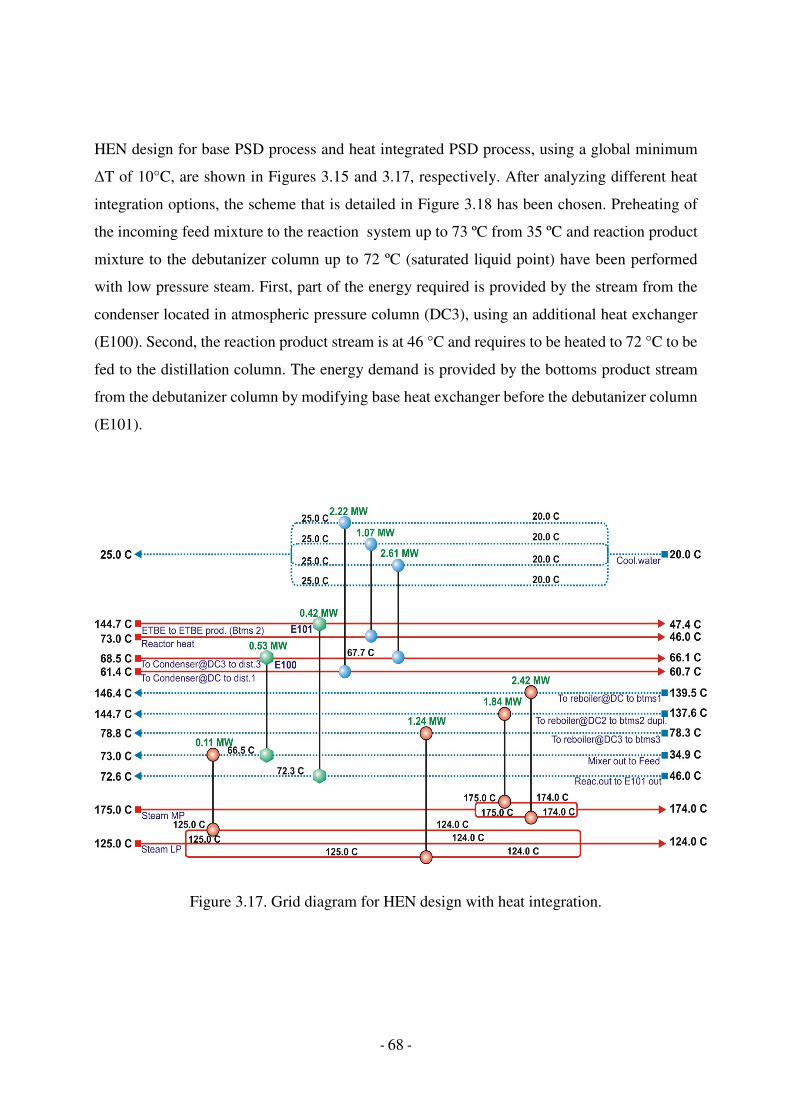
- 68 -
HEN design for base PSD process and heat integrated PSD process, using a global minimum
∆T of 10°C, are shown in Figures 3.15 and 3.17, respectively. After analyzing different heat
integration options, the scheme that is detailed in Figure 3.18 has been chosen. Preheating of
the incoming feed mixture to the reaction system up to 73 ºC from 35 ºC and reaction product
mixture to the debutanizer column up to 72 ºC (saturated liquid point) have been performed
with low pressure steam. First, part of the energy required is provided by the stream from the
condenser located in atmospheric pressure column (DC3), using an additional heat exchanger
(E100). Second, the reaction product stream is at 46 °C and requires to be heated to 72 °C to be
fed to the distillation column. The energy demand is provided by the bottoms product stream
from the debutanizer column by modifying base heat exchanger before the debutanizer column
(E101).
Figure 3.17. Grid diagram for HEN design with heat integration.

- 69 -
Figure 3.18. Heat integrated PSD process for the ETBE production.
Table 3.4. Energy consumption, economic and environmental performances
Base case Design
Low pressure steam 2.30 1.36
Medium pressure steam 4.26 4.26
Total Hot Utilities, MW 6.57 5.62
Cooling water 6.40 5.91
Total Cold Utilities, MW 6.40 5.91
Average utility saving, % - 11
Extra equipment cost, k€ - 17.6
Total equipment purchased cost, k€ 698.7 716.4
Payback period, year - 1
CO2 emission, kg/h 2850 2536
The energy demands for the ETBE production using PSD process can be decreased using heat
integration design (Figure 3.18). The system is composed of 9 heat exchanger units with a total
area of 616 m2. The heating demand is 5.62 MW and the cooling demand is 5.91 MW. The
utilities used are cooling water (20 °C), low pressure steam (125 °C) and medium pressure
steam (175 °C). The total cost has been estimated from both the energy cost of utilities and the
- 70 -
capital cost of the heat exchangers. The capital cost of the heat exchangers have been
determined by the number of units and the minimum network area requirement (Shemfe et al.,
2016). Thus, heat integration with pinch analysis shows that it is possible to achieve savings of
up to 11% in utilities consumption. The heating and the cooling demands, CO2 emission, total
utility and equipment purchased costs for the base case and heat integration option are presented
in Table 3.4.

- 71 -
References:
1. Alonso-Dávila P. Diseño de un proceso óptimo para la producción de éter etil tert-butílico. Tesis Doctoral, Universidad de Cantabria (2003).
2. Boston J F, Sullivan S L. A new class of solution methods for multicomponent, multistage separation processes. Can J Chem Eng 52: 52-63 (1974).
3. Dimian A, Bildea C, Kiss A. Integrated design and simulation of chemical processes. Chapter 9: Synthesis of azeotropic separation systems, 2nd ed., Elsevier Science, pp. 351-390 (2003).
4. Doherty MF, Malone MF. Conceptual design of distillation systems. McGraw-Hill Book Co, Singapore, (2001).
5. Douglas JM. Conceptual design of chemical processes. McGraw-Hill, New York, (1988).
6. Dytnersky YI. Processes and apparatus of chemical technology. Part 2 (in russian). Chemistry, Moscow, (1995).
7. Eduljee HE. Equations replace Gilliland plot. Hydrocarbon Process 54: 120-122 (1975).
8. El-Halwagi M. Heat integration. Academic Press, San Diego, pp. 231-257 (2006).
9. García-Echevarría M. La producción de biocarburantes por Petronor contribuye al uso de energías renovables. DYNA 78: 26-30 (2003).
10. Gilliland ER. Multicomponent rectification estimation of the number of theoretical plates as a function of the reflux ratio. Ind Eng Chem 32: 1220-1223 (1940).
11. Gundersen T, Naess L. The synthesis of cost optimal heat exchanger networks. an industrial review of the state of the art. Comput Chem Eng 12: 503-530 (1988).
12. Hussain Y. Equilibrium separation column. (2011).
13. Izquierdo JF, Cunill F, Vila M, Iborra M, Tejero J. Equilibrium constants for methyl tert-butyl ether and ethyl tert-butyl ether liquid-phase syntheses using C4 olefinic cut. Ind Eng Chem
Res 33: 2830-2835 (1994).
14. Kiss AA. Advanced distillation technologies. Design, control and applications. John Wiley & Sons Ltd, Chichester, (2013).
15. Kister H. Distillation design. McGraw-Hill, New York, (1992).
16. Kister H. Distillation operation. McGraw-Hill, New York, (1992).
17. Levy SG, Van Dongen DB, Doherty MF. Design and synthesis of homogeneous azeotropic distillations. 2. Minimum reflux calculations for nonideal and azeotropic columns. Ind Eng
Chem Fund 24: 463-474 (1985).
18. Linnhoff B, Hindmarsh E. The pinch design method for heat exchanger networks. Chem
Eng Sci 38: 745-763 (1983).

- 72 -
19. Luyben WL. Pressure-swing distillation for minimum- and maximum-boiling homogeneous azeotropes. Ind Eng Chem Res 51: 10881-10886 (2012).
20. Luyben WL. Principles and case studies of simultaneous design. AIChE – Wiley, Hoboken, NJ (2011).
21. Miracca I, Tagliabue L, Trotta R. Multitubular reactors for etherifications. Chem Eng Sci 51: 2349-2358 (1996).
22. Nawaz M, Jobson M. A boundary value design method for complex demethaniser distillation columns. Chem Eng Res Des 89: 1333-1347 (2011).
23. Nishida N, Stephanopoulos G, Westerberg AW. A review of process synthesis. AIChE J 27: 321-351 (1981).
24. Perry RH, Green DW, Maloney JO. Perry’s chemical engineers’ handbook, 7th ed. McGraw-Hill, New York (1997).
25. Pucci A, Mikitenko P, Zuliani M; Process for the separation of tert butyl ethyl ether from mixtures. U.S. Patent No. 5.158.652 (1992).
26. Quitain A, Itoh H, Goto S. Reactive distillation for synthesizing ethyl fe/t-butyl ether from bioethanol. J Chem Eng Jpn 32: 280-287 (1999).
27. Ravagnani MASS, Silva AP, Arroyo PA, Constantino AA. Heat exchanger network synthesis and optimisation using genetic algorithm. Appl Therm Eng 25: 1003-1017 (2005).
28. Robinson CS, Gilliland ER. Elements of fractional distillation. McGraw-Hill, New York (1950).
29. Seader JD, Henley EJ. Separation process principles, John Wiley & Sons, New York (1998).
30. Shemfe MB, Fidalgo B, Gu S. Heat integration for bio-oil hydroprocessing coupled with aqueous phase steam reforming. Chem Eng Res Des 107: 73-80 (2016).
31. Sneesby MG, Tadé MO, Datta R, Smith TN. ETBE synthesis via reactive distillation. 1. steady-state simulation and design aspects. Ind Eng Chem Res 36: 1855-1869 (1997).
32. Stichlmair GJ, Fair RJ. Distillation principles and practices. Wiley-VCH, New York (1998).
33. Streicher C, Asselineau L, Forestière A. Separation of alcohol/ether/hydrocarbon mixtures in industrial etherification processes for gasoline production. Pure Appl Chem 67: 985-992 (1995).
34. Towler G, Sinnott R. Chemical engineering design: Principles, practice and economics of plant and process design. Elsevier, Burlington, USA (2008).
35. Venkataraman, S, Chan WK, Boston JF. Reactive distillation using Aspen plus. Chem Eng
Prog 86: 45-54 (1990).
36. Vila M, Cunill F, Izquierdo J, Tejero J, Iborra M. Equilibrium constants for ethyl tert-butyl ether liquid-phase synthesis. Chem Eng Commun 124: 223-232 (1993).

- 73 -
CHAPTER 4 MEMBRANE INTEGRATED HYBRID PROCESS FOR THE PRODUCTION
OF ETBE
Chapter contents
4.1. Introduction
4.2. Membranes for the separation of ether/alcohol containing mixtures by
pervaporation
4.3. Pervap 2256 membrane
4.4. PV and distillation hybrid process options for the ETBE production
4.5. Modelling and simulation
4.5.1. Thermodynamic method
4.5.2. Modeling the reaction unit
4.5.3. Modeling of the debutanizer distillation column
4.5.4. Modeling mass transport in the pervaporation unit
4.6 Simulation results
4.7. Heat integration optimization for hybrid process
References

- 74 -
4.1. Introduction
In this section, the use of a membrane technology for the debottlenecking an existing ETBE
separation process, constituting a hybrid separation process, has been evaluated. By definition,
the term debottlenecking indicates the action of “increasing the production capacity of existing
facilities through the modification of existing equipment to remove throughput restrictions”
(Encyclo, 2014). Pervaporation is one of the most promising technologies for debottlenecking
purposes since it is not affected by the presence of an azeotrope and because pervaporation is a
low energy consumption technology (Genduso, 2016).
Pervaporation is a separation process in which the components from a liquid mixture permeate
selectively through a dense membrane driven by a chemical potential gradient favored by
reduction of the partial pressure on the permeate side (Néel, 1997). The affinity between the
permeant and the polymer material that constitutes the membrane, as well as its mobility
through the membrane matrix, are the main factors for the transport of the permeating
compounds. The concentration difference at the permeate side is neglected due to the
significantly higher diffusion coefficients of the components in the vapor phase compared to
the liquid phase. The transport phenomena of pervaporation have been studied and described
extensively in the literature (Néel, 1997; Lipnizki and Trägårdh, 2001; Luis and Van der
Bruggen, 2015). In theory, pervaporation can be used to separate any liquid mixtures, but in
practice, pervaporation tends to be used to separate azeotropic mixtures, close boiling-point
mixtures, for the recovery of small quantities of impurities and for the enhancement of
equilibrium reactions (Vane, 2005; Ortiz et al., 2005; Chapman et al., 2008; García et al., 2008;
Van der Bruggen and Luis, 2014; Orozco‐González, 2016).
4.2. Membranes for the separation of ether/alcohol containing mixtures by pervaporation
The separation of organic-organic mixtures is possibly the most challenging application in
pervaporation, and for that reason, great efforts have been made in the last two decades for the
development of new membranes (Doghieri et al., 1994; Smitha et al., 2004; Villaluenga et al.,
2004; Zereshki et al., 2011; Wang et al., 2014; Villegas et al., 2016). Specifically, for separating
alcohol/ether mixtures various membrane materials have been studied, and in recent years some
commercial membranes are available (González and Ortiz, 2001; Ortiz et al., 2002; Gorri et al.,
2006; Matuschewski and Schedler, 2008; Genduso et al., 2016). The ability of these membranes

- 75 -
to break the alcohol/ether azeotropes by means of selective permeation of the alcohol has been
experimentally demonstrated.
The most significant component in the membrane separation processes is the membrane itself.
According to the international nomenclature and definition, the membrane is a permselective
block between two phases (Koops, 1995).
Actual industrial application process objectives are:
� Search and selection of membranes and membrane materials that meet the specific
requirements for a specific separation task;
� Identifying the main factors affecting the separation efficiency.
Difficulties in selecting a membrane material for a particular separation purpose related both to
the need to select a specific material for optimal separation of a given mixture, and with the
strong impact of the separation of mixtures on the membrane material, difficult to predict its
behavior, the separation of a mixture according to the permeability of the individual
components.
The first industrial application for ether/alcohol separation using pervaporation was reported
by Air Products for the removal of methanol from MTBE in the production of octane enhancer
for fuel blends (Chen et al., 1989). After this, much research work in the pervaporation
separation of alcohol/ethers mixtures has been reported using various membranes (Pasternak et
al., 1990; Chen and Martin., 1995; Niang et al., 1997).
Earlier studies in the pervaporation separation of MTBE are related to Chen and coworkers,
who investigated cellulose acetate membranes for the selective separation of alcohols from
ethers (Chen et al., 1988, 1989). Farnand and Noh tested the Nafion membrane to separate
methanol from C4 hydrocarbons (Farnand and Noh, 1989). The use of polyvinylalcohol (PVA)
was introduced by Cen and colleagues for the pervaporative separation of methanol/MTBE
mixtures (Cen et al., 1989). Pasternak and coworkers used membrane technologies for the
separation of methanol from organic oxygenates (Pasternak et al., 1990; Shah et al., 1989).
Nakagawa and Matsuo (1990) reported a polyimide membrane for the separation of methanol
from hydrocarbons in the synthesis of MTBE. The application of a thin film of polystyrene-
sulfonate onto the surface of a microporous alumina support membrane was proposed by Chen
and Martin in 1995. Park et al. (1995) applied and proven the advantages of the polymer blend

- 76 -
concept by using a PVA and a polyacrylic acid (PAA) membrane blend for the separation of
MTBE and methanol. The pervaporation performance of a blend membrane made from
cellulose acetate and cellulose acetate hydrogen phthalate for the methanol/MTBE separation
was investigated by Niang et al. (1997). Kim et al. (2000) reported on the use of a polyion
complex composite membrane for pervaporative separation of methanol/MTBE ternary
mixture. Recently, several kinds of polymers have been reported on the preparation membranes
for separating the methanol–MTBE mixtures, such as poly(lactic acid), poly(vinyl acetate),
poly(vinyl pyrrolidone), cellulose and chitosan (Zereshki et al., 2010b; Yoshida and Cohen,
2003; Niang and Luo, 2001 ; Huang et al., 2001).
Because of less negative impacts of ETBE to environment, it is seeing increasing use as
oxygenate for gasoline to meet the clean Air Act requirements. As a result, the production of
ETBE has increased during the last several years. As MTBE, ETBE also is produced by reacting
isobutene with excess ethanol (~10 %), and the unreacted ethanol is subsequently distilled off
and recovered. Ethanol forms a minimum-boiling azeotrope with ETBE with a composition of
43 mol % ethanol at atmospheric pressure.
In the past decades, organoselective membranes for the separation of ethanol/ETBE mixtures
have attracted widespread attention in the ETBE production. Although comparatively a greater
number of studies have been reported in the literature for the MeOH/MTBE system than for the
ethanol/EBTE system, the same membranes or quite similar membranes (varying the degree of
crosslinking) could be used to carry out both separations.
Jonquières and colleagues have reported several studies in which they have used various types
of materials, such as polyurethaneimides (PUI) (Jonquières et al., 1996), polyamideimides
(PAI) synthesized from six dianhydride monomers containing amide functions (Jonquières et
al., 2000) and poly(urethane-amide-imide) (PUAI) block copolymers (Jonquières et al., 2005)
to study pervaporation performances for the separation of ethanol/ETBE mixtures.
Pervaporation experiments for different alcohol/ETBE and ethanol/ether mixtures were
performed (Jonquières et al., 1996). Also, Roizard et al. (1997) studied pervaporation
membranes made from polyvinylalcohol (PVA), polysulfone (PSU), polyacrylic acid (PAA),
cellulose acetate (CA), ion exchange resins or silicone network.
Luo, Niang and Schaetzel prepared and studied the behavior of of different materials such as
cellulose acetate propionate (CAP), blending cellulose acetate butyrate with CAP, blending

- 77 -
poly(acrylic acid) with CAP and blending 5 wt% poly(1-vinylpyrrolidone-co-acrylic acid) with
cellulose acetate propionate for the separation of ETBE and ethanol mixtures. Accordingly
pervaporation results, the blended membranes had higher performances than those of pure CAP
membranes and by increasing temperature and ethanol content in the feed stream the
permeation flux also increased (Luo, Niang and Schaetzel, 1997a; 1997b; 1997c; 1999).
Novel pervaporation membranes made from a semi-interpenetrating polymer network (s-IPN)
(1997a) and poly(vinyl pyrrolidone-co-vinyl acetate)-cellulose acetate blends (1997b) for
ethanol/ETBE separation, were investigated by Nguyen et al. in 1997. Experimental results
show that the crosslinked membranes exhibited improved selectivity (permeate ethanol content
higher than 99.6%) and slightly reduced permeability compared with the un-crosslinked
membrane.
Touchal et al. (2006) reported studies with two kinds of membranes: one from homopolymer
blends Poly(N-vinyl-pyrrolidinone (PVP) and Poly(trimethyl methacrylamidopropyl
ammonium) methylsulfate (PTMA)) and the other, a copolymer from N-vinyl-2-pyrrolidinone
(NVP) and N-[3-(trimethylamoniopropyl)] methacrylamidemethylsulfate (TMA)). Authors
investigated the influences of the polymer blend composition and the role of the polymer
microstructures on the membrane properties and concluded that highly ethanol selective
membranes could be obtained from PVP blends and from pyrrolidinone-based crosslinked
copolymers.
Zereshki et al. (2011) studied the pervaporation properties of poly lactic acid (PLA) in a
polar/non-polar case study. PLA/PVP (poly vinyl pyrrolidone) blend membranes were prepared
containing different PVP contents and evaluated in ethanol/ETBE azeotropic separation. The
degree of swelling and the permeation flux gradually increased when the PVP amount increased
to 21 wt%. On the other hand, the ethanol separation factor initially increased to 16 using 3
wt% PVP and then decreased to 3 using 21 wt% PVP.
The pervaporation experiments with a commercial membrane (PERVAP 2256, Sulzer
Chemtech) show a total permeation flux of 1200 g/m2 h with a permeate purity of 97 wt. %
(ethanol) working with a feed mixture of 40 wt % ethanol/ETBE at 70°C. Various attempts
have been made in different ways to improve the separation performance of the membrane
(Ortiz et al., 2002).

- 78 -
Recently, Abdellatif et al., (2017) obtained new bio-based membranes by grafting cellulose
acetate with controlled PLA amounts by a “grafting onto” strategy. The CA-g-PLA copolymers
were characterized by ATR-FTIR, 1H NMR, DSC and SAXS. Their membrane properties were
investigated in terms of structure-morphology-property relationships for the sorption and
pervaporation of the targeted ethanol/ETBE mixture.
Table 4.1. PV separation of ethanol and ETBE containing mixtures through various polymeric
membranes
Membrane Feed, wt% ethanol
Temp., ºC
Purity, wt%
Flux, g/m2h
Reference
PAI 20 50 67 2508 Jonquières et
al., 2000
PUAI block copolymers 20 50 85 1100 Jonquières et
al., 2005
CAP 20 40 98 560 Luo et al., 1997a
CAB/CAP 20 40 98 137 Luo et al., 1997b
PAA/CAP 20 40 96 835 Luo et al., 1997c
Poly(1-vinylpyrrolidone-co-acrylic acid)/CAP
20 40-60 98-96 525-
1240
Luo et al., 1999
Poly(vinyl pyrrolidone-co-vinyl acetate) and CA blends
20 40 98 620 Nguyen et al.,
1997
s-IPN materials 20 40 96 2000 Nguyen et al.,
1999
Pervap 2256 (commercial membrane)
40 60 97 1200 Ortiz et al., 2002
PVA, PSU, PAA, CA, ion exchange resin
20 40 95 1000 Roizard et al.,
1998
NVP/TMA 20 50 97 3500 Touchal et al.,
2006
PLA/PVP 20 30 96 1350 Zereshki et al.,
2011
Grafting PVP/PLA 20 50 99 22 Abdellatif et al.,
2017
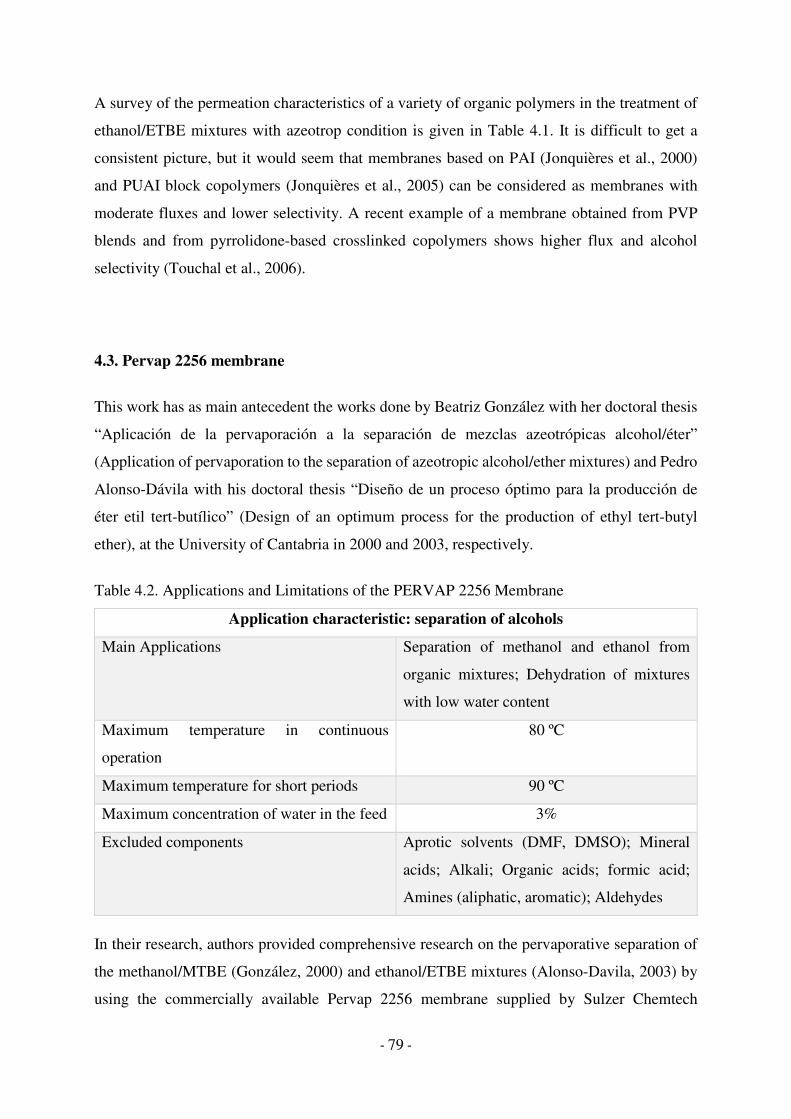
- 79 -
A survey of the permeation characteristics of a variety of organic polymers in the treatment of
ethanol/ETBE mixtures with azeotrop condition is given in Table 4.1. It is difficult to get a
consistent picture, but it would seem that membranes based on PAI (Jonquières et al., 2000)
and PUAI block copolymers (Jonquières et al., 2005) can be considered as membranes with
moderate fluxes and lower selectivity. A recent example of a membrane obtained from PVP
blends and from pyrrolidone-based crosslinked copolymers shows higher flux and alcohol
selectivity (Touchal et al., 2006).
4.3. Pervap 2256 membrane
This work has as main antecedent the works done by Beatriz González with her doctoral thesis
“Aplicación de la pervaporación a la separación de mezclas azeotrópicas alcohol/éter”
(Application of pervaporation to the separation of azeotropic alcohol/ether mixtures) and Pedro
Alonso-Dávila with his doctoral thesis “Diseño de un proceso óptimo para la producción de
éter etil tert-butílico” (Design of an optimum process for the production of ethyl tert-butyl
ether), at the University of Cantabria in 2000 and 2003, respectively.
Table 4.2. Applications and Limitations of the PERVAP 2256 Membrane
Application characteristic: separation of alcohols
Main Applications Separation of methanol and ethanol from
organic mixtures; Dehydration of mixtures
with low water content
Maximum temperature in continuous
operation
80 ºC
Maximum temperature for short periods 90 ºC
Maximum concentration of water in the feed 3%
Excluded components Aprotic solvents (DMF, DMSO); Mineral
acids; Alkali; Organic acids; formic acid;
Amines (aliphatic, aromatic); Aldehydes
In their research, authors provided comprehensive research on the pervaporative separation of
the methanol/MTBE (González, 2000) and ethanol/ETBE mixtures (Alonso-Davila, 2003) by
using the commercially available Pervap 2256 membrane supplied by Sulzer Chemtech

- 80 -
(Neunkirchen, Germany). It should be noted that at the time of the research, this membrane was
actually shown the selectivity towards methanol and ethanol in their respective alcohol/ether
mixtures (González, 2000; Alonso-Davila, 2003).
The PERVAP 2256 membrane is recommended for the separation of methanol and ethanol
from its mixtures with other organic liquids, and can only tolerate small concentrations of water
in the feed, so that, while being selective towards water, it is not useful for typical applications
of dehydration. The limits of use of this membrane are shown in Table 4.2 (González, 2000).
In the PERVAP 2256 membrane following layers can be distinguished: the polyvinyl alcohol
(PVA) selective layer with approximately 5 microns thickness and a micro porous
polyacrylonitrile (PAN) support with an effective thickness of about 180 microns (Figure 4.1)
(Alonso-Dávila, 2003).
Figure 4.1. SEM photography of the PERVAP 2256 membrane
4.4. PV and distillation hybrid process options for the ETBE production
As discussed in the Chapter 1, membrane processes often undergo several drawbacks when
used alone, in spite of its merits. Pervaporation alone is unable to achieve products of high
purity because it involves working with very low driving force for mass transfer, which results
in low permeate fluxes. With the purpose to overcome these constraints, membrane integrated

- 81 -
hybrid processes have been developed to optimize the productivity of separation processes.
Integrating two unit operations with different separation principles may have a synergetic
effect, and the resulting separation may be better than the separation obtained with either unit
operation alone (Koczka et al., 2007; Vane and Alvarez, 2008; Luis et al., 2011; Kiss, 2014).
The different types of separation units can be combined in various ways (Figure 4.2); the
pervaporation unit can be positioned: i) PV before the distillation column (case A), ii) PV after
the column on a side stream (case C) or directly in the distillate stream of the column (case B).
Depending on the particular separation task, the configuration and operation of a hybrid system
could be designed and optimized using process flow-sheet simulation packages to achieve
optimal results.
Figure 4.2. PV integrated design alternatives for the purification of product streams in the ETBE production
Several works have been published so far analyzing the performance of hybrid processes for
separating MTBE/methanol mixtures as summarized Sridhar et al (2005). Although the process
to produce ETBE is analog, there are remarkable differences in both the characteristics of the
mixtures to be separated (i.e. composition of the azeotropes) and in the operating conditions of
the equipment (i.e. condenser temperature, pressure in the debutanizer column) that justify the
need to analyze this specific case study.
Lipnizki et al. (1999) reviewed both present and future prospects of pervaporation integrated
hybrid processes and analyzed different schemes for several study cases. Streicher et al. (1995)
examined an integrated hybrid process combining distillation and PV with alcohol-selective
membranes. The authors found that this process that combines purification of ETBE and the
recycling of the ethanol excess in the bottom product to the reactor is more cost-effective than
the conventional two-column distillation process. With similar investment costs the hybrid

- 82 -
process could save up to 60 % in operating costs, depending on the plant size and process
conditions. Luo et al. (1997) reported research results on the performance of a pervaporation
hybrid process for the selective separation of ethanol from ethanol/ETBE mixture. In that work,
a cellulose derivative membrane was investigated and the process selectivity and permeability
of the components were analyzed. In order to simplify the simulation conditions, Luo et al.
(1997) assumed that the feed stream was a binary mixture containing only ethanol and ETBE,
and the PV module was connected to the distillate stream. As reported in chapter 2, hybrid
processes promise higher economic profits compared to conventional separation processes.
However, the approximation of considering a binary mixture might bring errors on the
evaluation of the membrane area. Thus, in our study we have considered multicomponent
mixtures (including C4 compounds, i.e. 1-butene and isobutene). In the separation by
pervaporation, the mathematical model assumes that only ethanol and ETBE permeate through
the membrane, but the presence of C4 compounds remarkably modifies the activity of the
species in the liquid phase, and therefore affects the driving force for pervaporation.
4.5. Modelling and simulation
In order to choose the best option for membrane integrated hybrid process, three alternative
flow-sheets of hybrid PV-distillation process for ETBE production are studied (Figure 4.2). The
objective of this work is to propose a process synthesis procedure that allows the determination
of the optimal process configuration, design and operation for a given separation target. First,
we have carried out a rigorous simulation of the azeotropic distillation column and the
pervaporation membrane units with the distillation column parameters previously reported by
Streicher et al. (1995) and Alonso-Davila (2003). The PV performance is based on the
experimental results reported by Ortiz et al. in 2002. A mathematical model of the PV
membrane modules was developed in ACMand integrated with Aspen Plus software. The mass
transport rate of the components through the membrane is proportional to the activity gradient
of permeant components as driving force. Multicomponent vapor-liquid equilibrium of this
mixture has been predicted by using the UNIFAC-Dortmund thermodynamic model. The
possibilities of membrane integrated hybrid processes with the design of Reactor–PV–
Distillation (case A), Reactor–Distillation–PV (with PV on the distillate stream) (case B) and
Reactor–Distillation–PV (with PV on a side stream) (case C) alternatives for ETBE production
are studied and analyzed (Figure 4.2). In addition to the accomplishment of environmental

- 83 -
standards, all the studied hybrid processes allow the recovery of over 99% of ETBE with a
purity of at least 95.2 wt%.
The process licensed by Hüls (Obenaus and Droste, 1980) has been chosen for process analysis
(Figure 4.3). In the conventional process, ETBE is recovered as the bottoms product of the
distillation unit and the ethanol-rich C4 distillate is sent to the ethanol recovery section. Water
is used to extract the ethanol excess and recycle it back to the process. At the top of the
ethanol/water separation column, the ethanol/water azeotrope is recycled to the reactor section;
this is a major drawback of the conventional process because water will react with butenes (in
the catalytic reactor) to form tertiary butyl alcohol (TBA) (Cunill et al., 1993). Thus, the use of
wet ethanol results in decreased isobutene conversion and ether product purity. Therefore, the
use of pervaporation to selectively recover a significant portion of the unreacted ethanol will
enable us to substantially decrease the amount of water reaching the reaction section and
thereby decrease the formation of TBA.
Figure 4.3. Schematic flow diagram of the conventional Huels process for ETBE production.
The combination of a pervaporation unit with the distillation column can reduce the complexity
and the investment required for a high conversion plant, as well as increase the production of
ether by using C4 streams with higher isobutene content; the hybrid process leads directly to
almost pure ether in the bottom stream with the design and operation of the column almost
unchanged. In this work the reaction system and debutanizer column used in the conventional
process for ETBE production licensed by Huels (Obenaus and Droste, 1980) has been chosen
as the first part of the hybrid process.

- 84 -
4.5.1. Thermodynamic method
The simulation of the separation section and the optimization of the whole process require the
use of thermodynamic models that should predict with precision the vapor-liquid equilibria and
in particular the presence of azeotropes for the compounds present in the separation section.
These include a blend of C4 hydrocarbons from the feed, ETBE, ethanol and other alcohols
from the feed and secondary reactions, and water from secondary reactions as well as from the
washing tower used for cleaning the hydrocarbons blend (Verrazzi et al., 1998).
As previously reported by Gmehling et al. (2015), the UNIFAC method is particularly
applicable for the prediction of the vapor-liquid equilibrium for multicomponent mixtures in
the absence of experimental data. In group contribution methods it is assumed that the mixture
does not consist of molecules but of functional groups. The required activity coefficients can
then be calculated via group activity coefficients when the group interaction parameters
between the functional groups are known. In this work, we have chosen the UNIFAC-Dortmund
group contribution method considering that this thermodynamic method is able to predict the
non-ideal behavior of the ethanol/ETBE/C4 mixtures at moderate pressures (Gmehling et al.,
1995). The Dortmund modified UNIFAC is today the UNIFAC version that has the most
extensive parameter table, although some of its parameters are not yet published in the open
literature.
4.5.2. Modeling the reaction unit
The synthesis of ETBE is usually performed at medium pressure (10 bar) in liquid phase using
an ion exchange resin as catalyst, for example Amberlyst, Lewatit, etc (Fité et al, 1994; Zhang
et al., 1997). ETBE is obtained by the reaction between ethanol and isobutylene. As shown in
chapter 2, the overall reaction mechanism of conversion in the synthesis of ETBE can be
represented as:
(cz(((c¡)z + (zc�wc↔ (zc�w(((c¡)¡ (Eq. 4.1)
Isobutene ethanol ETBE
(cz(((c¡)z + czw ↔ (((c¡)¡wc (Eq. 4.2)
Isobutene water TBA

- 85 -
2(cz(((c¡)z→ (�c"� (Eq. 4.3)
2 Isobutene diisobutene
A REquil reactor model (Aspen Plus) with chemical equilibrium constants from literature
(Sneesby et al., 1997; Izquierdo et al., 1994) was used to calculate the products composition
and the total molar flow-rate. The REquil reactor does not take into account reaction kinetics,
even though the results provide a useful reference to be compared with experimental results,
since this equilibrium reactor model can adequately describe conversion changes based on the
amount of recycled ethanol. The reactor operates at 10 bar and 46 ºC, so that water can be used
as coolant utility.
4.5.3. Modeling of the debutanizer distillation column
Modeling and simulation of a distillation column for the recovery of C4 as distillate from
ethanol/ETBE/C4 mixtures, has been performed using the RadFrac model (Aspen Plus), which
describes the full performance of the column through rigorous mathematical methods. The
column operation is simulated at constant internal reflux ratio of 0.5 and pressure between 7
bar and 9 bar, with 26 ideal separation stages, including condenser and reboiler. The detailed
calculation methods have been described in Chapter 2.
4.5.4. Modeling mass transport in the pervaporation unit
Modeling and simulation have become indispensable tools for engineers and researchers in
synthesis, analysis and optimization of processes. Depending on the requirements of the model,
different models with different complexities can be used, which differ greatly in predictive
accuracy and determining the appropriate model parameters (Lipnizki and Trägårdh, 2001).
For our study, a global transmembrane model based on the solution-diffusion theory was
selected. It assumes equilibrium between the upstream liquid and the upstream membrane

- 86 -
surface, and between the downstream vapor and its membrane side. Membrane transport
follows Fick’s law, with the permeant fugacity difference as the driving force. An intrinsic
membrane property is the permeability (permeant flux times membrane thickness divided by
permeant driving force) or the permeance (permeant flux divided by the permeant driving
force). The latter magnitude is used for asymmetric or composite membranes for which the
effective membrane thickness is not readily available (Wijmans, 2003).
The permeance of component i in the membrane, Qi, is defined with regard to the flux Ji as:
( ) ( )perm
ii
feed
i
o
ii
perm
i
feed
iii pxpQffQJ −≈−= γˆˆ (Eq. 4.4)
where feed
if̂ and perm
if̂ are the fugacities of component i in the feed mixture and in the permeate
side of the membrane, respectively. The saturation vapor pressure (o
ip ) is obtained from the
Antoine equation and the activity coefficients ( iγ ) have been obtained using the UNIFAC-
Dortmund model.
The activities of the components in the liquid phase are calculated as:
iii xa γ= (Eq. 4.5)
In this work we have used the experimental data for the separation of ethanol/ETBE mixtures
by pervaporation with PERVAP 2256 commercial membranes reported in previous papers by
our research group. Those experimental data have now been incorporated into a model that
describes the mass transport through the membrane as a function of the activity of the
components and operating conditions. As reported by Ortiz et al. (2002) the partial fluxes are a
nonlinear function of the activity of the components, which means that the permeances are not
constant but depend on the activity of the components. Therefore, taking into account the
various semi-empirical models reported in literature, we have adjusted the ethanol permeability
data to an equation that depends only on the activity of ethanol, as follows:
( ) 1*11
C
ethanolethanol aBAQ += (Eq. 4.6)
With regard to ETBE, we have found that its permeance can be described as a function of the
activities of both ethanol and ETBE, as follows:

- 87 -
( ) ( )ETBEethanolETBE aCaBAQ ** 222 ++= (Eq. 4.7)
We have assumed that only two components (ethanol and ETBE) permeate through the
membrane, while the rest of the components remain at the retentate side and do not permeate.
This simplification was experimentally tested with the membrane PERVAP 2256 used to find
the experimental data.
In this study, the temperature dependence of membrane permeance in the proposed
mathematical model was described trough the Arrhenius-type equation (Eq. 4.8),
−=
TR
EQQ
iact
ToiTi
,
,, exp (Eq. 4.8)
Experimental permeation data from Alonso-Dávila (2003) have been fitted to Eqs. 4.6-4.8 using
the ACM(AspenTech) software tool, obtaining the estimated parameters that are reported in
Table 4.3. The experimental data used to estimate the model parameters were obtained from
laboratory-scale experiments performed under isothermal conditions.
Table 4.3. Parameters of the pervaporation model for ethanol/ETBE mixtures permeating
through PERVAP 2256 membrane (65 ºC)
Ethanol ETBE
XETBE > 0.78 XETBE < 0.78
Ai 4.79x10⁻³ 8.61x10⁻³ 7.57x10⁻⁴
Bi 0.186 - 4.04x10⁻⁴ - 3.03x10⁻⁴
Ci 8.208 - 1.43x10⁻⁴ - 7.08x10⁻⁴
Eact, i (kJ mol-1) - 3.35 - 3.91
Comparison of the experimental data (Alonso-Dávila, 2003) with the model data fitting (Eqs.
4.4-4.8) is shown in Figures 4.4a and 4.4b.

- 88 -
Figure 4.4a. Influence of the feed concentration on the total flux through the Pervap-2256
membrane. The solid lines represent the predictions of the model.
Figure 4.4b. Influence of the feed concentration on the ethanol content in the permeate. The
solid lines represent the predictions of the model.
0
0.5
1
1.5
2
2.5
0 0.1 0.2 0.3 0.4 0.5
To
tal f
lux
(k
g m
-2h
-1)
Ethanol mass fraction in the feed
exp 60ºC
exp 50ºC
exp 40ºC
0.8
0.82
0.84
0.86
0.88
0.9
0.92
0.94
0.96
0.98
1
0 0.1 0.2 0.3 0.4 0.5
Eth
an
ol m
as
s f
racti
on
in
perm
ea
te
Ethanol mass fraction in the feed
exp 40ºC
exp 50ºC
exp 60ºC
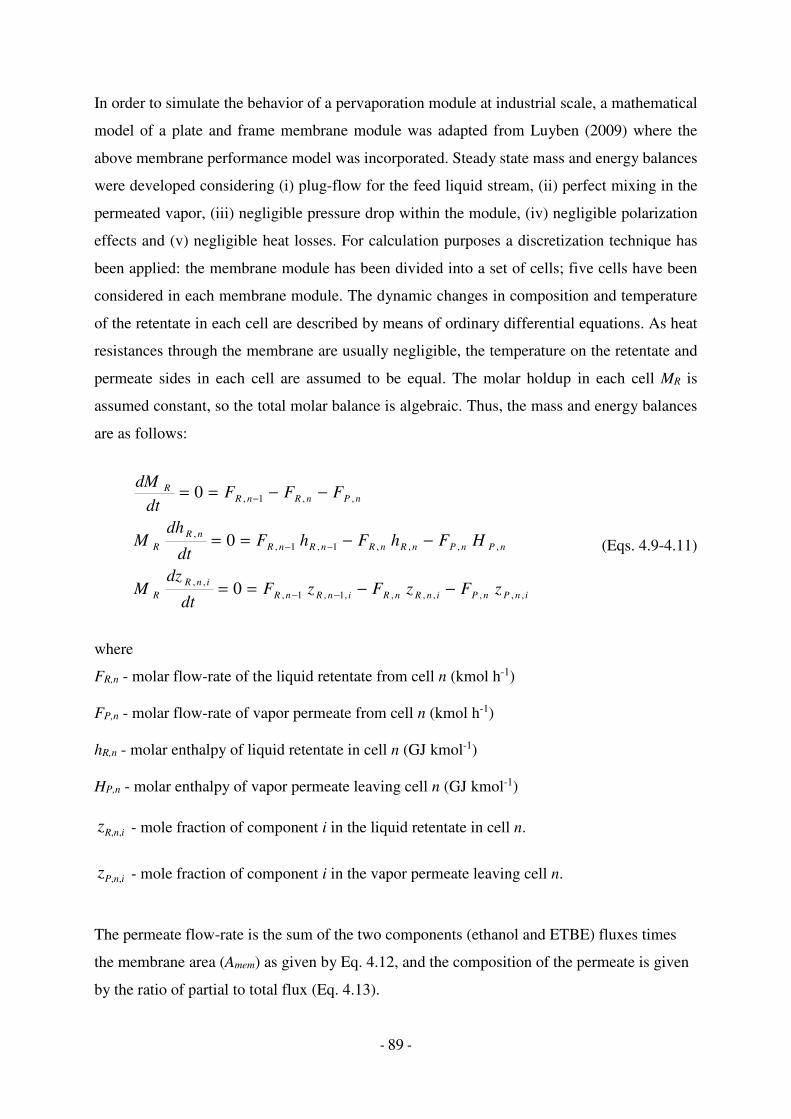
- 89 -
In order to simulate the behavior of a pervaporation module at industrial scale, a mathematical
model of a plate and frame membrane module was adapted from Luyben (2009) where the
above membrane performance model was incorporated. Steady state mass and energy balances
were developed considering (i) plug-flow for the feed liquid stream, (ii) perfect mixing in the
permeated vapor, (iii) negligible pressure drop within the module, (iv) negligible polarization
effects and (v) negligible heat losses. For calculation purposes a discretization technique has
been applied: the membrane module has been divided into a set of cells; five cells have been
considered in each membrane module. The dynamic changes in composition and temperature
of the retentate in each cell are described by means of ordinary differential equations. As heat
resistances through the membrane are usually negligible, the temperature on the retentate and
permeate sides in each cell are assumed to be equal. The molar holdup in each cell MR is
assumed constant, so the total molar balance is algebraic. Thus, the mass and energy balances
are as follows:
inPnPinRnRinRnR
inR
R
nPnPnRnRnRnR
nR
R
nPnRnRR
zFzFzFdt
dzM
HFhFhFdt
dhM
FFFdt
dM
,,,,,,,1,1,
,,
,,,,1,1,
,
,,1,
0
0
0
−−==
−−==
−−==
−−
−−
−
(Eqs. 4.9-4.11)
where
FR,n - molar flow-rate of the liquid retentate from cell n (kmol h-1)
FP,n - molar flow-rate of vapor permeate from cell n (kmol h-1)
hR,n - molar enthalpy of liquid retentate in cell n (GJ kmol-1)
HP,n - molar enthalpy of vapor permeate leaving cell n (GJ kmol-1)
inRz ,, - mole fraction of component i in the liquid retentate in cell n.
inPz ,, - mole fraction of component i in the vapor permeate leaving cell n.
The permeate flow-rate is the sum of the two components (ethanol and ETBE) fluxes times
the membrane area (Amem) as given by Eq. 4.12, and the composition of the permeate is given
by the ratio of partial to total flux (Eq. 4.13).

- 90 -
( )ETBEnethanolnmemnP JJAF ,,, += (Eq. 4.12)
nP
in
meminPF
JAz
,
,
,, ×= (Eq. 4.13)
The flux of component “i” in each cell is calculated using the following equation:
( )permeateiP
sat
iiiRii PzPzQJ −= γ (Eq. 4.14)
The temperature of the retentate is calculated from the known liquid enthalpy hR,n and the
known retentate composition ZR,n using physical properties relationships.
The Aspen Custom Modeler (ACM) software is used to simulate the pervaporation process.
Composition and temperature of the retentate and permeate streams are variables distributed
along the module, which are computed by simultaneously solving the material and energy
balances (Eqs. 4.9-4.11). To do this, the thermodynamic properties that are a function of
temperature and composition need to be computed in each cell using subroutines specific in
ACM software. Thus, properties such as activity coefficients, vapor pressure, density, heat
capacity, and liquid and vapor enthalpies are calculated as variables distributed along the
membrane module. In addition, the membrane permeances are also calculated in each cell using
the equations of the proposed model (Eqs. 4.6-4.8) as a function of the activities and
temperature. The differential and algebraic equations (Eqs. 4.6-4.14) for each cell and each
module are incorporated in the ACM program. The ACM model is then exported to Aspen Plus
software as a standalone module to integrate the pervaporation membrane module into global
flow-sheets. So we can evaluate diagrams with different configurations or different number of
membrane modules, and analyze the influence of the recycling streams (recovered unreacted
ethanol). Considering the commercially available pervaporation modules, a membrane area of
30 m2 for each module was assumed. Permeating molecules are removed from the downstream
surface of the membrane in the vapor phase, and the latent heat for the phase change is obtained
from the sensible heat of the feed (Baker, 2012). Thus, in PV cells a temperature drop will be
observed between the feed inlet and the retentate outlet streams. Feed pressure has been chosen
such that the feed to the PV modules is in the liquid state at the operating temperature (70 ºC).

- 91 -
4.6 Simulation results
We have adopted as reference process the one in operation at “Petróleos del Norte SA” (a
petrochemical Spanish company) which employs a C4 hydrocarbon stream as feedstock, with
19 % molar content of isobutene as well as the provision of ethanol in excess (~10 %), as it has
been reported by García-Echevarría (2003).
The methodology presented above is applied to the separation of ethanol from
ethanol/ETBE/C4 mixtures in order to achieve a productivity of 6400 kg h-1 of ETBE with a
minimum purity of 95.2 wt%. It is assumed that all C4-C6 hydrocarbons except isobutene are
inert (Sneesby et al., 1997). Therefore, all the inert C4 hydrocarbons are lumped, based on their
similarities, and represented here by n-butene (1-butene in Aspen plus database).
The feed stream to the membrane modules is considered to be in liquid phase. The values
adopted in this work were 70 ºC for the feed temperature and 20 mmHg (2.7 kPa) for the
permeate pressure. Feed pressure is chosen such that the feed to the pervaporation module is in
liquid phase at the operating temperature and varies between 4.8 and 7.5 bar depending on the
C4 content of the liquid mixture to be separated.
Simulation runs of the hybrid process have been performed in order to understand the impact
of different process configurations and parameters, and the results have been compared on the
basis of the required membrane area as shown in Figure 4.5. The purity of ETBE reported in
Figure 4.5 refers to the ETBE content in the product stream which in the 3 cases is obtained as
a bottom stream in the debutanizer column.
The pervaporation unit can be placed directly after the reactor outlet (case A, Figure 4.2) to
remove the unreacted ethanol. Other option is to place the pervaporation unit after the distillate
stream of distillation column (Case B, Figure 4.2). A third alternative configuration takes a side
withdrawal from the debutanizer column to the pervaporation unit to remove ethanol (Case C,
Figure 4.2). All alternatives can be used for ETBE production. The only difference between
them is the energy consumption, required membrane area and ethanol content in the distillate
stream. In the “C” alternative, the chosen stage of extraction is the one where a peak in the
concentration profile of ethanol in the liquid phase is noticed, as discussed below. Another
option would be processing the bottom stream by means of pervaporation, but this option will
be hardly competitive from an economic point of view, since the final product specification
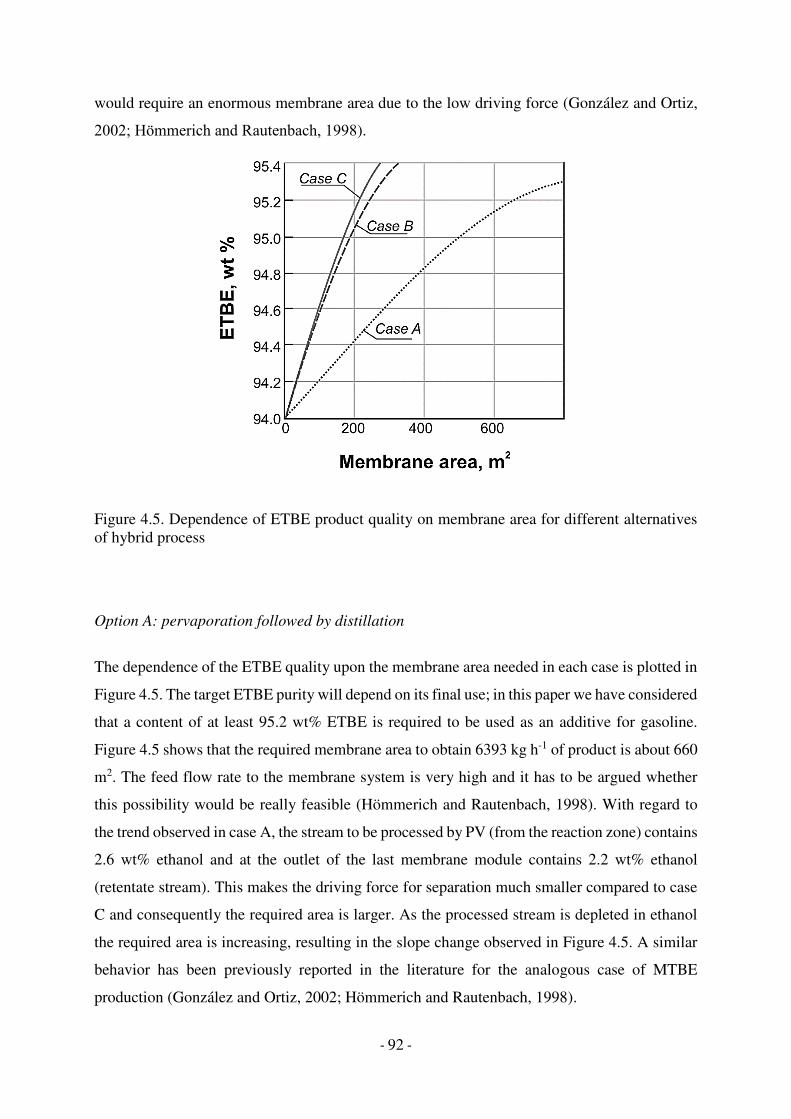
- 92 -
would require an enormous membrane area due to the low driving force (González and Ortiz,
2002; Hömmerich and Rautenbach, 1998).
Figure 4.5. Dependence of ETBE product quality on membrane area for different alternatives of hybrid process
Option A: pervaporation followed by distillation
The dependence of the ETBE quality upon the membrane area needed in each case is plotted in
Figure 4.5. The target ETBE purity will depend on its final use; in this paper we have considered
that a content of at least 95.2 wt% ETBE is required to be used as an additive for gasoline.
Figure 4.5 shows that the required membrane area to obtain 6393 kg h-1 of product is about 660
m2. The feed flow rate to the membrane system is very high and it has to be argued whether
this possibility would be really feasible (Hömmerich and Rautenbach, 1998). With regard to
the trend observed in case A, the stream to be processed by PV (from the reaction zone) contains
2.6 wt% ethanol and at the outlet of the last membrane module contains 2.2 wt% ethanol
(retentate stream). This makes the driving force for separation much smaller compared to case
C and consequently the required area is larger. As the processed stream is depleted in ethanol
the required area is increasing, resulting in the slope change observed in Figure 4.5. A similar
behavior has been previously reported in the literature for the analogous case of MTBE
production (González and Ortiz, 2002; Hömmerich and Rautenbach, 1998).

- 93 -
Option B: pervaporation on the distillate stream
This case, although technically feasible, involves processing a stream that is more difficult to
handle due to its high content of C4 components. Therefore, pervaporation modules should
work at pressures higher than 8 bar on the liquid side to avoid partial vaporization of the feed
mixture. Figure 4.5 shows that the required membrane area for case B is about 240 m2. In case
B, the required membrane area is lower than in the previous alternative, but the ethanol content
in the C4 outlet stream is higher. This motivated us to seek other alternative (option C) in which
a higher amount of ethanol separated by PV can be recycled to the reaction zone.
The internal profiles for the main components in the debutanizer column corresponding to cases
A and B are plotted in Figures 4.6 and 4.7. A clear difference between the two figures can be
observed with respect to the ethanol peak in the rectification section: in case A the ethanol peak
is lower because the column is fed with a stream that has been partially depleted in ethanol by
pervaporation.
Figure 4.6. Concentration of main components and temperature profile in the debutanizer column (Case A).

- 94 -
Figure 4.7. Concentration of main components and temperature profile in the debutanizer column (Case B).
Option C: pervaporation parallel to the distillation column
This configuration is possible because ethanol accumulates in the debutanizer column, due to
the VLE behavior of the system. In the process studied in Case C, pressure and temperature of
the stream fed to the column have to be optimized. Therefore, a study has been made to establish
the thermal condition that leads to a higher ethanol concentration in the liquid phase inside the
column. Simulations have been run for the standalone distillation column (decoupled from
pervaporation) to be used as reference and to study its behavior when the feed mixture is fed to
the column as saturated liquid or partially vaporized mixture, with the design and operation
parameters of the column remaining unchanged. Simulated data indicate that higher ethanol
concentration in the liquid phase is obtained when feeding a saturated liquid (Figure 4.8).

- 95 -
Figure 4.8. Ethanol concentration profile (liquid) in the debutanizer column for varying feed conditions
In Figure 4.9 the liquid concentration and temperature profiles inside the column (coupled to
PV) are shown. The existence of a maximum content of ethanol in the liquid phase can be
observed around stage 18 (27 wt% ethanol), together with a very low content of C4
hydrocarbons. The distillation column has 26 stages, and we have found that for the case “C”
the most suitable work conditions are as follows: the fresh feed is located in stage 11, the liquid
side withdrawal in stage 18, and the permeate from the membrane modules is recycled in stage
23. Thus, 7 PV modules are required to obtain the specified composition of ETBE in the bottom
stream. In these conditions about 6420 kg h-1 of ETBE with a purity of 95.2 wt% is obtained,
this implies that 99.9 % of the produced ETBE leaving the reactor is recovered in the bottom
of the column.
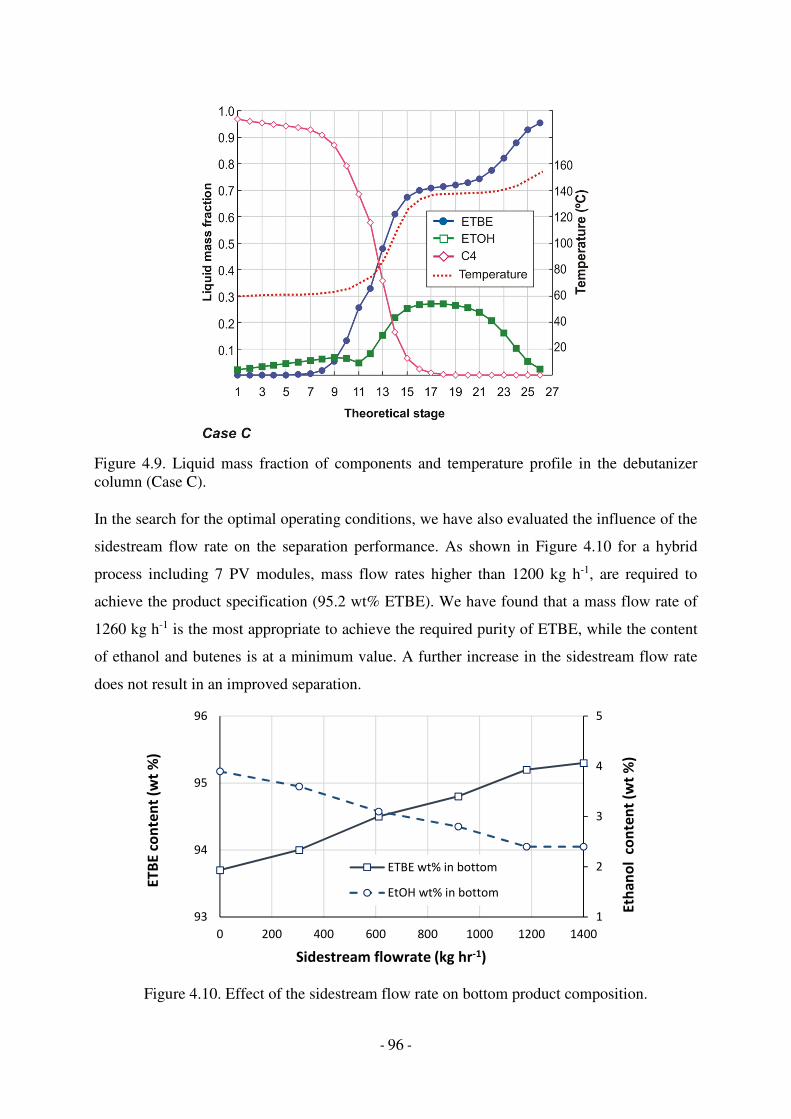
- 96 -
Figure 4.9. Liquid mass fraction of components and temperature profile in the debutanizer column (Case C).
In the search for the optimal operating conditions, we have also evaluated the influence of the
sidestream flow rate on the separation performance. As shown in Figure 4.10 for a hybrid
process including 7 PV modules, mass flow rates higher than 1200 kg h-1, are required to
achieve the product specification (95.2 wt% ETBE). We have found that a mass flow rate of
1260 kg h-1 is the most appropriate to achieve the required purity of ETBE, while the content
of ethanol and butenes is at a minimum value. A further increase in the sidestream flow rate
does not result in an improved separation.
Figure 4.10. Effect of the sidestream flow rate on bottom product composition.
1
2
3
4
5
93
94
95
96
0 200 400 600 800 1000 1200 1400
ETBE wt% in bottom
EtOH wt% in bottom
ET
BE
co
nte
nt
(wt
%)
Eth
an
ol
co
nte
nt
(wt
%)
Sidestream flowrate (kg hr-1)

- 97 -
It is well known the important influence of temperature on the driving force for pervaporation
process, and therefore on the membrane performance. Therefore, it is advisable to operate the
PV process at the highest possible temperature. The practical limit of operating temperature
(80°C, according to the technical data sheet) is determined by the thermal stability of the
membrane. However, in this case we have adopted a feed temperature of 70 ºC in order to avoid
working at too high pressures. Pervaporation operates in adiabatic mode, so the process requires
the feed liquid to be repeatedly reheated to supply the latent heat of evaporation removed by
the permeating vapor (Baker, 2012). The need for interstage reheating complicates the system
design and leads to lower average fluxes (as opposed to a hypothetical isothermal process). In
our case, since we have selected membrane modules with 30 m2 of area, the temperature drop
in the liquid in the direction of flow is a free parameter that depends on the depletion of the
ethanol concentration contained in the mixture being processed. Thus, in the case C the feed
stream must be reheated six times as the ethanol concentration drops from 27 to 19 % and the
average temperature of the fluid is at about 65 ºC. Figure 4.11 shows the temperature profile of
the retentate stream with heating between every PV module. The retentate streams leaving each
module are heated back up to 70 ºC. A temperature drop in a module of 3-10 °C is generally
assumed in the design and operation of commercial pervaporation units (Dutta et al., 1996). As
can be seen in Figure 4.11, the temperature drop per module is within the suggested range. The
drop in the retentate temperature in the last modules is quite small because the flux rates are
small too owing to the decrease in the retentate ethanol composition.
Figure 4.11. Temperature profile of the retentate stream with heating between every PV module.

- 98 -
Table 4.4. Summary of material balances for the 3 hybrid processes.
Case A, Pervaporation before to distillation. Membrane area: 660 m2
Total feed
to reactor
(kmol h-1)
Reaction
outlet
(kmol h-1)
Total Retentate
(kmol h-1)
Total
Permeate
(kmol h-1)
Btm.1
ETBE
product
(kmol h-1)
Dist.1
C4 stream
(kmol h-1)
ETBE 0.295 59.89 59.59 0.295 59.59 0.002
Ethanol 72.66 13.07 10.81 2.26 3.285 7.53
1-butene 282.68 282.68 282.68 < 0.001 282.68
Isobutene 66.06 3.97 3.97 trace 3.97
TBA 0.763 0.763 0.761 0.002
Water 0.763
DIB 0.865 0.865 0.865 trace
Total 422.46 361.24 358.68 2.56 64.5 294.18
T (⁰⁰⁰⁰C) 72.5 46 69.9 69.9 154.1 60.4
P (bar) 10 10 6.4 0.026 8.43 7.84
Case B, Distillation followed by pervaporation (distillate stream). Membrane area: 240 m2
Total feed
to reactor
(kmol h-1)
Reaction
outlet
(kmol h-1)
Btm.1
ETBE product
(kmol h-1)
Dist.1
C4 stream
(kmol h-1)
Total
Retentate
(kmol h-1)
Total
Permeate
(kmol h-1)
ETBE 0.14 59.73 59.59 0.142 0.002 0.14
Ethanol 72.66 13.07 3.29 9.78 8.93 0.851
1-butene 282.68 282.68 < 0.001 282.68 282.68
Isobutene 66.06 3.97 trace 3.97 3.97
TBA 0.763 0.758 0.005 0.005
Water 0.763
DIB 0.865 0.865 < 0.001 < 0.001
Total 422.30 361.08 64.5 296.58 295.59 0.992
T (⁰⁰⁰⁰C) 72.5 46 154.1 60.5 69.9 69.9
P (bar) 10 10 8.43 7.85 8.52 0.026
Case C, Distillation followed by pervaporation (side stream). Membrane area: 210 m2
Total feed
to reactor
(kmol h-1)
Reaction
outlet
(kmol h-1)
Btm.1
ETBE
(kmol h-1)
Dist.1
C4 stream
(kmol h-1)
Side
stream
(kmol h-1)
Total
Retentate
(kmol h-1)
Total
Permeate
(kmol h-1)
ETBE 0.017 59.81 59.797 < 0.001 8.80 8.78 0.017
Ethanol 72.66 12.87 3.377 6.76 7.37 4.64 2.733
1-butene 282.68 282.68 0.001 282.68 0.073 0.073
Isobutene 66.06 3.767 < 0.001 3.767 0.001 0.001
TBA 0.763 0.76 0.004 0.143 0.143
Water 0.763
DIB 0.865 0.865 trace 0.063 0.063
Total 422.18 360.75 64.8 293.21 16.444 13.69 2.75
T (⁰⁰⁰⁰C) 73 46 154.4 60.3 137.4 65.6 66.6
P (bar) 10 10 8.43 7.85 8.25 4.78 0.026

- 99 -
On the other hand, it has been verified experimentally (González and Ortiz, 2001; Alonso-
Dávila, 2003) that the influence of the permeate pressure on the mass transport rate can be
neglected in the range 1-20 mmHg, and the choice of the highest value will allow the costs of
permeate condensation to be reduced without leading to an increase in the membrane area
needed.
In case A, case B and case C the required membrane area is 660 m2, 240 m2 and 210 m2,
respectively. ETBE content in the distillate stream is negligible in all cases. In case B, the
ethanol content in the distillate stream and the utility energy consumption are higher than in
case C, although similar areas are required in both hybrid processes. As mentioned above the
target purity of ETBE is 95.2 wt% for all of the process alternatives. The final design data for
the hybrid process are summarized in Table 4.4.
Table 4.5. Energy use details for each hybrid process configurations
Case A Case B Case C Low pressure steam 3.19 2.39 0.67
Middle pressure steam
2.82 2.88 2.92
Total hot utilities, MW
6.01 5.27 3.59
Cooling water 3.27 3.33 3.33
Refrigerant 0.03 0.012 0.04
Total cold utilities, MW
3.30 3.35 3.37
Table 4.5 gives detailed information about the expected utility usage in the different
alternatives. As shown from the table, consumption of utilities (low and medium pressure
steam, refrigerant, and cooling water) differs for each case depending on the column reboiler
and condenser duty as well as the number of pervaporation units, because each unit needs of a
separate heat exchanger. The amount of refrigerant and electricity consumed is not significant
in relation to the total energy consumption. Differences between the amounts of energy
consumed by the hybrid processes mainly depend on the combination of distillation column
and pervaporation, as well as on the number of modules of pervaporation. A scheme of the final
hybrid process for cases A, B and C is displayed in Figures 4.12, 4.13 and 4.14, respectively.

- 100 -
Figure 4.12. Schematic diagram of optimized hybrid process for Case A (Compositions are given as wt%).
Figure 4.13. Schematic diagram of optimized hybrid process for Case B (Compositions are given as wt%).
Figure 4.14. Schematic diagram of optimized hybrid process for Case C (Compositions are
given as wt%).
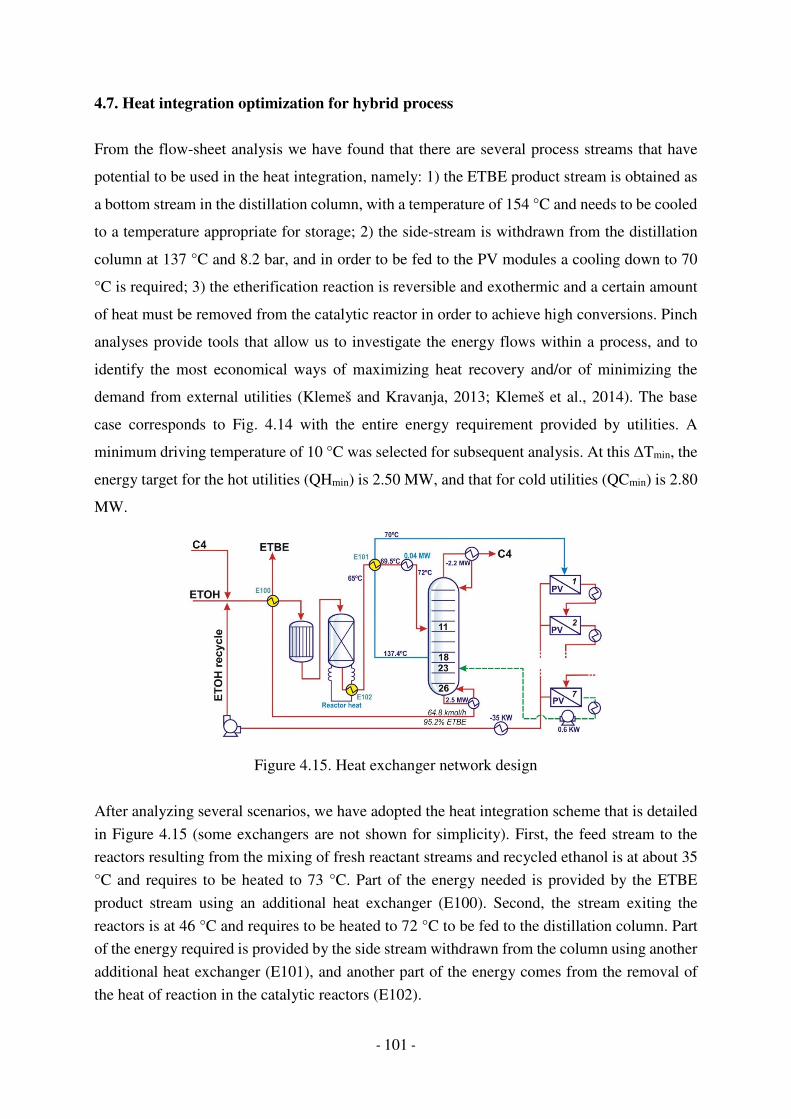
- 101 -
4.7. Heat integration optimization for hybrid process
From the flow-sheet analysis we have found that there are several process streams that have
potential to be used in the heat integration, namely: 1) the ETBE product stream is obtained as
a bottom stream in the distillation column, with a temperature of 154 °C and needs to be cooled
to a temperature appropriate for storage; 2) the side-stream is withdrawn from the distillation
column at 137 °C and 8.2 bar, and in order to be fed to the PV modules a cooling down to 70
°C is required; 3) the etherification reaction is reversible and exothermic and a certain amount
of heat must be removed from the catalytic reactor in order to achieve high conversions. Pinch
analyses provide tools that allow us to investigate the energy flows within a process, and to
identify the most economical ways of maximizing heat recovery and/or of minimizing the
demand from external utilities (Klemeš and Kravanja, 2013; Klemeš et al., 2014). The base
case corresponds to Fig. 4.14 with the entire energy requirement provided by utilities. A
minimum driving temperature of 10 °C was selected for subsequent analysis. At this ∆Tmin, the
energy target for the hot utilities (QHmin) is 2.50 MW, and that for cold utilities (QCmin) is 2.80
MW.
Figure 4.15. Heat exchanger network design
After analyzing several scenarios, we have adopted the heat integration scheme that is detailed
in Figure 4.15 (some exchangers are not shown for simplicity). First, the feed stream to the
reactors resulting from the mixing of fresh reactant streams and recycled ethanol is at about 35
°C and requires to be heated to 73 °C. Part of the energy needed is provided by the ETBE
product stream using an additional heat exchanger (E100). Second, the stream exiting the
reactors is at 46 °C and requires to be heated to 72 °C to be fed to the distillation column. Part
of the energy required is provided by the side stream withdrawn from the column using another
additional heat exchanger (E101), and another part of the energy comes from the removal of
the heat of reaction in the catalytic reactors (E102).
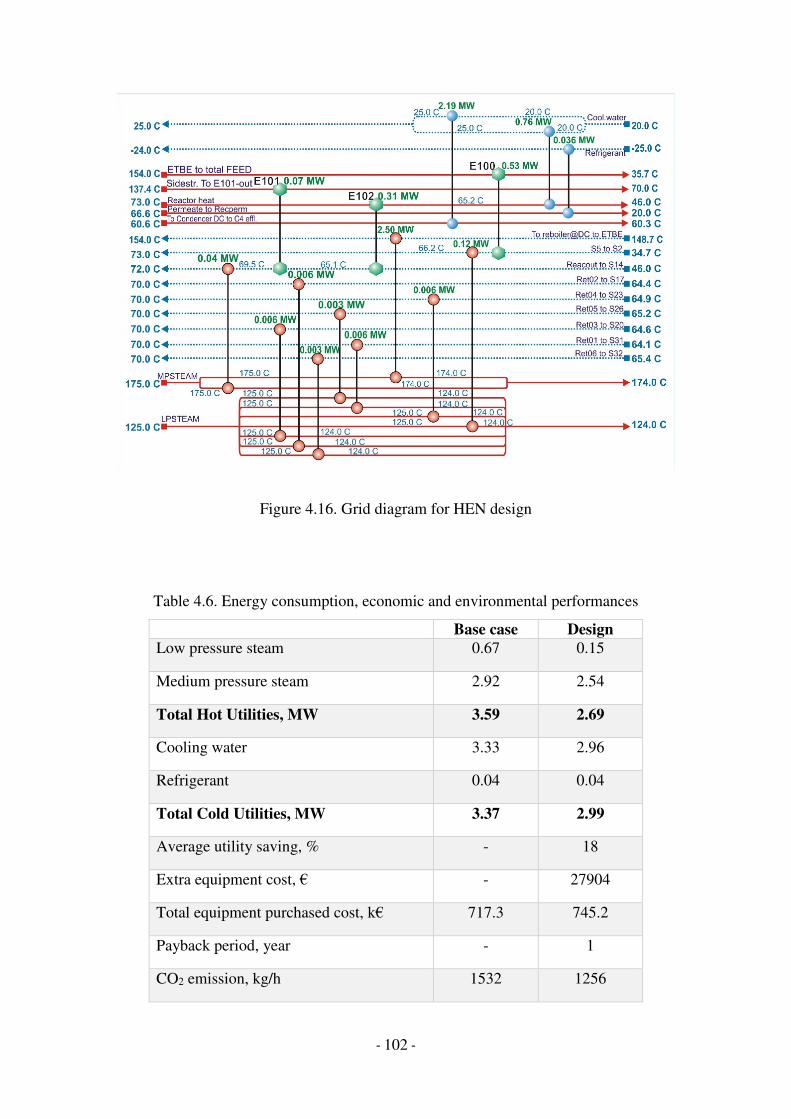
- 102 -
Figure 4.16. Grid diagram for HEN design
Table 4.6. Energy consumption, economic and environmental performances
Base case Design Low pressure steam 0.67 0.15
Medium pressure steam 2.92 2.54
Total Hot Utilities, MW 3.59 2.69
Cooling water 3.33 2.96
Refrigerant 0.04 0.04
Total Cold Utilities, MW 3.37 2.99
Average utility saving, % - 18
Extra equipment cost, € - 27904
Total equipment purchased cost, k€ 717.3 745.2
Payback period, year - 1
CO2 emission, kg/h 1532 1256

- 103 -
Figure 4.16 shows the optimal HEN design that minimizes the cost and energy consumption of
the ETBE plant. The system is composed of 15 heat exchanger units with a total area of 445
m2. The heating demand is 2.68 MW and the cooling demand is 2.99 MW. The utilities used
are cooling water (20 °C), refrigerant (-25 °C), low pressure steam (125 °C) and medium
pressure steam (175 °C). The total cost was estimated from both the energy cost of utilities and
the capital cost of the heat exchangers. The capital cost of the heat exchangers was determined
by the number of units and the minimum network area requirement (Shemfe et al., 2016). Thus,
heat integration with pinch analysis shows that it is possible to achieve savings of up to 18% in
utilities consumption (Table 4.6).

- 104 -
References:
1. Alonso-Dávila, PA. Diseño de un proceso óptimo para la producción de éter etil tert-
butílico. Tesis Doctoral, Universidad de Cantabria (2003).
2. Baker RW. Membrane technology and applications. 3rd ed. John Wiley & Sons, Chichester,
(2012).
3. Cen Y, Wesslein M, Lichtenthaler R. Pervaporation of liquid mixtures through PVA
membranes. Proceedings of the Fourth International Conference on Pervaporation Processes in
the Chemical Industry, p. 522 (1989).
4. Chapman PD, Oliveira T, Livingston AG, Li K. Membranes for the dehydration of solvents
by pervaporation. J Membr Sci 318: 5-37 (2008).
5. Chen M, Markiewicz G, Venugopal K. Development of membrane pervaporation TRIM
process for methanol recovery from CH3OH/MTBE/C4 mixtures. AIChE Symp. Ser. 85: 82-88
(1989).
6. Chen W, Martin CR. Highly methanol-selective membranes for the pervaporation separation
of methyl t-butyl ether/methanol mixtures. J Membr Sci 104: 101-108 (1995).
7. Chen MS, Eng RM, Glazer JL, Wensley CG. Pervaporation process for separating alcohols
from ethers. U.S. Patent No. 4,774,365. Washington, DC (1988).
8. Cunill F, Vila M, Izquierdo JF, Iborra M, Tejero J. Effect of water presence on methyl tert-
butyl ether and ethyl tert-butyl ether liquid-phase syntheses. Ind Eng Chem Res 32: 564-569
(1993).
9. Doghieri F, Nardella A, Sarti G, Valentini C. Pervaporation of methanol-MTBE mixtures
through modified poly (phenylene oxide) membranes. J Membr Sci 91: 283-291 (1994).
10. Dutta BK, Ji W, Sikdar SK. Pervaporation: Principles and applications. Sep Purif
Methods 25: 131-224 (1996).
11. Encyclo, Meaning of Debottlenecking. http://www.encyclo.co.uk/meaning-of-
debottlenecking. (accessed January 2017)
12. Farnand BA, Noh SH. Pervaporation as an alternative process for the separation of methanol
from C4 hydrocarbons in the production of MTBE and TAME. AIChE Symp Ser 85: 89-92
(1989).
13. Fite C, Iborra M, Tejero J, Izquierdo JF, Cunill F. Kinetics of the liquid-phase synthesis of
ethyl tert-butyl ether (ETBE). Ind Eng Chem Res 33: 581-591 (1994).

- 105 -
14. García V, Diban N, Gorri D, Keiski R, Urtiaga A, Ortiz I. Separation and concentration of
bilberry impact aroma compound from dilute model solution by pervaporation. J Chem Technol
Biotechnol 83: 973-982 (2008).
15. García-Echevarría M. La producción de biocarburantes por Petronor contribuye al uso de
energías renovables. DYNA 78: 26-30 (2003).
16. Genduso G, Luis P, Van der Bruggen B. Overcoming any configuration limitation: An
alternative operating mode for pervaporation and vapour permeation. J Chem Technol
Biotechnol 91: 948-957 (2016).
17. Genduso G, Amelio A, Colombini E, Luis P, Degrève J, Van der Bruggen B. Retrofitting
of extractive distillation columns with high flux, low separation factor membranes: A way to
reduce the energy demand? Chem Eng Res Des 109: 127-140 (2016).
18. Gmehling J, Constantinescu D, Schmid B. Group contribution methods for phase
equilibrium calculations. Annu Rev Chem Biomol Eng 6: 267-292 (2015).
19. Gmehling J, Menke J, Krafczyk J, Fischer K. A data bank for azeotropic data - status and
applications. Fluid Phase Equilib 103: 51-76 (1995).
20. González B. Aplicación de la pervaporación a la separación de mezclas azeotrópicas
alcohol/éter. Tesis Doctoral, Universidad de Cantabria (2000).
21. González B, Ortiz Uribe I. Mathematical modeling of the pervaporative separation of
methanol-methylterbutyl ether mixtures. Ind Eng Chem Res 40: 1720-1731 (2001).
22. González B, Ortiz I. Modelling and simulation of a hybrid process (pervaporation-
distillation) for the separation of azeotropic mixtures of alcohol-ether. J Chem Technol
Biotechnol 77: 29-42 (2002).
23. Gorri D, Ibáñez R, Ortiz I. Comparative study of the separation of methanol-methyl acetate
mixtures by pervaporation and vapor permeation using a commercial membrane. J Membr
Sci 280: 582-585 93 (2006).
24. Hassan Hassan Abdellatif F, Babin J, Arnal-Herault C, David L, Jonquieres A. Grafting of
cellulose acetate with ionic liquids for biofuel purification by a membrane process: Influence
of the cation. Carbohydr Polym 147: 313-322 (2016).
25. Hassan Hassan Abdellatif F, Babin J, Arnal-Herault C, Nouvel C, Six J, Jonquieres A. Bio-
based membranes for ethyl tert-butyl ether (ETBE) bio-fuel purification by pervaporation. J
Membr Sci 524: 449-459 (2017).

- 106 -
26. Hömmerich U, Rautenbach R. Design and optimization of combined
pervaporation/distillation processes for the production of MTBE. J Membr Sci 146: 53-64
(1998).
27. Huang RYM, Moon GY, Pal R. Chitosan/anionic surfactant complex membranes for the
pervaporation separation of methanol/MTBE and characterization of the polymer/surfactant
system. J Membr Sci 184: 1-15 (2001).
28. Izquierdo JF, Cunill F, Vila M, Iborra M, Tejero J. Equilibrium constants for methyl tert-
butyl ether and ethyl tert-butyl ether liquid-phase syntheses using C4 olefinic cut. Ind Eng Chem
Res 33: 2830-2835 (1994).
29. Jonquières A, Clément R, Lochon P. New film-forming poly (urethane-amide-imide) block
copolymers: Influence of soft block on membrane properties for the purification of a fuel octane
enhancer by pervaporation. Eur Polym J 41: 783-795 (2005).
30. Jonquières A, Dole C, Clément R, Lochon P. Synthesis and characterization of new highly
permeable polyamideimides from dianhydride monomers containing amide functions: An
application to the purification of a fuel octane enhancer (ETBE) by pervaporation. J Polym Sci
Pol Chem 38: 614-630 (2000).
31. Jonquières A, Roizard D, Cuny J, Lochon P. Solubility and polarity parameters for assessing
pervaporation and sorption properties. A critical comparison for ternary systems
alcohol/ether/polyurethaneimide. J Membr Sci 121: 117-133 (1996).
32. Kim S, Lim G, Jegal J, Lee K. Pervaporation separation of MTBE (methyl tert-butyl ether)
and methanol mixtures through polyion complex composite membranes consisting of sodium
alginate/chitosan. J Membr Sci 174: 1-15 (2000).
33. Kiss AA. Distillation technology–still young and full of breakthrough opportunities. J Chem
Technol Biotechnol 89: 479-498 (2014).
34. Klemeš JJ, Kravanja Z. Forty years of heat integration: Pinch analysis (PA) and
mathematical programming (MP). Curr Opin Chem Eng 2: 461-474 (2013).
35. Klemeš JJ, Varbanov PS, Wan Alwi, SR, Manan ZA. Process integration and
intensification: Saving energy, water and resources. Walter de Gruyter, Berlin (2014).
36. Koczka K, Mizsey P, Fonyo Z. Rigorous modelling and optimization of hybrid separation
processes based on pervaporation. Cent Eur J Chem 5: 1124-1147 (2007).
37. Koops G. Nomenclature and symbols in membrane science and technology: On behalf of
the European Society of Membrane Science and Technology. Membrane Technology Group,
University of Twente, (1995).
- 107 -
38. Lipnizki F, Trägårdh G. Modelling of pervaporation: Models to analyze and predict the
mass transport in pervaporation. Sep Purif Rev 30: 49-125 (2001).
39. Lipnizki F, Field RW, Ten P. Pervaporation-based hybrid process: A review of process
design, applications and economics. J Membr Sci 153: 183-210 (1999).
40. Luis P, Amelio A, Vreysen S, Calabro V, Van der Bruggen B. Simulation and
environmental evaluation of process design: Distillation vs. hybrid distillation–pervaporation
for methanol/tetrahydrofuran separation. Appl Energy 113: 565-575 (2014).
41. Luis P, Van der Bruggen B. Pervaporation modeling: State of the art and future trends. In
Pervaporation, Vapour permeation and Membrane Distillation, ed. by Basile A, Figoli A,
Khayet M., Woodhead Publishing, Oxford, pp. 87-107 (2015).
42. Luo G, Niang M, Schaetzel P. Separation of ethyl tert-butyl ether-ethanol by combined
pervaporation and distillation. Chem Eng J 68: 139-143 (1997).
43. Luo GS, Niang M, Schaetzel P. Development of cellulose acetate propionate membrane for
separation of ethanol and ethyl tert-butyl ether mixtures. Sep Sci Technol 32: 1143-1156 (1997).
44. Luo GS, Niang M, Schaetzel P. Pervaporation separation of ethyl tert-butyl ether and
ethanol mixtures with a blended membrane. J Membr Sci 125: 237-244 (1997).
45. Luo GS, Niang M, Schaetzel P. Sorption and pervaporation separation of ethyl tert-butyl
ether and ethanol mixtures through a blended membrane. J Appl Polym Sci 66: 1631-1638
(1997).
46. Luyben WL. Control of a column/pervaporation process for separating the ethanol/water
azeotrope. Ind Eng Chem Res 48: 3484-3495 (2009).
47. Matuschewski H, Schedler U. MSE—modified membranes in organophilic pervaporation
for aromatics/aliphatics separation. Desalination 224: 124-131 (2008).
48. Nakagawa Kand Makoto M, inventors; Process for producing ether compound. Patent
US5292963 A (1994).
49. Néel J. Pervaporation. Technique & Documentation-Lavoisier, Paris (1997).
50. Nguyen Q, Léger C, Billard P, Lochon P. Novel membranes made from a semi‐interpenetrating polymer network for ethanol–ETBE separation by pervaporation. Polym Adv
Technol 8: 487-495 (1997).
51. Nguyen Q, Noezar I, Clément R, Streicher C, Brueschke H. Poly (vinyl pyrrolidone‐co‐vinyl acetate)–cellulose acetate blends as novel pervaporation membranes for ethanol–ethyl
tertio‐butyl ether separation. Polym Adv Technol 8: 477-486 (1997).

- 108 -
52. Niang M, Luo G. A triacetate cellulose membrane for the separation of methyl tert-butyl
ether/methanol mixtures by pervaporation. Sep Purif Technol 24: 427-435 (2001).
53. Niang M, Luo G, Schaetzel P. Pervaporation separation of methyl tert-butyl ether/methanol
mixtures using a high-performance blended membrane. J Appl Polym Sci 64: 875-882 (1997).
54. Obenaus F, Droste W. Hüls-process: Methyl tertiary butylether. Erdol & Kohle Erdgas
Petrochem 33: 271-275 (1980).
55. Orozco‐González N, Bustamante F, Acosta‐Cárdenas A. Experimental assessment of the
integration of in situ removal of ethanol by pervaporation with a simultaneous saccharification–
fermentation process. J Chem Technol Biotechnol 91: 3011-3017 (2016).
56. Ortiz I, Alonso P, Urtiaga A. Pervaporation of azeotropic mixtures ethanol/ethyl tert-butyl
ether: Influence of membrane conditioning and operation variables on pervaporation
flux. Desalination 149: 67-72 (2002).
57. Ortiz I, Gorri D, Casado C, Urtiaga A. Modelling of the pervaporative flux through
hydrophilic membranes. J Chem Technol Biotechnol 80: 397-405 (2005).
58. Park H, Ramaker N, Mulder M, Smolders C. Separation of MTBE-methanol mixtures by
pervaporation. Sep Sci Technol 30: 419-433 (1995).
59. Pasternak M, Bartels CR, Reale J. Treatment of compositions containing water and organic
oxygenates. U.S. Patent No 4,910,344 (1990).
60. Roizard D, Jonquieres A, Léger C, Noezar I, Perrin L, Nguyen Q, Clément R, Lenda H,
Lochon P, Néel J. Alcohol/ether separation by pervaporation. High performance membrane
design. Sep Sci Technol 34: 369-390 (1999).
61. Shah V, Bartels C, Pasternak M, Reale J. Opportunities for membranes in the production of
octane enhancers. AIChE Symp. Ser. 85: 93-97 (1989).
62. Shemfe MB, Fidalgo B, Gu S. Heat integration for bio-oil hydroprocessing coupled with
aqueous phase steam reforming. Chem Eng Res Des 107: 73-80 (2016).
63. Smitha B, Suhanya D, Sridhar S, Ramakrishna M. Separation of organic-organic mixtures
by pervaporation - a review. J Membr Sci 241: 1-21 (2004).
64. Sneesby MG, Tadé MO, Datta R, Smith TN. ETBE synthesis via reactive distillation. 1.
steady-state simulation and design aspects. Ind Eng Chem Res 36: 1855-1869 (1997).
65. Sridhar S, Smitha B, Shaik A. Pervaporation‐Based separation of methanol/MTBE Mixtures
– A review. Sep Purif Rev 34: 1-33 (2005).

- 109 -
66. Streicher C., Asselineau L., Forestiere A. Separation of alcohol/ether/hydrocarbon mixtures
in industrial etherification processes for gasoline production. Pure and Applied Chemistry 67:
985-992 (2009).
67. Streicher C, Kremer P, Tomas V, Hubner A, Ellinghorst G. Development of new
pervaporation membranes, systems and processes to separate alcohols/ethers/hydrocarbons
mixtures. Proc. 7th Int. Conf. Pervaporation in the Chemical Industry, Nevada, pp. 297-
309 (1995).
68. Touchal S, Roizard D, Perrin L. Pervaporation properties of polypyrrolidinone-based
membranes for EtOH/ ETBE mixtures separation. J Appl Polym Sci 99: 3622-3630 (2006).
69. Van der Bruggen B, Luis P. Pervaporation as a tool in chemical engineering: A new
era? Curr Opin Chem Eng 4: 47-53 (2014).
70. Vane LM. A review of pervaporation for product recovery from biomass fermentation
processes. J Chem Technol Biotechnol 80: 603-629 (2005).
71. Vane LM, Alvarez FR. Membrane‐assisted vapor stripping: Energy efficient hybrid
distillation–vapor permeation process for alcohol–water separation. J Chem Technol
Biotechnol 83: 1275-1287 (2008).
72. Verrazzi A, Kikic I, Garbers P, Barreau A, Le Roux D. Vapor - liquid equilibrium in binary
systems ethanol C4 and C5 hydrocarbons. J Chem Eng Data 43: 949-953 (1998).
73. Villaluenga J, Godino P, Khayet M, Seoane B, Mengual J. Pervaporation of alcohols and
methyl tert-butyl ether through a dense poly (2, 6-dimethyl-1, 4-phenylene oxide)
membrane. Ind Eng Chem Res 43: 2548-2555 (2004).
74. Villegas M, Romero AI, Parentis ML, Vidaurre EFC, Gottifredi JC. Acrylic acid plasma
polymerized poly (3-hydroxybutyrate) membranes for methanol/MTBE separation by
pervaporation. Chem Eng Res Design 109: 234-248 (2016).
75. Wang M, Arnal-Herault C, Rousseau C, Palenzuela A, Babin J, David L, Jonquieres A.
Grafting of multi-block copolymers: A new strategy for improving membrane separation
performance for ethyl tert-butyl (ETBE) bio-fuel purification by pervaporation. J Membr
Sci 469: 31-42 (2014).
76. Wijmans J. Process performance= membrane properties operating conditions. J Membr
Sci 220: 1-3 (2003).
77. Yoshida W, Cohen Y. Ceramic-supported polymer membranes for pervaporation of binary
organic/organic mixtures. J Membr Sci 213: 145-157 (2003).

- 110 -
78. Zereshki S, Figoli A, Madaeni SS, Galiano F, Drioli E. Pervaporation separation of
ethanol/ETBE mixture using poly(lactic acid)/poly(vinyl pyrrolidone) blend membranes. J
Membr Sci 373: 29-35 (2011).
79. Zereshki S, Figoli A, Madaeni SS, Simone S, Drioli E. Pervaporation separation of
methanol/methyl tert-butyl ether with poly(lactic acid) membranes. J Appl Polym Sci 118:
1364-1371 (2010).
80. Zereshki S, Figoli A, Madaeni SS, Simone S, Esmailinezhad M, Drioli E. Pervaporation
separation of MeOH/MTBE mixtures with modified PEEK membrane: Effect of operating
conditions. J Membr Sci 371: 1-9 (2011).
81. Zhang T, Jensen K, Kitchaiya P, Phillips C, Datta R. Liquid-phase synthesis of ethanol-
derived mixed tertiary alkyl ethyl ethers in an isothermal integral packed-bed reactor. Ind Eng
Chem Res 36: 4586-4594 (1997).
- 111 -
CHAPTER 5 REACTIVE DISTILLATION PROCESS FOR THE PRODUCTION OF ETBE
Chapter contents
5.1. Introduction
5.2. Fundamentals of reactive distillation
5.2.1. Chemical equilibrium
5.2.2. Stoichiometric lines
5.3. Simulation of RD process for ETBE production
5.4. Thermodynamic equilibrium
5.5. Phase equilibrium
5.6. Pre-reactor and RD column
5.7. Effect of design parameters on RD column performance
5.8. Heat integration optimization for RD process
References
- 112 -
5.1. Introduction
In recent years, reactive distillation (RD) has become an object of intense industrial interest,
since it is a promising and economically profitable way of realizing the technological process.
At present, a large number of research papers have been published on the modeling and analysis
of the octane enhancer production processes using RD process (Hauan et al., 1995; Luyben and
Yu, 2008), where there may be multiple stationary states with very different yields of the target
products.
The primary interests to reactive or catalytic distillation process was began from 1970s. RD
process for the production of methyl acetate, performed by the Eastman Chemical Company, is
one of the first processes that had been a genuine economic success for several years (Doherty
and Malone, 2001). In that process, the entire process consisting of 11 major units and all their
heat exchangers, control systems, pumps, storage tanks, etc. is replaced by one hybrid RD
device. The conventional old process for the production of methyl acetate was complicated and
expensive because of existing azeotropic conditions in the mixture containing the reaction
products. Srinath et al (2007) considered that in methyl acetate process by RD the azeotrope
between methyl acetate and water disappears because it reacts into a four component mixture,
thereby destroying the azeotropes. As a result, RD process was considered economically
feasible in both of investment and energy demands (Agreda and Partin, 1984; Siirola, 1995).
The production process of MTBE by using RD has been described in several studies published
in the last decades (Lander et al., 1983; Jacobs et al., 1993; Nijhuis et al., 1995; Sundmacher
and Kienle, 2003). Typically, a mixed C4 hydrocarbon stream from a refinery light-ends
debutanizer column contains isobutene and other C4 components, which are not involved in the
reaction. This mixed C4 stream is fed into a RD column along with methanol. The isobutene
reacts with the methanol to form MTBE. The heavy MTBE is removed at the bottom, and the
chemically inert C4s go out the top. Other similar ethers such as, ETBE and TAME are also
produced using RD (Sneesby et al., 1997; Thiel et al, 1997; Subawalla and Fair, 1999; Mohl et
al, 1999; Al-Arfaj and Luyben, 2002, Luyben, 2005).
However, combining reaction and distillation is not always advantageous, and in fact, in some
cases it may not even be feasible. Among the limitations that may exist, we can mention the
following: a) there must be no mismatch in the temperatures that are favorable for reaction and
the temperatures that are favorable for separation; b) unfavorable volatilities; c) requirement of
- 113 -
high reaction rates (Luyben, 2008). Due to the factors mentioned above some systems may have
large energy requirements and costs, or the interaction of phase behavior and reaction may make
separation more difficult in some cases (Doherty and Malone, 2001).
In this chapter, the simulation of the RD process for the ETBE production in a plantwide
environment has been performed to evaluate the viability of the process and its costs.
5.2. Fundamentals of reactive distillation
Knowledge of the equilibrium is the most fundamental prerequisite for a conceptual synthesis
of both non-reactive and RD processes. However, the equilibrium in RD systems is more
complex since the chemical equilibrium is superimposed on the vapor-liquid equilibrium
(Stichlmair and Fair, 1998).
5.2.1. Chemical equilibrium
According to Stichlmair and Fair (1998), the following reaction mechanism is considered in
reactive distillation process:
¢T · £ + ¢% · ¤ + ⋯↔ ¢& · Q + ¢¦ · § + ⋯ (Eq. 5.1)
where, a, b and c – are the low, intermediate and high boiler components in the system; ¢� –
stoichiometric factor of the substance i. The reaction is assumed to be reversible but
instantaneous. In nonideal mixtures the chemical equilibrium constant is expressed as follows:
b̈ = 4J\J ·4©\©….4]\] ·4«\«….
· ¬J\J·¬©\©….¬]\]·¬«\«….
= ∏ (�� · X�)Y=®�!" (Eq. 5.2)
where, �&, �¦– equilibrium product mole fractions in liquid phase; �T, �% - equilibrium
reactants mole fractions in liquid phase. X� - activity coefficient of the substance i. By
convention, the stoichiometric coefficients ¢� are negative for educts and positive for products.
In nonideal mixtures, the equilibrium constant of the reaction, b̈, is essentially a function of
temperature.
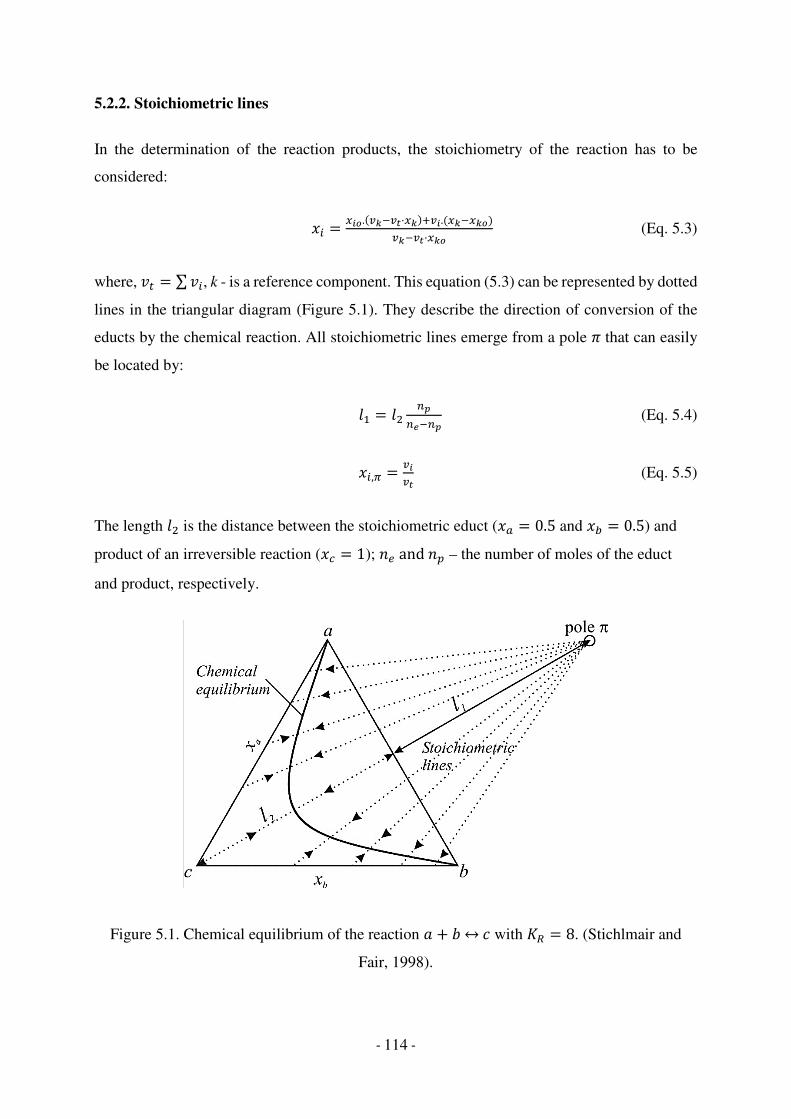
- 114 -
5.2.2. Stoichiometric lines
In the determination of the reaction products, the stoichiometry of the reaction has to be
considered:
�� = 4=¯.(Y°IY±·4°)�Y=.(4°I4°¯)Y°IY±·4°¯ (Eq. 5.3)
where, ¢V = ∑¢�, k - is a reference component. This equation (5.3) can be represented by dotted
lines in the triangular diagram (Figure 5.1). They describe the direction of conversion of the
educts by the chemical reaction. All stoichiometric lines emerge from a pole ² that can easily
be located by:
³" = ³z J GI J (Eq. 5.4)
��,´ = Y=Y± (Eq. 5.5)
The length ³z is the distance between the stoichiometric educt (�T = 0.5 and �% = 0.5) and
product of an irreversible reaction (�E = 1); µNandµ& – the number of moles of the educt
and product, respectively.
Figure 5.1. Chemical equilibrium of the reaction £ + ¤ ↔ B with b̈ = 8. (Stichlmair and
Fair, 1998).
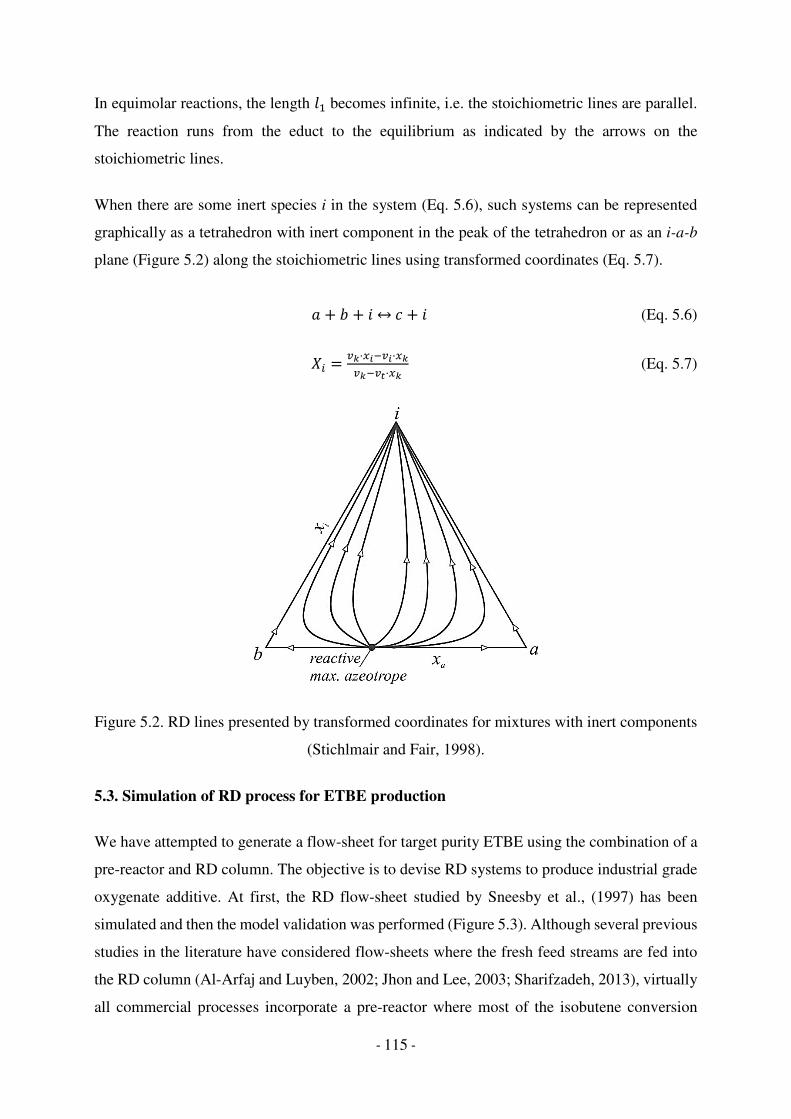
- 115 -
In equimolar reactions, the length ³" becomes infinite, i.e. the stoichiometric lines are parallel.
The reaction runs from the educt to the equilibrium as indicated by the arrows on the
stoichiometric lines.
When there are some inert species i in the system (Eq. 5.6), such systems can be represented
graphically as a tetrahedron with inert component in the peak of the tetrahedron or as an i-a-b
plane (Figure 5.2) along the stoichiometric lines using transformed coordinates (Eq. 5.7).
£ + ¤ + 1 ↔ B + 1 (Eq. 5.6)
·� = Y°·4=IY=·4°Y°IY±·4° (Eq. 5.7)
Figure 5.2. RD lines presented by transformed coordinates for mixtures with inert components
(Stichlmair and Fair, 1998).
5.3. Simulation of RD process for ETBE production
We have attempted to generate a flow-sheet for target purity ETBE using the combination of a
pre-reactor and RD column. The objective is to devise RD systems to produce industrial grade
oxygenate additive. At first, the RD flow-sheet studied by Sneesby et al., (1997) has been
simulated and then the model validation was performed (Figure 5.3). Although several previous
studies in the literature have considered flow-sheets where the fresh feed streams are fed into
the RD column (Al-Arfaj and Luyben, 2002; Jhon and Lee, 2003; Sharifzadeh, 2013), virtually
all commercial processes incorporate a pre-reactor where most of the isobutene conversion

- 116 -
takes place (Ethers, Hydrocarbon Processing, 2008). For this reason we have adopted a process
flow-sheet including a single fixed bed catalytic reactor and its output stream is fed to a RD
column where the conversion of isobutene is complete. The bottom product of this RD column
is ETBE of purity suitable for addition to the gasoline and the distillate stream is composed of
inerts and small amounts of unreacted ethanol and isobutene. The column is formed of non-
reactive stages and a section with the packed catalyst bed, always within the area above the feed
stage. The non-reactive steps above and below the reactive section are necessary to produce the
separation among products and reactants.
Table 5.1 Steady-state conditions and design parameters of the case reported by Sneesby (1997)
that was used for the model validation
Feed flowrate to column, kmol/h 0.039
Feed composition, mol % 29.1 (ETBE); 9.1 (ethanol);
7.3 (isobutene); 54.5 (n-butene)
Total stages 10
Stripping stages 5
Reactive stages 3
Rectifying stages 2
Overhead pressure, bar 9.5
Reboiler duty, kW 8.26
Reflux ratio, mole 5.0
Figure 5.3. Comparison of composition profiles in RD column for reference case with model
validation (Sneesby et al., 1997)

- 117 -
To perform the simulation and because of the reaction rate is fast enough compared to the mass
transfer rate occurring in the distillation process, it can be assumed that at each theoretical stage
of the RD column the reaction reaches the chemical equilibrium. This approach has also been
assumed by the authors of other studies previously reported in the literature (Sneesby et al.,
1997; Khaledi and Young, 2005; Daniel and Jobson, 2007).
In ETBE process in which the chemical reaction involves mainly two reactants (ethanol and
isobutene) producing mainly ETBE and little amount of dimerization (diisobutylene, DIB) and
hydration (tertiary butyl alcohol, TBA) products, as well as the inert components lumped as 1-
butene which also affect to overall process. The reactions takes place in the liquid phase and
are reversible (Figure 5.4):
Figure 5.4. Chemical reactions in ETBE synthesis: a) main reaction for obtaining ETBE; b)
secondary reaction – dimerization of isobutene; c) secondary reaction – hydration of
isobutene.

- 118 -
5.4. Thermodynamic equilibrium
As discussed in chapter 2, the main and dimerization reactions are equilibrium limited
(Izquierdo et al., 1994; Jensen and Datta, 1995; Rehfinger and Hoffmann, 1990; Colombo et
al., 1983). The following expressions were proposed for etherification (Eqs. 5.8 and 5.9) and
dimerization (Eq. 5.10) reactions that give constants K versus temperature using experimental
equilibrium data and the activity coefficients calculated by the UNIFAC method:
³µ ¨ = −9.5114 + 4262.21�I" (Eq. 5.8)
³µ¨ = 10.387 + 4060.59�I" − 2.89055 ³µ � − 0.0191544�+5.28586 ⨯ 10I��z − 5.32977 ⨯ 10I��¡ (Eq. 5.9)
³µ¨ = 95.2633 + 5819.8644�I" − 17.2 ³µ � − 0.0356� (Eq. 5.10)
According to Quitain et al. we have assumed that practically all the water existing in the reaction
system is converted to TBA (Quitain et al., 1999; Alonso-Davila, 2003).
5.5. Phase equilibrium
The phase equilibrium of this system is complex because of the existence of azeotropes and the
presence of the inert component (1-butene) in the C4 feed stream. Essentially the hydrocarbons,
1-butene and isobutene, go out the top of the RD column. To illustrate the vapor-liquid
equilibrium issues involved in the separation, we consider the ternary system including
isobutene, ethanol, and ETBE. The normal boiling points of these three components are – 6.9,
78.3, and 71 ºC, respectively. The reactive column operates at 9.5 bar, at which the boiling
points are 68.9, 148.8 and 166.1 ºC, respectively. This pure component information can be
easily obtained in Aspen Plus. Compositions and temperatures of the azeotropic mixtures are
listed for the three binary azeotropes at 9.5 bar, as predicted by thermodynamic analysis using
the UNIFAC-Dortmund model (Tables 5.2 and 5.3).

- 119 -
Table 5.2. Mixture investigated for azeotropes at a pressure of 9.5 bar
Component Name Boiling point
ETBE 166.1 ºC
ethanol 148.8 ºC
1-butene 68.5 ºC
isobutene 68.9 ºC
Table 5.3. Compositions and temperatures of the azeotropic mixtures found by
thermodynamic modeling in Aspen Plus.
Azeotropic mixture Temperature Composition Classification
ethanol/ETBE 143 ºC 36 mol % ethanol saddle
ethanol/1-butene 68.5 ºC 1 mol% ethanol unstable node
ethanol/ isobutene 68.8 ºC 1.5 mol% ethanol saddle
Figure 5.5 shows some important properties of the ETBE synthesis process that forms three
binary minimum azeotropes. The inert 1-butene, forms the peak of the tetrahedron of the figure.
The existence of the three binary azeotropes leads to a border distillation area that can not be
crossed by distillation.
Figure 5.5. System properties of the ETBE synthesis process

- 120 -
5.6. Pre-reactor and RD column
A simplified diagram for the ETBE production process by RD is shown in Fig. 5.6. There are
two fresh feed streams to the reactor: ethanol and the C4 stream that contains reactive isobutene
plus other C4 paraffins, naphthenes, and olefins. This C4 stream comes from the FCC process
as an intermediate product of the refinery (Petroleos del Norte). The boiling points of all of the
C4 components are quite similar and it is uneconomical to separate out the isobutene reactants
from the other C4s. The C4 fresh feedstream contains 18-19 mol% reactive isobutene. The
remaining components are n-butenes, butanes, butadiene, etc. (largely n-butene), which are
inert under the conditions in which the etherification reaction takes place. In order to analyze
the RD process for the ETBE production using feed stream compositions studied in other
processes (Chapter 3 and Chapter 4), several design parameters are changed, and their
parameters on the steady-state performance of the RD column are determined.
5.7. Effect of design parameters on RD column performance
The process flow-sheet consists of a single reactor whose operating pressure is set at 10 bar, as
in the conventional process, which is coupled to the RD column (Figure 5.6). The temperature
at the exit of the reactor is 70 °C and an isobutene conversion of 80% is achieved.
Figure 5.6. Schematic diagram of the RD process for ETBE production
The RD column taken from a reference work (Sneesby et al., 1997) consists of 2 stages in the
rectification section (including a total condenser), 3 reactive stages and 5 stages in the stripping
section (including the reboiler). The feed to the column is done just below the reaction section
(stage 6) to minimize the amount of product in this section and thus favor the shift of the

- 121 -
reaction equilibrium towards ETBE formation. The pressure at the top of the RD column is 9.5
bar and the temperature in the reaction section is between 70 and 75 °C (Figure 5.7), thereby
avoiding the conditions favoring both the catalyst deactivation (high temperatures) and the
formation of DIB (low reaction temperatures). The column produces a bottom stream with 95.2
wt% ETBE, for which a reflux ratio of 5 is required. Concentration of main components and
temperature profile in the RD column is shown in Figure 5.7.
Figure 5.7. Concentration of main components and temperature profile in the RD column
In order to evaluate the number of trays required to achieve the target product purity, we have
carried out a sensitivity analysis, as shown in Table 5.4. A reflux ratio of 5 was specified,
keeping the number of stages in the rectification section and in the reactive section, so that only
the number of trays in the stripping section varies. As can be seen in Table 3, 16 trays are
required to reach 95.2 wt% ETBE in the bottom stream, but adding more trays in the stripping
section does not imply an additional improvement in product purity.
Table 5.4. Effect of total number of trays in RD column on ETBE purity
Number of trays ETBE purity, wt%
10 94.5
12 95.0
14 95.1
16 95.2
18 95.2

- 122 -
In a RD column, reflux not only enhances separation, but also recycles unreacted reactants to
the reaction zone and increases conversion (Sneesby et al., 1997). The effect of reflux ratio on
ETBE purity in bottom stream and ETBE losses with distillate stream is shown in Figure 5.8,
where it is evident that an increase in the reflux ratio favors an increase of the ETBE content in
bottom stream and, at the same time, a decrease of ETBE losses with the distillate stream.
Figure 5.8. Effect of reflux ratio on ETBE purity in bottom stream and ETBE losses with
distillate stream.
As Sneesby et al. (1997) has highlighted, in RD the reboiler duty must be set to ensure sufficient
recycle of unreacted, heavy reactant to the reaction zone without excluding the light reactant
from the reaction zone. As shown in Figure 5.9, there is an optimal reboiler duty value for which
the ETBE purity is maximal while the ETBE losses in the distillate stream increase
monotonically with the reboiler duty.
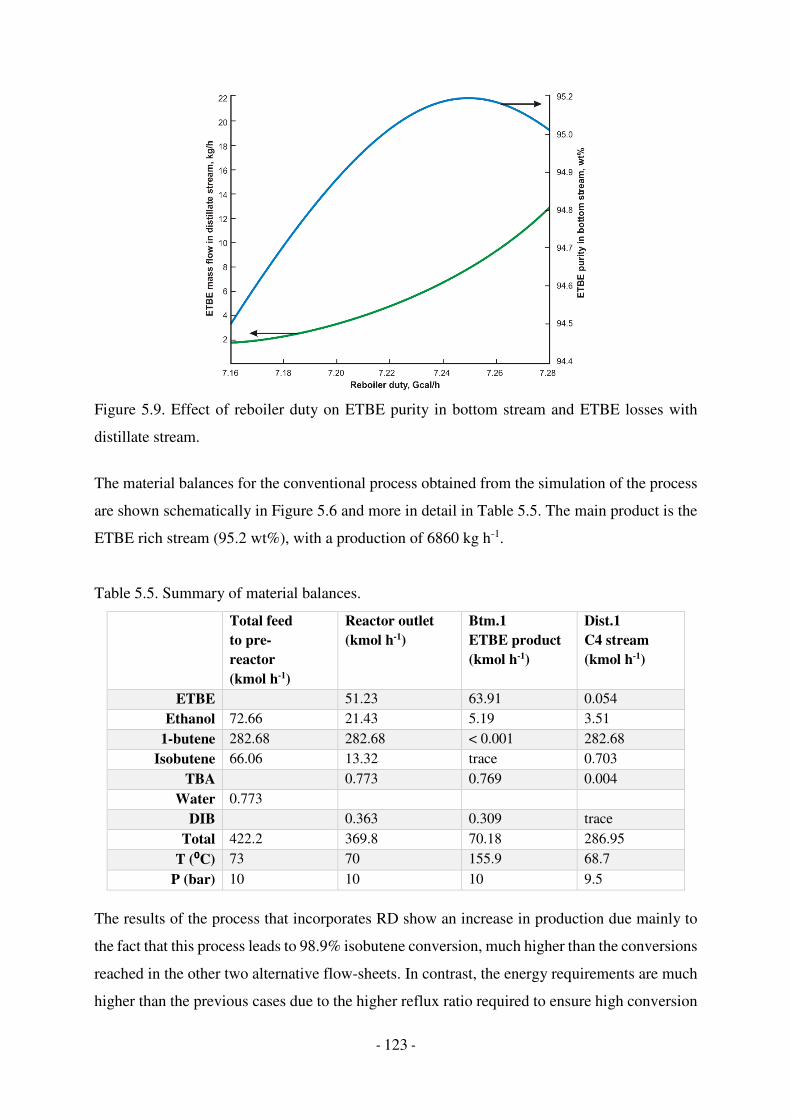
- 123 -
Figure 5.9. Effect of reboiler duty on ETBE purity in bottom stream and ETBE losses with
distillate stream.
The material balances for the conventional process obtained from the simulation of the process
are shown schematically in Figure 5.6 and more in detail in Table 5.5. The main product is the
ETBE rich stream (95.2 wt%), with a production of 6860 kg h-1.
Table 5.5. Summary of material balances.
Total feed to pre-reactor (kmol h-1)
Reactor outlet (kmol h-1)
Btm.1 ETBE product (kmol h-1)
Dist.1 C4 stream (kmol h-1)
ETBE 51.23 63.91 0.054
Ethanol 72.66 21.43 5.19 3.51
1-butene 282.68 282.68 < 0.001 282.68
Isobutene 66.06 13.32 trace 0.703
TBA 0.773 0.769 0.004
Water 0.773
DIB 0.363 0.309 trace
Total 422.2 369.8 70.18 286.95
T (⁰⁰⁰⁰C) 73 70 155.9 68.7
P (bar) 10 10 10 9.5
The results of the process that incorporates RD show an increase in production due mainly to
the fact that this process leads to 98.9% isobutene conversion, much higher than the conversions
reached in the other two alternative flow-sheets. In contrast, the energy requirements are much
higher than the previous cases due to the higher reflux ratio required to ensure high conversion

- 124 -
and at the same time to achieve the target ETBE purity. Thus, the energy requirements for
condensation (8.9 MW) and reboiler duty (9.2 MW) are appreciably greater than the
consumption in the alternative cases.
5.8. Heat integration optimization for RD process
To decrease energy consumption in this process external heat integration options have been
revised. The ETBE product stream (bottoms stream of RD column) temperature is about 160
ºC (as saturated liquid at 10 bar), which means that some heat integration between the RD
column outlet stream and the process streams that require heating before this column may be
very convenient from the economic point of view. In this section, the pinch analysis has been
applied to evaluate heat integration options. The simulation program Aspen Energy Analyzer
has been used to generate heat exchanger networks from process models built in Aspen Plus.
From the results of the calculations, we have found that the bottom stream from the distillation
column can be used to heat the stream coming out of the reactors to be fed to the RD column,
using the same exchanger intended for use with utilities (E101), i.e. no additional heat
exchanger is required in this case. In addition, heat integration from reactor heat to the initial
feed stream with the purpose of achieving the target feed temperature, also save some utility
consumptions. Therefore, an additional heat exchanger (E100) with heat transfer area of 256
m2 is required. Final design changes and simulation results are summarized in Figures 5.10,
5.11 and Table 5.6.
Figure 5.10. Heat exchanger network design for RD process

- 125 -
Table 5.6. Energy consumption, economic and environmental performances
Base case Design
Low pressure steam 0.76 0.06
Medium pressure steam 8.43 8.43
Total Hot Utilities, MW 9.19 8.49
Cooling water 8.86 8.28
Total Cold Utilities, MW 8.86 8.28
Average utility saving, % - 5.3
Extra equipment cost, € - 41145
Total equipment purchased cost, k€ 809.6 850.8
Payback period, year - 1.2
CO2 emission, kg/h 3974 3765
Figure 5.11. Grid diagram for HEN design for RD process
- 126 -
References
1. Alonso-Dávila P. Diseño de un proceso óptimo para la producción de éter etil tert-butílico.
Tesis Doctoral, Universidad de Cantabria (2003).
2. Colombo F, Cori L, Dalloro L, Delogu P. Equilibrium constant for the methyl tert-butyl ether
liquid-phase synthesis using UNIFAC, Ind Eng Chem Fund 22: 219-223 (1983).
3. Doherty MF, Malone MF. Conceptual design of distillation systems. McGraw-Hill Book Co,
Singapore (2001).
4. Ethers. In: Hydrocarbon processing’s 2008 Refining processes handbook, Gulf Publishing,
Houston, pp. 141-147 (2008).
5. Agreda VH, Partin LR. Reactive distillation process for the production of methyl acetate.
U.S. Patent No. 4,435,595 (1984).
6. Al-Arfaj MA, Luyben WL. Control study of ethyl tert-butyl ether reactive distillation. Ind
Eng Chem Res 41: 3784-3796 (2002).
7. Daniel G, Jobson M. Conceptual design of equilibrium reactor-reactive distillation flow-
sheets. Ind Eng Chem Res 46: 559-570 (2007).
8. Hauan S, Hertzberg T, Lien KM. Why methyl tert-butyl ether production by reactive
distillation may yield multiple solutions. Ind Eng Chem Res 34: 987-991 (1995).
9. Izquierdo JF, Cunill F, Vila M, Iborra M, Tejero J. Equilibrium constants for methyl tert-
butyl ether and ethyl tert-butyl ether liquid-phase syntheses using C4 olefinic cut. Ind Eng Chem
Res 33: 2830-2835 (1994).
10. Jacobs R, Krishna R. Multiple solutions in reactive distillation for methyl tert-butyl ether
synthesis. Ind Eng Chem Res 32: 1706-9 (1993).
11. Jensen KL, Datta R. Ethers from ethanol. 1: Equilibrium thermodynamic analysis of the
liquid-phase ethyl tert-butyl ether reaction. Ind Eng Chem Res 34: 392-329 (1995).
12. Jhon YH, Lee T. Dynamic simulation for reactive distillation with ETBE synthesis. Sep
Purif Technol 31: 301-317 (2003).

- 127 -
13. Khaledi R, Young B. Modeling and model predictive control of composition and conversion
in an ETBE reactive distillation column. Ind Eng Chem Res 44: 3134-3145 (2005).
14. Lander E, Hubbard JN, Smith L. Revving-up refining profits with catalytic
distillation. Chemical Engineering 90: 36 (1983).
15. Luyben WL, Chien I. Design and control of distillation systems for separating azeotropes.
John Wiley & Sons, Hoboken, NJ (2010).
16. Luyben WL. Comparison of pressure-swing and extractive-distillation methods for
methanol-recovery systems in the TAME reactive-distillation process. Ind Eng Chem Res 44:
5715-5125 (2005).
17. Luyben WL, Yu C. Reactive distillation design and control. John Wiley & Sons, Hoboken,
NJ (2008).
18. Mohl K, Kienle A, Gilles E, Rapmund P, Sundmacher K, Hoffmann U. Steady-state
multiplicities in reactive distillation columns for the production of fuel ethers MTBE and
TAME: Theoretical analysis and experimental verification. Chem Eng Sci 54: 1029-1043
(1999).
19. Nijhuis S, Kerkhof F, Mak A. Multiple steady states during reactive distillation of methyl
tert-butyl ether. Ind Eng Chem Res 32: 2767-2774 (1993).
20. Quitain A, Itoh H, Goto S. Reactive distillation for synthesizing ethyl tert-butyl ether from
bioethanol. J Chem Eng Jpn 32: 280-287 (1999).
21. Rehfinger A, Hoffmann U. Formation of di-isobutene, main by-product of methyl tertiary
butyl ethyl ether synthesis catalyzed by ion exchange resin, Chem Eng Technol 13: 150-156
(1990).
22. Sharifzadeh M. Implementation of a steady-state inversely controlled process model for
integrated design and control of an ETBE reactive distillation. Chem Eng Sci 92: 21-39 (2013).
23. Siirola JJ. An industrial perspective on process synthesis. AIChE Symposium Series 91: 222-
234 (1995).
- 128 -
24. Sneesby MG, Tadé MO, Datta R, Smith TN. ETBE synthesis via reactive distillation. 1.
steady-state simulation and design aspects. Ind Eng Chem Res 36: 1855-1869 (1997).
25. Srinath S, Kanthi K, Venkat RG. Modeling and simulation of multicomponent reactive
distillation. Récents Progrès en Génie des Procédés 94: 1/8-8/8 (2007)
26. Stichlmair GJ, Fair RJ. Distillation principles and practices. Wiley-VCH, Weinheim (1998).
27. Subawalla H, Fair JR. Design guidelines for solid-catalyzed reactive distillation
systems. Ind Eng Chem Res 38: 3696-3709 (1999).
28. Sundmacher K, Kienle A (Eds.). Reactive Distillation, Wiley-VCH Verlag, Weinheim
(2003).
29. Thiel C, Sundmacher K, Hoffmann U. Residue curve maps for heterogeneously catalysed
reactive distillation of fuel ethers MTBE and TAME. Chem Eng Sci 52: 993-1005 (1997).

- 129 -
CHAPTER 6 TECHNO-ECONOMIC ANALYSIS FOR THE PRESSURE-SWING,
REACTIVE DISTILLATION AND PERVAPORATION INTEGRATED
HYBRID PROCESSES
Chapter contents
6.1. Introduction
6.2. Equipment sizing and selection
6.3. Equipment costs for the PSD process
6.4. Equipment costs for the RD process
6.5. Equipment costs for the PV integrated hybrid process
6.6. Costing and project evaluation for ETBE production
6.7. Raw materials and energy analysis in the ETBE production
References

- 130 -
6.1. Introduction
This chapter provides a comparative techno-economic analysis of ETBE production through
the processes based on PSD, RD and PV integrated hybrid scheme with alcohol selective
membranes (hybrid process). The comparison of the PV integrated hybrid process to the
industrial PSD and RD processes has been done by subsequent consideration of the resulting
specific techno-economic analysis, including annual capital and operating costs.
The most important item in an industrial plant is the value of the equipment, since it
characterizes and defines the process, influencing at the same time the rest of the items. In
general, to study the cost of the equipment, three methods are usually used:
- The first is to use a properly scaled and updated reference equipment. For this purpose, this
reference value must be of the same type and similar characteristics as the one sought.
- The second way is to use the cost curves, which represent the cost of the equipment and the
unit of its functional parameter.
- Finally, a more abstract way is to correlate the cost with the fundamental parameters of design
through an empirical equation. This method assumes greater precision, but also a
comprehensive statistical study. It is the one used in computer estimation packages (Madrigal
et al., 1991; González, 2000).
In our case, we have used the cost indexes (Table 6.1) found in the literature (Towler and
Sinnott, 2012) to determine the costs of the distillation towers, reactors, pumps and the different
exchangers, while the costs of the modules (including the membrane) have been obtained by
consulting the major manufacturers.
Operating costs for the processes included fixed costs and total energy costs for heating and
cooling utilities for different stages of the process (Sinnott, 2009; Ulrich and Vasudevan, 2004).
The energy required for the PV process consists mainly of heating (or cooling) energy of the
initial mixture before feeding to the PV unit and energy for condensing permeate.
Capital costs for the process of conventional and reactive distillation processes include the cost
of reactors, columns, heat exchangers, condensers, pumps. On the other hand, the capital cost
of hybrid process include the cost of reactors, debutanizer, stream pumps, heat exchangers,
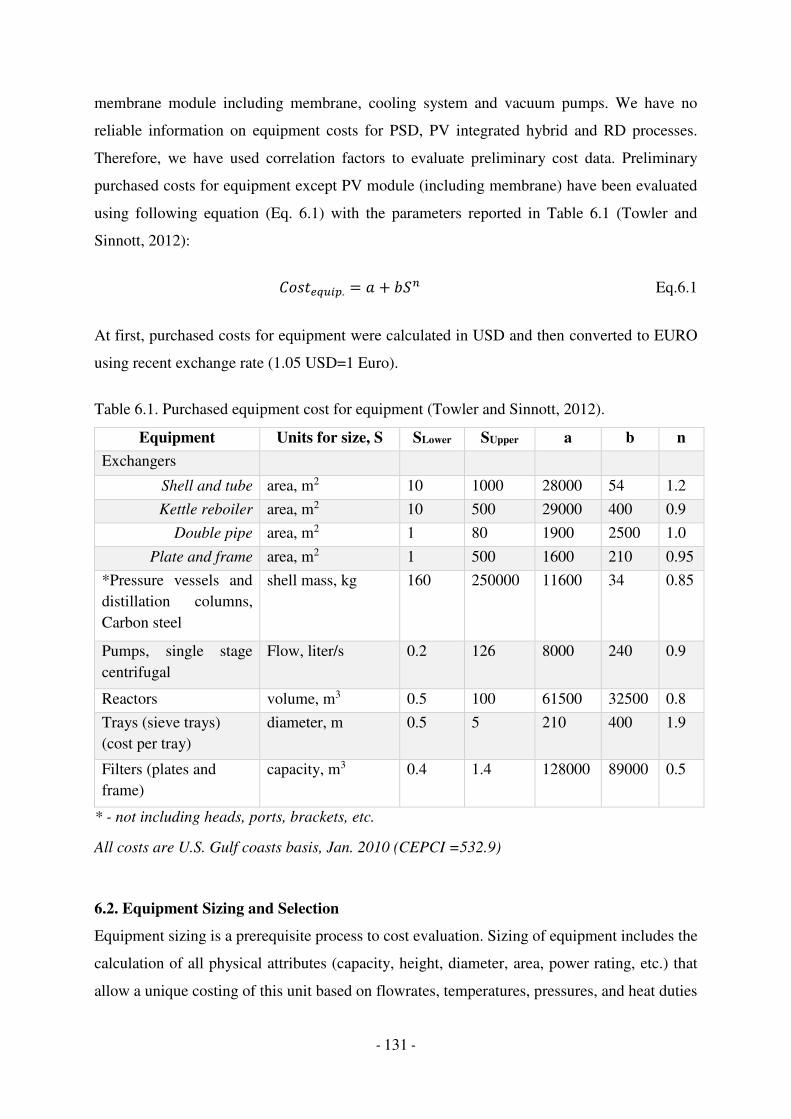
- 131 -
membrane module including membrane, cooling system and vacuum pumps. We have no
reliable information on equipment costs for PSD, PV integrated hybrid and RD processes.
Therefore, we have used correlation factors to evaluate preliminary cost data. Preliminary
purchased costs for equipment except PV module (including membrane) have been evaluated
using following equation (Eq. 6.1) with the parameters reported in Table 6.1 (Towler and
Sinnott, 2012):
(¼½vN¦¾�&. = £ + ¤P Eq.6.1
At first, purchased costs for equipment were calculated in USD and then converted to EURO
using recent exchange rate (1.05 USD=1 Euro).
Table 6.1. Purchased equipment cost for equipment (Towler and Sinnott, 2012).
Equipment Units for size, S SLower SUpper a b n
Exchangers
Shell and tube area, m2 10 1000 28000 54 1.2
Kettle reboiler area, m2 10 500 29000 400 0.9
Double pipe area, m2 1 80 1900 2500 1.0
Plate and frame area, m2 1 500 1600 210 0.95
*Pressure vessels and
distillation columns,
Carbon steel
shell mass, kg 160 250000 11600 34 0.85
Pumps, single stage
centrifugal
Flow, liter/s 0.2 126 8000 240 0.9
Reactors volume, m3 0.5 100 61500 32500 0.8
Trays (sieve trays)
(cost per tray) diameter, m 0.5 5 210 400 1.9
Filters (plates and
frame) capacity, m3 0.4 1.4 128000 89000 0.5
* - not including heads, ports, brackets, etc.
All costs are U.S. Gulf coasts basis, Jan. 2010 (CEPCI =532.9)
6.2. Equipment Sizing and Selection
Equipment sizing is a prerequisite process to cost evaluation. Sizing of equipment includes the
calculation of all physical attributes (capacity, height, diameter, area, power rating, etc.) that
allow a unique costing of this unit based on flowrates, temperatures, pressures, and heat duties

- 132 -
from the flow-sheet mass and energy balance. This section describes the general approach used
to size and select the equipment for all of studied processes. The details of design basis, streams
and unit operations data were provided in Chapters 3, 4 and 5. As discussed before, we have
used a single equilibrium reactor for simulation purposes of the etherification process. A
combination of spreadsheet calculations and simulation tools (Aspen Plus Economic Analyzer;
Sinnott, 2009; Towler and Sinnott, 2012) have been used to size and cost evaluation of
equipment in the process.
The production of ETBE is mainly carried out under pressure condition. Wall thickness and
shell mass have to be taken into account to estimate techno-economic characteristics of the
columns. The first step is to convert the units to those required for the correlations and
determine any missing design information. The distillation column can be considered as a
combination of a vertical pressure vessel and internals. For all distillation columns, we need to
know the wall thickness. The design pressure of the vessels should be 10% above the operating
pressure. For example, if the operating pressure is 10 bar (1.0⨯106 N/m2), the design pressure
should be 11 bar (1.1⨯106 N/m2). In general, the wall thickness of any vessel should not be less
than the following values (Table 6.2):
Table 6.2. Minimum wall thickness of vessels including a corrosion allowance of 2 mm.
Vessel diameter (m) Minimum thickness (mm)
1 5
1 to 2 7
2 to 2.5 9
2.5 to 3.0 10
3.0 to 3.5 12
For a cylindrical shell, as well as for a distillation column the minimum thickness required to
resist internal pressure can be determined from following consideration (Towler and Sinnott,
2008):
v¿ = S=C=zRnI".zS= (Eq.6.2)
where D is the internal diameter of a vessel or a column, P is the internal pressure, S is the
maximum allowable stress and E is welded-joint efficiency. The maximum allowable stress for

- 133 -
carbon steel material at up to 260 ºC and density, are 88.9 N/mm2 and 7850 kg/m3, respectively.
Assuming the welds will be fully radiographed, the weld efficiency is 1.0, so the consideration
for minimum thickness follows:
v¿ = S=C=zRI".zS= (Eq.6.3)
Now the shell mass can be calculated:
½ℎe³³Á£½½ = ²?�8�v¿� (Eq.6.4)
where L is the length of vessel, � is the metall density (8000 kg/m3 for stainless steel and 7850
for carbon steel). The detailed calculation parameters can be found in the reference by Towler
and Sinnott (2008 and 2012).
6.3. Equipment costs for the PSD process
This process consisted of a total of 9 main equipments, including distillation column (DC1,
DC2, DC3), reactor, pumps (P100, P101), heat exchangers (E100, E101) and pressure control
valves.
Reactor
In the reaction system used in the PSD process, the pressure is 10 bar, the feed and outlet stream
flowrates are 41.6 and 38.2 m3/h, respectively. The required reactor volume was estimated to
be 5.5 m3. Total isobutene conversion of 94.3% is reached.
Heat exchanger before the reactor (E100)
The feed stream is preheated prior to the reaction by heat integration (E100) using the distillate
stream from the third distillation column and consequent heat exchanger with low pressure
steam. A temperature of 73 °C is required to be fed to the reactor section. The calculated heat
transfer area for these two heat exchangers are 106.4 m2 and 7.6 m2, respectively.
Heat exchanger before the debutanizer column (E101)
The simulation results showed that it is more appropriate to introduce the feed stream into the
column as a saturated liquid. Since a pressure of 10 bar has been specified, the feed stream must
be heated to 72.6 °C to reach the saturated liquid state. A net duty of 0.42 MW and a heat
transfer area of 41.4 m2 are required.

- 134 -
Debutanizer column (DC1)
The removal of hydrocarbon from the multicomponent mixture takes place in a debutanizer
column. The energy required for separation is supplied through the column reboiler. The
debutanizer was sized using the Aspen Economic Analyzer tool. The pressure drop is
considered about 0.6 bar. The diameter and height of the column with tray spacing of 0.6 m,
are 1.4 and 19 m, respectively. Carbon steel is selected for this and all other columns.
The reboiler pressure is 8.43 bar. A kettle-type with U-tube bundle was chosen as a reboiler.
Middle pressure steam is used as utility. Taking into account that the temperature in the reboiler
is 151 ºC, 2.4 MW reboiler duty and 126 m2 heat transfer area are required.
The debutanizer condenser cools and condenses the hot overhead vapors exiting from the top
of the column. The condenser is a shell and tube type exchanger. Cooling water at 20 ºC is used
as an operating utility, assuming a temperature rise of 5°C. The temperature is 60°C in the
debutanizer condenser. Respective heat transfer area and condenser duty were estimated to be
79 m2 and 2.2 MW.
Part of the condensed liquid from the debutanizer condenser vessel is sent back to the
debutanizer column as a reflux via a circulation pump. The reflux pump is a centrifugal type
and has an efficiency of 70% and liquid flowrate of 9.6 L/s. On the other hand, the calculated
shell mass of the tower is about 5.8 ton.
Distillation column for ETBE product (DC2)
In the second distillation column after debutanizer ETBE product is separated as a bottom
stream. Condenser is not included in it. The diameter and height of the column calculated are
1.07 and 11 m, respectively.
The reboiler pressure is 7.5 bar. A kettle-type reboiler and middle pressure steam as a utility
are used. Taking into account that the temperature in the reboiler is 145 ºC, 1.84 MW reboiler
duty and 76.5 m2 heat transfer area are required. On the other hand, the calculated shell mass
of the tower is about 2.15 ton.
Distillation column for alcohol separation (DC3)
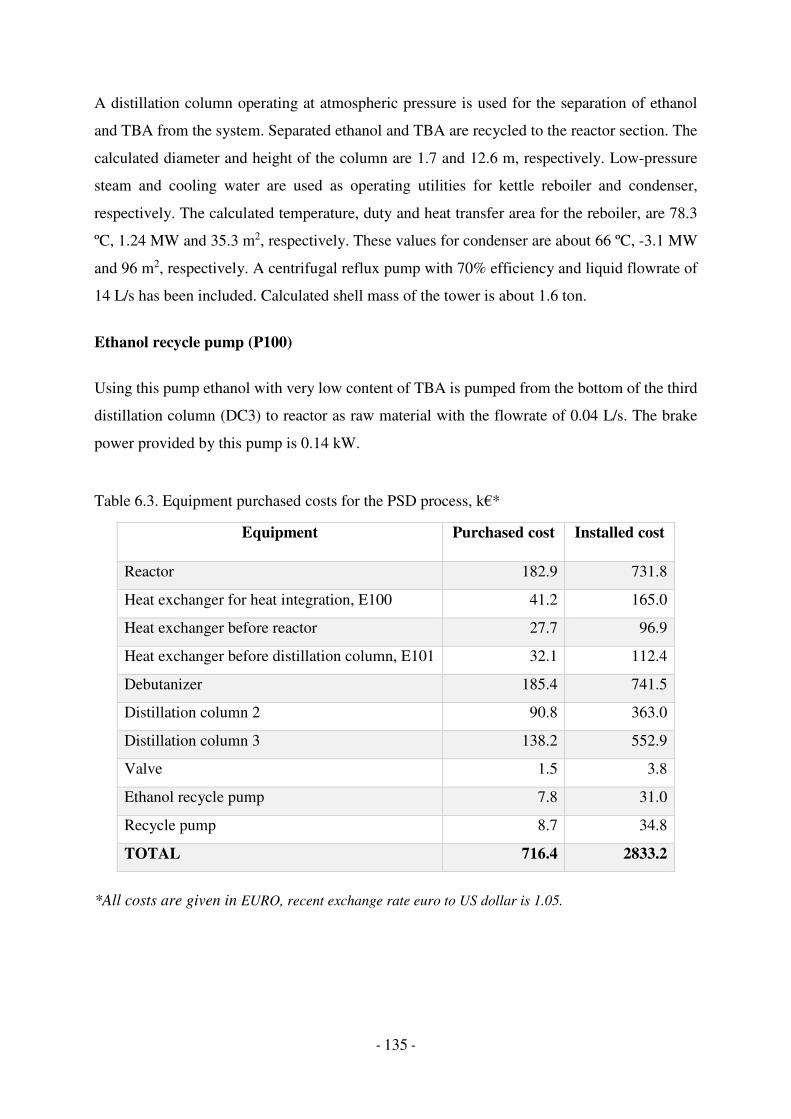
- 135 -
A distillation column operating at atmospheric pressure is used for the separation of ethanol
and TBA from the system. Separated ethanol and TBA are recycled to the reactor section. The
calculated diameter and height of the column are 1.7 and 12.6 m, respectively. Low-pressure
steam and cooling water are used as operating utilities for kettle reboiler and condenser,
respectively. The calculated temperature, duty and heat transfer area for the reboiler, are 78.3
ºC, 1.24 MW and 35.3 m2, respectively. These values for condenser are about 66 ºC, -3.1 MW
and 96 m2, respectively. A centrifugal reflux pump with 70% efficiency and liquid flowrate of
14 L/s has been included. Calculated shell mass of the tower is about 1.6 ton.
Ethanol recycle pump (P100)
Using this pump ethanol with very low content of TBA is pumped from the bottom of the third
distillation column (DC3) to reactor as raw material with the flowrate of 0.04 L/s. The brake
power provided by this pump is 0.14 kW.
Table 6.3. Equipment purchased costs for the PSD process, k€*
Equipment Purchased cost Installed cost
Reactor 182.9 731.8
Heat exchanger for heat integration, E100 41.2 165.0
Heat exchanger before reactor 27.7 96.9
Heat exchanger before distillation column, E101 32.1 112.4
Debutanizer 185.4 741.5
Distillation column 2 90.8 363.0
Distillation column 3 138.2 552.9
Valve 1.5 3.8
Ethanol recycle pump 7.8 31.0
Recycle pump 8.7 34.8
TOTAL 716.4 2833.2
*All costs are given in EURO, recent exchange rate euro to US dollar is 1.05.

- 136 -
Azeotrop recycle pump (P101)
The ETBE/ethanol azeotropic mixture obtained at the top of the third column is recycled to the
second distillation column using this pump. To provide a flow rate of 4.7 L/s the required power
was estimated to be 0.14 kW.
Overhead product pressure control valve
The overhead product valve is typically used to control the product pressure level. In this case
the change of high-pressure distillate product from DC2 to the atmospheric pressure column
(DC3) should be controlled by means of a pressure control valve. It normally has no effect on
column operation. There are no open reference about the price of such industrial valves.
Therefore, the price for the pressure reducing valve from commercial web sites
(http://www.flomatic.com) is approximately 1524 Euros.
Using these data, the purchased equipment cost theoretically estimated using methods reported
by Towler and Sinnott (2012) is summarized in Table 6.3.
6.4. Equipment costs for the PV integrated hybrid process
Reactor, debutanizer column, heat exchangers located before the reactor and before the
debutanizer column have the same characteristics as those previously described for the
conventional pressure swing process. Only difference is the sidestream outlet to PV units and
inlet recycle to the debutanizer; With respect to the reboiler of the debutanizer column, the
calculations indicate than the reboiler duty (2.5 MW) and heat transfer area (149 m2) are slightly
higher than those of debutanizer used in PSD process. The final estimated prices for devices
included in this process are depicted in Table 6.4.
Heat exchangers
There are 4 heat exchangers in the conventional part of the hybrid process, 2 of them (E100,
E101) are for heat integration purposes and others for reaching additional target temperature.
The feed stream to reactor needs to be is heated up to about 73 °C using two heat exchangers:
E100 with 31.5 m2 and other heat exchanger with 1.4 m2. The stream containing the reaction
products needs to be heated from 46 °C to 72 °C (Just below its saturation temperature at a
pressure of 8.4 bar) using other two heat exchangers: E101 (2.9 m2) and other heat exchanger

- 137 -
(4.2 m2). The equipments E100 and E101 are applied for heat integration as described in
Chapter 4.
Heat exchangers before PV units
As previously indicated, we have adopted a feed temperature to the PV modules of 70 °C to
preserve the thermal stability of the membrane. Pervaporation operates in adiabatic mode, so
interstage heaters are then required between membrane module stages to compensate for
temperature drop due to latent heat of evaporation removed by the permeating vapor. Thus,
there are seven heat exchangers for seven membrane modules in the hybrid process. The heat
transfer area of the first heat exchanger is about 1.6 m2, whereas other heat exchangers have
about 0.1 m2 heat transfer area.
Membrane modules
According to the simulation results the total required membrane area is 210 m2 in the hybrid
process. We have assumed the use of commercial membrane modules with 30 m2 membrane
area. Thus, 7 PV modules are required to obtain the specified composition of ETBE in the
bottom stream. González and Ortiz (2002) mentioned that the membrane module price
including membrane was 1106 Euro/m2. Approximate membrane prices fluctuated between
100-200 Euro/m2 and installed cost of PV block laid by a factor of 3.36 of the total purchased
cost of the membrane modules. Generally, in industry the membrane replacement duration is
considered as 2-3 years. (González and Ortiz, 2002). However, a recent price (October 2016)
for PV module was consulted with industrial manufacturers (Sulzer Chemtech, Germany) and
it is about 1100 Euro/m2.
The membrane replacement costs have been calculated and included in the economic analysis
of the hybrid process. The highest price of membrane is assumed as 200 USD in 2001 (González
and Ortiz, 2001) and this price was converted to current price in euro via cost estimation
analysis (CEPCI 2016=541.7) and current exchange rate of euro to USD (1.05):
(ÂnÂ�.bnSL. = €zÄi/@Å·Æ(@Å)z(<NTOÇ) (Eq.6.5)
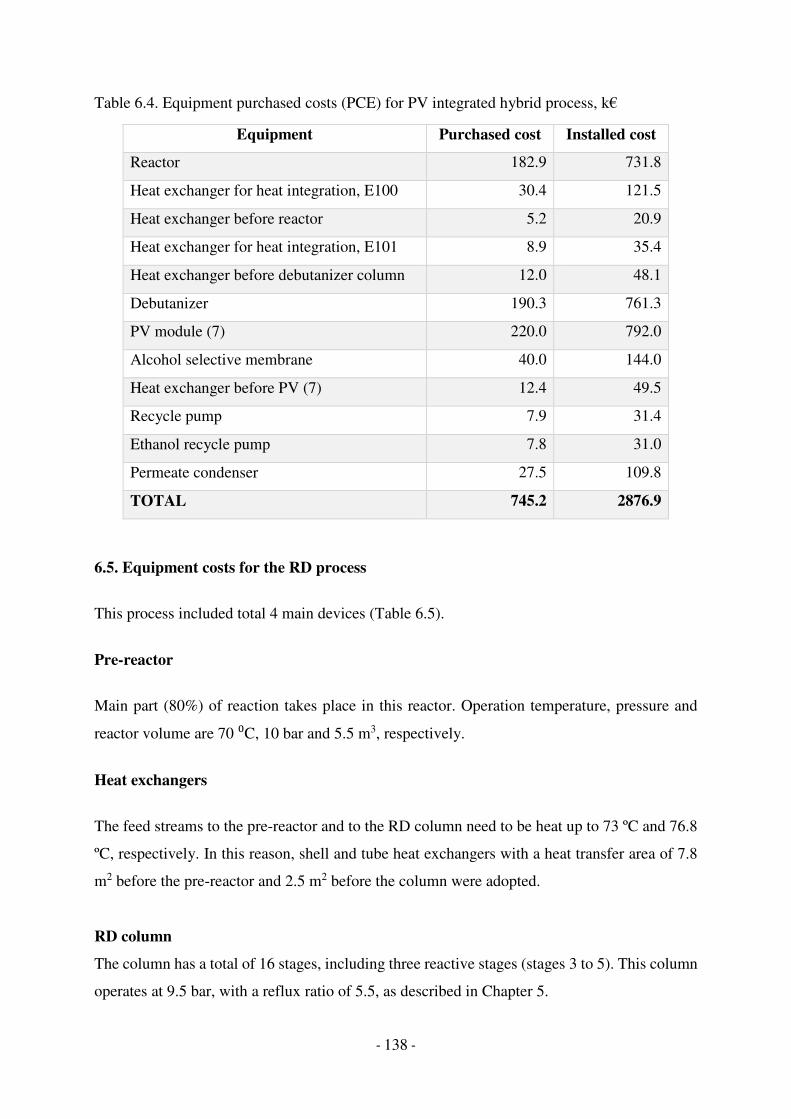
- 138 -
Table 6.4. Equipment purchased costs (PCE) for PV integrated hybrid process, k€
Equipment Purchased cost Installed cost
Reactor 182.9 731.8
Heat exchanger for heat integration, E100 30.4 121.5
Heat exchanger before reactor 5.2 20.9
Heat exchanger for heat integration, E101 8.9 35.4
Heat exchanger before debutanizer column 12.0 48.1
Debutanizer 190.3 761.3
PV module (7) 220.0 792.0
Alcohol selective membrane 40.0 144.0
Heat exchanger before PV (7) 12.4 49.5
Recycle pump 7.9 31.4
Ethanol recycle pump 7.8 31.0
Permeate condenser 27.5 109.8
TOTAL 745.2 2876.9
6.5. Equipment costs for the RD process
This process included total 4 main devices (Table 6.5).
Pre-reactor
Main part (80%) of reaction takes place in this reactor. Operation temperature, pressure and
reactor volume are 70 ⁰C, 10 bar and 5.5 m3, respectively.
Heat exchangers
The feed streams to the pre-reactor and to the RD column need to be heat up to 73 ºC and 76.8
ºC, respectively. In this reason, shell and tube heat exchangers with a heat transfer area of 7.8
m2 before the pre-reactor and 2.5 m2 before the column were adopted.
RD column
The column has a total of 16 stages, including three reactive stages (stages 3 to 5). This column
operates at 9.5 bar, with a reflux ratio of 5.5, as described in Chapter 5.

- 139 -
Table 6.5. Equipment purchased costs for RD process, k€
Equipment Purchased cost Installed cost
Pre-reactor 182.9 731.8
Heat exchanger before reactor 27.7 110.8
Heat exchanger before RD column
27.3 109.0
RD column 612.8 2451.3
TOTAL 850.8 3403.0
According to the calculations, the diameter is 2.6 m and height of the column is 13 m with tray
spacing of 0.6 m. Middle pressure steam and cooling water are used as operating utility for
kettle reboiler and condenser. The calculated temperature, heat duty and heat transfer area for
reboiler are 156 ºC, 8.4 MW and 512 m2 respectively. These values for condenser are calculated
about 69 ºC, -8.3 MW and 243 m2 respectively. A centrifugal reflux pump is required, having
adopted a model with an efficiency of 70% to provide the required flow rate of 55.7 L/s. The
volume of reaction section of this column is about 9.5 m3. Calculated shell mass of the tower is
about 14 ton.
6.6. Costing and project evaluation for ETBE production
The studied three process configurations can produce the same purity of ETBE in the final
stream with purity ETBE content of 95.2 wt. % and at almost the same product flow rates
corresponding to an annual ETBE product rate of more than 51 thousand tons/year. To compare
the process economics the capital, operating and utility costs for the ETBE process
configurations have been studied. The Aspen Process Economic Analyzer is used to evaluate
the economic impact of process designs by expanding unit operations from simulator output to
equipment models using proprietary mapping technology, and calculating preliminary sizes for
these equipment items.
The total capital corresponds to the investment required for purchase of equipment, cost of labor
and materials (direct installation costs), costs for site preparation and buildings, and certain
other costs (indirect installation costs). It also includes costs for land, working capital, and
service facilities. Factorial method (Sinnott, 2005) has been used for the estimation of total
capital investment and annual operating cost. The fixed capital investment (FCI) is given as
direct and indirect costs. Direct costs or total cost of the physical plant take into account PCE -
equipment purchase cost; f1 - equipment erection, including foundations and minor structural
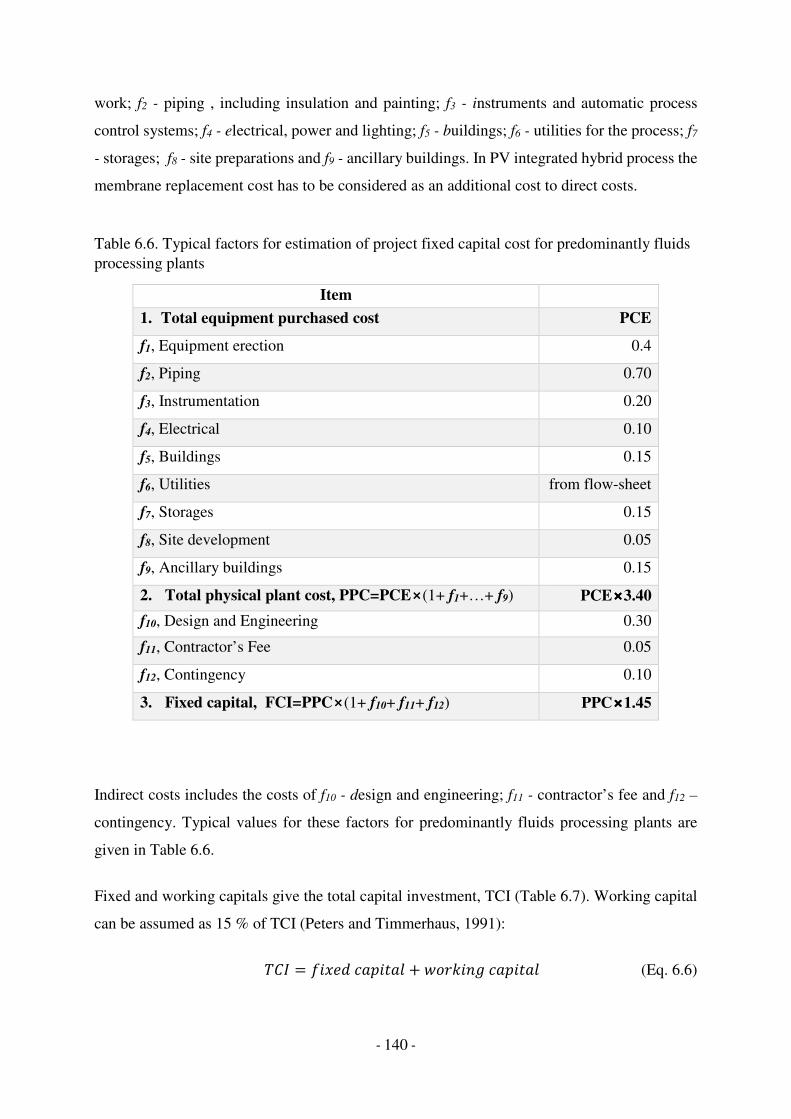
- 140 -
work; f2 - piping , including insulation and painting; f3 - instruments and automatic process
control systems; f4 - electrical, power and lighting; f5 - buildings; f6 - utilities for the process; f7
- storages; f8 - site preparations and f9 - ancillary buildings. In PV integrated hybrid process the
membrane replacement cost has to be considered as an additional cost to direct costs.
Table 6.6. Typical factors for estimation of project fixed capital cost for predominantly fluids
processing plants
Item
1. Total equipment purchased cost PCE
f1, Equipment erection 0.4
f2, Piping 0.70
f3, Instrumentation 0.20
f4, Electrical 0.10
f5, Buildings 0.15
f6, Utilities from flow-sheet
f7, Storages 0.15
f8, Site development 0.05
f9, Ancillary buildings 0.15
2. Total physical plant cost, PPC=PCE⨯(1+ f1+…+ f9) PCE⨯⨯⨯⨯3.40
f10, Design and Engineering 0.30
f11, Contractor’s Fee 0.05
f12, Contingency 0.10
3. Fixed capital, FCI=PPC⨯(1+ f10+ f11+ f12) PPC⨯⨯⨯⨯1.45
Indirect costs includes the costs of f10 - design and engineering; f11 - contractor’s fee and f12 –
contingency. Typical values for these factors for predominantly fluids processing plants are
given in Table 6.6.
Fixed and working capitals give the total capital investment, TCI (Table 6.7). Working capital
can be assumed as 15 % of TCI (Peters and Timmerhaus, 1991):
�(| = �1�eÈB£Q1v£³ + ɼÊË1µÌB£Q1v£³ (Eq. 6.6)
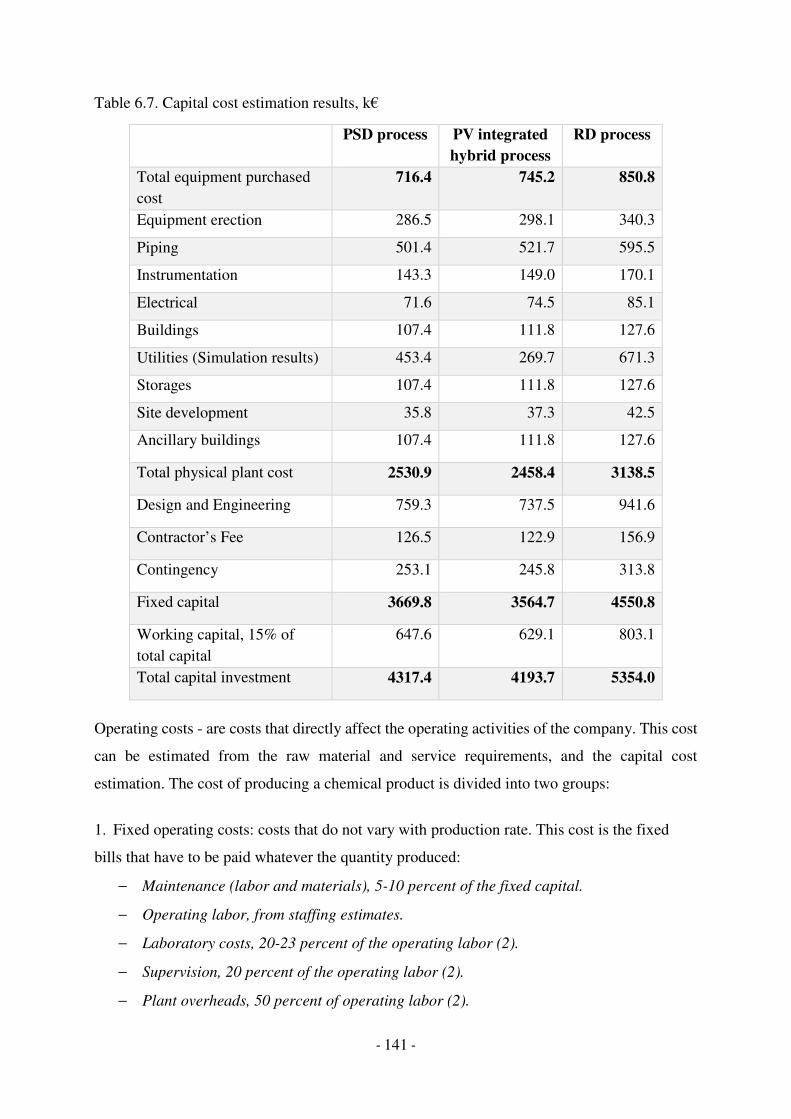
- 141 -
Table 6.7. Capital cost estimation results, k€
PSD process PV integrated hybrid process
RD process
Total equipment purchased
cost
716.4 745.2 850.8
Equipment erection 286.5 298.1 340.3
Piping 501.4 521.7 595.5
Instrumentation 143.3 149.0 170.1
Electrical 71.6 74.5 85.1
Buildings 107.4 111.8 127.6
Utilities (Simulation results) 453.4 269.7 671.3
Storages 107.4 111.8 127.6
Site development 35.8 37.3 42.5
Ancillary buildings 107.4 111.8 127.6
Total physical plant cost 2530.9 2458.4 3138.5
Design and Engineering 759.3 737.5 941.6
Contractor’s Fee 126.5 122.9 156.9
Contingency 253.1 245.8 313.8
Fixed capital 3669.8 3564.7 4550.8
Working capital, 15% of
total capital
647.6 629.1 803.1
Total capital investment 4317.4 4193.7 5354.0
Operating costs - are costs that directly affect the operating activities of the company. This cost
can be estimated from the raw material and service requirements, and the capital cost
estimation. The cost of producing a chemical product is divided into two groups:
1. Fixed operating costs: costs that do not vary with production rate. This cost is the fixed
bills that have to be paid whatever the quantity produced:
− Maintenance (labor and materials), 5-10 percent of the fixed capital.
− Operating labor, from staffing estimates.
− Laboratory costs, 20-23 percent of the operating labor (2).
− Supervision, 20 percent of the operating labor (2).
− Plant overheads, 50 percent of operating labor (2).

- 142 -
− Capital charges, 10 percent of the fixed capital.
− Insurance, 1 percent of the fixed capital.
− Local taxes, 2 percent of the fixed capital.
− License fees and royalty payments, 1 percent of the fixed capital.
2. Variable operating costs: costs that are dependent on the amount of product produced.
− Raw materials, from flow-sheet.
− Miscellaneous operating materials, 10 percent of maintenance (1).
− Utilities, from flow-sheet.
− Shipping and packaging, usually negligible.
For the estimation of the production costs, number of operators, annual salary for per operator,
as well as expenses of sales, general overheads, research and development are taken into
account. From 1992 to 2003, hourly wages grew at a rate of 3% per year. Assuming similar
behavior for the near future, one can predict annual operator salaries by the following:
dµµÍ£³¼QeÊ£v¼Ê½£³£Ê� = $41,600 ∙ 1.03(<Izii¡) = $61,091 (Eq. 6.7)
where y is the year of the estimation
In a typical, intensive operation, each operating slot requires five people. Three shifts per day
plus the equivalent of one shift on the weekend and one more person to cover vacations, sick
leave, and holidays. A total of 5 people per slot at 40 hours per week are required (Ulrich and
Vasudevan, 2004; Garrett, 1989).
Table 6.8. Operator requirements for various types of process equipment
Equipment type Operators per unit per shift Heat exchangers 0.05
Pumps 0
Reactors 0.3
Towers (including auxiliary pumps and
exchangers)
0.1-0.3
Plate and frame, shell and leaf filters 0.6
Different operating labor ratios required for various types of process equipment are shown in
Table 6.8 (Ulrich and Vasudevan, 2004). PV modules have been assumed as a plate and frame
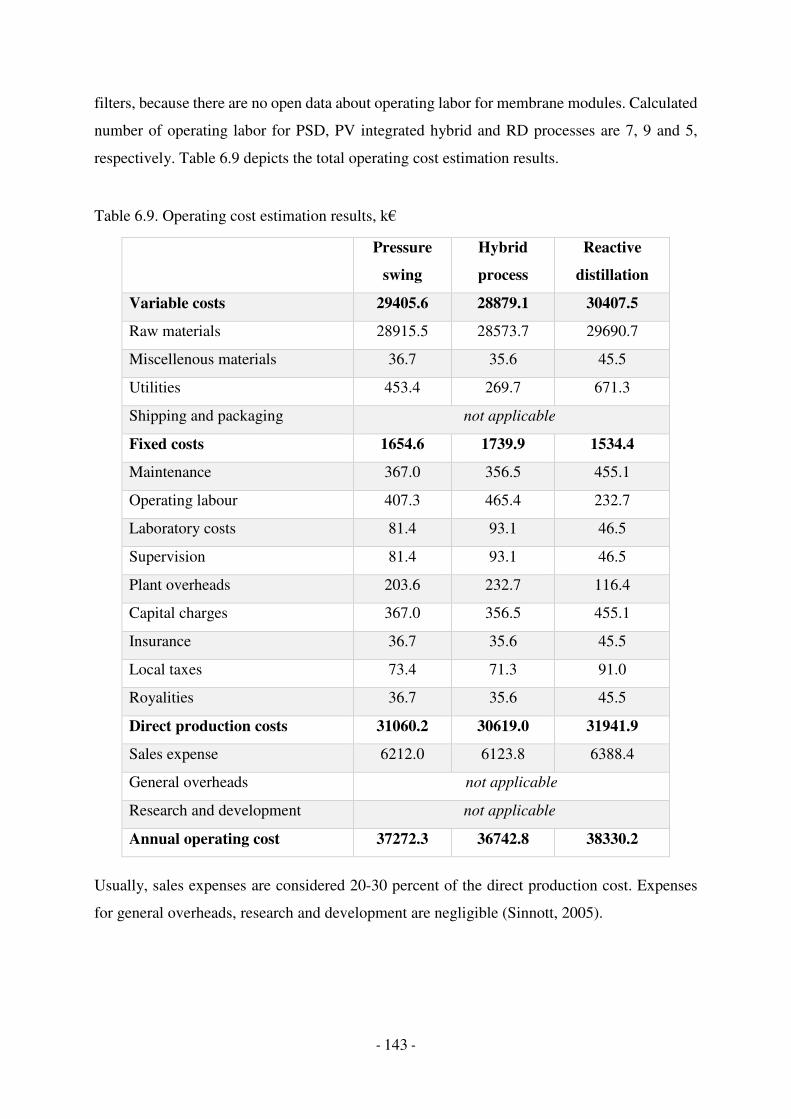
- 143 -
filters, because there are no open data about operating labor for membrane modules. Calculated
number of operating labor for PSD, PV integrated hybrid and RD processes are 7, 9 and 5,
respectively. Table 6.9 depicts the total operating cost estimation results.
Table 6.9. Operating cost estimation results, k€
Pressure
swing
Hybrid
process
Reactive
distillation
Variable costs 29405.6 28879.1 30407.5
Raw materials 28915.5 28573.7 29690.7
Miscellenous materials 36.7 35.6 45.5
Utilities 453.4 269.7 671.3
Shipping and packaging not applicable
Fixed costs 1654.6 1739.9 1534.4
Maintenance 367.0 356.5 455.1
Operating labour 407.3 465.4 232.7
Laboratory costs 81.4 93.1 46.5
Supervision 81.4 93.1 46.5
Plant overheads 203.6 232.7 116.4
Capital charges 367.0 356.5 455.1
Insurance 36.7 35.6 45.5
Local taxes 73.4 71.3 91.0
Royalities 36.7 35.6 45.5
Direct production costs 31060.2 30619.0 31941.9
Sales expense 6212.0 6123.8 6388.4
General overheads not applicable
Research and development not applicable
Annual operating cost 37272.3 36742.8 38330.2
Usually, sales expenses are considered 20-30 percent of the direct production cost. Expenses
for general overheads, research and development are negligible (Sinnott, 2005).

- 144 -
6.7. Raw materials and energy analysis in the ETBE production
Accordingly, mapping technology and equipment sizes evaluated by Aspen plus software, total
utilities and raw materials have been estimated. The price of industrial ethanol as a raw material
is set as 790 €/m3 (www.icispricing.com). The price of C4 hydrocarbon stream have not been
included in economic calculation, because this stream is an intermediate product from
manufacture (Petroleos del Norte, Spain) and main reactive component (isobutylene) is about
18-19 % (García-Echevarría, 2003). However, the price of this stream are almost the same in
all of process configurations. Only difference is RD process required more ethanol flowrate
than other process alternatives, because of ethanol recycle, so calculated annual flowrates of
ethanol stream for PSD, PV integrated hybrid and RD process are 4.12, 4.12 and 4.28 m3/h,
respectively.
Table 6.10. Energy consumption and environmental performances
PSD
process
Hybrid
process
RD process
Low pressure steam 1.36 0.15 0.06
Medium pressure steam 4.26 2.54 8.43
Total Hot Utilities, MW 5.62 2.69 8.49
Cooling water 5.91 2.96 8.28
Refrigerant - 0.04 -
Total Cold Utilities, MW 5.91 2.99 8.28
CO2 emission, kg/h 2536 1256 3765
Refrigerant, cooling water, and low and middle pressure steam are used as process utilities.
Utility costs and equipment sizes can be evaluated using the Aspen Economic Analyzer tool
via sizing and economic evaluation of corresponding equipment and process flow diagrams
from the process stream data. Default values in Aspen Plus software are chosen as cost prices
and CO2 emission factors for used utilities. European Commission decision of “2007/589/EC”
was used as a data source of CO2 emission factor and natural gas was specified as a fuel source.
Detailed of energy consumption for utilities, environmental performances and summary of
techno-economic analysis for studied processes are shown in Tables 6.10 and 6.11.

- 145 -
Table 6.11. Summary results
PSD
process
PV integrated
hybrid process
RD process
Total Capital Investment, k€ 4317.4 4193.7 5353.9
Total Operating Cost, k€ 37272.3 36742.8 38330.2
Raw materials cost, k€ 28915.5 28573.7 29690. 7
Fixed Capital Cost, k€ 3669.8 3255.7 3872.1
Total Utilities Cost, k€ 453.4 269.7 671.3
Total Equipment purchased Cost, k€ 716.4 745.2 850.8
Total Equipment installed cost, k€ 2833.2 2876.9 3403.0
Operating labor 407.3 488.7 232.7
CO2 emission, kg/h 2536 1256 3765
ETBE production rate, ktonne/op.year
(8000 h)
50.7 51.4 54.9
Production cost, €/tons 734.5 715.4 698.4

- 146 -
References
1. García-Echevarría M. La producción de biocarburantes por Petronor contribuye al uso de
energías renovables. DYNA 78: 26-30 (2003).
2. Garrett DE. Chemical Engineering Economics. Van Nostrand Reinhold, New York (1989).
3. González B. Aplicación de la pervaporación a la separación de mezclas azeotrópicas
alcohol/éter. Tesis doctoral, Universidad de Cantabria (2000).
4. Madrigal E, Miranda AL, Mirada F. Estimación de los costes de inversión en plantas
químicas (III): Estimación detallada: Equipo. Ingeniería Química 272: 199-210 (1991).
5. Peters MS, Timmerhaus KD. Plant design and economics for chemical engineers. 4th ed.
McGraw-Hill, New York, (1991).
6. Sinnott RK. Chemical engineering design. 4th ed. Elsevier, Oxford (2005).
7. Sinnott RK, Towler G. Chemical engineering design. 5th ed. Elsevier, Oxford (2009).
8. Towler G, Sinnott R. Chemical engineering design: Principles, practice and economics of
plant and process design. Elsevier, Burlington (2008).
9. Towler G, Sinnott RK. Chemical engineering design: Principles, practice and economics of
plant and process design. 2nd ed. Elsevier, Oxford (2012).
10. Ulrich G, Vasudevan PT. Chemical engineering process design and economics, A practical
guide. 2nd ed. Process Publishing, New Hampshire (2004).

- 147 -
CHAPTER 7 DISCUSSION AND CONCLUDING REMARKS
Chapter contents
7.1. Modelling of membrane module
7.2. ETBE purification using a PV integrated hybrid process
7.3. Economic analysis
7.4. Environmental analysis in the ETBE production
References

- 148 -
In recent years, ETBE have been manufactured in greater quantities than other oxygenate
additives, because of their physical, chemical and environmental properties. Another attractive
feature of ETBE is that it can be produced using renewable material. In other words, part of the
raw material can be replaced with a renewable material. We have simulated the different
alternatives of ETBE production process and compared them. To purify the ETBE, the
pervaporative separation of ethanol/ETBE/hydrocarbon multicomponent mixtures was studied
and a phenomenological model including the component activity influence to permeation
process was developed to be used for the optimum design of a hybrid process. The methodology
applied to the design of the hybrid process, allows the design of the structure of the process.
Mathematical modeling and simulation of the membrane module have been performed using
Aspen Custom Modeler and linked with Aspen Plus software to describe the overall process.
7.1. Modelling of membrane module
Membrane separation is one of the promising tools in the separation of multicomponent
mixtures. The merits of this group of processes can be attributed to the fact that most of them
are conducted at relatively low temperatures. This avoids additional energy consumption for
heating and allows the separation of thermally unstable substances. During the pervaporation
process, the liquid passing through the membrane is removed as a vapor. For our study, a global
transmembrane model based on the solution-diffusion theory was selected. Membrane transport
follows Fick’s law, with the permeant fugacity difference as the driving force. Experimental
data previously reported by the research group have now been incorporated into a model that
describes the mass transport through the membrane as a function of the activity of the
components and operating conditions. Perhaps the main contribution with regard to previously
published works is that this model includes the influence of non-permeant species through its
effect on the activity of the components of the mixture, unlike previous works that were only
based on the behavior of binary mixtures. In order to simulate the behavior of a pervaporation
module at industrial scale, a mathematical model of a plate and frame membrane module was
adopted, where the membrane performance model was incorporated. Steady state mass and
energy balances were developed, allowing to evaluate the concentration and temperature
profiles along the module. The differential and algebraic equations for each cell and each
module were incorporated in the Aspen Custom Modeler program. The ACM model was then
exported to Aspen Plus software as a standalone module to integrate the pervaporation
membrane module into global flow-sheets. So we were able to evaluate diagrams with different

- 149 -
configurations or different number of membrane modules, and analyze the influence of the
recycling streams (unreacted ethanol recovered by PV).
7.2. ETBE purification using a PV integrated hybrid process
The comparative analysis of hybrid process alternatives based on the combination of distillation
and pervaporation operations for the production of ETBE were performed. We propose the use
of pervaporation to unload a distillation column, thereby reducing energy consumption and
operating costs and increasing throughput. Three different options that resulted from the relative
location of the separation technologies were considered. The final configuration with the lower
energy consumption and ethanol impurity in the distillate stream was determined. Through
comparisons of various hybrid processes, we found that the hybrid process designed in Chapter
4, case C, in which the pervaporation modules are located on a side-stream withdrawn from the
distillation column, is more favorable in energy consumption and it shows lower content of
ethanol in distillate stream than other membrane integrated hybrid processes. Thus, in the case
of study analyzed 7 PV modules, with a total membrane area of 210 m2, are required to obtain
6420 kg h-1 de ETBE with a purity of 95.2 wt%. At the same time, by recycling the permeate
rich in ethanol to the reaction area, allows us to slightly increase the conversion of isobutene to
0.943.
Alternatively, the production of ETBE by means of reactive distillation is analyzed for the same
basis of calculation. The results of the process that incorporates reactive distillation show an
increase in production due mainly to the fact that this process leads to 98.9% isobutene
conversion, much higher than the conversions reached in the other two alternative production
processes. In contrast, the energy requirements are much higher than the previous cases due to
the higher reflux ratio required to ensure high conversion and at the same time to achieve the
target ETBE purity.
An analysis of the options to include energy integration in the different flow-sheets has been
carried out. The results show the enormous potential of energy integration to implement heat
exchange networks to reduce the demand for utilities.
7.3. Economic analysis
Economic results show a remarkable reduction in terms of energy costs and environmental
emissions brought by membrane integrated hybrid process. The elimination of distillation

- 150 -
columns from conventional pressure swing process by introduction of PV greatly reduced
energy consumption. The total capital investment for the PSD, PV integrated hybrid and RD
configuration are approximately 4.31, 4.19 and 5.35 million euros, respectively. Comparison
of energy consumptions between these configurations confirmed that the hybrid process
substantially reduces the energy footprint of the ETBE process. The total heating utility duty of
the hybrid process (2.69 MW) is almost half (47.9 % reduction) of the PSD process (5.62 MW)
and about 31.7 % of the RD process (8.49 MW). The cooling utility requirements in the hybrid
process (2.99 MW) are 50 % less than the conventional PSD process (5.91 MW) and 63.9 %
less than the RD process (8.28 MW).
7.4. Environmental analysis in the ETBE production
The concept of sustainable development is focused on the improvement of the quality of
environment, reducing resource consumption and industrial emissions. Several concepts have
recently been developed as references to evaluate the air pollution emissions. Additionally in
the fuel oxygenates production, decreasing of utilities demanded in industry has been included
in the environmental analysis, because CO2 emission rate strongly depend on utility
consumption.
Why CO2 emission?
Carbon dioxide pollution has been increasing since the start of the industrial revolution and has
shown no signs of abating. According to scientists, in September 2016, the CO2 emission rate
passed from 400-ppm. It means that this level never return below in our lifetimes, because
September is usually the month with the lowest carbon dioxide level after a summer of plants
growing and sucking it up in the northern hemisphere. In early autumn, the plants weakens,
which in turn decompose, releasing the accumulated carbon dioxide back into the atmosphere.
At Mauna Loa Observatory, the world’s marquee site for monitoring carbon dioxide, the
measurements show levels that have remained above 400 ppm (Climate Central Reports).
Recent studies of the effect of CO2 on human metabolism show that a safe level of carbon
dioxide needs revision, especially given the fact that the carbonic acid is poured into the blood
in the serum, which is an alkaline liquid. Emissions of carbon dioxide in the atmosphere, in
which mankind can survive, are much lower than expected. At the heart of the air should be
oxygen, but not carbon dioxide. The calculated toxic level of carbon dioxide in the atmosphere,

- 151 -
in which a person can live a lifetime is 426 ppm. At a CO2 concentration of 600 ppm, in the
normal condition room, people begin to feel signs of deteriorating air quality. When air is
heavily CO2, some people begin to experience one of the classic symptoms of carbon monoxide
poisoning, such as breathing problems, rapid heart rate, headache, hearing loss,
hyperventilation and fatigue. At a level of 1000 ppm, almost all of those in the room experience
these or other symptoms described above. It was assumed that human could stand to the high
level of CO2 for a while, but not all lifetime (Robertson, 2006).
In process simulation cases, carbon tracking methods allows the calculation of CO2 emissions
after specifying ‘CO2 emission factor data source’ and ‘ultimate fuel source’ from built-in data
for each utility block. The CO2 emission factor data source can be taken from European
Commission decision of ‘2007/589/EC’ or United States Environmental Protection Agency
Rule of ‘E9-5711’ (Demirel, 2013; Agrawal, 1998; Bandyopadhyay, 2002; European
Commission Decision 2007/589/EC, 2007; US-EPA Rule E9-5711, 2009).
Simulation results with regards to CO2 emissions are given in Figure 7.1.
Figure 7.1 CO2 emission results, kg/h
These results show that also from the environmental point of view the alternative based on the
hybrid process is the most favorable.
0
1000
2000
3000
4000
PSD PV RD
- 152 -
References
1. European Commission, Decision 2007/589/EC: Official Journal of the European
Commission, 31.8.2007, L229/1.
2. US-EPA, Rule E9-5711: Federal Register/vol. 74, no. 68/ April 10, 2009 / proposed rules,
pp 16639-16641.
3. Agrawal R, Herron DM. Efficient use of an intermediate reboiler or condenser in a binary
distillation. AIChE J 44: 1303-1315 (1998).
4. Bandyopadhyay S. Effect of feed on optimal thermodynamic performance of a distillation
column. Chem Eng J 88: 175-186 (2002).
5. Demirel Y. Sustainable operations for distillation columns. Chemical Engineering & Process
Techniques 1: 1005 (2013).
- 153 -
CAPITULO 7 DISCUSIÓN Y CONCLUSIONES
Contenidos
7.1. Modelización del módulo de membranas
7.2. Purificación de ETBE usando un proceso híbrido pervaporación-destilación
7.3. Análisis económico
7.4. Análisis ambiental en la producción de ETBE

- 154 -
En los últimos años, ETBE ha sido producido en mayores cantidades que otros aditivos
oxigenados, debido a sus propiedades físicas, químicas y ambientales. Otra característica
atractiva de ETBE es que se puede producir utilizando materiales renovables. En otras palabras,
parte de las materias primas puede ser reemplazada por un material renovable. En este trabajo
hemos simulado las diferentes alternativas del proceso de producción de ETBE y las hemos
comparado. Para purificar ETBE, se estudió la separación mediante pervaporación de mezclas
multicomponente de etanol/ETBE/hidrocarburo y se desarrolló un modelo fenomenológico que
incluía la influencia de la actividad de cada componente en el proceso de permeación, para
luego ser utilizado en el diseño óptimo de un proceso híbrido. La metodología aplicada al diseño
del proceso híbrido, permite el diseño de la estructura del proceso. El modelado matemático y
la simulación del módulo de membrana se han realizado utilizando el software Aspen Custom
Modeler para obtener un modelo que usuario que luego se ha exportado al entorno del software
Aspen Plus para describir el proceso global.
7.1. Modelización del módulo de membranas
La separación con membranas es actualmente una de las herramientas más prometedoras en la
separación de mezclas multicomponentes. Las ventajas de este grupo de procesos se pueden
atribuir al hecho de que la mayoría de ellos se llevan a cabo a temperaturas relativamente bajas.
Esto evita un consumo de energía adicional para el calentamiento y permite la separación de
sustancias térmicamente inestables. Durante el proceso de pervaporación, los componentes que
permean preferencialmente pasan desde la fase líquida a través de la membrana, obteniéndose
en la cara posterior de la membrana en forma de vapor. Para nuestro estudio, se seleccionó un
modelo de transporte a través de la membrana basado en la teoría d disolución-difusión. El
transporte de las especies a través de membrana sigue la ley de Fick, con la diferencia de
fugacidad de los componentes como la fuerza impulsora para el transporte de materia. Los datos
experimentales previamente reportados por el grupo de investigación se han utilizado ahora
para desarrollar un modelo que describe el transporte de materia a través de la membrana en
función de la actividad de los componentes y las condiciones de operación. Tal vez la mayor
aportación respecto a trabajos previos publicados es que en este modelo se incluye la influencia
de las especies no-permeantes a través de su efecto en la actividad de los componentes de la
mezcla, a diferencia de trabajos previos que se basaban en el comportamiento de mezclas
binarias únicamente. Con el fin de simular el comportamiento de un módulo de pervaporación
a escala industrial, se adoptó un modelo matemático de un módulo de membranas de placa y

- 155 -
marco, en el que se incorporó el modelo específico que describe el comportamiento de la
membrana. Se desarrollaron los balances de materia y energía en estado estacionario, que
permitieron evaluar los perfiles de concentración y temperatura a lo largo del módulo. Las
ecuaciones diferenciales y algebraicas para cada celda y cada módulo se incorporaron en el
programa Aspen Custom Modeler. El modelo ACM fue luego exportado al entorno del software
Aspen Plus como un módulo independiente lo cual permitió integrar los módulos de
pervaporación en los diagramas de flujo globales. Así pudimos evaluar diagramas de proceso
con diferentes configuraciones o diferente número de módulos de membrana, y analizar la
influencia de las corrientes de reciclado (etanol sin reaccionar recuperado mediante
pervaporación).
7.2. Purificación de ETBE usando un proceso híbrido pervaporación-destilación
Se realizaron análisis comparativos de alternativas de proceso híbridos basados en la
combinación de operaciones de destilación y pervaporación para la producción de ETBE. La
idea es que el uso de la pervaporación permite disminuir la carga de trabajo de separación de
una columna de destilación, reduciendo así el consumo de energía y los costos de operación y
aumentando el rendimiento. Se consideraron tres opciones diferentes que resultaron de la
ubicación relativa de las dos tecnologías de separación. Se determinó la configuración final que
se correspondía con el menor consumo de energía y menor contenido de etanol en la corriente
de destilado. A través de las comparaciones de varios procesos híbridos, se encontró que el
proceso híbrido descrito en el capítulo 4, caso C, en el que los módulos de pervaporación están
situados en una corriente lateral extraída de la columna de destilación, es más favorable en
cuanto a consumo de energía y muestra un menor contenido de etanol en la corriente de
destilado que otros procesos híbridos integrados en la membrana. Por lo tanto, en el caso del
estudio analizado se requieren 7 módulos de pervaporación, con una superficie total de
membrana de 210 m2, para obtener 6420 kg h-1 de ETBE con una pureza del 95,2% en peso. Al
mismo tiempo, al reciclar el permeado rico en etanol a la zona de reacción, permite aumentar
ligeramente la conversión de isobuteno a 0,943.
Alternativamente, también se analizó la producción de ETBE por medio de destilación reactiva
para la misma base de cálculo. Los resultados del proceso que incorpora la destilación reactiva
muestran un aumento en la producción de éter debido principalmente al hecho de que este
proceso permite alcanzar una conversión de 98,9% de isobuteno, muy superior a las
conversiones alcanzadas en los otros dos procesos alternativos. Por el contrario, los

- 156 -
requerimientos de energía son mucho más altos que los casos anteriores debido a la mayor
relación de reflujo requerida para asegurar una alta conversión y al mismo tiempo para lograr
la pureza especificada para ETBE.
Finalmente, se ha realizado un análisis de las opciones para incluir la integración energética en
los diferentes diagramas de proceso. Los resultados muestran el enorme potencial de la
integración energética para implementar redes de intercambio de calor para reducir la demanda
de servicios auxiliares (utilities).
7.3. Análisis económico
Los resultados del análisis económico muestran que se puede alcanzar una notable reducción
en términos de costos de energía y emisiones ambientales con la adopción del proceso híbrido
integrado con membranas. El reemplazo de columnas de destilación del proceso convencional
basado en cambio de la presión por el proceso basado en PV permitiría reducir
considerablemente el consumo de energía. Los cálculos indican que la inversión total de capital
para el proceso PSD, el proceso híbrido integrado con PV y el proceso basado en RD es de
aproximadamente 4,31, 4,19 y 5,35 millones de euros, respectivamente. La comparación de los
consumos de energía entre estas configuraciones confirmó que el proceso híbrido reduce
sustancialmente la huella energética del proceso para producir ETBE.
7.4. Environmental analysis in the ETBE production
El concepto de desarrollo sostenible se centra en la mejora de la calidad del medio ambiente, la
reducción del consumo de recursos y de las emisiones industriales. Varios conceptos han sido
recientemente desarrollados como referencias para evaluar las emisiones contaminantes.
Adicionalmente, en la producción de aditivos oxigenados para combustibles también se ha
incluido el consumo de utilities en el análisis ambiental, ya que la tasa de emisión de CO2
depende en gran medida del consumo de utilities.
¿Por qué son preocupantes las emisiones de CO2?
La contaminación por dióxido de carbono ha estado aumentando desde el inicio de la revolución
industrial y no ha mostrado signos de disminución. Según los científicos, en septiembre de 2016
la tasa de emisión de CO2 pasó de 400 ppm. Esto significa que probablemente este nivel nunca
volverá atrás en nuestras vidas, porque septiembre es generalmente el mes con el nivel más bajo

- 157 -
del dióxido de carbono en el hemisferio norte después del verano en que las plantas crecen y
fijan una importante cantidad de CO2. A principios de otoño, algunas plantas mueren y liberan
parte del dióxido de carbono acumulado de vuelta a la atmósfera. En el Observatorio Mauna
Loa, el sitio de referencia mundial para monitorear el dióxido de carbono, las medidas muestran
niveles que han permanecido por encima de 400 ppm (Climate Central Reports).
Estudios recientes sobre el efecto del CO2 en el metabolismo humano muestran que es necesario
revisar el umbral de seguridad de dióxido de carbono, especialmente dado el hecho de que el
ácido carbónico absorbido en la sangre pasa al suero, que es un líquido alcalino. El nivel de
emisiones de dióxido de carbono en la atmósfera, en las que la humanidad puede sobrevivir,
son mucho más bajos de lo esperado. El nivel tóxico calculado de dióxido de carbono en la
atmósfera, en el que una persona puede vivir toda la vida es de 426 ppm. Con una concentración
de CO2 de 600 ppm, en una sala de condiciones normales, la gente comienza a sentir signos de
deterioro de la calidad del aire. Cuando el aire está muy cargado de CO2, algunas personas
comienzan a experimentar los síntomas clásicos del envenenamiento por monóxido de carbono,
tales como problemas respiratorios, ritmo cardíaco rápido, dolor de cabeza, pérdida auditiva,
hiperventilación y fatiga. A un nivel de 1000 ppm, casi todas las personas presentes en la sala
experimentan estos u otros síntomas descritos anteriormente. Se supone que el ser humano
podía soportar el alto nivel de CO2 durante un tiempo, pero no toda la vida (Robertson, 2006).
En los casos estudiados mediante simulación de procesos, los métodos denominados “carbon
tracking” en Aspen Plus permiten calcular las emisiones de CO2 después de especificar “CO2
emission factor data source” y “ultimate fuel source” a partir de datos incorporados para cada
bloque de utilities. Los factores de emisión de CO2 han sido tomados de fuentes como la
Decisión de la Comisión Europea “2007/589/EC” y la Rule “E9-5711” de la US-EPA (Demirel,
2013; Agrawal, 1998; Bandyopadhyay, 2002; European Commission Decision 2007/589/EC,
2007; US-EPA Rule E9-5711, 2009).
Los resultados de la simulación en relación a las emisiones de CO2 se muestran en la figura 7.1.
Estos resultados muestran que también desde el punto de vista ambiental la alternativa basada
en el proceso híbrido es la más favorable.

- 158 -
Figura 7.1 Resultados de las emisiones calculadas de CO2 , kg/h
Referencias
1. European Commission, Decision 2007/589/EC: Official Journal of the European
Commission, 31.8.2007, L229/1.
2. US-EPA, Rule E9-5711: Federal Register/vol. 74, no. 68/ April 10, 2009 / proposed rules,
pp 16639-16641.
3. Agrawal R, Herron DM. Efficient use of an intermediate reboiler or condenser in a binary
distillation. AIChE J 44: 1303-1315 (1998).
4. Bandyopadhyay S. Effect of feed on optimal thermodynamic performance of a distillation
column. Chem Eng J 88: 175-186 (2002).
5. Demirel Y. Sustainable operations for distillation columns. Chemical Engineering & Process
Techniques 1: 1005 (2013).
0
1000
2000
3000
4000
PSD PV RD

- 159 -
LIST OF SCIENTIFIC CONTRIBUTIONS
Publications in international journals
1. Process flow-sheet analysis of pervaporation-based hybrid processes in the production
of ethyl tert-butyl ether. A. Norkobilov, D.Gorri, I.Ortiz. Journal of Chemical
Technology and Biotechnology 92: 1167–1177 (2017).
2. Comparative study of conventional, reactive-distillation and pervaporation integrated
hybrid process for ethyl tert-butyl ether production. A. Norkobilov, D.Gorri, I.Ortiz.
Submitted to Special Issue of the Chemical & Engineering Processing: Process
Intensification
Contributions to international conferences
1. Propylene Purification in a Hybrid System Using Polymer-ionic Liquid Composite
Membranes. D. Gorri, S. Laguillo, A. Ortiz, A. Norkobilov, I. Ortiz. Iberoamerican
Meeting on Ionic Liquids- IMIL 2015. Madrid (Spain) July 2015. Poster
2. Process flow-sheet analysis of pervaporation-based hybrid processes in the production
of ethyl tert-butyl ether. A. Norkobilov, D.Gorri, I.Ortiz. EUCHEMS-2016, Seville
(Spain). September 2016. Poster.
3. Comparative study of conventional, reactive-distillation and pervaporation integrated
hybrid process for ethyl tert-butyl ether production. A. Norkobilov, D.Gorri, I.Ortiz.
XXII International Conference on Chemical Reactors (CHEMREACTOR-22). London
(UK). September 2016. Poster.
4. Optimum production of ethyl tert-butyl ether using pervaporation-based hybrid
processes through the analysis of process flow-sheet. D. Gorri, A. Norkobilov, I. Ortiz.
27th European Symposium on Computer-Aided Process Engineering (ESCAPE-27).
Barcelona (Spain). October 2017. Poster

