universidade estadual de campinas instituto de … · 2018-08-31 · “ainda que eu falasse as...
TRANSCRIPT

UNIVERSIDADE ESTADUAL DE CAMPINAS
INSTITUTO DE QUÍMICA
PRISCILA DESTRO
GOLD-COPPER COLLOIDAL NANOPARTICLES:
INSIGHTS ABOUT THE ALLOY FORMATION AND APPLICATION IN CO OXIDATION REACTION
NANOPARTÍCULAS COLOIDAIS DE COBRE-OURO:
CONSIDERAÇÕES SOBRE A FORMAÇÃO DA LIGA E APLICAÇÃO NA REAÇÃO DE OXIDAÇÃO DE CO
CAMPINAS 2016
PRISCILA DESTRO
GOLD-COPPER COLLOIDAL NANOPARTICLES:
INSIGHTS ABOUT THE ALLOY FORMATION AND APPLICATION IN CO OXIDATION REACTION
NANOPARTÍCULAS COLOIDAIS DE COBRE-OURO: CONSIDERAÇÕES SOBRE A FORMAÇÃO DA LIGA E APLICAÇÃO NA REAÇÃO
DE OXIDAÇÃO DE CO
Doctoral Thesis presented to the Institute of Chemistry of the
University of Campinas as part of the requirements to obtain the
title of Doctor in Sciences.
Supervisor: Profa. Dra. Daniela Zanchet
THIS COPY CORRESPONDS TO THE FINAL VERSION OF THE PhD THESIS
DEFENDED BY PRISCILA DESTRO AND SUPERVISED BY PROF. DR. DANIELA
ZANCHET.
CAMPINAS 2016


“Ainda que eu falasse as línguas dos homens e dos anjos,
e não tivesse amor,
seria como o metal que soa ou como o sino que tine.
E ainda que tivesse o dom de profecia,
e conhecesse todos os mistérios e toda a ciência,
e ainda que tivesse toda a fé, de maneira tal que transportasse os montes,
e não tivesse amor, nada seria.”
1 Cor 13, 1-2
Aos meus pais, Valdivino e Maria de Lourdes,
por me ensinarem o que há de mais importante na vida.
Às minhas avós, Benedita e Joana, exemplos de
mulheres fortes sempre tão presentes nesta caminhada.
Com muito amor,
Dedico.

AGRADECIMENTOS
Acredito que escrever os agradecimentos de uma tese seja tão difícil quanto escrever a própria
tese. Foram anos de aprendizado que vão muito além de um título, foram aprendizados de
vida. Termino este trabalho com a plena certeza de que tudo que valeu a pena.
Agradeço primeiramente a Deus, por me dar fé e força para seguir sempre em frente, mesmo
nas vezes em que o caminho à minha frente era tão sinuoso. Por me manter de pé quando eu
achei que não conseguiria mais e por, acima de tudo, se fazer presente no olhar de tantas
pessoas que cruzaram o meu caminho.
Aos meus pais, pelo amor e apoio em todos os momentos. Por acreditarem em mim e fazerem
do meu sonho o sonho deles. Ao meu pai seu pelo exemplo de caráter e honestidade que me
acompanha sempre, à minha mãe por seu exemplo de dedicação e amor que faz toda a
diferença. Aos dois por me ensinarem a seguirem sempre no caminho do bem. À minha irmã
pela sua doçura e delicadeza me apoiando em cada passo que eu dou.
À minha orientadora, Profa. Daniela Zanchet. Acredito que o exemplo é a melhor forma de
passar uma mensagem e agradeço pela honra de conviver com você nestes anos e ver seu
exemplo de mulher e profissional tão ética e dedicada. Você fez total diferença na minha
formação! Obrigada por me motivar e acreditar sempre em mim! Por me ensinar muito mais
do aquilo que está na minha tese e me incentivar a ir sempre muito mais além. Se fosse para
recomeçar, tinha que ser sob a sua impecável orientação novamente!
Aos meus amigos do Grupo de Catálise e Nanomateriais. Crescemos muito nestes últimos
anos e levarei para sempre os maravilhosos momentos com vocês... a projeção das linhas
catalíticas, as madrugadas no LNLS, os cafés das 16:00, os churrascos, almoços, o grupo
caminhada e o apoio diário. Agradeço muito à primeira geração do nosso grupo. Ao Felipão
por estar ao meu lado desde a entrevista para a seleção do doutorado em Lavras. Desculpe por
te desesperar naquele dia, mas você ainda vai me agradecer por isso! Ao Zay pela sua
sinceridade e apoio em todas as horas, principalmente pelos conselhos práticos e gambiarras
geniais! À Tathi por compartilhar tantos momentos importantes comigo e, mesmo quando
desesperada, me ajudar a manter a calma. Ao Babá pela sua tranquilidade e paciência em tudo
que faz, me ensinando a pensar antes de falar ou tomar qualquer decisão. Ao Lulu pelo seu
bom humor e amizade que fizeram toda a diferença no meu dia-a-dia. À Monique por seu
apoio, carinho e por nos ajudar a organizara bagunça. Sem palavras para agradecer tudo que
vocês fizeram por mim! Agradeço à Danielle pela amizade e por me deixar ainda mais curiosa

no estudo de ligas metálicas. Ao Doctor Daniel por sua incrível memória científica e pelo seu
grande apoio neste trabalho. À Debs por me ajudar sempre que precisei com alegria e
amizade. Ao Arthur pela ótima convivência com todo o grupo neste último ano. À Tanna por
dar continuidade a este trabalho. Aos alunos de iniciação científica que passaram pelo
laboratório, Guilherme, Pedro, Thaís, Lanousse, Ana Carmem, Henrique, Débora, Luigi e
Guilherme por tornarem o trabalho muito mais divertido. Também agradeço muito Lili e
Amandinha, nossas agregadas tão queridas.
Ao Instituto de Química da Unicamp, funcionários e professores, por fornecerem toda a infra-
estrutura para a realização deste trabalho.
Ao Prof. José Maria Corrêa Bueno do LabCat-UFSCar e seus alunos por toda a colaboração
com nosso grupo.
Aos pesquisadores e funcionários do LNLS pelo apoio em tantas semanas de medidas durante
estes anos de doutorado.Em especial à Daniela Coelho, Cristiane Rodella e Fábio Zambello
por toda a ajuda nos momentos de desespero.
Aos membros da banca, por aceitarem o convite e por dedicarem o tempo tão corrido de vocês
para a este trabalho.
Aos meus amigos e familiares por recarregarem minhas energias a cada encontro e abraço,
tornando a caminhada muito mais leve. Às minhas amadas avós pela torcida de sempre.
Agradeço em especial ao Felipe, por aguentar meu desespero nos últimos meses e por seu
carinho, atenção e paciência que tanto me ajudaram.
Às queridas Amanda,Larissa,Eugênia e Renata por me receberem tão bem em casa.
Ao CNPq pela concessão da minha bolsa de estudos no Instituto de Química. À CAPES/
Programa Ciência Sem Fronteiras pela concessão da bolsa para a realização de parte deste
trabalho no Istituto Italiano di Tecnologia, parte muito importante da minha formação.
For all the amazing people that I met during my year abroad. For all the technicians,
researchers and students from the Nanochemistry Department of the Italian Institute of
Technology. My special thanks to Dr. Liberato Manna for the opportunity and to Dr.
Massimo Colombo for his great contribution in the development of this work. Grazie Mille!!
Este trabalho é fruto do apoio de todos vocês! Muito obrigada!!!
RESUMO
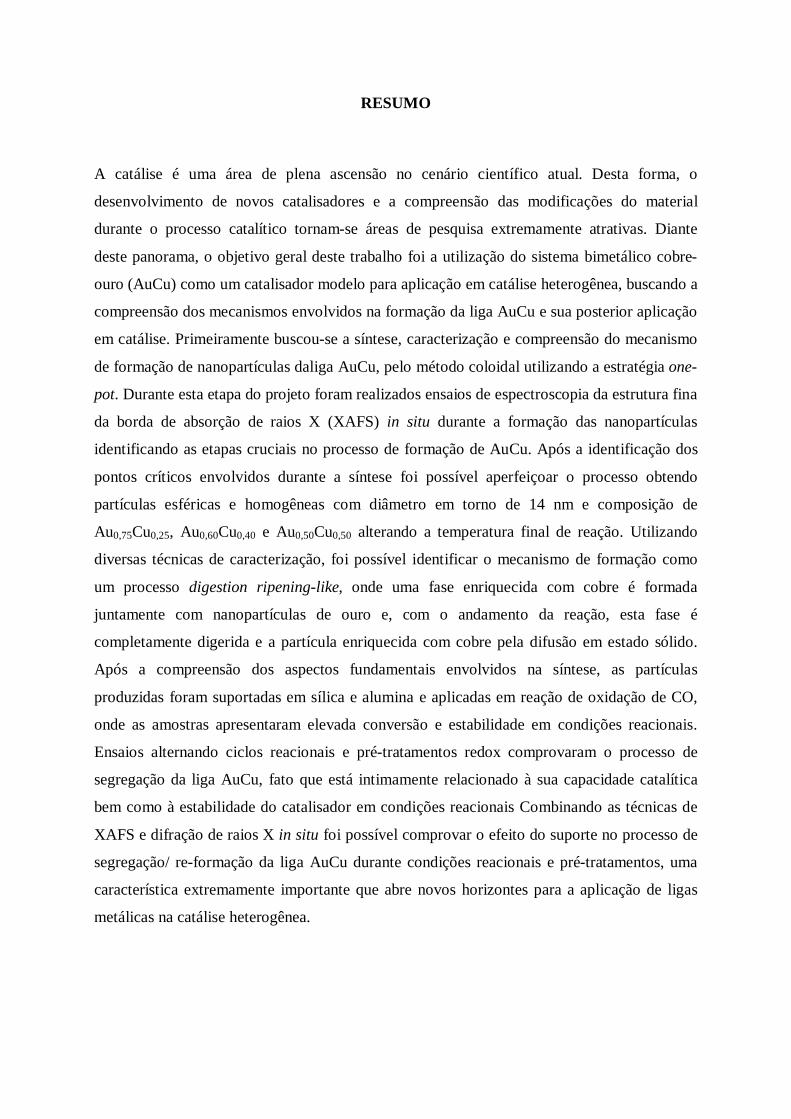
A catálise é uma área de plena ascensão no cenário científico atual. Desta forma, o
desenvolvimento de novos catalisadores e a compreensão das modificações do material
durante o processo catalítico tornam-se áreas de pesquisa extremamente atrativas. Diante
deste panorama, o objetivo geral deste trabalho foi a utilização do sistema bimetálico cobre-
ouro (AuCu) como um catalisador modelo para aplicação em catálise heterogênea, buscando a
compreensão dos mecanismos envolvidos na formação da liga AuCu e sua posterior aplicação
em catálise. Primeiramente buscou-se a síntese, caracterização e compreensão do mecanismo
de formação de nanopartículas daliga AuCu, pelo método coloidal utilizando a estratégia one-
pot. Durante esta etapa do projeto foram realizados ensaios de espectroscopia da estrutura fina
da borda de absorção de raios X (XAFS) in situ durante a formação das nanopartículas
identificando as etapas cruciais no processo de formação de AuCu. Após a identificação dos
pontos críticos envolvidos durante a síntese foi possível aperfeiçoar o processo obtendo
partículas esféricas e homogêneas com diâmetro em torno de 14 nm e composição de
Au0,75Cu0,25, Au0,60Cu0,40 e Au0,50Cu0,50 alterando a temperatura final de reação. Utilizando
diversas técnicas de caracterização, foi possível identificar o mecanismo de formação como
um processo digestion ripening-like, onde uma fase enriquecida com cobre é formada
juntamente com nanopartículas de ouro e, com o andamento da reação, esta fase é
completamente digerida e a partícula enriquecida com cobre pela difusão em estado sólido.
Após a compreensão dos aspectos fundamentais envolvidos na síntese, as partículas
produzidas foram suportadas em sílica e alumina e aplicadas em reação de oxidação de CO,
onde as amostras apresentaram elevada conversão e estabilidade em condições reacionais.
Ensaios alternando ciclos reacionais e pré-tratamentos redox comprovaram o processo de
segregação da liga AuCu, fato que está intimamente relacionado à sua capacidade catalítica
bem como à estabilidade do catalisador em condições reacionais Combinando as técnicas de
XAFS e difração de raios X in situ foi possível comprovar o efeito do suporte no processo de
segregação/ re-formação da liga AuCu durante condições reacionais e pré-tratamentos, uma
característica extremamente importante que abre novos horizontes para a aplicação de ligas
metálicas na catálise heterogênea.

ABSTRACT
Catalysis is a strategic area in the current scientific scenario. Thus, the development of new
catalysts and understanding of the material changes during the catalytic process becomes an
extremely attractive research area. Based on that, the aim of this work was the exploitation of
gold-copper (AuCu) nanoparticles as a model heterogeneous catalyst, seeking to understand
the mechanisms involved in the AuCu alloy formation and its subsequent application in
catalysis. Firstly, the AuCu alloy nanoparticles were synthesized and characterized to
understand the alloy formation mechanism by the colloidal method using the one-pot
approach. During this part of the project, the formation of the nanoparticles was probed by in
situ X-ray absorption of fine structure (XAFS) spectroscopy, identifying the crucial steps in
the AuCu nanoparticles formation process. After the identification of the main steps involved
in the synthesis, it was possible to improve the process obtaining spherical and homogeneous
nanoparticles with a diameter of around 14 nm and composition of Au0.75Cu0.25, Au0.60Cu0.40
and Au0.50Cu0.50, by changing the reaction final temperature. Using different characterization
techniques, it was possible to identify the mechanism of formation as a digestion ripening-like
process where a copper-riched phase is formed together with the gold nanoparticles; with the
progress of the reaction, this phase is completely digested and the alloy nanoparticles are
formed by a solid state diffusion process. After understanding fundamental aspects involved
on the synthesis, the AuCu nanoparticles were supported on alumina and silica and applied to
CO oxidation reaction, where the samples showed high conversion and stability at reaction
conditions. Tests alternating reaction cycles and redox pretreatments revealed a partially
reversible dealloying/alloying process, which is closely related to the catalytic potential and
the stability of the catalyst under reaction conditions. By combining the in situ techniques
XAFS and X ray diffraction, it was possible to highlight the effect of the support in the
process of alloying/ dealloying of the AuCu nanoparticles under reaction conditions and
pretreatments, an extremely important feature that opens up new horizons for the application
of metallic alloys in heterogeneous catalysis.

Abbreviations and Symbols
AuCu NPs Gold-copper nanoparticles
BF-TEM Bright-field transmission electron microscopy
EDS Energy-dispersive X-ray spectroscopy
EXAFS Extended X-ray absorption fine structure
HAADF-STEM High-angle annular dark field– scanning transmission electron
microscopy
ICP Inductively coupled plasma optical emission spectroscopy
LNLS Brazilian Synchrotron Light Laboratory
NPs Nanoparticles
STEM Scanning transmission electron microscopy
TEM Transmission electron microscopy
UV-Vis Electronic absorption spectroscopy in ultraviolet-visible range
XAFS X-Ray Absorption of fine structure
XANES X-ray absorption near edge structure
XAS X-Ray absorption
XPS X-ray photoelectron spectroscopy
XRD X-ray diffraction

Summary
1. Introduction ...................................................................................................................... 14
1.1 General aspects about nanomaterials ........................................................................... 14
1.2 Colloidal synthesis of nanoparticles............................................................................. 15
1.3 The gold-copper alloy ................................................................................................. 18
1.6 The heterogeneous catalysis ........................................................................................ 22
1.4 CO Oxidation reaction................................................................................................. 26
1.5 Goals and thesis presentation ....................................................................................... 29
1.6 Overview .................................................................................................................... 29
1.7 Summary of each chapter ............................................................................................ 29
Chapter 2 .............................................................................................................................. 31
Synthesis of gold-copper nanoparticles by colloidal method varying the compositions as a
function of the synthesis final temperature ............................................................................ 31
2.1 Introduction................................................................................................................. 32
2.2 Experimental section ................................................................................................... 33
2.2.1 Chemicals ............................................................................................................ 33
2.2.2 Synthesis of bimetallic gold-copper NPs .............................................................. 33
2.3 Characterization .......................................................................................................... 34
2.3. Results ....................................................................................................................... 36
2.4. Discussion .................................................................................................................. 44
Chapter 3 .............................................................................................................................. 49
Formation of bimetallic copper-gold alloy nanoparticles probed by in situ XAFS ................. 49
3.1 Introduction................................................................................................................. 50
3.2 Experimental session ................................................................................................... 51
3.2.1 Chemicals ............................................................................................................ 51
3.2.2 Synthesis of bimetallic copper-gold nanoparticles ................................................ 51

3.2.3 Characterization ................................................................................................... 52
3.3 Results and discussion ................................................................................................. 52
3.3.1 Nanoparticles formation ....................................................................................... 54
3.3.2 Mechanistic aspects .............................................................................................. 57
3.4 Conclusions................................................................................................................. 63
Chapter 4 .............................................................................................................................. 65
Incorporation of AuCu nanoparticles on silica: Studies about the stability of nanoparticles and
the application in CO oxidation reaction ............................................................................... 65
4.1 Introduction................................................................................................................. 66
4.2 Experimentalsession .................................................................................................... 67
4.2.1Chemicals and materials ........................................................................................ 67
4.2.2 Synthesis of bimetallic copper-gold NPs .............................................................. 67
4.2.3 CatalyticTests....................................................................................................... 68
4.2.4 Characterization ................................................................................................... 69
4.3 Results ........................................................................................................................ 69
4.4 Discussion ................................................................................................................... 76
4.5 Conclusion .................................................................................................................. 78
Chapter 5 .............................................................................................................................. 79
Au1-xCux supported nanoparticles applied on CO oxidation: Insights about the support effect
using in situ techniques ......................................................................................................... 79
5.1 Introduction................................................................................................................. 80
5.2 Experimental Session .................................................................................................. 80
5.2.1 Chemicals. ........................................................................................................... 80
5.2.2 Synthesis of bimetallic copper-gold NPs. ............................................................. 80
5.2.3 Catalysis preparation ............................................................................................ 81
5.2.4 Characterization ................................................................................................... 81
5.2.5 In situ measurements ............................................................................................ 81

5.2.6 Catalytic Tests...................................................................................................... 82
5.3 Results and discussion ................................................................................................. 83
5.3.1 Catalytic results .................................................................................................... 84
5.3.2 In situ measurements during the activation ........................................................... 87
5.3.3 In situ measurements during the CO oxidation ..................................................... 93
5.3.4 In situ measurements during the reduction ............................................................ 94
Chapter 6 .............................................................................................................................. 98
Global discussion and conclusions ........................................................................................ 98
Bibliography....................................................................................................................... 100
Appendix ............................................................................................................................ 116

14
1. Introduction
1.1 General aspects about nanomaterials
The manipulation of matter at increasingly smaller scales has aroused great fascination by
the humanity since the ancient times. The ability to control different substances and thus
rearrange atoms to produce new materials with fully adjustable features to specific
applications was firstly seen as magic or something close to mythical; nevertheless, the
scientific research and advanced characterization methods led to demystification of matter,
making science the fundamental pillar for the development of society.
In this context, advances in nanotechnology has enabled the development of innovative
particles with revolutionary applications in several important areas such as the development
of new types of cleaners and more efficient ways to storage energy1, the fast and secure
transmission of data and the development of new drugs2 associated to treatments that provide
a better quality of life to the world population. Thus, the development of new synthesis routes
to produce nanoparticles as well as the thorough understanding of the processes behind the
synthesis is of fundamental importance for technological development3.
To fully exploit the nanoparticles, it is necessary to develop efficient and innovative
synthetic routes that lead to a fine-tuning of the properties at the nanoscale. Two different
approaches can be highlighted, the “top-down” and the “bottom-up”4. The “top-down”
approach often uses traditional techniques of micro fabrication, using controlled tools to cut
and shape the materials into the desired shape or array. The most common method is the
lithography, using UV radiation or an ion beam. On other hand, the “bottom-up” approach
uses the physico-chemical properties of materials to assemble the building blocks into a
desired conformation, for example, chemical vapor deposition and colloidal methods. It is
difficult to elect the most efficient approach, each one has its advantages and disadvantages;
however, according to Chaudhuri and Paria,5 the bottom-up approach allows producing
smaller particles and can be more cost-effective in the future because of its accuracy, control
of the entire process and minimizing the energy loss. The colloidal synthesis can generate a
broad library of particles of different compositions, shapes and sizes, to be applied in several
areas.

15
1.2 Colloidal synthesis of nanoparticles
Colloidal nanoparticles have attracted the interest of many research groups because of
its versatility that finds application in various areas of research.6–8This work highlights the use
of chemical synthesis, in which metal precursor is in the cationic form that is reduced in the
presence of protective agents, producing particles stable in a dispersion. By controlling
parameters such as metal/protective agent or metal/reducing agent ratios, reaction temperature
and time it is possible to obtain particles with different shapes, sizes and compositions. Figure
1.1 shows schematically the colloidal synthetic process.
Figure 1.1: Schematic representation of the colloidal synthesis of metallic nanoparticles.
(Adapted from Jia and Schüth9)
According to Berti and Palazzo10, a colloidal system can be defined as particles with at
least one dimension between 1 and 100 nm dispersed in a solvent. These particles are small
enough for the Brownian forces being greater than the gravitational force, maintaining the
particles stable in dispersion.
The first scientific studies of the stability of colloidal dispersions were described by
Faraday in the 19th century,11 describing the reduction of an aqueous solution of chloroaurate
(AuCl4-) and investigating the optical properties. 12,13 An important work was developed by
Turkevich and co-workers14in the50´s, describing a stable dispersion of 13 nm gold
nanoparticles using sodium citrate as reducing agent and stabilizer. The schematic approach
used in Turkevich´s work is shown in equation (1.1).
푥푀 + 푛푒 + 푠푡푎푏푖푙푖푧푒푟 → 푀 (1.1)

16
In this approach, the reducing agent (e.g. hydrogen, alcohol, hydrazine or borohydride)
is mixed with the metal precursor salt in the presence of stabilizing agents (ligands, polymers
or surfactants). The stabilizer prevents the undesired agglomeration, helps the formation of
well dispersed metal particles and may provide a way to functionalize the surface of the
nanoparticles targeting specific applications.9
Kudera and Manna10 listed the main points that determine the success of a colloidal
synthesis route, which are: the control of particles growth by preventing their agglomeration,
an efficient way to collect or isolate the final product, and minimization of by-products
formation.
The study of the mechanisms of nucleation and growth of colloidal nanoparticles
started in the mid-twentieth century by the seminal work by LaMer and was detailed by Reiss
in the 50´s.15,16These authors described the colloidal synthesis as a process with three main
stages. The first one is the formation of monomers, species that are formed from the cationic
precursors connected to the stabilizing molecules. The binding strength and the size of the
monomers influence directly the formation of the colloidal nanoparticles. The amount of
monomers in solution increases until the supersaturation regime is reached, and the second
stage of the LaMer process initiates: the nucleation. This is the most important stage and
influences directly the final structure of the nanoparticles. Once the nuclei are formed, the
growing step initiates. The growth can be carried by aggregation of nuclei or by incorporation
of atoms to the nuclei. Figure 1.2 shows the main stages of the formation of colloidal particles
proposed by LaMer.
Figure1.2: The classic LaMer mechanism for nanoparticles formation. The first stage is the
monomer formation followed by nucleation and growth. (Adapted from Reiss, Vreeland and
Kudera15)

17
The strategy to synthesize metal nanoparticles by colloidal methods is widely explored
in several applications because of its accurate control of size, shape and composition17–19.
Particles with 1-10 nm are considered by some authors as intermediate size between small
molecules and bulk metal.2The figure 1.3 shows the UV-Vis absorption spectra of Au
nanoparticles synthesized by Piella et al.20that illustrate the size-dependence of their optical
properties.
Figure 1.3: UV-Vis absorption spectra of Au nanoparticles as a function of size (From Piella
et. al 20)
Another approach that has been widely used in the synthesis of the metal nanoparticles
is the introduction of a second metal, producing bimetallic particles. Some of the most studied
bimetallic systems are PtPd21, PtNi22, PdCo23 and AuAg24. Figure 1.4 shows some
possibilities in the formation of bimetallic particles.
Figure 1.4: Possible structures presented by bimetallic particles. Type (a) heterostructure, (b)
core-shell structure (c) alloy with random substitution and (d) chemically ordered alloy.
(Adapted from An et al.25)

18
Bimetallic structures can be denominate as ordered when there is a spatial organization
between the components A and B constituting the particle. The first case described in the
figure 1.4a is a heterostructure type (also known as Janus particle) where there is a solid
interface between the two domains, each one formed exclusively by compounds A or B.
Figure 1.4b illustrates the core-shell structures, where one element is in the center of the
particle while the other forms a shell on the surface.
Metal alloys may be formed by two different ways: a random substitution of atoms in
the crystal lattice of the major component (Figure 1.4.c) or by replacement of atoms at
specific positions, usually forming a different crystal structure (Figure 1.4d). The latest is also
known as chemically ordered alloy.
According to Johnsoton et al26, some factors can directly influence the atomic
distribution of a AB bimetallic nanoparticle, such as:
The bond strength between A-A, B-B and A-B: If the A-B bonding is stronger, it
favors the formation of the alloy, if the homonuclear bonds are stronger, a segregated
structure is favored.
Surface energy of A and B bulk phases: The element with the lowest surface energy
on the bulk phase tends to segregate to the surface of the particle.
Charge transfer: Electrons are transferred from the least to the most electronegative
element, favoring the mixture by maximizing attractive coulombic interactions.
Bonding strength of the metal with the surface ligands: For nanoparticles with a ligand
layer on the surface (especially colloidal particles), the element that binds more
strongly to the ligand may remain on the surface of the nanoparticles.
The final structure of the nanoparticle depends on the balance among the various factors
mentioned above as well as on the preparation method and experimental conditions which can
control the kinetics involved in the process.
1.3 The gold-copper alloy
The AuCu is one of the most studied alloy nowadays, however, its potentialities are
exploited since pre-Columbian civilizations of Central America that used the mixture of
copper and gold27, getting the "Tumbaga", an alloy with improved ductility and strength.
Currently, the AuCu alloy is still widely used in jewelry and emerged as a potential system of

19
study in the nanoscience.28 One feature of the AuCu alloy is the alloy formation of any
composition, with the generation of chemically ordered alloys for specific Au:Cu ratios
(known as superlattices)29.
The miscibility between metals was studied thoroughly by Hume-Rothery, and the
main factors are known as the “Hume-Rothery Rule”30. According to this rule, the main
factors that determine the miscibility of two metals are the similarity between atomic radius,
crystal structure, valence and electronegativity. The combination of Au and Cu satisfy two
these requirements since the difference in atomic radius is smaller than 15% (Au = 134pm
and Cu = 117pm) and they have the same crystal structure (face-centered cubic), causing the
random replacement at elevated temperatures30. In the case of nanostructures, studies
developed by Guisbier and co-workers31 for AuCu alloys stability considers another important
factor to the of metal nanoalloys formation: the molar heat of vaporization, which relates the
cohesion energy of the materials. The difference between the molar heat of vaporization of Au
and Cu is less than 15% (ΔHvapAu= 334 kJ.mol-1 and ΔHvapCu=300 kJ/mol-1,indicating
possible formation of the AuCu alloy nanoparticles.
In the study of metal alloys, the Vegard´s Law32 is a very useful tool for quantitative
analysis of each metal content in the disordered AuCu alloy (randomic substitution in the
crystal lattice). The Vegard's Law shows a linear dependence of the lattice parameter with the
composition, as described in the Figure 1.5. In the case of AuCu alloy, a small deviation in
the lattice parameter values can be related to the interaction of Au and Cu within the crystal
lattice. This work was originally described to bulk systems, but the concept of the Vegard's
law is also used for nanostructured systems.
Figure 1.5: Relationship of lattice parameters and composition in the disordered fcc AuCu
system. The symbols on the continuous line indicate some experimental values used by
Okamoto at. al.33.

20
As previously mentioned, another factor that makes the AuCu system extremely
interesting is the formation of superlattices, chemically ordered structures determined by
composition and temperatures that assume different crystalline structure. The superlattices
formation may occur in the following proportions: Au3Cu, AuCu and AuCu3. These structures
are shown in Figure 1.6 in the phase diagram of the AuCu alloy. The phase diagram indicates
the transformations occurred in the AuCu system by different compositions and temperatures.
The structural data are described on the table 1.1and represented at figure 1.7.
Figure 1.6: Phase diagram of Au-Cu (Adapted from Okamoto33)
Table 1.1: AuCu structural data.
Phase Composition
(at. % Cu)
Pearson symbol Space group
(Au,Cu) 0 to 100 cF4 Fm3m
Au3Cu 10 to 38.5 cP4 Pm3m
AuCu (I) 42 to 57 tP4 P4/mmm
AuCu (II) 38.5 to 63 oI40 Imma
AuCu3 (I) 67 to 81 Cp4 Pm3m
AuCu3 (II) 66 to ? tP28 P4mm

21
Figure 1.7: Representative unit cells structures of (a) Au1-xCux (disordered alloy), (b)Au3Cu,
(c) and (d) AuCu and (e) AuCu3. The orange balls represented in (a) indicates the random
substitution of Cu in the Au lattice. The red balls indicate the Cu atoms and the yellow balls
indicate the gold atoms in the structures (b) to (e).
Theoretical studies have provided significant advances in the understanding of AuCu
system. 34,35 Studies evaluating small metal particles (454 atoms) observed that AuCu
particles are not fully homogeneous, as predicted by the bulk phase diagram, but shows a
certain degree of segregation with the copper in the core and a gold shell due to the
minimization of surface energy and maximizing strongest interactions as Au-Au36,37. Guisbier
and colleagues also found a similar this behavior with the segregation of Au to the surface for
various polyhedral nanoparticles, in the size range of 4-10 nm. 31 It is important to remark that
these studies are performed on bare nanoparticles and for other systems (e.g. colloidal
nanoparticles) also the interaction with ligands or solvents has an impact on the particle.
The alloy formation can also interfere in the symmetry of the clusters. Darby and co-
workers36 described the effect of alloying in cluster of 55 atoms. Clusters of Cu55 have an
icosahedral symmetry whileAu55 is amorphous-like; however, the replacement of only one
atom of Au by Cu leads to a reorganization of the structure, with icosahedral symmetry, as
shown in figure 1.8.
Figure 1.8: Simulation Au55, CuAu54 and Cu55 structures presented by Darby et al.38

22
Clusters structure with compositions CuAu, CuAu3 and Cu3Au have also been studied.
Au and Cu atoms were added one by one to a defined seed and the CuAu showed a strong
dependence on the size in the 100 and 200 atoms range. 39 The theoretical studies indicate that
the composition and/or size of the metal alloy can directly change its structure, resulting in
structural and electronic effects that have a direct impact in their applications.
From the catalytic point of view, one of the most explored applications of metal alloys,
the impact of the size and composition have a fundamental importance for the understanding
of the effects involved. 37 The changes in the structure can modify structurally the alloy,
generating preferential adsorption sites or low coordination sites that interfere directly in the
catalytic properties of the material. The electronic effects are related to the band structure that
depends on the composition and particle size. Studies by Kim and co-workers40 showed the
relationship between the composition of Au1-xCux particles and the reactivity in CO2
reduction. The distinct Au:Cu ratio has a direct impact on the d-band position, determining
the reactivity of the catalyst. Figure 1.9 is the surface valence band spectra of Au–Cu
bimetallic nanoparticles collected by high-resolution X-ray photoemission spectroscopy
(XPS)
Figure 1.9: Surface valence band photoemission spectra of Au–Cu bimetallic nanoparticles.
(Available at Kim, D. et. al.40)
1.6 The heterogeneous catalysis
In heterogeneous catalysts, the fundamental principle is the ability of the reactants to
diffuse and to adsorb on the surface of the catalyst and, after reacting, being desorbed
releasing the active site to react again with another reactant molecule. To illustrate the
catalytic process, a generic cycle is showed at figure 1.10. In this process, A and B are the
reactants that adsorb on the catalyst surface, react, and desorb as a product P. The catalyst

23
provides a new potential energy pathway to the process, as described in Figure 1.10, which
compares a non-catalytic reaction versus a catalytic reaction.
Figure 1.10: Potential energy diagram of a heterogeneous catalytic reaction with gaseous
reactants and products and a solid catalyst. The red line indicates the non-catalyzed reaction
and the green line, the catalyzed pathway.41
It is possible to observe in Figure 1.10 that the non-catalytic reaction, in which A and
B has to collide with sufficient energy to overcome the activation barrier forming P, has an
energy barrier much higher that the catalytic route.
In the catalytic route, the initial step is the adsorption of A and B on the catalyst
surface in a spontaneous process, followed by formation of a complex between A-B- catalyst
surface resulting the product P adsorbed on the catalyst surface. The process of formation of
this complex has a significantly lower activation energy compared to the non-catalyzed
reaction. Finally, the product P formed is desorbed from the catalyst leaving the catalytic site
free for a new cycle.41
Most of the heterogeneous catalysts are solids, composed by a metallic phase highly
dispersed on a matrix with high surface area.42 The matrix used to support the metallic phase
can be composed of metal oxides, aluminosilicates, carbonaceous compounds among others.
The metal surface is normally the active phase, and therefore is the crucial part in the design
of a catalyst. The highly dispersed metal leads to a greater accessibility of reactants to the
active phase, improving the catalytic capacity of the material.
There are different methods to incorporate the metal phase to supports with high
surface area. One of the most applied is the deposition- precipitation method43, where the pH
of the solution containing the metallic precursors and the support is altered inducing the

24
formation of the metallic phase on the support surface. For the incipient-wetness method, only
the pores of the support are filled with precursor solution, to prevent deposition on the
external surface of the catalyst44. Another used approach is the impregnation and drying of the
metallic precursors in solution on the support.44 The deposition-precipitation and incipient
wetness are defined as conventional methods, usually used for monometallic material,
however for bimetallic alloys are not the best option due to the difficult to keep the size and
composition homogeneity for all the supported particles. In this context, the great advances in
the development of nanomaterials fit perfectly to this goal: increase the available area by
decreasing the size of the metal particles with high control of their properties.46–48To achieve a
good dispersion and homogeneity of the bimetallic phase it is possible to highlight the use of
colloidal metal nanoparticles, since the characteristics of the metallic phase are defined before
the incorporation, as described in the Figure 1.11.
Figure 1.11: Scheme comparing conventional incorporation versus the colloidal method.
(Adapted from Sonström et. al. 49)
Besides the fact that the available area increases by decreasing the particle size, it is
described in the literature that some reactions are highly sensitive to particle size (structure
sensitive reactions).50 The work by Haruta in the 80´s51 represents a breakthrough in the
history of catalysis, showing the catalytic activity of Au particles in the CO oxidation
reaction, revolutionizing the application of nanomaterials in catalysis and opening a new and
extensive research field.

25
For a better comprehension of the catalytic process, the development of model catalysis is
extremely important, since it allows a deep understanding of the parameters that determine the
catalyst activity. Ideally, a model supported catalyst has homogeneous particles on its surface,
as described in figure 1.12, to evaluate each factor individually.
Figure 1.12: Scheme of model supported catalyst.
The composition of the metal phase is an important parameter to be evaluated in
model catalysts. The versatility of metal alloys makes this system extremely attractive for
applications in catalysis52. Many of the works disclose the use of alloys with enhanced
specific catalytic activity and selectivity when compared to the corresponding monometallic
catalysts, as shown in Table 1.3
Table 1.3: Examples of metal alloys used in catalysis.
Metal Reaction
Temperature
(°C)
Conversion
(%) Reference
Pt
Water-Gas Shift
Reaction 300 70 Xu et al., Journal of
Catalysis, 201253
Ru 300 80
PtRu 300 85
Pt CO oxidation 150 10 Zhou et al., Advanced
Functional Materials,
200754 AuPt 150 80
26
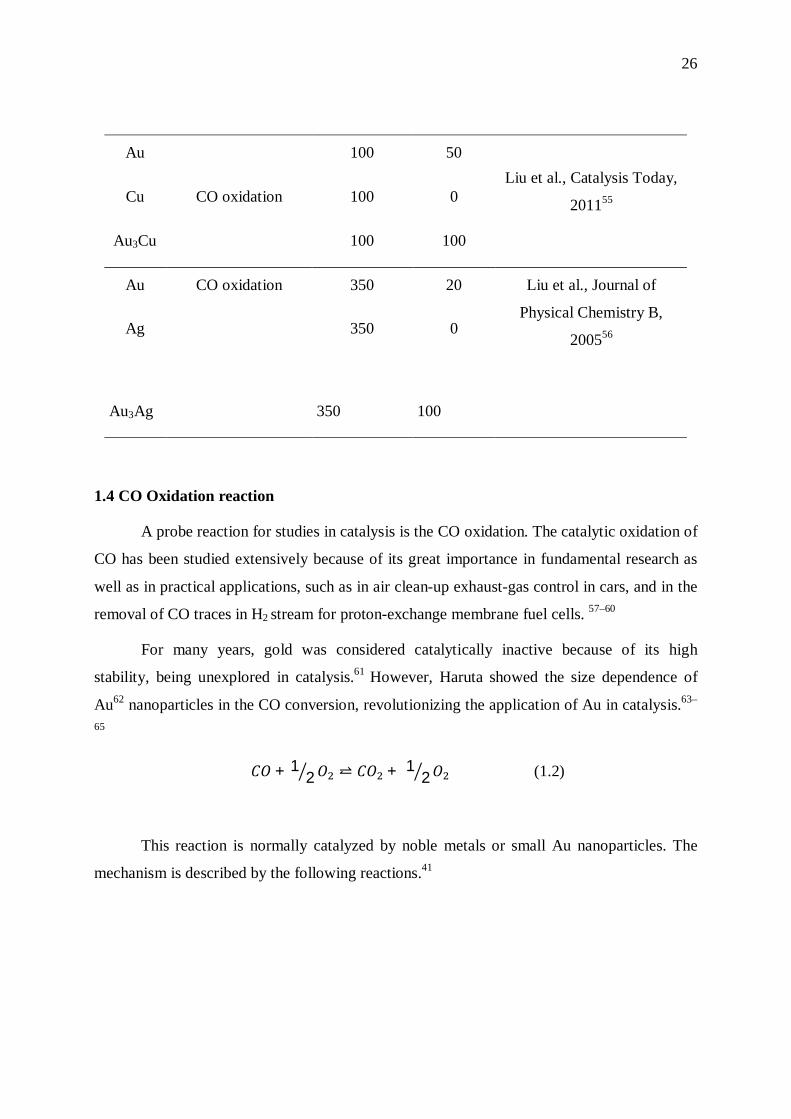
Au 100 50 Liu et al., Catalysis Today,
201155
Cu CO oxidation 100 0
Au3Cu 100 100
Au CO oxidation 350 20 Liu et al., Journal of
Physical Chemistry B,
200556
Ag 350 0
Au3Ag 350 100
1.4 CO Oxidation reaction
A probe reaction for studies in catalysis is the CO oxidation. The catalytic oxidation of
CO has been studied extensively because of its great importance in fundamental research as
well as in practical applications, such as in air clean-up exhaust-gas control in cars, and in the
removal of CO traces in H2 stream for proton-exchange membrane fuel cells. 57–60
For many years, gold was considered catalytically inactive because of its high
stability, being unexplored in catalysis.61 However, Haruta showed the size dependence of
Au62 nanoparticles in the CO conversion, revolutionizing the application of Au in catalysis.63–
65
퐶푂 + 12푂 ⥨ 퐶푂 + 1 2푂 (1.2)
This reaction is normally catalyzed by noble metals or small Au nanoparticles. The
mechanism is described by the following reactions.41

27
An important step in the CO oxidation reaction is the activation of the O2. Thereby,
the choice of an appropriate support plays an important role in the catalyst performance.
Remediakis57 and co-workers presented a theoretical study showing that TiO2 is an efficient
support in the catalytic CO oxidation reaction, since it facilitates the activation of O2 at the
metal-support interfacial sites. (Figure 1.13).
Figure 1.13: CO oxidation mechanism for Au10 supported on TiO2 (110) proposed by
Remediakis et. al. 57
The use of supports considered "inerts" for oxidation reactions such as Al2O3 and SiO2
was studied by Schubert et al.66 and in this case, Au particles are less active because the
activation of O2 molecules occur in Au low coordination sites, competing with the adsorption
of CO molecules and decreasing its catalytic performance.67,68
Since the successful application of Au nanoparticles in CO oxidation reaction, the use
of bimetallic nanoparticles involving gold has also become an important research field.69,70
The main motivation is related to the fact that the O2 is not able to adsorb well on Au surface,
so the alloy formation can generate different sites on the surface that improves the O2
adsorption. Metals as silver, cobalt and copper are mostly used, facilitating the adsorption and
activation of oxygen on the surface.

28
Figure 1.14: Model structure of CO and O2 adsorption on the Au25Ag30 alloy surface. Au
atoms are represented by yellow balls, Ag atoms are represented in gray, oxygen in red and
carbon in white.71
In the case of AuCu alloy, the catalyst is more active than monometallic ones,
subjected to the same reaction conditions.72 A list of factors can contribute to the greater
activity, such as the formation of Cu sites that facilitates the adsorption of oxygen, as well as
the change of alloy electronic properties. 73,74
Another fact that affects the catalytic ability of the material is the nature of the metal-
support interaction75,76 and, in the case AuCu, this is an additional factor that makes this
system even more attractive from the catalytic point of view. It is described in the literature
that, under oxidizing conditions, Cu in the alloy can be oxidized forming CuOx on the surface
of the material that can act as (a) a layer between the metal particle and the support,
enhancing the support-metal interaction and thus preventing sintering,72 (b) forming sites of
CuOx between the metal and the support that facilitate activation of O2 or even (c) forming a
layer of CuOx on surface of the nanoparticle preventing the sintering77. All these factors are
extremely useful and can be assessed also in the application of other existing bimetallic
systems, opening a large field of study for the application of bimetallic nanoparticles under
redoxconditions.78,79

29
1.5 Goals and thesis presentation
The general goal of this thesis was to study the formation of colloidal AuCu alloy
nanoparticles and their application in heterogeneous catalysis, using the CO oxidation
reaction as a model reaction.
Specific goals:
Understand the steps involved in the AuCu nanoparticles formation controlling
the size and composition by the colloidal method.
Produce catalysts by impregnation of AuCu nanoparticles on silica and
alumina and evaluate the structure-activity relationship in CO oxidation.
1.6 Overview
The main idea of this work was to explore the potential of colloidal approach for the
synthesis of bimetallic nanoparticles for applications in catalysis. The metal system chosen
was AuCu, a highly versatile alloy for catalytic applications.
After understanding the mechanism involved during colloidal synthesis, AuCu
nanoparticles produced were supported on silica and alumina to evaluate the stability and
catalytic potential of the material produced.
After the identification of critical points of AuCu colloidal synthesis and the
application of this system in CO oxidation reaction, in situ characterizations experiments
using X-ray absorption of fine structure (XAFS) spectroscopy and X ray diffraction (XRD) at
the Brazilian Synchrotron Light Laboratory (LNLS) were conducted for a deeper
characterization of our system.
1.7 Summary of each chapter
For the AuCu nanoparticles synthesis, the method described by Motl and co-workers81
was optmized to obtain a better control of size and composition depending on the final
temperature of the synthesis. The main results of this part are presented in Chapter 2, using
different characterization techniques and evaluating aliquots taken at different reaction stages
to infer about the mechanism of the synthesis.

30
For a deeper understanding of the synthesis mechanism, AuCu nanoparticles were
synthesized and evaluated in situ using XAFS at LNLS. For this step, it was designed a home-
made reactor adapted for XAFS measurements, allowing following the modifications of Au
and Cu precursors in real time. These results are presented in Chapter 3.
The synthesis of nanoparticles with well-defined size and composition were used to
produce heterogeneous catalysts and Chapter 4 presents the application of the
Au0.75Cu0.25/SiO2catalyst in CO oxidation, focusing in the impact of the redox pretreatments
in the performance and stability of the catalyst.
Finally, the impact of alloy composition and support nature of several catalysts were
addressed. This part of the work explore in detail by in situ XAFS and XRD allowing a deep
understanding of the effects involved during the pretreatments and catalytic cycles as well as
to assess the effect of the support in the alloy/dealloying processes of supported AuCu
nanoparticles. These results are presented in the Chapter 5.
Chapter 6 presents a general discussion of the work, the main conclusions and
perspectives.

31
Chapter 2
Synthesis of gold-copper nanoparticles by colloidal method varying the compositions
as a function of the synthesis final temperature
The content of this chapter is an adaptation of the article entitled
“Au1-xCux colloidal nanoparticles synthesized via a one-pot
approach: understanding the temperature effect on the Au:Cu
ratio” by Priscila Destro, Massimo Colombo, Mirko Prato,
Rosaria Brescia, Liberato Manna and Daniela Zanchet published
for RSC Advances.
Reference: RSC Adv.,2016, 6, 22213.
My contribution to this work was the planning of the
experiment, synthesis of Au1-xCux nanoparticles, the
characterizations by UV-Vis, BF-TEM, XRD and ICP, the data
analysis and writing the publication.

32
2.1 Introduction
Advances in the synthesis of nanomaterials have contributed to significant development in
fields such as sensors, photonics, drug-delivery systems and, especially, to fulfill the
increasing demand for new materials and technologies for energy.81,82
Among the huge variety of nanostructured materials, it is important to highlight the use of
metallic nanoparticles (NPs), where the metal confined in small portion has distinct properties
from those of the bulk. In this context, the control of size, shape and composition of the metal
NPs represents an important way to obtain new materials for many applications.58,83
The synthesis of gold NPs by colloidal methods has been extensively described using
different approaches, enabling accurate control of their properties.84,85 The use of Au-based
bimetallic NPs has also been presented in the literature as an interesting strategy for the
design of new materials.86,87 In this context, the AuCu alloy is an interesting example of how
the electronic properties of the alloy differ from the simple sum of the properties of Au and
Cu.29,88 For example, the Au:Cu ratio reflects directly on the position of the d-band center
relative to the Fermi level, which has a strong correlation with the reactivity of materials,
especially for applications in catalysis.40 Another point to be featured in the case of the AuCu
alloy is the possible formation of chemically ordered alloys. Some metallic nanoparticles such
as CoPt89, FePt90 and AuCo91 are able to form chemically ordered structures at specific
compositions. This ordering can affect different properties of the materials since the distinct
symmetry alters the resulting density of states.92 In the case of AuCu, it is possible to observe
chemically ordered alloys of Au3Cu, AuCu and AuCu3 compositions.
AuCu NPs can find interest in many fields of applications. Their tunable optical properties,
which depend on the shape and composition of nanoparticles, have been explored, for
example, in biosensors applications,93–95 SERS detection88 and photothermal therapy97,
showing exciting results. Another important research field in which AuCu NPs have showed
interesting and unique properties is heterogeneous catalysis, where supported bimetallic NPs
are more active and stable than the monometallic ones.33,97
The study of nanoalloys formation and growth mechanisms has been investigated by
different groups because of the applicability of these systems in several areas.18,37,99 Among
the methods to obtain nanometric metallic alloys reported in the literature, a widely used
strategy is the formation of a metallic seed followed by the incorporation of a second metal, in
a two-step growth mechanism.100,101 By using a seed of the metal with lowest reduction

33
potential, the second metal can be incorporated by galvanic replacement as nicely explored by
Xia and co-workers to produce a large library of nanoalloys starting from Ag seeds.102 In the
case of CuAu system, Liu et al.103 firstly synthesized Cu NPs, and then by partial replacement
of Cu by Au they obtained a Cu@Au core-shell structure. The alloy formation took place by
heating the core-shell NPs, through a unidirectional diffusion mechanism in solid state. In a
more general case, when the galvanic replacement is not favored, the reduction of the second
metal can be done by using a reducing agent. Chen et al.104 successfully obtained intermetallic
CuAu NPs using Au seeds.
In this work, we explore the one-pot strategy (i.e. all reagents are brought into contact at
the beginning of the reaction) to synthesize AuCu NPs with different compositions. In this
approach, characteristics such as the final size, composition and chemical ordering can be
varied by tuning the reaction parameters, i.e. metal: metal ratio, metal: ligand ratio and
temperature. We produced Au1-xCux spherical NPs of 14 nm in diameter, with a fine control
of their composition obtained by optimization of the final reaction temperature; we probed in
detail the alloy formation by combining different methods of characterization.
2.2 Experimental section
2.2.1 Chemicals
HAuCl4.3H2O (99%), and Cu(acac)2 (99%) were used as metal precursors. Oleylamine
(Oley, 70%) and oleic acid (OlAc, 90%) were used as protective agents. 1,2-hexadecanediol
(90%) was used as reducing agent and 1-octadecene (1-ODE, 90%) as solvent. All reactants
were purchased from Sigma-Aldrich and used without further purification.
2.2.2 Synthesis of bimetallic gold-copper NPs
The synthesis of bimetallic AuCu NPs was adapted from the literature.80 Briefly, 45 mg of
HAuCl4.3H2O and 30 mg of Cu(acac)2 (molar ratio Au:Cu 1:1) were added to a three-necked
round-bottom flask containing 5 mL of 1-ODE, 800 L of OlAc, 600 L of Oley and 100 mg
of 1,2-hexadecanediol. The mixture was magnetically stirred at room temperature under
vacuum for30 min, generating a green solution. The mixture was heated up under vacuum up
to 120 °C. After holding at 120 °C for 30 min (step 1), the solution was heated to the final
temperature. At about 200oC, N2 was fed to the system. The final temperature was set at 225,
260 or 280°C to obtain different compositions of Au1-xCux NPs (Figure 2.1). The reaction was

34
annealed at the corresponding final temperature for 30 min (step 2) and then cooled down.
The purification was carried out by adding a toluene: isopropanol (1:5 volume ratio) mixture,
followed by centrifugation at 4000 rpm for 10 min. Precipitated NPs were dispersed by
adding 2 mL of hexane and centrifuged at 2000 rpm for 10 min to remove any undispersed
material. This procedure was repeated twice and the particles were then dispersed in hexane.
The samples were named based on the final synthesis temperature as AuCu_225, AuCu_260
and AuCu_280. To follow the alloy formation, aliquots were taken at different stages of the
synthesis, and named by the temperature (100, 120_I, 120_F, 225_I, 225_F, 260_I, 260_F,
280_I, 280_F). The letters I and F indicate respectively the beginning and end of steps (1 and
2), on which the temperature was hold for 30 min.
Figure 2.1: Heating protocol adopted in the Au1-xCux NPs synthesis. The letters I and F
indicate the initial and final points of each step. Step 1 corresponds to 120 °C for 30 min and
step 2to the final temperature for 30 min. See text for more details.
2.3 Characterization.
Aliquots of approximately 20 µL were collected along the synthesis and diluted in hexane
using a quartz cell of 10 mm path length to characterize the Au1-xCux NP growth by UV-Vis
analysis, using a Varian Cary 5000 UV-Visible-NIR spectrophotometer in single path
configuration within the wavelength range of 200-800 nm with a scanning rate of 10 nm/s.
Overview bright-field transmission electron microscopy (BF-TEM) analyses were carried
out using a JEOL JEM-1011 instrument (thermionic W source, 100 kV high tension).
analyses were performed using a JEOL JEM-2200FS microscope (Schottky emitter, 200 kV
high tension) equipped with a CEOS spherical aberration corrector of the High-angle annular
dark field–scanning TEM (HAADF- STEM) objective lens and an in-column image filter (-

35
type). The shown values for NP diameter and uncertainty were obtained as average and
standard deviation over 500 NPs, respectively. Elemental mapping over the Au1-xCux NP
samples was carried out by energy-dispersive X-ray spectroscopy (EDS) performed in STEM
mode with a Bruker Quantax 400 system with a 60 mm2 silicon-drift detector (SDD). The
reported elemental maps of Cu and Au were obtained by integration of the Cu Kα and Au Lα
after background subtraction and peak deconvolution. For BF-TEM analyses, ~10 μL of the
samples were deposited onto carbon-coated Cu grids. For EDS analyses, carbon-coated
molybdenum grids and an analytical holder with a Be specimen retainer were used.
The elemental analysis of the colloidal NPs was done by Inductively Coupled Plasma
Optical Emission Spectroscopy (ICP) using an iCAP 6000 Thermo Scientific spectrometer.
Each sample was obtained by quenching the reaction at the selected temperature, followed by
purification. Samples were dissolved in HCl/HNO3 3/1 (v/v) overnight, diluted with deionized
water (14 μS), and filtered using a PTFE filter before measurement. The yield of Au and Cu
was defined as %Metal and calculated by the Equation 1.
% = × 100 (Eq.2.1)
where %Metal is the final yield of Au or Cu, Nfinal is the molar amount of metal determined by
ICP and Ninitial the molar amount of metal initially added.
X-ray diffraction (XRD) measurements were performed using a RigakuSmartLab X-ray
diffractometer equipped with a 9 kW Cu Kα (= 1.542 Å) rotating anode, operating at 40 kV
and 150 mA. A zero diffraction silicon substrate was used to collect XRD data on colloidal
NPs. The diffraction patterns were collected at room temperature over an angular range of
20−90°, with a step size of 0.05°. XRD data analysis was carried out using PDXL 2.1
software from Rigaku. As for the ICP measurements, each sample was obtained by quenching
the reaction at the selected temperature, followed by purification. XRD data were used to
estimate the Au1-xCux alloy composition. We used the equation (Eq.2) proposed by Okamoto
et al.32, based on experimental values described in the literature for the Au1-xCux solid solution
phase with face-centered cubic (fcc) structure:
푎 = 0.40784(1− 푥) + 0.36149푥 + 0.01198푥(1− 푥)(Eq.2.2)
Where a is the Au1-xCux lattice parameter and x is the copper atomic fraction, defined as
NCu/(NCu+NAu), where Nx is the number of atoms of the element x.

36
Since the Au1-xCuxalloy system shows a positive deviation from the Vegard’s law, the
equation proposed by Okamoto et al.33 gives a more accurate estimation of the alloy
composition.
X-ray photoelectron spectroscopy (XPS) measurements were performed on a Kratos Axis
Ultra DLD spectrometer, using a monochromatic Al Kα source (15 kV, 20 mA). Wide scans
were acquired at an analyzer pass energy of 160 eV. High-resolution narrow scans were
performed at constant pass energy of 10 eV and steps of 0.1 eV. Photoelectrons were detected
at a takeoff angle of Φ = 0° with respect to the surface normal. The pressure in the analysis
chamber was maintained below 7× 10⁻⁹ Torr for data acquisition. The samples were prepared
by drop-casting a few microliters of purified NPs solutions onto a graphite substrate (HOPG,
ZYB quality, NTMDT), which was then transferred to the XPS setup. Data were converted to
VAMAS format and processed using CasaXPS 2.3.16 software. The binding energy scale was
internally referenced to the C 1s peak (BE for C−C = 285 eV). Semi-quantitative analysis was
performed by measuring the areas under selected Au and Cu XPS peaks and by applying
appropriate atomic sensitivity factors, as obtained by the instrument manufacturer.
2.3. Results
Au and Cu NPs exhibit a characteristic absorption band in the visible region due to
plasmon excitation.105 Plasmon band arises from the collective oscillation of the free electrons
induced by the interaction with visible light.17 While Au NPs characteristic plasmon band is
centered at approximately 520 nm, the Cu NPs plasmon appears at 560 nm, and the Au1-xCux
NPs alloy plasmon is usually observed between these two values.80 For this reason, we firstly
followed the evolution of synthesis products by UV-Vis spectroscopy, as shown in Figure 2.2.
At 100 °C (black lines in Figure 2.2a, b and c) the characteristic plasmon resonance of Au
NPs is observed around 520 nm, indicating that the formation of Au NPs already occurred
before reaching this temperature. In fact, around 70 °C the colour of the solution already
changes from orange to deep red and TEM images at 100 °C confirms the formation of NPs
(Figure A1). By increasing the temperature, it is possible to observe a similar profile at 120°C
in all the three tests performed. Above this temperature a red shift occurs and the plasmon
peak becomes asymmetric, indicating the incorporation of copper into the Au NPs. Among
the samples, the red shift increases as a function of final temperature and annealing time:
AuCu_225 shows a plasmon band at 540 nm (Figure 2.2a), AuCu_260 at 550 nm (Figure
2.2b) and AuCu_280 at 552 nm (Figure 2.2c). In contrast, there is no significant change in the
peak width, indicating that the NPs remain stable by the incorporation of Cu.29

37
Figure.2.2 UV-Vis spectra during Au1-xCux NPs synthesis at different final temperatures: (a)
AuCu_225, (b) AuCu_260 and (c) AuCu_280.The red dashed line indicates the position of
Au plasmon and the blue dashed line the Cu plasmon position.
Figure 2.3 shows the BF-TEM images and corresponding size distribution of the final
particles. According to the BF-TEM analyses, the AuCu_225 sample shows spherical and
uniform NPs, with a diameter of 14± 1 nm. The average particle size did not significantly
change with the reaction temperature: we measured 13±1 nm for AuCu_260 and 14±1 nm for
AuCu_280. For AuCu_260, it is possible to observe also some less isotropic particles, which
become the dominant population for the AuCu_280 sample. The lower isotropy in these
samples may be due to a structural rearrangement upon incorporation of a higher fraction of
Cu atoms in the initial Au structure and/or to the higher final temperature.
Elemental analysis by ICP was performed on the final products and on all the aliquots
collected during the syntheses to get more information about the growth mechanism of the
Au1-xCux NPs. The results are presented in Table 2.1.
38
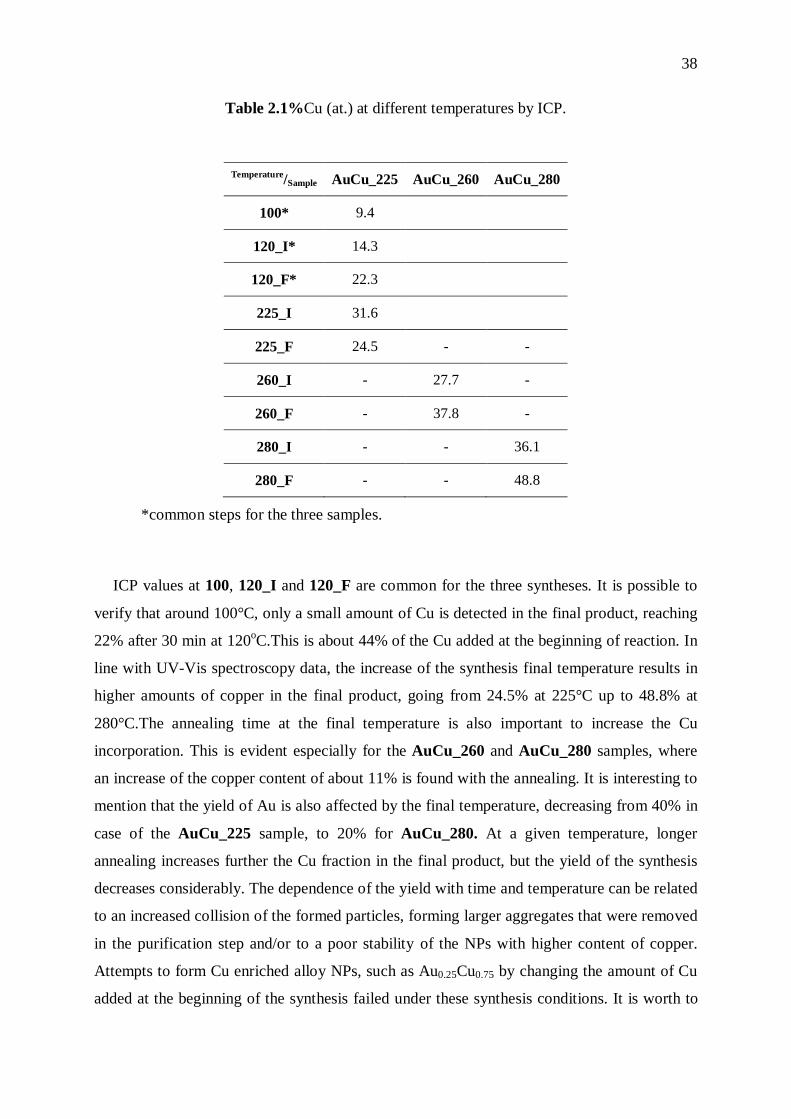
Table 2.1%Cu (at.) at different temperatures by ICP.
Temperature/Sample AuCu_225 AuCu_260 AuCu_280
100* 9.4
120_I* 14.3
120_F* 22.3
225_I 31.6
225_F 24.5 - -
260_I - 27.7 -
260_F - 37.8 -
280_I - - 36.1
280_F - - 48.8
*common steps for the three samples.
ICP values at 100, 120_I and 120_F are common for the three syntheses. It is possible to
verify that around 100°C, only a small amount of Cu is detected in the final product, reaching
22% after 30 min at 120oC.This is about 44% of the Cu added at the beginning of reaction. In
line with UV-Vis spectroscopy data, the increase of the synthesis final temperature results in
higher amounts of copper in the final product, going from 24.5% at 225°C up to 48.8% at
280°C.The annealing time at the final temperature is also important to increase the Cu
incorporation. This is evident especially for the AuCu_260 and AuCu_280 samples, where
an increase of the copper content of about 11% is found with the annealing. It is interesting to
mention that the yield of Au is also affected by the final temperature, decreasing from 40% in
case of the AuCu_225 sample, to 20% for AuCu_280. At a given temperature, longer
annealing increases further the Cu fraction in the final product, but the yield of the synthesis
decreases considerably. The dependence of the yield with time and temperature can be related
to an increased collision of the formed particles, forming larger aggregates that were removed
in the purification step and/or to a poor stability of the NPs with higher content of copper.
Attempts to form Cu enriched alloy NPs, such as Au0.25Cu0.75 by changing the amount of Cu
added at the beginning of the synthesis failed under these synthesis conditions. It is worth to

39
point out that other authors report the formation of Au0.25Cu0.75 NPs31 and Au0.33Cu0.77
35 using
different conditions, but the yields were not reported.
Figure2.3:BF-TEM images and size distribution of (a) AuCu_225, (b) AuCu_260 and (c)
AuCu_280.
Table 2.3 shows the quantitative XPS results, wherein the amount of Cu increases with
temperature. Interestingly, although XPS is a surface technique, probing a few atomic layers
(< 2 nm for Cu and Au)106, it shows Cu atomic % similar to those measured by ICP. These
results indicate a homogeneous distribution of both metals in the synthesis product, at all
stages, ruling out the formation of a core-shell structure with, for example, a Cu-rich shell.
However, it is important to note that a similar result could also be found, for example, if Au
and Cu single-metal particles were formed. This hypothesis is excluded by STEM-EDS
mapping over individual particles (see Figure A2), showing a homogeneous distribution of
both metals in the NPs.

40
The amount of Cu that was effectively alloyed with Au was quantified by XRD analyses.
Both metals exhibit a fcc structure, and the variation in lattice parameter is related to the
Au:Cu ratio in the alloy (Eq. 2.2) 33 Figure 4 shows the corresponding diffractograms in which
a clear shift of the peak positions can be seen as the synthesis proceeds. The dashed lines in
Figure 2.4 correspond to the (111) peak position of metallic Au (a = 4.08 Å, red line) and
metallic Cu (a = 3.61 Å, blue line). It can be seen that during the first reaction step (120°C),
common to all samples, XRD confirms the formation of monometallic Au NPs, in agreement
with the UV-VIS results. By increasing the temperature, the peak positions shift to larger
Bragg angle values showing a decrease of the lattice parameter in agreement with the
incorporation of Cu into the Au lattice. The results also show that the higher the temperature,
the larger the shift, indicating higher Cu incorporation. Interestingly, in the case of
AuCu_280 sample the superlattice peaks related to the chemically ordered tetragonal
structure of AuCu can also be seen.107 Therefore, although the yield of NPs decreases with
temperature and annealing time, keeping the system at 280°C for 30 min lead to NPs with
Au:Cu molar ratio of 1:1, matching the initial metals ratio, and favoring the formation of the
chemically ordered bimetallic AuCu phase.
Table 2.2: %Cu (at.) at different temperatures obtained by XPS.
Temperature/Sample AuCu_225 AuCu_260 AuCu_280
100* 3.4
120_I* 5.7
120_F* 22.3
225_I 29.5
225_F 26.5 - -
260_I - 28.6 -
260_F - 40.3 -
280_I - - 36.2
280_F - - 40.4
*common steps for the three samples.

41
Figure 2.4: XRD patterns of Au1-xCux NPs at different stages of the synthesis: (a) AuCu_225,
(b) AuCu_260 and (c) AuCu_280. The red dashed line indicates the (111) peak position of
Au (a= 4.08 Å, JCPDS N° 00-004-0784) and the blue one indicates the (111) position of Cu
(a= 3.61 Å, JCPDS N°. 00-901-3023). The superlattice peaks of the chemically ordered AuCu
phase (JCPDS N°. 01-071-5026) are indicated by * in (c).
Table 2.3 presents the Cu at.% obtained by the analysis of the lattice parameter. It is
possible to confirm the increase in the copper amount as a function of the temperature,
similarly to what observed by ICP and XPS analyses. However, while ICP/XPS showed that

42
the total amount of Cu raises steadily, e.g. from about 10% when reaching 120°C (120_I) up
to 20% after 30 min at this temperature (120_F), XRD gives no indication that the Cu is
incorporated in the Au lattice at this temperature. In all stages, the Cu contents found by XRD
were smaller than those measured by ICP/XPS, with the exception of the final stages at 260 °C (260_F) and 280 °C (280_F).
Table 2.3: %Cu (at.) derived from the lattice parameter, obtained by XRD (Eq.2.1)
Temperature/Sample AuCu_225 AuCu_260 AuCu_280
100* 0
120_I* 0
120_F* 0
225_I 15.0
225_F 19.2 - -
260_I - 21.9 -
260_F - 38.1 -
280_I - - 30.1
280_F - - 50.0
*common steps for the three samples
Figure 2.5 compares the results found by ICP and XRD. It is possible to observe that,
as the syntheses proceed, the values obtained by the two techniques tend to converge toward
the same values. These results likely indicate that part of the Cu species present at the
beginning of the synthesis, which precipitate together with the Au NPs during the purification
process, are not detectable by XRD, not even as a separate phase (e.g. metallic Cu or
crystalline copper oxides).

43
Figure2.5: Comparison of the %Cu (at.) obtained by ICP and XRD as a function of the
synthesis temperature of (a) AuCu_225, (b) AuCu_260 and (c) AuCu_280.
In order to understand this difference, a detailed analysis was performed by HAADF-
STEM imaging and STEM-EDS elemental analysis on samples 280_I and 280_Fas shown in
Figure A.6 and Figure A2. Besides the high-contrast (i.e., high thickness and/or mean atomic
number) of the Au1-xCux NPs, a fainter contrast region can be observed in HAADF-STEM
images around the particles for the sample 280_I, as indicated by arrows in Figure 2.6. This
region is mainly composed by copper, as shown by the corresponding STEM-EDS analysis.
Although this type of analysis is local, this result, associated to the similar quantification of
Au and Cu provided by ICP and XPS, is strong evidence that the reduction of Cu leads
initially to the formation of a Cu-rich phase that cannot be identified by means of XRD.

44
Figure 2.6: HAADF-STEM image of 280_I sample, showing the presence of a lower contrast
phase (indicated by arrows) surrounding the Au1-xCux NPs, mainly composed by copper as
demonstrated by the comparison between STEM-EDS spectra collected on NPs and on the
surrounding phase (identical area and acquisition time).
2.4. Discussion
In the one-pot synthetic method, both metals precursors are added together to the initial
solution and, depending on the reaction conditions, one may expected the formation of an
alloy already in the early stages of the synthesis process. Previous works with the Au1-xCux
system found, however, that in fact Au nucleates first. 72,108 Destro et al.109 probed the
formation of the AuCu alloy (in air) by in situ X-ray absorption fine structure spectroscopy

45
(XAFS) and confirmed that Au reduction starts already at 70oC. In the present work, where
the synthesis was performed in vacuum/inert atmosphere, the results confirmed that Au
precursor is reduced first, and alloy formation is highly dependent on the temperature.
Considering the experimental conditions implemented in the present work, the early reduction
of Au can be rationalized considering that 1,2-hexadecanediol is not a strong reducing agent,
in particular at low temperature, and that Au3+ is reduced easier than Cu2+ due to the higher
reduction potential (+1.5 and +0.3 eV respectively).110
One interesting consequence of the formation of monometallic Au NPs at the early stages
of the synthesis is that theAu1-xCuxNPs, characterized by different compositions, show similar
sizes. Similar results were reported by Motl et al.72 they implemented a one-pot synthesis
approach where the amount of Cu in the NPs was controlled by the Au:Cu ratio of the
precursors. They analyzed eight samples with copper contents ranging from 0 to 50% (at.) and
seven of them showed an average size in the10-13 nm range. Recently, Sinha et al.,100
explored the one-pot strategy for the synthesis of Au1-xCuxNPs by varying the (Oley +
OlAc)/metal and Oley/OlAc ratios seeking to control the average particles size. They reported
that a 40:1 total ligand: metal ratio led to the smallest average size of the NPs (i.e. about 14
nm). This value is in line with our results, where the total ligand: metal ratio is 50:1.
According to Sinha et al.,100 it was not possible to decrease the particle size below this value
just by increasing the amount of ligands. Smaller Au1-xCuxNPs were only obtained by using a
seed mediated approach where pre-formed Au NPs are added to solution containing the
copper precursor.104 We have also found similar results, where the final temperature of the
synthesis impact both the Au:Cu ratio and the eventual chemical order of the alloy without
affecting significantly the average particles size. In fact, at 100oC when most of the Au ions
have already been reduced forming the NPs, the mean size is 14 nm (see Figure S1). It is
worth to point out that the increase of the Cu content in the NPs from 25 % (AuCu_225) to
50 % (AuCu_280) should lead to an increase of about 11 % in size. This small increase
would be hardly detected by TEM due to the size distribution of the samples. Different
parameters such as total ligand/metal ratio, heating ramp and temperature of step 1 were also
varied but did not impact significantly in the final particle size (results not reported).
More interestingly, how the Cu atoms are generated and incorporated to form the alloy is
still not clear and there are some possible mechanisms that can lead to the Au1-xCux alloy
formation. Chen et. al.96 proposed that in the seed mediated synthesis, a diffusion-based
mechanism takes place. They proposed that Cu2+ ions were reduced to Cu atoms and/or small

46
cluster in solution. Then, by colliding with the Au NPs Cu species diffuses into the core of the
NPs forming the alloy. No evidence of a core-shell structure was found. On the other hand,
Shore et al.111 observed a core-shell structure in AuAg system at low temperature (< 200oC)
and the alloy formation was achieved by increasing the temperature. They also showed that
similar AuAg alloy NPs could be directly obtained by heating Au NPs in the presence of Ag
precursor at higher temperatures (~250 o C).
In our work, the combination of XPS, ICP, TEM, XRD and STEM-EDS does not indicate
the formation of a core-shell structure or the direct formation of atomic species of copper that
would collide and diffuse into the Au NPs. We showed that the Au NPs are formed at low
temperature and that the amount of Cu in the final product progressively increases with the
reaction temperature. Moreover, the copper content inferred from XRD analysis was
systematically smaller than that measured by ICP and XPS at all reaction stages except at the
end of the annealing step. Our results strongly indicate that a Cu-rich phase, undetectable by
XRD, was initially formed and then progressively digested in the reaction medium at high
temperatures. This Cu phase, amorphous or formed by few nm-sized Cu or CuOx
nanocrystals, acts as a reservoir of Cu species that are released as the synthesis proceeds and
that are incorporated into the Au NPs through a solid state diffusion process.
The growth mechanism of our Au1-xCuxNPs resembles the mechanism called digestion
ripening described by Smetana et al.112 in which AuCu and AuAg alloy NPs were obtained by
mixing and heating preformed single metal colloidal NPs in the presence of alkanethiol under
reflux. This mechanism is highly dependent on the ligand and temperature, and core-shell
NPs have also been prepared by this method at lower temperatures.113–115 We speculate that
the large excess of ligands and the high temperature achieved in our synthesis can promote
the digestion of the Cu-rich phase leading to the formation of the Au1-xCuxalloy, as proposed
in Figure 2.7.
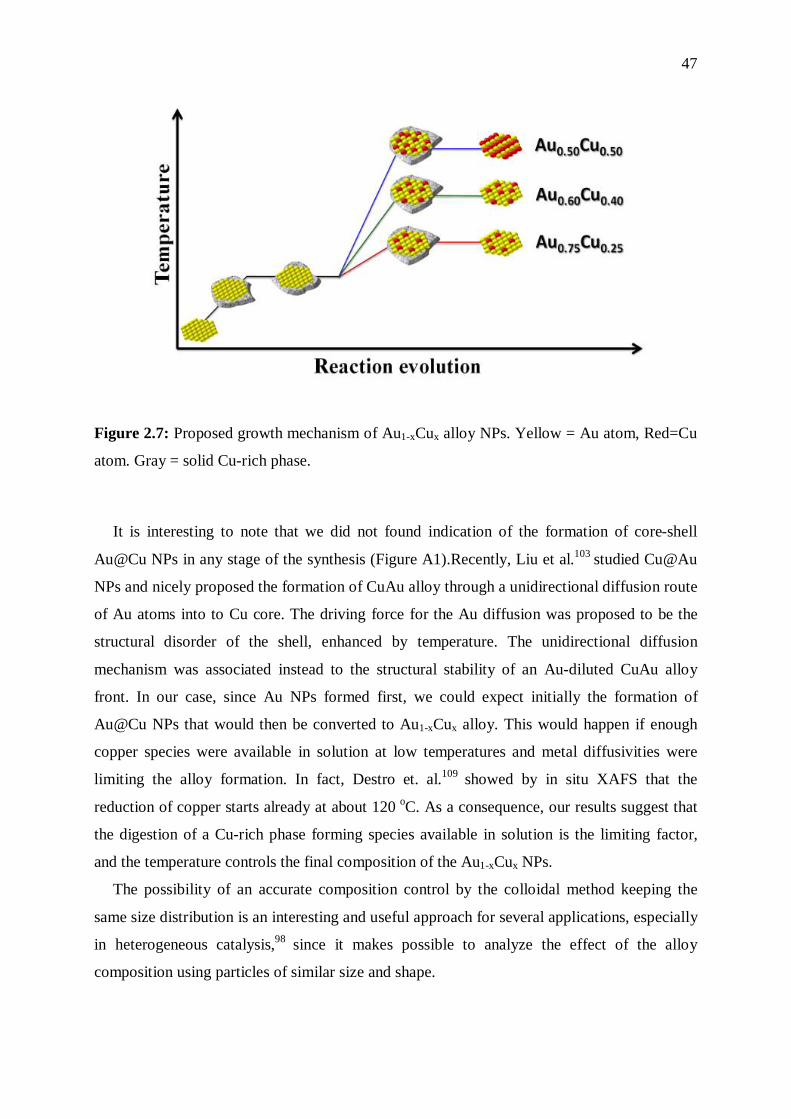
47
Figure 2.7: Proposed growth mechanism of Au1-xCux alloy NPs. Yellow = Au atom, Red=Cu
atom. Gray = solid Cu-rich phase.
It is interesting to note that we did not found indication of the formation of core-shell
Au@Cu NPs in any stage of the synthesis (Figure A1).Recently, Liu et al.103 studied Cu@Au
NPs and nicely proposed the formation of CuAu alloy through a unidirectional diffusion route
of Au atoms into to Cu core. The driving force for the Au diffusion was proposed to be the
structural disorder of the shell, enhanced by temperature. The unidirectional diffusion
mechanism was associated instead to the structural stability of an Au-diluted CuAu alloy
front. In our case, since Au NPs formed first, we could expect initially the formation of
Au@Cu NPs that would then be converted to Au1-xCux alloy. This would happen if enough
copper species were available in solution at low temperatures and metal diffusivities were
limiting the alloy formation. In fact, Destro et. al.109 showed by in situ XAFS that the
reduction of copper starts already at about 120 oC. As a consequence, our results suggest that
the digestion of a Cu-rich phase forming species available in solution is the limiting factor,
and the temperature controls the final composition of the Au1-xCux NPs.
The possibility of an accurate composition control by the colloidal method keeping the
same size distribution is an interesting and useful approach for several applications, especially
in heterogeneous catalysis,98 since it makes possible to analyze the effect of the alloy
composition using particles of similar size and shape.

48
2.5. Conclusions
We evaluated the effect of the temperature on the synthesis of Au1-xCuxalloy colloidal NPs
via one-pot approach. By changing the final reaction temperature it was possible to obtain
uniform spherical particles, with size of about 14 nm, with different composition: Au0.75Cu0.25
at 2250C, Au0.60Cu0.40 at 2600C and Au0.50Cu0.50 at 280°C. By combining different techniques,
it was possible to propose a growth mechanism, where Au NPs are formed at low
temperatures together with a Cu-rich phase. This intermediary Cu-rich phase acts as a
reservoir of Cu atoms that are incorporated into the Au NPs at a given temperature through a
digestive ripening like-process.
The results presented here clearly point out the important role played by the temperature in
the formation of bimetallic Au1-xCux NPs. Despite the efforts, we still lack deeply studies on
the phase diagrams at nanoscale, as well as the main mechanisms that determine atomic
diffusion and phase segregation at nanoscale. This is of crucial importance in several areas,
such as catalysis, where the interaction with supports and reaction medium can further affect
the stability of nanoalloys. We hope that our results will contribute to motivate further
theoretical and experimental studies in this direction.
49
Chapter 3
Formation of bimetallic copper-gold alloy nanoparticles probed by in situ XAFS
This chapter is an adaptation of the paper “Formation of
bimetallic copper-gold alloy nanoparticles probed by in situ
XAFS” by Priscila Destro, Daniel Augusto Cantane, Guilherme
dos Santos Honório, Luelc Souza da Costa, Débora M. Meira,
José Maria C. Bueno and Daniela Zanchet that is in the final
revision to be submitted.
My contribution to this work was the synthesis of AuCu
nanoparticles, the ex situ characterizations of AuCu
nanoparticles, participation in the XAFS data analysis and
writing process.

50
3.1 Introduction
Bimetallic gold-copper alloy nanoparticles (Au1-xCux NPs) have attracted much
attention not only from a scientific perspective but also from an applied one, especially in the
field of catalysis.34 Extensive efforts have been devoted to building synthesis strategies for
obtaining Au1-xCux NPs with well-controlled chemical composition80,116,117 crystalline
structure-ordered/disordered87,118, size and shape (morphology).97,119,120Among many
synthesis methods, the chemical reduction of metal precursors via one-pot approach in
organic-phase has revealed to be one of the most powerful ways to access these desired Au1-
xCux NPs at nanoscale. 87,104,121 In particular, through controlled synthesis parameters such as
precursor/co-surfactants concentration and reaction temperature/time Au1-xCux NPs from
nanospheres to nanowires as well as from disordered to atomically ordered alloys with
different compositions have been made.87,119 Although a significant progress has been reached
in synthesizing Au1-xCux NPs in organic-phase via one-pot approach102 the mechanism
(nucleation and growth) which govern its formation has not yet been satisfactorily understood
and is currently the greatest hurdle to design bimetallic Au1-xCux materials with well-
optimized proprieties.34,122 To overcome this drawback, ex situ characterizations by sampling
procedures have been used to unraveling the mechanism involved during the evolution of
Au1-xCux NPs formation, especially taking out aliquots from reaction solution at different
times.80,117 Continuing from these understandings, we have recently revealed the temperature
effect on the final Au:Cu composition, demonstrating the Au1-xCuxalloy NPs formation occurs
through a digestive ripening-like process.4 However, from these ex situ procedures all shed
light on the synthesis mechanism cannot be deeply extracted, once that the stability of the
intermediates formed is critically influenced by interactions of potential in solution, i.e., the
solvation effects. As another strategy, in situ synchrotron radiation-based X-ray
characterizations have shown to be capable of identifying and monitoring the chemical
evolution of the NPs formation in solution. 123 Among them, in situ X-ray absorption fine
structure (XAFS) spectroscopy have received considerable attention124, since it offers
versatility, such as monitoring the changes in oxidation states, coordination, bond formation,
already at the initial stages of nucleation and growth of the NPs, as well as information about
local environment with chemical sensibility, even in the absence of a crystalline phase.125,126
By this means, many in situ studies have dedicated in monitoring the formation of bimetallic
NPs, however in aqueous-phase 127–129 with few limited reports in understanding the
formation of bimetallic NPs in organic-phase.130
51
Herein, we report new insights into the mechanism of one-pot bimetallic Au0.75Cu0.25
alloy NPs formation in organic-phase by time-resolved in situ XAFS spectroscopy. For that, a
home-made system was built enabling the direct monitoring of all events involved during the
bimetallic NPs formation in organic-phase. Therefore, the reaction sequence of Au0.75Cu0.25
alloy NPs formation with time resolution was mapped, providing strong evidences that
digestive ripening-like process is driven by a solid state diffusion mechanism at the metallic
gold/copper-oxide-rich interface.
3.2 Experimental session
3.2.1 Chemicals
HAuCl4.3H2O (99%), and Cu(acac)2 (99%) were used as metal precursors. Oleylamine
(Oley, 70%) and oleic acid (OlAc, 90%) were used as protective agents. 1,2-hexadecanodiol
(HDD, 90%) was used as reducing agent and 1-octadecene (1-ODE, 90%) as solvent. All
reactants were purchased from Sigma-Aldrich and used without further purification.
3.2.2 Synthesis of bimetallic copper-gold nanoparticles
Bimetallic NPs were synthesized using a protocol previously reported.80 In a typical
procedure used for in situ XAFS measurements, HAuCl4.3H2O (45 mg) and Cu(acac)2 (68
mg)were added to a home-made reactor (see details below) containing 1-ODE (5 mL),Oley
(600 L), Olac (800 L) and HDD (100 mg) (Cu:Au atomic ratio ~ 2.3:1). The mixture was
magnetically stirred at room temperature to generate a green solution and then heated to 120
ºC. After holding at 120 ºC for 30 min in air, the solution was heated to 225 ºC and
maintained at this temperature for 30 min. After that, the solution was cooled to room
temperature naturally. Similar procedure was repeated at laboratory, to perform ex situ
characterization by a larger set of techniques and test the reproducibility. The purification was
carried out by adding acetone: hexane (3:1 volume ratio, 10 mL), followed by centrifugation
at 12000 rpm for 10 min. The precipitate was dispersed in hexane (10 mL) containing Oley
(100 L) and Olac (100 L) and the NPs were further purified by centrifugation at 3000 rpm
for 10 min, to remove large agglomerates. After discarding the precipitated, the NPs were
precipitated out by adding ethanol (10 mL), followed by centrifugation at 8500 rpm for 8 min.
The final NPs were dispersed in hexane (5 mL) for characterization.

52
3.2.3 Characterization
Inductively coupled plasma-atomic emission spectroscopy (ICP-AES) measurements
were carried out on 3000DV-Perkin Elmer atomic-emission spectrometer. X-ray diffraction
(XRD) patterns were collected using a Shimadzu X-ray diffractometer XDR7000 with Cu Kα
radiation (λ = 1.5418 Å), 40 kV and 30mA. Transmission electron microscopy (TEM) images
were obtained using a JEOL JEM 2100 equipment (200 kV and point resolution of 2.3 Å)
available at the Brazilian Nanotechnology National Laboratory (LNNano), Campinas, Brazil.
TEM samples were prepared by depositing a single drop of diluted NPs dispersion (~5 L) on
ultra-thin amorphous carbon-coated copper grids. EDS-STEM (energy dispersive
spectroscopy- scanning TEM) was performed with a 2100 FEG-TEM, operating with a probe
of 1 nm at LNNano. Ultraviolet–visible spectra were acquired with an Agilent 8453
spectrophotometer. In situ time-resolved X-ray absorption fine structure (XAFS) spectra in
the near edge region (XANES) were acquired at theD06A-DXAS beamline of the Brazilian
Synchrotron Light Laboratory (LNLS), Campinas, Brazil, operating in dispersive mode. A
curved Si(111) monochromator was used to focus the beam at the reactor window center and
a CCD camera was used as detector (time per spectrum ~ 4-300 s depending on the
concentration). Data at both absorption edges, Au-L3 (11919 eV) and Cu-K (8979 eV), were
collected by running twice the experiment. The final spectra were obtained by subtracting
each collected spectrum from the background signal originated by a solution containing all
the reactants except the metal precursor of interest. A home-made reactor was built based on a
round bottom flask with two adjustable hollow Teflon® pistons capped with Kapton®
windows to allow the X-rays passing through the reaction medium. The optical pathway could
be adjusted from about 0.5 to 10 mm. The dispersion was stirred with a stir plate and heated
by a metallic block, controlled via a thermocouple system. Details about the setup for
monitoring the NPs synthesis by in situ XAFS are presented in the Supporting Information
(Figure B1).
3.3 Results and discussion
Far from the best practice in controlled-synthesis, the mapping in time-resolved
formation of Au0.75Cu0.5 alloy NPs was carried out under air, which could impact on the final
Cu ratio incorporated into alloy material. Therefore, prior to in situ XAFS measurements, the
NPs were characterized by ICP, TEM, UV-vis absorption, and XRD to confirm the

53
reproducibility and robustness of the synthesis approach under air condition, besides
providing a basis for comparison of the obtained nanostructure.
400 500 600 700 800N
orm
aliz
ed a
bsor
ptio
n (A
rb. U
nits
)
Wavelength (nm)
20 30 40 50 60 70 80Nor
mal
ized
inte
nsity
(Arb
. Uni
ts)
2 (°)
Figure 3.1. (a) Representative TEM image;(b) UV-Vis spectrum. The red and blue dashed
lines indicates the plasmon peak position of Au and Cu NPs, respectively(c) XRD pattern of
the synthesized bimetallic Au1-xCux NPs The red dashed line indicates the(111) peak position
of Au (a= 4.08 Å, JCPDS N° 00-004-0784) and the blue one indicates the (111) position of
Cu (a= 3.61 Å, JCPDS N°. 00-901-3023).
From Figure 3.1a, it is observed that the as-prepared NPs are substantially spherical in
shape, with an average diameter size of 14.3± 1.3 nm (see statistical information in Table B1).
UV-vis absorption spectrum in the Figure 3.1b confirmed the formation of Au1-xCux NPs
alloy; it shows a centered band at 545 nm corresponding to a maximum plasmon resonance
frequency between the plasmon bands of Au NPs in this size range (red dashed line), at 520
nm, and Cu NPs (blue dashed line), at 560 nm.80,116 According to ICP data, the purified NPs
are formed by ~ 1:3 Cu:Au atomic ratio (namely Cu:Au 27.4:72.6 ±0.3%). XRD pattern in the
Figure 3.1c corresponds to face-centered cubic (fcc) nanostructure with peak positions in
between of gold and copper standards. Based on the lattice parameter obtained from XRD
pattern, it is possible to quantify the amount of Cu incorporated into the alloy using the
Vegard´s Law33 and the results confirm the Cu amount of about 26 %, in accordance with the
formation of Au0.75Cu0.25 NPs. The elemental line-scan EDS-STEM analysis (Figure C2) is in
agreement with a homogenous distribution of Cu and Au indicated by UV-Vis and XRD
measurements. Therefore, the results confirm the formation of Au0.75Cu0.25 NPs. It is
important noting that a large fraction of Cu precursor was placed to compensate the favorable
copper oxide formation under air condition (initial Cu:Au 3:1 atomic ratio for generating
incorporated Cu:Au 1:3). In fact, we have recently demonstrated that under rigorous
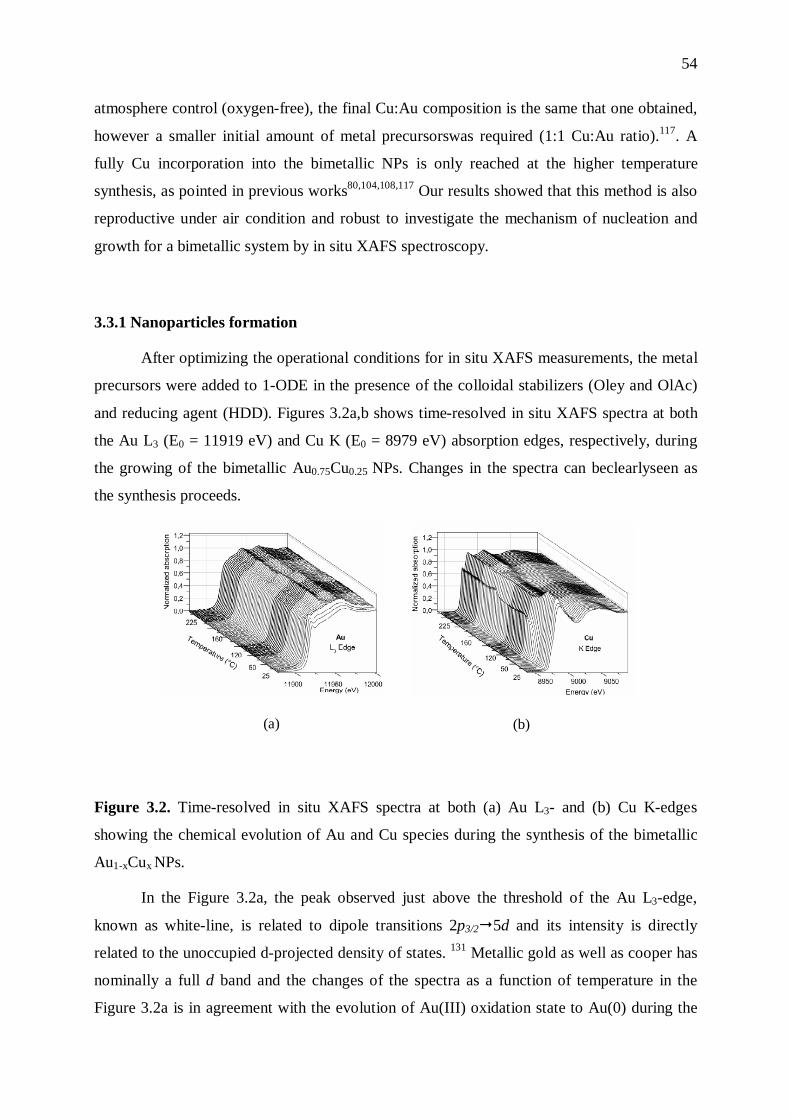
54
atmosphere control (oxygen-free), the final Cu:Au composition is the same that one obtained,
however a smaller initial amount of metal precursorswas required (1:1 Cu:Au ratio).117. A
fully Cu incorporation into the bimetallic NPs is only reached at the higher temperature
synthesis, as pointed in previous works80,104,108,117 Our results showed that this method is also
reproductive under air condition and robust to investigate the mechanism of nucleation and
growth for a bimetallic system by in situ XAFS spectroscopy.
3.3.1 Nanoparticles formation
After optimizing the operational conditions for in situ XAFS measurements, the metal
precursors were added to 1-ODE in the presence of the colloidal stabilizers (Oley and OlAc)
and reducing agent (HDD). Figures 3.2a,b shows time-resolved in situ XAFS spectra at both
the Au L3 (E0 = 11919 eV) and Cu K (E0 = 8979 eV) absorption edges, respectively, during
the growing of the bimetallic Au0.75Cu0.25 NPs. Changes in the spectra can beclearlyseen as
the synthesis proceeds.
(a)
(b)
Figure 3.2. Time-resolved in situ XAFS spectra at both (a) Au L3- and (b) Cu K-edges
showing the chemical evolution of Au and Cu species during the synthesis of the bimetallic
Au1-xCux NPs.
In the Figure 3.2a, the peak observed just above the threshold of the Au L3-edge,
known as white-line, is related to dipole transitions 2p3/25d and its intensity is directly
related to the unoccupied d-projected density of states. 131 Metallic gold as well as cooper has
nominally a full d band and the changes of the spectra as a function of temperature in the
Figure 3.2a is in agreement with the evolution of Au(III) oxidation state to Au(0) during the

55
formation of the bimetallic NPs. In the case of Cu K-edge (Figure 3.2b), which mainly
involves 1s4p dipole transitions, the change in intensity of the white-line is also visible and
correspond to the evolution of Cu(II) oxidation state to a more reduced state. A pre-edge
feature emerged upon heating, which is related to dipole forbidden transition from 1s to d
states. 131 To better understand these changes, selected in situ XANES spectra at different
temperatures (30, 50, 100, 120, 160, 200 and 225 ºC) are shown in Figure 3.3a a set of
XANES spectra of standards materials, including Au and Cu foils, HAuCl4 and Cu(acac)2
precursors and Cu2O powder, are displayed in Figure C3 for reference.
11900 11925 11950 11975 12000
11920 11925 11930 11935
i
iiiii
Nor
mal
ized
abs
orpt
ion
Energy (eV)
30 ºC 100 ºC 120 ºC 160 ºC 200 ºC 225 ºC
(a)i
8960 8980 9000 9020
8980 8985 8990
i
iii
ii
Nor
mal
ized
abs
orpt
ion
Energy (eV)
30 ºC 100 ºC 120 ºC 160 ºC 200 ºC 225 ºC
(b)
i
Figure 3.3 In situ XAFS spectra for (a) Au L3-edge and (b) Cu K-edge, taken at different
reaction temperatures: 30 ºC (black-line), 100 ºC (dot), 120 ºC (dash dot–spectrum taken at
the when reaching 120oC; open-circle–spectrum taken after 30 min at 120oC, respectively),

56
160 ºC (solid-circle line), 200 ºC (star), and 225 ºC (red-line). Insets show a magnified view
of the edge regions. See text for details.
From both set of spectra, a particular and interesting trend can be observed. The black-
line spectra obtained at 30 ºC in the Figure.3.3a and b match well with those ones observed
for HAuCl4 and Cu(acac)2 precursors, having Au(III) and Cu(II) oxidation states, respectively
(see precursors spectra for comparison in the Figure. B3a,b). Focusing on the spectra profile
at the Au L3-edge, in the Figure 3.3a, it is noted that there is a rapid depletion of signal
intensity related to the Au(III)species (peak i, at ~ 11922 eV) when the temperature of
reaction is still mild (lower than 100 ºC temperature). Moreover, two shoulders concomitantly
emerge at around 11944 eV (peak ii) and 11966 eV (peak iii), which are attributed to a
metallic gold phase (see pure gold foil spectrum in the Figure B3a), suggesting the formation
of Au−Au bonding as in the metal phase already at the earliest stage of the reaction. This
reduction process is also supported by the color changes of the reaction medium from yellow
to deep-red. It is well-known that the formation of deep-red solution takes place in the
presence of gold nanoparticles in colloidal dispersions. Therefore, in situ XAFS spectroscopy
results at the Au L3 absorption edge revealed a nearly complete depletion of the HAuCl4
precursor as the reaction temperature is increased above 100 ºC.
In contrast, there is no evidence of Cu(II) converting (from the Cu(acac)2 precursor) to
Cu(I) or to Cu(0) species up to 100 ºC temperature (dot line spectrum in the Figure 3b). Upon
reaching the temperature to 120 ºC (dash-dot line spectrum in the Figure 3.3b), however, a
small pre-peak is detected at about 8981 eV (peak i) and a shift in the position of the main
peak from (iii) to (ii) position occurred (dash-dot line spectrum in the Figure 3.3b). This
suggests that the copper reduction start to take place in this temperature. More interestingly
however, after holding the temperature for 30 min at 120 ºC (open-circle line spectrum in the
Figure 3.3b), a profile more similar to Cu2O spectrum is visible (see Figure B3b for
comparison).When the temperature is further increased to 225 ºC, the modifications are small
but going into the direction of metallic copper. Previously XANES studies of bulk AuCu
alloy at both Au L3 and Cu K absorption edges have shown qualitatively changes in the
XANES spectra features when compared with pure Au and Cu foils.131 For example, Kuhn
and Sham131 found a small increase in absorption just above Au L3-edge threshold (~ 11927
eV) for bulk Au0.75Cu0.25alloy when compared to Au foil. In the case of Cu K-edge, the study
has reported a decrease of the absorption pre-edge peak(9879 eV) and an increase of the first

57
main peak for the alloy material (~8994 eV) when compared to Cu foil.131 The red-line
spectrum in the Figure 3.3a matched well with the one reported for bulk alloy (Figure C3b).
In contrast, final Cu K-edge spectrum (Figure 3.3b) is very different from both metallic
copper (Figure C4b) and bulk Au0.75Cu0.25 alloy. These results together reveal that, although
the Au1-xCux NPs formation occurred, a large fraction of unreduced copper remains in
solution overcoming the typical features of the absorption spectrum of the bulk alloy. This is
agreement with the ICP results, that showed that although the initial Cu:Au atomic ratio was
3:1 the final Cu:Au atomic ratio in the NPs was only 1:3Cu:Au.
3.3.2 Mechanistic aspects
An illustrative analysis can be drawn from in situ XANES data by looking at the
profile of absorption intensity at characteristic energies. Figure 3.4a shows the evolution of
the Au(III) white-line intensity as function of temperature at 11922 eV (peak i in Figure 3.3a)
and Figure 3.4b shows the corresponding graphic for Cu(II)looking at 8998 eV (peak iii in
Figure 3.3b). Additionally, the evolution of the intensity of absorption pre-edge peak at ~
8981 eV is also shown in the Figure 3.4b, for comparison.
50
100
150
200
Temperature (°C) White line intensity
(at 11922 eV)
Synthesis evolution
Tem
pera
ture
(ºC
)
0,90
0,95
1,00
1,05
1,10
1,15
(t5) (t1) (t4) (t
3) (t
2)
Whi
te li
ne In
tens
ity (a
t 119
22 e
V)(a)
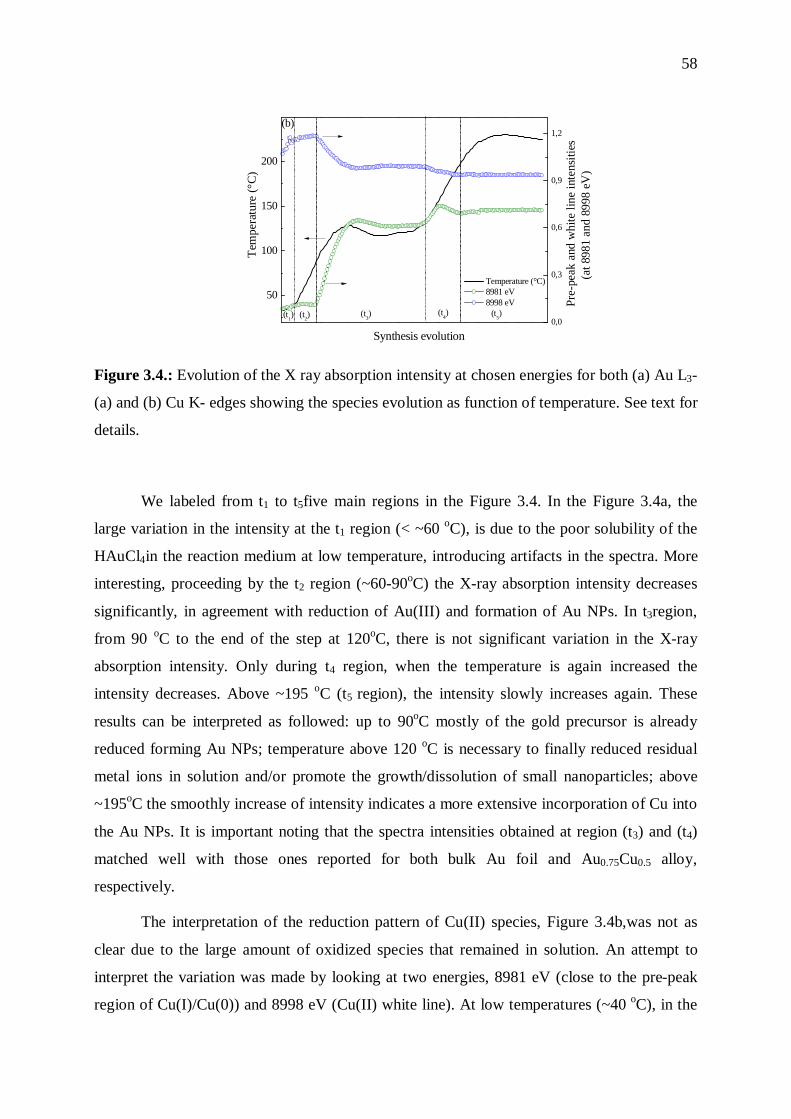
58
50
100
150
200
Temperature (°C) 8981 eV 8998 eV
Synthesis evolution
Tem
pera
ture
(°C
)
Pre-
peak
and
whi
te li
ne in
tens
ities
(at 8
981
and
8998
eV
)
0,0
0,3
0,6
0,9
1,2
(t4)(t
3)(t
1) (t2)
(b)
(t5)
Figure 3.4.: Evolution of the X ray absorption intensity at chosen energies for both (a) Au L3-
(a) and (b) Cu K- edges showing the species evolution as function of temperature. See text for
details.
We labeled from t1 to t5five main regions in the Figure 3.4. In the Figure 3.4a, the
large variation in the intensity at the t1 region (< ~60 oC), is due to the poor solubility of the
HAuCl4in the reaction medium at low temperature, introducing artifacts in the spectra. More
interesting, proceeding by the t2 region (~60-90oC) the X-ray absorption intensity decreases
significantly, in agreement with reduction of Au(III) and formation of Au NPs. In t3region,
from 90 oC to the end of the step at 120oC, there is not significant variation in the X-ray
absorption intensity. Only during t4 region, when the temperature is again increased the
intensity decreases. Above ~195 oC (t5 region), the intensity slowly increases again. These
results can be interpreted as followed: up to 90oC mostly of the gold precursor is already
reduced forming Au NPs; temperature above 120 oC is necessary to finally reduced residual
metal ions in solution and/or promote the growth/dissolution of small nanoparticles; above
~195oC the smoothly increase of intensity indicates a more extensive incorporation of Cu into
the Au NPs. It is important noting that the spectra intensities obtained at region (t3) and (t4)
matched well with those ones reported for both bulk Au foil and Au0.75Cu0.5 alloy,
respectively.
The interpretation of the reduction pattern of Cu(II) species, Figure 3.4b,was not as
clear due to the large amount of oxidized species that remained in solution. An attempt to
interpret the variation was made by looking at two energies, 8981 eV (close to the pre-peak
region of Cu(I)/Cu(0)) and 8998 eV (Cu(II) white line). At low temperatures (~40 oC), in the
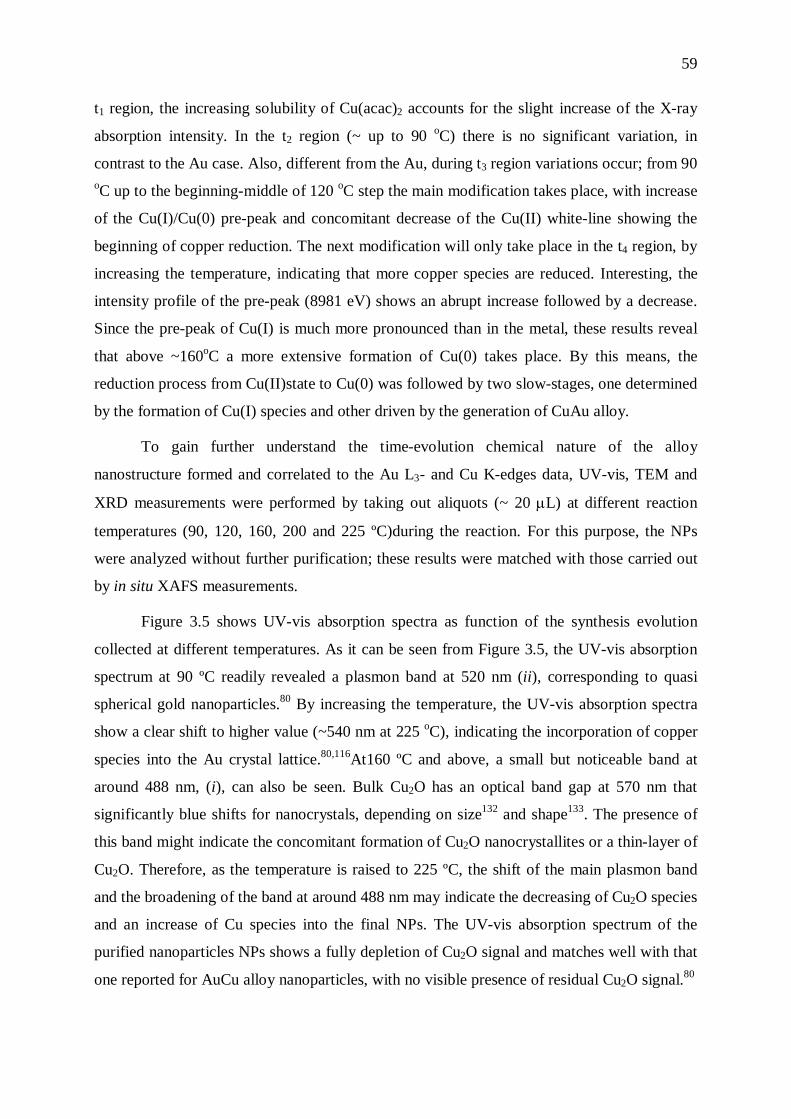
59
t1 region, the increasing solubility of Cu(acac)2 accounts for the slight increase of the X-ray
absorption intensity. In the t2 region (~ up to 90 oC) there is no significant variation, in
contrast to the Au case. Also, different from the Au, during t3 region variations occur; from 90 oC up to the beginning-middle of 120 oC step the main modification takes place, with increase
of the Cu(I)/Cu(0) pre-peak and concomitant decrease of the Cu(II) white-line showing the
beginning of copper reduction. The next modification will only take place in the t4 region, by
increasing the temperature, indicating that more copper species are reduced. Interesting, the
intensity profile of the pre-peak (8981 eV) shows an abrupt increase followed by a decrease.
Since the pre-peak of Cu(I) is much more pronounced than in the metal, these results reveal
that above ~160oC a more extensive formation of Cu(0) takes place. By this means, the
reduction process from Cu(II)state to Cu(0) was followed by two slow-stages, one determined
by the formation of Cu(I) species and other driven by the generation of CuAu alloy.
To gain further understand the time-evolution chemical nature of the alloy
nanostructure formed and correlated to the Au L3- and Cu K-edges data, UV-vis, TEM and
XRD measurements were performed by taking out aliquots (~ 20 L) at different reaction
temperatures (90, 120, 160, 200 and 225 ºC)during the reaction. For this purpose, the NPs
were analyzed without further purification; these results were matched with those carried out
by in situ XAFS measurements.
Figure 3.5 shows UV-vis absorption spectra as function of the synthesis evolution
collected at different temperatures. As it can be seen from Figure 3.5, the UV-vis absorption
spectrum at 90 ºC readily revealed a plasmon band at 520 nm (ii), corresponding to quasi
spherical gold nanoparticles.80 By increasing the temperature, the UV-vis absorption spectra
show a clear shift to higher value (~540 nm at 225 oC), indicating the incorporation of copper
species into the Au crystal lattice.80,116At160 ºC and above, a small but noticeable band at
around 488 nm, (i), can also be seen. Bulk Cu2O has an optical band gap at 570 nm that
significantly blue shifts for nanocrystals, depending on size132 and shape133. The presence of
this band might indicate the concomitant formation of Cu2O nanocrystallites or a thin-layer of
Cu2O. Therefore, as the temperature is raised to 225 ºC, the shift of the main plasmon band
and the broadening of the band at around 488 nm may indicate the decreasing of Cu2O species
and an increase of Cu species into the final NPs. The UV-vis absorption spectrum of the
purified nanoparticles NPs shows a fully depletion of Cu2O signal and matches well with that
one reported for AuCu alloy nanoparticles, with no visible presence of residual Cu2O signal.80

60
450 500 550 600 650 700
purified NPs
225 oC
200 oC
160 oC
120 oC
ii iii
Nor
mal
ized
abs
orpt
ion
Wavelenght (nm)
i
90 oC
Figure 3.5: UV-Vis spectra evolution during the synthesis of Au0.75Cu0.25 NPs. NPs spectrum
obtained after purification was inserted for comparison. The lines are guide to the eyes
indicating the center absorption bands for Cu2O (i), Au (ii), and AuCu (iii) NPs. An offset
was applied to all spectra for sake of clarity.
The UV-Vis results further confirm that the growth of bimetallic CuAu NPs is guided
by multi-stages; firstly the Au NPs formation, followed by the Cu2O formation, and then the
incorporation of Cu species into the Au crystal lattice. This trend is in agreement with those
ones earlier observed by time-resolved in situ XAFS measurements.
Figure 3.6a,b display diameter distribution histograms during the synthesis evolution.
A set of representatives TEM images is shown in Figure B5. Most of nanoparticles are
spherical in shape and well-formed nanoparticles, with mean diameter of 11.2 ± 1.2 nm can
be already seen at 70 oC (Table B1), and increase up to 13.8 ± 1.8 nm at 225°C. At
intermediates temperatures the size is around 14 nm, considering the error associated to these
measurements.

61
6 8 10 12 14 16 18 200
70
140
Diameter (nm)
70°C11.2±1.2 nm
120°C_final13.2±1.2 nm
160°C14.5±0.9 nm
225°C_final13.8±1.8 nm
6 8 10 12 14 16 18 200
306090
Num
ber o
f par
ticle
s
6 8 10 12 14 16 18 200
10
20
6 8 10 12 14 16 18 2005
101520
Figure 3.6: Diameter distribution histograms showing the evolution of synthesis obtained at
70, 120, 160, and 225 ºC.
Figure 3.7 shows the temporal evolution of the synthesized bimetallic AuCu NPs at
different temperature (90, 120, 160 and 225 ºC) by XRD measurements. The XRD pattern
confirms the formation of Au NPs at low-temperature (90ºC), since the peak positions
relatively matched with that one for bulk Au pattern. This result is much plausible with UV-
Vis data and further confirms the observation obtained by XAFS measurements at the Au L3-
edge. After aging for 30 min at 225 ºC a noticeable shift to higher 2 values in the peak
positions is observed. This implies that Cu species are incorporated into Au crystal lattice,
shortening Au-Au bond distance due to the formation of Cu-Au bonding.
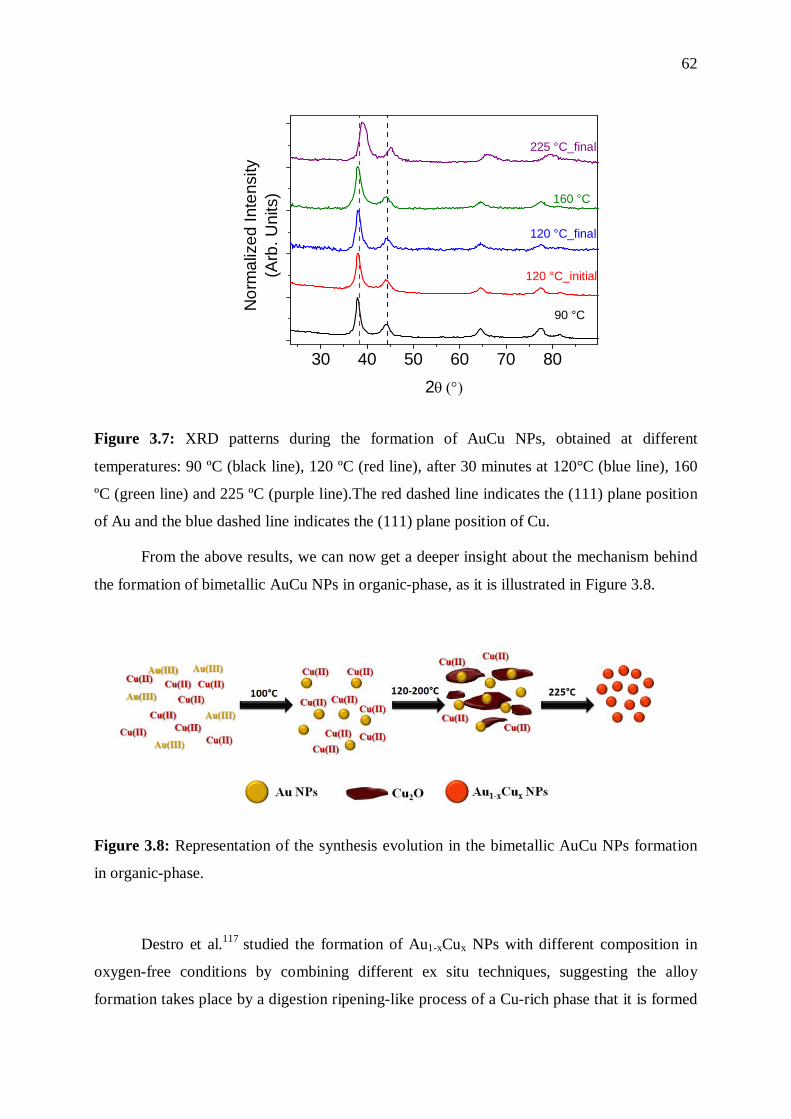
62
30 40 50 60 70 80
225 °C_final
160 °C
120 °C_final
120 °C_initial
Nor
mal
ized
Inte
nsity
(Arb
. Uni
ts)
2
90 °C
Figure 3.7: XRD patterns during the formation of AuCu NPs, obtained at different
temperatures: 90 ºC (black line), 120 ºC (red line), after 30 minutes at 120°C (blue line), 160
ºC (green line) and 225 ºC (purple line).The red dashed line indicates the (111) plane position
of Au and the blue dashed line indicates the (111) plane position of Cu.
From the above results, we can now get a deeper insight about the mechanism behind
the formation of bimetallic AuCu NPs in organic-phase, as it is illustrated in Figure 3.8.
Figure 3.8: Representation of the synthesis evolution in the bimetallic AuCu NPs formation
in organic-phase.
Destro et al.117 studied the formation of Au1-xCux NPs with different composition in
oxygen-free conditions by combining different ex situ techniques, suggesting the alloy
formation takes place by a digestion ripening-like process of a Cu-rich phase that it is formed
63
together with initial Au NPs. Continuing from this investigation, herein we demonstrate the
Cu intermediate phase (CuOx species) incorporates into the Au NPs through a solid state
diffusion mechanism at a metallic gold/copper-oxide-rich interface. In situ XAFS clearly
shows that the Au precursor is mostly reduced when the temperature reaches 90 0C, releasing
Au NPs with sizes close to the final alloy NPs. Meanwhile, Cu(II) species start to reduce only
above 90oC forming Cu(I)/Cu(0) species as an intermediate step. These species are not
detected by XRD but UV-Vis spectra suggest the formation of Cu2O species at these early
stages. Only above 160 oC it is possible to observe by in situ XAFS a modification on Au and
Cu profile that can be related to the incorporation of Cu species into the Au nanoparticles pre-
formed at the first step.
In summa, these results indicates that the formation of Cu2O species (nuclei or
clusters) and, consequently, their diffusion from Au NPs surface towards inner layers appears
to be the driving force for the generation of a bimetallic AuCu nanostructure in organic-phase.
Probably, there are enough thermal energy at higher temperature for supplying both the
diffusion of solid-structures at nanoscale and the generation of bimetallic nanostructures one,
as the AuCu NPs. These results also are in agreement with recently study reported on the
formation of intermetallic AuCu NPs from copper ions diffusion route into gold-seed at high
temperature.104
Therefore, we demonstrate that employing a time-resolved mapping by in situ XAFS
analysis from fundamental chemical processes during the bimetallic nanostructures formation
can be an interesting tool, not only for controlled-chemical synthesis but also applied-science
of the nanostructured materials, bringing useful information for scientists to design novel
bimetallic nanoparticles with well-optimized proprieties.
3.4 Conclusions
In the present contribution, we have reported the time-resolved evolution of formation
of colloidal gold-cooper nanoparticles using in situ XAFS spectroscopy. Characterization data
reveals an intermediate stage during the formation of bimetallic AuCu nanoparticles in
organic-phase, involving the diffusion of the Cu species into the Au crystal lattice upon
heating to a specific temperature. The UV-vis, TEM, and XRD measurements further
confirmed that the formation of bimetallic AuCu NPs occurred by multi-stages, including the
initial formation of Au NPs, followed by the diffusion of copper species (Cu2O) from the Au

64
NPs surface to their inner lattice, which appears to be the driving force for the generation of a
bimetallic AuCu nanostructure in organic-phase. The presented results provide more
information for designing one-pot synthesis of bimetallic nanoparticles, thus manipulating
monometallic species diffusion processes, for example, by turning reaction time and
temperature plateau.
Since other bimetallic alloys of paramount importance can be synthesized by a similar
protocol in organic-phase, we believe this setup could be extended to build an understanding
about the processes involved in the initial events of growing and nucleation during the
formation of a wide range of bimetallic nanostructures.

65
Chapter 4
Incorporation of AuCu nanoparticles on silica: Studies about the stability of
nanoparticles and the application in CO oxidation reaction
The content of this chapter is an adaptation of the article
entitled “AuCu alloy nanoparticles supported on SiO2:
Impact of redox pretreatments in the catalyst performance in
CO oxidation” by Priscila Destro; Sergio Marras; Liberato
Manna; Massimo Colombo and Daniela Zanchet accepted to
Catalysis Today in August 2016.
Reference: http://dx.doi.org/10.1016/j.cattod.2016.08.003
My contribution to this work was the synthesis and of AuCu
nanoparticles and AuCu supported on SiO2, the XRD, TEM,
and ICP characterizations and writing the paper for
publication.

66
4.1 Introduction
Metallic nanoparticles (NPs) are interesting materials that can present strategic
properties of interest in a large variety of applications. The impressive improvements made in
the synthetic methods in the last 30 years have permitted an easy access to high quality
samples of metal NPs for a large number of groups, working in different fields. In this
context, a significant contribution was made by the colloidal methods, in which the use of
protective agents and easy handling facilitates the use of the NPs. 26
In catalysis, the accurate control on size, shape, structure and composition achieved by
colloidal NPs have been used to address the complex interplay of different factors, such as
support effect, metal NPs size, metal-oxide interface among others134–138. In several cases, this
high control and stability of the colloidal NPs are originated by the use of organic capping
agents that form a protective layer on the metallic surface which prevents the aggregation of
the NPs and directly participate in the nucleation and grow mechanism. Ligands with
functional groups (i.e. amines, phosphines, thiols, carboxylic acids), which bind to the metal
surface and nonpolar tails that provides steric stabilization have been largely used in colloidal
synthesis of metal NPs.4,138.
The use of colloidal NPs in catalysis has significantly contributed to understand
fundamental aspects in several reactions.9,19,90 In the case of bimetallic NPs, the colloidal
approach is particularly promising, since it enables a fine control of NPs composition and
homogeneity.48,50 In addition, by using preformed metallic NPs supported on metallic oxides
(i.e. silica, alumina, titania, ceria, etc.) it is possible to control and stabilize the metal phase
prior the deposition on the support, which allows a greater stability of the metallic phase, and
the control of activity and selectivity of the catalyst. 44,140
Nevertheless, one of the main challenges in the case of supported catalysts produced
from colloidal NPs is the removal of the organic layer that covers the metallic phase. Their
presence usually blocks the active sites and thus requires an additional step to activate the
catalyst, in which the ligands have to be removed without causing sintering or undesired
modification of the metal NPs.141–143In particular for the case of bimetallic NPs, such as AuCu
NPs, the conditions required to remove the ligands may induce dealloying, changing
significantly the NPs properties.
Several methods have been presented in the literature, such as oxidation by ozone and
UV radiation144–146, heat treatments in an oxidizing atmosphere and redox cycling at mild
67
temperature 141,147. These procedures may induce alterations in the metal NPs, such as
sintering, oxidation, migration on the support surface, etc., which has to be evaluated with
great care to not irreversibly modify the NPs. In general, mild temperatures (< 400oC) are
used 148,149 but Cargnello et al. recently showed that a fast treatment at high temperatures (500
–700oC) can also have a similar effect, preserving the NPs.149
Therefore, understanding the different aspects involved in the activation of colloidal
NPs for catalytic applications is of fundamental importance. 151,152 In addition to the presence
of capping ligands on the metallic surface, much less understood is the impact and mechanism
of removal of other contaminants that may be present in the synthesis medium and that are not
fully eliminated during the purification steps, such as counter ions and other residues153. In
conventional methods of catalyst preparation, such as wet and dry impregnation of metal
precursors, this is much better understood. An important case is the presence of residual
chlorine from the metallic precursors that can block active sites by different mechanisms and
thus interfere in the catalyst performance.154,155
Within this framework, the aim of this work is to evaluate the effect of redox
pretreatments in the activation and CO oxidation catalytic activity of SiO2 supported AuCu
colloidal NPs. The AuCu system has been indeed reported as one of the most promising
metallic system in CO oxidation in which the properties are much superior than the
monometallic Au and Cu phases, especially in CO oxidation. 156
4.2 Experimentalsession
4.2.1Chemicals and materials
HAuCl4.3H2O (99%) and Cu(acac)2 (99%) were used as metal precursors. Oleylamine
(Oley, 70%) and oleic acid (OlAc, 90%) were used as protective agents. 1,2-hexadecanediol
(90%) was used as reducing agent and 1-octadecene (1-ODE, 90%) as solvent. All reactants
were purchased from Sigma-Aldrich and used without further purification. Silica AEROSIL®
380(BET surface area of 350-410 m2/g) was purchased from Evonik Industries.
4.2.2 Synthesis of bimetallic copper-gold NPs
The synthesis of bimetallic AuCu NPs was adapted from the literature72 and described
in detail by Destro et al.117 Briefly, 45 mg HAuCl4.3H2O and 30 mg of Cu(acac)2 (molar ratio
Au:Cu 1:1) were added to a three-necked round-bottom flask containing 5 mL of 1-ODE, 800
L of OlAc, 600 L of Oley and 100 mg of 1,2-hexadecanediol. The mixture was

68
magnetically stirred at room temperature under vacuum for 30 min, generating a green
solution. The mixture was heated up under vacuum up to 120 ºC. After holding at 120 ºC for
30 min, the solution was heated at about 200oC, N2 was fed to the system and the system was
heated up to 225°C, kept at this temperature for 30 min. The final composition using these
synthesis parameters was Au0.75Cu0.25, determined by Inductively Coupled Plasma Optical
Emission Spectroscopy (ICP) using an iCAP 6000 Thermo Scientific spectrometer (Cu at% of
24,89±0,26%).After purification, a given amount of Au0.75Cu0.25 NPs were dispersed in 5 mL
of hexane/15 mL of toluene and left in contact with SiO2 support at room temperature and
under stirring for 12 h. After this period, the solvent became clear indicating that most of the
Au0.75Cu0.25 NPs impregnated the SiO2 support. The material was washed 3 times using
hexane and centrifuged at 4000 rpm for 10 min. After the successive washes the material was
left overnight at 80 °C to dry. Elemental analysis of the Au0.75Cu0.25/SiO2 catalyst gave a total
metal loading of 1.93±0.20 wt%.
4.2.3 CatalyticTests
Catalytic activity data for CO oxidation were collected using a micro reactor system
(internal diameter = 6 mm) coupled with a NDIR analyzer (ABB Uras 26)for the continuous
measurement of CO and CO2. The feed gas consisted of a mixture of 1% v/v CO and 6% v/v
O2 balanced with He with a flow rate of 80 Ncc/min corresponding to a gas hourly space
velocity (GHSV) of 3000000 Ncc/h (g of (Au + Cu)). Once loaded in the reactor, the catalyst
was initially activated at 350 °C for 10 h in 6% v/v O2 in He to remove the organic ligands
present on the NPs surface. Independent thermogravimetric analysis showed that weight loss
due to organic ligand removal was completed at 350°C. Each catalytic test cycle was
performed at constant flow rate and inlet gas composition. For each cycle the reactor was
heated from room temperature to 300°C with a heating rate of 2 °C/min, kept at 300 °C for 30
min, then cooled to 100 °C with the same rate and kept at this temperature for 30 min. Before
each cycle the sample was usually pretreated for 1 h at 350 °C either in an oxidizing (6% v/v
O2, balance He)or in a reducing (5% v/v H2, balance He) atmosphere. Where not specified, no
pretreatment was performed. In this case, a new test cycle was started immediately after the
conclusion of the previous one, without changing the gas composition. The heating rate used
in activation, reducing, and oxidizing pretreatments was set to 5 °C/min.

69
4.2.4 Characterization
Overview bright-field transmission electron microscopy (BF-TEM) analyses were
carried out using a JEOL JEM-1011 instrument (thermionic W source, 100 kV high tension).
HRSEM-EDX analyses were carried out using a JEOL JSM-7500FA instrument,
equipped with an Oxford X-max LN2-free SDD, with 80 mm2 of sensor active area and 129
eV of energy resolution at 5.9 keV (MnK). The Extended Pouchou and Pichoir (XPP) matrix
correction algorithm included in the Oxford AZtec software was used to analyze the data. In
case of Au0.75Cu0.25NPs colloidal solution, the sample was prepared by dropcasting the alloy
NCs solution on an ultra-smooth silicon wafer. In case of Au0.75Cu0.25/SiO2, few mg of
catalyst powder were dispersed in isopropanol by sonication, then the suspension was
dropcasted on an ultra-smooth silicon wafer.
X-ray diffraction (XRD) measurements were performed using a RigakuSmartLab X-
ray diffractometer equipped with a 9 kW Cu Kα (= 1.542 Å) rotating anode, operating at 40
kV and 150 mA. XRD data on colloidal NPs were collected using a zero diffraction silicon
substrate while a glass sample holder was used for the powdered sample. The diffraction
patterns were collected at room temperature over an angular range of 20−90°, with a step size
of 0.05°. XRD data analysis was carried out using PDXL 2.1 software from Rigaku. XRD
data were used to confirm the Au0.75Cu0.25 alloy composition using the equation proposed by
Okamoto et al.33
4.3 Results
Figure 4.1a shows a representative BF-TEM image of the Au0.75Cu0.25/SiO2 confirming
that the synthesized NPs are homogeneous and well dispersed on the support (Figure 4.1a).
The XRD patterns of the colloidal Au0.75Cu0.25NPs and Au0.75Cu0.25/SiO2 catalyst are shown in
Figure 4.1b.According to the Figure 4.1 it is possible to observe that there is no significant
modification of the alloy NPs composition in the catalyst. The analysis of peak positions
confirmed that the average composition of the alloy NPs is Au0.75Cu0.25. It is also possible to
note that the peaks width are maintained, confirming that there was no sintering after the
incorporation.

70
Figure 4.1: (a) BF-TEM image of as prepared Au0.75Cu0.25 /SiO2 catalyst and (b) XRD
patterns of Au0.75Cu0.25 colloidal NPs and Au0.75Cu0.25/SiO2.
The Au0.75Cu0.25/SiO2 sample was used as catalyst in CO oxidation. As described in
the Experimental section, the sample underwent a series of cycles in order to evaluate the
impact of the pretreatments in the performance of the catalyst. The test protocol followed in
the first set of experiments is shown in Figure 4.2a. Firstly, an activation step is performed in
oxidative atmosphere. This treatment was necessary to burn off from the catalyst surface the
organic ligands (i.e. Oley and/or OlAc) that acted as stabilizing agents during the colloidal
synthesis. After the activation, the catalytic activity in CO oxidation is evaluated (Run #1) and
shown as the black curve in Figure 4.2b.The catalyst is inactive below 220 °C; then, the
activity slowly increases with temperature and the conversion reaches about 16% at 300 °C.
During the cooling phase the activity is slightly higher but still significantly limited. The
sample is then subjected to an oxidative treatment and the reaction cycle repeated (Run #2,
Figure 4.2b). The CO conversion resulted is slightly higher compared to the first reaction
cycle, approaching 19 % at 300°C. Repeating again the same oxidative pretreatment resulted
in a further enhancement of the activity, with a maximum of about 23% at 300°C (Run #3, in
Figure 4.2b). At the end of the Run#3, two more reaction cycles (Run # 4 and #5) are
performed without any pretreatment. These two tests results in a different trend in which the
activity during the heating phase is higher compared to the one measured during the cooling
transient. Higher CO conversions are also achieved, namely 30 % at 300 °C in Run #4 and
34% at 275 °C in case Run #5. Despite this different trend during the heating and cooling
transients when no pretreatments were performed, the main information from the data
reported in Figure 4.2b is represented by the non-reproducibility of the catalyst performance
among the different reaction cycles, even when performing the same pretreatment.

71
Figure 4.2: (a) Test protocol for Runs #1 to #5. Grey segments represent the pre-pretreatment
in oxidizing atmosphere, blue segment the reaction cycle, (b) CO conversion over
Au0.75Cu0.25/SiO2 during the test protocol depicted in (a).
The same sample was then exposed to a reducing atmosphere at high temperature
(Figure 4.3). The following reaction cycle resulted in a dramatic change of catalyst activity
compared to the previous tests (Run # 6, Figure 4.3b). At 75°C the CO conversion started to
increase and finally reached 100% when approaching 300°C. The activity during the cooling
cycle resulted even higher if compared to the heating transient (e.g. at 200°C we measured
66% CO conversion during the cooling transient against 45% measured during the heating
phase). The reducing pretreatment was repeated, followed by a reaction cycle (Run # 7,
Figure 4.3b) resulting in the same CO conversion profile. The same result was obtained in
Run #8. When no pre-treatment was applied before the reaction cycle (Runs # 9 and 10,
Figure 4.3b), the activity substantially overlapped with the previous run and no hysteresis
between the heating and cooling transients were observed.

72
Figure 4.3: Test protocol for Runs #6 to #10. Red segments represent the pretreatment in
reducing atmosphere, blue segment the reaction cycle, (b) CO conversion over
Au0.75Cu0.25/SiO2 during the test protocol depicted in (a).
After these series of tests, the sample underwent again a sequence of reaction cycles,
each preceded by an oxidative treatment (Runs #11 to 13, Figure 4.4a). The CO conversion
measured during the reaction cycles is dramatically higher if compared to the data reported in
Figure 4.3, approaching 100% at 300°C. Noteworthy, the three tests resulted in the same
activity profile, indicating that the activity data are reproducible and the catalyst approached a
stable behavior. The same situation is observed if no pretreatment is performed: four reaction
cycles (Runs #14 to 17) results in the same CO conversion profile as a function of
temperature, as reported in Figure 4.4b.

73
Figure 4.4: CO conversion over Au0.75Cu0.25/SiO2 during (a) Runs #11 to #13 performed after
pretreatment in oxidizing atmosphere, (b) Runs #14 to #17 performed without any
pretreatment.
The catalytic activity data presented in Figures 4.2 to 4.4 clearly point out the pivotal
role of a reducing treatment in order to obtain a stable and considerable catalytic activity over
the tested Au0.75Cu0.25/SiO2 catalyst. It is evident that the oxidative pretreatment, necessary to
burn off the organic ligands from the NPs surface, is not sufficient to fully activate the
catalyst and bring to a stable performance. On the opposite, one reducing treatment is enough
to improve the activity and provide stable performances. Impressively, the CO conversion
profiles measured in all the reaction cycles performed after the first exposure to a reducing
treatment do not exhibit any memory of the previous reaction cycles and pretreatment history:
the results were influenced exclusively by the pretreatment applied just before the test cycle.
These experimental evidences likely suggest that the first exposure to a reducing
environment caused an irreversible change on the catalyst surface that dramatically affected
the performances of the Au0.75Cu0.25 /SiO2catalyst.

74
In order to shed light on this phenomenon, the Au0.75Cu0.25/SiO2 sample is
characterized by means of different techniques. We firstly measure the size of the Au0.75Cu0.25
NPs on the as prepared catalyst (i.e. FRESH) and compare it with the size of the NPs after the
initial oxidative activation (i.e. OXI) and after a reducing treatment (i.e. RED). Graphical
evaluation of NPs size from TEM images shows no statistically relevant difference in the
three samples (Figure 4.5).
Figure 4.5: Size distribution histograms of Au0.75Cu0.25/SiO2 of (a) as prepared catalyst, (b)
after activation in oxidative atmosphere and (c) after first reduction.
We further characterize the same samples by means of ICP and SEM-EDX, to verify
their chemical composition. As control experiments we characterize with the same technique
Au0.75Cu0.25 colloidal NPs and the bare SiO2 support. Results of quantitative SEM-EDX
analyses are summarized in Table 4.1.
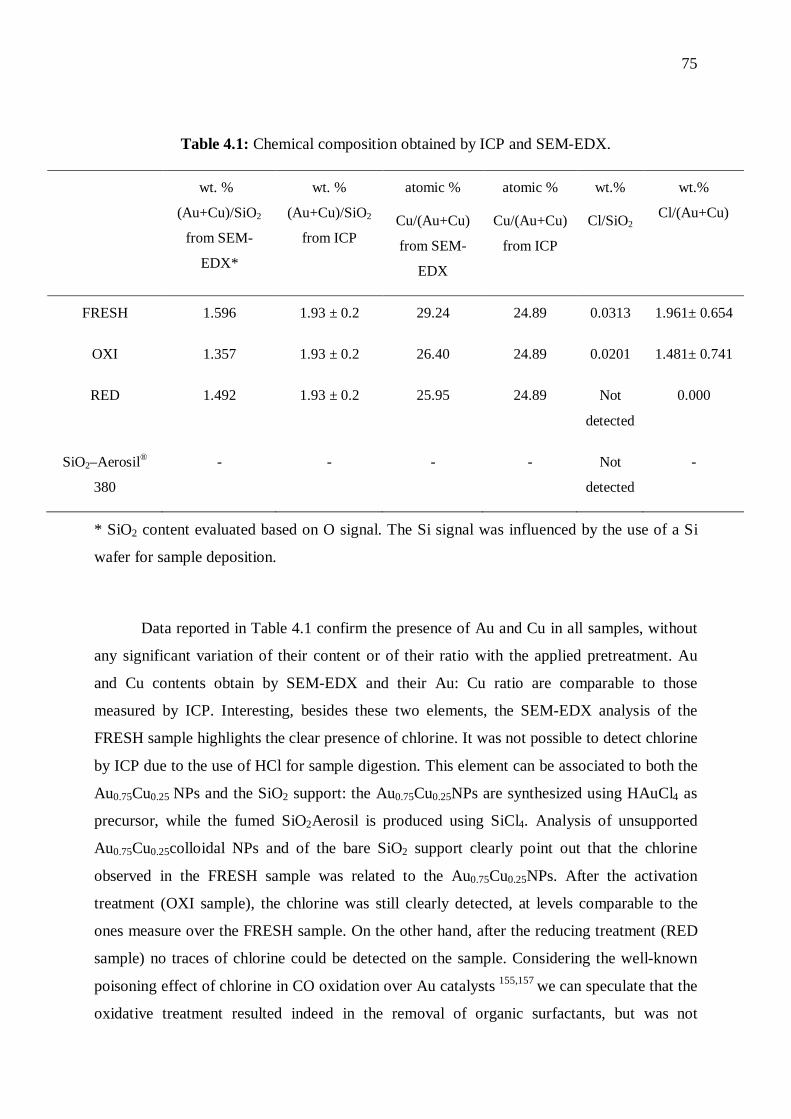
75
Table 4.1: Chemical composition obtained by ICP and SEM-EDX.
wt. %
(Au+Cu)/SiO2
from SEM-
EDX*
wt. %
(Au+Cu)/SiO2
from ICP
atomic %
Cu/(Au+Cu)
from SEM-
EDX
atomic %
Cu/(Au+Cu)
from ICP
wt.%
Cl/SiO2
wt.%
Cl/(Au+Cu)
FRESH 1.596 1.93 ± 0.2 29.24 24.89 0.0313 1.961± 0.654
OXI 1.357 1.93 ± 0.2 26.40 24.89 0.0201 1.481± 0.741
RED 1.492 1.93 ± 0.2 25.95 24.89 Not
detected
0.000
SiO2–Aerosil®
380
- - - - Not
detected
-
* SiO2 content evaluated based on O signal. The Si signal was influenced by the use of a Si
wafer for sample deposition.
Data reported in Table 4.1 confirm the presence of Au and Cu in all samples, without
any significant variation of their content or of their ratio with the applied pretreatment. Au
and Cu contents obtain by SEM-EDX and their Au: Cu ratio are comparable to those
measured by ICP. Interesting, besides these two elements, the SEM-EDX analysis of the
FRESH sample highlights the clear presence of chlorine. It was not possible to detect chlorine
by ICP due to the use of HCl for sample digestion. This element can be associated to both the
Au0.75Cu0.25 NPs and the SiO2 support: the Au0.75Cu0.25NPs are synthesized using HAuCl4 as
precursor, while the fumed SiO2Aerosil is produced using SiCl4. Analysis of unsupported
Au0.75Cu0.25colloidal NPs and of the bare SiO2 support clearly point out that the chlorine
observed in the FRESH sample was related to the Au0.75Cu0.25NPs. After the activation
treatment (OXI sample), the chlorine was still clearly detected, at levels comparable to the
ones measure over the FRESH sample. On the other hand, after the reducing treatment (RED
sample) no traces of chlorine could be detected on the sample. Considering the well-known
poisoning effect of chlorine in CO oxidation over Au catalysts 155,157 we can speculate that the
oxidative treatment resulted indeed in the removal of organic surfactants, but was not

76
effective for the removal of residual chlorine from the surface of the Au0.75Cu0.25NPs. On the
opposite, the high temperature treatment in a reducing atmosphere effectively removed the
chlorine from the Au0.75Cu0.25NPs, thus enhancing significantly the catalytic performances
and leading to a stable activity.
4.4 Discussion
The catalytic performance of the Au0.75Cu0.25/SiO2 after been submitted to different
pretreatments and reactions show a very intriguing and interesting behavior. Firstly, the CO
conversion achieved after the activation and the following oxidative treatments is typical low,
and slowly improves cycle after cycle (Figure 4.2). This could indicate, for example that
ligand residues remain firmly attached to the Au0.75Cu0.25 NPs surface and are slowly released
in the several cycles. However, the more significant increase in the CO conversion obtained
during subsequent reactions, without oxidative treatments in between, does not agree with this
explanation: the reaction atmosphere is indeed less oxidative than the oxidizing pretreatment
and thus should be less effective in the removal of residual ligands. This is further
corroborated by the remarkable effect of the reductive pretreatment, which should not have a
huge impact in removing residual ligands at these mild temperatures. Even more impressive is
the stability achieved by the catalyst after being submitted to the reducing treatment.
The detail characterization of the catalysts showed that the size distribution of the NPs
are not affected in this whole processes. The chemical analysis, on the other hand, showed the
presence of small amounts of residual chlorine that is eliminated only by the reductive
pretreatment.
The presence of chlorine in the colloidal NPs and the FRESH catalyst suggests that the
purification steps performed in the synthesis of the NPs117 were not able to successfully
remove it from the surface of the NPs. In fact, the percentage of chlorine detected by SEM-
EDX is of the order of metal atoms percentage at the surface of the NPs, suggesting that the
surface of the NPs is significantly covered by chlorine species. This result was quite
unexpected since the NPs go through several precipitation- redispersion before being
deposited on the SiO2 support. However, it is important to remark that the synthesis and
purification is performed in organic medium, with a much smaller affinity by chlorinated
species than aqueous medium.
77
Several authors have reported the poisoning effect of chlorine in catalysts, but the
mechanism is not totally clear. There are different mechanisms described in the literature to
explain such a poisoning effect. In the case of Au catalysts, Ho et al.155 proposed that the
presence of chloride ions can block electrostatically the metal surface, preventing the
reactants to access the active sites, and favor agglomeration. In other systems, the presence of
an [MxClyOz] complex has been described especially for Pd-Pt systems using chlorinated
metal precursors158 Gracia et al. 154 described interesting results regarding the chlorine
poisoning on platinum supported catalysts and systematically observed the effect of the
pretreatment for oxidation reactions. They proposed that the chlorinated species, initially on
the surface, can form a complex phase described as [Mx(OH)yClz] or [MxOyClz] after the
oxidation. It means that, even if the organic ligands on the surface are removed, after the
oxidative treatment this chlorinated phase can block the active metal sites. After a reductive
treatment, the metallic sites that are available can adsorb dissociative H2, which reacts with
the [MxOyClz] complex forming HCl that can migrate to the support or desorbs as a gas,
removing the Cl from the surface. This may be one possible mechanism behind the
considerable increase of the catalytic activity that we detected after the reductive
pretreatment.
It is important, however, to consider that the presence of chlorinate species is not the
only mechanism that can explain the increase of the CO conversion until the catalyst achieved
a stable state. It is important to highlight that after the oxidative treatment, the AuCu NPs
undergo a dealloying process, in which the less noble metal, in this case Cu, segregates
forming CuOx species at the interface with the support.95 The formation of CuOx species may
facilitate the dispersion and removal of Cl species that were previously on the metal surface
of the AuCu NPs. Najafishirtari et al.90 described the influence of different pretreatments on
an AuCu/Al2O3 catalyst and observed that the activation under oxidizing atmosphere removes
the organic ligand and induces Cu segregation, resulting in the formation of CuOx species
dispersed on the support. After a reductive treatment these CuOx species can be reduced and
realloy. This means that by exposing the catalyst to different atmospheres it is possible to
generate a new chemical environment on the surface of the catalyst, which can directly impact
the catalytic performances. In this case, a significant role of the support is most likely
expected and should be also investigated.
Despite this complex process, one of the most interesting results found in this system
is the stability achieved after the first reductive treatment. Once stable, the performance

78
depends only on the last pretreatment before the test, and remains constant even after a large
number of cycles. These results reveal that the AuCu catalyst do not exhibit a memory of the
previous reaction cycles or pretreatments, showing a remarkable stability.
4.5 Conclusion
In this work we synthesize Au0.75Cu0.25 colloidal NPs and use them to prepare a SiO2
supported catalyst characterized by a homogenous size distribution of the metallic phase. The
pretreatments performed before the catalytic oxidation of CO have a remarkable influence on
the catalytic performance. After the initial oxidative activation, the CO conversion is very low
but increases considerably after a reductive pretreatment. After that, the catalyst becomes
highly stable. This behavior can be related to the removal of Cl residue, detected on the
catalysts, by the reductive pretreatment and/or the formation of a new chemical environment
generating stable species on the surface that can improve the CO conversion. The most
interesting point to be highlighted is that after alternate oxidative/reductive pretreatments the
CO conversion is totally stable, showing that the material reaches an equilibrium state and
high activity.

79
Chapter 5
Au1-xCux supported nanoparticles applied on CO oxidation:
Insights about the support effect using in situ techniques
This chapter is an adaptation of the paper “Au1-xCux
supported nanoparticles applied on CO oxidation:
Insights about the support effect using in situ techniques”
by Priscila Destro, Tathiana M. Kokumai, Alice
Scarpellini, Liberato Manna, Massimo Colombo, Daniela
Zanchet that is under preparation.
My contribution to this work was planning the
experiments, the synthesis of AuCu nanoparticles and the
catalysts, the ex situ characterization by ICP, XRD and
BF-TEM, the planning and execution of in situ XRD and
XAFS measurements, XRD data analysis and writing the
draft for publication.

80
5.1 Introduction
Metal alloys are an extremely promising system for the application in catalysis.52,58,159 The
possibility of mixing two metals allows the modulation of their electronic properties and, by
synergism between the two metals, the properties of the resulting material are not merely an
average of the two metals involved, but a new material with distinct and innovative properties.30,32
In heterogeneous catalysts, the metal phase is supported on a matrix with high surface area 47,160
Thus, the use of supported nanoalloys becomes an interesting strategy because it permits control
of size, shape and composition of the metal phase. It is described in the literature that catalytic
supports are not just a phase where the metallic particles are deposited, but a phase that can
actively participate in the catalytic cycle.161 In many reactions the support acts by activating one of
the reagents involved, such as in oxidation reactions. In oxidation reactions, such as oxidation of
alcohols162, methane163 and carbon monoxide164,165 the support plays a fundamental role, where the
oxygen is activated on the metal/support interface. An interesting strategy of the design of new
and promissory catalysts is the application of metal alloys and, by different pretreatments, to
control the alloying/ dealloying process166,167, allowing the control of metal-oxide contact area.
Thus, the objective of this work is the deposition of AuCu nanoparticles previously synthesized by
the method colloidal on silica and alumina and, by redox pretreatments, evaluate the support role
by in situ techniques.
5.2 Experimental Session
5.2.1 Chemicals.
HAuCl4.3H2O (99%), and Cu(acac)2 (99%), Oleylamine (Oley, 70%) Oleic acid (OlAc,
90%), 1,2-hexadecanediol (90%), 1-octadecene (1-ODE, 90%). All reactants were purchased from
Sigma-Aldrich and used without further purification. Silica AEROSIL® 380 (BET surface area of
350-410 m2/g) was purchased from Evonik Industries and γ-Al2O3 from Strem Chemicals (Surface
area 190 m2/g)
5.2.2 Synthesis of bimetallic copper-gold NPs.
The synthesis of bimetallic AuCu NPs was performed as described in details by Destro et
al.117 Briefly, 45 mg HAuCl4.3H2O and 30 mg of Cu(acac)2 (molar ratio Au:Cu 1:1) were added to
a three-necked round-bottom flask containing 5 mL of 1-ODE, 800 mL of OlAc, 600 mL of Oley
and 100 mg of 1,2-hexadecanediol. The mixture was heated up under vaccum to a final
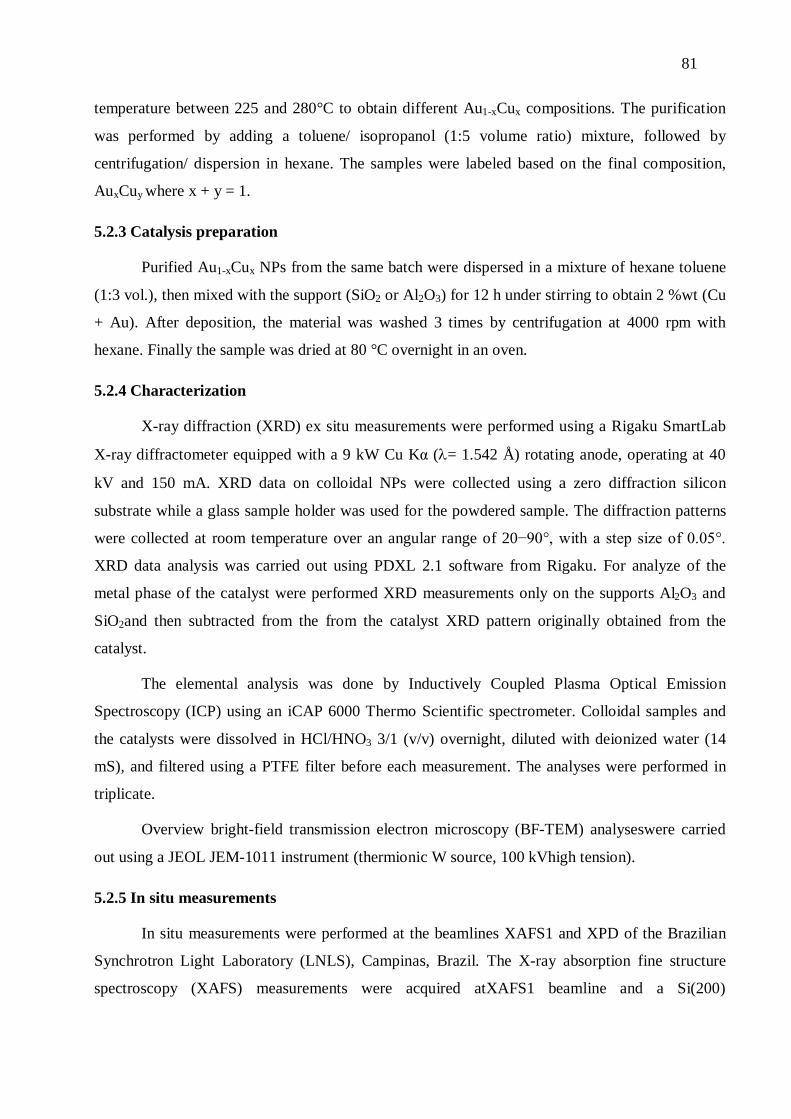
81
temperature between 225 and 280°C to obtain different Au1-xCux compositions. The purification
was performed by adding a toluene/ isopropanol (1:5 volume ratio) mixture, followed by
centrifugation/ dispersion in hexane. The samples were labeled based on the final composition,
AuxCuy where x + y = 1.
5.2.3 Catalysis preparation
Purified Au1-xCux NPs from the same batch were dispersed in a mixture of hexane toluene
(1:3 vol.), then mixed with the support (SiO2 or Al2O3) for 12 h under stirring to obtain 2 %wt (Cu
+ Au). After deposition, the material was washed 3 times by centrifugation at 4000 rpm with
hexane. Finally the sample was dried at 80 °C overnight in an oven.
5.2.4 Characterization
X-ray diffraction (XRD) ex situ measurements were performed using a Rigaku SmartLab
X-ray diffractometer equipped with a 9 kW Cu Kα (= 1.542 Å) rotating anode, operating at 40
kV and 150 mA. XRD data on colloidal NPs were collected using a zero diffraction silicon
substrate while a glass sample holder was used for the powdered sample. The diffraction patterns
were collected at room temperature over an angular range of 20−90°, with a step size of 0.05°.
XRD data analysis was carried out using PDXL 2.1 software from Rigaku. For analyze of the
metal phase of the catalyst were performed XRD measurements only on the supports Al2O3 and
SiO2and then subtracted from the from the catalyst XRD pattern originally obtained from the
catalyst.
The elemental analysis was done by Inductively Coupled Plasma Optical Emission
Spectroscopy (ICP) using an iCAP 6000 Thermo Scientific spectrometer. Colloidal samples and
the catalysts were dissolved in HCl/HNO3 3/1 (v/v) overnight, diluted with deionized water (14
mS), and filtered using a PTFE filter before each measurement. The analyses were performed in
triplicate.
Overview bright-field transmission electron microscopy (BF-TEM) analyseswere carried
out using a JEOL JEM-1011 instrument (thermionic W source, 100 kVhigh tension).
5.2.5 In situ measurements
In situ measurements were performed at the beamlines XAFS1 and XPD of the Brazilian
Synchrotron Light Laboratory (LNLS), Campinas, Brazil. The X-ray absorption fine structure
spectroscopy (XAFS) measurements were acquired atXAFS1 beamline and a Si(200)
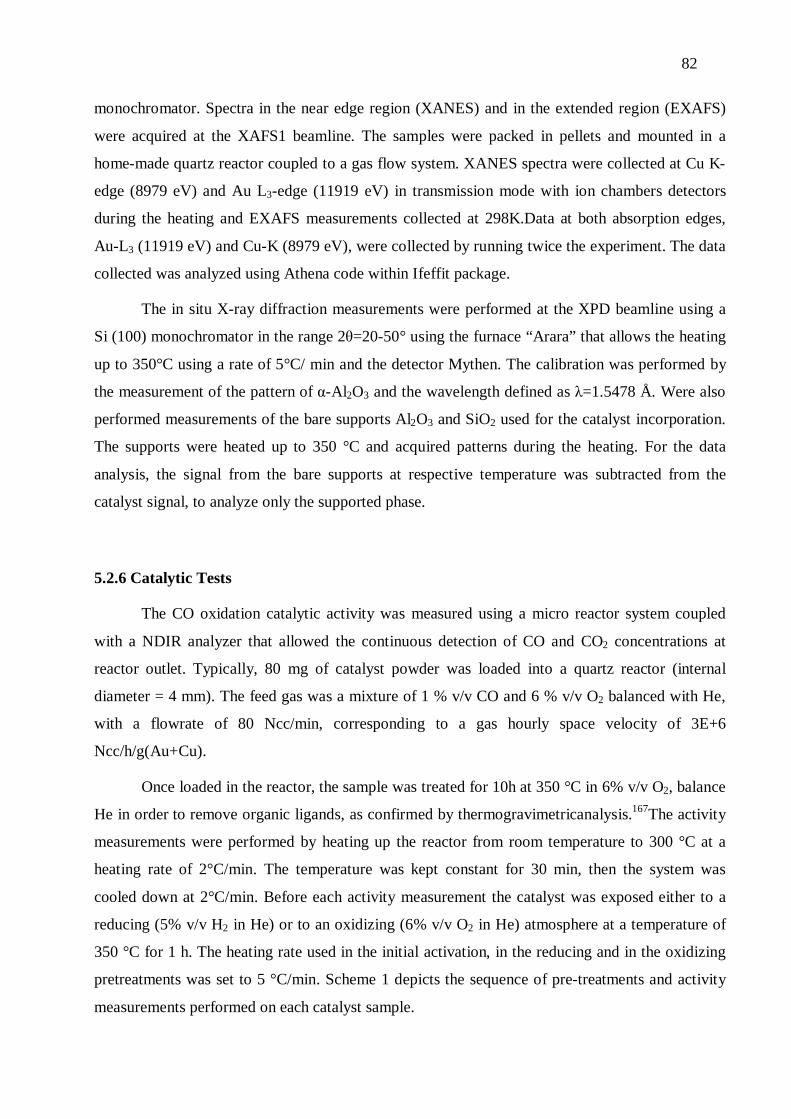
82
monochromator. Spectra in the near edge region (XANES) and in the extended region (EXAFS)
were acquired at the XAFS1 beamline. The samples were packed in pellets and mounted in a
home-made quartz reactor coupled to a gas flow system. XANES spectra were collected at Cu K-
edge (8979 eV) and Au L3-edge (11919 eV) in transmission mode with ion chambers detectors
during the heating and EXAFS measurements collected at 298K.Data at both absorption edges,
Au-L3 (11919 eV) and Cu-K (8979 eV), were collected by running twice the experiment. The data
collected was analyzed using Athena code within Ifeffit package.
The in situ X-ray diffraction measurements were performed at the XPD beamline using a
Si (100) monochromator in the range 2θ=20-50° using the furnace “Arara” that allows the heating
up to 350°C using a rate of 5°C/ min and the detector Mythen. The calibration was performed by
the measurement of the pattern of α-Al2O3 and the wavelength defined as λ=1.5478 Å. Were also
performed measurements of the bare supports Al2O3 and SiO2 used for the catalyst incorporation.
The supports were heated up to 350 °C and acquired patterns during the heating. For the data
analysis, the signal from the bare supports at respective temperature was subtracted from the
catalyst signal, to analyze only the supported phase.
5.2.6 Catalytic Tests
The CO oxidation catalytic activity was measured using a micro reactor system coupled
with a NDIR analyzer that allowed the continuous detection of CO and CO2 concentrations at
reactor outlet. Typically, 80 mg of catalyst powder was loaded into a quartz reactor (internal
diameter = 4 mm). The feed gas was a mixture of 1 % v/v CO and 6 % v/v O2 balanced with He,
with a flowrate of 80 Ncc/min, corresponding to a gas hourly space velocity of 3E+6
Ncc/h/g(Au+Cu).
Once loaded in the reactor, the sample was treated for 10h at 350 °C in 6% v/v O2, balance
He in order to remove organic ligands, as confirmed by thermogravimetricanalysis.167The activity
measurements were performed by heating up the reactor from room temperature to 300 °C at a
heating rate of 2°C/min. The temperature was kept constant for 30 min, then the system was
cooled down at 2°C/min. Before each activity measurement the catalyst was exposed either to a
reducing (5% v/v H2 in He) or to an oxidizing (6% v/v O2 in He) atmosphere at a temperature of
350 °C for 1 h. The heating rate used in the initial activation, in the reducing and in the oxidizing
pretreatments was set to 5 °C/min. Scheme 1 depicts the sequence of pre-treatments and activity
measurements performed on each catalyst sample.

83
Scheme 5.1: Catalytic test protocol followed in this work.
5.3 Results and discussion
The synthesis final temperature was adjusted to obtain colloidal NPs with different
compositions.116The final compositions were determined by ICP and confirmed by XRD (Figure
5.1). The results for three sets of NPs (Au0.75Cu0.25, Au0.60Cu0.40and Au0.50Cu0.50) are shown in
Table C1 and Figure 5.1.The composition analysis by XRD was performed considering the lattice
parameter variation related do the Au (4.07 Å) and Cu (3.61 Å) based on the Vegard´s Law32.
Figure 1 shows the XRD patterns of the colloidal NPs.
20 30 40 50 60 70 80
*
Inte
nsity
(Arb
Uni
ts)
2°
Au0.50Cu0.50
Au0.60Cu0.40
Au0.75Cu0.25
*
Figure 5.1: Diffraction patterns of Au0.75Cu0.25, Au0.60Cu0.40 and Au0.50Cu0.50 colloidal NPs. The
green dashed line indicates the peak at 2θ=38.2°related to the (111) position of Au (JCPDS no. 00-
004-0784) and the purple dashed line indicates the peak at 2θ=44.6° related to the (111) position
of Cu (JCPDS no. 00-901-3023). The red asterisks peaks in the Au0.50Cu0.50patternindicates the
(001) and (100) peaks related to the chemically ordered Au0.50Cu0.50 phase (JCPDS no. 01-071-
5026).
TEM images confirm the formation of Au1-xCuxcolloidal NPs with 14 nm size, for all
samples (Figure 5.2a and C1a,d).15 In addition, according to the TEM images it can be observed
that the Au1-xCuxNPs are preserved after incorporation in the supports and are well-dispersed on

84
the surface of the Al2O3 and SiO2 (Figures 5.2b,c and C1b,c,e,f).The total metal loading was
determined by ICP (Table S1), and was close to the 2 %wt nominal value for all supported
materials.
(a) (b) (c)
Figure 5.2: TEM images of (a) Au0.75Cu0.25colloidalNPs,(b) Au0.75Cu0.25/Al2O3and (c)
Au0.75Cu0.25/SiO2.
5.3.1 Catalytic results
Figure 5.3a-c shows the catalytic activity in CO oxidation for the alumina supported
catalysts after the oxidative and reductive pretreatments (Runs# 10 and 12 of scheme 5.1). Test
results obtained during the previous runs of the experimental protocol (see Figure C2) show that
the catalytic activity was reproducible and stable between Runs #6 and 12. Independently from the
NPs composition, the same qualitative trend was observed when changing the pre-treatment
environment. The samples pre-treated in an oxidizing atmosphere show a hysteresis between the
heating and the cooling phase of the test, with the activity being higher during the latter phase.
The reductive pre-treatment results in a reverse hysteresis, with a higher CO conversion measured
during the heating transient compared to the subsequent cooling. Exposing the sample to the
reducing atmosphere resulted in the best CO oxidation performances. Noteworthy, the activity
during the cooling phase of the experiments were substantially overlapped, independently from
the applied pre-treatment. The results of Figures 3a-c are surprisingly in line with what recently
reported by some of us. Najafishirtari et al.98 studied the effect of oxidizing or reducing pre-
treatments on the CO oxidation catalytic activity of ~ 6nm Au0.50Cu0.50 NPs supported on Al2O3.
Despite the different synthesis procedure and the significantly different size of the AuCu NPs (6
nm vs 14 nm), the qualitative effect of the pre-treatment was identical. On the other hand, the
different Cu content in the NPs affected the CO conversion level: as shown in Table 1, the
temperature at which 50% conversion is achieved resulted to be minimized (i.e. activity

85
maximized) in the case of the Au0.60Cu0.40 sample, independently from the pre-treatment and the
transient phase of the test considered.
A completely different picture was observed when the same Au1-xCux NPs were deposited
on SiO2 (Figure 5.3d-f) and subjected to the same testing protocol. In analogy with alumina, the
catalytic activity resulted to be strongly dependent from the pre-treatment atmosphere, while the
qualitative effect of the pre-treatment was independent from the Cu content in the alloy NPs.
When a stable activity was approached (see Figure C3 and related discussion), the oxidizing pre-
treatment resulted in almost the same CO conversion during both the heating and the cooling
phase of the test. A complex, “8-shaped” pattern of the CO conversion vs temperature was instead
observed after high temperature exposure to a reducing environment: at low temperature the
activity was similar to the one observed after oxidation. Then, the CO conversion increased less
markedly with temperature compared to the pre-oxidized system, resulting in lower CO
conversion values before eventually approaching 100% conversion between 200-250°C. Finally,
the activity during the cooling transient resulted to be almost overlapped with the one measured
after oxidation, in analogy with what observed for the same NPs supported on alumina. Also in
this case, the copper fraction in the starting NPs affected the CO conversion level. Table 5.2
shows how, similarly to what was observed over Al2O3, the best catalytic performances were
achieved over the Au0.60Cu0.40 sample.

86
(a) (b) (c)
(d)
(e)
(f)
Figure 5.3: Catalytic activity in CO oxidation after oxidative and reductive pretreatments for (a)
Au0.75Cu0.25/Al2O3, (b) Au0.60Cu0.40/Al2O3, (c) Au0.50Cu0.50/Al2O3,(d) Au0.75Cu0.25/SiO2, (e)
Au0.60Cu0.40/SiO2 and (f) Au0.50Cu0.50/SiO2.
Table 5.1: T50 for the Au1-xCux supported samples under CO oxidation and after being exposed to
oxidative or reductive pre-treatments.
Sample Oxidative pretreatment Reductive pretreatment
Heating phase Cooling phase Heating phase Cooling phase
Au0.75Cu0.25/Al2O3 242 °C 188 °C 163 °C 174 °C
Au0.60Cu0.40/Al2O3 199 °C 168 °C 150 °C 164 °C
Au0.50Cu0.50/Al2O3 202 °C 173 °C 150 °C 165 °C
Au0.75Cu0.25/SiO2 144 °C 147 °C 153 °C 147 °C
50 100 150 200 250 300
0102030405060708090
100
Oxidized Reduced
CO
con
vers
ion
(%)
Temperature (°C)
Au0.75Cu0.25/Al2O3
50 100 150 200 250 300
0102030405060708090
100
Oxidized Reduced
CO
con
vers
ion
(%)
Temperature (°C)
Au0.60Cu0.40/Al2O3
50 100 150 200 250 300
0102030405060708090
100
Oxidized Reduced
CO
con
vers
ion
(%)
Temperature (°C)
Au0.50Cu0.50/Al2O3
0 50 100 150 200 250 300
0102030405060708090
100
Au0.75Cu0.25/SiO2
Oxidized Reduced
CO
conv
ersi
on (%
)
Temperature (°C)0 50 100 150 200 250 300
0102030405060708090
100
Au0.60Cu0.40/SiO2
Oxidized Reduced
CO
conv
ersi
on (%
)
Temperature (°C)0 50 100 150 200 250 300
0102030405060708090
100
Au0.50Cu0.50/SiO2
Oxidized Reduced
CO
conv
ersi
on (%
)
Temperature (°C)

87
Au0.60Cu0.40/SiO2 110 °C 110°C 141 °C 116 °C
Au0.50Cu0.50/SiO2 129 °C 126°C 157 °C 126 °C
5.3.2 In situ measurements during the activation
Since a common pattern was found for all catalysts prepared using the same support,
independently of the Au:Cu ratio, a series of in situ experiments were performed with catalysts
prepared using the same batch of colloidal NPs (Au0.60Cu0.40), to understand the transformations
involved during pre-treatments and to identify the species formed during the catalytic cycles. As
mentioned before and discussed by Najafishirtari el al.98, after deposited on the support, the Au1-
xCux NPs are still capped by the organic ligands, so it is fundamental an oxidative treatment to
remove this organic layer and activate the catalyst exposing the metallic phase. Figure 5.4 shows
the in situ XRD patterns collected during the activation (Run#1) of Au0.60Cu0.40/Al2O3 and
Au0.60Cu0.40/SiO2 catalysts. The diffraction patterns presented in Figure 5.4 are obtained after
subtraction of the bare support signals, as described in the experimental section and indicated in
Figure C4.
30 35 40 45 50
350°C325°C
300°C290°C
220°C250°C
200°C150°C
100°C
Inte
nsity
(Arb
. Uni
ts)
2 (°)
25°C
Au0.70Cu0.60/Al2O3
(a)
30 35 40 45 50
Inte
nsity
(Arb
. Uni
ts.)
2 (°)
350°C
325°C300°C290°C250°C220°C200°C150°C100°C25°C
Au0.60Cu0.40/SiO2
(b)
Figure 5.4: (a) XRD patterns of Au0.60Cu0.40/Al2O3 and (b) Au0.60Cu0.40/SiO2 during the activation
(Run#1).

88
Figure 5.4 a,b shows the main (111) diffraction peak of the Au0.60Cu0.40 alloy phase at 2θ ~
40°. Comparing to the colloidal NPs (see Figure 5.1), the diffraction peaks at room temperature
become asymmetric after the incorporation of the NPs on both supports. Since the NPs sizes are
preserved after incorporation, the results suggest that the interaction with the supports surface
generates this asymmetry that seems more pronounced for the Au0.60Cu0.40/Al2O3catalyst. The
asymmetric peak can be simulated by considering the presence of two crystalline domains, with
different Cu contends. Interesting, by increasing the temperature during activation, it is clear that
the NPs go through a structural Figure C4 shows the XRD patterns and best fits using two
Gaussians in the range of 2θ=36-42° at selected temperatures.
For the Au0.60Cu0.40/Al2O3catalyst (Figure 5.4a and C5a,c), the fit obtained at 25°C
confirms that the (111) peak of the alloy can be simulated using two Gaussians, one centered at
38.9° (domain #1) and another at 40.0° (domain #2). According to the Vegard´s Law, domain #1
correspond to an Cu-poor alloy domain (6.6% of copper)and the domain#2 roughly matches the
original alloy ( 40.9% of copper). By increasing the temperature, both domains show a significant
decrease of Cu content and, at approximately 200 °C, there is only one metallic domain. At 350°C
the peak at 2θ =38.2° matches the Au metallic phase, indicating that the NPs go through a
dealloying process and at the end of the activation what remains are Au NPs and Cu species
highly dispersed on alumina. This newly formed Cu species are not detected by XRD.
Figure 5.4b shows the evolution of Au0.60Cu0.40/SiO2 during the activation. Comparing to
the behavior of on the Au0.60Cu0.40/Al2O3, it is also possible to observe a similar profile with two
different domains that evolved to a single one during activation. In this case, the initial pattern
domain #1 corresponds to pure Au and domain #2 to roughly the original alloy composition
(36.7% of Cu). At approximately 200°C, only one domain is observed, corresponding to Au NPs.
Similar to the previous case, a dealloying process takes place with the formation of CuOx species,
not detected by XRD. Interesting, a similar temperature of dealloying was observed by Bauer et
al.76 for the Au0.50Cu0,50 NPs in silica, indicating that the composition does not seem to affect the
temperature range of dealloying. Figure C4c,d shows the evolution of Cu% in each domain for
both catalysts during the activation.
To shade light in the Cu species formed during the activation, we perform in situ X-ray
absorption measurements. Figure 5.5 shows the XANES spectra at Cu K-edge of
Au0,60Cu0,40/Al2O3, measured during activation (Run#1).

89
8900 8950 9000 9050 9100 9150 9200
0,0
0,2
0,4
0,6
0,8
1,0
1,2
Nor
mal
ized
abs
orpt
ion
Tempe
ratur
e (°C
)
Activation
350250
150
Energy (eV)
50Cu_K
Au0.60Cu0.40/Al2O3
(a)
8980 9000 9020
Nor
mal
ized
abs
orpt
ion
E nergy (eV )
C u0
350 °C_ f
200 °C
CuOCu
2O
350 °C_ i
250 °C
150 °C
R T
(b)
8900 8950 9000 9050 9100 9150 9200
0,0
0,2
0,4
0,6
0,8
1,0
1,2
Au0.60
Cu0.40
/SiO2
Energy (eV)
Nor
mal
ized
abs
orpt
ion
50150
250350
Tempe
ratur
e (°C
)
Cu_KActivation
(c)
8980 9000 9020
Nor
mal
ized
Abs
orpt
ion
Energy (eV)
Cu0
350 °C_f
200 °C
CuO
Cu2O
350 °C_i
250 °C
150 °C
RT
(d)
Figure 5.5: In situ XANES at Cu K-edge during activation of (a, b) Au0,60Cu0,40/Al2O3.and (c,d)
Au0,60Cu0,40/SiO2. The black, red, green and blue dashed lines in (b) and (d) indicate the 8980,
8993, 8997 and 9002 eV energies, respectively.
Comparing the initial spectra, at room temperature, of Au0.60Cu0.40/Al2O3 and
Au0.60Cu0.40/SiO2 with the Cu metallic standard it is possible to observe a pre-peak at
approximately 8980 eV that confirms the presence of Cu in metallic state. The attenuation and
shift of the features at 8993 and 9002eV are expected due to the interaction with Au in the alloy131.

90
The attenuation of the feature at approximately 8997 eV indicates the presence of Cu oxidized
species presented already at room temperature. These results are in line with the XRD data,
indicating that a part of the Cu initially present in the colloidal alloy NPs is oxidized by the
contact with the support surface. A similar trend was also observed in the EXAFS oscillations (not
shown). The quantitative analysis shows the presence of Cu-Au and Cu-Cu bonds consistent with
alloy structure; however, Cu-O bonds were also observed after the deposition on both supports
(Table 5.2).
Table 5.2: First nearest-neighbor average coordination number (CN), bond lengths (R) and mean-square deviations (σ2) determined from EXAFS data collected at Cu K edge at room temperature.
Sample-condition Cu K edge
Scattering CN R (Å) σ2(Å2) R-factor
Cu foil Cu-Cu 12 2,547 0,009 0,006
Cu-Cu 6 3,605 0,009
CuO Cu-O 2 1,955 0,007 0,022
Cu-O 2 1,965 0,007
Cu-O 2 2,788 0,008
Cu-Cu 4 2,906 0,008
Au0.60Cu0.40-coloidal Cu-Cu 2,55 2,679 0,014 0,021
Cu-Au 6,08 2,682 0,014
Au0.60Cu0.40/Al2O3 Fresh Cu-O 0,97 1,943 0,007 0,030
Cu-O 0,97 1,953 0,007
Cu-Cu 2,10 2,692 0,013
Cu-Au 4,54 2,641 0,013
After activation Cu-O 1,50 1,957 0,007 0,007
Cu-O 1,50 1,967 0,007
Cu-Cu 0,35 2,913 0,013
After 1st CO Oxidation reaction Cu-O 1,39 1,953 0,007 0,007

91
Cu-O 1,39 1,963 0,007
Cu-Cu 0,22 2,987 0,013
After reducing treatment Cu-O 0,56 1,924 0,007 0,019
Cu-O 0,56 1,934 0,007
Cu-Cu 1,38 2,633 0,013
Cu-Au 4,38 2,659 0,013
Au0.60Cu0.40/SiO2
Fresh Cu-O 0,47 1,950 0,007 0,012
Cu-O 0,47 1,960 0,007
Cu-Cu 1,38 2,701 0,013
Cu-Au 5,97 2,678 0,013
After activation Cu-O 1,68 1,959 0,007 0,004
Cu-O 1,68 1,956 0,007
Cu-Cu 2,27 2,857 0,013
After 1st CO Oxidation reaction Cu-O 1,51 1,948 0,007 0,004
Cu-O 1,51 1,958 0,007
Cu-Cu 1,87 2,857 0,013
After reducing treatment Cu-Cu 3,07 2,537 0,013 0,010
Cu-Au 5,11 2,686 0,013
During activation (Figure 5.5), a clear evolution of the Cu environment can be seen. After
200°C, there is a significant modification on the XANES spectra at 8980 and 8997 eV, indicating
that a major oxidation takes place. This result also agrees with XRD data that shows that the
dealloying process is completed at this temperature. At the end of the activation process, the
XANES spectra for both catalysts resemble the CuO standard confirming that the Cu species are
totally oxidized Interesting, EXAFS analysis confirm the presence of Cu-O bonds for both
catalysts but differences were found in the Cu-Cu second shell. This contribution is much smaller
in the case of Au0.60Cu0.40/Al2O3, suggesting that CuOx species are more dispersed in the Al2O3.
Figure 5.7 shows the AuL3-edge measurements during activation for the Au0.60Cu0.40/SiO2
catalyst a metallic profile is observed during the entire process; however, it is possible to note a

92
modification on the pre-edge region regarding the dealloying of AuCu during the activation.
Around 11930 eV, it is observed a characteristic feature of the Au1-xCux alloy, related to the d-
electron transfer from Au to Cu131. The evolution to metallic Au can be easily followed during
activation.
0,0
0,2
0,4
0,6
0,8
1,0
11800 11900 12000 12100
ActivationAu L3
Temperature (°C)
350250
150
Nor
mal
ized
abs
orpt
ion
Energy (eV)
50
Au0.60Cu0.40/SiO2
11920 11930 11940 11950 119600,60
0,65
0,70
0,75
0,80
0,85
0,90
0,95
1,00
Room temperature 150 °C 250 °C 350 °C Au metallic (Standard)
Nom
aliz
ed a
bsor
ptio
n
Energy (eV)
Figure 5.6: XANES at AuL3-edge during the activation (step#1) of Au0.60Cu0.40/SiO2.
The differences between Au0.60Cu0.40/Al2O3 and Au0.60Cu0.40/SiO2 activations, in particular
the higher dispersion of the CuOx species found in the case of Au0.60Cu0.40/Al2O3were confirmed
by TEM-EDS mapping (Figure 5.7). By comparing images acquired at the end of the activation
process, it is possible to observe that while the Cu species are well spread on the Al2O3 surface, in
the case of SiO2 these species remain localized nearest to the Au NPs. These results clearly show
that the dealloying mechanism that takes place during the activation is related to the metal-support
interaction.

93
(a)
(b)
Figure 5.7: TEM-EDS images after activation of (a) Au0.60Cu0.40/Al2O3 and (b) Au0.60Cu0.40/SiO2.
5.3.3 In situ measurements during the CO oxidation
In situ XRD and XANES analysis were also carried out under CO oxidation reaction. The
initial catalyst is formed by Au NPs and CuOx species dispersed on the support. Only slightly
modifications could be found for both catalysts. By XRD, it was possible to note a small shift to
lower 2θ at higher temperatures (Figure C7). More interesting, after the cooling phase the (111)
peak position is exactly the same as the initial one, indicating no irreversible changes in the Au
phase took place during the reaction. XANES measurements at the Cu K-edge also show a slight
modification on the pre-edge peak and the white line during the heating, for both supports (Figure
C8). After cooling, the XANES profiles are similar to the initial ones, indicating that the CuOx
species do not change significantly during the reaction. The EXAFS data before and after CO
oxidation reaction confirms that the reaction atmosphere does not affect the nature of the Cu
species.

94
5.3.4 In situ measurements during the reduction
A similar set of in situ measurements were also performed under reductive pre-treatment,
following the CO oxidation reaction (Step#3). Figure 5.8a-d shows the XANES spectra at Cu K-
edge acquired during the reduction of Au0.60Cu0.40/Al2O3 and Au0.60Cu0.40/SiO2. After CO
oxidation, CuOx species remain dispersed on the support. By increasing the temperature under
reducing conditions, it is possible to note significant modifications on the white line corresponding
to copper reduction. These modifications are intensified after 200 °C and, at 350 °C, the XANES
spectra indicates the presence of both Cu0 and CuOx species. . XANES at Au L3-edge measured
for Au0.60Cu0.40/SiO2 (Figure 5.8e,f) revealed that a re-alloying process takes place with the
formation of AuCu NPs.
8900 9000 9100 9200
0,00,20,40,60,81,01,21,4
Energy (eV)
Nor
mal
ized
abs
orpt
ion
Cu KReduction
Au0.60Cu0.40/Al2O3
50150
250350
Tempe
ratur
e (°C
)
(a)
8980 9000 9020
Nom
aliz
ed a
bsor
ptio
n
Energy (eV)
Cu0
200 °C
CuOCu2O
350 °C
250 °C
150 °C
RT
(b)

95
8900 9000 9100 9200
0,00,20,40,60,81,01,21,4
Energy (eV)
Nor
mal
ized
abs
orpt
ion
Cu KReduction
Au0.60Cu0.40/SiO2 350250
15050
Tempe
ratur
e (°C
)
(c)
8980 9000 9020
Nor
mal
ized
abs
orpt
ion
Energy (eV)
Cu0
200 °C
CuOCu2O
350 °C
250 °C
150 °C
RT
(d)
0,0
0,2
0,4
0,6
0,8
1,0
11800 11900 12000 12100
Au0.60Cu0.40/SiO2
Energy (eV)
Nor
mal
ized
abs
orpt
ion
Au L3Reduction
50150
250350
Temperature (°C)
(e)
11921 11928 119350,4
0,5
0,6
0,7
0,8
0,9
Au0
RT 150 °C 200 °C 250 °C 350 °C 350 °C_ after 30 min
Nor
mal
ized
abs
orpt
ion
Energy (eV)
(f)
Figure 5.8: In situ XANES during reduction (step#3) of (a) and (b) Au0.60Cu0.40/Al2O3 and (c) and
(d) Au0,60Cu0,40/SiO2 at Cu K-edge. (d) and (f) shown the XANES at AuL3-edge during the
reduction of Au0.60Cu0.40/SiO2.
EXAFS data collected at the Cu K-edge (not shown) confirm a very interesting trend
comparing the systems supported on silica versus alumina. For Au0.60Cu0.40/SiO2 it is possible to
observe the appearance of Au-Cu bonds, indicating the once the Cu is reduced part of it migrates
diffuse into the Au NPs, forming and alloy. In addition, it is also observed the formation of shorter
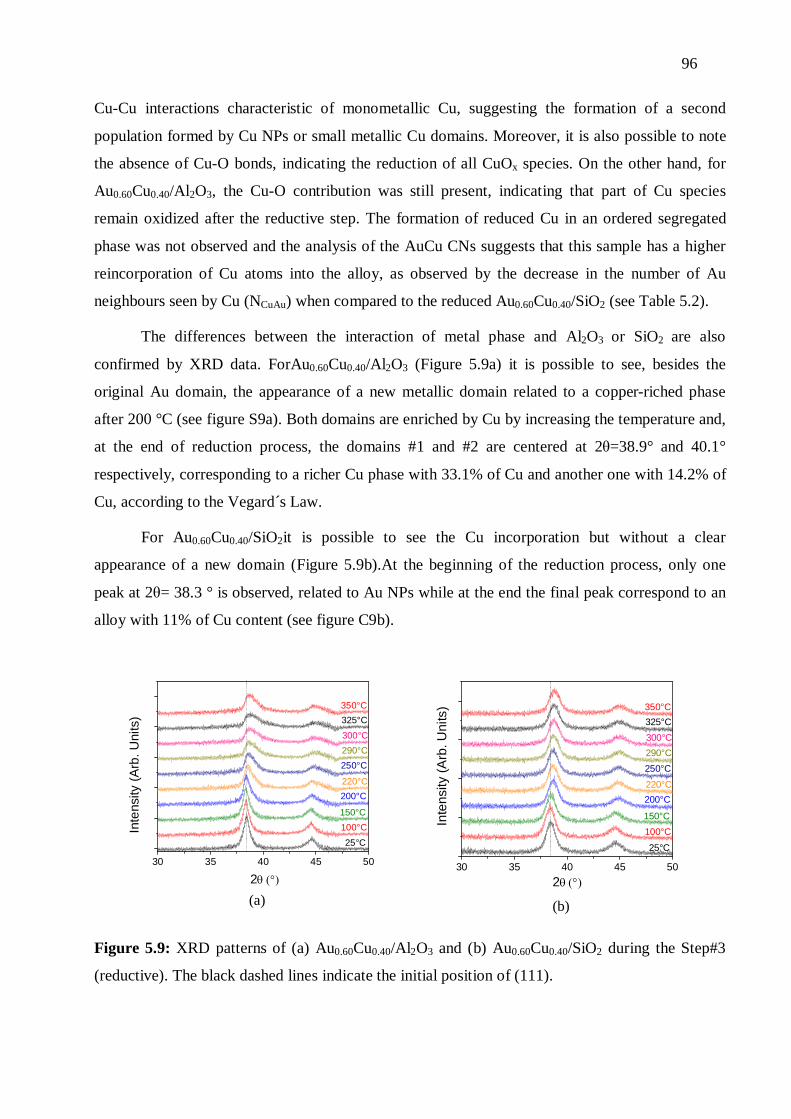
96
Cu-Cu interactions characteristic of monometallic Cu, suggesting the formation of a second
population formed by Cu NPs or small metallic Cu domains. Moreover, it is also possible to note
the absence of Cu-O bonds, indicating the reduction of all CuOx species. On the other hand, for
Au0.60Cu0.40/Al2O3, the Cu-O contribution was still present, indicating that part of Cu species
remain oxidized after the reductive step. The formation of reduced Cu in an ordered segregated
phase was not observed and the analysis of the AuCu CNs suggests that this sample has a higher
reincorporation of Cu atoms into the alloy, as observed by the decrease in the number of Au
neighbours seen by Cu (NCuAu) when compared to the reduced Au0.60Cu0.40/SiO2 (see Table 5.2).
The differences between the interaction of metal phase and Al2O3 or SiO2 are also
confirmed by XRD data. ForAu0.60Cu0.40/Al2O3 (Figure 5.9a) it is possible to see, besides the
original Au domain, the appearance of a new metallic domain related to a copper-riched phase
after 200 °C (see figure S9a). Both domains are enriched by Cu by increasing the temperature and,
at the end of reduction process, the domains #1 and #2 are centered at 2θ=38.9° and 40.1°
respectively, corresponding to a richer Cu phase with 33.1% of Cu and another one with 14.2% of
Cu, according to the Vegard´s Law.
For Au0.60Cu0.40/SiO2it is possible to see the Cu incorporation but without a clear
appearance of a new domain (Figure 5.9b).At the beginning of the reduction process, only one
peak at 2θ= 38.3 ° is observed, related to Au NPs while at the end the final peak correspond to an
alloy with 11% of Cu content (see figure C9b).
30 35 40 45 50
350°C325°C300°C290°C250°C
220°C200°C
150°C100°CIn
tens
ity (A
rb. U
nits
)
2
25°C
(a)
30 35 40 45 50
Inte
nsity
(Arb
. Uni
ts)
2
350°C325°C300°C290°C250°C
220°C200°C
150°C100°C
25°C
(b)
Figure 5.9: XRD patterns of (a) Au0.60Cu0.40/Al2O3 and (b) Au0.60Cu0.40/SiO2 during the Step#3
(reductive). The black dashed lines indicate the initial position of (111).

97
The differences of Au0.60Cu0.40/Al2O3 and Au0.60Cu0.40/SiO2 after reduction are also
confirmed by TEM-EDS mapping, indicating a higher dispersion of Cu species of
Au0.60Cu0.40/Al2O3 then Au0.60Cu0.40/SiO2.
(a)
(b)
Figure 5.10: TEM-EDS images after the reduction of (a) Au0.60Cu0.40/Al2O3 and (b)
Au0.60Cu0.40/SiO2.
5.4 Conclusion
The redox pre-treatments performed for Au1-xCux supported on SiO2 and Al2O3 directly
impact in the catalytic performance. The oxidative pre-treatment induces the dealloying of the
Au1-xCux nanoparticles resulting in Au nanoparticles and CuOx phase dispersed on the support;
this process and the characteristics of the CuOx phase are support-depended. This final
configuration is stable under CO oxidation. When the reductive pre-treatment is performed, the
CuOx species are reduced and part of the copper migrates forming the alloy nanoparticles, but with
lower copper contend. This work clearly highlights the crucial role played by the support on the
stability of the alloy phase, deeply impacting in the final performance of the catalyst.

98
Chapter 6
Global discussion and conclusions
In this work it was possible to demonstrate the potentialities of the bimetallic colloidal
NPs synthesis with a good control of properties targeting catalytic applications.
Firstly it was studied the formation of colloidal AuCu NPs. In the Chapter 2, it was
possible to shown the synthesis of homogeneous spherical NPs and understand the effect of
the temperature in the final composition. By changing the final synthesis temperature, 225,
260 and 280 °C, it was possible to synthesize particles with the compositions of Au0.75Cu0.25,
Au0.60Cu0.40 and Au0.50Cu0.50 respectively, with average size of 14 nm. Using different
characterization techniques to evaluate aliquots taken at different stages of reaction, it was
possible to infer about the formation mechanism of AuCu NPs, confirming the presence of an
intermediate Cu-rich phase that is digested during the synthesis to form the alloy. Another
important step, described in the Chapter 3, was given by in situ XAFS measurements, which
enabled monitoring the evolution of the metallic precursors in real-time during the synthesis,
using a special reactor developed by our group. The results supported the solid-state diffusion
mechanism for the AuCu alloy formation.
In the Chapter 4, Au0.75Cu0.25 NPs were supported on silica and exposed to redox
pretreatments and CO oxidation reaction cycles. The pretreatments performed before the
catalytic oxidation of CO showed direct influence on the catalytic performance. After the
activation step, the CO conversion is very low but increases considerably after a reductive
pretreatment. After that, the catalyst becomes highly stable. This behavior can be related to
the removal of Cl residues, detected on the catalysts, by the reductive pretreatment and/or the
formation of a new chemical environment generating stable species on the surface that can
improve the CO conversion. The most interesting point in this stage was that, after alternate
oxidative/reductive pretreatments the CO conversion is totally stable, showing that the
material reaches a high activeequilibrium state.

99
After the promising results obtained for Au0.75Cu0.25 supported on silica, tests were
carried out to verify the stability and catalytic performance of different compositions of Au1-
xCux supported on silica and alumina. The Chapter 5 extensively explored in situ
characterization techniques to clarify the processes involved in redox pretreatments and CO
oxidation reaction cycles. By combining in situ X-ray absorption and diffraction, it was
observed a dealloying process under oxidative atmosphere and re-alloying under reductive
conditions. The AuCu alloying/dealloying process is directly influenced by the support,
generating different species on silica or alumina that directly affect the performance of the
catalyst.
This doctoral thesis explored different aspects of the use of the AuCu system in
catalysis, from the alloying mechanisms that take place in colloidal systems to its use in CO
oxidation reaction, highlighting that the species formed during pretreatments and the nature of
the support direct impact in the catalytic performance of the material.
Further studies may be carried out by changing the particle size of AuCu, using
different supports and also on the application of AuCu NPs in other reactions where a well-
defined metal-support interface is required.

100
Bibliography
(1) Li, Y.; Somorjai, G. A. Nanoscale Advances in Catalysis and Energy Applications.
Nano Lett.2010, 10, 2289–2295.
(2) Daniel, M. C. M.; Astruc, D. Gold Nanoparticles: Assembly, Supramolecular
Chemistry, Quantum-Size Related Properties and Applications toward Biology,
Catalysis and Nanotechnology,. Chem. Rev.2004, 104, 293–346.
(3) Carbone, L.; Cozzoli, P. D. Colloidal Heterostructured Nanocrystals: Synthesis and
Growth Mechanisms. Nano Today2010, 5, 449–493.
(4) Bonnemann, H.; Richards, R. M. Nanoscopic Metal Particles - Synthetic Methods and
Potential Applications. Eur. J. Inorg. Chem.2001, 2455–2480.
(5) Ghosh Chaudhuri, R.; Paria, S. Core/shell Nanoparticles: Classes, Properties, Synthesis
Mechanisms, Characterization, and Applications. Chem. Rev.2012, 112, 2373–2433.
(6) Thanh, N. T. K.; Maclean, N.; Mahiddine, S. Mechanisms of Nucleation and Growth of
Nanoparticles in Solution. Chem. Rev.2014, 3.
(7) Doyle, H.; Betley, T. A. Colloidal Synthesis of Nanocrystals and Nanocrystal
Superlattices This Paper Provides an Overview of the. 2001, 45, 47–56.
(8) Sneed, B. T.; Young, A. P.; Tsung, C.-K. Building up Strain in Colloidal Metal
Nanoparticle Catalysts. Nanoscale2015, 7, 12248–12265.
(9) Jia, C.-J.; Schüth, F. Colloidal Metal Nanoparticles as a Component of Designed
Catalyst. Phys. Chem. Chem. Phys.2011, 13, 2457–2487.
(10) Manna, L.; Kudera, S. Colloidal Foundations of Nanoscience; Berti, D.; Palazzo, G.,
Eds.; First edit.; Elsevier, 2014.
(11) Faraday, M. Experimental Relations of Gold (and Other Metals) to Light. Philos.
Trans. R. Soc. London1857, 147, 145.
(12) Yin, Y.; Alivisatos, a P. Colloidal Nanocrystal Synthesis and the Organic-Inorganic
Interface. Nature2005, 437, 664–670.
(13) Sugimoto, T. Preparation of Monodispersed Colloidal Particles. Adv. Colloid Interface
Sci.1987, 28, 65–108.
(14) Turkevich, J.; Stevenson, P. C.; Hillier, J. A Study of the Nucleation and Growth

101
Processes in the Synthesis of Colloidal Gold. Discuss. Faraday Soc.1951, 55, 55–75.
(15) Vreeland, E. C.; Watt, J.; Schober, G. B.; Hance, B. G.; Austin, M. J.; Price, A. D.;
Fellows, B. D.; Monson, T. C.; Hudak, N. S.; Maldonado-Camargo, L.; et al. Enhanced
Nanoparticle Size Control by Extending LaMer’s Mechanism. Chem. Mater.2015, 27,
6059−6066.
(16) LaMer, V.; Dinegar, R. Theory, Production and Mechanism of Formation of
Monodispersed Hydrosols. J. Am. Chem. Soc.1950, 72, 4847–4854.
(17) Romo-Herrera, J. M.; Alvarez-Puebla, R. A.; Liz-Marzán, L. M. Controlled Assembly
of Plasmonic Colloidal Nanoparticle Clusters. Nanoscale2011, 3, 1304–1315.
(18) You, H.; Yang, S.; Ding, B.; Yang, H. Synthesis of Colloidal Metal and Metal Alloy
Nanoparticles for Electrochemical Energy Applications. Chem. Soc. Rev.2013, 42,
2880–2904.
(19) Somorjai, G. A.; Tao, F.; Park, J. Y. The Nanoscience Revolution: Merging of Colloid
Science, Catalysis and Nanoelectronics. Top. Catal.2008, 47, 1–14.
(20) Piella, J.; Bastús, N. G.; Puntes, V. Size-Controlled Synthesis of Sub-10-Nanometer
Citrate-Stabilized Gold Nanoparticles and Related Optical Properties. Chem.
Mater.2016, 28, 1066−1075.
(21) Koutsopoulos, S.; Johannessen, T.; Eriksen, K. M.; Fehrmann, R. Titania-Supported Pt
and Pt-Pd Nanoparticle Catalysts for the Oxidation of Sulfur Dioxide. J. Catal.2006,
238, 206–213.
(22) Wu, Y.; Cai, S.; Wang, D.; He, W.; Li, Y. Syntheses of Water-Soluble Octahedral,
Truncated Octahedral, and Cubic Pt-Ni Nanocrystals and Their Structure-Activity
Study in Model Hydrogenation Reactions. J. Am. Chem. Soc.2012, 134, 8975–8981.
(23) Wang, Y.; Zhao, Y.; Yin, J.; Liu, M.; Dong, Q.; Su, Y. Synthesis and Electrocatalytic
Alcohol Oxidation Performance of Pd-Co Bimetallic Nanoparticles Supported on
Graphene. Int. J. Hydrogen Energy2014, 39, 1325–1335.
(24) Huang, X.; Wang, X.; Tan, M.; Zou, X.; Ding, W.; Lu, X. Selective Oxidation of
Alcohols on P123-Stabilized Au-Ag Alloy Nanoparticles in Aqueous Solution with
Molecular Oxygen. Appl. Catal. A Gen. 2013, 467, 407–413.
(25) An, K.; Alayoglu, S.; Ewers, T.; Somorjai, G. A. J. Colloid Interface Sci. 2012, 373, 1–

102
13.
(26) Johnston, R. L. Metal Nanoparticles and Nanoalloys; 1st ed.; Elsevier Ltd, 2012; Vol.
3.
(27) Pendergast, D. M. Tumbaga Object from the Early Classic Period, Found at Altun Ha,
British Honduras (Belize). Science19170, 168, 116–118.
(28) Yin, F.; Wang, Z. W.; Palmer, R. E. Formation of Bimetallic Nanoalloys by Au
Coating of Size-Selected Cu Clusters. J. Nanoparticle Res.2012, 14, 1114–1124.
(29) Xu, Z.; Lai, E.; Shao-Horn, Y.; Hamad-Schifferli, K. Compositional Dependence of the
Stability of AuCu Alloy Nanoparticles. Chem. Commun. (Camb).2012, 48, 5626–5628.
(30) Ferro, R.; Saccone, A. Elements of Alloying Behaviour Systematics. In Intermetallic
Chemistry; Elsevier, 2008.
(31) Guisbiers, G.; Mejia-Rosales, S.; Khanal, S.; Ruiz-Zepeda, F.; Whetten, R. L.; José-
Yacaman, M. Gold−Copper Nano-Alloy, “Tumbaga ”, in the Era of Nano : Phase
Diagram and Segregation. Nano Lett.2014, 14, 6718–6726.
(32) Lubarda, V. A. On the Effective Lattice Parameter of Binary Alloys. 2003, 35, 53–68.
(33) Okamoto, H.; Chakrabarti, D. J.; Laughlin, D. E.; Massalski, T. B. The Au-Cu (Gold-
Copper) System. Bull. Alloy Phase Diagrams1987, 454–473.
(34) Bracey, C. L.; Ellis, P. R.; Hutchings, G. J. Application of Copper-Gold Alloys in
Catalysis: Current Status and Future Perspectives. Chem. Soc. Rev.2009, 38, 2231–
2243.
(35) Baletto, F.; Ferrando, R. Structural Properties of Nanoclusters: Energetic,
Thermodynamic, and Kinetic Effects. Rev. Mod. Phys.2005, 77, 371–423.
(36) Pauwels, B.; Van Tendeloo, G.; Zhurkin, E.; Hou, M.; Verschoren, G.; Theil Kuhn, L.;
Bouwen, W.; Lievens, P. Transmission Electron Microscopy and Monte Carlo
Simulations of Ordering in Au-Cu Clusters Produced in a Laser Vaporization Source.
Phys. Rev. B2001, 63, 1–10.
(37) Ferrando, R.; Jellinek, J.; Johnston, R. L. Nanoalloys: From Theory to Applications of
Alloy Clusters and Nanoparticles. Chem. Rev.2008, 108, 845–910.
(38) Darby, S.; Mortimer-Jones, T. V.; Johnston, R. L.; Roberts, C. Theoretical Study of
Cu–Au Nanoalloy Clusters Using a Genetic Algorithm. J. Chem. Phys.2002, 116,

103
1536.
(39) Toai, T. J.; Rossi, G.; Ferrando, R. Global Optimisation and Growth Simulation of
AuCu Clusters. Faraday Discuss.2008, 138, 49–58.
(40) Kim, D.; Resasco, J.; Yu, Y.; Asiri, A. M.; Yang, P. Synergistic Geometric and
Electronic Effects for Electrochemical Reduction of Carbon Dioxide Using Gold-
Copper Bimetallic Nanoparticles. Nat. Commun.2014, 5, 1–8.
(41) Chorkendorff, I.; Niemantsverdriet, J. W. Concepts of Modern Catalysis and Kinetics;
2003.
(42) Bell, A. T. The Impact of Nanoscience on Heterogeneous Catalysis. Science2003, 299,
1688–1691.
(43) Bamwenda, G. R.; Tsubota, S.; Nakamura, T.; Haruta, M. The Influence of the
Preparation Methods on the Catalytic Activity of Platinum and Gold Supported on TiO
2 for CO Oxidation. Catal. Letters1997, 44, 83–87.
(44) Munnik, P.; de Jongh, P. E.; de Jong, K. P. Recent Developments in the Synthesis of
Supported Catalysts. Chem. Rev.2015.
(45) Baatz, C.; Decker, N.; Prube, U. New Innovative Gold Catalysts Prepared by an
Improved Incipient Wetness Method. J. Catal.2008, 258, 165–169.
(46) Schauermann, S.; Nilius, N.; Shaikhutdinov, S.; Freund, H.-J. Nanoparticles for
Heterogeneous Catalysis: New Mechanistic Insights. Acc. Chem. Res.2013, 46, 1673–
1681.
(47) Cao, A.; Lu, R.; Veser, G. Stabilizing Metal Nanoparticles for Heterogeneous
Catalysis. Phys. Chem. Chem. Phys.2010, 12, 13499–13510.
(48) Tao, F. F.; Schneider, W. F.; Kamat, P. V. Chemical Synthesis of Nanscale
Heterogeneous Catalysis. In Heterogeneous Catalysis at the Nanoscale for Energy
Applications; 2014; Vol. 1, pp. 9–29.
(49) Sonström, P.; Bäumer, M. Supported Colloidal Nanoparticles in Heterogeneous Gas
Phase Catalysis: On the Way to Tailored Catalysts. Phys. Chem. Chem. Phys.2011, 13,
19270–19284.
(50) Pushkarev, V. V.; Zhu, Z.; An, K.; Hervier, A.; Somorjai, G. A. Monodisperse Metal
Nanoparticle Catalysts: Synthesis, Characterizations, and Molecular Studies under

104
Reaction Conditions. Top. Catal.2012, 55, 1257–1275.
(51) Haruta, M.; Kobayashi, T.; Sano, H.; Yamada, N. Novel Gold Catalysts for the
Oxidation of Carbon Monoxide at a Temperature Far below 0°C. Chem. Lett.1987,
405–408.
(52) Zafeiratos, S.; Piccinin, S.; Teschner, D. Alloys in Catalysis: Phase Separation and
Surface Segregation Phenomena in Response to the Reactive Environment. Catal. Sci.
Technol.2012, 2, 1787–1801.
(53) Xu, W.; Si, R.; Senanayake, S. D.; Llorca, J.; Idriss, H.; Stacchiola, D.; Hanson, J. C.;
Rodriguez, J. a. In Situ Studies of CeO2-Supported Pt, Ru, and Pt–Ru Alloy Catalysts
for the Water–Gas Shift Reaction: Active Phases and Reaction Intermediates. J.
Catal.2012, 291, 117–126.
(54) Zhou, S.; Jackson, G. S.; Eichhorn, B. AuPt Alloy Nanoparticles for CO-Tolerant
Hydrogen Activation: Architectural Effects in Au-Pt Bimetallic Nanocatalysts. Adv.
Funct. Mater.2007, 17, 3099–3104.
(55) Liu, X.; Wang, A.; Zhang, T.; Su, D. S.; Mou, C. Y. Au-Cu Alloy Nanoparticles
Supported on Silica Gel as Catalyst for CO Oxidation: Effects of Au/Cu Ratios. Catal.
Today2011, 160, 103–108.
(56) Liu, J. H.; Wang, A. Q.; Chi, Y. S.; Lin, H. P.; Mou, C. Y. Synergistic Effect in an Au-
Ag Alloy Nanocatalyst: CO Oxidation. J. Phys. Chem. B2005, 109, 40–43.
(57) Remediakis, I. N.; Lopez, N.; Nørskov, J. K. CO Oxidation on Gold Nanoparticles:
Theoretical Studies. Appl. Catal. A Gen.2005, 291, 13–20.
(58) Singh, A. K.; Xu, Q. Synergistic Catalysis over Bimetallic Alloy Nanoparticles.
ChemCatChem2013, 5, 652–676.
(59) Xu, J.; White, T.; Li, P.; He, C.; Yu, J.; Yuan, W.; Han, Y.-F. Biphasic Pd-Au Alloy
Catalyst for Low-Temperature CO Oxidation. J. Am. Chem. Soc.2010, 132, 10398–
10406.
(60) Liu, H.; Kozlov, A. I.; Kozlova, A. P.; Shido, T.; Asakura, K.; Iwasawa, Y. Active
Oxygen Species and Mechanism for Low-Temperature CO Oxidation Reaction on a
TiO2-Supported Au Catalyst Prepared from Au(PPh3)(NO3) and As-Precipitated
Titanium Hydroxide. J. Catal.1999, 185, 252–264.

105
(61) Molina, L. M.; Hammer, B. Some Recent Theoretical Advances in the Understanding
of the Catalytic Activity of Au. Appl. Catal. A Gen.2005, 291, 21–31.
(62) Haruta, M. Size- and Support-Dependency in the Catalysis of Gold. Catal. Today1997,
36, 153–166.
(63) Boccuzzi, F.; Chiorino, a; Manzoli, M.; Lu, P.; Akita, T.; Ichikawa, S.; Haruta, M.
Au/TiO2 Nanosized Samples: A Catalytic, TEM, and FTIR Study of the Effect of
Calcination Temperature on the CO Oxidation. J. Catal.2001, 202, 256–267.
(64) Shekhar, M.; Wang, J.; Lee, W.-S.; Williams, W. D.; Kim, S. M.; Stach, E. a; Miller, J.
T.; Delgass, W. N.; Ribeiro, F. H. Size and Support Effects for the Water-Gas Shift
Catalysis over Gold Nanoparticles Supported on Model Al2O3 and TiO2. J. Am. Chem.
Soc.2012, 134, 4700–4708.
(65) Choudhary, T. V.; Goodman, D. W. Catalytically Active Gold: The Role of Cluster
Morphology. Appl. Catal. A Gen.2005, 291, 32–36.
(66) Schubert, M. M.; Hackenberg, S.; van Veen, A. C.; Muhler, M.; Plzak, V.; Behm, R. J.
CO Oxidation over Supported Gold Catalysts—“Inert” and “Active” Support Materials
and Their Role for the Oxygen Supply during Reaction. J. Catal.2001, 197, 113–122.
(67) Klyushin, A. Y.; Arrigo, R.; Youngmi, Y.; Xie, Z.; Hävecker, M.; Bukhtiyarov, A. V.;
Prosvirin, I. P.; Bukhtiyarov, V. I.; Knop-Gericke, A.; Schlögl, R. Are Au
Nanoparticles on Oxygen-Free Supports Catalytically Active? Top. Catal.2016, 59,
469–477.
(68) Liu, X.; Wang, A.; Yang, X.; Zhang, T.; Mou, C. Y.; Su, D. S.; Li, J. Synthesis of
Thermally Stable and Highly Active Bimetallic Au-Ag Nanoparticles on Inert
Supports. Chem. Mater.2009, 21, 410–418.
(69) Mu, R.; Fu, Q.; Xu, H.; Zhang, H.; Huang, Y.; Jiang, Z.; Zhang, S.; Tan, D.; Bao, X.
Synergetic Effect of Surface and Subsurface Ni Species at Pt-Ni Bimetallic Catalysts
for CO Oxidation. J. Am. Chem. Soc.2011, 133, 1978–1986.
(70) Yen, C.; Lin, M.; Wang, A.; Chen, S.; Chen, J.; Mou, C. CO Oxidation Catalyzed by
Au− Ag Bimetallic Nanoparticles Supported in Mesoporous Silica. J. Phys. Chem.
C2009, 113, 17831–17839.
(71) Wang, A. Q.; Chang, C. M.; Mou, C. Y. Evolution of Catalytic Activity of Au-Ag
Bimetallic Nanoparticles on Mesoporous Support for CO Oxidation. J. Phys. Chem.

106
B2005, 109, 18860–18867.
(72) Liu, X.; Wang, A.; Li, L.; Zhang, T.; Mou, C. Y.; Lee, J. F. Structural Changes of Au-
Cu Bimetallic Catalysts in CO Oxidation: In Situ XRD, EPR, XANES, and FT-IR
Characterizations. J. Catal.2011, 278, 288–296.
(73) Wang, A.; Liu, X. Y.; Mou, C.-Y.; Zhang, T. Understanding the Synergistic Effects of
Gold Bimetallic Catalysts. J. Catal.2013, 308, 258–271.
(74) Zhou, S.; Varughese, B.; Eichhorn, B.; Jackson, G.; McIlwrath, K. Pt-Cu Core-Shell
and Alloy Nanoparticles for Heterogeneous NOx Reduction: Anomalous Stability and
Reactivity of a Core-Shell Nanostructure. Angew. Chemie - Int. Ed.2005, 44, 4539–
4543.
(75) Cargnello, M.; Doan-Nguyen, V. V. T.; Gordon, T. R.; Diaz, R. E.; Stach, E. a; Gorte,
R. J.; Fornasiero, P.; Murray, C. B. Control of Metal Nanocrystal Size Reveals Metal-
Support Interface Role for Ceria Catalysts. Science2013, 341, 771–773.
(76) Yen, H.; Seo, Y.; Kaliaguine, S.; Kleitz, F. On the Role of Metal-Support Interactions,
Particle Size, and Metal-Metal Synergy in CuNi Nanocatalysts for H2 Generation. ACS
Catal.2015, 2, 5505−5511.
(77) Bauer, J. C.; Mullins, D.; Li, M.; Wu, Z.; Payzant, E. A.; Overbury, S. H.; Dai, S.
Synthesis of Silica Supported AuCu Nanoparticle Catalysts and the Effects of
Pretreatment Conditions for the CO Oxidation Reaction. Phys. Chem. Chem.
Phys.2011, 13, 2571–2581.
(78) Li, X.; See, S.; Fang, S.; Teo, J.; Foo, Y. L.; Borgna, A.; Lin, M.; Zhong, Z. Activation
and Deactivation of Au−Cu/SBA-15 Catalyst for Preferential Oxidation of CO in H2-
Rich Gas. ACS Catal.2012, 2, 360–369.
(79) Sugano, Y.; Shiraishi, Y.; Tsukamoto, D.; Ichikawa, S.; Tanaka, S.; Hirai, T. Supported
Au-Cu Bimetallic Alloy Nanoparticles: An Aerobic Oxidation Catalyst with
Regenerable Activity by Visible-Light Irradiation. Angew. Chemie2013, 125, 5403–
5407.
(80) Motl, N. E.; Ewusi-Annan, E.; Sines, I. T.; Jensen, L.; Schaak, R. E. Au-Cu Alloy
Nanoparticles with Tunable Compositions and Plasmonic Properties: Experimental
Determination of Composition and Correlation with Theory. J. Phys. Chem.2010, 114,
19263–19269.

107
(81) Toshima, N.; Yonezawa, T. Bimetallic Nanoparticles—novel Materials for Chemical
and Physical Applications. New J. Chem.1998, 22, 1179–1201.
(82) Jana, S. Advances in Nanoscale Alloys and Intermetallics: Low Temperature Solution
Chemistry Synthesis and Application in Catalysis. Dalt. Trans.2015, 44, 18692–18717.
(83) Major, K. J.; De, C.; Obare, S. O. Recent Advances in the Synthesis of Plasmonic
Bimetallic Nanoparticles. Plasmonics2009, 4, 61–78.
(84) Brust, M.; Walker, M.; Bethell, D.; Schiffrin, D. J.; Whyman, R. Synthesis of Thiol-
Derivatised Gold Nanoparticles in a Two-Phase Liquid-Liquid System Mathias. Chem.
Commun.2000, 801–802.
(85) Sardar, R.; Funston, A. M.; Mulvaney, P.; Murray, R. W. Gold Nanoparticles: Past,
Present, and Future. Langmuir2009, 25, 13840–13851.
(86) DeSantis, C. J.; Weiner, R. G.; Radmilovic, A.; Bower, M. M.; Skrabalak, S. E.
Seeding Bimetallic Nanostructures as a New Class of Plasmonic Colloids. J. Phys.
Chem. Lett.2013, 4, 3072–3082.
(87) Sra, A. K.; Schaak, R. E. Synthesis of Atomically Ordered AuCu and AuCu 3
Nanocrystals from Bimetallic Nanoparticle Precursors. J. Am. Chem. Soc.2004, 6667–
6672.
(88) Barcaro, G.; Fortunelli, A.; Rossi, G.; Nita, F.; Ferrando, R. Electronic and Structural
Shell Closure in AgCu and AuCu Nanoclusters. J. Phys. Chem. B2006, 110, 23197–
23203.
(89) Alloyeau, D.; Ricolleau, C.; Mottet, C.; Oikawa, T.; Langlois, C.; Le Bouar, Y.;
Braidy, N.; Loiseau, A. Size and Shape Effects on the Order–disorder Phase Transition
in CoPt Nanoparticles. Nat. Mater.2009, 8, 940–946.
(90) Sun, S.; Murray, C. B.; Weller, D.; Folks, L.; Moser, A. Monodisperse FePt
Nanoparticles and Ferromagnetic FePt Nanocrystal Superlattices. Science (80-. ).2000,
287, 1989–1992.
(91) Kuttiyiel, K. A.; Sasaki, K.; Su, D.; Wu, L.; Zhu, Y.; Adzic, R. R. Gold-Promoted
Structurally Ordered Intermetallic Palladium Cobalt Nanoparticles for the Oxygen
Reduction Reaction. Nat. Commun.2014, 5, 1–8.
(92) Nemoshkalenko, V. V.; Chuistov, K. V.; Aleshin, V. G.; Senkevich, A. I. Changes in

108
Energy Structure of Cu3Au and CuAu3 Alloy Studied by the Method of X-Ray
Photoelectron Spectroscopy. J. Electron Spectros. Relat. Phenomena1976, 9, 169–173.
(93) Tee, S. Y.; Ye, E.; Pan, P. H.; Lee, C. J. J.; Hui, H. K.; Zhang, S.-Y.; Koh, L. D.; Dong,
Z.; Han, M.-Y. Fabrication of Bimetallic Cu/Au Nanotubes and Their Sensitive,
Selective, Reproducible and Reusable Electrochemical Sensing of Glucose.
Nanoscale2015, 7, 11190–11198.
(94) Chen, L. Y.; Fujita, T.; Ding, Y.; Chen, M. W. A Three-Dimensional Gold-Decorated
Nanoporous Copper Core-Shell Composite for Electrocatalysis and Nonenzymatic
Biosensing. Adv. Funct. Mater.2010, 20, 2279–2285.
(95) Kim, S.-I.; Eom, G.; Kang, M.; Kang, T.; Lee, H.; Hwang, A.; Yang, H.; Kim, B.
Composition-Selective Fabrication of Ordered Intermetallic Au–Cu Nanowires and
Their Application to Nano-Size Electrochemical Glucose Detection.
Nanotechnology2015, 26, 245702.
(96) Jiang, Z.; Zhang, Q.; Zong, C.; Liu, B.-J.; Ren, B.; Xie, Z.; Zheng, L. Cu–Au Alloy
Nanotubes with Five-Fold Twinned Structure and Their Application in Surface-
Enhanced Raman Scattering. J. Mater. Chem.2012, 22, 18192–18197.
(97) He, R.; Wang, Y.; Wang, X.; Wang, Z.; Liu, G.; Zhou, W.; Wen, L.; Li, Q.; Wang, X.;
Chen, X.; et al. Facile Synthesis of Pentacle Gold–copper Alloy Nanocrystals and
Their Plasmonic and Catalytic Properties. Nat. Commun.2014, 5, 1–10.
(98) Najafishirtari, S.; Brescia, R.; Guardia, P.; Marras, S.; Manna, L.; Colombo, M.
Nanoscale Transformations of Alumina-Supported AuCu Ordered Phase Nanocrystals
and Their Activity in CO Oxidation. ACS Catal.2015, 5, 2154–2163.
(99) Zhang, L.; Niu, W.; Xu, G. Synthesis and Applications of Noble Metal Nanocrystals
with High-Energy Facets. Nano Today2012, 7, 586–605.
(100) Au, L.; Lu, X.; Xia, Y. A Comparative Study of Galvanic Replacement Reactions
Involving Ag Nanocubes and AuCl(2) or AuCl(4). Adv. Mater.2008, 20, 2517–2522.
(101) Moon, G. D.; Ko, S.; Min, Y.; Zeng, J.; Xia, Y.; Jeong, U. Chemical Transformations
of Nanostructured Materials. Nano Today2011, 6, 186–203.
(102) Xia, Y.; Xiong, Y.; Lim, B.; Skrabalak, S. E. Shape-Controlled Synthesis of Metal
Nanocrystals: Simple Chemistry Meets Complex Physics? Angew. Chem. Int. Ed.
Engl.2009, 48, 60–103.

109
(103) Liu, S.; Sun, Z.; Liu, Q.; Wu, L.; Huang, Y.; Yao, T.; Zhang, J.; Hu, T.; Ge, M.; Hu, F.;
et al. Unidirectional Thermal Diff Usion in Bimetalic Cu@Au Nanoparticles. ACS
Nano2014, 8, 1886–1892.
(104) Chen, W.; Yu, R.; Li, L.; Wang, A.; Peng, Q.; Li, Y. A Seed-Based Diffusion Route to
Monodisperse Intermetallic CuAu Nanocrystals. Angew. Chemie2010, 122, 2979–
2983.
(105) Bansal, A.; Sekhon, J. S.; Verma, S. S. Scattering Efficiency and LSPR Tunability of
Bimetallic Ag, Au, and Cu Nanoparticles. Plasmonics2013, 9, 143–150.
(106) Tanuma, S.; Powell, C. J.; Penn, D. R. Calculations of Electron Inelastic Mean Free
Paths. Surf. interface Anal.2000, 21, 165–176.
(107) Schaak, R. E.; Sra, A. K.; Leonard, B. M.; Cable, R. E.; Bauer, J. C.; Han, Y.; Means,
J.; Teizer, W.; Vasquez, Y.; Funck, E. S. Metallurgy in a Beaker : Nanoparticle Toolkit
for the Rapid Low-Temperature Solution Synthesis of Functional Multimetallic Solid-
State Materials. J. Am. Chem. Soc.2005, 3506–3515.
(108) Sinha, S. K.; Srivastava, C.; Sampath, S.; Chattopadhyay, K. Tunability of
Monodispersed Intermetallic AuCu Nanoparticles through Understanding of Reaction
Pathways. RSC Adv.2015, 5, 4389–4395.
(109) Destro, P.; Cantane, D.; Honorio, G.; Costa, L.; Meira, D.; Zanchet, D. Solid-State
Diffusion Mechanism at Nanoscale : A Strategy to Synthesizing Bimetallic
Nanoparticles. Under Prep.
(110) Gauthard, F.; Epron, F.; Barbier, J. Palladium and Platinum-Based Catalysts in the
Catalytic Reduction of Nitrate in Water: Effect of Copper, Silver, or Gold Addition. J.
Catal.2003, 220, 182–191.
(111) Shore, M. S.; Wang, J.; Johnston-Peck, A. C.; Oldenburg, A. L.; Tracy, J. B. Synthesis
of Au(core)/Ag(shell) Nanoparticles and Their Conversion to AuAg Alloy
Nanoparticles. Small2011, 7, 230–234.
(112) Smetana, A. B.; Klabunde, K. J.; Sorensen, C. M.; Ponce, A. A.; Mwale, B. Low-
Temperature Metallic Alloying of Copper and Silver Nanoparticles with Gold
Nanoparticles through Digestive Ripening. J. Phys. Chem. B2006, 110, 2155–2158.
(113) Bhaskar, S. P.; Vijayan, M.; Jagirdar, B. R. Size Modulation of Colloidal Au
Nanoparticles via Digestive Ripening in Conjunction with a Solvated Metal Atom

110
Dispersion Method: An Insight into Mechanism. J. Phys. Chem. C2014, 118, 18214–
18225.
(114) Kalidindi, S. B.; Jagirdar, B. R. Synthesis of Cu@ZnO Core-Shell Nanocomposite
through Digestive Ripening of Cu and Zn Nanoparticles. J. Phys. Chem. C2008, 112,
4042–4048.
(115) Jose, D.; Jagirdar, B. R. Au@Pd Core-Shell Nanoparticles through Digestive Ripening.
J. Phys. Chem. C2008, 112, 10089–10094.
(116) Xu, Z.; Lai, E.; Shao-Horn, Y.; Hamad-Schifferli, K. Compositional Dependence of the
Stability of AuCu Alloy Nanoparticles. Chem. Commun. (Camb).2012, 48, 5626–5628.
(117) Destro, P.; Colombo, M.; Prato, M.; Brescia, R.; Manna, L.; Zanchet, D. Au1-xCux
Colloidal Nanoparticles Synthesized via One-Pot Approach: Understanding the
Temperature Effect on the Au:Cu Ratio. RSC Adv.2016, 6, 22213–22221.
(118) Cable, R. E.; Schaak, R. E.; September, R. V; Re, V.; Recei, M.; October, V. Low-
Temperature Solution Synthesis of Nanocrystalline Binary Intermetallic Compounds
Using the Polyol Process. 2005, 6835–6841.
(119) Sra, A. K.; Ewers, T. D.; Schaak, R. E. Direct Solution Synthesis of Intermetallic
AuCu and AuCu Nanocrystals and Nanowire Networks Direct Solution Synthesis of
Intermetallic AuCu and AuCu3 Nanocrystals and Nanowire Networks. Chem.
Mater.2005, 17, 758–766.
(120) Henkel, A.; Jakab, A.; Brunklaus, G.; Sönnichsen, C. Tuning Plasmonic Properties by
Alloying Copper into Gold Nanorods. J. Phys. Chem. C2009, 113, 2200–2204.
(121) Cable, Robert E Schaak, R. E. Reacting the Unreactive: A Toolbox of Low-
Temperature Solution-Mediated Reactions for the Facile Interconversion of
Nanocrystalline Intermetallic Compounds. J. Am. Chem. Soc.2006, 128, 9129–9136.
(122) Yin, J.; Shan, S.; Yang, L.; Mott, D.; Malis, O.; Petkov, V.; Cai, F.; Shan Ng, M.; Luo,
J.; Chen, B. H.; et al. Gold–Copper Nanoparticles: Nanostructural Evolution and
Bifunctional Catalytic Sites. Chem. Mater.2012, 24, 4662–4674.
(123) Frenkel, A. I.; Rodriguez, J. a.; Chen, J. G. Synchrotron Techniques for in Situ
Catalytic Studies: Capabilities, Challenges, and Opportunities. ACS Catalysis, 2012, 2,
2269–2280.

111
(124) Frenkel, A. I. Applications of Extended X-Ray Absorption Fine-Structure
Spectroscopy to Studies of Bimetallic Nanoparticle Catalysts. Chem. Soc. Rev.2012,
8163–8178.
(125) Krishna, K. S.; Navin, C. V; Biswas, S.; Singh, V.; Ham, K.; Bovenkamp, G. L.;
Theegala, C. S.; Miller, T.; Spivey, J. J.; Kumar, C. S. S. R. Milli Fluidics for Time-
Resolved Mapping of the Growth of Gold Nanostructures. J. Am. Chem. Soc.2013,
135, 5450–5456.
(126) Campi, G.; Mari, A.; Amenitsch, H.; Pifferi, A.; Cannas, C.; Suber, L. Monitoring
Early Stages of Silver Particle Formation in a Polymer Solution by in Situ and Time
Resolved Small Angle X-Ray Scattering. Nanoscale2010, 2, 2447–2455.
(127) Sarma, L. S.; Chen, C. H.; Kumar, S. M. S.; Wang, G. R.; Yen, S. C.; Liu, D. G.; Sheu,
H. S.; Yu, K. L.; Tang, M. T.; Lee, J. F.; et al. Formation of Pt-Ru Nanoparticles in
Ethylene Glycol Solution: An in Situ X-Ray Absorption Spectroscopy Study.
Langmuir2007, 23, 5802–5809.
(128) Tsai, Y. W.; Tseng, Y. L.; Sarma, L. S.; Liu, D. G.; Lee, J. F.; Hwang, B. J. Genesis of
Pt Clusters in Reverse Micelles Investigated by in Situ X-Ray Absorption
Spectroscopy. J. Phys. Chem. B2004, 108, 8148–8152.
(129) Chen, C. H.; Hwang, B. J.; Wang, G. R.; Sarma, L. S.; Tang, M. T.; Liu, D. G.; Lee, J.
F. Nucleation and Growth Mechanism of Pd/Pt Bimetallic Clusters in Sodium bis(2-
Ethylhexyl)sulfosuceinate (AOT) Reverse Micelles as Studied by in Situ X-Ray
Absorption Spectroscopy. J. Phys. Chem. B2005, 109, 21566–21575.
(130) Oyanagi, H.; Sun, Z. H.; Jiang, Y.; Uehara, M.; Nakamura, H.; Yamashita, K.; Zhang,
L.; Lee, C.; Fukano, A.; Maeda, H. In Situ XAFS Experiments Using a Microfluidic
Cell: Application to Initial Growth of CdSe Nanocrystals. J. Synchrotron Radiat.2011,
18, 272–279.
(131) Kuhn, M.; Sham, T. K. Charge Redistribution and Electronic Behavior in a Series of
Au-Cu Alloys. Phys. Rev. B1994, 49, 1647–1661.
(132) Borgohain, K.; Murase, N.; Mahamuni, S. Synthesis and Properties of Cu 2O Quantum
Particles. J. Appl. Phys.2002, 92, 1292–1297.
(133) Chang, Y.; Teo, J. J.; Zeng, H. C. Formation of Colloidal CuO Nanocrystallites and
Their Spherical Aggregation and Reductive Transformation to Hollow Cu 2O

112
Nanospheres. Langmuir2005, 21, 1074–1079.
(134) Somorjai, G. a.; Park, J. Y. Colloid Science of Metal Nanoparticle Catalysts in 2D and
3D Structures. Challenges of Nucleation, Growth, Composition, Particle Shape, Size
Control and Their Influence on Activity and Selectivity. Top. Catal.2008, 49, 126–135.
(135) Narayanan, R.; El-Sayed, M. A. Catalysis with Transition Metal Nanoparticles in
Colloidal Solution: Nanoparticle Shape Dependence and Stability. J. Phys. Chem.
B2005, 109, 12663–12676.
(136) Narayanan, R.; El-Sayed, M. A. Shape-Dependent Catalytic Activity of Platinum
Nanoparticles in Colloidal Solution. Nano Lett.2004, 4, 1343–1348.
(137) Prieto, P. J. S.; Ferreira, A. P.; Haddad, P. S.; Zanchet, D.; Bueno, J. M. C. Designing
Pt Nanoparticles Supported on CeO2-Al 2O3: Synthesis, Characterization and
Catalytic Properties in the Steam Reforming and Partial Oxidation of Methane. J.
Catal.2010, 276, 351–359.
(138) Ribeiro, R. U.; Liberatori, J. W. C.; Winnishofer, H.; Bueno, M. C.; Zanchet, D.
Colloidal Co Nanoparticles Supported on SiO 2 : Synthesis , Characterization and
Catalytic Properties for Steam Reforming of Ethanol. Appl. Catal. B Environ.2009, 91,
670–678.
(139) Mourdikoudis, S.; Liz-Marzán, L. M. Oleylamine in Nanoparticle Synthesis. Chem.
Mater.2013, 25, 1465–1476.
(140) Na, K.; Zhang, Q.; Somorjai, G. A. Colloidal Metal Nanocatalysts: Synthesis,
Characterization, and Catalytic Applications. J. Clust. Sci.2014, 25, 83–114.
(141) Li, D.; Wang, C.; Tripkovic, D.; Sun, S.; Markovic, N. M.; Stamenkovic, V. R.
Surfactant Removal for Colloidal Nanoparticles from Solution Synthesis: The Effect on
Catalytic Performance. ACS Catal.2012, 2, 1358–1362.
(142) Blavo, S. O.; Qayyum, E.; Baldyga, L. M.; Castillo, V. A.; Sanchez, M. D.;
Warrington, K.; Barakat, M. A.; Kuhn, J. N. Verification of Organic Capping Agent
Removal from Supported Colloidal Synthesized Pt Nanoparticle Catalysts. Top.
Catal.2013, 56, 1835–1842.
(143) Huang, W.; Hua, Q.; Cao, T. Influence and Removal of Capping Ligands on Catalytic
Colloidal Nanoparticles. Catal. Letters2014, 144, 1355–1369.

113
(144) Aliaga, C.; Park, J. Y.; Yamada, Y.; Lee, H. S.; Tsung, C. K.; Yang, P.; Somorjai, G.
A. Sum Frequency Generation and Catalytic Reaction Studies of the Removal of
Organic Capping Agents from Pt Nanoparticles by UV-Ozone Treatment. J. Phys.
Chem. C2009, 113, 6150–6155.
(145) Crespo-Quesada, M.; Andanson, J.-M.; Yarulin, A.; Lim, B.; Xia, Y.; Kiwi-Minsker, L.
UV-Ozone Cleaning of Supported Poly(vinylpyrrolidone)-Stabilized Palladium
Nanocubes: Effect of Stabilizer Removal on Morphology and Catalytic Behavior.
Langmuir2011, 27, 7909–7916.
(146) Elliott, E. W.; Glover, R. D.; Hutchison, J. E. Removal of Thiol Ligands from Surface-
Confined Nanoparticles without Particle Growth or Desorption. ACS Nano2015, 9,
3050–3059.
(147) Sinha, a K.; Seelan, S.; Tsubota, S.; Haruta, M. Catalysis by Gold Nanoparticles:
Epoxidation of Propene. Top. Catal.2004, 29, 95–102.
(148) Borodko, Y.; Lee, H. S.; Joo, S. H.; Zhang, Y.; Somorjai, G. Spectroscopic Study of
the Thermal Degradation of PVP-Capped Rh and Pt Nanoparticles in H 2 and O 2
Environments. 2010, 1117–1126.
(149) Zhao, Y.; Jia, L.; Medrano, J. a; Ross, J. R. H.; Le, L. Supported Pd Catalysts Prepared
via Colloidal Method: The Effect of Acids. ACS Catal. 2013, 3, 2341–2352.
(150) Cargnello, M.; Chen, C.; Diroll, B. T.; Doan-Nguyen, V. V. T.; Gorte, R. J.; Murray,
C. B. Efficient Removal of Organic Ligands from Supported Nanocrystals by Fast
Thermal Annealing Enables Catalytic Studies on Well-Defined Active Phases. J. Am.
Chem. Soc. 2015, 137, 6906–6911.
(151) Niu, Z.; Li, Y. Removal and Utilization of Capping Agents in Nanocatalysis. Chem.
Mater. 2014, 26, 72–83.
(152) Lopez-sanchez, J. A.; Dimitratos, N.; Hammond, C.; Brett, G. L.; Kesavan, L.; White,
S.; Miedziak, P.; Tiruvalam, R.; Robert, L.; Carley, A. F.; et al. Facile Removal of
Stabiliser-Ligands from Supported Gold Nanoparticles. 2011, 27–59.
(153) Bartholomew, C. H. Mechanisms of Catalyst Deactivation. Appl. Catal. A Gen. 2001,
212, 17–60.
(154) Gracia, F. J.; Miller, J. T.; Kropf, a J.; Wolf, E. E. Kinetics, FTIR, and Controlled
Atmosphere EXAFS Study of the Effect of Chlorine on Pt-Supported Catalysts during

114
Oxidation Reactions. J. Catal. 2002, 209, 341–354.
(155) Oh, H. S.; Yang, J. H.; Costello, C. K.; Wang, Y. M.; Bare, S. R.; Kung, H. H.; Kung,
M. C. Selective Catalytic Oxidation of CO: Effect of Chloride on Supported Au
Catalysts. J. Catal. 2002, 210, 375–386.
(156) Liu, X.; Wang, A.; Li, L.; Zhang, T.; Mou, C.-Y.; Lee, J.-F. Structural Changes of Au–
Cu Bimetallic Catalysts in CO Oxidation: In Situ XRD, EPR, XANES, and FT-IR
Characterizations. J. Catal. 2011, 278, 288–296.
(157) Broqvist, P.; Molina, L. M.; Grönbeck, H.; Hammer, B. Promoting and Poisoning
Effects of Na and Cl Coadsorption on CO Oxidation over MgO-Supported Au
Nanoparticles. J. Catal. 2004, 227, 217–226.
(158) Cant, N. W.; Angove, D. E.; J. Patterson, M. The Effects of Residual Chlorine on the
Behaviour of Platinum Group Metals for Oxidation of Different Hydrocarbons. Catal.
Today 1998, 44, 93–99.
(159) Ponec, V. Alloy Catalysts: The Concepts. Appl. Catal. A Gen.2001, 222, 31–45.
(160) Bertolini, J. Model Catalysis by Metals and Alloys : From Single-Crystal Surfaces to
Well-Defined Nano-Particles. 2008, 138, 84–96.
(161) Llorca, J.; Ledesma, C.; Chimentão, R. J.; Medina, F.; Sueiras, J.; Angurell, I.; Seco,
M.; Rossell, O. Propene Epoxidation over TiO 2 -Supported Au – Cu Alloy Catalysts
Prepared from Thiol-Capped Nanoparticles. 2008, 258, 187–198.
(162) Abad, A.; Almela, C.; Corma, A.; García, H. Efficient Chemoselective Alcohol
Oxidation Using Oxygen as Oxidant. Superior Performance of Gold over Palladium
Catalysts. Tetrahedron 2006, 62, 6666–6672.
(163) Prieto, P. J. S.; Ferreira, a. P.; Haddad, P. S.; Zanchet, D.; Bueno, J. M. C. Designing
Pt Nanoparticles Supported on CeO2–Al2O3: Synthesis, Characterization and Catalytic
Properties in the Steam Reforming and Partial Oxidation of Methane. J. Catal.2010,
276, 351–359.
(164) Bauer, J. C.; Mullins, D. R.; Oyola, Y.; Overbury, S. H.; Dai, S. Structure Activity
Relationships of Silica Supported AuCu and AuCuPd Alloy Catalysts for the Oxidation
of CO. Catal. Letters2013.
(165) Comotti, M.; Li, W.-C.; Spliethoff, B.; Schüth, F. Support Effect in High Activity Gold

115
Catalysts for CO Oxidation. J. Am. Chem. Soc.2005, 128, 917–924.
(166) Li, X.; Chen, Q.; McCue, I.; Snyder, J.; Crozier, P.; Erlebacher, J.; Sieradzki, K.
Dealloying of Noble-Metal Alloy Nanoparticles. Nano Lett.2014, 14, 2569–2577.
(167) Baldizzone, C.; Gan, L.; Hodnik, N.; Keeley, G. P.; Kostka, A.; Heggen, M.; Strasser,
P.; Mayrhofer, K. J. J. Stability of Dealloyed Porous Pt/Ni Nanoparticles. ACS
Catal.2015, 5000–5007.
(168) Destro, P.; Marras, S.; Manna, L.; Colombo, M.; Zanchet, D. AuCu Alloy
Nanoparticles Supported on SiO2: Impact of Redox Pretreatments in the Catalyst
Performance in CO Oxidation. Catal. Today, 2016,
http://dx.doi.org/10.1016/j.cattod.2016.08.003.

116
Appendix
Appendix A
Supporting Information of Chapter 2
8 10 12 14 16 18 20
0
20
40
60
80
100
Num
ber o
f par
ticle
sSize (nm)
100°C14.0 1.0 nm
(a)
8 10 12 14 16 18 200
20
40
60
80
100
120
Num
ber o
f par
ticle
s
Size (nm)
120°C_I12.0 1.0
(b)

117
8 10 12 14 16 18 200
20406080
100120140160180
13.0 1.0 nm
Num
ber o
f par
ticle
s
Size (nm)
120 °C_F
(c)
8 10 12 14 16 18 200
5
10
15
20
25
30
Num
ber o
f par
ticle
s
Size (nm)
225°C_I13.01.0 nm
(d)
8 10 12 14 16 18 20
0
40
80
120
160
Num
ber o
f par
itcle
s
Size (nm)
225 °C_F14.01.0 nm
(e)

118
8 10 12 14 16 18 20
0
10
20
30
40
50
60
70
Num
ber o
f par
ticle
s
Size (nm)
260°C_I13.01.0 nm
(f)
8 10 12 14 16 18 200
50
100
150
200
Num
ber o
f par
ticle
s
Size (nm)
260°C_F13.01.0 nm
(g)
8 10 12 14 16 18 200
20406080
100120
140160
Num
ber o
f par
ticle
s
Size (nm)
280°C_I14.01.0 nm
(h)

119
8 10 12 14 16 18 20
0
20
40
60
80
100
Num
ber o
f par
ticle
s
Size (nm)
280°C_F14.01.0 nm
(i)
A1: TEM images during the synthesis at the points (a) 100°C, (b) 120°C_I, (c) 120°C_F, (d)
225°C_I, (e) 225_F, (f) 260_I, (g) 260_F, (h) 280_I and (i) 280_F

120
(a)
(b)
A2:HAADF-STEM imaging and STEM-EDS elemental analysis for the two samples obtained
at (a) 280_I and (b) 280_F

121
Appendix B
Supporting information of Chapter 3
B.1 Reactor design
A schematic representation of the home-made reactor for in situ XAFS measurements is
shown at Figure B1a. The reactor consist a round bottom flask with outer joint (1) and two
“arms” (2), all made in glass. On the two arms are two pistons (3) made in Teflon®, which are
fixed to the reactor by two devices (4). The X-rays cross the sample through the two pistons.
On the top of the piston there is a Kapton® window (5), an o-ring (6) and a piece to keep
everything together (7) even under harsh reaction conditions (250 0C and organic solvents).
The pistons allow adjusting the optical path, from about 0.3 mm to 10 mm according to the
sample concentration. Stirring is carried out by a stir plate. The heating is made by an
aluminum heating block (8) that matches perfectly to the reactor. Two cartridge resistances
(9) are coupled to the temperature controller. The temperature is monitored by a
thermocouple. The temperature can reach up to 250 0C without damaging the Kapton®
window. It the heating block is fixed to the beamline bench, facilitating the alignment of the
reactor. The reactor is coupled to a reflux system and connected to a nitrogen trap and to the
exhaustion system. Reaction can be conduct under inert gas by bubbling gas through the
reflux system. Figure B1b shows a picture of the set-up.
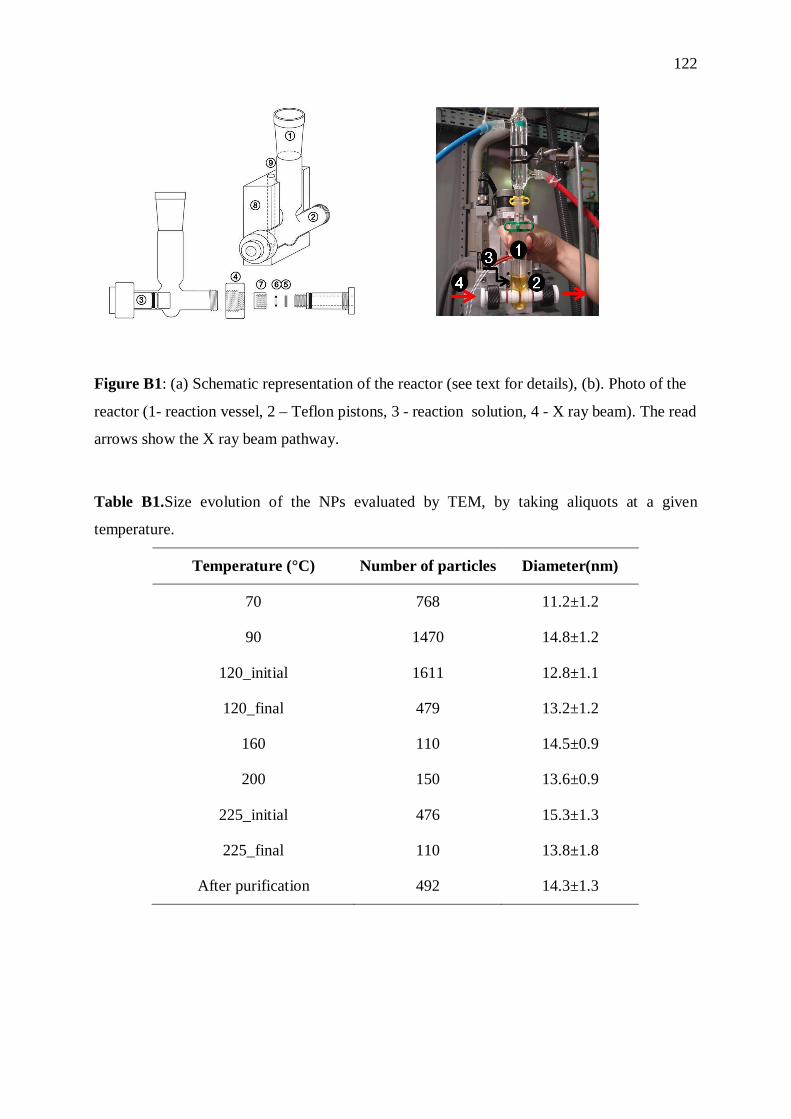
122
Figure B1: (a) Schematic representation of the reactor (see text for details), (b). Photo of the
reactor (1- reaction vessel, 2 – Teflon pistons, 3 - reaction solution, 4 - X ray beam). The read
arrows show the X ray beam pathway.
Table B1.Size evolution of the NPs evaluated by TEM, by taking aliquots at a given
temperature.
Temperature (°C) Number of particles Diameter(nm)
70 768 11.2±1.2
90 1470 14.8±1.2
120_initial 1611 12.8±1.1
120_final 479 13.2±1.2
160 110 14.5±0.9
200 150 13.6±0.9
225_initial 476 15.3±1.3
225_final 110 13.8±1.8
After purification 492 14.3±1.3

123
Figure B2.(a) STEM image and (b) elemental line-scan EDS-STEM for abimetallicNP.
Figure B3.Ex situ XANES spectra of standards at (a) Au L3-edge (HAuCl4 and Au foil) and
(b) Cu K-edge (Cu foil,Cu(acac)2, and Cu2O).
8950 8975 9000 9025 9050
Nor
mal
ized
abs
orpt
ion
Energy (eV)
bare Cu foils Cu(acac)2
Cu2O
(b)

124
Figure B4:.XANES spectra obtained at the Au L3-edge (a) and Cu K-edge (b). Panel (a)
AuCu NPs dispersionat 225 ºC and Au foil and panel (b) AuCu NPs dispersionat 225 ºC
andstandards (Cu foil,Cu(acac)2, and Cu2O).

125
Figure B5.Representative TEM images obtained by taking aliquots at 70, 90, 120, 160, 200,
and 225 ºC during the AuCu NPs synthesis.

126
Appendix C
Supporting information of Chapter 5
TableC1: %Cu obtained by ICP for theAu1-xCux nanoparticles studied in this work (colloidal
and supported) and total metal loading for the supported catalysts, .
Sample name molar Cu% wt % metal load
(Au+Cu)
Au0.75Cu0.25 25.57±0.08 --
Au0.60Cu0.40 41.35±0.04 --
Au0.50Cu0.50 48.79±0.07 --
Au0.75Cu0.25/Al2O3 23.08±0.09 1.87±0.03
Au0.60Cu0.40/Al2O3 40.16±0.22 2.01±0.19
Au0.50Cu0.50/Al2O3 45.47±0.25 1.72±0.11
Au0.75Cu0.25/SiO2 25.2 ± 0.5 1.87 ± 0.07
Au0.60Cu0.40/SiO2 34.2 ± 0.2 1.92 ± 0.01
Au0.50Cu0.50/SiO2 44.81 ± 0.2 1.75 ± 0.09

127
(a) (b) (c)
(d)
(e)
(f)
Figure C1. TEM imagesof (a) Au0.60Cu0.40 (b) Au0.60Cu0.40/Al2O3, (c) Au0.60Cu0.40/ SiO2 (d)
Au0.50Cu0.50 (e) Au0.50Cu0.50/Al2O3and (f) Au0.50Cu0.50/SiO2.
0 50 100 150 200 250 3000
102030405060708090
100 Run #2 Run #6
CO
Con
vers
ion
(%)
Temperature (°C)
Au0.75Cu0.25/Al2O3
(a)
0 50 100 150 200 250 3000
102030405060708090
100 Run #2 Run #6 Run #10
CO
Con
vers
ion
(%)
Temperature (°C)
Au0.60Cu0.40/Al2O3
(b)
0 50 100 150 200 250 3000
102030405060708090
100 Run #2 Run #6 Run #10
CO
Con
vers
ion
(%)
Temperature (°C)
Au0.50Cu0.50/Al2O3
(c)
0 50 100 150 200 250 3000
102030405060708090
100 Run #4 Run #8
CO
Con
vers
ion
(%)
Temperature (°C)
Au0.75Cu0.25/Al2O3
(d)
0 50 100 150 200 250 3000
102030405060708090
100 Run #4 Run #8 Run #12
CO
Con
vers
ion
(%)
Temperature (°C)
Au0.60Cu0.40/Al2O3
(e)
0 50 100 150 200 250 3000
102030405060708090
100 Run #4 Run #8 Run #12
CO
Con
vers
ion
(%)
Temperature (°C)
Au0.50Cu0.50/Al2O3
(f)
Figure C2:Catalytic activity in CO oxidation(Runs #2, #6 and #10) after oxidative
pretreatments for (a) Au0.75Cu0.25/Al2O3, (b) Au0.60Cu0.40/Al2O3 and (c) Au0.50Cu0.50/Al2O3, and
after reductive pretreatments (Runs #4, #8 and #12) for (d) Au0.75Cu0.25/Al2O3, (e)
Au0.60Cu0.40/Al2O3 and (f) Au0.50Cu0.50/Al2O3.

128
0 50 100 150 200 250 3000
20
40
60
80
100 Run #2 Run #6 Run #10
CO
Con
vers
ion
(%)
Temperature (°C)
Au0.60Cu0.40/SiO2
(a)
0 50 100 150 200 250 3000
20
40
60
80
100 Run #2 Run #6 Run #10
CO
Con
vers
ion
(%)
Temperature (°C)
Au0.60Cu0.40 /SiO2
(b)
0 50 100 150 200 250 3000
20
40
60
80
100
Au0.50Cu0.50/SiO2
Run #2 Run #6 Run #10
CO
Con
vers
ion
(%)
Temperature (°C)
(c)
0 50 100 150 200 250 3000
20
40
60
80
100 Run #4 Run #8 Run #12
CO
Con
vers
ion
(%)
Temperature (°C)
Au0.75Cu0.25/SiO2
(d)
0 50 100 150 200 250 3000
20
40
60
80
100
Au0.60Cu0.40/SiO2
Run #4 Run #8 Run #12
CO
Con
vers
ion
(%)
Temperatura (°C)
(e)
0 50 100 150 200 250 3000
20
40
60
80
100
Au0.50Cu0.50/SiO2
Run #4 Run #8 Run #12
CO
Con
vers
ion
(%)
Temperature (°C)
(f)
Figure C3:Catalytic activity in CO oxidation(Runs #2, #6 and #10) after oxidative
pretreatments for (a) Au0.75Cu0.25/SiO2, (b) Au0.60Cu0.40/SiO2 e (c) Au0.50Cu0.50/SiO2, and after
reductive pretreatments (Runs #4, #8 and #12) for (d) Au0.75Cu0.25/SiO2, (e) Au0.60Cu0.40/SiO2 e
(f) Au0.50Cu0.50/SiO2. In the case of Runs #2 of SiO2 supported samples the lower CO
conversion can be related to the presence of chloride species on the support from the colloidal
samples. Details about this trend were discussed by some of us on Destroet. al. (CatTodpaper)

129
30 35 40 45 50 55 60
0
20
40
60
80
100
Inte
nsity
(Arb
. Uni
ts)
2 (°)
Signal difference
Al2O3
Au1-xCux/Al2O3
Au1-xCux/Al2O3
(a)
30 35 40 45 50 55 60
20
40
60
80
Inte
nsity
(Arb
. uni
ts)
2
Au1-xCux/SiO2
Au1-x
Cux/SiO
2
SiO2
Signal difference
(b)
Figure C4: XRD patterns ofAu0.70Cu0.30/Al2O3, Al2O3 and the difference between
Au0.70Cu0.30/Al2O3 and Al2O3 (b)XRD patterns ofAu0.70Cu0.30/SiO2, SiO2 and the difference
between Au0.70Cu0.30/SiO2 and SiO2.
34 36 38 40 42
Inte
nsity
(Arb
. Uni
ts)
2 (°)
350°C
325°C
300°C
290°C
220°C
250°C
200°C150°C
100°C
25°C
(a)
34 36 38 40 422
Inte
nsity
(Arb
. Uni
ts.)
350°C
325°C
300°C
290°C
220°C
250°C
200°C
150°C100°C
25°C
(b)

130
50 100 150 200 250 300 3500
10
20
30
40%
Cu
Temperature (°C)
%Cu domain #1%Cu domain #2
(c)
50 100 150 200 250 300 3500
10
20
30
40 %Cu domain#1%Cu domain#2
% C
u
Temperature (°C)
(d)
Figure C5: XRD patterns ofAu0.70Cu0.30/Al2O3 in the range of 2θ=34-43° at specific
temperatures during the activation and best fits of patterns at 25, 100 and 150 °C using two
Gaussians. (b)XRD patterns ofAu0.70Cu0.30/SiO2 in the range of 2θ=34-43° at specific
temperatures during the activation and best fits of patterns at 25, 100 and 150 °C using two
Gaussians. (c) Quantification of Cu related to domain #1, domain #2 and the global
composition of Cu based on the relative areas.
34 36 38 40 42 44 46
10
20
30
40
Inte
nsity
(Arb
. Uni
ts)
2
Original signal Domain #1 Domain #2 Total area
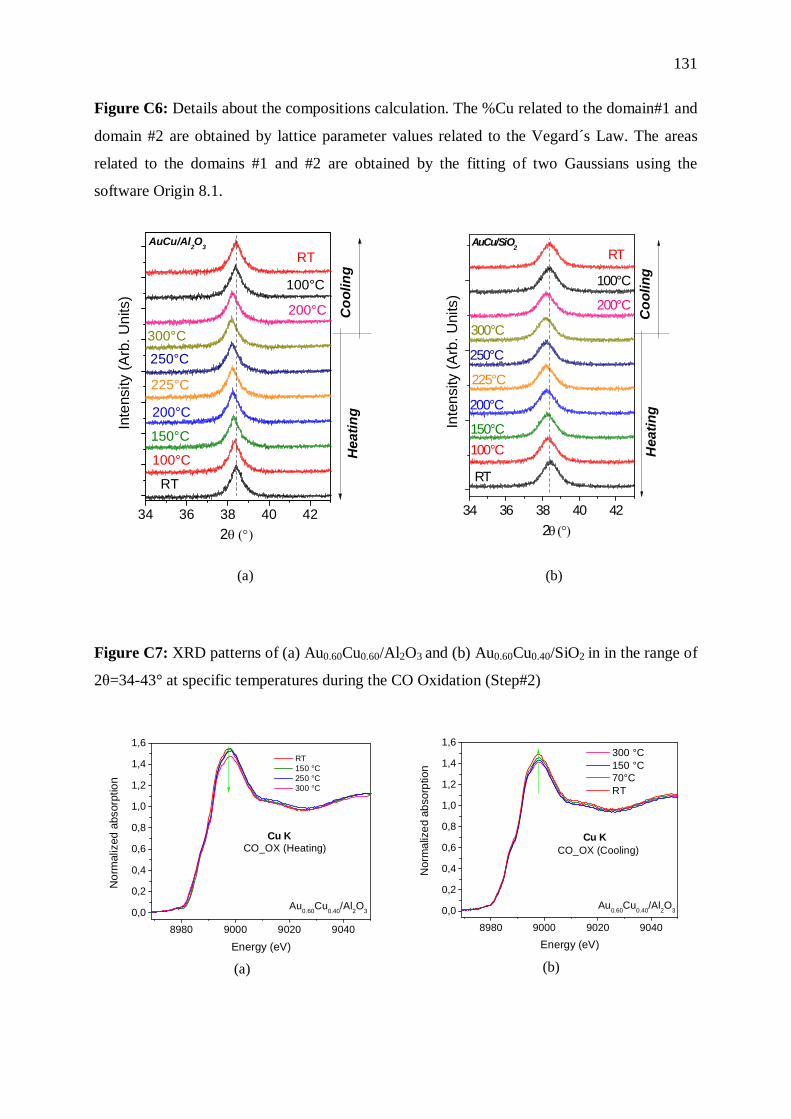
131
Figure C6: Details about the compositions calculation. The %Cu related to the domain#1 and
domain #2 are obtained by lattice parameter values related to the Vegard´s Law. The areas
related to the domains #1 and #2 are obtained by the fitting of two Gaussians using the
software Origin 8.1.
34 36 38 40 42
Coo
ling
RT
100°C
200°C
300°C
250°C
225°C
200°C
150°C
100°C
Inte
nsity
(Arb
. Uni
ts)
2
RT
Hea
ting
AuCu/Al2O3
(a)
34 36 38 40 42
AuCu/SiO2
Coo
ling
RT
100°C
200°C
300°C
250°C
225°C
200°C
150°C100°C
Inte
nsity
(Arb
. Uni
ts)
2
RT
Hea
ting
(b)
Figure C7: XRD patterns of (a) Au0.60Cu0.60/Al2O3 and (b) Au0.60Cu0.40/SiO2 in in the range of
2θ=34-43° at specific temperatures during the CO Oxidation (Step#2)
8980 9000 9020 90400,0
0,2
0,4
0,6
0,8
1,0
1,2
1,4
1,6
Nor
mal
ized
abs
orpt
ion
Energy (eV)
RT 150 °C 250 °C 300 °C
Cu KCO_OX (Heating)
Au0.60Cu0.40/Al2O3
(a)
8980 9000 9020 90400,0
0,2
0,4
0,6
0,8
1,0
1,2
1,4
1,6
Nor
mal
ized
abs
orpt
ion
Energy (eV)
300 °C 150 °C 70°C RT
Cu KCO_OX (Cooling)
Au0.60Cu0.40/Al2O3
(b)

132
8980 9000 9020 90400,0
0,2
0,4
0,6
0,8
1,0
1,2
1,4
1,6
Nor
mal
ized
abs
orpt
ion
Energy (eV)
RT 150 °C 250 °C 300 °C
CO_OX (Heating)Cu K
Au0.60Cu0.40/SiO2
(c)
8980 9000 9020 9040
0,0
0,2
0,4
0,6
0,8
1,0
1,2
1,4
1,6
Nor
mal
ized
abs
orpt
ion
Energy (eV)
300 °C 150 °C 70 °C RT
Cu KCO_OX (Cooling)
Au0.60Cu0.40/SiO2
(d)
Figure C8: (a) XANES Cu-K of Au0.60Cu0.40/Al2O3 under CO + O2 atmosphere at Step#2
during (a) heating and (b) cooling at specific temperatures. (a) XANES Cu-K of
Au0.60Cu0.40/SiO2 under CO + O2 atmosphere at Step#2 during (a) heating and (b) cooling at
specific temperatures.
34 36 38 40 42
Inte
nsity
(Arb
. Uni
ts)
2
350°C
325°C
300°C
290°C
250°C
220°C
200°C
150°C
100°C
25°C
(a)
34 36 38 40 42
Inte
nsity
(Arb
Uni
ts)
2
350°C
325°C
300°C
290°C
250°C
220°C
200°C150°C
100°C
25°C
(b)

133
50 100 150 200 250 300 350
0
5
10
15
20
25
30
35
40
Temperature (°C)
Au0.60Cu0.40/Al2O3
%C
u
%Cu domain #1%Cu domain #2
(C)
0 50 100 150 200 250 300 350 4000
5
10
15
20
25
30
35
40
% C
u
Temperature (°C)
Au0.60Cu0.40/SiO2
%Cu
(D)
Figure C9: XRD patterns ofAu0.60Cu0.40/Al2O3in the range of 2θ=34-43° at specific
temperatures during the reduction and best fits of patterns at 200, 220, 290, 300, 325 and 350
°C using two Gaussians. (b)XRD patterns ofAu0.60Cu0.40/SiO2in the range of 2θ=34-43° at
specific temperatures during the reduction and best fits of patterns at 25, 100 and 150 °C
using one Gaussian.

134
Appendix D
Permission to use paper the paper:
“Au1-xCux colloidal nanoparticles synthesized via a one-pot approach: understanding the
temperature effect on the Au:Cu ratio”
Priscila Destro, Massimo Colombo, Mirko Prato, Rosaria Brescia, Liberato Manna and
Daniela Zanchet.
Dear Priscila
The Royal Society of Chemistry (RSC) hereby grants permission for the use of your paper(s) specified below in the printed and microfilm version of your thesis. You may also make available the PDF version of your paper(s) that the RSC sent to the corresponding author(s) of your paper(s) upon publication of the paper(s) in the following ways: in your thesis via any website that your university may have for the deposition of theses, via your university’s Intranet or via your own personal website. We are however unable to grant you permission to include the PDF version of the paper(s) on its own in your institutional repository. The Royal Society of Chemistry is a signatory to the STM Guidelines on Permissions (available on request).
Please note that if the material specified below or any part of it appears with credit or acknowledgement to a third party then you must also secure permission from that third party before reproducing that material. Please ensure that the thesis states the following:
Reproduced by permission of The Royal Society of Chemistry and include a link to the paper on the Royal Society of Chemistry’s website.
Please ensure that your co-authors are aware that you are including the paper in your thesis.
Regards
Gill Cockhead
Publishing Contracts & Copyright Executive
Gill Cockhead Publishing Contracts & Copyright Executive
Royal Society of Chemistry,
Thomas Graham House, Science Park, Milton Road, Cambridge, CB4 0WF,
UKTel +44(0)1223432134

135
Appendix E
Permission to use paper the paper:
AuCu alloy nanoparticles supported on SiO2: Impact of redox pretreatments in the catalyst
performance in CO oxidation
Priscila Destro, Sergio Marras, Liberato Manna, Massimo Colombo, Daniela Zanchet
This Agreement between Priscila Destro and Elsevier consists of your license details and the terms and conditions provided by Elsevier and Copyright Clearance Center.
License Number 3975910444492
License date Oct 20, 2016
Licensed Content Publisher Elsevier
Licensed Content Publication Catalysis Today
Licensed Content Title AuCu alloy nanoparticles supported on SiO2: Impact of redox pretreatments in the catalyst performance in CO oxidation
Licensed Content Author Priscila Destro, Sergio Marras,Liberato Manna, Massimo Colombo, Daniela Zanchet
Licensed Content Date Available online 6 August 2016
Licensed Content Volume Number n/a
Licensed Content Issue Number n/a
Licensed Content Pages 1
Start Page
End Page
Type of Use Reuse in a thesis/dissertation
Portion full article
Format print
Are you the author of this Elsevier article?
Yes
Will you be translating? No
Order reference number
Title of your thesis/dissertation Gold-copper colloidal nanoparticles: Insights about

136
the alloy formation and application in CO oxidation reaction
Expected completion date Dec 2016
Estimated size (number of pages) 150
Elsevier VAT number GB 494 6272 12

137
Appendix F
DECLARAÇÃO
As cópias dos documentos de minha autoria ou de minha co-autoria, já publicados ou
submetidos para publicação em revistas científicas ou anais de congressos sujeitos a
arbitragem, que constam da minha Dissertação/Tese de Mestrado/Doutorado, intitulada
”NANOPARTÍCULAS COLOIDAIS DE COBRE-OURO: CONSIDERAÇÕES SOBRE
A FORMAÇÃO DA LIGA E APLICAÇÃO NA REAÇÃO DE OXIDAÇÃO DE CO”
não infringem os dispositivos da Lei nº 9.610/98, nem o direito autoral de qualquer editora.
Campinas, 24 de outubro de 2016
Priscila Destro
R.G. nº 43.726.551-1
Daniela Zanchet (Orientadora)
RG nº 34.443.884-3