université de grenoble thèse - sfbiophys.org · université de grenoble thèse pour obtenir le...
TRANSCRIPT

Université de Grenoble
Thèse
Pour obtenir le grade de
DOCTEUR DE L’UNNIVERSITE DE GRENOBLE
Spécialité : Physique pour les sciences du vivant
Arrêté ministériel : 7 août 2006
Présentée et soutenue publiquement par
MARCUS TRAPP
le 9 décembre 2010
Neutron scattering studies of the dynamics of biological systems asa function of hydration, temperature and pressure
La dynamique de systèmes biologiques en fonction del’hydratation, de la température et de la pression étudiée par
diffusion neutronique
Thèse dirigée par Prof. Dr. Judith Peters
Membres du Jury
Prof. Dr. Gerald Kneller RapporteurProf. Dr. Maikel C. Rheinstädter RapporteurUni. Doz. Dr. Ruth Prassl ExaminateurDr. Thomas Gutberlet ExaminateurDr. Francesca Natali ExaminateurDr. Moeava Tehei Président
Thèse préparée à l’Institut de Biologie Structurale J.-P. Ebel, CEA/CNRS/UJF, Grenoble eta l’Institut Laue-Langevin, Grenoble dans l’Ecole Doctorale de Physique


Contents
Acknowledgments 1
1 Introduction 3
2 Résumé de la thèse en français 7
3 Thermal neutron scattering 113.1 General introduction and properties of the neutron . . . . . 113.2 Interaction between neutrons and matter . . . . . . . . . . . 123.3 Scattering law . . . . . . . . . . . . . . . . . . . . . . . . . . . 133.4 Neutron sources and transport . . . . . . . . . . . . . . . . . 163.5 Spectrometers . . . . . . . . . . . . . . . . . . . . . . . . . . . 18
3.5.1 Backscattering spectrometers . . . . . . . . . . . . . . 193.5.2 Time-of-Flight spectrometers . . . . . . . . . . . . . . 22
3.6 Energy resolved neutron scattering . . . . . . . . . . . . . . . 253.6.1 Elastic neutron scattering . . . . . . . . . . . . . . . . 263.6.2 Quasi-elastic neutron scattering . . . . . . . . . . . . 27
4 The backscattering spectrometer IN13 334.1 Detailed instrument description . . . . . . . . . . . . . . . . . 334.2 Instrument development . . . . . . . . . . . . . . . . . . . . . 35
5 Model lipids 415.1 Historical overview . . . . . . . . . . . . . . . . . . . . . . . . 415.2 Model lipid DMPC and its phase behaviour . . . . . . . . . . 425.3 Sample preparation . . . . . . . . . . . . . . . . . . . . . . . . 45
5.3.1 Oriented samples . . . . . . . . . . . . . . . . . . . . . 455.3.2 DMPC in solution for the high pressure experiments 46
6 Elastic measurements 496.1 Sample characterisation at D16 . . . . . . . . . . . . . . . . . 506.2 Elastic measurements at IN13 . . . . . . . . . . . . . . . . . . 51
6.2.1 Results and discussion . . . . . . . . . . . . . . . . . . 536.3 Elastic measurements at IN16 . . . . . . . . . . . . . . . . . . 55
i

ii CONTENTS
6.3.1 Results and discussion . . . . . . . . . . . . . . . . . . 59
7 Quasi-elastic measurements 617.1 Sample characterisation at TREFF . . . . . . . . . . . . . . . . 617.2 The measurement . . . . . . . . . . . . . . . . . . . . . . . . . 617.3 Results and discussion . . . . . . . . . . . . . . . . . . . . . . 627.4 Conclusions . . . . . . . . . . . . . . . . . . . . . . . . . . . . 677.5 Conclusion en français . . . . . . . . . . . . . . . . . . . . . . 69
8 High pressure experiments on DMPC 738.1 Introduction . . . . . . . . . . . . . . . . . . . . . . . . . . . . 758.2 Diffraction experiments on D16 . . . . . . . . . . . . . . . . . 778.3 Elastic experiments on IN13 . . . . . . . . . . . . . . . . . . . 778.4 Future perspectives . . . . . . . . . . . . . . . . . . . . . . . . 798.5 Perspectives . . . . . . . . . . . . . . . . . . . . . . . . . . . . 80
9 Neutron scattering studies of human acetylcholinesterase 839.1 Introduction . . . . . . . . . . . . . . . . . . . . . . . . . . . . 839.2 Sample preparation and characterisation . . . . . . . . . . . . 87
9.2.1 Purification of recombinant human AChE . . . . . . . 879.2.2 Sample preparation for neutron scattering . . . . . . 88
9.3 Elastic experiments . . . . . . . . . . . . . . . . . . . . . . . . 889.3.1 Instrumental aspects and data analysis . . . . . . . . 899.3.2 Determination of atomic mean-square displacements 919.3.3 Results . . . . . . . . . . . . . . . . . . . . . . . . . . . 91
9.4 Comparison between AChE and BChE . . . . . . . . . . . . . 1019.5 Quasi-elastic experiments . . . . . . . . . . . . . . . . . . . . 1119.6 Conclusion and outlook . . . . . . . . . . . . . . . . . . . . . 1169.7 Conclusion en français . . . . . . . . . . . . . . . . . . . . . . 117
Appendix I
A Abbreviations I
B Physical constants III
C Amino acid composition of hAChE V
D Articles VIID.1 Elastic scattering studies of aligned DMPC multilayers on
different hydrations . . . . . . . . . . . . . . . . . . . . . . . . VIID.2 Hydration dependent studies of highly aligned multilayer
lipid membranes by neutron scattering . . . . . . . . . . . . . XVD.3 Dynamics of model membranes . . . . . . . . . . . . . . . . . XXIII

CONTENTS iii
List of tables XLI
List of figures XLV
Bibliography XLVII

iv CONTENTS

Acknowledgment
First of all, I would like to thank my supervisor Prof. Dr. Judith Peters,for her support, encouragement and guidance, without which this workwould not have been possible.
I am grateful to the members of the jury, Prof. Dr. Gerald Kneller andProf. Dr. Maikel C. Rheinstädter, who accepted to be the referees of thiswork, and also Uni. Doz. Dr. Ruth Prassl, Dr. Thomas Gutberlet, Dr.Moeava Tehei and Dr. Francesca Natali for being part of the jury.
Of course this was not an isolated work but has to been seen in thelarger context, so I would like to thank all co-workers on the DMPC project:Thomas for his support during the hardest time of my Ph.D., Fanni formany questions and help for the data analysis, Moeava for many challeng-ing questions, which made me learn a lot.In the course of the AChE project I am grateful for the support I receivedfrom Marie Trovalet, Florian Nachon and Patrick Masson.
I want to thank IN13 team, which I had the pleasure to be a part of dur-ing the last three years. The two responsible, Francesca and Judith, but alsothe other students Chiara, Wiebke and Carlotta. Not to forget the techni-cians Ismaël, Teddy and Mathieu.
All of my experiments would not have been possible without the helpof the local contacts, even if it was not always apparent. Therefore I wantto thank Bruno Demé, Tobias Unruh, Karin Schmalzl, Marek Michael Kozaand Lambert van Ejick for their support.
Support from ILL is very much appreciated. To name all people wouldclearly exceed the remit of these acknowledgment, therefore only some arementioned here. I want to thank Jérôme Locatelli for the help when LAMPwas not doing what I wanted, Franck Rey for many hardware checks andreversing two important cables and for the cryo team Xavier Tonon. A bigthank you goes to the high pressure experts Jean-Luc Laborier and ClaudePayre, who were heavily involved in the development and testing of thehigh pressure cell.
1

2 CONTENTS
I am grateful to Hanna Wacklin and Giovanna Fragneto, who help meout with DMPC for the high pressure experiment on IN13.
I am thankful to Anna, Stu, Peggy, Jochen, Martin, Bastian and Marekfor the company, sometimes in the middle of the night, and a lot of afterhours coffee breaks and the company at rainy barbecues. A special thankyou goes to Audrey and Kent for their enthusiasm during our term as stu-dent representatives. For proofreading and correcting my French and En-glish I want to say thank you to Estelle and Anna.
For for answering many questions from a physicist entering the field ofbiophysics, and for many fruitful discussions I want to say thank you toAndreas, Marion, Sebastian and Julia.
I am grateful for my grant from the French Ministry for Research andTechnology. The project to study the dynamics of human achetylcholinesterasewas partly funded by DGA under the contract REI n° 2009340023. I ac-knowledge also the financial support from the Access to Major ResearchFacilities Program which is a component of the International Science Link-ages Program established under the Australian Government’s innovationstatement, Backing Australia’s Ability.
I want to thank all my friends in Viernheim, especially Anja and Ankefor their friendship and two amazing weddings.
A big thank you go to Eva proof-reading, motivation, supporting andstanding me during beam times and writing up and for many, many otherthings.
Last but not least I want to thank my parents for the possibility tostudy abroad and the encouragement during this time. And also my uncle,aunt, cousins and their families for very warm welcomes every time I camehome.

Chapter 1
Introduction
For a long time lipids, and membranes made out of these lipids, werethought of as building blocks of cells, having not so prominent tasks ase.g. proteins. Fulfilling their function as cell boundaries, they cover a totalsurface area of about 100 km2 in a single human being. In recent years theknowledge about their role has been extended. It was found that lipids actnot only as passive solvents for membrane proteins, but play also an inte-gral part of cellular function. They can act as enzymes, receptors, drugs aswell as regulators.Real cell membranes are highly complex systems, which consist not only ofseveral different kinds of lipids, but also of membrane proteins and mem-brane active molecules such as cholesterol. Therefore model membranesystems such as 1,2-dimyristoyl-sn-glycero-3-phosphocholine (DMPC) areoften used to mimic their more complex natural counterparts, because theyshow a similar thermodynamical behaviour. Depending on temperature,pressure or amount of water in the system the dynamic behaviour of thesemodel systems can be effected. Hence, knowledge of these interactions arecrucial to better understand the parameters necessary for the functioningof biological membranes and what precisely are their effects.In the first part of this work the results of elastic and quasi-elastic neutronscattering experiments on DMCP multilayers as a function of hydrationwill be discussed in more detail. Analogous to the investigation of lipid dy-namics, in the second part of this thesis the investigation of a protein undervarious external conditions via neutron scattering is described. This ansatzforms an extension of the methodology already described in the chaptersdealing with DMPC.Molecular dynamics of pure recombinant human acetylcholinesterase(hAChE) and inhibited by Huperzine A using elastic, quasi-elastic and in-elastic neutron scattering will be described. This enzyme plays an impor-tant role in the termination of nerve impulses via the hydrolysis of the neu-rotransmitter acetylcholin. Therefore it is a primary target of neurotoxins.
3

4
In recent years the investigation of AChE has also gained interest in thetreatment of neural diseases such as Alzheimer’s disease or myastheniagravis, where the hydrolysis of ACh is defective.
The energy E and wavelength λ of cold and thermal neutrons lies in themillielectron volt and Ångstrom range, therefore neutron scattering is verywell suited to investigate dynamics in the pico- to nanosecond timescaleand on a atomic length scale. A big advantage of neutron scattering overother techniques is the fact that it is isotope selective, this means there is alarge difference of the incoherent scattering cross section of hydrogen anddeuterium (about one order of magnitude). Samples such as proteins ormembranes comprise about 50% hydrogen atoms, thus neutron scatteringprobes an average over the whole sample and perdeuteration can eventu-ally be used to “mask” some parts.
After an introduction to the general properties of the neutron, in chap-ter 3 an overview of the theory of thermal neutron scattering is given,herein section 3.6 introduces the models for elastic (section 3.6.1) and quasi-elastic (section 3.6.2) incoherent neutron scattering used for data treatmentin chapters 6 - 9. A brief presentation of research neutron sources and theprinciple of spectrometers used for this work, namely backscattering andtime-of-flight spectrometers, is also part of this chapter.
The thermal backscattering spectrometer IN13 is presented in detail in chap-ter 4. In the course of my Ph.D. work I was highly involved in the opera-tion and the maintenance of this collaborating research group (CRG) instru-ment. The chapter starts with a description of the design of the instrument.Examples of the instrument development, which led to a significant im-provement of the instrument’s performance, are given also.
After a short historical introduction, the model lipid DMPC and its thermo-dynamical characteristics are reviewed in chapter 5, thereafter the samplepreparation for the experiments described in the chapters 6 and 7 is out-lined.
The neutron scattering experiments performed on DMPC are described indetail in chapters 6 and 7. Chapter 6 deals with the elastic experimentscontains results from two different sets of measurements, one performedon IN13 (section 6.2), the second one done on IN16 (section 6.3), both in-struments are situated at the Institut Laue-Langevin in Grenoble, France. Intotal samples with four different hydration levels were prepared on a solidsupport of silicon wafers. Thanks to their very good alignment, in-planeand out-of-plane dynamics of the membranes could be probed. Results ob-tained during the IN13 experiments showed a clear shift to higher temper-

CHAPTER 1. INTRODUCTION 5
atures of the lipid main phase transition for decreasing water content andserved also as preparation for the quasi-elastic measurements performed atthe Munich research reactor FRM II.
The experiments performed on IN16 and described in section 6.3 allowed acomparison between summed intensities and mean square displacements(msd) of two samples at low hydration. It was shown that the decreaseof the elastic intensity, which occurs at the main phase transition, is corre-lated with an increased mobility, indicated by a change of slope of the meansquare displacements. The results from this experiment were published inthe journal “Spectroscopy” as part of the proceedings of the XIII EuropeanConference on the Spectroscopy of Biological Molecules, where this workwas presented, and are part of the appendix of this manuscript (cf sectionD.1).
The quasi-elastic experiments performed on the time-of-flight spectrometerTOFTOF of the FRM II research reactor in Munich are outlined in chapter 7.The same samples employed for the elastic experiments on IN13 were alsoused for these measurements. Elastic incoherent structure factors (EISF)could be extracted. Different models had to be fitted to the data to take intoaccount the effects of hydration. The obtained findings from the TOFTOFand IN13 experiments resulted in a paper, which is published in “The Jour-nal of Chemical Physics” and can be found in the appendix to this work insection D.2.
Temperature scans are nowadays routinely used to investigate dynamicsof biomolecules by neutron scattering. In contrast high hydrostatic pres-sure is under represented in combination with neutron scattering due toengineering difficulties. With the investigation of high pressure, a secondthermodynamical variable can be explored apart from temperature scans.Pressure has a similar effect on membranes as to reduce the hydration oflipid bilayers, thus the experiments described in chapter 6 and 7 are com-plementary to the high pressure investigations started now. The develop-ment of a new high pressure equipment and first diffraction and spectro-scopic measurements on DMPC are described in chapter 8.
The investigation on AChE is described in chapter 9. After a general in-troduction to AChE and depiction of the sample preparation, the elasticexperiments are delineated in section 9.3. This section is based on a paper,which has been submitted to “Physical Chemistry Chemical Physics”. Cover-ing two orders of magnitude in instrumental resolution allows to observemean square displacements on different time scales, ranging from about10-1000 ps. In section 9.4 a comparison with results obtained on humanbutyrylcholinesterase (BChE) is drawn. The data published by Gabel and

6
co-workers show remarkable differences to our results on AChE, even ifthe function and structure of both enzymes are quite similar.Finally in section 9.5 the results of quasi-elastic measurements on AChE atIN6 are elaborated.

Chapter 2
Résumé de la thèse en français
Pendant longtemps, les lipides et les membranes, qui sont elle-même consti-tuées de lipides, ont été considérés comme simples composantes des cel-lules, n’ayant pas autant de fonctions que les protéines, par exemple. Entant que limites des cellules biologiques, ils couvrent une surface totaled’environ 100 km2 dans un être humain. Ces dernières années, la connais-sance de leurs fonctions a pourtant bien évolué. On a constaté que les li-pides n’agissent pas seulement comme solvants passifs pour les protéinesmembranaires, mais font partie de la fonction cellulaire. Ils peuvent agir entant qu’enzymes, récepteurs, médicaments ainsi que régulateurs.Les membranes cellulaires biologiques sont des systèmes très complexesqui ne contiennent pas seulement plusieurs types de lipides, mais aussides protéines membranaires et des molécules actives telles que le choles-térol. C’est pourquoi les systèmes modèles de membranes comme le 1,2-dimyristoyl-sn-glycéro-3-phosphocholine (DMPC) sont souvent utilisés pourimiter leurs homologues naturels plus complexes, car ils ont un comporte-ment thermodynamique similaire. Selon la température, la pression ou laquantité d’eau dans le système le comportement dynamique de ces mo-dèles peut être effectuée. Par conséquent, la connaissance de ces interac-tions est cruciale pour mieux comprendre les paramètres nécessaires aufonctionnement des membranes biologiques et quels sont exactement leurseffets.Dans la première partie de ce travail, les résultats de la diffusion élastiqueet quasi-élastique de neutrons sur les multicouches DMCP en fonction del’hydratation seront discutés. Analogue à l’investigation de la dynamiquedes lipides, dans la deuxième partie de cette thèse l’investigation d’uneprotéine dans diverses conditions externes par la diffusion neutronique estdécrite. Cette approche formes une extension de la méthode déjà décritedans les chapitres sur DMPC.La dynamique moléculaire de l’acétylcholinestérase humaine recombinante(hAChE), pure et inhibée par HuperzineA, sera décrite utilisant la diffusion
7

8
de neutrons élastique, quasi-élastique et inélastique. Cette enzyme joue unrôle important dans l’achèvement des impulsions nerveuses par l’hydro-lyse du neurotransmetteur acétylcholine. Par conséquent, c’est une cibleprimaire des neurotoxines. Ces dernières années, l’étude de l’AChE a éga-lement suscité l’intérêt dans le cadre du traitement des maladies neurolo-giques, comme la maladie d’Alzheimer ou la myasthénie grave, où l’hy-drolyse de l’acétylcholine est défectueuse.
L’énergie E et la longueur d’onde λ des neutrons froids et thermiques sesituent dans le domaine des milli-électronvolts et des Ångstroms, la dif-fusion de neutrons est donc très bien adaptée à l’étude de la dynamiquedans le domaine de la pico- à la nanoseconde et sur une échelle de lon-gueur atomique. Un grand avantage de la diffusion neutronique par rap-port à d’autres techniques provient du fait qu’elle est sélective entre diffé-rents isotopes, cela signifie qu’il ya une grande différence entre la sectionefficace incohérente de l’hydrogène et du deutérium (environ un ordre degrandeur). Les échantillons tels que les protéines ou les membranes com-portent environ 50% d’atomes d’hydrogène, les neutrons mesurent doncune moyenne sur l’ensemble de l’échantillon. La deutériation peut éven-tuellement être utilisée pour "masquer" certaines parties.
Après une introduction des propriétés générales des neutrons dans le cha-pitre 3, un aperçu de la théorie de la diffusion des neutrons thermiques estdonnée. Dans la section 3.6 des modèles sont présentés pour décrire la dif-fusion incohérente neutronique élastique (section 3.6.1) et quasi-élastique(section 3.6.2), qui seront utilisés pour le traitement des données dans leschapitres 6 - 9. Une brève présentation des sources de neutrons pour la re-cherche et du principe des spectromètres utilisés pour ce travail, à savoirdes spectromètres à rétrodiffusion et des spectromètres en temps de vol,fait aussi partie de ce chapitre.
Le spectromètre thermique à rétrodiffusion IN13 est présenté en détailsdans le chapitre 4. Au cours de mon travail doctoral, j’ai été très impli-qué dans l’opération et le maintien de cet instrument d’un “collaboratingresearch group” (CRG). Le chapitre commence par une description de laconception de l’instrument. Des exemples du développement de l’instru-ment, qui a entraîné une importante amélioration de sa performance, sontexposés dans la suite.
Après une brève introduction historique, le lipide DMPC et ses caractéris-tiques thermodynamiques sont présentés dans le chapitre 5, puis la prépa-ration des échantillons pour les expériences sont décrites dans les chapitres6 et 7.
CHAPTER 2. RÉSUMÉ DE LA THÈSE EN FRANÇAIS 9
Les expériences de diffusion de neutrons effectuées sur DMPC sont dé-crites en détails dans les chapitres 6 et 7. Le chapitre 6 sur les expériencesélastiques contient les résultats de deux séries de mesures différentes, l’uneeffectuée sur IN13 (section 6.2), l’autre sur IN16 (section 6.3). Les deux ins-truments se trouvent à l’Institut Laue-Langevin à Grenoble, France. Au to-tal, quatre échantillons avec des niveaux d’hydratation différents ont étépréparés sur un support solide de plaquettes en silicium. Grâce à leur ex-cellent alignement, la dynamique des bicouches dans le plan et perpendicu-laire à la normale des bichouches pouvait être sondée. Les résultats obtenuslors des expériences sur IN13 ont clairement montré un déplacement de latransition de phase lipidique principale vers des températures plus élevéespour des hydratations plus basses et ils ont également servi pour préparerles mesures quasi-élastiques réalisées à Munich au réacteur de rechercheFRM II.
Les expériences réalisées sur IN16 et décrites dans la section 6.3 ont per-mis de faire une comparaison entre les intensités sommées et les déplace-ments carrés moyens (msd) de deux échantillons à faible hydratation. Ila été montré que la diminution de l’intensité élastique à la transition dephase principale est corrélée avec une mobilité accrue, qui se manifeste parun changement du coefficient directeur des déplacements carrés moyens.Les résultats de cette expérience ont été publiés dans la revue "Spectroscopy"dans les actes de la conférence “XIII European Conference on the Spectro-scopy of Biological Molecules”, où ce travail a été présenté, et font partiede l’annexe de ce manuscrit (cf article D.1).
Les expériences quasi-élastiques réalisées sur le spectromètre en temps devol TOFTOF du réacteur de recherche FRM II à Munich sont décrites dansle chapitre 7. Les mêmes échantillons utilisés pour les expériences élas-tiques sur IN13 ont aussi servis pour ces mesures. Des facteurs de structureélastiques incohérents (EISF) ont pu être extraits des données. Différentsmodèles ont été comparés aux données pour prendre en compte les effetsde l’hydratation. Les résultats obtenus à partir des expériences faites surTOFTOF et IN13 ont abouti à une publication dans "The Journal of ChemicalPhysics" qui se trouve dans l’annexe de ce travail dans la section D.2.Les deux chapitres commencent par une caractérisation de l’échantillon pardiffraction neutronique, suivie par une description des expériences et dutraitement des données est donnée suivie par l’interprétation et la discus-sion des résultats obtenus sont exposés en fin de chapitre.
Des balayages en température sont aujourd’hui couramment utiliséspour étudier la dynamique des biomolécules par diffusion de neutrons. Aucontraire, la haute pression hydrostatique est sous-utilisée en combinaisonavec la diffusion neutronique en raison des difficultés technologiques. Or,
10
en considerant la haute pression, une seconde variable thermodynamiquepeut être explorée. La pression a un effet similaire sur les membranes quela réduction de l’hydratation des bicouches lipidiques, ainsi les expériencesdécrites dans les chapitres 6 et 7 sont complémentaires aux études en fonc-tion de la haute pression démarrées récemment. Le développement d’unéquipement de haute pression et les premières mesures de diffraction et despectroscopie de DMPC sont décrites dans le chapitre 8.
L’étude de l’AChE est décrite dans le chapitre 9. Après une introductiongénérale de l’AChE et la présentation de la préparation des échantillons,les expériences élastiques sont détaillées dans la section 9.3. Cette sectionest basée sur une publication soumise à "Physical Chemistry Chemical Phy-sics". L’exploitation de deux ordres de grandeur de la résolution instrumen-tale permet d’observer les déplacements carrés moyens sur des échelles detemps très différentes, allant de 10-1000 ps environ.Dans la section 9.4 une comparaison avec les résultats obtenus sur la bu-tyrylcholinestérase humaine (BChE) est entreprise. Les données publiéespar Gabel et ses collaborateurs montrent des différences significatives parrapport à nos résultats avec l’AChE, même si la structure et la fonction desdeux enzymes sont très similaires.Enfin dans la section 9.5 les résultats des mesures quasi-élastiques de l’AChEsur IN6 sont présentés.
Chapter 3
Thermal neutron scattering
3.1 General introduction and properties of the neu-tron
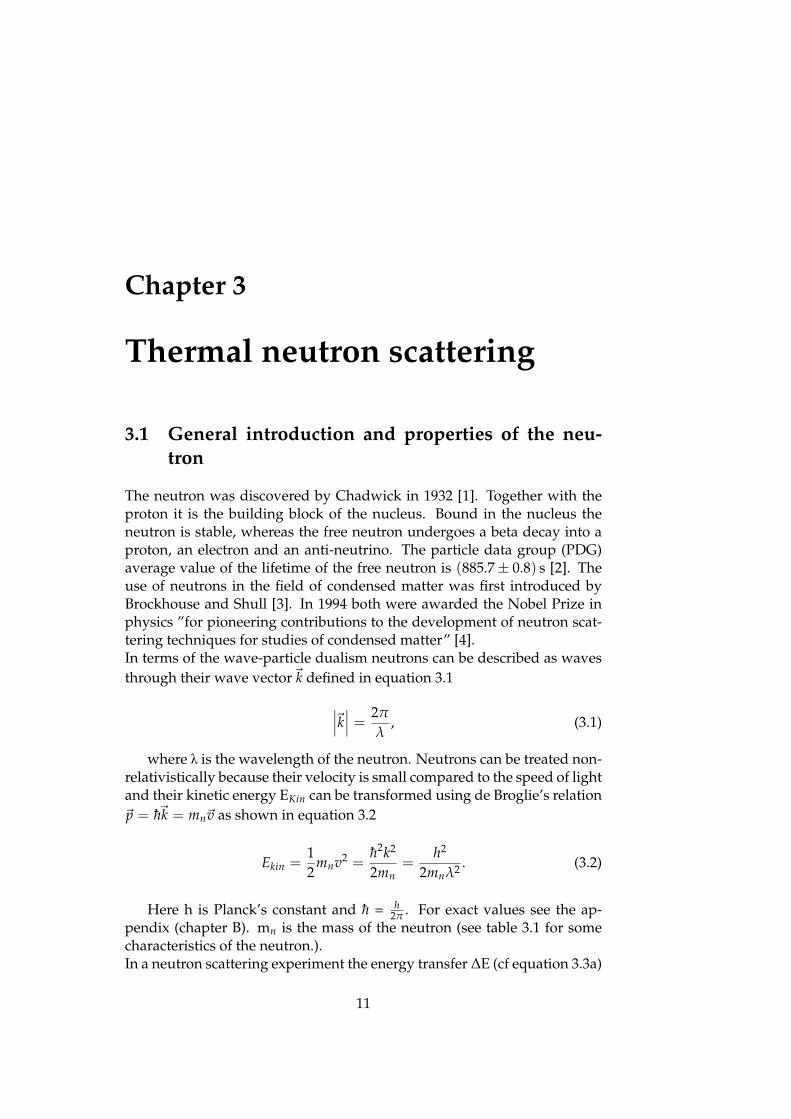
The neutron was discovered by Chadwick in 1932 [1]. Together with theproton it is the building block of the nucleus. Bound in the nucleus theneutron is stable, whereas the free neutron undergoes a beta decay into aproton, an electron and an anti-neutrino. The particle data group (PDG)average value of the lifetime of the free neutron is (885.7± 0.8) s [2]. Theuse of neutrons in the field of condensed matter was first introduced byBrockhouse and Shull [3]. In 1994 both were awarded the Nobel Prize inphysics ”for pioneering contributions to the development of neutron scat-tering techniques for studies of condensed matter” [4].In terms of the wave-particle dualism neutrons can be described as wavesthrough their wave vector~k defined in equation 3.1
∣∣∣~k∣∣∣ = 2π
λ, (3.1)
where λ is the wavelength of the neutron. Neutrons can be treated non-relativistically because their velocity is small compared to the speed of lightand their kinetic energy EKin can be transformed using de Broglie’s relation~p = h~k = mn~v as shown in equation 3.2
Ekin =12
mnv2 =h2k2
2mn=
h2
2mnλ2 . (3.2)
Here h is Planck’s constant and h = h2π . For exact values see the ap-
pendix (chapter B). mn is the mass of the neutron (see table 3.1 for somecharacteristics of the neutron.).In a neutron scattering experiment the energy transfer ∆E (cf equation 3.3a)
11

12 3.2. INTERACTION BETWEEN NEUTRONS AND MATTER
and the momentum transfer ~Q (cf equation 3.3b) are the observed quanti-ties, as visualised in figure 3.1.
∆E = E f − Ei = hω =h2
2mn(k2
f − k2i ) (3.3a)
and~Q = ~k f − ~ki. (3.3b)
For inelastic processes the energy dependence of ~Q has to be taken intoaccount. The corresponding formula (equation 3.16) can be found in section3.5.2.
kf
kf
Elastic scattering
Ef=Ei
Inelastic scattering
Ef>Ei
2θ
ki
kf
Inelastic scattering
Ef<Ei
Q
Figure 3.1: Schematic representation of a scattering event. The incomingwave is characterised by its wave vector ~ki and its corresponding wave-length λi and energy Ei. Both elastic (E f = Ei) and inelastic scattering (E f ,
Ei) are shown. Also conservation of momentum ~Q =~k f -~ki is depicted. 2θis the scattering angle.
3.2 Interaction between neutrons and matter
Electromagnetic radiation interacts with the electrons in the atomic shell.Therefore the interaction strongly depends on the atomic number. The

CHAPTER 3. THERMAL NEUTRON SCATTERING 13
charge 0mass 1.008 66 u = 1.675 10× 10−27 kgspin 1
2magnetic moment -1.923 nuclear magnetons
Table 3.1: Properties of the neutron.
higher the atomic number, the stronger the interaction. In contrast to elec-tromagnetic radiation no such general statement about neutrons can bemade, since neutrons interact via the short range strong interaction withthe nucleus of the atoms and therefore the interaction is not as systematicas in the eletromagnetic case. The scattering processes will be treated inmore detail in section 3.3.The difference in the scattering cross sections of hydrogen and its isotopedeuterium is employed in biophysical neutron scattering (cf. table 3.2).About 50% of the atoms in biological macromolecules are hydrogens, thustheir incoherent scattering dominates the recorded signal.Hydration plays a crucial role in the dynamics of biomolecules such aslipids [5], proteins [6], RNA and whole cells [7], too. In order to focus onthe water dynamics, deuterated macromolecules are used so that the onlyhydrogen atoms in the sample are those of the solvent [8]. If in contrastthe interest of the performed study lies in the dynamics of the biomolecule,D2O is used for hydration [9]. However, it has been shown that the elas-tic energy resolution and therefore the accessible space-time window ofthe employed instrument also plays a role. For example in the space-timeframe observed on IN13, bulk H2O contributes to the data only as a flatbackground [10].
3.3 Scattering law
In the following section the basic principles of neutron scattering are pre-sented. As biological samples are normally non magnetic, only nuclearscattering is considered below.In any neutron experiment the double differential cross section d2σ
dΩdE is mea-sured. This quantity is the number of neutrons scattered per second into agiven solid angle dΩ with a final energy E between hω and hω + hdω di-vided by the incoming flux. When the perturbation of the scatterer by theincident neutron is small, the Born approximation holds [12] and the dou-ble differential cross section can be written as:
d2σ
dΩdE=
k f
ki
12πh ∑
i,j
⟨bibj⟩ ∫ ∞
−∞
⟨e−i~Q~ri(0)ei~Q~rj(t)
⟩· e−iωtdt, (3.4)

14 3.3. SCATTERING LAW
Isotope σcoh [barn] σinc [barn] σabs [barn]
H 1.76 80.26 0.331H 1.76 80.27 0.332H 5.59 2.05 0.0
3He 4.42 1.53 5333.04He 1.34 0.0 0.0Li 0.45 0.92 70.50
6Li 0.51 0.46 940.07Li 0.62 0.78 0.05B 3.54 1.70 767.0
10B 0.14 3.0 3835.0C 5.55 0.0 0.0N 11.01 0.50 1.90O 4.23 0.0 0.0Al 1.50 0.01 1.50Si 2.16 0.0 0.17P 3.31 0.0 0.17
Cd 3.04 3.46 2520.0Gd 29.30 151.0 49700.0
157Gd 650.0 394.0 259000.0
Table 3.2: Scattering cross sections σ. The table gives the coherent (σcoh), in-coherent (σinc) and absorption (σabs) cross section for the most common ele-ments in biological samples (H,C,O,N,P,S). From the high absorption crosssection of 6Li, 10B, Cd and Gd it is obvious that these elements are used forshielding purposes. Where no isotope is specified the numbers refer to theratio occurring in nature [11].
CHAPTER 3. THERMAL NEUTRON SCATTERING 15
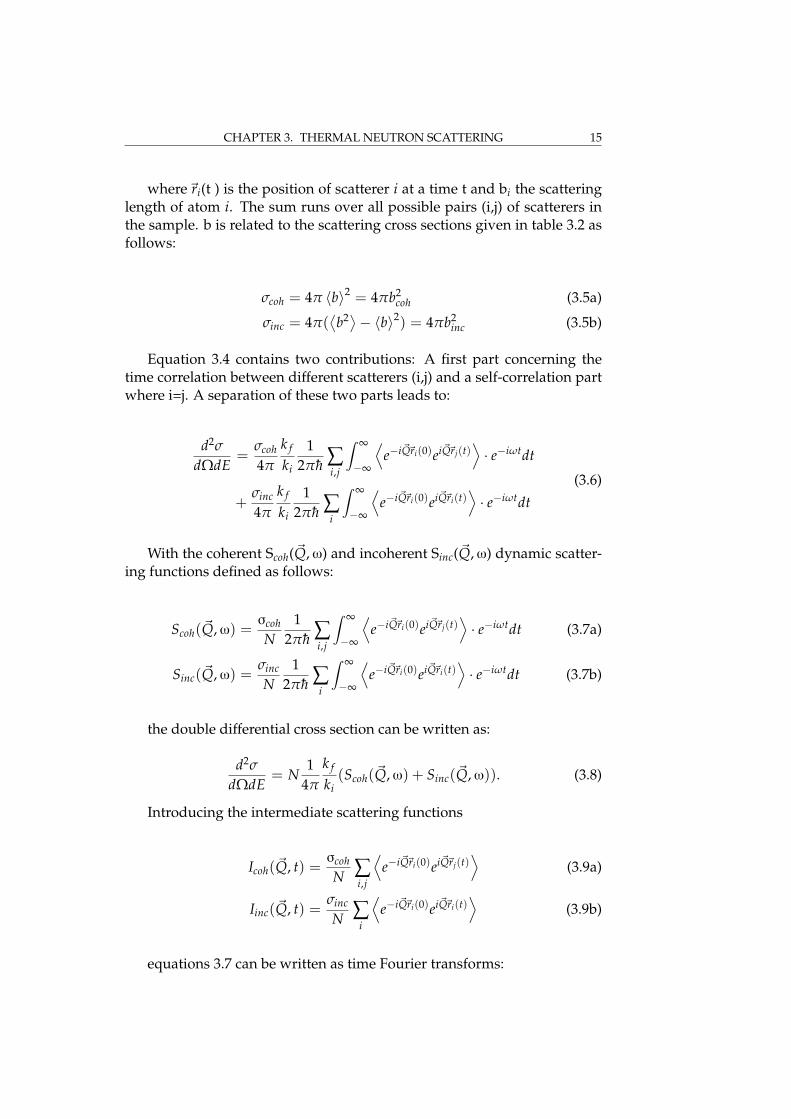
where~ri(t ) is the position of scatterer i at a time t and bi the scatteringlength of atom i. The sum runs over all possible pairs (i,j) of scatterers inthe sample. b is related to the scattering cross sections given in table 3.2 asfollows:
σcoh = 4π 〈b〉2 = 4πb2coh (3.5a)
σinc = 4π(⟨b2⟩− 〈b〉2) = 4πb2
inc (3.5b)
Equation 3.4 contains two contributions: A first part concerning thetime correlation between different scatterers (i,j) and a self-correlation partwhere i=j. A separation of these two parts leads to:
d2σ
dΩdE=
σcoh
4π
k f
ki
12πh ∑
i,j
∫ ∞
−∞
⟨e−i~Q~ri(0)ei~Q~rj(t)
⟩· e−iωtdt
+σinc
4π
k f
ki
12πh ∑
i
∫ ∞
−∞
⟨e−i~Q~ri(0)ei~Q~ri(t)
⟩· e−iωtdt
(3.6)
With the coherent Scoh(~Q,ω) and incoherent Sinc(~Q,ω) dynamic scatter-ing functions defined as follows:
Scoh(~Q,ω) =σcoh
N1
2πh ∑i,j
∫ ∞
−∞
⟨e−i~Q~ri(0)ei~Q~rj(t)
⟩· e−iωtdt (3.7a)
Sinc(~Q,ω) =σinc
N1
2πh ∑i
∫ ∞
−∞
⟨e−i~Q~ri(0)ei~Q~ri(t)
⟩· e−iωtdt (3.7b)
the double differential cross section can be written as:
d2σ
dΩdE= N
14π
k f
ki(Scoh(~Q,ω) + Sinc(~Q,ω)). (3.8)
Introducing the intermediate scattering functions
Icoh(~Q, t) =σcoh
N ∑i,j
⟨e−i~Q~ri(0)ei~Q~rj(t)
⟩(3.9a)
Iinc(~Q, t) =σinc
N ∑i
⟨e−i~Q~ri(0)ei~Q~ri(t)
⟩(3.9b)
equations 3.7 can be written as time Fourier transforms:

16 3.4. NEUTRON SOURCES AND TRANSPORT
Scoh(~Q,ω) =1
2πh
∫ ∞
−∞Icoh(~Q, t) · e−iωtdt (3.10a)
Sinc(~Q,ω) =1
2πh
∫ ∞
−∞Iinc(~Q, t) · e−iωtdt. (3.10b)
Performing a Fourier transform with respect to space on the interme-diate scattering functions leads to the Van Hove pair correlation functionin the case of coherent scattering and to the self correlation function in thecase of incoherent scattering [13]:
G(~r, t) =1
(2π)3
∫Icoh(~Q, t) · e−i~Q~rd~Q (3.11a)
GS(~r, t) =1
(2π)3
∫Iinc(~Q, t) · e−i~Q~rd~Q. (3.11b)
G(~r,t) is the probability that, given a particle at the origin a time t = 0,any particle (including the original particle) can be found at~r at a time t.In contrast GS(~r,t) gives the probability of finding the same particle, whichwas at t = 0 at the origin at a time t at the position~r. Therefore G(~r,t) in-cludes GS(~r,t).Coherent scattering thus contains the correlation of the position of differentatoms at different times. Hence information on structure and collective mo-tions can be deduced from coherent scattering. In contrast the incoherentpart contains information about the evolution in time of one and the sameatom, thus the local dynamics of the sample can be probed with incoherentscattering.
3.4 Neutron sources and transport
About 50% of all matter is made up of neutrons but they are bound to thenucleus. In order to produce free neutrons two methods are employed inresearch institutes: fission (Institut Laue-Langevin (ILL), Grenoble, France,Forschungsreaktor München II (FRMII), Munich, Germany) and spallation(Spallation neutron source (SNS) in Oak Ridge, US, Paul Scherrer Insti-tut (PSI), Villigen, Switzerland or ISIS, Didcot, UK). Laser induced fusionhas been proposed lately [14], but will not be available in the near future,due to technological difficulties.In the fission process 235Uranium nuclei are split into two lighter parts andrelease energy (see figure 3.2a). Apart from the fission fragments in av-erage 2.5 neutrons with energies in the MeV range are produced per fis-sion event. This technology is limited to a relatively low flux (maximum1× 1014-1× 10¹⁵ n cm2/s), due to heat production in the reactor core and

CHAPTER 3. THERMAL NEUTRON SCATTERING 17
the difficulty of heat dissipation in short times.In the case of spallation sources a heavy metal target (liquid or solid) is hitby an accelerated proton (up to several GeV). The excitation of the targetleads to an evaporation of 20 to 30 neutron in the MeV range per event (cffigure 3.2b). Therefore more neutrons can be produced per proton pulse ina spallation source, but these sources are normally operated in a discontin-uous way. Thus absolute flux values are difficult to compare.
(a) (b)
Figure 3.2: Schematic representation of the fission 3.2a and spallation 3.2bprocess [15].
The energy of the liberated neutrons (in the order of MeV) is too highby far for scattering experiments for which energies in the meV range areneeded to probe excitations within the sample. Moderators are generallyused to shift the energy of the neutrons to lower values. In reactor sourcesthey are in particular needed to slow down the fast neutrons created in thefission process and thus sustain the chain reaction. In neutron scatteringmoderation is also employed to move the energy of the fission neutronsinto the range used for the experiments (≈ meV). Typically materials usedas moderators have a high scattering cross section (cf table 3.2). At ambienttemperature water or heavy water is often used. To slow down the neu-trons even further liquid hydrogen or deuterium at temperatures around20 K can be employed. The neutrons have Maxwellian energy distributionafter the moderation with a maximum which corresponds to the temper-ature of the moderator. An overview of characteristic temperatures andenergies typically employed in neutron scattering can be found in table 3.3.Neutron guides are used to transport the free neutrons from where theyare created to the experiments. Nowadays the longest transport distanceis about 100 m at neutron centres, so beam loss due to neutron decay canbe neglected. As neutrons carry no charge, they cannot be deflected by

18 3.5. SPECTROMETERS
electro-magnetic fields. Therefore total reflection is employed to transportthe neutrons. Often nickel is used for the coating of neutron guides due toits high refraction index n. Below a critical angle of θC = λ[Å]× 0.1° total re-flection occurs [16]. It can be improved even further by using 58Ni due to itslarger coherent scattering length and multilayer coating of the guides [17].
E [meV] T [K] v [m s−1] λ [Å]
cold 0.1 - 10 1 - 120 130 - 1300 30 - 3thermal 10 - 100 120 - 1200 1300 - 4000 3 - 1hot 100 - 500 1200 - 6000 4000 - 10000 1 - 0.4
Table 3.3: Characteristic neutron energies, temperatures, velocities and cor-responding wavelengths. Values can be calculated using the relation E =kBT and equation 3.2.
3.5 Spectrometers
Via Heisenberg’s uncertainty principle:
∆E∆t > h2
(3.12)
the observation time is directly related to the energy resolution of theemployed instrument. Thus using spectrometers with different energy res-olutions gives access to different time scales probed within the sample.A whole hierarchy of energy resolutions is covered by the different typesof spectrometers currently available in neutron scattering centres.The highest energy resolution (in the order of neV) is obtained by the Neu-tron spin echo (NSE) technique [18]. Backscattering spectrometers give ac-cess to energy resolutions between 0.9 µeV and 10 µeV. This type of instru-ment will be discussed in more detail in section 3.5.1 and the IN13 spec-trometer will be especially highlighted in chapter 4. The energy resolu-tion of disk chopper time-of-flight spectrometers can be varied almost con-tinuously between 10 µeV and 3 meV by adjusting the speed of the chop-pers. Resolutions of the instruments used in this work are shown in figure3.3 for comparison. The resolution functions normally have Gaussian orLorentzian shapes, but can also have a triangular shape, depending on thechopper alignment. Three axis spectrometers are employed mainly in solidstate physics to study collective excitations (phonons). They will not bediscussed here.
In neutron spectroscopy not only the spatial deviation of the neutron,but also the energy exchanged with the sample is measured. Via the scat-
CHAPTER 3. THERMAL NEUTRON SCATTERING 19
tering vector ~Q information on the length scales under investigation can beextracted. The energy transfer ∆E provides information on the dynamicsof the samples. Therefore the incident wave vector ~ki of the neutrons has tobe well defined.Two methods are employed in backscattering and time-of-flight instrumentsto select a given wavelength out of the polychromatic neutron beam:
1. Bragg reflection of crystals. In this case the reflection of a single crys-tal is used to select a wavelength, which is determined by the latticeconstant of the crystal. This method is mainly employed in backscat-tering spectrometers (see section 3.5.1), but also on some time-of-flight instruments (e.g. IN6).
2. Time-of-flight. A set of choppers is used to create neutron pulses witha given energy resolution (cf section 3.5.2). Choppers are disks rotat-ing with a speed up to 20000 rpm. They are coated with a neutron ab-sorbing material (e.g. gadolinium), only a small fraction is untreatedand therefore lets neutrons pass.
In the following sections backscattering and time-of-flight spectrome-ters will be discussed in greater detail, because these two types of instru-ments were employed in the presented work.
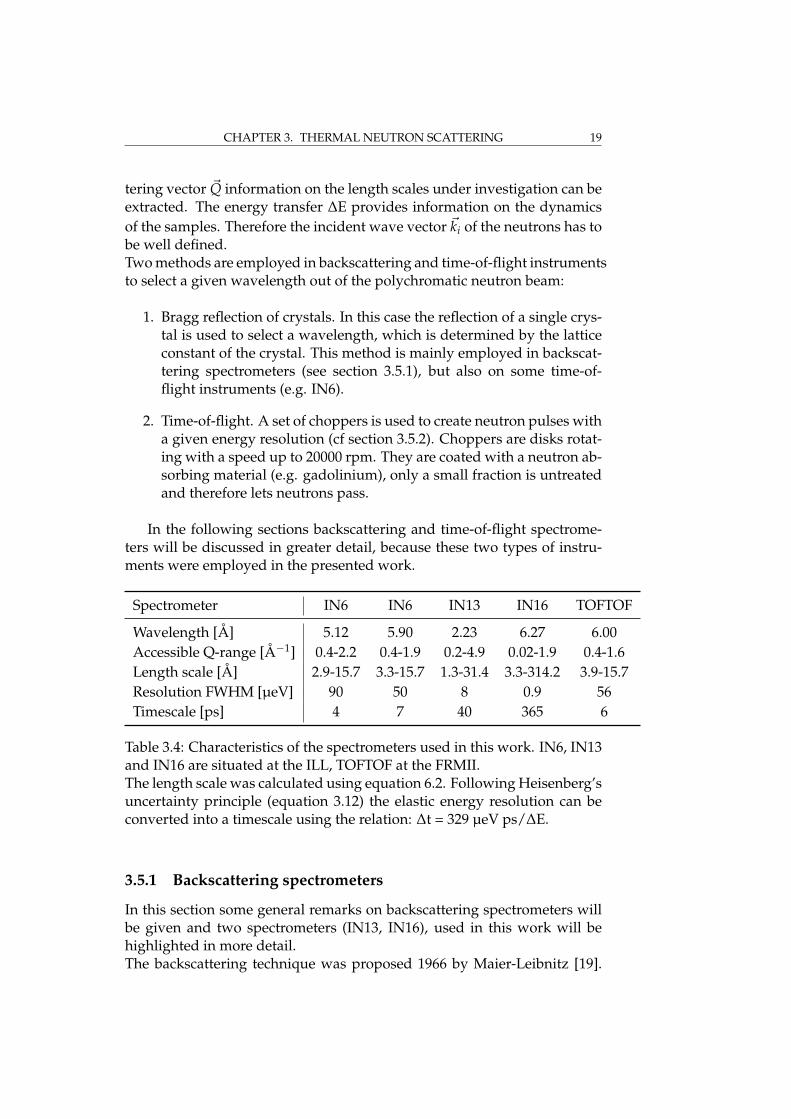
Spectrometer IN6 IN6 IN13 IN16 TOFTOF
Wavelength [Å] 5.12 5.90 2.23 6.27 6.00Accessible Q-range [Å−1] 0.4-2.2 0.4-1.9 0.2-4.9 0.02-1.9 0.4-1.6Length scale [Å] 2.9-15.7 3.3-15.7 1.3-31.4 3.3-314.2 3.9-15.7Resolution FWHM [µeV] 90 50 8 0.9 56Timescale [ps] 4 7 40 365 6
Table 3.4: Characteristics of the spectrometers used in this work. IN6, IN13and IN16 are situated at the ILL, TOFTOF at the FRMII.The length scale was calculated using equation 6.2. Following Heisenberg’suncertainty principle (equation 3.12) the elastic energy resolution can beconverted into a timescale using the relation: ∆t = 329 µeV ps/∆E.
3.5.1 Backscattering spectrometers
In this section some general remarks on backscattering spectrometers willbe given and two spectrometers (IN13, IN16), used in this work will behighlighted in more detail.The backscattering technique was proposed 1966 by Maier-Leibnitz [19].

20 3.5. SPECTROMETERS
-120 -100 -80 -60 -40 -20 0 20 40 60 80 100 120
0.0
0.2
0.4
0.6
0.8
1.0
no
rma
ilised
in
ten
sity [a
.u.]
energy [µeV]
Figure 3.3: Comparison of the elastic energy resolutions of three differentinstruments and four different resolutions used for this work. The reso-lutions cover a range from 0.9 µeV to 90 µeV (FWHM). Shown in red IN6(5.1 Å = 90 µeV), in green IN6 (5.9 Å = 50 µeV) is displayed, in black IN13(8 µeV) is presented and IN16 (0.9 µeV) is depicted in blue. More informa-tion on the characteristics of the single instruments can be found in table3.4.
CHAPTER 3. THERMAL NEUTRON SCATTERING 21
In this technique crystal reflections are used according to Bragg’s law (seeequation 3.13) to select a given wavelength:
nλ = 2d sin θB. (3.13)
In this equation d stand for the repeat distance of the crystal lattice, θBfor the Bragg angle and n for the order of the reflection. It takes advantageof the fact, that the energy resolution in backscattering geometry (2θ = 180°)becomes very narrow. This can be seen by taking the derivative of Bragg’sLaw:
∆EE
=2∆λ
λ=
2∆dd
+ 2 cot θB∆θB. (3.14)
For θB=90° the cotangent term in eq. 3.14 becomes zero and only thefirst term, which solely depends on the crystal quality, dominates the en-ergy resolution of the spectrometer. This setup is realised within the sec-ondary spectrometer (see pictures 3.4 and 4.1). The analyser crystals aremounted in perfected backscattering geometry, so only neutrons with thecorresponding resolution are collected by the neutron detectors.Until the invention of the spin echo technique, backscattering spectrome-ters provided the finest energy resolution available. Furthermore the firstinelastic studies revealing the dynamical transition with neutrons were per-formed on a backscattering spectrometer [9].
IN13
During my thesis I was involved in the development and the operationof the thermal backscattering spectrometer IN13, therefore the instrumentand its characteristics will be discussed in more detail in chapter 4.
IN16
The backscattering spectrometer IN16 is situated on a guide looking at oneof the cold sources of the ILL. Therefore the Si (111) reflection is used toselect a wavelength of λ = 6.27 Å of the incoming neutrons. This instru-mental setup results in a very narrow elastic energy resolution of 0.9 µeV.In contrast to IN13, where the energy of the impinging neutrons is changedby heating or cooling the monochromator, IN16 uses a Doppler drive. Forelastic measurements this drive is at rest, in the quasi-elastic mode it moveswith a given speed resulting in an accessible energy range of± 15 µeV. Theschematic layout of IN16 can be found in figure 3.4.

22 3.5. SPECTROMETERS
Figure 3.4: Schematic layout of the cold neutron backscattering spectrome-ter IN16 at ILL [20].
3.5.2 Time-of-Flight spectrometers
This type of spectrometer uses the time-of-flight of the scattered neutronsfor energy discrimination. Monochromatisation is done by either usingBragg reflection, then the spectrometer is called XTL-TOF (crystal-time-of-flight) spectrometer. If a system of choppers is used to select a wavelength,the instrument is called TOF-TOF spectrometer. At least two choppers areneeded to perform this task. A schematic representation of this setup isshown in figure 3.5. The first chopper (P-chopper in figure 3.5) dividesthe continuous beam into discrete packages. These packages still containneutrons with different wavelengths, i.e. different velocities. The secondchopper (M-chopper in figure 3.5), installed at a certain distance to the firstone (typically one to several meters), is used to select one wavelength outof the now dispersed package. Additional choppers can be put in place be-tween these two choppers, to avoid e.g. that very slow neutrons from thereactor also pass and distort the recorded signal.
The scattered neutrons are detected as a function of time. Neutronswhich gained energy during the scattering process will arrive before elas-tically scattered neutrons. Neutrons which have lost energy during the in-teraction with the sample will arrive last in the detectors. The recordedtime difference ∆t then permits to recalculate the energy difference to theelastically scattered neutrons through:

CHAPTER 3. THERMAL NEUTRON SCATTERING 23
Figure 3.5: Sketch of the time-of flight principle. The different wavelengthsof the polychromatic beam are presented by different colours. Adaptedfrom [21].
∆E = h∆ω =12
mn(∆v)2
=12
mnL2SD
(1t0− 1
t
)2
=12
mnL2SD
(∆t
t20 + t0∆t
)2 (3.15)
where LSD denotes the distance between sample and detector (cf figure3.5), t0 is the flight time of the elastically scattered neutrons and ∆t thedifference in the time of flight: ∆t = t - t0.
In contrast to backscattering spectrometers, where only small energytransfers are probed, on a time-of-flight instrument the energy dependenceof ~Q cannot be neglected. Hence equation 3.3b has to be rewritten as equa-tion 3.16
Q2 = k2i + k2
f − 2kik f cos 2θ. (3.16)
Together with the energy transfer (eq. 3.2) this leads to the fundamentalrelation between scattering vector ~Q, incident wave vector ~ki and scatter-ing angle 2θ which is shown in equation 3.17 and visualised for differentscattering angles in figure 3.6:
Q2 = 2k2i −
2mnω
h− 2ki
√k2
i −2mnω
hcos 2θ. (3.17)
In the following sections, the two time-of-flight spectrometers whichhave been used during this work, will be described in more detail.
IN6
IN6 is an example of a time focusing XTL-TOF spectrometer. It uses crystalreflections of three pyrolytic graphite monochromator arrays to monochro-

24 3.5. SPECTROMETERS
-100 -80 -60 -40 -20 00
1
2
3
4
5
6
7
8
9
Q [Å
-1]
energy [meV]
2θ = 0° 2θ = 10° 2θ = 45° 2θ = 90° 2θ = 115° 2θ = 180°
Figure 3.6: Dynamic range for a given ki=1.23 Å−1 (corresponding to awavelength of 5.1 Å) and different scattering angles 2θ. The black linesindicate the angular range covered with detectors on the IN6 spectrometerat ILL.
matise the incident beam. By changing the angle of the secondary spec-trometer with respect to the monochromator, four discrete wavelengths(4.1, 4.6, 5.1, 5.9 Å) can be selected on this spectrometer. Higher order re-flections are removed by a beryllium filter. The schematic layout of theinstrument can be found in figure 3.7. For the experiments described in thefollowing chapters only incident wavelengths of 5.1 and 5.9 Å were used,resulting in elastic energy resolutions of 90 and 50 µeV, respectively (cf fig-ure 3.3). In order to get the neutrons from all three monochromators at thesame time on the sample, this corresponds to the so called time-focusingcondition, the beam is pulsed by a Fermi chopper (a fast rotating assem-bly of curved slits). To prevent frame-overlap when the chopper is rotatingfaster than 7500 rpm, a suppressor chopper is placed before the Fermi chop-per and rotates in phase with the latter at a lower speed. The secondaryspectrometer is filled with helium and equipped with 337 3He counterscovering an angular range from 10° to 115° and a total surface of about6 m2.The accessible dynamic range of IN6 for an incident wavelength of 5.1 Å isshown as a black line in figure 3.6.
CHAPTER 3. THERMAL NEUTRON SCATTERING 25
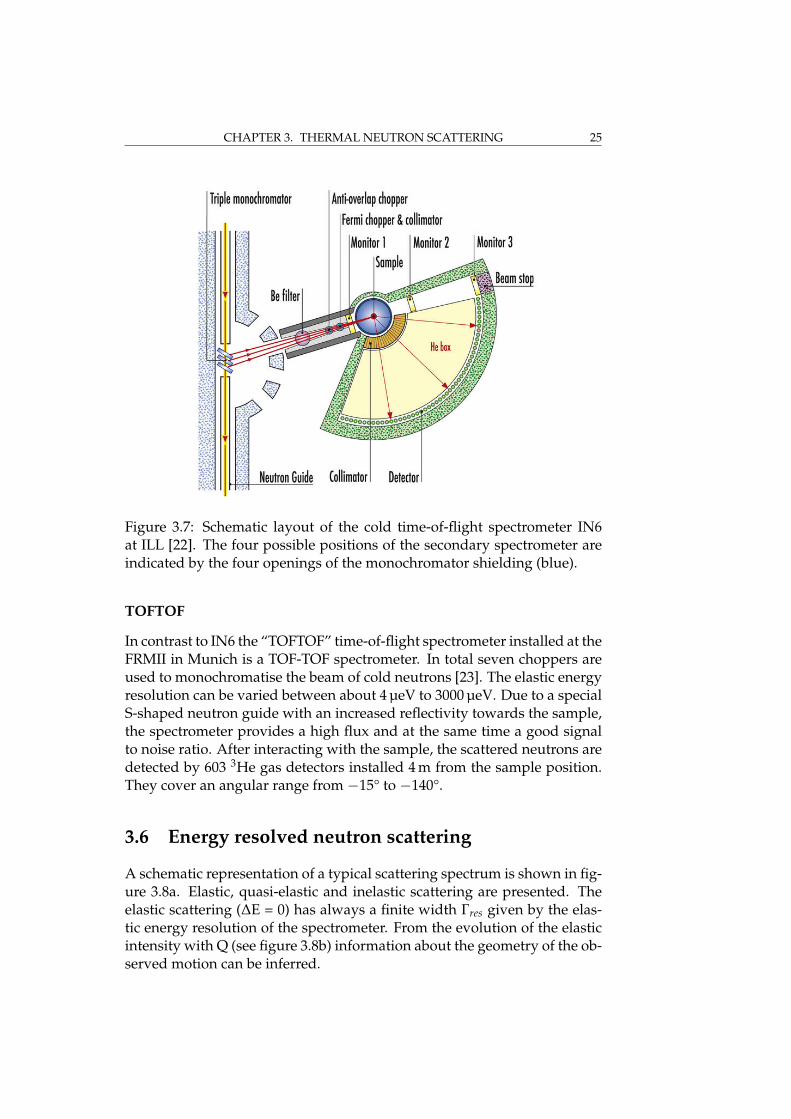
Figure 3.7: Schematic layout of the cold time-of-flight spectrometer IN6at ILL [22]. The four possible positions of the secondary spectrometer areindicated by the four openings of the monochromator shielding (blue).
TOFTOF
In contrast to IN6 the “TOFTOF” time-of-flight spectrometer installed at theFRMII in Munich is a TOF-TOF spectrometer. In total seven choppers areused to monochromatise the beam of cold neutrons [23]. The elastic energyresolution can be varied between about 4 µeV to 3000 µeV. Due to a specialS-shaped neutron guide with an increased reflectivity towards the sample,the spectrometer provides a high flux and at the same time a good signalto noise ratio. After interacting with the sample, the scattered neutrons aredetected by 603 3He gas detectors installed 4 m from the sample position.They cover an angular range from −15° to −140°.
3.6 Energy resolved neutron scattering
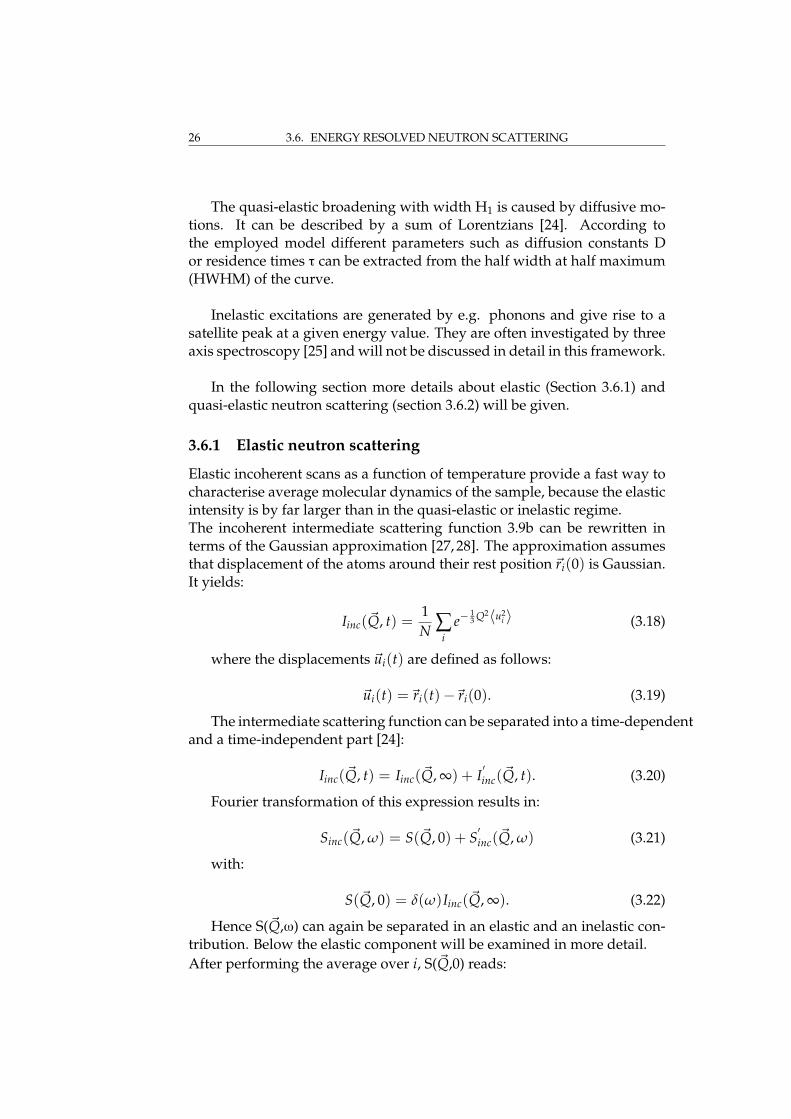
A schematic representation of a typical scattering spectrum is shown in fig-ure 3.8a. Elastic, quasi-elastic and inelastic scattering are presented. Theelastic scattering (∆E = 0) has always a finite width Γres given by the elas-tic energy resolution of the spectrometer. From the evolution of the elasticintensity with Q (see figure 3.8b) information about the geometry of the ob-served motion can be inferred.
26 3.6. ENERGY RESOLVED NEUTRON SCATTERING
The quasi-elastic broadening with width H1 is caused by diffusive mo-tions. It can be described by a sum of Lorentzians [24]. According tothe employed model different parameters such as diffusion constants Dor residence times τ can be extracted from the half width at half maximum(HWHM) of the curve.
Inelastic excitations are generated by e.g. phonons and give rise to asatellite peak at a given energy value. They are often investigated by threeaxis spectroscopy [25] and will not be discussed in detail in this framework.
In the following section more details about elastic (Section 3.6.1) andquasi-elastic neutron scattering (section 3.6.2) will be given.
3.6.1 Elastic neutron scattering
Elastic incoherent scans as a function of temperature provide a fast way tocharacterise average molecular dynamics of the sample, because the elasticintensity is by far larger than in the quasi-elastic or inelastic regime.The incoherent intermediate scattering function 3.9b can be rewritten interms of the Gaussian approximation [27, 28]. The approximation assumesthat displacement of the atoms around their rest position ~ri(0) is Gaussian.It yields:
Iinc(~Q, t) =1N ∑
ie−
13 Q2〈u2
i 〉 (3.18)
where the displacements ~ui(t) are defined as follows:
~ui(t) =~ri(t)−~ri(0). (3.19)
The intermediate scattering function can be separated into a time-dependentand a time-independent part [24]:
Iinc(~Q, t) = Iinc(~Q, ∞) + I′inc(~Q, t). (3.20)
Fourier transformation of this expression results in:
Sinc(~Q, ω) = S(~Q, 0) + S′inc(~Q, ω) (3.21)
with:
S(~Q, 0) = δ(ω)Iinc(~Q, ∞). (3.22)
Hence S(~Q,ω) can again be separated in an elastic and an inelastic con-tribution. Below the elastic component will be examined in more detail.After performing the average over i, S(~Q,0) reads:

CHAPTER 3. THERMAL NEUTRON SCATTERING 27
S(~Q, 0) ≈ e−13 Q2〈u2〉 (3.23)
The average mean square displacement can be extracted from a linearfit to the logaritm of S(~Q,0) versus Q2 according to :
⟨u2⟩ = −3
∂ ln S(~Q, 0)∂Q2 . (3.24)
The same formalism is used in small angle scattering and known asGuinier approximation [29]. The approximation is strictly valid for Q→ 0,but it was shown, that it hold up to
⟨u2⟩ Q2 ≈ 1 [30].
3.6.2 Quasi-elastic neutron scattering
Analysing the quasi-elastic scattering gives a more detailed picture aboutthe observed dynamics. From the elastic incoherent structure factor (EISF)the geometry of the motion can be inferred. The theoretical scattering func-tion Stheo(~Q,ω) reads [24]:
Stheo(~Q, ω) = e−〈x2〉Q2
[A0(~Q)δ(ω) + ∑
nAn(~Q)Ln(~Q, ω)
](3.25)
where e−〈x2〉Q2is the Debye-Waller factor, representing vibrations. The
delta function δ accounts for dynamics that cannot be resolved by the in-struments’ resolution. The amplitude A0(~Q) is the elastic incoherent struc-ture factor (EISF) and contains information about the geometry of the move-ment. The quasi-elastic contributions are mimicked by a sum of Lorentzianfunctions Ln(~Q,ω) and the corresponding quasi-elastic incoherent structurefactors (QISF) An(~Q).
Ln(~Q, ω) =1π
Γn(~Q)
ω2 + Γn(~Q)2. (3.26)
For data analysis the theoretical scattering law Stheo has to be convo-luted with the instrumental energy resolution, which can be mimicked bye.g. vanadium:
Smeas(~Q, ω) = Stheo(~Q, ω)⊗ Sres(~Q, ω). (3.27)
Diffusion in a sphere model
For the description of diffusion in confined space, such as hydrogen atomsin a lipid or in proteins, Volino and Dianoux developed the model of dif-fusion in a sphere. Here diffusive motion are allowed only inside a sphere

28 3.6. ENERGY RESOLVED NEUTRON SCATTERING
with radius r and impervious walls [31]. The scattering law can be writtenas:
S(~Q, ω) = A00(~Q)δ(ω) + ∑
(l,n),(0,0)(2l + 1)Al
n(~Q)1π
λlnD
πω2 + (λlnD)2 . (3.28)
The authors found an analytical expression for the EISF, which reads:
A00(~Q) =
[3j1(~Qr)
~Qr
]2
, (3.29)
where j1(x) = sin xx2 - cos x
x is the first order spherical Bessel function and rthe radius of the sphere, which can be extracted from fitting equation 3.29to the obtained data. Bellisent-Funel and co-workers [32] expanded themodel for the EISF by an immobile fraction p, where p denotes stronglybound proton. Equation 3.29 then reads:
A00(~Q) = p + (1− p)×
[3j1(~Qr)
~Qr
]2
. (3.30)
Figure 3.9a shows the HWHM of the quasi-elastic component of thescattering law as a function of (RQ)2. For continuous diffusion a lineardependence is expected [24] as drawn in the graph 3.9. However, for smallQ-values (Q < π
r ) Γ tends towards a constant value Γ0, what is a signatureof motion in confinement. Γ is then related to the Diffusion constant D andthe radius of the sphere via:
Γ0 =4.33D
r2 . (3.31)
Hall and Ross [33] extended this model to a random jump diffusionwithin the restricted geometry of a sphere. For small Q-values, it showsthe same behaviour as the diffusion in a sphere model, but for large valuesof Q it converges towards the jump-diffusion model introduced by Singwiand Sjölander [34]. The half width at half maximum can be described byequation 3.32, where D is the diffusion constant and τ the residence timebetween two jumps. τ can be described in the limit of large Q as Γ∞ = 1/τ:
Γ =DQ2
1 + DQ2τ. (3.32)
Carpentier model
A modification of the Volino-Dianoux model assumes not only one fix ra-dius but allows increasing radii for the diffusion volumes of the hydrogen

CHAPTER 3. THERMAL NEUTRON SCATTERING 29
atoms along a linear chain (see equation (3.33a)). This model was intro-duced by Carpentier et al. for the study the dynamics of alkyl chain ofdicopper tetrapalmitate [35] and was already employed to describe the dy-namics of lipid chains by König et al. [36] and also by Doxastakis et al. [37].In this case the EISF can be written as:
A0(~Q) =1N
N
∑n=1
[3j1(QRn)
QRn
]2
(3.33a)
withRn =
n− 1N − 1
× [RN − R1] + R1. (3.33b)
N stands for the total number of hydrogen atoms along a chain and Rngives the corresponding radii for the running index n. The line width inthis model shows a similar behaviour as in the case of the “diffusion in asphere” model.

30 3.6. ENERGY RESOLVED NEUTRON SCATTERING
(a)
0.40.6
0.81.0
1.2
-0.75-0.50
-0.250.000.250.500.75
1
2
3
4
5
6
energy [meV]
S [Q
, ωωωω)]
Q [Å-1 ]
(b)
Figure 3.8: Figure 3.8a shows a schematic representation of a scatteringspectrum is shown. Elastic, quasi-elastic and inelastic scattering are indi-cated (Taken from [26]). The evolution of the elastic peak as a function of Qis shown in figure 3.8b.

CHAPTER 3. THERMAL NEUTRON SCATTERING 31
(a) (b)
Figure 3.9: Schematic representations of the HWHM of the function repre-senting the quasi-elastic component of the scattering law in the case of thediffusion in a sphere model (3.9a) [31] and the model introduced by Halland Ross (3.9b) [33].

32 3.6. ENERGY RESOLVED NEUTRON SCATTERING
Chapter 4
The backscatteringspectrometer IN13
The backscattering (BS) spectrometer IN13 was designed in the 1980s at theILL for the study of tunnelling effects [38]. The instrument was built in or-der to achieve a good energy resolution with a large Q-range, as these arethe important characteristics for tunnelling experiments. It also fills the gapin (~Q, ω) space between the backscattering spectrometers with even finerenergy resolution (IN10 and IN16) and the time-of flight instruments IN5and IN6. The shorter wavelength allows especially to access a much largerQ-range compared to a cold instrument. In the case of IN13 a scatteringvector Q of up to 4.9 Å−1 is available.After redesigning and the installation of some modifications the thermalneutron backscattering spectrometer IN13 is operated since 1998 by a Col-laborating research group (CRG) [39]. 50% of the available beamtime isallocated by the CRG partners (Italy and France) and the other half by theILL subcommittees. The CRG time is dedicated to the investigation of dy-namics of biological systems such as proteins, lipids or whole cells.
4.1 Detailed instrument description
A schematic layout of the spectrometer is displayed in figure 4.1. The in-strument is situated on the H24 guide of the ILL which is fed with thermalneutrons coming from the reactor core. The neutrons have a Maxwelliandistribution centered around 2 Å due to the moderator temperature of 300K.A monochromator made out of CaF2 crystals is employed to extract neu-trons with a wavelength of 2.23 Å from the guide. For this purpose the (422)reflection of the crystals is used. Several types of scans can be performedon the spectrometer. For elastic scans, the energy of the incoming neutronsis kept fix. To perform inelastic scans, the energy of the neutrons hitting thesample is changed. This is achieved by heating or cooling the monochro-
33

34 4.1. DETAILED INSTRUMENT DESCRIPTION
Figure 4.1: Schematic layout of the IN13 backscattering spectrometer [40].

CHAPTER 4. THE BACKSCATTERING SPECTROMETER IN13 35
mator, which results in a change of the lattice constant of the monochroma-tor crystals. To obtain a good energy resolution an almost backscatteringcondition is employed already at this stage. With a take-off angle of typ-ically 1.8° a deflector is needed to deviate the neutrons. For this purposean array of nine rows of pyrolytic graphite crystals deflects and focuses theneutron beam into the secondary spectrometer. To avoid beam loss due toair scattering (for a flight path of 1 m in air approximately 10% of the neu-trons are lost) the deflector is housed in a sealed box which is filled withhelium gas. The box is additional faced with cadmium to avoid parasiticscattering.The sample is normally contained in a closed cycle cryostat (displex) ora cryofurnace for temperature control. The displex allows experiments ina temperature range from 3 K to 550 K. A set of seven analyser crystals(again CaF2, (422) reflection) installed in perfect backscattering conditionselects the neutrons of the right energy, which pass a second time throughthe sample before reaching the detectors. A sample transmissions in the or-der of 90% or higher avoids that the neutrons are scatterd again while theypass a second time through the sample. Finally the neutrons are detectedby 35 3He counters and in the small angle region by a Position Sensitive De-tector (PSD). In order to suppress the neutrons which are scattered directlyfrom the sample onto the detectors and thus do not fulfil the backscatteringcondition and to suppress higher orders of the refelction of the monochro-mator (λ/2, etc), a chopper is used. Operating at a speed of 6756 rpm, itchops the neutron beam into discrete packages. Because the velocity ofthe neutrons is well-known, a discrimination via the time-of-flight is pos-sible. Neutrons scattered directly into the detectors are suppressed by theelectronics. Finally only neutrons which were selected by the analysers arecounted, whereas.Neutrons that pass the sample without being scattered are stopped by acadmium coated beam stop, which can be replaced by a monitor to mea-sure transmission. In total IN13 makes use of two monitors. The first one ispermanently installed in the beam, positioned between chopper and sam-ple. It is used to normalise the scattered intensity to the incoming flux. Ithas a low efficiency in order to keep the impinging flux on the sample ashigh as possible. The second one is used to measure transmission and ismounted on a linear stage after the sample position. During data acquisi-tion it is moved out of the beam, for transmission measurements it is putin.
4.2 Instrument development
During my PhD I was also highly involved in the user support, mainte-nance and running of the IN13 spectrometer. In this section some of the

36 4.2. INSTRUMENT DEVELOPMENT
recent technical developments are highlighted.
• In order to guide and focus the beam perfectly onto the sample, thedeflector can be moved by five axes. It is mounted on two linearstages, through which the x- and y-direction can be controlled. Fur-thermore it can be rotated (ω), tilted (χ) and its curvature can bechanged (ρ) in order to focus the beam on the sample position.During inelastic scans the temperature of the monochromator is var-ied in order to change the energy of the incoming neutrons. There-fore, the deflector has to be moved to the new position of the beam.Even during elastic scans its position has to be checked regularly andcorrected when needed. This can be necessary when the temperatureof the analyser crystals changes due to environmental reasons. Inthis case the temperature of the monochromator is changed while thetemperature of the deflector is kept fixed. Thus a precise positioningand monitoring of the deflector is essential for the experiment.The motors performing the motions are controlled by encoders whichallow the absolute determination of the position of the motors. Be-cause of a malfunction of one of the encoders and aging due to radi-ation, it was decided to replace all of them. During the work a dis-placement of the linear stage, on which the deflector is mounted, wasdiscovered. Thereupon a re-alignment of the complete instrument,starting with the monochromator became necessary.
Energy [µeV] xDF[mm] yDF[mm] ωDF[°] ωBA[°]
-100 78.20 419.64 45.21 7.11-50 72.70 414.22 45.28 6.88-25 69.97 411.52 45.32 6.84-10 68.32 409.89 45.34 6.841.8 67.04 408.62 45.36 6.8110 66.14 407.72 45.37 6.7725 64.52 406.09 45.39 6.7450 61.84 403.41 45.43 6.69
100 56.38 398.03 45.51 6.52
Table 4.1: Deflector positions as a function of energy transfer on IN13.1.8 µeV corresponds to the elastic position.
During a long shutdown in 2010, in a first step a laser setup was usedto find the optically correct position of the deflector and the corre-sponding position of the secondary spectrometer. The alignment us-ing neutrons was done in the beginning of the first cycle 2010. Scans

CHAPTER 4. THE BACKSCATTERING SPECTROMETER IN13 37
of the four axes xDF, yDF, ωDF, ωBA (where ”DF” stands for deflectorand ”BA” for the secondary spectrometer) were performed to find theposition of the maximal flux. First a scan with large step width of thexDF- and yDF-axis of the deflector was performed in order to locatethe elastic position. These two axes are less sensible to changes thanωDF and ωBA, as it can be seen from table 4.1. A second scan usingall four axes around the intensity maximum found in the first scanthen allowed to exactly determine the position of the maximal flux.An example of the scan of xDF and yDF is shown in figure 4.2. There-alignment resulted in a gain in flux of about 7%.
• A second improvement was the installation of a new CCD camerato check the sample alignment [41]. The position of the sample inthe beam has to be verified for every user. In the old configuration aPolaroid camera was used to verify the sample position with respectto the beam. Both systems use scintillators to convert neutrons intophotons, which are then recorded either by a photo sensitive chip oran emulsion. Typical exposure times for the Polaroid camera were inthe order of 5 min whereas with the CCD camera the exposure timecould be reduced to 20 s. Figure 4.3 shows an example where thelength of the sample stick had to be adapted. With the old setup thissimple operation took at least ten minutes whereas it can be done inless than a minute now. Furthermore, the picture taken can be easilyarchived for comparison.
• Finally the development and testing of a high pressure cell dedicatedto biological samples was also part of my work. The cell was orig-inally designed in the group of M.-C. Bellisent-Funel at the Labora-toire Léon Brillouin (LLB) in Saclay [42] (see figure 4.4). The pres-sure cell used in this work was manufactured by J.-L. Laborier and C.Payre at the ILL. It is made out of an aluminium cylinder (7049T6)with an inner diameter of 6 mm and an outer diameter of 15 mm,what leads to a thickness of 9 mm. A piston transmits the pressureof up to 6.5 kbar (1 bar = 0.1 MPa) with a precision of 3% to the sam-ple inside. In order to avoid multiple scattering the sample volumein the beam can be further reduced by an aluminum insert of 4 mmdiameter. The cell has been tested with powder (hydrated lysozyme)and liquid samples (DMPC in D2O). Some of the results obtained onDMPC will be presented in more detail in chapter 8.

38 4.2. INSTRUMENT DEVELOPMENT
400 404
408 412
416
xDF [mm]
60 64
68 72
76
yDF [mm]
600
650
700
750
800
850
900
600 650 700 750 800 850 900
(a)
400 404
408 412
416
xDF [mm]
60 64
68 72
76
yDF [mm]
150
160
170
180
190
200
210
150 160 170 180 190 200 210
(b)
Figure 4.2: Wide scan of the x and y axes of the deflector. Figure 4.2a showsthe intensity measured at the position of the monitor 1, 4.2b shows thesummed intensity of all detectors. The sample used, was a 2 mm thickvanadium reference.

CHAPTER 4. THE BACKSCATTERING SPECTROMETER IN13 39
(a) (b)
Figure 4.3: Example for the adjustment of the length of the sample stickusing the new CCD camera. Picture 4.3a shows the initial position of thesample with respect to the incident neutron beam. Picture 4.3b displaysthe adjusted position. Exposure times were 20 s per image. To visualise thecenter of the sample cell a cross made out of cadmium is screwed to thesample stick.
Figure 4.4: Schematic design of the high pressure cell. The cell can be filledand emptied via the bottom. To reduce the sample volume, an aluminuminsert can be used.

40 4.2. INSTRUMENT DEVELOPMENT

Chapter 5
Model lipids
5.1 Historical overview
Biological membranes are complex systems containing not only differentkinds of lipids, they incorporate also membrane proteins, membrane ac-tive molecules such as, e.g., cholesterol or ethanol etc. The membrane com-position varies not only from organism to organism but it differs also fordifferent organelles. A myelin membrane contains about 80% lipids and20% proteins, whereas the mitochondrial inner membranes contain about75% proteins and only 25% lipids.
Figure 5.1: Schematic composition of a membrane containing lipids, pro-teins and other molecules [43].
41

42 5.2. MODEL LIPID DMPC AND ITS PHASE BEHAVIOUR
The exact knowledge about membrane structure is not very old and itturned out that it was not an easy task to come to this picture. The firsttime an existence of a plasma membrane was proposed was in 1877 byPfeffer [44]. The bilayered structure was introduced by Gorter and Gredelin 1925 [45]. But it took until 1972 to come to a more complete picturewhen Singer and Nicolson [46] suggested in their fluid-mosaic model thatproteins are not simply bound to the membrane, but that they can alsobe incorporated in it. To account for mismatches within the lipid bilayercaused by lipids with different chain length or by lipid protein interactions,Mouritsen and Bloom proposed a modified version of the Singer model, themattress model [47]. Here interfacial tension can lead to a deformation ofthe bilayer and to the aggregation of lipids of a similar kind. A schematicassembly of a membrane and its components is shown in figure 5.1.Even if the investigation of membrane dynamics using neutron scatteringstarted about 15 years ago [36, 48–50], there is still discussion about thetypes of motion observed [51]. In recent years not only local dynamics [36,51] using time-of-flight instruments, but also collective dynamics [25, 52]using three-axis and spin-echo spectrometers have been studied.
5.2 Model lipid DMPC and its phase behaviour
Phospholipids are amphiphilic molecules, which means they posses bothhydrophobic and hydrophilic parts. In the case of phospholipids the polarhead group is the hydrophilic part and the acyl chains are hydrophobic.Therefore they tend to form aggregates when inserted into water with thetrend to form larger aggregates at higher lipid concentrations. The firstcrystal structure of DMPC, the lipid used in this work, was published in1979 [53].
As a function of shape, temperature and concentration they can formdifferent kinds of phases, such as micelles, lamellar, cubic or hexagonalphases. In the following description we will concentrate on the lamellarphases. Depending on the sample preparation they were employed as ori-ented bilayers (when prepared on a solid support 5.3.1) or vesicles, whichcan be subdivided into unilamellar (formed out of only one bilayer) or mul-tilamellar (made out of several bilayers). Below, the different phases aredescribed in more detail and displayed in figure 5.2. Phase transitions canbe determined e.g. by calorimetric measurements, the corresponding datafor DMPC are shown in figure 5.5.
• Lβ′ phase: In this so called ’gel’ phase the lipid chains are ordered inthe all-trans configuration. The prime indicates that the alkyl chainsare tilted with respect to the bilayer normal, in the case of DMPC anangle of about 30° is observed. The high degree of chain order leads to

CHAPTER 5. MODEL LIPIDS 43
Figure 5.2: Schematic representation of the different phases that occur asa function of temperature [54]. The higher the temperature, the higher thechain disorder. Transition temperatures are given for protonated DMPC.
a quasi-crystalline order. This order can be recognised in the neutrondata by the appearance of a coherent peak. This quasi-Bragg peak atQ=1.48 Å−1 corresponds to the inter-chain distance of about 4.25 Å inreal space.
• Pβ′ phase: the ’ripple’ phase. This phase is formed prior to the mainphase transition. It exhibits one dimensional ripples on the mem-brane surface.
• Lα phase: the liquid-disordered or fluid phase. The long-range in-plane order is lost. Due to the disorder of the lipid chains, the quasi-Bragg peak caused by the chain ordering vanishes. This effect can beused for determination of the temperature of the main phase transi-tion TM.
Generally speaking the degree of chain ordering gets lower as you gothrough the different phases starting with the low temperature Lβ′ phase.Figure 5.3 shows the phase behaviour of DMPC which was used in thisstudy as a function of temperature and hydration.The transition temperature shifts with increasing chain length to highertemperatures and can be approximated linearly. Table 5.1 gives values forTM for some common lipids. The lower TM for the deuterated lipids wasassociated by Guard-Friar and coworkers to a lower degree of ordering inthe gel phase of the deuterated hydrocarbon chains [56].
During this work two kinds of DMPC were used for experiments: fullyprotonated DPMC and chain deuterated DMPC-d54 (see figure 5.4). Bothcoherent and incoherent scattering lengths for the two species are found

44 5.2. MODEL LIPID DMPC AND ITS PHASE BEHAVIOUR
Figure 5.3: Phase diagram of DMPC as a function of temperature and rela-tive humidity [55].
Lipid chain length TM [K]
DMPC 14:0 296.75DMPC-d54 14:0 293.30DPPC 16:0 314.45DPPC-d62 16:0 310.27DSPC 18:0 327.85DSPC-d70 18:0 323.67
Table 5.1: Transition temperatures TM of some common lipids. Values forthe protonated lipids are adapted from [54]. The chain deuterated lipids aremarked as “-d” where the number indicates the total number of deuteriumatoms present in both alkyl chains. TM for the chain deuterated lipids aretaken from [56].Note that there is a shift of 3-5 K for the deuterated lipids. This shift wasassociated by Guard-Friar et al. [56] with a less well ordering of the chainsin the gel phase in the case of chain deuterated lipids compared to theirnondeuterated counterparts.
CHAPTER 5. MODEL LIPIDS 45
in table 5.2. The experiments done with DMPC-d54 are described in thechapters 6 and 7, fully protonated DMPC was used for the high pressurestudies presented in chapter 8.
σcoh [barn] σinc [barn]
DMPC 373.97 5779.98DMPC (tails)
239.34 4315.17(H54C26)DMPC (head group)
135.32 1445.38(C10H18NO8P)DMPC-d54 (tails)
446.29 110.73(D54C26)DMPC-d54 total 581.61 1556.11
Table 5.2: Scattering lengths σ for fully protonated DMPC and chain deuter-ated DMPC-d54. The head group comprises the choline and phosphategroups as well as the glycerol backbone. The chain includes the CD2 andCD3 groups.
5.3 Sample preparation
5.3.1 Oriented samples
The chain deuterated lipids were purchased from Avanti Polar Lipids (Al-abaster, AL., USA) and used without any further purification. The DMPCpowder was dissolved in a 3:1 chloroform-trifluoroethanol (TFE) mixture[59]. This solution was kept at −20 C overnight and then sprayed ontocleaned Si-wafers. The wafers were purchased from Siltronix, Archamps,France. Its specifications are listed in table 5.4. Each Si-wafer was cut toa size of about 30 mm x 40 mm to fit perfectly the dimensions of the IN13sample holders. The sample holders are made out of aluminium and werecoated with 0.5 µm gold and 3 µm nickel to avoid chemical interacting be-tween the holder and the sample. About 30 mg of lipid was deposited on asingle wafer. After the preparation the wafers were dried for two days in adesiccator.
The samples were rehydrated from pure D2O or saturated salt solutionsat 40 C. The corresponding relative humidities can be found in table 5.3.Each sample was made out of six such wafers, to achieve a sample amountof about 200 mg per sample. In order to reduce contact with the sampleholder to a minimum, the wafers are inserted into the holder in a way that

46 5.3. SAMPLE PREPARATION
(a)
(b)
Figure 5.4: Schematic structure of the both types of DMPC employed in thiswork. Fully protonated DMPC is shown in figure 5.4a, chain deuteratedDMPC-d54 in figure 5.4b, respectively. Both pictures are taken from [57].
salt relative humidity max. dissolved salt[%] [g/100 g H2O]
K2SO4 96 14.8KCl 82 40.3NaCl 75 36.4
Table 5.3: Salts used for rehydration. All values are given for a temperatureof 40 C.
the sprayed sides face each other. After closing the sample holders, theweight of both samples was monitored. No mass loss was observed afterthe experiments.
5.3.2 DMPC in solution for the high pressure experiments
When applying high pressure to the membranes, oriented sample can nolonger be used, simply because the silicon wafers will not support the highpressure and break. Therefore the samples for the high pressure investi-gation of the dynamics of DMPC cannot be prepared on silicon wafers buthave to be in solution.For the high pressure experiments completely protonated DMPC purchasedat Lipoid (Ludwigshafen, Germany), was used. To avoid water inclusionsin vesicles formed during the preparation, DMPC powder was hydratedfrom D2O vapor pressure at 40 C for two days. To ensure a fully hydratedsample, additional heavy water was added when filling the sample holder

CHAPTER 5. MODEL LIPIDS 47
Figure 5.5: Calorimetric melting profile of DMPC [58]. Here, the heat capac-ity ∆cp as a function of temperature is shown. It increases slightly around287 K at the pretransition from the gel phase to the ripple phase. Around297 K ∆cp shows a drastic and sharp increase due to the main phase transi-tion from the ripple to the liquid-disordered phase.
Diameter 3 inchOrientation <111>Thickness (380± 25)µmDoping N-PhosResistivity > 10 ΩSurface polished one side
Table 5.4: Characteristics of Si-wafer.

48 5.3. SAMPLE PREPARATION
for the high pressure experiments.

Chapter 6
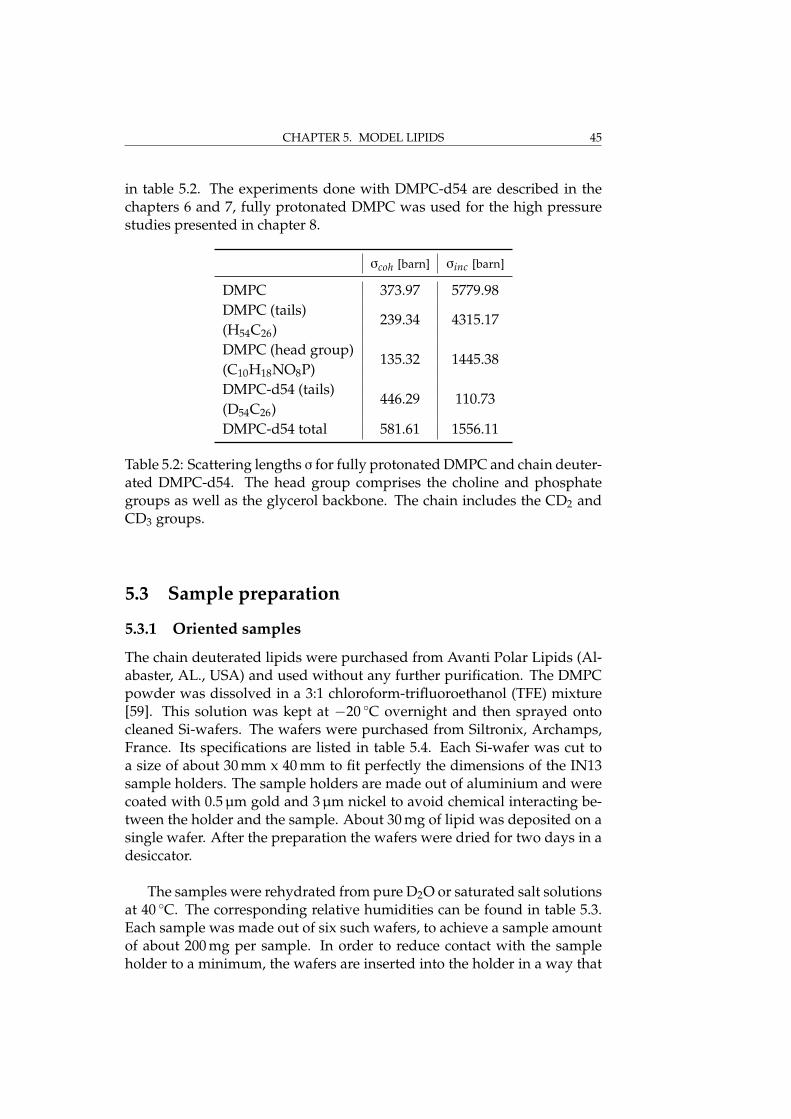
Elastic measurements
Native biological systems are always found in aqueous environments. There-fore, it is not surprising that dynamics of such systems are influenced bythe hydration level, as it has been confirmed by several neutron scatter-ing studies [6, 60–64] and molecular dynamics (MD) simulations [65–68].A dynamical transition for proteins appears around 200 K. This marks thecrossover from a regime in which only vibrational motions of the atoms,around their stationary position, are observed to a regime where anhar-monic motions emerge. Below a certain level of hydration (typically 0.2-0.4g water/g protein) corresponding to one complete water layer bound to theprotein surface, the protein shows no dynamical transition and as a conse-quence does not become active [6].In the case of membranes a transition due to the structural transition intothe liquid-crystalline Lα phase is observed (cf chapter 5). Depending onthe chain length and the degree of hydration of the lipid it occurs aroundroom temperature or even higher temperatures [54]. In contrast to pro-teins where the hydration of individual amino acids allows local motions ofthe protein, in phospholipid bilayers only the hydration of the hydrophilichead group triggers the dynamic response of the hydration shielded hy-drophobic alkyl chains, due to the increased surface available with increasedhydration. For membranes a shift of the main phase transition to highertemperatures with decreasing water content is already known for quitesome time [55]. In recent years numerous neutron scattering studies ofmembrane dynamics focused on highly hydrated samples [36, 48, 69, 70],but only a few of these studies took hydration effects explicitly into consid-eration, e.g., König et al. [48].In the following chapters the investigation of the influence of hydration onthe dynamics of model membranes by elastic incoherent (EINS) (chapter6) and quasi-elastic (QENS) (chapter 7) neutron scattering is discussed inmore detail. Dynamics in such lipid systems span a large range in time andspace and have been investigated not only by neutron scattering [25, 36,
49

50 6.1. SAMPLE CHARACTERISATION AT D16
48, 52, 69], but also by nuclear magnetic resonance (NMR) [50, 71], inelas-tic x-ray scattering [72], dielectric spectroscopy [73], differential scanningcalorimetry (DSC) [74], dynamic light scattering (DLS) [75], single parti-cle tracking [76] and other methods. In addition to the experimental re-sults there are also simulations dealing with membrane dynamics avail-able [65–68]. To mimic membrane behaviour in biological systems the fullyhydrated state is the one of interest because this resembles physiologicalconditions. On the other hand also the dried state is of interest, e.g. forfood science [37]. Therefore an exact knowledge of the hydration and theresulting dynamics of the investigated sample are crucial for the under-standing of the system.
6.1 Sample characterisation at D16
In this section the characterisation of the DMPC-d54 multilayer samplesat the small momentum transfer diffractometer D16 (see figure 6.1) for theelastic measurements performed on IN13 is described.D16 is situated, like IN16, on the H53 guide of the ILL. Via a focusing py-rolytic graphite monochromator two wavelengths (4.7 Å or 5.6 Å) can beselected. A beryllium filter is used to eliminate higher orders and a set ofslits to adapt the beam size to the individual sample size is available. Thediffracted neutrons are recorded with a two dimensional area detector.As mentioned in chapter 3, structural information about the sample canbe extracted from diffraction data. From the scattering angle θ, the wavevector transfer Q can be calculated following eq. 6.1 (λ being the incidentwavelength and θ the scattering angle).
Q =4π
λsin(θ). (6.1)
Combining equation 6.1 with Bragg’s law (eq. 3.13) leads to:
d =2π
Q. (6.2)
where d stands for the atomic distance corresponding to a given Q-value.
In the case of solid supported membranes, the characteristic repeat dis-tance d of the bilayers and the alignment of the multilayer with respect toeach other were checked. The first can be done by scanning the scatteringangle θ (θ - 2θ scan). From the positions of the Bragg peaks in reciprocalspace the repeat distance can be calculated using equation 6.2. As the re-peat distance depends on the hydration, the degree of hydration can beextracted from this value [78].

CHAPTER 6. ELASTIC MEASUREMENTS 51
Figure 6.1: Schematic layout of the small momentum transfer diffractome-ter D16 at ILL [77].
The mosaic spread can be deduced from a rocking scan where the sampleis rotated with respect to the incoming beam (ω-axis). From the full widthat half maximum (FWHM) of the first order Bragg reflections the mosaicspread of the samples was calculated. The mosaic spread is an indicationof the relative orientation of the membranes. A typical value of the mosaicspread for solid supported membranes is in the order of 1° or less.With this two methods a d-spacing of 62.5 Å and a mosaicity of (0.22± 0.02)°(FWHM) were found for the sample hydrated from pure D2O. In the courseof this work, it will be referred to as the "higher hydrated sample".The sample hydrated from saturated salt solution (D2O + NaCl) showed ad-spacing of 54.9 Å and a mosaic spread of (0.25± 0.02)°. It will be referredto as "less hydrated sample".Comparing the measured values with the values obtained by Kucerka et al.using X-ray diffraction [78], the hydration of the first sample correspondsto a fully hydrated sample. The latter one corresponds to the hydrationused by Rheinstädter et al. for their investigations of collective membranedynamics e.g [25, 79].Figures 6.2a and 6.2b show the fits to evaluate the mosaic spread. The θ-2θscans for the evaluation of the repeat distance are shown in figures 6.3a and6.3b. The incident wavelength for these measurements was λ = 4.75 Å.
6.2 Elastic measurements at IN13
A detailed description of the instrument can be found in chapter 4. Trans-mission for both samples was measured and found to be in the order of90%, so multiple scattering effects were not taken into consideration for the
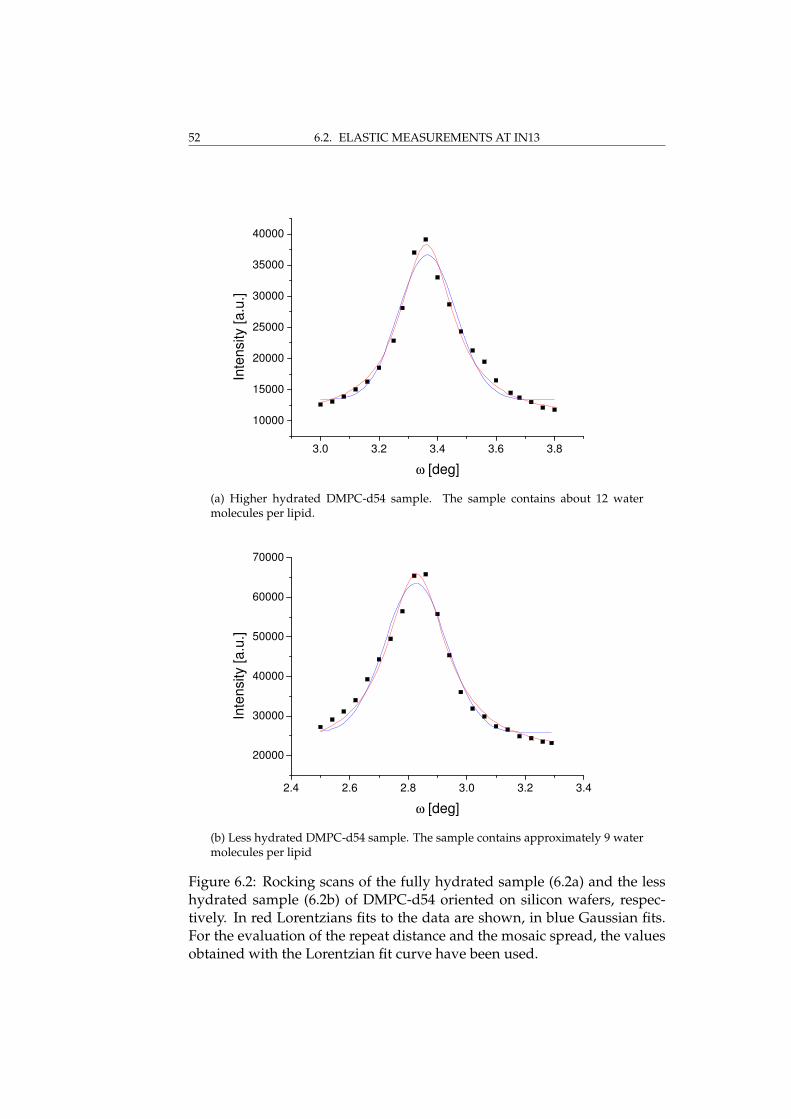
52 6.2. ELASTIC MEASUREMENTS AT IN13
3.0 3.2 3.4 3.6 3.8
10000
15000
20000
25000
30000
35000
40000In
tensity [
a.u
.]
ω [deg]
(a) Higher hydrated DMPC-d54 sample. The sample contains about 12 watermolecules per lipid.
2.4 2.6 2.8 3.0 3.2 3.4
20000
30000
40000
50000
60000
70000
Inte
nsity [
a.u
.]
ω [deg]
(b) Less hydrated DMPC-d54 sample. The sample contains approximately 9 watermolecules per lipid
Figure 6.2: Rocking scans of the fully hydrated sample (6.2a) and the lesshydrated sample (6.2b) of DMPC-d54 oriented on silicon wafers, respec-tively. In red Lorentzians fits to the data are shown, in blue Gaussian fits.For the evaluation of the repeat distance and the mosaic spread, the valuesobtained with the Lorentzian fit curve have been used.

CHAPTER 6. ELASTIC MEASUREMENTS 53
data treatment. For both samples fixed energy window (FEW) scans wererecorded in the temperature range between 250 K and 310 K in steps of 5 Kto cover both the phase transition from the lamellar gel to the fluid phaseat 295 K and also the transition from the gel to the crystalline phase around285 K. Special care was taken for the sample alignment so that the scatter-ing vector ~Q at the lipid peak maximum lies in the plane of the membranebilayers for the parallel orientation. Using equation 6.1 the correspondingangles of 75° and 165° with respect to the incoming beam were calculatedfor the parallel and perpendicular orientation of the scattering vector to-wards the membrane surface, respectively.Strictly speaking the terms “parallel” and “perpendicular” are only true forthese particular values, nevertheless we are using these designations in thecourse of this work to distinguish the orientations where these alignmentsare best visible. Both orientations ~Q|| and ~Q⊥ to the membrane surfacewere measured, but we focused on the parallel orientation (2θ = 75°) in or-der to investigate the in plane diffusion. Three hours per temperature weremeasured to favor good data statistic collection for this orientation. For theperpendicular orientation the acquisition time varied between 45 minutesand one hour (at higher temperatures in particular). For data correctionpurposes an empty cell, a cell with six cleaned wafers and for normaliza-tion a 2 mm Vanadium sample were measured. The data evaluation wascarried out using the LAMP software available at ILL [80].Normalised intensities as a function of Q for both orientations are shownin figure 6.4. Here the clear difference between the two orientations is ob-vious. The quasi-Bragg peak arising from the ordering of the alkyl chainsis clearly visible in the parallel setup (figure 6.4a), whereas in the perpen-dicular orientation (figure 6.4b) ordering out of the plane is probed andtherefore the peak around 1.5 Å−1 is no longer observed.
6.2.1 Results and discussion
Figure 6.5 shows the normalized summed intensity taken on IN13 (Q-range:0.19 Å−1 < Q < 1.67 Å−1) as a function of temperature for both samples.The representation of the data offers a simple and model-free approach todetect transitions as changes in the elastic intensity decay [81]. In the cho-sen setup, the influence of the coherent scattering coming from the chainordering is mainly seen in the parallel orientation. Summed intensities arethen shown only for the parallel orientation. The phase transition for thefully hydrated sample is found to lie around 294 K which coincides verywell with the value of 293.30 K found by Guard-Friar et al. [56] by differ-ential scanning microcalorimetry for DMPC-d54. Whereas for the less hy-drated sample a transition temperature around 298 K is found.It is known from e.g. FTIR spectroscopy [82] that dehydration increasesthe transition temperature. Following the procedure used by Pfeiffer et

54 6.2. ELASTIC MEASUREMENTS AT IN13
0.0 0.1 0.2 0.3
100
1000
neut
ron
coun
ts
Q [Å-1]
(a) Higher hydrated DMPC-d54 sample.
0.0 0.1 0.2 0.3
100
1000
10000
neut
ron
coun
ts
Q [Å-1]
(b) Less hydrated DMPC-d54 sample.
Figure 6.3: θ-2θ scans of the two samples. From the peak position the repeatdistance of the bilayers was calculated using equation 6.2.

CHAPTER 6. ELASTIC MEASUREMENTS 55
al. [83] we estimated the water content from the shift of the main phasetransition temperature. We can extract the parameter RW=nW/nA whereRW expresses the molar ratio of water (nW) and amphiphile (nA) [82, 83].The calculated RW for the fully hydrated sample is RW ≈ 12 and RW ≈ 9for the less hydrated sample. Pfeiffer et al. find for DMPC multilayers avalue of RW ≈ 12 for fully hydrated membranes [83]. Therefore the elasticmeasurements on IN13 provide a solid basis to characterize the system forthe quasi-elastic experiment at TOFTOF. The quasi-elastic experiments willbe described in more detail in chapter 7.Due to the coherent scattering arising from the ordering of the lipid chainsbelow the main phase transition and the relatively broad Q resolution ofIN13 only three detectors were left to evaluate the mean square displace-ments (msd) [28], therefore, it was not possible to obtain msd’s with rea-sonable error bars. A detailed comparison between mean square displace-ments and summed intensities for DMPC can be found elsewhere [84].
6.3 Elastic measurements at IN16
Because it was not possible to extract mean square displacements from theelastic scans on IN13, another set of measurements on the IN16 backscat-tering spectrometer, where more detectors in the low Q-range and a higherflux are available, was performed. This time two hydration levels that weredifferent from the ones used on IN13 and TOFTOF were used. For the sam-ple rehydration saturated salt solution made out of D2O + K2SO4 and D2O+ KCl, resulting in relative humidities of 96 % and 82 %, respectively (cftable 5.3). As for the previous experiment also in this case the level of hy-dration, the mosaicity of the 1D lamellar order and the evolution of the re-peat distance (d-spacing) of the bilayers with temperature were checked byneutron diffraction measurements on the small momentum transfer diffrac-tometer D16 [77]. After heating to 330 K to allow annealing of defects, scanswere performed to obtain the repeat distance of the membranes at three dif-ferent temperatures, namely 330 K, 310 K and 280 K. During the tempera-ture changes data were taken to identify the temperature of the main phasetransition. An example of the evolution of the d-spacing with temperatureis shown in figure 6.6a.
Elastic temperature scans in the range of 280-330 K were performed onthe cold neutron backscattering spectrometer IN16 at ILL at an energy reso-lution of ∆E = 0.9 µeV (full width half maximum) and an accessible Q-rangeof 0.19-1.93 Å−1 [20]. The investigated temperature range covers both themain phase transition from the Pβ ripple to the liquid-crystalline Lα phasewhich occurs around 297 K for DMPC at full hydration and also the pre-transition from the Lβ gel phase to the Pβ ripple phase about 10 degreesbelow the main phase transition. Special care was taken on the orienta-

56 6.3. ELASTIC MEASUREMENTS AT IN16
0
0.05
0.1
0.15
0.2
0.25
0.3
0 0.5 1 1.5 2
elas
tic in
tens
ity [a
. u.]
Q [Å−1]
(a) Parallel orientation ~Q||. Triangles represent data taken in the Lβ′ at 280 K, circledata in the Lα phase at 300 K. The higher hydrated sample is drawn in red, the lesshydrated in blue.
0
0.1
0.2
0.3
0.4
0.5
0.6
0 0.5 1 1.5 2
elas
tic in
tens
ity [a
. u.]
Q [Å−1]
(b) Perpendicular orientation ~Q⊥. Again triangles show data recorded in the Lβ′ at280 K. The data in the Lα phase are given for the higher hydrated sample at 300 K,for the less hydrated sample at 305 K. The higher hydrated sample is drawn in red,the less hydrated in blue.
Figure 6.4: Normalised elastic intensities for both DMPC-d54 samples un-der investigation in the parallel (6.4a) and perpendicular (6.4b) orientation.

CHAPTER 6. ELASTIC MEASUREMENTS 57
0
0.2
0.4
0.6
0.8
1.0
0 5 10 15 20 25 30 35 40
270 275 280 285 290 295 300 305 310 315
su
mm
ed in
ten
sitie
s [
a.u
.]
temperature [°C]
temperature [K]
higher hydrated sampleless hydrated sample
Figure 6.5: Summed intensities for both samples DMPC-d54 in the parallelorientation measured on IN13. Used Q-range: 0.19 Å−1 < Q < 1.67 Å−1.
tion of the sample to probe motions around the chain correlation peak atQ=1.48 Å−1 parallel and perpendicular to the membrane surface. Via therelation 6.1 the angle of the sample with respect to the incoming beam wascalculated to be 135° for the orientation parallel to the membrane surfaceand 45° for the perpendicular orientation, respectively. From the obtaineddata an empty cell was subtracted and the data were normalised by thescattering of a 1mm Vanadium sample.Figure 6.7 (using the left y-axis) shows the summed elastic intensities mea-sured for the parallel orientation at 135° with respect to the incoming beamfor the two samples on IN16. At the temperature of the main phase transi-tion a drastic decrease in the elastic intensity occurs. The phase transitiontemperature moves to higher temperatures for the sample with lower wa-ter content.In order to compare the results obtained from the mean square displace-ment (using the right y-axis in figure 6.7) with the summed elastic intensi-ties, the intensities shown in figure 6.7 (using the left y-axis) were summedover the same Q-range (0.43 Å−1 6 Q 6 1.16 Å−1) which was used in theevaluation of the msd’s. The effect is stronger for the summed intensitiesdue to adding up the signals from all detectors in the used Q-range. Fromhydration dependent studies of e.g. bacteriorhodopsin [55] it is known thatwith increasing hydration the msd’s show a steeper slope only at high rel-

58 6.3. ELASTIC MEASUREMENTS AT IN16
0.05 0.10 0.15 0.20 0.25 0.30 0.35 0.40 0.45
100
1000
10000
100000in
tens
ity [a
.u.]
Q [Å-1]
(a) DMPC-d54 sample hydrated from D2O + K2SO4.
0.05 0.10 0.15 0.20 0.25 0.30 0.35 0.40 0.45
1000
10000
100000
inte
nsity
[a.u
.]
Q [Å-1]
(b) DMPC-d54 sample hydrated from D2O + KCl.
Figure 6.6: θ-2θ data taken on D16 at ILL. Data for both samples are shownfor three different temperatures: 280K (black), 310K (red) and 330K (green).The less hydrated sample (6.6b) shows no change of the lamellar d-spacingbelow 310 K, whereas a continuous change is observed for the higher hy-drated sample 6.6a.

CHAPTER 6. ELASTIC MEASUREMENTS 59
ative humidities in contrast to proteins where a steady rice of the msd isobserved [28].
6.3.1 Results and discussion
From the shift of the main phase transition temperature to higher temper-atures with decreasing water content (see section 1 and figure 1 in [5]), it ispossible to evaluate the water content between the phospholipid surfaces.We can extract the parameter RW=nW/nA where RW expresses the molarratio of water (nW) and amphiphile (nA) [82, 83]. The calculated RW for thehigher hydrated sample is RW ≈ 6 (transition temperature: 305 K) and RW≈ 4 for the less hydrated sample (transition temperature: 310 K). A valuesof RW ≈ 12 was found by Pfeiffer et al. for DMPC multilayers for a fullyhydrated sample [83].To characterise the local dynamics from the elastic neutron scattering in-tensity, the so called atomic mean square displacements (msd) <u2> werecalculated. The elastic scattering function S(Q, ω=0) can be approximatedby S(Q, ω=0) ≈ exp(-<u2>Q2/3), as explained in section 3.6.1. From theslope of a linear fit to the logarithm of the normalised data as a functionof Q2 the <u2> were extracted. Below the temperature of the main phasetransition, coherent scattering arising from the ordering of the alkyl chain,gives rise to the so called "chain correlation peak" around a characteristic Qvalue of 1.48 Å−1. Therefore the fit range was limited to 0.18-1.33 Å−2 in ourdata analysis. As shown in figure 6.7 (using the right y-axis) the <u2> showtransitions at 305 K and 310 K for the higher and lower hydrated sample, re-spectively. At first sight the evaluated mean square displacements are verylarge above temperature of the main phase transition, but <u2> in the sameorder of magnitude have been observed in a previous study which aimedto investigate the influence of the myelin basic protein (MBP) on the dy-namics of model membranes (DMPA in this study) [85].A recently published molecular-dynamics simulation performed on fullyhydrated DMPC bilayers in the Lα phase (at 303 K) also shows very large<u2> at this temperature, even larger then the two partially hydrated sam-ples used in our study [86]. Hence we attribute the difference in the valuesof the mean square displacements to the different hydrations of the sam-ples, ranging from the highest <u2>-value for the simulation (≈ 8 Å2 forthe centre of mass) to the sample with the lowest hydration of RW ≈ 4 (≈1.5 Å2). The authors differentiate three different diffusion regimes in time:1. a ballistic region where <u2> ≈ t2; 2. a subdiffusive domain where <u2>≈ tβ with β < 1 and 3. a domain of Fickian diffusion with <u2> ≈ t. Ac-cording to this simulation, the time window of IN16 of about 700 picosec-onds probes length scales in the subdiffusive regime. A detailed analysisof quasi-elastic data taken on IN13 in both the Lβ gel and liquid-crystallineLα phase is still in progress [87].

60 6.3. ELASTIC MEASUREMENTS AT IN16
0
0.2
0.4
0.6
0.8
1
280 290 300 310 320 330 0
1
2
3
4
5
6
305 312
sum
med
inte
nsiti
es [a
.u.]
<u2 >
[Å2 ]
temperature [K]
Figure 6.7: Summed elastic intensity (Q-range: 0.43-1.16 Å−1) measuredat 135° (left y-scale, filled squares RW ≈ 4, empty circles: RW ≈ 6) andmean square displacements <u2> (right y-scale, filled diamonds RW ≈ 4,empty triangles: RW ≈ 6). Drawn lines are guides to the eyes to followthe evolution of the mean square displacements. Data taken on the coldneutron spectrometer IN16 at ILL (energy resolution: 0.9 µeV). Intensitiesare normalised to the lowest temperature.
Rheinstädter et al. [79] analyzed the elastic intensity at various Q-valuesof DMPC to map out the transition of the different molecular componentsfrom immobile to mobile as a function of temperature. The effect of hy-dration on the membrane dynamics was neglected in their analysis. Ourstudy reveals the strong influence hydration has on the membrane sys-tems, not only on the structure but also on the dynamics. Similar to hy-drated protein powders also phospholipids show a dynamic transition inthe mean square displacements <u2> and a shift of the temperature of themain phase transition depending on their hydration. The transition for pro-teins occurs around 200 K and is often called "dynamical transition" [9]. Inthe case of membranes this transition is due to the structural transition intothe liquid-crystalline Lα phase at 297 K. In contrast to proteins were theindividual amino acid is hydrated to allow local motions of the proteins inphospholipid bilayers only the hydration of the hydrophilic head group ofthe phospholipid triggers the dynamic response of the hydration shieldedhydrophobic alkyl chains. In conclusion special care should be taken forthe hydration control to avoid a mixing of effects, which could be partlydue to the hydration state of the sample.

Chapter 7
Quasi-elastic measurements
7.1 Sample characterisation at TREFF
The same two samples used for the elastic measurements in May 2008 atIN13 (see chapter 6) were used for the measurements at the time-of-flightinstrument TOFTOF. In the time between the two measurements the sam-ples were kept in a cold room at 8 C. To see if the two samples kept theirgood alignment, diffraction data was taken at the TREFF diffractometer atFRM II (see figure 7.1). The higher hydrated sample showed a lamellard-spacing of 62.96 Å, which reproduced the values calculated from the ear-lier measurements at D16 (see section 6.1). The mosaicity of this samplewas 0.1°. With 52.25 Å the d-spacing of the less hydrated sample was 2.6 Åsmaller then during the elastic measurements on IN13. The mosaicity forthis sample was also 0.1° (This value of 52.25 Å corresponds to the value of53 Å of the sample used by Rheinstädter et al. [25]). Fits for the diffractiondata is shown in figures 7.2a and 7.2b.
7.2 The measurement
Quasi-elastic neutron scattering experiments (QENS) have been performedon the same samples at the time-of-flight spectrometer TOFTOF [23] at theMunich research reactor FRM II in Garching, Germany. Other results ob-tained on of the spectrometer in the field of membrane biophysics can befound in e.g. Busch et al. [51]. The incident wavelength was set to λ=6 Å,the chopper speed to 12000 rpm, resulting in an energy resolution of theelastic line of 56 µeV (FWHM of the elastic line). The setup was chosenin order to compare the results with previous measurements obtained byanother group [36]. Both samples were measured in a temperature rangefrom 278 K to 298 K to cover both phase transitions, the pre-transition fromthe Lβ gel phase to the Pβ ripple phase at 285 K as well as the main phasetransition from the Pβ phase to the Lα liquid phase at 295 K [55]. Spectra
61

62 7.3. RESULTS AND DISCUSSION
Figure 7.1: Setup of the diffractometer TREFF at FRM II.
were taken every 5 K. The measuring time per temperature was five hours.All samples, including a 1.5 mm vanadium sample and a sample holderwith six empty wafers and pure D2O needed for corrections, were mea-sured in one orientation (at 45° with respect to the incident beam), only.The D2O hardly contributes to the scattering signal of the empty cell at thiswavelength as it was shown by Busch et al. [51], therefore the empty cellscattering can be subtracted from the sample signal. In the case of 2θ =45°, ~Q is mainly parallel to the membrane surface at the alkyl chain corre-lation peak position (Q=1.48 Å−1) for low energy transfers. Earlier QENSexperiments on 1,2-dipalmitoyl-sn-glycero-3-phosphocholine (DPPC) [36]observed no significant differences in the elastic incoherent structure fac-tor (EISF) for ~Q oriented parallel or perpendicular to the membrane sur-face in this time window. This fact was confirmed by our elastic data,and consequently the QENS data were recorded only for the parallel ori-entation. From the measured spectra the scattering of the empty can wassubtracted, then they were normalized to vanadium and transformed into(Q,E)-space. The data were binned into 15 groups with Q ranging from0.44 Å−1 to 1.56 Å−1. Data reduction was performed with IDA packageavailable onsite [88], data analysis was done using the PAN package fromDAVE software [89].
7.3 Results and discussion
A detailed description of the analysis of quasi-elastic neutron scatteringdata can be found in Bée [24]. For applications in the context of lipid dy-

CHAPTER 7. QUASI-ELASTIC MEASUREMENTS 63
namics see e.g. Busch et al. [51] and for water dynamics in lipid systemse.g. Swenson et al. [90].The obtained data are a convolution of the theoretical scattering law Stheo(~Q,ω)and the instrumental resolution Sres(~Q,ω) given by a measured vanadiumsample (cf equation 3.27). The theoretical scattering law can be expressedby a delta function for the elastic contribution and a sum of Lorentziansfor the quasi-elastic contributions coming from the dynamics of the inves-tigated sample [24]. It is shown in equation 3.25. In our study, an elasticpeak and two Lorentzian functions (narrow and broad components) werenecessary to reasonably fit the obtained data. In figure 7.3 the fits to thedata are shown for two Q values. S(~Q,ω) can be written as shown in equa-tion 3.25 with n = 2.Keeping in mind that chain-deuterated lipids were used in our experi-ments, the narrow and the broad Lorentzians were associated with slowand fast motions of the head groups, respectively. The geometry of the mo-tion can be extracted from the elastic incoherent structure factor (EISF) asdefined in equation (7.1)
EISF(~Q) =A0(~Q)
A0(~Q) + A1(~Q) + A2(~Q). (7.1)
For both samples the EISF does not decay to zero for large Q-values,which indicates an immobile fraction in the examined time-space window.Two different models were applied to fit the EISFs. First we used the "diffu-sion in a sphere" model introduced by Volino and Dianoux [31], where freediffusion in the restricted volume of a sphere is permitted. Bellissent-Funeland co-workers [32] established as an addition to this model an immobilefraction. Here p and (1 − p) denote the populations of hydrogen atomsthat appear immobile and mobile in the observed space and time window,respectively. The corresponding EISFs are described by equations 3.29 and3.30.A modification of the Volino-Dianoux model allows increasing radii forthe diffusion volumes of the hydrogen atoms along the head group (seeequation (3.33a)). This model was introduced by Carpentier et al. for thestudy of dicopper tetrapalmitate [35] and is described by equations 3.33aand 3.33b. N stands for the total number of atoms in the chain to which hy-drogen atoms are bound (in the case of this study N=3). The index n startswith the carbon atom the closest to the oxygen of the phosphorus groupwhich connects the lipid chains with the head group and ends with thenitrogen of the choline group (see fig. 5.4). Rn gives the radius of the dif-fusion volume for the corresponding hydrogen atoms. In equation (3.33b)linear increasing radii are assumed. It turned out during the fitting proce-dure that the choice of N=3 yields physically reasonable results, whereasfor values bigger than N=3 the radius for R1 became negative.

64 7.3. RESULTS AND DISCUSSION
1.8 2.0 2.2 2.4 2.6 2.8 3.0
0
50
100
150
200
250cou
nts
ω [deg]
(a) Higher hydrated sample with a repeat distance of 62.96 Å and a mosaic spreadof 0.1°.
1.5 2.0 2.5 3.0 3.5
0
2000
4000
6000
8000
10000
12000
14000
cou
nts
ω [deg]
(b) Less hydrated sample with a repeat distance of 52.25 Å and a mosaic spread of0.1°.
Figure 7.2: Rocking scan of the two DMPC-54 samples measured at TREFF(FRMII). The samples were exactly the same samples used for the experi-ments on D16 and IN13 and described in chapter 6.2.

CHAPTER 7. QUASI-ELASTIC MEASUREMENTS 65
Around 1.48 Å−1 the coherent scattering rising from the ordering of thelipid chains, the so called "chain correlation peak", is clearly visible. To ex-clude its influence on the EISF fits, the fit range was restricted to a rangeof 0.44 Å−1 < Q < 1.32 Å−1. Figures 7.4a and 7.4b show the obtained datafor two temperatures, one below (278 K) and one above (298 K) the mainphase transition for the fully hydrated sample and the less hydrated sam-ple, respectively. Fits corresponding to the diffusion in a sphere model areshown as solid blue lines, the Carpentier model as dashed green lines. Inthe case of the less hydrated sample the diffusion in a sphere model fits thedata sufficiently well within the experimental errors, leading to values ofa = (2.64± 0.10)Å and a = (2.91± 0.06)Å for the radii at 278 K and 298 K,respectively. For the higher hydrated sample the simple model of diffu-sive motion in a sphere is not longer sufficient. Here the Carpentier modelgives definitely better results, especially at higher temperatures. In the Lβgel phase at 278 K the fits result in values of Rmin = (0.36± 0.04)Å for thedisplacement of the proton bound in the methylene groups near the phos-phorus atoms of the lipid and of Rmax = (5.05± 0.06)Å for the hydrogensof the methyl groups in the choline group. At 298 K in the liquid Lα phasecorresponding values of Rmin = (1.14± 0.03)Å and Rmax = (6.42± 0.11)Åwere obtained. The fact that the EISF is not going to zero for large Q-valuesis an indication that not all of the protons take part in the movements ob-served in the chosen time-space window of the experiment, as it has beenseen e.g. for protein-membrane complexes [85, 91]. However for a detailedinvestigation a broader Q-range would be preferable to clearly distinguishtrends. In this context we want to emphasize that both employed mod-els have only two fit parameters, namely in the case of the diffusion in asphere model the radius a and the immobile fraction p, and in the Carpen-tier model the first radius R1 and the last radius RN . We tried also to fitother models to the EISF (with more than two fit parameters) which areoften used to analyze methyl group reorientation because of the three headgroup methyl groups. Namely the threefold jump model [24] and a variantof this model (applied to the methyl reorientation on trimethyloxosulpho-nium [92]) have also been fitted to the data, but they do not sufficiently wellfit the experimental data (not shown).
Our experiments demonstrate nicely the influence of hydration on themobility of the protons. The difference in the EISF values shows a strongdependence on the level of hydration. For the "diffusion in a sphere" modelthe percentage of immobile protons can be inferred directly from the fit pa-rameter p (see formula 3.30)), in the case of the Carpentier model differentradii for the volume of rotation can be extracted. Thus, for the less hy-drated sample the values of the strongly bound protons for 278 K amountto p278 K = (61.9± 1.4)% and p298 K = (42.0± 0.8)% for 298 K, respectively.

66 7.3. RESULTS AND DISCUSSION
0.01
0.1
1
10
−1 −0.5 0 0.5 1
S(Q
,ω)
[a. u.]
energy [meV]
(a) Q = 0.44 Å−1.
0.01
0.1
1
10
−1 −0.5 0 0.5 1
S(Q
,ω)
[a. u.]
energy [meV]
(b) Q = 1.48 Å−1.
Figure 7.3: Plot of S(~Q,ω) for the higher hydrated sample (RW ≈ 12) attwo discrete Q-values at a temperature of 278 K. The resulting fit is shown(black line) as well as the single contributions. As blue line the delta func-tion is drawn, the two Lorentzians are plotted as green and pink lines, re-spectively.

CHAPTER 7. QUASI-ELASTIC MEASUREMENTS 67
Even if the "diffusion in a sphere" model cannot be applied to the higherhydrated sample, it is already clear from comparing figures 7.4a and 7.4bthat the immobile fraction for the latter sample is lower. With the obtainedresults, we are able to directly associate different models of motions to agiven hydration of the lipids.The line width of the broad Lorentzian is about a factor of ten larger thanthe narrow one and it shows Q independent, constant values of Γ for bothhydrations (data shown in figure 7.6), indicating some rotational motions.As this contribution is so noisy, it will not be discussed in more detail.
Figures 7.5 and 7.7 show the line widths Γ of the narrower Lorentzianas a function of Q2.
For small Q-values (Q → 0), the data do not go to zero as for free dif-fusion, then they increase and asymptotically reach a constant value Γ∞for large Q. A constant value at small Q was assigned by Volino and Di-anoux [31] to a confinement effect at large radii. A similar behaviour isassumed and has also been observed by Carpentier et al. [35].However we find a discrete kink only for the lowest measured tempera-ture (red points in figure 7.5 and in more detail shown in figure 7.7). Atthis temperature the confinement radius Rcon f obtained from the crossoverof the two regimes at a Q2-value of about 0.55 Å−2 following formula 7.2was calculated to be (4.2± 0.4)Å. This values is in between Rmin and Rmaxobtained from the EISF fits for the corresponding sample at 278 K and there-fore consistent with these values according to
Q =π
Rcon f. (7.2)
No pronounced plateau is visible for higher temperatures, but a Γ whichdoes not decay to zero for small Q values is still an indication for restrictedmotion as it has also been observed for proteins [93,94]. As we find severalradii for the diffusion volumes in the Carpentier model, a superpositionof different kinks leads to the observed behaviour, especially at high tem-peratures. At larger Q-values, the line width Γ follows the "random jumpdiffusion" model [95].As for the EISF also for the line width the influence of the coherent scatter-ing arising from the chain ordering around Q=1.48 Å−1 occurs below themain phase transition, whereas for 298 K the predicted plateau is observed.Therefore the data are drawn in the same range as for the EISF.
7.4 Conclusions
In this chapter the hydration dependent behavior of model membrane sys-tems above and below the main phase transition of DMPC with a focus on

68 7.4. CONCLUSIONS
0
0.2
0.4
0.6
0.8
1
0 0.2 0.4 0.6 0.8 1 1.2 1.4
EIS
F
Q [Å−1]
278 K298 K
(a) Sample hydrated with 12 water molecules per lipid.
0
0.2
0.4
0.6
0.8
1
0 0.2 0.4 0.6 0.8 1 1.2 1.4
EIS
F
Q [Å−1]
278 K298 K
(b) Sample hydrated with 9 water molecules per lipid.
Figure 7.4: Elastic incoherent structure factors for both samples. The low-est, 278 K (red squares), and highest temperature measures 298 K (black tri-angles) are shown. Data for the higher hydrated DMPC-d54 sample (RW ≈12) are given in figure 7.4a, the less hydradted samples (RW ≈ 9) is shownin figure 7.4b. Fits according to the diffusion in a sphere model (equation3.30) are shown in blue. The fits corresponding to the Carpentier model(equation 3.33) are shown as dashed green lines.

CHAPTER 7. QUASI-ELASTIC MEASUREMENTS 69
0.0 0.2 0.4 0.6 0.8 1.0 1.2 1.4 1.6 1.80
20
40
60
80
100
HW
HM
[µeV
]
Q2 [Å-2]
Figure 7.5: Comparison of the line width for the higher hydrated sample forselected temperatures (278 K (black sqaures), 288 K (red circles) and 298 K(green triangles)). For the display of the data, the same Q-range was usedas for the EISFs.
the head group motion has been investigated using quasi-elastic neutronscattering. In contrast to existing studies, hydration effects on the dynamicsof model membrane systems were explicitly taken into account. Therefore,different models for the motions of the hydrogen atoms in the head groupcould be associated to different degrees of hydration. The influence of hy-dration in the observed time and space window is clearly assigned by thedifferent models necessary to fit the obtained elastic incoherent structurefactors for the different hydrations and the resulting radii.
7.5 Conclusion en français
Dans ce chapitre, nous avons étudié par diffusion quasi-élastique de neu-trons le comportement des systèmes modèles de membranes en fonctionde l’hydratation. Nous mesurons au-dessus et en-dessous de la transitionde phase principale de DMPC en mettant l’accent sur les mouvements dugroupe de tête des lipides. Contrairement aux études existantes, les effetsde l’hydratation sur la dynamique des systèmes membranaires modèlesont été explicitement pris en compte. Par conséquent, des modèles diffé-rents pour les mouvements des atomes d’hydrogène dans le groupe detête pouvaient être associés à des degrés différents d’hydratation. Dans la

70 7.5. CONCLUSION EN FRANÇAIS
fenêtre espace-temps définie par l’instrument, l’influence de l’hydratationpeut clairement être attribuée aux différents modèles nécessaires à l’affine-ment des facteurs de structure incohérents élastiques pour des hydratationsdifférentes et les rayons de confinement qui en résultent.

CHAPTER 7. QUASI-ELASTIC MEASUREMENTS 71
0.0 0.5 1.0 1.5 2.0 2.5
0.2
0.3
0.4
0.5
0.6
0.7
0.8
0.9
1.0
1.1
1.2
1.3
1.4
HW
HM
[meV
]
Q2 [Å-2]
(a) Line width of the broad Lorentzian for the higher hydrated sample.
0.0 0.5 1.0 1.5 2.0 2.5
0.20.30.40.50.60.70.80.91.01.11.21.31.41.5
HW
HM
[meV
]
Q2 [Å-2]
(b) Line width of the broad Lorentzian for the less hydrated sample.
Figure 7.6: Lorentzian width of the broader Lorentzian. All measured tem-perature are shown: 278 K (black squares), 283 K (red circles), 288 K (greentriangles), 293 K (dark blue inverse triangles) and 298 K (light blue dia-monds). The line width is Q independent. Note that line width is alsoconstant in the investigated temperature range. A further analysis was notperformed, due to the large errors of the obtained values.
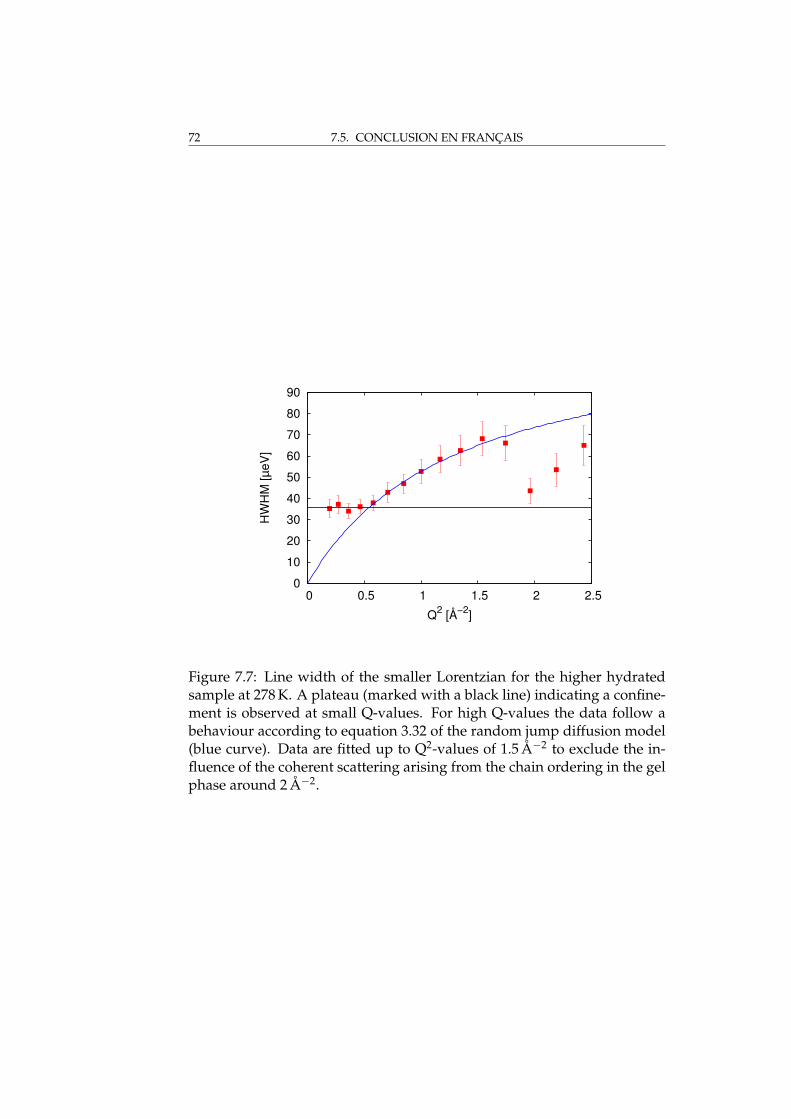
72 7.5. CONCLUSION EN FRANÇAIS
0
10
20
30
40
50
60
70
80
90
0 0.5 1 1.5 2 2.5
HW
HM
[µeV
]
Q2 [Å−2]
Figure 7.7: Line width of the smaller Lorentzian for the higher hydratedsample at 278 K. A plateau (marked with a black line) indicating a confine-ment is observed at small Q-values. For high Q-values the data follow abehaviour according to equation 3.32 of the random jump diffusion model(blue curve). Data are fitted up to Q2-values of 1.5 Å−2 to exclude the in-fluence of the coherent scattering arising from the chain ordering in the gelphase around 2 Å−2.

Chapter 8
High pressure experiments onDMPC
In order to establish a complete picture of the energy landscape of thebiomolecule under investigation, as many thermodynamical variables aspossible have to be employed. Besides temperature, which is routinelyused in neutron scattering studies, high pressure opens access to a com-plementary parameter.A recent development within our research group was the construction andtesting of a high pressure cell dedicated to biological samples. For severalreasons it was decided to use DMPC as a benchmark in order to test theperformance of the cell. About 200 mg are needed for (in-)elastic neutronscattering experiments in order to achieve good counting statistics. Dueto constrains resulting from the design of the high pressure cell, an evenhigher amount of several hundreds of milligram of specimen are neededto fill the cell. Because of their large variety of applications not only in re-search but also for industrial e.g. pharmaceutical and cosmetic industry,lipids are available in large quantities, therefore they are ideally suited totest the performance of the high pressure cell.From a scientific point of view the use of lipids is interesting for two rea-sons. First, there are already SAXS/SANS experiments showing a shift ofthe temperature of the main phase transition of about 22 K per 1000 bar [96],therefore these experiments can serve as a reference. Secondly, only a fewdynamical studies under high pressure of lipid model systems exist, thatwere performed using NMR [97]. No neutron scattering study dealing withthe influence of high pressure on lipid dynamics has been published so far.Thus already from the first experiments, relevant data can be extracted.After a general introduction, a brief description of the diffraction experi-ments performed on D16 are described, followed by a series of EINS mea-surements done on IN13.
73

74
0.06 0.08 0.1 0.12 0.14
Q [Å−1]
275
280
285
290
295
300
305
310te
mpe
ratu
re [K
]
−0.5
0
0.5
1
1.5
2
2.5
3
3.5
4
4.5
(a) Radial integrated scattering intensity of a θ-2θ scan at atmospheric pressure.
0.06 0.08 0.1 0.12 0.14
Q [Å−1]
285
290
295
300
305
310
315
320
325
tem
pera
ture
[K]
−1
0
1
2
3
4
5
6
7
8
9
(b) Radial integrated scattering intensity of a θ-2θ scan at 600 bar.
Figure 8.1: Sample characterisation of DMPC in the excess of D2O at D16.In figure 8.1a the scattered intensity at atmospheric pressure as a function oftemperature is shown. The phase transitions are clearly visible as changesof the peak position and hence of the repeat distance of the lipid multilay-ers. Picture 8.1b shows the scattered intensity at 600 bar.
CHAPTER 8. HIGH PRESSURE EXPERIMENTS ON DMPC 75
8.1 Introduction
About 75% of the marine biosphere lies in the deep sea below 1000 m.Therefore, it is exposed to 100 bar or higher pressure [98]. In the MarianaTrench, depth up to 11 000 m, corresponding to 110 bar are reached. In foodindustry high hydrostatic pressure (HHP) is used as a nonthermal foodprocessing technology, whereby foods are subjected to pressure, generallyin the range of 100-600 MPa at or around room temperature [99]. Pressuresbetween 300 and 600 MPa can inactivate yeasts, moulds and most vegeta-tive bacteria including most infectious food-borne pathogens. Thus, pres-sure is a potential alternative to heat pasteurization as pressure leaves smallmolecules such as many flavour compounds and vitamins intact [100].Even if the structure and composition of deep-sea life form is under inves-tigation for quite a while [101], the recently completed “census of marinelife” [102] quarried numerous, so far unknown, life forms from all threedomains of life [103]. Somero and co-workers [98] found that membranesare very sensitive to pressure effects, in the sense that the main phase tran-sition is shifted to higher temperatures with increasing pressure, thereforepressure has a similar effect on the transition temperature as a decreasedhydration. The observed effect is independent of the chain length.In order to maintain membrane fluidity at physiological temperatures or-ganisms exposed to high pressure change the ratio between saturated andunsaturated lipid chains toward the latter. Unsaturated chains are knownto lower transition temperature [104, 105], this counteracts the ordering ef-fect induced by the applied pressure.Lipids can form additional hexagonal phases, so called "mesophases", whileapplying pressure. However this behaviour is only observed for lipids witha chain length longer than 16 carbon atoms [106]. So DMPC with only 14carbon atoms per chain is ideally suited to probe the dynamics of purelamellar phases (Lβ gel and Lα liquid phase, respectively).Also from a biomedical point of view the investigation of pressure effectson membranes is interesting. Anaesthetics are known to lower the temper-ature of the main phase transition and whereas pressure increases TM. Itwas shown that the effect of alcohol and other anaesthetics on tadpoles canbe reversed by applying pressure up to 5000 psi (1 psi ≈ 0.069 bar) [107].Even if there are models which try to explain the impact of anaesthetics bya thermodynamical approach [108], a general description how anaestheticsact on membranes is still not existing.

76 8.1. INTRODUCTION
0.05 0.10 0.150
2
4
6
8
10
I(Q
) [a
.u.]
Q [Å-1]
0 bar (300K) 600 bars (328K)
(a) Peak positions in the Lα phase at 0 bar and 600 bar. Lorentzian (in blue) andGaussian (in green) fits to evaluate the repeat distance are also shown.
0.05 0.10 0.15
1
2
3
I(Q
) [a
.u.]
Q [Å-1]
276K 290K 300K
(b) Repeat distance in the Lβ′ (black curve), in the Pβ′ (red curve) and in the Lα(green curve) phases.
Figure 8.2: The peak position at both investigated pressure values is shownin figure 8.2a. Figure 8.2b shows a comparison of the repeat distance of thedifferent lipid phases at atmospheric pressure.

CHAPTER 8. HIGH PRESSURE EXPERIMENTS ON DMPC 77
8.2 Diffraction experiments on D16
In a first step and as a test of the newly developed pressure cell (see chap-ter 4) we performed diffraction experiments on D16 to follow the predictedshift of the temperature of the main phase transition of 22 K per 1000 bar[96].To avoid water inclusions in lipid vesicles the sample was prepared to formlamellar bilayers by hydrating dry lipid powder from D2O vapour at 310 Kfor two days (cf chapter 5). Additional heavy water was added to ensurea full hydration of the sample. As reference a temperature scan from 276 Kto 310 K at atmospheric pressure was performed (steps of 2 K). Figure 8.1ashows a reference scan taken at atmospheric pressure. As expected for fullyhydrated DMPC, the two phase transitions are apparent and occur at thesame temperatures, namely 287 K and 297 K, as in the oriented samples inthe fully hydrated state (see chapter 6) or e.g. DSC. Even if no correctionfor multiple scattering has been applied so far, this is an encouraging resultfrom the first test.In a next step a second temperature scan from 280-330 K (steps of 2 K) wasrecorded, this time a pressure of 600 bar was applied to the sample. Theobserved temperature for the main phase transition at this pressure was310 K, corresponding exactly to a shift of 13 K (cf figure 8.1b) and thus inagreement with what was reported by Winter et al. [96]. Below the temper-ature of the main phase transition neither the ripple phase nor the gel phasewas observed. As pressure has a similar effect on the lipids as a decreasedhydration, the absence of the Pβ′ phase is in agreement with observationsmade by Smith et al. [55] at hydrations below 85 % relative humidty. Thesurprising feature of the absence of the gel phase is under further investi-gation.Figure 8.2a shows a comparison of the peak position of the Lα phase forboth investigated pressure values. They agree within errors and show a re-peat distance around 63 Å, which is in agreement with literature values forfully hydrated DMPC. The fact that the repeat distance of the bilayers staysconstant when applying pressure is an indication that the lateral structurepersists in the investigated pressure range.
8.3 Elastic experiments on IN13
First experiments on IN13 were performed using the high pressure cell inthe course of 2010. Due to an exceptional reactor shut down during thethird cycle in 2010, it was so far only possible to perform a temperaturescan at atmospheric pressure, which will serve as reverence. Figure 8.3ashows the summed elastic intensity normalised to 290 K. Due to the highcounting time per point (approximately 12 hours) only a limited temper-

78 8.3. ELASTIC EXPERIMENTS ON IN13
290 295 300 305 310 3150.70
0.75
0.80
0.85
0.90
0.95
1.00
no
rma
lise
d e
lastic in
ten
sity [
a.u
.]
temperature [K]
(a) Normalised summed elastic intensities at atmospheric pressure.
290 295 300 305 310 3151.2
1.4
1.6
1.8
2.0
2.2
2.4
2.6
2.8
3.0
3.2
<u2 >
[Å2 ]
temperature [K]
(b) Mean square displacements obtained from fitting the data in a Q-range of0.52 Å−1 6 Q 6 1.47 Å−1.
Figure 8.3: Elastic intensities and mean square displacements of DMPC inexcess of heavy water at atmospheric pressure.

CHAPTER 8. HIGH PRESSURE EXPERIMENTS ON DMPC 79
ature range can be scanned during an experiment. The calculated meansquare displacements are shown in figure 8.3b, so far no correction of mul-tiple scattering has been applied.Nevertheless the extracted <u2> show already good agreement with a re-cent MD simulation at 303 K and atmospheric pressure [86]. Figure 8.4shows the results of the simulation. The time resolution of IN13 is drawnas dashed red line. Values for the mean square displacements at differentposition of the lipid molecule were extracted from the simulation. For thecarbon atom of the methyl group at the end of the lipid chain (CT) a valueof about 11 Å2 is found, whereas for the centre of mass (CM) a value ofabout 1 Å2 was deduced. The value obtained from the IN13 experiment is5 Å2 (cf figure 8.3b) and thus lies in between the two simulation values.The data obtained on IN13 with the cylindrical high pressure cell show thewell known behaviour of a kink at the main phase transition indicating anincreased mobility. The same characteristics were observed on IN16 withthe solid supported DMPC in flat sample holders (see chapter 6.3).In addition to the reference scan at atmospheric pressure, temperature scansat two more pressure values, namely 300 bar and 600 bar are planned. Theapplied pressure should lead to a shift of 6.6 K for 300 bar and 13.2 K for600 bar, respectively.
8.4 Future perspectives
For the fourth reactor cycle in 2010 high pressure elastic and quasi-elasticneutron scattering experiments on the time-of-flight spectrometers IN5 andIN6 on fully hydrated DMPC in the range between 0 bar and 600 bar willbe performed. They will enlarge the already started elastic investigationson IN13.It is known from the investigation of deep-sea organisms that the composi-tion of membranes changes as a function of pressure. The higher the pres-sure, the more lipids with unsaturated chains are found [109].The effect of unsaturated chains on the phase transition temperature will beinvestigated by elastic temperature scans on IN13. In the autumn proposalround 2010 a project was submitted to perform EINS experiments on mix-tures of saturated DMPC (14:0) with (∆9-Trans) PC (1,2-dimyristelaidoyl-sn-glycero-3-phosphocholine) and (∆9-Cis) PC (1,2-dimyristoleoyl-sn-glycero-3-phosphocholinelipids). These lipids have the same chain length and headgroup as DMPC but they have one unsaturated carbon bond per chain(14:1) at the ninth position of the chain. The temperature range between275 K and 330 K will be investigated in order to detect any shift of the mainphase transition temperature. In addition to the neutron experiments, DSCmeasurements are envisaged to follow the shift transition temperature witha complementary method.

80 8.5. PERSPECTIVES
On a long scale perspective comparative measurements of cell membranesfrom organisms living at different depths can give insight on how lateraldiffusion processes in the membrane under physiological pressure condi-tions happen.
Figure 8.4: Values of MSDs extracted from MD simulations. Data are givenfor four different positions within the lipid. The open square representthe MSDs of the phosphorus atom, open triangles the carbon of the methylgroups in the head group of the lipid, open circles the carbon of the terminalmethyl group of the lipid chain and the closed circles represent the centreof mass MSDs. The time resolution of IN13 is depicted as dashed red line.Figure is adapted from [86].
8.5 Perspectives
Dûrant le quatrième cycle du réacteur en 2010, des expériences à hautepression élastique et quasi-élastique sont prévues sur les spectromètres entemps de vol IN5 et IN6. Des échantillons DMPC complètement hydratésseront étudiés dans la gamme entre 0 et 600 bars pour élargir les investiga-tions déjà commencées sur IN13.L’effet des chaînes non saturées sur la température de la transition de phasesera étudié par balayages élastiques sur IN13. En automne 2010, un pro-jet a été soumis à l’ILL pour effectuer des expériences EINS sur des mé-langes de DMPC saturé (14 :0) avec (∆9-Trans) PC (1,2-dimyristelaidoyl-sn-glycéro-3-phosphocholine) et (∆9- Cis) PC (1,2-dimyristoleoyl-sn-glycéro-3-phosphocholinelipids). Ces lipides ont la même longueur de chaîne et lemême groupemebnt de tête que DMPC, mais ils ont une liaison insaturée

CHAPTER 8. HIGH PRESSURE EXPERIMENTS ON DMPC 81
par chaîne (14 :1) à la neuvième position de la chaîne. La gamme de tempé-rature entre 275 K et 330 K a été choisie afin de détecter tout changement dela température de transition de phase principale. En plus des expériencesneutroniques, des mesures DSC sont envisagées pour suivre le décalage dela température de transition par une méthode complémentaire.A plus longue échelle des mesures de comparaison de membranes cellu-laires d’organismes vivants à des profondeurs différentes peuvent donnerdes indications à savoir comment des processus de diffusion latérale ontlieu dans une membrane sous des conditions de pression physiologique.

82 8.5. PERSPECTIVES

Chapter 9
Neutron scattering studies ofhuman acetylcholinesterase
In the following chapter a second project, in which I have participated inthe course of my PhD thesis, is described. Neutron scattering studies onpure human acetylcholinesterase and in complex with the non-covalentbinding inhibitor Huperzine A have been performed. In total three dif-ferent spectrometers (IN6, IN13, IN6) and four different energy resolutionshave been employed to study the dynamics of AChE and its inhibited coun-terpart on a pico- to nanosecond timescale.After a general introduction (section 9.1) and the description of the samplepreparation (section 9.2), the elastic experiments are described in section9.3, this section is based on a research paper submitted to “Physical Chem-istry Chemical Physics” for publication. In section 9.4 the mean square dis-placements of AChE are compared to those of the second cholinesterase,which can be found in humans, butyrylcholinesterase (BChE). Both en-zymes fulfil similar tasks and have therefore a high structural similarity,nevertheless our findings show significant differences on the pico- to nanosec-ond timescale between them. The results from the quasi-elastic measure-ments are introduced in section 9.5. Concluding remarks and an outlookfor further investigations are given in section 9.6.
9.1 Introduction
Cholinesterases (ChEs) belong to the hydrolase class of enzymes (EnzymeCommission (E.C.) class 3) and are fundamental for cholinergic and non-cholinergic functioning of the nervous system and are presumably involvedin various diseases. It has been proposed that they have additional func-tions as bioscavengers for poisons, as protection against the toxicity ofnerve agents or in mutant forms as therapeutic treatment of cocaine over-dose [111, 112]. Acetylcholinesterase (AChE, E.C. 3.1.1.7, see figure 9.1 for
83

84 9.1. INTRODUCTION
Figure 9.1: Crystal structure of human AChE (PDB code 3LII). Data weretaken at a resolution of 3.2 Å. The size of the unit cell was determined to a= b = 210.90 Å and c = 115.27 Å (angles: α = β = 90°, γ = 120°) [110].

CHAPTER 9. NEUTRON SCATTERING STUDIES OF HUMANACETYLCHOLINESTERASE 85
the crystal structure), which is one of the two ChEs found in mammals, hy-drolyses the neurotransmitter acetylcholine (ACh) (see figure 9.2), therebyregulating the concentration of the transmitter at the synapse. An abruptblockade of acetylcholine-mediated neurotransmission is lethal. Clinically,moderate inhibition of AChE is effective in treatment of certain diseases toprolong the action of ACh on the receptor. Such a treatment is desirableeither if there are fewer ACh-receptors, as in the case of myasthenia gravis,or if there is reduced production of ACh, as in the case of Alzheimer’sdisease. Huperzine A (HupA) is a naturally occurring alkaloid isolatedfrom the Chinese medicinal herb Huperzia serrata. As it is a powerful re-versible inhibitor of AChE, it was envisaged for the symptomatic treatmentof Alzheimer’s disease.
Figure 9.2: Enzymatic hydrolysis of Acetylcholin by AChE.
AChE is one of the fastest enzymes known [113], operating nearly atthe diffusion limit. The first crystallographic structure of Torpedo CalifornicaAChE (TcAChE) [114] revealed a surprising feature, which is at odds withthe speed of the enzyme: the active site is located at the bottom of a deepand narrow gorge lined by 14 conserved aromatic residues. Due to the re-strictive dimensions of the active site gorge (20 Å deep, Ø ≈ 5 Å), substratehydrolysis takes place in a closed space virtually isolated from the bulk sol-vent. In parts, the gorge appears to be so narrow that only water moleculescould fit through, and substrates or inhibitors would have no access to theactive site if the enzyme was rigid. Thus large amplitude fluctuations arenecessary to explain the entry of molecules like substrates and inhibitors.Experimentally neutron spin echo experiments have been used to inves-tigate large scale fluctuations covering a time range up ton several 100 ns[115]. In the case of alcohol dehydrogenase the collective motion of do-mains were related to a cleft opening dynamics between the binding andthe catalytic domains enabling binding and release of a functional impor-tant cofactor [116].In addition molecular dynamics simulations (MD) are a powerful comput-ing tool to analyse dynamics in more detail and such efforts have revealeda whole hierarchy of motions acting together on different timescales. Stud-ies of the enzyme’s dynamics, using MD simulations [117, 118] and quan-tum mechanical-molecular mechanical (QM/MM) simulations [119], indi-cate the presence of such motions. The groups of J.A. McCammon and

86 9.1. INTRODUCTION
Y. Xu [120] have undertaken simulations of mouse AChE (mAChE), unli-ganded and in complex with HupA [121–124]. The first two simulationsof McCammons’ group dealt with a liganded mAChE at 300 K over 500 psand 1 ns (with slightly different starting structures). The next simulationsinvestigated the unliganded form at 300 K over 1 and 10 ns. The authorsanalyzed the dynamics of the breathing mode of the gorge and the possibleopening of a so-called backdoor and other possible side channels in detail.These studies revealed in particular the dynamical complexity of the fluctu-ations: the latter fact seems to be a general characteristic of macromoleculesdue to their rough energy landscapes [125]. Xu et al. concentrated on themotions of specific residues and studied amongst others the question howone could explain the fact that the association time with HupA is muchshorter than the dissociation time [124].Within complex dynamical systems such as proteins, diffusive motions areoften confined in space. Therefore they can be described as diffusion pro-cesses in presence of systematic forces. The corresponding autocorrelationfunctions exhibit long-term memory effects and lead to a non-exponentialdecay in time. This effect is the signature of a linking of the time scales offast and slow functional relaxation dynamics [126], resulting from differ-ent scales of interactions that each have important but competitive con-tributions. The analysis of the variation of the gorge radius over 10 nsshowed clearly that the corresponding autocorrelation function complieswith a non-exponential relaxation [123]. For instance, the local motions ofside chains seem to contribute significantly to the opening of the gorge, butthey are strongly correlated to larger domains of collective dynamics. Atleast half the protein was found to be involved in large-scale fluctuations.The authors are speaking about a hierarchy of relaxations divided into tiersof faster and slower motions, where the relaxations in the slower tiers onlybecome accessible when the faster tiers have moved into the required con-formations. A similar interpretation was given by K. Henzler-Wildman &D. Kern [125], stating that transitions are slow if they are improbable, aris-ing from many individual attempts by local groups to overcome the energybarrier separating the conformational states. The low success rate resultsfrom the collective nature of such large-scale motions.More recently, a combined MD simulation and experimental study hasshown that picosecond mean square displacements, as measured by elasticincoherent neutron scattering (EINS), satisfy a universal scaling law withrespect to viscosity measured over much longer time scales (up to secondsor more). Such universal correlation was observed to be valid for a widerange of simple liquids, supercooled liquids and glass formers, and thusconfers on picosecond MSDs a more general and intriguing role of fastpredictor for slower dynamical processes governed by viscosity and relax-ations [127, 128]. In fact, the protein solvation shell exhibits a regular glasstransition, so that such effects are probably also correlated to protein dy-

CHAPTER 9. NEUTRON SCATTERING STUDIES OF HUMANACETYLCHOLINESTERASE 87
namics.Members of the ChE family differ from each other in catalytic activity,oligomerisation state and glycosylation [129]. The question of whetherthere exists a correlation between these characteristics and dynamics isstill an unresolved matter [130]. Catalytic activities lie on the millisecondtimescale, which are comparable to those required for protein folding. Candifferences in catalytic activities be reflected in variations in atomic thermalfluctuations on the pico- to nanosecond time-scale? By blocking or not en-zymatic activity with an inhibitor, could this be a way to trigger it and toprobe its effects on the dynamics? The inhibitor HupA was chosen for theexperiments because it is a small molecule. Due to its low hydrogen con-tent, the molecule itself will be almost invisible in the neutron dynamicsstudies, but when bound to AChE, it switches off the enzyme activity.Elastic, quasi-elastic and inelastic neutron scattering was used to probe ex-perimentally and quantitatively the molecular dynamics of human AChE(hAChE), with or without HupA inhibition, in order to investigate the re-lationships between molecular dynamics, activity, inhibitor-binding, andunfolding.We used three different spectrometers (IN6, IN13 and IN16) [20, 22, 40, 131]at the ILL. The energy resolution of the spectrometers corresponds to differ-ent time scales, which permitted to probe dynamics between a few picosec-onds up to about one nanosecond (cf table 3.4), corresponding to move-ments from very fast internal motions to slow global motions. In section9.3 elastic intensity changes upon temperature variation are reported. Theapplication of approximate relations assuming a Gaussian distribution ofthe atoms around their equilibrium positions permits the extraction of av-erage atomic mean square displacements. They are the reflection of thesampling of conformational sub-states and of vibrational amplitudes. Thewavelength of the incident neutrons corresponds to inter-atomic distancesand, contrary to the energy of X-ray or synchrotron radiation, the corre-sponding neutron energy is of the order of the energy of vibrational andconformational states. Therefore EINS is well suited for experimental in-vestigations of thermal fluctuations within biological macromolecules un-der different biochemical conditions on timescales that match those of MDcalculations and permit direct comparisons.
9.2 Sample preparation and characterisation
9.2.1 Purification of recombinant human AChE
The full cDNA of hAChE was inserted into pGS vector carrying the glu-tamine synthetase gene marker and expressed in Chinese hamster ovarycells (CHO-K1 cells). The cells were maintained in BioWhittaker® Ultra-

88 9.3. ELASTIC EXPERIMENTS
cultureTM medium (Lonza, Belgium) and transfected using DNA-calciumphosphate co-precipitation. Transfected clones were selected by incubationin media containing methionine sulfoximide (50 M). The enzyme, secretedinto the culture medium, was purified by affinity chromatography as pre-viously described [132]. hAChE was concentrated to 13 mg ml−1 using aCentricon-30 ultrafiltration microconcentrator (30,000 MW cutoff from Am-icon (Millipore, USA)). Enzyme concentration was determined from its ab-sorbance at 280 nm using a molar extinction coefficient of 1.7 for 1 mg ml−1
of protein [133].Activity measurements were carried out at 298 K according to Ellman method[134] using 1 mM acetylthiocholine (ATC) as substrate and 0.5 mM 5-5’-dithio-bis (2-nitrobenzoic acid) (DTNB) in 0.1 M phosphate buffer pH 7.Circular dichroism (CD) spectra of recombinant hAChE (0.1 mg ml−1 inammonium acetate buffer 5 mM pH 7) were collected on a JASCO-810 CDspectrometer in the spectral range 190 nm–240 nm (at 0.5 nm intervals) atroom temperature. Baseline was performed with ammonium acetate buffer5 mM pH 7. The spectra analyses were performed using the DichroWebserver (Dichro).
9.2.2 Sample preparation for neutron scattering
A batch of about 300 mg of hAChE was dialyzed against 25 mM ammo-nium acetate dissolved in D2O, pD 7.0 (corresponding to a pH 6.6). Sincethe buffer is completely volatile, an over-night lyophilisation at 220 K un-der vacuum resulted in salt free protein powder. About 140 mg of hAChEin D2O solution was mixed with 2 molar equivalents of (-)-HuperzineAbefore lyophilisation. About the same amount of hAChE was lyophilisedwithout inhibitor. Both lyophilised powders (free hAChE and hAChE-HupA complex) were placed in aluminium sample containers of dimen-sions 30× 40× 1 mm3 to match the size of the neutron beam available onthe instruments. The samples were dried at atmospheric pressure overphosphorus pentoxide (P2O5) and weighed. The measured weights weretaken as their dry weights (h = 0 g D2O/g dry powder, denoted by g/gbelow). For neutron experiments, samples were hydrated by vapour ex-change over D2O, at ambient temperature, in a desiccator. A final watercontent of 0.4g/g for both samples was achieved. To verify that no lossof material had occurred, all samples were weighed before and after theneutron scattering experiments. No losses were detected for any sample.
9.3 Elastic experiments
Incoherent neutron scattering is dominated by the signal of hydrogen scat-tering intensity. This is due to the hydrogen incoherent scattering cross sec-

CHAPTER 9. NEUTRON SCATTERING STUDIES OF HUMANACETYLCHOLINESTERASE 89
tion which is one order of magnitude larger than that of all other elementsusually occurring in biological matter, and also of its isotope deuterium(see table 3.2). The technique probes average protein dynamics becausehydrogen atoms are uniformly distributed in the protein. The wild typeform of hAChE contains a high proportion of hydrogen, 4673 of a total of9470 atoms. The incoherent cross section of the hydrogen atoms thus cor-responds to 99.8% of the total incoherent cross section and to 92.6% of thetotal scattering. The exact number of amino acids and the atomic composi-tion of hAChE can be found in the tables C.1 and C.2 in appendix C.
9.3.1 Instrumental aspects and data analysis
The characteristics of the used spectrometers in terms of incident wave-length, accessible Q-range, detectable length-scale, energy resolution andtimescale are already outlined in table 3.4. The timescale can be calcu-lated from the energy resolution using the Heisenberg uncertainty relation(equation 3.12) or eq. 21 in the paper by Zorn [135], assuming a Gaussianshape of the resolution function. As the edges of the time window are notsharp, rounded values in between both results are given in the table.The cold neutron time-of-flight spectrometer IN6 [22] is sensitive to mo-tions with associated times of a few ps. Two different wavelengths corre-sponding to two different energy resolutions of ∆E ≈ 50 and 90 µeV weremeasured. IN13 [40] is the only thermal neutron backscattering spectrom-eter worldwide with an intermediate energy resolution of ∆E ≈ 8 µeV. Fi-nally IN16 [20] is a high resolution cold neutron backscattering spectrom-eter with an energy resolution of ∆E ≈ 0.9 µeV, corresponding to a timewindow ranging up to ≈ 1 ns. A comparison of the different elastic res-olution functions was already shown in figure 3.3 of section 3.5.2. Thus,the three instruments are sensitive to motions on different time scales. Thedifferent contributions to atomic motions (lattice and internal molecular vi-brations, reorientations, translations) are assumed to be completely decou-pled, because they occur on significantly different time scales, what wasalso shown by MD simulations [136]. In this sense the instruments can beseen as a motion filter to focus on certain aspects of the sample dynamicsonly. Internal motions are within the window for all three spectrometers.The contribution of global protein diffusion is negligible for all instrumentsapart from IN16, which has the broadest time window. Water diffusionis outside the window of IN13 and IN16 and appears as a smooth back-ground. It does, however, contribute significantly on IN6. Especially thelength-time window of IN13 is well suited to measure internal dynamics,without ’pollution’ of the scattering by contributions from global or bulkwater diffusion [137].Transmission values were measured on IN13 and corresponded to 0.94 and0.95 for the wild type and the inhibited form of AChE, respectively. Mul-

90 9.3. ELASTIC EXPERIMENTS
0 1 2 3 4 5
-1.4
-1.2
-1.0
-0.8
-0.6
-0.4
-0.2
0.0
0.2
ln I
Q2 [Å-2]
(a) Data taken on IN13.
0 1 2 3 4 5-1.0
-0.8
-0.6
-0.4
-0.2
0.0
ln I
Q2 [Å-2]
(b) Data taken on IN6 (90 µeV resolution).
Figure 9.3: Logarithm of the normalised intensities of hAChE plotted ver-sus Q2 for 20 (black squares), 100 (red circles), 200 (green triangles) and300 K (blue diamonds) with corresponding error bars. The full lines corre-spond to the linear fits used to extract the MSDs. The dashed lines in theright figure are extrapolations of the linear fits to higher Q-values and showa clear deviation from Gaussian behaviour at higher temperatures.

CHAPTER 9. NEUTRON SCATTERING STUDIES OF HUMANACETYLCHOLINESTERASE 91
tiple scattering effects were therefore not taken into consideration for thedata treatment. To obtain the scattered intensities of the sample, scatteringfrom the empty sample holder was subtracted. The data were normalizedto the lowest temperature (20 K), where molecular motions are stronglyreduced. Absorption correction was based on the correction formula ofPaalman-Pings coefficients [138]. Data evaluation was carried out usingthe LAMP software available at ILL [80].
9.3.2 Determination of atomic mean-square displacements
The logarithm of the elastic intensity (eq 3.23) of each sample at a giventemperature T is plotted against Q2 (see e.g. figures 9.3a and 9.3b). As IN6is a time-of-flight instrument, the whole accessible energy range is mea-sured simultaneously. The elastic data were thus extracted by integratingover an energy range of [-0.11, 0.12] meV for the 90 µeV resolution and of[-0.06, 0.09] meV for the 50 µeV resolution. This corresponds to the wholeelastic peak and not only the full width half maximum (FWHM). Whereasat low temperatures intensities decreased linearly over the whole Q-range,a dynamical transition appeared in the plots above ≈ 200 K (see figure 9.3),consistent with the well-known deviation from the Gaussian behaviour athigher temperatures [9]. The mean square displacements can be obtainedfrom the slope of the logarithm of the scattered intensities according toequation 3.24. This approach is formally similar to the Guinier approxi-mation in small angle scattering experiments [29]. MSDs were extractedfrom the Q-ranges where the linearity was clearly visible. The correspond-ing Q-ranges, used during the fitting procedure are given in table 9.1.
Spectrometer IN6 IN6 IN13 IN16
Resolution FWHM [µeV] 90 50 8 0.9used Q-range [Å−1] 0.49 - 1.24 0.42 - 1.13 0.52 - 1.67 0.54 - 1.10
Table 9.1: Q-range used in order to extract mean square displacements.
The criterion for validity of the Gaussian approximation <u2> Q2 6 1was checked a posteriori: it is slightly exceeded at IN16 and IN13 (valuesup to 2.9), but the curves are still linear for these Q-values and thus theapproximation is justified [139].
9.3.3 Results
Some complementary tests were performed to characterise the samples be-fore and after the neutron scattering experiments. The enzyme solutionswere stable at 277 K and hAChE activity was partially preserved after a

92 9.3. ELASTIC EXPERIMENTS
lyophilisation step (only 20-25% of activity was lost - data not shown). TheCD spectrum of hAChE in 5 mM ammonium acetate buffer (pH 7) indi-cated the presence of a large amount of alpha-helix structures and beta-sheets. However, after the neutron scattering study, dissolution of hAChEsample was not possible and neither activity nor CD measurements couldbe performed as a final temperature exceeding the denaturation tempera-ture was reached during the experiments (cf section 9.3.3).
IN13: Correlation between heat denaturation and MSDs
0 50 100 150 200 250 300 350
0.0
0.2
0.4
0.6
0.8
1.0
1.2
1.4
<u2 >
[Å2 ]
temperature [K]
Figure 9.4: MSDs measured on IN13 of hAChE (squares) and hAChE withHupA (circles), hydrated from D2O in the temperature ranges 20-310 K(filled symbols) and 310-365 K (open symbols). The seal of the sampleholder had to be exchanged between the two temperature ranges. Themid-point denaturation temperature of the native (non-inhibited) enzymein solution is indicated by the vertical line.
The denaturation temperature of recombinant hAChE is known to be329 K in HEPES 20 mM NaCl 150 mM at pH 7.5 [140] and 334 K in 50mM sodium phosphate at pH 8.0 [141]. Therefore we measured both sam-ples (hAChE with and without HupA) first in the temperature range from20-310 K (measured on all instruments) and in a second experiment from310-365 K (measured only on IN13). One difficulty was related to the fact,that the used indium alloy seal to make the sample holder tight meltsaround 350 K. So the sample holders for higher temperature measurementshad to be re-opened in order to take away the indium and replace it by aseal of silicon Motorsil D. The samples were then carefully dried and rehy-

CHAPTER 9. NEUTRON SCATTERING STUDIES OF HUMANACETYLCHOLINESTERASE 93
drated again.
The behaviour of the protein on IN13 under denaturing conditions byheating it up to 365 K was investigated.Here a reference to a former study on IN16, which reported about en-zyme dynamics in the presence of a covalent inhibitor (the organophos-phonate soman) on hydrated powders [142] as function of temperatureis inserted. The protein under investigation was a ChE without knownfunction, present in human blood plasma: human butyrylcholinesterase(hBuChE, E.C. 3.1.1.8)). hBuChE and AChE have a close structure of theactive site and a similar a/b fold [111, 129], hence both share a similar cat-alytic function, only hBuChE can hydrolyse butyrylcholine in addition toacetylcholine. For instance, the size of the catalytic subunit of hBuChE isalmost identical to that of TcAChE, the residues 1 - 574 and 1 - 575 for thetailed molecular forms and their sequences are 54% identical.Neutron dynamics studies revealed identical behaviour of the wild typeand the inhibited enzyme in the temperature range below 334 K, but abovethat temperature the soman phosphonylated BChE was more rigid thanthe native enzyme. Furthermore the inhibited enzyme had a denaturationmidpoint temperature in both H2O- and D2O-solution shifted by 10 K from337.5 to 347.5 K [143, 144]. In the present study, similar effects were ad-dressed using the non-covalent inhibitor HupA on hAChE.Figure 9.4 shows MSDs obtained on IN13 as function of temperature. SinceHupA has only 18 hydrogen atoms compared to the 4673 H-atoms of hAChE,the measured signal represents essentially the enzyme dynamics, even inpresence of the ligand. The MSDs increase smoothly and display the well-known dynamical transition at around 220K [9]. Within the error bars, nodifferences are visible between both samples below the denaturation tem-perature at around 330 K. The error bars increase above 300 K, due to thereduced data acquisition time available. Only above 360 K a slight differ-ence between the curves appears. Such a small effect cannot be valuedas a proof, but it is also not contradicting earlier observations of Rochu etal. [145] and Gabel et al. [142], i.e. a covalently or non-covalently boundinhibitor stabilizes the enzyme and shifts the denaturation temperature toa higher value.The results can be compared with MD simulations from Tara et al. [122]of pure mAChE and mAChE in the presence of HupA. These simulationsfound overall lower structural MSDs for residues in the gorge of the unli-ganded form. In a first impression, this fact could seem to be at variancewith the presented data, because hardly any difference between the wildtype and the inhibited form is seen. Neutron scattering averages over allresidues in the protein and cannot differentiate between gorge residues andothers in a completely protonated protein. Simulations can easily disen-tangle such small effects. Their observation is in accordance with an ex-

94 9.3. ELASTIC EXPERIMENTS
0 50 100 150 200 250 300 350
0.0
0.2
0.4
0.6
0.8
1.0
1.2<u
2 > [Å
2 ]
temperature [K]
(a) IN6, 90 µeV, tmax ≈ 10 ps.
0 50 100 150 200 250 300 350
0.0
0.2
0.4
0.6
0.8
1.0
1.2
<u2 >
[Å2 ]
temperature [K]
(b) IN6, 50 µeV, tmax ≈ 20 ps. Due to limited beamtime the native AChE samplecould only be measured up to a temperature of 270 K.
Figure 9.5: MSDs of pure hAChE (black squares) and with HupA (red cir-cles), hydrated from D2O vapor and measured at IN6. For a better visi-bility error bars are given only for a few data points. They are highest athigh temperature. tmax gives the maximal resolved observation time of thecorresponding spectrometer. Figure is continued on the next page
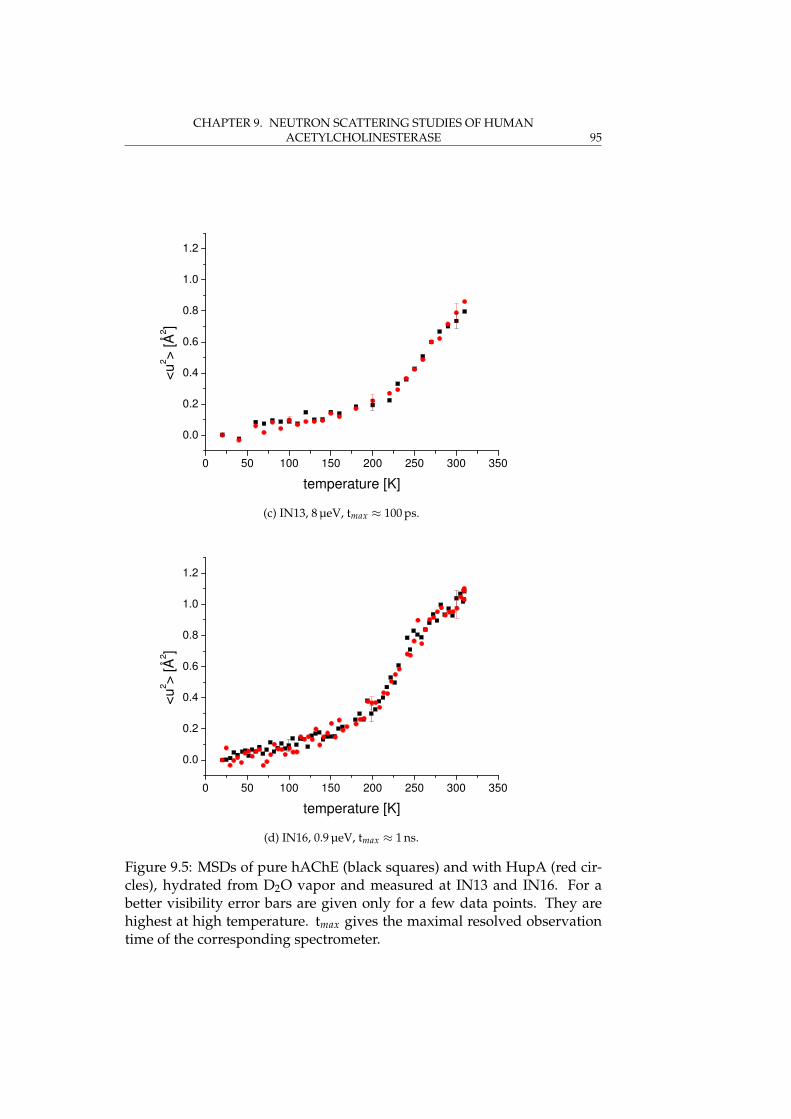
CHAPTER 9. NEUTRON SCATTERING STUDIES OF HUMANACETYLCHOLINESTERASE 95
0 50 100 150 200 250 300 350
0.0
0.2
0.4
0.6
0.8
1.0
1.2
<u2 >
[Å2 ]
temperature [K]
(c) IN13, 8 µeV, tmax ≈ 100 ps.
0 50 100 150 200 250 300 350
0.0
0.2
0.4
0.6
0.8
1.0
1.2
<u2 >
[Å2 ]
temperature [K]
(d) IN16, 0.9 µeV, tmax ≈ 1 ns.
Figure 9.5: MSDs of pure hAChE (black squares) and with HupA (red cir-cles), hydrated from D2O vapor and measured at IN13 and IN16. For abetter visibility error bars are given only for a few data points. They arehighest at high temperature. tmax gives the maximal resolved observationtime of the corresponding spectrometer.
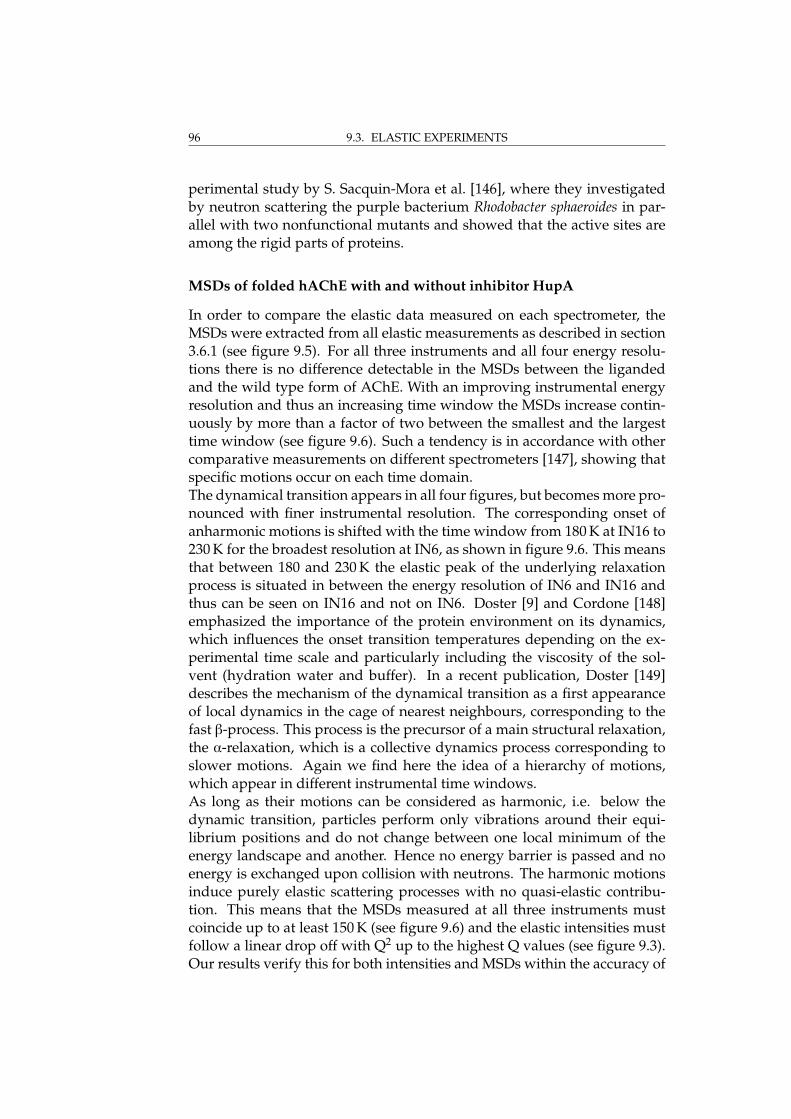
96 9.3. ELASTIC EXPERIMENTS
perimental study by S. Sacquin-Mora et al. [146], where they investigatedby neutron scattering the purple bacterium Rhodobacter sphaeroides in par-allel with two nonfunctional mutants and showed that the active sites areamong the rigid parts of proteins.
MSDs of folded hAChE with and without inhibitor HupA
In order to compare the elastic data measured on each spectrometer, theMSDs were extracted from all elastic measurements as described in section3.6.1 (see figure 9.5). For all three instruments and all four energy resolu-tions there is no difference detectable in the MSDs between the ligandedand the wild type form of AChE. With an improving instrumental energyresolution and thus an increasing time window the MSDs increase contin-uously by more than a factor of two between the smallest and the largesttime window (see figure 9.6). Such a tendency is in accordance with othercomparative measurements on different spectrometers [147], showing thatspecific motions occur on each time domain.The dynamical transition appears in all four figures, but becomes more pro-nounced with finer instrumental resolution. The corresponding onset ofanharmonic motions is shifted with the time window from 180 K at IN16 to230 K for the broadest resolution at IN6, as shown in figure 9.6. This meansthat between 180 and 230 K the elastic peak of the underlying relaxationprocess is situated in between the energy resolution of IN6 and IN16 andthus can be seen on IN16 and not on IN6. Doster [9] and Cordone [148]emphasized the importance of the protein environment on its dynamics,which influences the onset transition temperatures depending on the ex-perimental time scale and particularly including the viscosity of the sol-vent (hydration water and buffer). In a recent publication, Doster [149]describes the mechanism of the dynamical transition as a first appearanceof local dynamics in the cage of nearest neighbours, corresponding to thefast β-process. This process is the precursor of a main structural relaxation,the α-relaxation, which is a collective dynamics process corresponding toslower motions. Again we find here the idea of a hierarchy of motions,which appear in different instrumental time windows.As long as their motions can be considered as harmonic, i.e. below thedynamic transition, particles perform only vibrations around their equi-librium positions and do not change between one local minimum of theenergy landscape and another. Hence no energy barrier is passed and noenergy is exchanged upon collision with neutrons. The harmonic motionsinduce purely elastic scattering processes with no quasi-elastic contribu-tion. This means that the MSDs measured at all three instruments mustcoincide up to at least 150 K (see figure 9.6) and the elastic intensities mustfollow a linear drop off with Q2 up to the highest Q values (see figure 9.3).Our results verify this for both intensities and MSDs within the accuracy of

CHAPTER 9. NEUTRON SCATTERING STUDIES OF HUMANACETYLCHOLINESTERASE 97
the measurements.
Figure 9.5 shows the MSDs measured on all three instruments over thewhole investigated temperature range. It indicates that the MSDs are pos-sibly converging for all instruments at higher temperatures, as it was re-ported by Daniel et al. [150]. Unfortunately this fact could not be veri-fied experimentally due to the protein denaturation and the associated ir-reversible structural changes at temperatures above 334 K. The MSD val-ues measured at IN13 are thus between the data of IN16 and IN6, includ-ing the relaxation processes of the lower energy resolution and indicatingthat there must be a certain overlap between the measurable motions onthe three instruments. To make this effect even more visible, Daniel etal. [150, 151] mention the possibility of subtracting the IN6 (or IN13) datafrom the IN16 data to study the change in dynamics in different time win-dows.The observed decrease in slope of the MSDs at IN16 (figure 9.5 and 9.6) fortemperatures higher than 280 K can be explained by the limitation of theinstrumental resolution in relation to the measurement of large-scale mo-tions [142]. The influence of a finite instrument resolution was simulatedwithin the framework of the neutron frequency window model [152]. Thetransition observed by a spectrometer depends on the relationship betweenthe timescales of the relaxation processes activated and the timescale acces-sible to the instrument. Two extreme scenarios were considered: firstlyif the characteristic relaxation frequencies lie all within the energy reso-lution of the instrument, the observed dynamical transition is completelydependent on the temperature changes of the corresponding atomic MSDs,probing the energy levels of different conformational substates. The dif-ference in energy of the substates corresponds to the free energy difference∆G, which is furnished by the increase in thermal energy [9]. Secondly, itcould be possible to have no change of the MSDs with temperature, whichcould be conceivable if there is no difference in energy for different localminima of the energy landscape. In the latter case, the various local min-ima are separated by a potential barrier corresponding to the activationenergy Ea. Comparing data taken on IN6 and IN16 with simulations, Mc-Cammon et al. [117] demonstrated that such effects lead to a shift of thedynamic transition temperature and can explain the change of slope of theMSDs measured on IN16. Such an apparent dynamical transition can ariseif the relaxation frequencies increase with temperature, e.g. the density ofstates is changing, such that they move into the frequency window of theinstrument, giving therefore information about the timescales of motionscrossing the resolution window of the instrument.In a complex protein energy landscape it is likely to find a combinationof both scenarios. The increase of the MSDs with the time scale togetherwith the deviation of the intensities from Gaussian behaviour indicates

98 9.3. ELASTIC EXPERIMENTS
0 50 100 150 200 250 300 350 400
0.0
0.2
0.4
0.6
0.8
1.0
1.2<u
2 > [Å
2 ]
temperature [K]
(a) <u2> of the pure hAChE.
0 50 100 150 200 250 300 350 400
0.0
0.2
0.4
0.6
0.8
1.0
1.2
<u2 >
[Å2 ]
temperature [K]
(b) <u2> of hAChE + HupA.
Figure 9.6: Compilation of the obtained mean square displacements. IN16(blue diamonds), IN13 (green triangles) and IN6 (50 µeV: red circles,90 µeV: black squares). For clarity characteristic error bars are only givenat 50 K, 200 K and 300 K.

CHAPTER 9. NEUTRON SCATTERING STUDIES OF HUMANACETYLCHOLINESTERASE 99
the existence of more than a single relaxation process (G. Kneller, unpub-lished work). This leads necessarily to an autocorrelation function I(Q,t),the Fourier transform of the scattering function S(Q, ω), with long-termmemory effects and a non-exponential decay in time. As mentioned inthe introduction, it is the signature of a linking of the time scales of fastand slow functional relaxation dynamics [126] and was already found bymolecular dynamics simulations [123].
In fact, this can be verified by the experimental data. Using the “FourierTransform Toolkit” (FFT) included in the DAVE program suite [89], therecorded scattering functions S(Q, ω) have been transformed into interme-diate scattering functions I(Q,t). When only one relaxation process is ob-served, I(Q,t) shows an exponential decay, corresponding to β = 1 in equa-tion 9.1. If several processes lie in the examined space and time window,I(Q,t) can be described by a stretched exponential or Kohlrausch-Williams-Watts (KWW) function, where 0 6 β 6 1 and τ represents the relaxationtime of the system.
I(t) ∝ exp
[−(
tτ
)β]
(9.1)
The β extracted from fits to the data shown in figure 9.7 resulted invalues of β ≈ 0.3 for both resolutions.
Conclusions
A series of elastic incoherent neutron scattering experiments were carriedout on native and HupA inhibited hAChE at different spectrometers toprobe different motions contributing to the functioning of the enzyme. Al-though no difference in MSDs of the wild type and the inhibited form until350 K was detected, a indication of a small shift of the denaturation tem-perature due to the ligand appears around 360 K and could indicate stabi-lization by the inhibitor.The MSDs recorded on the different instruments increase continuously withthe enlargement of the observation time window from about 1.0 Å2 for ∆E= 90 µeV to about 2.3 Å2 for ∆E = 0.9 µeV. In agreement with MD simula-tion the results confirm the concept that a hierarchy of local and subdomainmotions is necessary for the breathing movement of the enzyme’s gorge.Another effect of the influence of the instrumental resolution can be seenon the basis of the shift of the dynamical transition temperature from 230 Kat IN6 (90 µeV) to 180 K at IN16 (0.9 µeV). It can be explained in the light ofthe so-called ’frequency-window model’ where the motion enter the reso-lution window of the corresponding instrument at different temperatures.

100 9.3. ELASTIC EXPERIMENTS
0.1 1 100.0
0.2
0.4
0.6
0.8
1.0
I(Q
,t)
[a.u
.]
time [ps]
(a) Intermediate scattering function I(Q,t) at a given wavelength of 5.1 Åfor AChE + HupA. The figure shows curves for Q-values of 0.5 Å−1 (red),1.0 Å−1 (green), 1.5 Å−1 (dark blue) and 2.0 Å−1 (light blue) at 300 K.
1 100.0
0.2
0.4
0.6
0.8
1.0
I(Q
,t)
[a.u
.]
time [ps]
(b) Comparison of I(Q,t) of pure AChE and AChE + HupA (λ = 5.9 Å).Data for the pure AChE is depicted with squares, AChE + HupA withcircles, respectively. Again selected Q-values of 0.5 Å−1 (red and brown),1.0 Å−1 (green and pink) and 1.5 Å−1 (blue and orange) are shown.
Figure 9.7: Intermediate scattering functions for both resolutions measuredon IN6. The increasing error bars for long correlation times indicate theresolution limit of the given setup. The black curves represents the instru-mental resolution.

CHAPTER 9. NEUTRON SCATTERING STUDIES OF HUMANACETYLCHOLINESTERASE 101
In this context also the observed decrease in slope of the MSDs on IN16for temperatures higher than 280 K can be explained by the limitation ofthe instrumental resolution. The stretched exponential behaviour of I(Q,t)indicates the existence of more than a single relaxation process [123].
9.4 Comparison between AChE and BChE
Figure 9.8: Crystal structure of human BChE (PDB code 1P01). Data weretaken to a resolution of 2.0 Å. The size of the unit cell was determined to a= b = 154.66 Å and c = 127.89 Å (angles: α = β = γ= 90°) [129].
The second member of the choline family which can be found in mam-malians is BChE (E.C. 3.1.1.8). Human BChE is a tetrameric protein, whosecrystal structure is shown in figure 9.8. It was solved by the group of P.Masson [129]. As already mentioned in the introduction, it fulfils similartasks as AChE, but is mainly found in the plasma, whereas AChE is mainlylocated in the muscle nervous tissue. Nevertheless also BChE is found insmall amounts in nervous tissue.The mean square displacements of native BChE and in the presence ofits covalent binding inhibitor soman, have been investigated by Gabel etal. [142], using the backscattering spectrometer IN16.
For the comparison of the two data sets, the data recorded by Gabel et

102 9.4. COMPARISON BETWEEN ACHE AND BCHE
0 50 100 150 200 250 300 350
0.0
0.2
0.4
0.6
0.8
1.0
1.2
1.4
1.6
1.8
<u2 >
[Å2 ]
temperature [K]
(a) Native AChE and BChE.
0 50 100 150 200 250 300 350
0.0
0.2
0.4
0.6
0.8
1.0
1.2
1.4
1.6
1.8
<u2 >
[Å2 ]
temperature [K]
(b) Same data as shown in 9.9a but with a shift of the x-axis for AChE data of 35 K.
Figure 9.9: Comparison of the mean square displacements of native AChEand BChE taken on IN16. In black the AChE data are shown, in red thecorresponding BChE data, respectively. To demonstrate that both data setsshow the same slope, the x-axis of the AChE data is shifted by 35 K in figure9.9b.

CHAPTER 9. NEUTRON SCATTERING STUDIES OF HUMANACETYLCHOLINESTERASE 103
al. [142] have been retreated using exactly the same LAMP routines as forthe evaluation of the AChE data in order to avoid any differences comingfrom the data treatment. No discrepancies between the old and the newdata treatment were found.At first glance, it appears that AChE shows a steeper slope in comparison toBChE after the dynamical transition. Figures 9.9a and 9.10a show the orig-inal data, whereas figures 9.9b and 9.10b show, for comparison, the samedata, but with the temperature axis shifted empirically by 35 K in the caseof AChE and AChE + HupA. From the latter it is obvious that both, AChEand BChE, show the same slope, and therefore the same resilience [153].In order to extract thermodynamical variables from the elastic data a model,introduced by Becker et al. [152, 154], was used to fit the mean square dis-placements as a function of temperature. The corresponding equation usedfor the fitting procedure is given as:
< ∆u2 >=< ∆u2 > f ast + < ∆u2 >A0
(1− 2
πarctan
∆ω
κ
). (9.2)
Following the description of Becker et al. <∆ u2> f ast was assumed todepend linearly on temperature, can be expressed as <∆ u2> f ast = αT andcan be obtained by fitting the data at low temperatures with a straightline. <∆ u2>A0
is a fit parameter, accounting for slow motions. ∆ω isgiven by the half width at half maximum of the elastic energy resolutionof the corresponding spectrometer. In the case of IN16 ∆ωIN16 = 0.5 µeV =7.595× 10⁸ s−1 and in the case of IN13 ∆ωIN13 = 4 µeV = 6.076× 10⁹ s−1. κis the relaxation frequency of the observed process.
Assuming an Arrhenius behaviour for κ, it can be expressed as:
κ(T) = a · e−Ea/RT , (9.3)
where a is a prefactor, Ea the activation energy, R the ideal gas constantand T the temperature. The resulting fits to the elastic data of the AChEsamples are shown in figure 9.11 for the data obtained on IN16 and in fig-ure 9.13 for the IN13 data, respectively. The fits to the BChE sample aregiven in figure 9.12.During the analysis of the elastic neutron data it was found that the valuesof Ea for BChE are about a factor of two larger the the values obtained forthe activation energy Ea of AChE (cf tables 9.2 for AChE and 9.3 for BChE).This tendency is in agreement with results obtained by activity measure-ments of hAChE and hBChE. About a factor of two between the two en-zymes was found [155].The degree of glycolisation differs between the two enzymes. As sugarsare known to slow down dynamics on the pico- to nanosecond range [156],this could be one reason for the difference see between AChE and BChE.

104 9.4. COMPARISON BETWEEN ACHE AND BCHE
0 50 100 150 200 250 300 350
0.0
0.2
0.4
0.6
0.8
1.0
1.2
1.4
1.6
1.8
<u2 >
[Å2 ]
temperature [K]
(a) AChE inhibited with HupA, BChE inhibited with soman.
0 50 100 150 200 250 300 350
0.0
0.2
0.4
0.6
0.8
1.0
1.2
1.4
1.6
1.8
<u2 >
[Å2 ]
temperature [K]
(b) same data as shown in 9.10a but with a shift of the x-axis for AChE + HupAdata of 35 K.
Figure 9.10: Comparison of the mean square displacements of AChE andBChE in the presence of their inhibitors on IN16. In black the AChE +HupA data are shown, in red the corresponding BChE + soman, respec-tively. As for figure 9.9b also in figure 9.10b the x-axis of the AChE + HupAdata is shifted by 35 K.

CHAPTER 9. NEUTRON SCATTERING STUDIES OF HUMANACETYLCHOLINESTERASE 105
fit parameters AChE AChE + HupA
IN16
α [Å2 K−1] 0.00106 ± 0.00005 0.00100 ± 0.00007<∆ u2>A0
[Å2] 0.83 ± 0.02 0.84 ± 0.03a [s−1] 1× 10¹² 1× 10¹²
Ea [kJ mol−1] 14.20 ± 0.11 14.27 ± 0.16
IN13
α [Å2 K−1] 0.00083 ± 0.00007 0.00074 ± 0.00005<∆ u2>A0
[Å2] 0.97 ± 0.10 1.18 ± 0.09a [s−1] 1× 10¹² 1× 10¹²
Ea [kJ mol−1] 12.55 ± 0.39 12.88 ± 0.30
IN6α [Å2 K−1] 0.00069 ± 0.00012 0.00078 ± 0.00005
<∆ u2>A0[Å2] 0.88 ± 0.78 0.99 ± 0.15
50 µeVa [s−1] 1× 10¹² 1× 10¹²
Ea [kJ mol−1] 9.40 ± 22.20 14.46 ± 0.54
IN6α [Å2 K−1] 0.00056 ± 0.00004 0.00058 ± 0.00004
<∆ u2>A0[Å2] 4.78 ± 1.80 5.65 ± 1.93
90 µeVa [s−1] 1× 10¹² 1× 10¹²
Ea [kJ mol−1] 12.25 ± 0.99 12.62 ± 0.90
Table 9.2: Values obtained from fitting formula 9.2 to the mean square dis-placements of AChE and AChE + HupA. Values are given for data obtainedon all spectrometers. a was fixed to a value of 1× 10¹² s−1 in order to allowthe fit to converge. The value can be found in the literature as a typicalvalue for barrier crossing in condensed-phase molecular systems [24, 152].Due to the limited acquisition time on IN6 the native AChE sample elasticdata could only be measured up to 270 K in the 50 µeV setup, therefore theobtained fit results show large errors compared to the other data sets.
BChE BChE + Soman
α [Å2 K−1] 0.00104 ± 0.00005 0.00119 ± 0.00003<∆ u2>A0
[Å2] 1.78± 0.10 1.57 ± 0.06a [s−1] 1× 10¹² 1× 10¹²
Ea [kJ mol−1] 19.39 ± 0.26 19.56 ± 0.18
Table 9.3: Values obtained from fitting formula 9.2 to the mean square dis-placements of BChE and BChE + Soman. As for the fits of the AChE data,the value for a was kept fix during the fitting procedure in order to allow aconvergence of the fit.

106 9.4. COMPARISON BETWEEN ACHE AND BCHE
0 50 100 150 200 250 300 350
0.0
0.2
0.4
0.6
0.8
1.0
1.2<u
2 > [Å
2 ]
temperature [K]
(a) MSDs of AChE with corresponding fit.
0 50 100 150 200 250 300 350
0.0
0.2
0.4
0.6
0.8
1.0
1.2
<u2 >
[Å2 ]
temperature [K]
(b) MSDs of AChE + HupA with corresponding fit.
Figure 9.11: Evaluated mean square displacements of AChE and AChE +HupA on IN16 with corresponding fits according to equation 9.2. The ob-tained fit parameters are given in table 9.2.

CHAPTER 9. NEUTRON SCATTERING STUDIES OF HUMANACETYLCHOLINESTERASE 107
With the values for a and Ea obtained by fitting equation 9.2 to the data,the resulting curves for κ are shown in figure 9.14. The elastic energy res-olution of IN16 is about 1000 ps. The inverse of this value corresponds toa frequency of 0.001 ps−1, which indicates the resolution limit of the spec-trometer, and is drawn as horizontal line in figure 9.14a. Motions fasterthan this limit cannot be resolved by the spectrometer. The fact, that both,AChE and AChE + HupA, cross this line around 250 K is consistent withthe finding of a kink around the same temperature in the mean square dis-placements.In the case of BChE and BChE + Soman κ passes the resolution limit notuntil 330 K. Therefore the observed motions stay almost over the wholeinvestigated temperature range within the resolution window of the spec-trometer.For the MSDs of AChE obtained on IN13 the situation presents itself dif-ferently. On this spectrometer the energy resolution is about 8 µeV, thusabout a factor of 10 larger than the resolution of IN16. Therefore also theobservation time is ten times shorter and hence the observable frequencyten times larger, respectively.Fits to the mean square displacements are depicted in figure 9.13, theyshow no levelling off, as seen for IN16. Hence the κ obtained from thefits and drawn in figure 9.14b stay within the time resolution for IN13, in-dicated by the horizontal black line. The investigated fit range was limitedto 310 K in order to exclude the influence of the protein denaturation occur-ring around a temperature of 330 K.

108 9.4. COMPARISON BETWEEN ACHE AND BCHE
0 50 100 150 200 250 300 350
0.0
0.2
0.4
0.6
0.8
1.0
1.2
1.4
1.6
1.8<u
2 > [Å
2 ]
temperature [K]
(a) MSDs of BChE with corresponding fit.
0 50 100 150 200 250 300 350
0.0
0.2
0.4
0.6
0.8
1.0
1.2
1.4
1.6
1.8
<u2 >
[Å2 ]
temperature [K]
(b) MSDs of BChE + Soman with corresponding fit.
Figure 9.12: Evaluated mean square displacements of BChE and BChE +Soman on IN16 with corresponding fits according to equation 9.2. The re-sulting fit parameters are given in table 9.3.

CHAPTER 9. NEUTRON SCATTERING STUDIES OF HUMANACETYLCHOLINESTERASE 109
0 50 100 150 200 250 300 350
0.0
0.2
0.4
0.6
0.8
1.0
<u2 >
[Å2 ]
temperature [K]
(a) MSDs of AChE with corresponding fit on IN13.
0 50 100 150 200 250 300 350
0.0
0.2
0.4
0.6
0.8
1.0
<u2 >
[Å2 ]
temperature [K]
(b) MSDs of AChE + HupA with corresponding fit on IN13.
Figure 9.13: Evaluated mean square displacements of AChE and AChE +HupA with corresponding fits according to equation 9.2 on IN13. The ob-tained fit parameters are given in table 9.2. In order to exclude the influenceof denaturation effects, the fit range was limited to a a range of 20 K–310 K.

110 9.4. COMPARISON BETWEEN ACHE AND BCHE
0 50 100 150 200 250 300 350
0.000
0.002
0.004
0.006
0.008κ [
ps
-1]
temperature [K]
(a) Values for AChE are shown in black, AChE + HupA in red. The calculatedvalues for BChE are given in green and for Soman in blue, respectively. The blackhorizontal line indicates the resolution limit of ≈ 0.001 ps−1 on IN16.
0 50 100 150 200 250 300 350-0.002
0.000
0.002
0.004
0.006
0.008
0.010
0.012
κ [
ps
-1]
temperature [K]
(b) Values for AChE are shown in black, AChE + HupA in red. The black horizontalline indicates the resolution limit of ≈ 0.01 ps−1 on IN13.
Figure 9.14: κ calculated according to equation 9.3 using the values ob-tained by fitting equation 9.2 to the MSDs for IN16 and IN13.

CHAPTER 9. NEUTRON SCATTERING STUDIES OF HUMANACETYLCHOLINESTERASE 111
9.5 Quasi-elastic experiments
0
0.5
1
1.5
2
2.5
−2 −1 0 1 2 3 4
Q[Å
−1 ]
energy [meV]
λ = 5.1 Å, 2θ=10°λ = 5.1 Å, 2θ=115°λ = 5.9 Å, 2θ=10°
λ = 5.9 Å, 2θ=115°
Figure 9.15: Dynamical ranges for the two wavelengths used on IN6. Thedashed blue line represents the elastic line. In the data evaluation a Q-rangeof 0.5 Å−1–1.6 Å−1 was chosen for a λ of 5.9 Å and 0.5 Å−1–1.9 Å−1 for λ =5.1 Å, respectively.
On a high flux instrument such as IN6 it is possible due to the highcount rate around the elastic position to record the elastic data, during heat-ing the samples from 20 K to room temperature. However to obtain rea-sonable statistics for quasi-elastic scans, longer count rates are necessary.Typical QENS measuring times lie in the order of several hours, instead ofseveral minutes for an elastic scan.Recorded data are corrected in the same way as elastic data for the scatter-ing coming from the sample holder, then they are normalised to the 20 Kdata and grouped to increase the statistics.Due to the two different wavelengths used in the experiments, the acces-sible Q-ranges differ slightly for the two resolutions, as can be seen fromfigure 9.15. For an incoming wavelength of λ = 5.9 Å and an energy trans-fer of± 0.75 meV, the Q-range is limited to 0.5 Å−1–1.6 Å−1. Choosing a ∆Qof 0.1 Å−1 this results in 12 data points. For λ = 5.1 Å this can be extended toan energy transfer of ± 1 meV and a Q-value of 1.9 Å−1. The same binningof ∆Q = 0.1 Å−1 was chosen, resulting in 15 groups.
The obtained data were fitted using a delta function for the elastic con-tribution, a single Lorentzian to mimic the quasi-elastic broadening and aslope background. The resulting fits for the native AChE sample and an

112 9.5. QUASI-ELASTIC EXPERIMENTS
-1.0 -0.5 0.0 0.5 1.0
1E-5
1E-4
1E-3
0.01S
(Q,
ω)
[a.u
.]
energy [meV]
(a) Wave vector Q = 0.5 Å−1.
-1.0 -0.5 0.0 0.5 1.0
1E-5
1E-4
1E-3
0.01
S(Q
, ω
) [a
.u.]
energy [meV]
(b) Wave vector Q = 1.8 Å−1.
Figure 9.16: S(Q,ω) of native AChE taken on IN6 (90 µeV energy resolution)with corresponding fits. Data are shown as black points with correspond-ing error bars. The delta function used as elastic line is shown in green, inblue is a single Lorentzian curve and in cyan a linear background is drawn.Due to the convolution with the experimental determined instrumental res-olution, the elastic line shows noise for higher energy transfers. Data aregiven for the lowest and highest measured Q-value.

CHAPTER 9. NEUTRON SCATTERING STUDIES OF HUMANACETYLCHOLINESTERASE 113
incident wavelength of 5.1 Å are shown in figure 9.16. Data and fits cor-responding to the second measured resolution (5.9 Å = 50 µeV) are givenin figure 9.17. For comparison fits for the lowest and highest measured Q-values are given.The half-width at half maximum Γ of the Lorentzian used in the fitting pro-cedure are given in figure 9.18a for the 90 µeV setup and in figure 9.18b forthe 50 µeV as a function of Q2, respectively. From both figures it is obviousthat in the limit of Q → 0 the HWHM does not tend to zero. Γ increaseswith Q2 and seems to approach asymptotically a constant value Γ∞. Thefirst feature indicates, as already mentioned in the theory section (section3.6.2), that the diffusive motion is not free, but confined in space [24]. Us-ing the “diffusion in a sphere” model introduced by Volino and Dianoux(cf. section 3.6.2) and the modification introduced by Bellissent-Funel etal., this can be taken into consideration for the data evaluation.The radius of the sphere was extracted from fitting equation 3.30 to the Q-dependence of the EISF. The resulting fits are shown in figure 9.19 and theobtained values for the radius of the sphere and the percentage of immo-bile protons are given in table 9.4. For both investigated resolutions the ob-tained values for the EISF agree within experimental errors. The observedradius is larger for an incident wavelength of λ = 5.9 Å due to the longerobservation time in comparison to an incident wavelength of λ = 5.1 Å. Forthe second parameter extracted from the fits, the immobile fraction, such astatement is not possible because of the large errors due to the restricted fitrange at large Q-values (cf figure 9.19).In contrast to MD simulations [121, 122] where specific sites of the enzymecan be investigated in more detail e.g. the gorge, neutron scattering probesthe average over all protons present in the protein. Therefore the conclu-sion can be drawn that ligand binding can have an local effect on the dy-namics of the gorge but a rather small impact on global dynamics.
native AChE AChE + HupA
λ = 5.1 Åradius a [Å] 2.69 ± 0.07 2.71 ± 0.07
immobile fraction p [%] 71.19 ± 3.71 69.81 ± 4.31
λ = 5.9 Åradius a [Å] 2.93 ± 0.09 2.96 ± 0.06
immobile fraction p [%] 69.37 ± 6.00 68.19 ± 4.23
Table 9.4: Results obtained from fitting the EISF with the “diffusion in asphere” model. Values are given for both samples and both investigatedenergy resolutions.
The line widths of the Lorentzian are drawn in figure 9.18, as already

114 9.5. QUASI-ELASTIC EXPERIMENTS
-0.8 -0.6 -0.4 -0.2 0.0 0.2 0.4 0.6 0.81E-5
1E-4
1E-3
0.01S
(Q,
ω)
[a.u
.]
energy [meV]
(a) Wave vector Q = 0.5 Å−1.
-0.8 -0.6 -0.4 -0.2 0.0 0.2 0.4 0.6 0.81E-5
1E-4
1E-3
0.01
S(Q
, ω
) [a
.u.]
energy [meV]
(b) Wave vector Q = 1.6 Å−1.
Figure 9.17: S(Q, ω) of AChE + HupA taken on IN6 (50 µeV energy reso-lution) with corresponding fits. Data are shown as black points with cor-responding error bars. The delta function used as elastic line is shown ingreen, in blue is a single Lorentzian curve and in cyan a linear backgroundis drawn. Due to the convolution with the experimental determined instru-mental resolution, the elastic line shows noise for higher energy transfers.Data are given for the lowest and highest measured Q-value.
CHAPTER 9. NEUTRON SCATTERING STUDIES OF HUMANACETYLCHOLINESTERASE 115
mentioned above. For small Q-values, i.e. large distances, a confinementeffect is visible. According to the “diffusion in a sphere” model (cf section3.6.2), the diffusion coefficient D can be estimated from the limit Γ0 for Q→0 according to equation 3.31. The resulting values are given in table 9.5 for90 µeV. For the 50 µeV energy resolution the values for D were extractedfrom fitting equation 3.32 to the data, corresponding values are shown intable 9.5. Again, the obtained values match within experimental errors forboth resolutions.For large Q-values, the line width does not follow a free diffusion. For freediffusion Γ can be written as Γ = DQ2. In the here investigated case theline width shows a jump diffusion behaviour, described by equation 3.32.High Q-values correspond to short length scales, thus local motions suchas jumps of the observed protons become dominant. The residence time τbetween two jumps is given by τ = 1/Γ∞, where Γ∞ can be extracted fromthe asymptotic behaviour of Γ for high Q, where a constant value Γ∞ isreached.For both resolutions the line width is still increasing at high Q-values andhas not yet reached a plateau in the investigated Q-range. Therefore thevalues have to be extracted from fitting equation 3.32 to the data. Corre-sponding values for τ are also given in tables 9.5 and 9.6.The characteristic jump distance can be calculated using:
l =√
Dτ. (9.4)
Again the obtained results are given in tables 9.5 and 9.6. As for all otherparameters obtained, also the jump lengths for native AChE and AChE +HupA agree within experimental errors.In order to perform a jump, protons have to overcome an energy barrierimposed by the surrounding energy landscape. The height of this energybarrier is linked to the residence time via the Arrhenius relation:
τ = τ0eEa/kBT , (9.5)
where τ0 is a pre-factor and Ea the activation energy of the process.When τ0 is assumed to be the same for native AChE and its inhibited coun-terpart, ∆Ea can be written as
∆Ea = kBT ln(
τAChE
τHupA
). (9.6)
Using equation 9.6 the activation energy difference between the two in-vestigated systems is found to be ∆Ea,90 µeV = 10.47 ± 0.30 and ∆Ea,50 µeV= 11,90 ± 0.43 cal/mol, respectively. Both values correspond to approxi-mately 0.02kBT and therefore only to very small energy differences.

116 9.6. CONCLUSION AND OUTLOOK
In this section first quasi-elastic neutron scattering data on native AChEand AChE + HupA for two different energy resolutions are presented. In-formation on internal diffusion motion were extracted from fits to the quasi-elastic broadening of the experimental scattering function. The analysis ofthe EISF gave information on the radii in which protons diffuse accordingto the “diffusion in a sphere” model [31]. In addition the immobile fractionof hydrogens in the observed space-time window could be extracted. Theevaluation of the HWHM of the Lorentzian broadening permits a detailedevaluation of the observed diffusive motions. In the low Q-region a con-finement effect is observed as deviation from the DQ2 law. For the higherQ-values, the diffusion can be described by jump diffusion. Both diffusionconstants D and residence times τ were calculated. All results obtained inthis section agree within the experimental errors for the native AChE andits inhibited counterpart. Even if the here presented results were obtainedusing hydrated powders, they yield values for D and τ which can be com-pared to values obtained on proteins in solution, e.g. [93].
9.6 Conclusion and outlook
In this chapter extensive neutron scattering studies on human AChE are de-scribed. The dynamics in the pico to nanosecond time have been exploredusing four different elastic energy resolutions. The results from the elasticscattering experiments (section 9.3) showed that more than one relaxationprocess is observed. From the fact, that the observed motions leave the timewindow of IN16 a maximal timescale of the motion can be inferred.In section 9.4 the mean square displacements of human AChE and humanBChE have been investigated. A clear difference in the msds has been de-tected. Already some explanations have been given in section 9.4, but inorder to further clarify the reasons for the different behaviours, several ad-ditional investigations have to be performed.Finally, in section 9.5 the results from the quasi-elastic experiments on IN6are presented. The evaluation of the obtained EISFs and Lorentzian widthspermits a more detailed picture of the internal diffusive motions than theelastic data but showed also no significant difference between the nativeand the inhibited form of AChE.In a next step EINS studies on different kinds of AChE, especially mouseACHE (mAChE) are planned using the same four energy resolutions as forAChE. With the results from these experiments it will be possible to show,if there is already a large variation of MSDs between AChE from differentspecies or if the observed difference between human AChE and BChE isdue structural differences between the two enzymes. Especially the resultsfrom IN16 where a comparison of all samples is possible will help to clarifythis fact.

CHAPTER 9. NEUTRON SCATTERING STUDIES OF HUMANACETYLCHOLINESTERASE 117
In addition to the experimental approach, MD simulations are foreseen. Sofar it was not possible to perform MD simulations of human AChE becausethere was no crystal structure available. The crystal structure of humanAChE in its apo state has only been published very recently [110].With the now available crystallographic data, MD simulations of humanAChE and BChE will be performed in the ns range to cover the time win-dow of IN16 in order to find the origin of the observed difference in theneutron data obtained on this spectrometer. The experimental data ob-tained on mAChE will also be included in the analysis, because there existalready MD simulations on this type of AChE [121–123], not only in thenative form but also in complex with HupA.
9.7 Conclusion en français
Dans ce chapitre, des études détaillées de l’AChE humaine par diffusion deneutrons sont décrites. La dynamique dans le domaine du temps allant dela pico- à la nano -seconde a été explorée en utilisant quatre différentes réso-lutions pour l’énergie élastique. Les résultats des expériences de diffusionélastique (section 9.3) ont montré que plus d’un processus de relaxation estcontenu dans la dynamique. Le fait que les mouvements observés sortentla fenêtre de temps de IN16 permet de déduire l’échelle de temps maximaledes mouvements.Dans la section 9.4 les déplacements carrés moyens de l’AChE humaine etde la BChE humaine ont été étudiés. Une différence considérable dans leursMSD a été détectée. Quelques explications sont proposées dans la section9.4, mais pour mieux comprendre les raisons des comportements différents,plusieurs études supplémentaires sont envisagées.Nous voulons réaliser des études EINS sur différents types de AChE, enparticulier l’ACHE de souris (mAChE). Avec les résultats de ces expériencesnous pourrons voir si il existe déjà une grande variation entre les MSD dedifférentes espèces, ou si la différence observée entre l’AChE et la BChEhumaines est due à des différences structurales entre les deux enzymes.Une autre approche sera effectuée à l’aide de simulations de dynamiquemoléculaire. Jusqu’à présent, il n’était pas possible d’entreprendre de tellessimulations de l’acétylcholinestérase humaine, parce qu’il n’existait pas destructure cristalline publiée. La structure cristalline de l’AChE humainedans son état apo n’a été publiée que très récemment [110].Avec les nouvelles données cristallographiques, des simulations de dyna-mique moléculaire de l’AChE et de la BChE humaines seront effectuéesdans le domaine de la ns pour couvrir la fenêtre de temps de IN16, afinde mieux comprendre l’origine de la différence observée dans les don-nées neutroniques obtenues sur ce spectromètre. En outre, les mesures re-cueillies sur mAChE pourront également être incluses dans l’analyse, car il

118 9.7. CONCLUSION EN FRANÇAIS
0.0 0.5 1.0 1.5 2.0 2.5 3.0 3.5 4.00
20
40
60
80
100
120
140
HW
HM
[µeV
]
Q2 [Å-2]
(a) Lorentzian width at a wavelength of 5.1 Å (elastic energy resolution:90 µeV). Fit curves correspond to equation 3.32 of the jump diffusion model.A clear deviation for low Q-values, corresponding to confinement effects, isvisible. The results from the fits are given in table 9.5.
0.0 0.5 1.0 1.5 2.0 2.50
20
40
60
80
100
120
140
HW
HM
[µeV
]
Q2 [Å-2]
(b) Lorentzian width for the data taken at 50 µeV. Fit corresponds to the jumpdiffusion model (see equation 3.32). The results from the fit are given in table9.6.
Figure 9.18: Half widths of the quasi-elastic Lorentzian as a function of Q2
for native AChE (black squares) and AChE + HupA (red circles) for bothinvestigated resolutions on IN6. The colors of the fit curves correspond torespective sample.

CHAPTER 9. NEUTRON SCATTERING STUDIES OF HUMANACETYLCHOLINESTERASE 119
existe déjà des simulations MD sur ce type d’AChE [121–123], et non seule-ment dans sa forme native, mais aussi en complexe avec HupA.Enfin, dans la section 9.5 les résultats des expériences quasi-élastiques surIN6 sont présentés. L’évaluation des EISFs fournisse une image plus dé-taillée de la dynamique que les données élastiques seules.

120 9.7. CONCLUSION EN FRANÇAIS
0.0 0.2 0.4 0.6 0.8 1.0 1.2 1.4 1.6 1.8 2.00.6
0.7
0.8
0.9
1.0E
ISF
Q [Å-1]
(a) EISF for an incident wavelength of 5.1 Å (elastic energy resolution : 90 µeV).
0.0 0.2 0.4 0.6 0.8 1.0 1.2 1.4 1.6 1.80.6
0.7
0.8
0.9
1.0
EIS
F
Q [Å-1]
(b) EISF for an incident wavelength of 5.9 Å (elastic energy resolution : 50 µeV).
FIGURE 9.19 – Elastic incoherent structure factor for both resolutions mea-sured on IN6. Data and corresponding fits for pure AChE are drawn inblack, for AChE + HupA data and fits are depicted in red. The values ex-tracted from the fits are given in table 9.4.

CHAPTER 9. NEUTRON SCATTERING STUDIES OF HUMANACETYLCHOLINESTERASE 121
native AChE AChE + HupA
D [10−5 cm2 s−1] 1.58 ± 0.07 1.51 ± 0.06τ [ps] 3.30 ± 0.29 3.36 ± 0.31l [Å] 0.72 ± 0.04 0.71 ± 0.04
∆Ea [cal/mol] 10.47 ± 0.30
Table 9.5: Values obtained by fitting equation 3.32 to the data obtained with90 µeV energy resolution and shown in figure 9.18a.
native AChE AChE + HupA
D [10−5 cm2 s−1] 3.53 ± 0.33 3.45 ± 0.31τ [ps] 9.11 ± 0.23 8.93 ± 0.22l [Å] 1.79 ± 0.17 1.76 ± 0.16
∆Ea [cal/mol] 11.90 ± 0.43
Table 9.6: Values obtained by fitting equation 3.32 to the data at 50 µeVenergy resolution and shown in figure 9.18b. Due to the levelling of atsmall Q-values the, first data point was excluded from the fit.

122 9.7. CONCLUSION EN FRANÇAIS

Appendix A
Abbreviations
AChE AcetylcholinesteraseBChE ButyrylcholinesteraseCCD Charge-coupled deviceCRG Collaborating research groupDMPA 1,2-dimyristoyl-sn-glycero-3-phosphateDMPC 1,2-dimyristoyl-sn-glycero-3-phosphocholineDMPC-d54 1,2-dimyristoyl-d54-sn-glycero-3-phosphocholineDPPC 1,2-dipalmitoyl-sn-glycero-3-phosphocholineEINS Elastic incoherent neutron scatteringEISF Elastic incoherent structure factoreV Electron voltFRMII Forschungsreaktor München IIFWHM Full width at half maximumHHP High hydrostatic pressureHupA Huperzine AHWHM Half width at half maximumIBS Institut de Biologie StructuraleILL Institut Laue-LangevinLLB Laboratoire Léon BrillouinMD Molecular dynamicsmsd Mean square displacementNSE Neutron spin echoPDG Particle data groupPSD Position Sensitive DetectorPSI Paul Scherrer InstitutQENS Quasi-elastic neutron scatteringQISF Quasi-elastic incoherent structure factorrpm Revolutions per minuteSNS Spallation neutron source
I

II

Appendix B
Physical constants
Planck constant:
h = (6.626 068 96± 0.000 000 33)× 10−34 J s
= (4.135 667 33± 0.000 000 10)× 10−15 eV s
reduced Planck constant
h =h
2π= (1.054 571 628± 0.000 000 053)× 10−34 J s
= (6.582 118 99± 0.000 000 16)× 10−16 eV s
Boltzmann constant
kB = (1.380 650 4± 0.000 002 4)× 10−23 J K−1
= (8.617 343± 0.000 015)× 10−5 eV K−1
Avogadro constant
NA = (6.022 141 79± 0.000 000 30)× 1030 mol−1
Gas constant
R = NA · kB = (8.314 472± 0.000 015) J mol−1 K−1
= 5.189× 10¹⁹ eV mol−1 K−1
III

IV
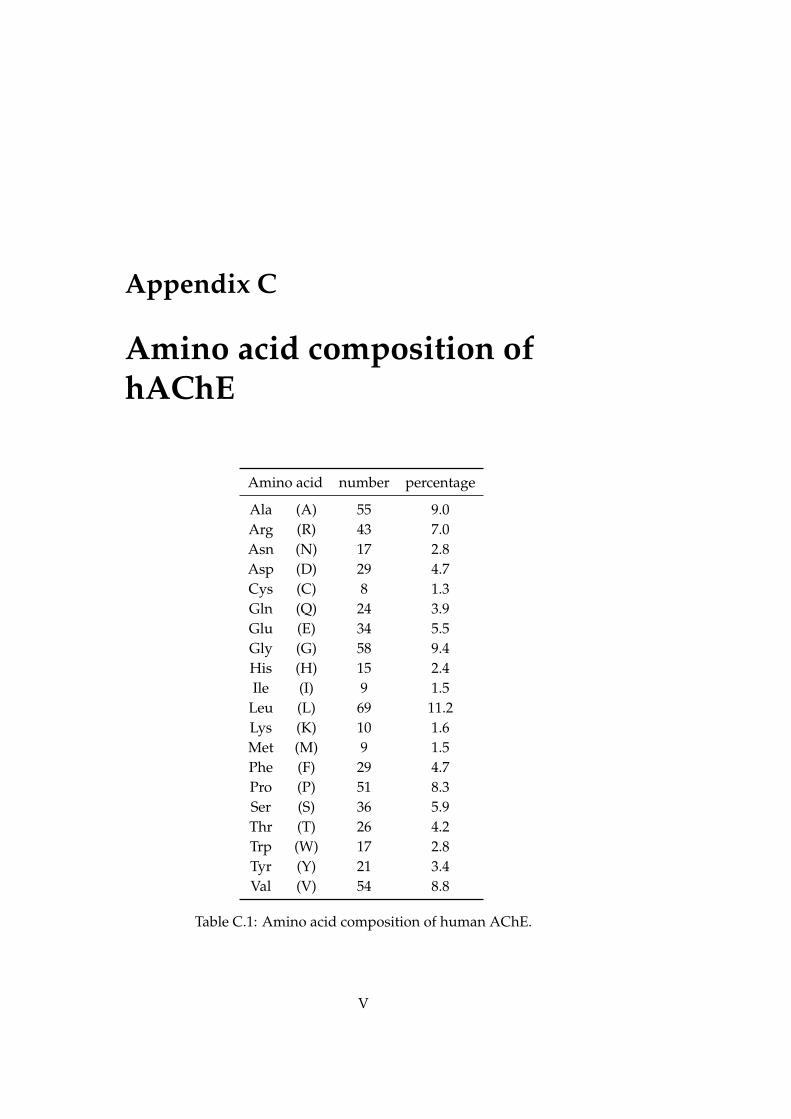
Appendix C
Amino acid composition ofhAChE
Amino acid number percentage
Ala (A) 55 9.0Arg (R) 43 7.0Asn (N) 17 2.8Asp (D) 29 4.7Cys (C) 8 1.3Gln (Q) 24 3.9Glu (E) 34 5.5Gly (G) 58 9.4His (H) 15 2.4Ile (I) 9 1.5
Leu (L) 69 11.2Lys (K) 10 1.6Met (M) 9 1.5Phe (F) 29 4.7Pro (P) 51 8.3Ser (S) 36 5.9Thr (T) 26 4.2Trp (W) 17 2.8Tyr (Y) 21 3.4Val (V) 54 8.8
Table C.1: Amino acid composition of human AChE.
V

VI
Atom number in protein
Carbon C 3074Hydrogen H 4673Nitrogen N 841Oxygen O 865Sulfur S 17
Table C.2: Atomic content of human AChE.

Appendix D
Articles
In this chapter all accepted articles are listed, I contributed to. They arequoted in the order of their publication data, staring with the earliest.
D.1 Elastic scattering studies of aligned DMPC multi-layers on different hydrations
The following article was published in the proceedings of the XIII EuropeanConference on the Spectroscopy of Biological Molecules, held in Palermo,Italy from August 28 - September 2, 2009. During the conference I pre-sented a poster with results of a measuring campaign on IN16, ILL. Thepresented results are summarised in the following article.
VII

Spectroscopy 24 (2010) 461–466 461DOI 10.3233/SPE-2010-0481IOS Press
Elastic scattering studies of aligned DMPCmultilayers on different hydrations 1
Marcus Trapp a, Fanni Juranyi b, Moeava Tehei c,d, Lambert van Eijck e, Bruno Demé e,Thomas Gutberlet f and Judith Peters a,e,g,∗a Institut de Biologie Structurale J.-P. Ebel, UMR 5075, CNRS-CEA-UJF, Grenoble, Franceb LNS, ETH Zürich and Paul Scherrer Institut, Villigen, Switzerlandc Australian Institute of Nuclear Science and Engineering, Menai, Australiad School of Chemistry and Centre for Medical Bioscience, University of Wollongong, Wollongong,Australiae Institut Laue-Langevin, Grenoble, Francef JCNS at FRMII, Garching, Germanyg Université Joseph Fourier, Grenoble, France
Abstract. Biological membranes, consisting mainly of phospholipids and proteins, are organized in a bilayered structure whichexhibits dynamical behaviour within time regimes ranging from 10−12 s with the motion of alkyl chain defects and 1 s corre-sponding to collective excitations of the bilayer [Europhysics Letters 8 (1989), 201–206]. With the prominent role hydrationplays on the structural phase behaviour of phospholipids membranes, it is essential for a better description of membranes tounderstand also the influence of hydration on the dynamics of membrane systems. In the present study we have performedneutron scattering investigations on highly oriented DMPC-d54 multilayers at two different relative humidity (rh) levels. Ourresults reveal the strong influence of hydration on the local membrane dynamics, i.e., head group dynamics.
Keywords: Oriented model membranes, elastic neutron scattering, dynamics, hydration effects
1. Introduction
Biological membranes consist not only of different kinds of lipids, but also of membrane proteins andmolecules like, e.g., cholesterol and ethanol [18]. To investigate the physical and structural behaviour ofsuch complex systems, lipid membranes consisting of only one type of lipid such as 1,2-Dimyristoyl-sn-Glycero-3-Phosphocholine (DMPC) serve as suitable model systems.
Saturated phospholipids like DMPC show two phase transitions: (1) a pre-transition from the Lβ gelphase to the Pβ ripple phase (DMPC at 286 K) and (2) the main phase transition from the Pβ ripplephase to the liquid-crystalline Lα phase (DMPC at 296 K) where the mobility of the alkyl chains isenhanced with respect to the gel phase [10]. For chain deuterated lipids which were used in this studythe temperature of the main phase transition is shifted by about 3 K to lower temperatures [6].
Lowering the water content reduces the repeating distance of the bilayers. In addition, structural in-vestigations [20] show that a lower degree of hydration causes a shift of the main phase transition to
1This paper was presented at ECSBM, Palermo, Italy, August 28–September 2, 2009. Guest Editor: A. Cupane.*Corresponding author: Judith Peters, Université Joseph Fourier, F-38042 Grenoble Cédex 9, France. Tel.: +33 476 20 75
60; Fax: +33 476 20 76 88; E-mail: [email protected].
0712-4813/10/$27.50 © 2010 – IOS Press and the authors. All rights reserved

462 M. Trapp et al. / Elastic scattering studies of aligned DMPC multilayers on different hydrations
higher temperatures. The effect can be observed by X-ray or neutron diffraction following the shift inthe distance of the Bragg peaks of the lipid bilayers. The relation d = λ/2× sin(θ) (λ – X-ray or neutronwavelength, θ – scattering angle) allows to calculate the repeating distance d. For a fully hydrated DMPCbilayer, the repeating distance d is around 63 Å [8]. While the influence of hydration on the structuralproperties of membranes is well investigated [20], its influence on dynamic behaviour is rather poor.
The diffusive motions of lipids within the bilayer have been explored by quasi-elastic neutron scat-tering [7,14,22]. More recently collective motions of the lipid bilayer were also studied with inelasticneutron scattering [15]. However, the hydration effects on the lipid bilayer properties were not enclosedin these investigations. In this study, we thus performed neutron scattering investigations on highly ori-ented DMPC multilayers at two different relative humidity (rh) levels with the aim to fill this gap. Ourresults reveal the strong influence of hydration on the local membrane dynamics.
2. Materials and methods
2.1. Sample preparation
To probe dynamics of lipid membranes in and out of plane, oriented samples can be prepared on verysmooth surfaces such as silicon wafers or mica sheets. Solid supported bilayer systems also allow thepreparation of large amount of sample (≈150–200 mg) required in inelastic and quasi-elastic neutronscattering experiments [19]. Another advantage of this preparation method is the very low mosaic spread(below 0.5). Each Si-wafer was of size of about 30 × 40 mm which fitted perfectly the dimensionsof the flat gold coated aluminium sample cells used for the experiments.
Alkyl chain deuterated 1,2-dimyristoylphosphatidylcholine-d54 (DMPC-d54) was purchased fromAvanti Polar Lipids (Alabaster, AL, USA) and used without further purification. The DMPC powderwas dissolved in a 3:1 chloroform–trifluoroethanol (TFE) mixture following a protocol described in [2].This solution was then kept at −20C overnight.
About 30 mg of lipid was deposited on a single wafer. After the deposition the wafers were dried fortwo days in a desiccator. One sample was rehydrated from pure D2O with relative humidity of 100%,another one was rehydrated from a saturated salt solution (D2O + NaCl) with reduced relative humidityof 75%. Six such wafers were placed in the sample cell and sealed to achieve an amount of about 200 mghydrated lipid bilayers per sample. The weight of both samples was monitored and no change in weightbefore and after the neutron experiments was observed.
2.2. Elastic neutron experiments
The level of hydration, the mosaicity of the 1D lamellar order and the evolution of the repeat distance(d-spacing) of the bilayers with temperature were checked by neutron diffraction measurements on thesmall momentum transfer diffractometer D16 at the Institut Laue-Langevin (ILL), Grenoble, France [1].After heating to 330 K to allow annealing of defects, scans were performed to obtain the repeat distanceof the membranes at three different temperatures, namely, 330, 310 and 280 K. During the temperaturechanges data were taken to identify the temperature of the main phase transition. An example of theevolution of the d-spacing with temperature is shown in Fig. 1.
Elastic temperature scans in the range of 280–330 K were performed on the cold neutron backscatter-ing spectrometer IN16 at ILL at an energy resolution of ΔE = 0.9 µeV (full width half maximum) andan accessible Q-range of 0.19–1.93 Å−1 [5]. The investigated temperature range covers both the main

M. Trapp et al. / Elastic scattering studies of aligned DMPC multilayers on different hydrations 463
Fig. 1. Diffraction data taken on D16 at ILL. Data are shown for three different temperatures: 280 K (straight line), 310 K(broken line) and 330 K (broken line with crosses). The sample was hydrated from a saturated salt solution (D2O + NaCl)resulting in a relative humidity of 75%.
phase transition from the Pβ ripple to the liquid-crystalline Lα phase which occurs around 296 K forDMPC at full hydration and also the pre-transition from the Lβ gel phase to the Pβ ripple phase about10 degrees below the main phase transition.
Special care was taken on the orientation of the sample to probe motions around the chain correlationpeak at Q = 1.48 Å−1 parallel and perpendicular to the membrane surface. Via the relation Q =4π sin(2θ)/λ the angle of the sample with respect to the incoming beam was calculated to be 135 forthe orientation parallel to the membrane surface and 45 for the perpendicular orientation, respectively.From the obtained data an empty cell was subtracted and the data were normalised by the scattering ofa 1 mm vanadium sample.
3. Results and discussion
From the shift of the main phase transition temperature to higher temperatures with decreasing wa-ter content (see Section 1 and Fig. 1 in [20]), it is possible to evaluate the water content between thephospholipid surfaces. We can extract the parameter Rw = nW/nA where Rw expresses the molar ratioof water (nW) and amphiphile (nA) [12,13]. Figure 2 (using the left y-axis) shows the summed elasticintensities measured for the parallel orientation at 135 with respect to the incoming beam for the twosamples on IN16. At the temperature of the main phase transition a drastic decrease in the elastic inten-sity occurs. The phase transition temperature moves to higher temperatures for the sample with lowerwater content. The calculated Rw for the higher hydrated sample is Rw ≈ 6 (transition temperature:305 K) and Rw ≈ 4 for the less hydrated sample (transition temperature: 310 K). Pfeiffer et al. find forDMPC multilayers a value of Rw 12 for fully hydrated membranes [13].

464 M. Trapp et al. / Elastic scattering studies of aligned DMPC multilayers on different hydrations
Fig. 2. Summed elastic intensity (Q-range: 0.43–1.16 Å−1) measured at 135 (left y-scale, filled squares: Rw ≈ 4, emptycircles: Rw ≈ 6) and mean square displacements 〈u2〉 (right y-scale, filled diamonds: Rw ≈ 4, empty triangles: Rw ≈ 6).Drawn lines are guides to the eyes to follow the evolution of the mean square displacements. Data taken on the cold neutronspectrometer IN16 at ILL (energy resolution: 0.9 µeV). Intensities are normalised to the lowest temperature.
To characterise the local dynamics from the elastic neutron scattering intensity, the so-called meansquare displacements (msd) 〈u2〉 were calculated. The elastic scattering function S(Q, ω = 0) can beapproximated by S(Q, ω = 0) ≈ exp(1/6 × 〈u2〉Q2) [21]. From the slope of a linear fit to a semi-logarithmic plot of the data one can extract the 〈u2〉. Below the temperature of the main phase transi-tion, coherent scattering arising from the ordering of the alkyl chain, gives rise to the so-called “chaincorrelation peak” around a characteristic Q-value of 1.48 Å−1. Therefore the fit range was limited to0.18 Å−2 Q2 1.33 Å−2 in our data analysis. As shown in Fig. 2 (using the right y-axis) the 〈u2〉show transitions at 305 and 310 K for the higher and lower hydrated sample, respectively. At first sightthe evaluated mean square displacements are very large above temperature of the main phase transition,but 〈u2〉 in the same order of magnitude have been observed in a previous study which aimed to inves-tigate the influence of the myelin basic protein (MBP) on the dynamics of model membranes (DMPAin this study) [11]. A recently published molecular-dynamics simulation performed on fully hydratedDMPC bilayers in the Lα phase (at 303 K) also shows very large 〈u2〉 at this temperature, even largerthen the two partially hydrated samples used in our study [4]. Hence we attribute the difference in thevalues of the mean square displacements to the different hydrations of the samples, ranging from thehighest 〈u2〉-value for the simulation (≈8 Å2 for the centre of mass) to the sample with the lowest hy-dration of Rw ≈ 4 (≈2.9 Å2). The authors differentiate three different diffusion regimes in time: (1) aballistic region where 〈u2〉 ∼ t2; (2) a subdiffusive domain where 〈u2〉 ∼ tβ with β < 1 and (3) adomain of Fickian diffusion with 〈u2〉 ∼ t. According to this simulation, the time window of IN16 ofabout 700 picoseconds probes length scales in the subdiffusive regime. A detailed analysis of quasi-

M. Trapp et al. / Elastic scattering studies of aligned DMPC multilayers on different hydrations 465
elastic data taken in both the Lβ gel and liquid-crystalline Lα phase is still in progress [23]. In orderto compare the results obtained from the mean square displacement (using the right y-axis in Fig. 2)with the summed elastic intensities, the intensities shown in Fig. 2 (using the left y-axis) were summedover the same Q-range (0.43 Å−1 Q 1.16 Å−1) which was used in the evaluation of the msd’s.The effect is stronger for the summed intensities due to adding up the signals from all detectors in theused Q-range. From hydration dependent studies of, e.g., bacteriorhodopsin [9] it is known that withincreasing hydration the msd’s show a steeper slope only at high relative humilities in contrast to proteinwhere a steady rice of the msd is observed [17]. Only small difference of the calculated slopes in theLα phase (higher hydrated sample: 0.258 ± 0.0157, less hydrated sample: 0.224 ± 0.022) of our resultsconfirm these finding.
Rheinstaedter et al. [16] analyzed the elastic intensity at various Q-values of DMPC to map out thetransition of the different molecular components from immobile to mobile as a function of temperature.The effect of hydration on the membrane dynamics was neglected in their analysis. Our study revealsthe strong influence hydration has on the membrane systems, not only on the structure but also on thedynamics. Similar to hydrated protein powders [3] also phospholipids show a dynamic transition in themean square displacements 〈u2〉 and a shift of the temperature of the main phase transition dependingon their hydration. The transition for proteins occurs around 200 K and is often called “dynamicaltransition”. In the case of membranes this transition is due to the structural transition into the liquid-crystalline Lα phase. In contrast to proteins were the individual amino acid is hydrated to allow localmotions of the proteins in phospholipid bilayers only the hydration of the hydrophilic head group ofthe phospholipid triggers the dynamic response of the hydration shielded hydrophobic alkyl chains. Inconclusion special care should be taken for the hydration control to avoid a mixing of effects, whichcould be partly due to the hydration state of the sample.
Acknowledgements
We acknowledge the ILL for the allocation of beamtime and the financial support from the Accessto Major Research Facilities Programme which is a component of the International Science LinkagesProgramme established under the Australian Government’s innovation statement, Backing Australia’sAbility.
References
[1] http://www.ill.eu/d16/.[2] L. Ding, T.M. Weiss, G. Fragneto, W. Liu, L. Yang and H.W. Huang, Distorted hexagonal phase studied by neutron
diffraction: lipid components demixed in a bent monolayer, Langmuir 21 (2005), 203–210.[3] W. Doster, S. Cusack and W. Petry, Dynamical transition of myoglobin revealed by inelastic neutron scattering, Nature
337 (1989), 754–756.[4] E. Flenner, J. Das, M.C. Rheinstadter and I. Kosztin, Subdiffusion and lateral diffusion coefficient of lipid atoms and mole-
cules in phospholipid bilayers, Physical Review E – Statistical, Nonlinear, and Soft Matter Physics 79 (2009), 011907.[5] B. Frick and M. Gonzalez, Five years operation of the second generation backscattering spectrometer IN16 – a retrospec-
tive, recent developments and plans, Physical Review B – Condensed Matter 301 (2001), 8–19.[6] D. Guard-Friar, C.H. Chen and A.S. Engle, Deuterium isotope effect on the stability of molecules: phospholipids, The
Journal of Physical Chemistry 89 (1985), 1810–1813.[7] S. König, W. Pfeiffer, T. Bayerl, D. Richter and E. Sackmann, Molecular dynamics of lipid bilayers studied by incoherent
quasi-elastic neutron scattering, Journal de Physique II France 2 (1992), 1589–1615.

466 M. Trapp et al. / Elastic scattering studies of aligned DMPC multilayers on different hydrations
[8] N. Kucerka, Y. Liu, N. Chu, H.I. Petrache, S. Tristram-Nagle and J.F. Nagle, Structure of fully hydrated fluid phaseDMPC and DLPC lipid bilayers using X-ray scattering from oriented multilamellar arrays and from unilamellar vesicles,Biophysical Journal 88 (2005), 2626–2637.
[9] U. Lehnert, V. Réat, M. Weik, G. Zaccaï and C. Pfister, Thermal motions in bacteriorhodopsin at different hydration levelsstudied by neutron scattering: correlation with kinetics and light-induced conformational changes, Biophysical Journal75 (1998), 1945–1952.
[10] J.F. Nagle, Theory of the main lipid bilayer phase transition, Annual Review of Physical Chemistry 31 (1980), 157–196.[11] F. Natali, A. Relini, A. Gliozzi, R. Rolandi, P. Cavatorta, A. Deriu, A. Fasano and P. Riccio, The influence of the lipid–
protein interaction on the membrane dynamics, Physical Review B – Condensed Matter 350 (2004), E623–E626.[12] H. Pfeiffer, H. Binder, G. Klose and K. Heremans, Hydration pressure and phase transitions of phospholipids: I.
Piezotropic approach, Biochimica et Biophysica Acta – Biomembranes 1609 (2003), 144–147.[13] H. Pfeiffer, H. Binder, G. Klose and K. Heremans, Hydration pressure and phase transitions of phospholipids: II. Ther-
motropic approach, Biochimica et Biophysica Acta – Biomembranes 1609 (2003), 148–152.[14] W. Pfeiffer, T. Henkel, E. Sackmann, W. Knoll and D. Richter, Local dynamics of lipid bilayers studied by incoherent
quasi-elastic neutron scattering, Europhysics Letters 8 (1989), 201–206.[15] M.C. Rheinstädter, C. Ollinger, G. Fragneto, F. Demmel and T. Salditt, Collective dynamics of lipid membranes studied
by inelastic neutron scattering, Physical Review Letters 93 (2004), 108107.[16] M.C. Rheinstädter, T. Seydel, F. Demmel and T. Salditt, Molecular motions in lipid bilayers studied by the neutron
backscattering technique, Physical Review E – Statistical, Nonlinear, and Soft Matter Physics 71 (2005), 061908.[17] J.H. Roh, J.E. Curtis, S. Azzam, V.N. Novikov, I. Peral, Z. Chowdhuri, R.B. Gregory and A.P. Sokolov, Influence of
hydration on the dynamics of lysozyme, Biophysical Journal 91 (2006), 2573–2588.[18] E. Sackmann, Biological membranes architecture and function, in: Structure and Dynamics of Membranes, Handbook of
Biological Physics, Vol. 1, R. Lipowsky and E. Sackmann, eds, Elsevier, Amsterdam, 1995, pp. 1–64.[19] T. Salditt and M.C. Rheinstädter, Structure and dynamics of model membrane systems probed by elastic and inelastic
neutron scattering, in: Neutron Scattering in Biology, Techniques and Applications, J. Fitter, T. Gutberlet and J. Katsaras,eds, Springer, Berlin, 2006, pp. 503–530.
[20] G.S. Smith, E.B. Sirota, C.R. Safinya and N.A. Clark, Structure of the L beta phases in a hydrated phosphatidylcholinemultimembrane, Physical Review Letters 60 (1988), 813–816.
[21] J.C. Smith, Protein dynamics: comparison of simulations with inelastic neutron scattering experiments, Quarterly Reviewsof Biophysics 24 (1991), 227–291.
[22] J. Swenson, F. Kargl, P. Berntsen and C. Svanberg, Solvent and lipid dynamics of hydrated lipid bilayers by incoherentquasielastic neutron scattering, Journal of Chemical Physics 129 (2008), 045101.
[23] M. Trapp, F. Juranyi, M. Tehei, L. van Eijck, B. Demé, T. Gutberlet and J. Peters, QENS studies on aligned DMPCmultilayers at different hydrations, in preparation.

XIVD.1. ELASTIC SCATTERING STUDIES OF ALIGNED DMPC MULTILAYERS ON
DIFFERENT HYDRATIONS

APPENDIX D. ARTICLES XV
D.2 Hydration dependent studies of highly alignedmultilayer lipid membranes by neutron scatter-ing
The article entitled “Hydration dependent studies of highly aligned multi-layer lipid membranes by neutron scattering” has been accepted for publi-cation in The Journal of Chemical Physics and was published in October 2010.The article was also selected for the October issue of the JCP: BioChemicalPhysics. It includes the subset of articles from The Journal of Chemical Physicsthat directly deals with, or has important implications for, biologically re-lated systems.Elastic and quasi-elastic data are presented which where obtained dur-ing measurements on IN13 and TOFTOF. I was responsible for the samplepreparation, took part in both measurement campaigns and performed thedata evaluation.

Hydration dependent studies of highly aligned multilayer lipid membranesby neutron scattering
Marcus Trapp,1,2 Thomas Gutberlet,3 Fanni Juranyi,4 Tobias Unruh,5 Bruno Demé,2
Moeava Tehei,6 and Judith Peters1,2,7,a
1Institut de Biologie Structurale J.-P. Ebel, UMR 5075, CNRS-CEA-UJF, 41 rue Jules Horowitz,38027 Grenoble, France2TOF/HR Group, Institut Laue Langevin (ILL), 6 Avenue J. Horowitz, BP 156, F-38042 Grenoble Cedex 9,France3Jülich Centre for Neutron Science, TU Munich, Lichtenbergstr. 1, 85747 Garching, Germany4Laboratory for Neutron Scattering, ETH Zürich and Paul Scherrer Institut, 5232 Villigen PSI, Switzerland5Physik Department E13 and Forschungsneutronenquelle Heinz Maier-Leibnitz FRM II, TechnischeUniversität München, Lichtenbergstr. 1, 85747 Garching, Germany6Australian Institute of Nuclear Science and Engineering (AINSE), Menai 2234, New South Wales, Australiaand School of Chemistry and Centre for Medical Bioscience, University of Wollongong, Wollongong,New South Wales 2522, Australia7Université Joseph Fourier, F-38041 Grenoble Cédex 9, France
Received 26 April 2010; accepted 12 September 2010; published online 25 October 2010
We investigated molecular motions on a picosecond timescale of 1,2-dimyristoyl-sn-glycero-3-phosphocholine DMPC model membranes as a function of hydration by using elasticand quasielastic neutron scattering. Two different hydrations corresponding to approximately nineand twelve water molecules per lipid were studied, the latter being the fully hydrated state. In ourstudy, we focused on head group motions by using chain deuterated lipids. Information on in-planeand out-of-plane motions could be extracted by using solid supported DMPC multilayers. Ourstudies confirm and complete former investigations by König et al. J. Phys. II France 2, 15891992 and Rheinstädter et al. Phys. Rev. Lett. 101, 248106 2008 who described the dynamicsof lipid membranes, but did not explore the influence of hydration on the head group dynamics aspresented here. From the elastic data, a clear shift of the main phase transition from the P ripplephase to the L liquid phase was observed. Decreasing water content moves the transitiontemperature to higher temperatures. The quasielastic data permit a closer investigation of thedifferent types of head group motion of the two samples. Two different models are needed to fit theelastic incoherent structure factor and corresponding radii were calculated. The presented data showthe strong influence hydration has on the head group mobility of DMPC. © 2010 American Instituteof Physics. doi:10.1063/1.3495973
I. INTRODUCTION
Native biological systems are always found in aqueousenvironments. Therefore, it is not surprising that the dynam-ics of such systems is influenced by the hydration level, as ithas been confirmed by several neutron scattering studies1–6
and molecular dynamics simulations.7–9 The dynamical tran-sition for proteins appears around 200 K. It marks the cross-over from a regime in which only vibrational motions of theatoms are observed to a regime where anharmonic motionsemerge. Below a certain level of hydration typically 0.2–0.4 g water/g protein corresponding to one complete waterlayer bound to the protein surface, the protein shows no dy-namical transition and as a consequence does not becomeactive.4
In the case of membranes, a transition due to the struc-tural transition into the liquid-crystalline L phase is ob-served. Depending on the chain length and the degree ofhydration of the lipid, it occurs around room temperature or
even higher temperatures.10 In contrast to proteins where thehydration of individual amino acids allows local motions ofthe protein, in phospholipid bilayers, only the hydration ofthe hydrophilic head group triggers the dynamic response ofthe hydration shielded hydrophobic acyl chains due to theincreased surface available with increased hydration. Formembranes, a shift of the main phase transition to highertemperatures with decreasing water content is already knownfor quite some time.11 In recent years, neutron scatteringstudies of membrane dynamics focused on highly hydratedsamples,12–15 but only a few of these studies took hydrationeffects explicitly into consideration, e.g., König et al.14
In this work, we investigated the hydration influence onthe dynamics of model membranes by quasielastic neutronscattering QENS and elastic incoherent neutron scattering.Model membrane systems such as 1,2-dimyristoyl-sn-glycero-3-phosphocholine DMPC show a similar thermo-dynamical behavior as real cell membranes16 and are there-fore often used to mimic their more complex naturalcounterparts.
Dynamics in such lipid systems span over a large rangeaAuthor to whom correspondence should be addressed. Electronic mail:
THE JOURNAL OF CHEMICAL PHYSICS 133, 164505 2010
0021-9606/2010/13316/164505/7/$30.00 © 2010 American Institute of Physics133, 164505-1
Author complimentary copy. Redistribution subject to AIP license or copyright, see http://jcp.aip.org/jcp/copyright.jsp

in time and space, and have been investigated not only byneutron scattering,12–14,17,18 but also by nuclear magneticresonance,19,20 inelastic x-ray scattering,21 dielectricspectroscopy,22 differential scanning calorimetry,23 dynamiclight scattering,24 single particle tracking,25 and other meth-ods. To mimic membrane behavior in biological systems thefully hydrated state is the one of interest because this re-sembles physiological conditions. On the other hand, also thedried state is of interest, e.g., for food science.26
The knowledge of the dynamical behavior of thesemodel systems as a function of hydration is then crucial tobetter understand the parameters necessary for the function-ing of biological membranes and what precisely are theireffects.27
II. SAMPLE PREPARATION AND CHARACTERIZATION
In neutron scattering, deuterated samples allow to takeadvantage of the great difference in the incoherent scatteringcross sections of hydrogen inc=80.26 b Ref. 28 and itsisotope deuterium inc=2.05 b, whereas the coherent scat-tering cross sections are of the same order of magnitudecohH=1.76 b and cohD=5.59 b, all values are givenfor thermal neutron with an incident wavelength of about1.8 Å. So selective deuteration can be used to change thecontrast between different parts of the sample. This methodis especially useful for biological samples which contain ahigh amount of homogeneously distributed hydrogen atoms.In phospholipid model membranes, the incoherent scatteringcross section is drastically decreased by deuterating thealkyl-chains of the lipids. For completely protonated DMPC,the contribution to the incoherent scattering of the headgroup accounts for 25% of the total incoherent scattering.However, for the chain deuterated lipid used in our experi-ments, 73% of the total incoherent+coherent scatteringcross section stems from the head group. The ratio is evenmore striking considering only the incoherent cross section,here 93% of the scattering originates from the head group. Inthe gel phase, the chains are arranged in a regular manner ata characteristic distance. This ordering gives rise to the co-herent scattering originating from a quasi-Bragg peak around1.48 Å−1, the so called “chain correlation peak,” correspond-ing to a distance of about 4.2 Å. In the liquid phase, themotion of the lipid chains prevents their ordering, and there-fore the appearance of the correlation peak.
For the experiments described in the paper, we usedchain deuterated DMPC-d54 including the methyl groups atthe end of the alkyl chains, see Fig. 1. The lipids werepurchased from Avanti Polar Lipids Alabaster, AL, USAand used without any further purification deuteration of
98%. The DMPC powder was dissolved in a 3:1chloroform-trifluoroethanol mixture following a protocol de-scribed by Ding and co-workers.29 The dissolution was keptat −20 °C overnight. To be able to probe the in- and out-of-plane motions of the lipids in the membranes, orientedsamples have to be used. Such oriented samples have to beprepared on very smooth surfaces such as silicon wafers. Thewafers were purchased from Siltronix Archamps, Francewith a thickness of 38025 m and Si 111 orientation.Each Si-wafer was cut to a size of about 30 mm40 mm tofit the dimensions of the flat aluminum sample containerused for the experiments. To avoid chemical interactions be-tween the holder and the sample, the cells are coated with alayer of 3 m nickel and 0.5 m gold. About 30 mg of lipidsolution was sprayed onto a single wafer. Using this method,bilayer stacks parallel to the wafer surface are assembled.Two samples with different hydration levels were prepared.After the deposition, the wafers were dried over silica gel for2 days in a desiccator. One sample was rehydrated from pureD2O at 40 °C to achieve a fully hydrated sample corre-sponding to about 12 water molecules per lipid and more30.The other one was rehydrated from a saturated salt solutionto get reduced water content compared to the fully hydratedsample D2O+NaCl at 40 °C resulting in a relative humidityof 75%, about 9 water molecules per lipid. For each sample,six wafers were stacked together after rehydration to achievea total amount of about 200 mg lipid per sample. A flat coverwas used to close the sample cells. The total sample thick-ness of the six wafers total thickness of 2.3 mm and depos-ited DMPC was 3 mm. With typical values of about 90% forthe sample transmission, this amount of sample is needed toachieve sufficiently high statistics in a reasonable measuringtime. The weight of both samples was monitored before andafter the experiments and no change was observed.
The level of hydration and the mosaicity of the sampleswere characterized by neutron diffraction prior to both thequasielastic and elastic experiments. The corresponding dif-fraction data obtained at D16 Ref. 31 of the Institut LaueLangevin ILL, Grenoble, France, are shown in the supple-ments to this paper.32 This allows evaluating the bilayer re-peat distance for each sample and by this means the relativehumidity.33 For the sample hydrated from pure D2O, whichwill be referred to as the “higher hydrated sample” in thefollowing, the diffraction data yield a repeat distance of62.5 Å. The mosaic spread was extracted from fitting aLorentzian curve to the experimental data to be 0.222° fullwidth at half maximum FWHM. The sample hydratedfrom D2O+NaCl showed a d-spacing of 54.9 Å and a mo-saicity of 0.252° data not shown here. It will be referredto as “less hydrated sample.”
III. EXPERIMENT
A. Elastic experiments at IN13
Elastic experiments were performed at the CollaborativeResearch Group CRG thermal neutron backscattering spec-trometer IN13 at ILL, Grenoble. The incident wavelengthwas =2.23 Å with an incident neutron energy of about16 meV. This setup results in a uniquely wide range of mo-
FIG. 1. Schematic view of DMPC-d54. According to the Carpentier model,three different radii are sketched in the choline head group.
164505-2 Trapp et al. J. Chem. Phys. 133, 164505 2010
Author complimentary copy. Redistribution subject to AIP license or copyright, see http://jcp.aip.org/jcp/copyright.jsp

mentum transfer Q0.2 Å−1Q4.9 Å−1. The elastic en-ergy resolution was 8 eV. A detailed description of theinstrument and selected applications in the field of biophys-ics can be found in Natali et al.34 Transmission for bothsamples was measured and found to be in the order of 90%,so multiple scattering effects were not taken into consider-ation for the data treatment. For both samples, fixed energywindow scans were recorded in the temperature range be-tween −23 and 37 °C in steps of 5 °C to cover both thephase transition from the lamellar gel to the fluid phase at22 °C and also the transition from the gel to the crystallinephase around 12 °C. Special care was taken for the samplealignment so that the momentum transfer Q at the lipidpeak maximum lies in the plane of the membrane bilayersfor the parallel orientation. Using Eq. 1, the correspondingangles of 75° and 165° with respect to the incoming beamwere calculated for the parallel and perpendicular orientationof the scattering vector toward the membrane surface, re-spectively,
Q =4
sin . 1
Strictly speaking, the terms “parallel” and “perpendicular”are only true for these particular values; nevertheless, we areusing these designations in the course of this paper to distin-guish the orientations where these alignments are best vis-ible. Both orientations Q parallel and Q perpendicular to themembrane surface were measured. We mainly focused on theparallel orientation 2=75°. 3 h per temperature was mea-sured to favor good data statistic collection for this orienta-tion. For the perpendicular orientation, the acquisition timevaried between 45 min and 1 h at higher temperatures inparticular. For data correction purposes, an empty cell, a cellwith six cleaned wafers, and for normalization a 2 mm va-nadium sample were measured. The data evaluation was car-ried out using the LAMP software available at ILL.35
B. Quasielastic neutron scattering experimentsat TOFTOF
QENS experiments have been performed on the samesamples at the time-of-flight spectrometer TOFTOF Ref. 36at the Munich research reactor FRM II in Garching. Appli-cations of the spectrometer in the field of membrane bio-physics can be found in, e.g., Busch et al.37 The incidentwavelength was set to =6 Å, the chopper speed to12 000 rpm, resulting in an energy resolution of the elasticline of 56 eV FWHM of the elastic line. The setup waschosen in order to compare the results with previous mea-surements obtained by another group.13 Both samples weremeasured in a temperature range from 5 to 25 °C to coverboth phase transitions: the pretransition from the L gelphase to the P ripple phase at 12 °C as well as the mainphase transition from the P phase to the L liquid phase at22 °C.11 Spectra were taken every 5 °C. The measuringtime per temperature was 5 h. All samples, including a1.5 mm vanadium sample and a sample holder with sixempty wafers and pure D2O needed for corrections, weremeasured in one orientation at 45° with respect to the inci-
dent beam only. In this case Q is mainly parallel to themembrane surface at the alkyl chain correlation peak posi-tion Q=1.48 Å−1 for low energy transfers. Earlier QENSexperiments on 1,2-dipalmitoyl-sn-glycero-3-phosphocholine13 showed no significant differences in theelastic incoherent structure factor EISF for Q orientedparallel and perpendicular to the membrane surface. This factwas confirmed by our elastic data and the QENS data wererecorded only for the parallel orientation. From the measuredspectra, the scattering of the empty can was subtracted, thenthey were normalized to vanadium and transformed intoQ,E-space. The data were binned into 15 groups with Qranging from 0.44 to 1.56 Å−1. Data reduction was per-formed with IDA package available onsite,38 data analysiswas done using the PAN package from DAVE software.39
IV. RESULTS AND DISCUSSION
A. Elastic data
Figure 2 shows the normalized summed intensity takenon IN13 (Q-range: 0.19 Å−1Q1.67 Å−1 as a functionof temperature for both samples. The representation of thedata offers a simple and model-free approach to detect tran-sitions as changes in the elastic intensity decay.40 In the cho-sen setup, the influence of the coherent scattering comingfrom the chain ordering is mainly seen in the parallel orien-tation. Summed intensities are then shown only for the par-allel orientation. The phase transition for the fully hydratedsample is found to lie around 21 °C which coincides verywell with the value of 20.15 °C found by Guard-Friar et al.41
Whereas for the less hydrated sample a transition tempera-ture around 25 °C is found. It is known from, e.g., Fouriertransform infrared spectroscopy FTIR spectroscopy42 thatdehydration increases the transition temperature. Followingthe procedure used by Pfeiffer et al.,30 we estimated the wa-ter content from the shift of the main phase transition tem-perature. We can extract the parameter Rw=nW /nA where Rw
expresses the molar ratio of water nW and amphiphilenA.30,42 The calculated Rw for the fully hydrated sample isRw12 and Rw9 for the less hydrated sample. Pfeiffer etal. found for DMPC multilayers a value of Rw12 for fully
0
0.2
0.4
0.6
0.8
1
0 5 10 15 20 25 30 35 40
270 275 280 285 290 295 300 305 310 315
summedintensities[a.u.]
temperature [°C]
temperature [K]
higher hydrated sampleless hydrated sample
FIG. 2. Plot of the normalized summed elastic intensity vs temperature forQ aligned parallel to the membrane surface. With decreasing water content,a shift in the temperature of the main phase transition is evident. Lines areguides to the eye.
164505-3 Hydration dependent dynamics of DMPC J. Chem. Phys. 133, 164505 2010
Author complimentary copy. Redistribution subject to AIP license or copyright, see http://jcp.aip.org/jcp/copyright.jsp

hydrated membranes.30 Therefore, the elastic measurementson IN13 provide a solid basis to characterize the system forthe quasielastic experiment at TOFTOF.
Due to the coherent scattering arising from the orderingof the lipid chains, below the main phase transition and therelatively broad Q resolution of IN13, only three detectorswere left to evaluate the mean square displacementsMSDs;43 therefore, it was not possible to obtain MSDs withreasonable error bars. A detailed comparison between themean square displacements and the summed intensities forDMPC is found elsewhere.44
B. Quasielastic data
A detailed description of the analysis of quasielastic neu-tron scattering data can be found in Bée.45 For applicationsin the context of lipid dynamics, see, e.g., Busch et al.,37 andfor water dynamics in lipid systems, see, e.g., Swensonet al.46
The obtained data are a convolution of the theoreticalscattering law StheoQ , and the instrumental resolutionSresQ , given by a measured vanadium sample,
SmeasQ , = StheoQ , SresQ , . 2
The theoretical scattering law can be expressed by a deltafunction for the elastic contribution and a sum of Lorentziansfor the quasielastic contributions coming from the dynamicsof the investigated sample.45 In our study, an elastic peak andtwo Lorentzian functions narrow and broad componentswere necessary to reasonably fit the obtained data. In Fig. 3the fits to the data are shown for two Q-values. The SQ , writes
StheoQ , = e−DWFA0Q + A1Q L11,
+ A2Q L22, . 3
e−DWF is the Debye–Waller factor according for vibrationalmotions, i represents the half width at half maximum ofeach Lorentzian, Ai is the corresponding amplitude with thenormalization A0+A1+A2=1. Keeping in mind that chain-deuterated lipids were used in our experiments, the narrowand the broad Lorentzians were associated with slow and fastmotions of the head groups, respectively. The geometry ofthe motion can be extracted from the EISF as defined in
EISFQ =A0Q
A0Q + A1Q + A2Q . 4
For both samples, the EISF does not decay to zero for largeQ-values, which indicates an immobile fraction in the exam-ined time-space window.
Two different models were applied to fit the EISFs. First,we used the “diffusion in a sphere” model introduced byVolino and Dianoux,47 where free diffusion in the restrictedvolume of a sphere is permitted. Bellissent-Funel andco-workers48 established as an addition to this model an im-mobile fraction. The corresponding EISF is described by
A0Q = p + 1 − p 3j1QaQa
2
, 5
where j1 is the first order spherical Bessel function of thefirst kind, a is the radius of the sphere, p denotes an immo-bile contribution, and 1− p is the corresponding mobilefraction.
A modification of the Volino/Dianoux model allows in-creasing radii for the diffusion volumes of the hydrogen at-oms along the head group see Eq. 6a. This model wasintroduced by Carpentier et al. for the study of dicoppertetrapalmitate49 and is described by
A0Q =1
Nn=1
N 3j1QRnQRn
2
6a
with
Rn =n − 1
N − 1 RN − R1 + R1. 6b
N stands for the total number of atoms in the chain to whichhydrogen atoms are bound in the case of this study N=3.The index n starts with the carbon atom the closest to theoxygen of the phosphorus group which connects the lipidchains with the head group and ends with the nitrogen of the
0.01
0.1
1
10
−1 −0.5 0 0.5 1
S(Q,ω)[a.u.]
energy [meV]
(a)
0.01
0.1
1
10
−1 −0.5 0 0.5 1
S(Q,ω)[a.u.]
energy [meV]
(b)
FIG. 3. Plot of SQ , for a Q=0.44 Å−1 and b Q=1.48 Å−1 at 5 °C.The resulting fit is shown black line as well as the single contributions.The delta function is drawn in the blue line; the two Lorentzians are plottedas green and pink lines, respectively.
164505-4 Trapp et al. J. Chem. Phys. 133, 164505 2010
Author complimentary copy. Redistribution subject to AIP license or copyright, see http://jcp.aip.org/jcp/copyright.jsp
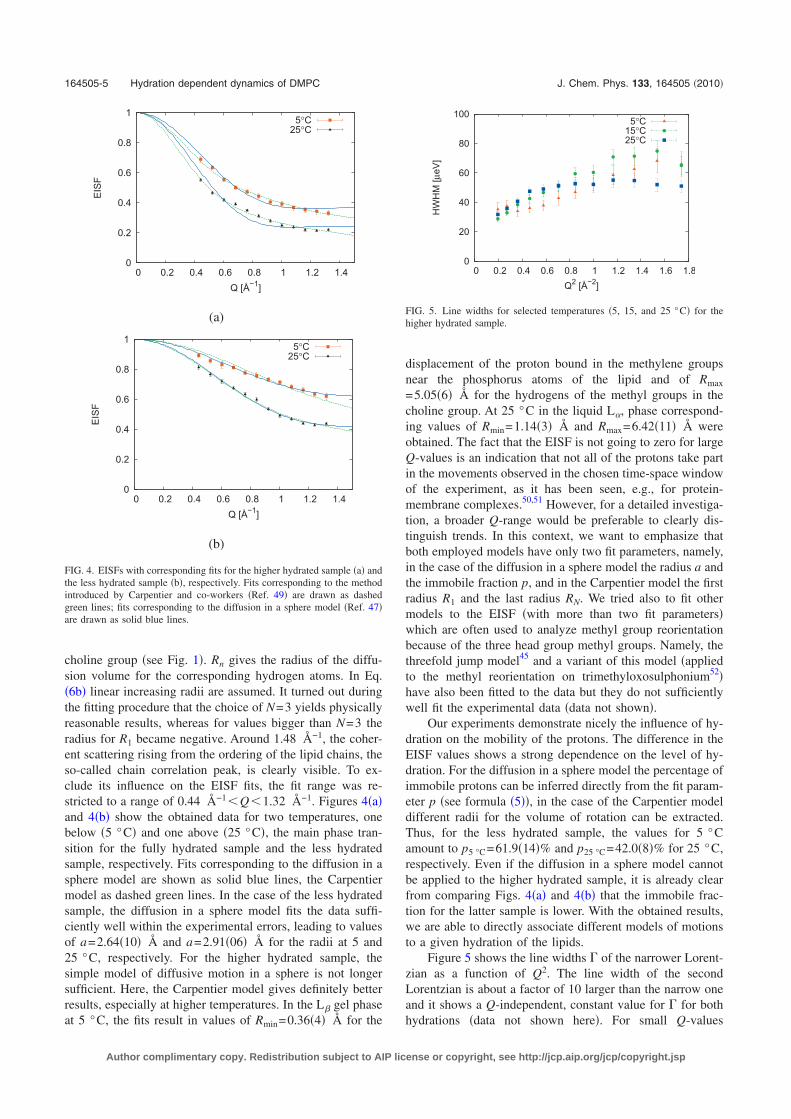
choline group see Fig. 1. Rn gives the radius of the diffu-sion volume for the corresponding hydrogen atoms. In Eq.6b linear increasing radii are assumed. It turned out duringthe fitting procedure that the choice of N=3 yields physicallyreasonable results, whereas for values bigger than N=3 theradius for R1 became negative. Around 1.48 Å−1, the coher-ent scattering rising from the ordering of the lipid chains, theso-called chain correlation peak, is clearly visible. To ex-clude its influence on the EISF fits, the fit range was re-stricted to a range of 0.44 Å−1Q1.32 Å−1. Figures 4aand 4b show the obtained data for two temperatures, onebelow 5 °C and one above 25 °C, the main phase tran-sition for the fully hydrated sample and the less hydratedsample, respectively. Fits corresponding to the diffusion in asphere model are shown as solid blue lines, the Carpentiermodel as dashed green lines. In the case of the less hydratedsample, the diffusion in a sphere model fits the data suffi-ciently well within the experimental errors, leading to valuesof a=2.6410 Å and a=2.9106 Å for the radii at 5 and25 °C, respectively. For the higher hydrated sample, thesimple model of diffusive motion in a sphere is not longersufficient. Here, the Carpentier model gives definitely betterresults, especially at higher temperatures. In the L gel phaseat 5 °C, the fits result in values of Rmin=0.364 Å for the
displacement of the proton bound in the methylene groupsnear the phosphorus atoms of the lipid and of Rmax
=5.056 Å for the hydrogens of the methyl groups in thecholine group. At 25 °C in the liquid L, phase correspond-ing values of Rmin=1.143 Å and Rmax=6.4211 Å wereobtained. The fact that the EISF is not going to zero for largeQ-values is an indication that not all of the protons take partin the movements observed in the chosen time-space windowof the experiment, as it has been seen, e.g., for protein-membrane complexes.50,51 However, for a detailed investiga-tion, a broader Q-range would be preferable to clearly dis-tinguish trends. In this context, we want to emphasize thatboth employed models have only two fit parameters, namely,in the case of the diffusion in a sphere model the radius a andthe immobile fraction p, and in the Carpentier model the firstradius R1 and the last radius RN. We tried also to fit othermodels to the EISF with more than two fit parameterswhich are often used to analyze methyl group reorientationbecause of the three head group methyl groups. Namely, thethreefold jump model45 and a variant of this model appliedto the methyl reorientation on trimethyloxosulphonium52have also been fitted to the data but they do not sufficientlywell fit the experimental data data not shown.
Our experiments demonstrate nicely the influence of hy-dration on the mobility of the protons. The difference in theEISF values shows a strong dependence on the level of hy-dration. For the diffusion in a sphere model the percentage ofimmobile protons can be inferred directly from the fit param-eter p see formula 5, in the case of the Carpentier modeldifferent radii for the volume of rotation can be extracted.Thus, for the less hydrated sample, the values for 5 °Camount to p5 °C=61.914% and p25 °C=42.08% for 25 °C,respectively. Even if the diffusion in a sphere model cannotbe applied to the higher hydrated sample, it is already clearfrom comparing Figs. 4a and 4b that the immobile frac-tion for the latter sample is lower. With the obtained results,we are able to directly associate different models of motionsto a given hydration of the lipids.
Figure 5 shows the line widths of the narrower Lorent-zian as a function of Q2. The line width of the secondLorentzian is about a factor of 10 larger than the narrow oneand it shows a Q-independent, constant value for for bothhydrations data not shown here. For small Q-values
0
0.2
0.4
0.6
0.8
1
0 0.2 0.4 0.6 0.8 1 1.2 1.4
EISF
Q [Å−1]
5°C25°C
(a)
0
0.2
0.4
0.6
0.8
1
0 0.2 0.4 0.6 0.8 1 1.2 1.4
EISF
Q [Å−1]
5°C25°C
(b)
FIG. 4. EISFs with corresponding fits for the higher hydrated sample a andthe less hydrated sample b, respectively. Fits corresponding to the methodintroduced by Carpentier and co-workers Ref. 49 are drawn as dashedgreen lines; fits corresponding to the diffusion in a sphere model Ref. 47are drawn as solid blue lines.
0
20
40
60
80
100
0 0.2 0.4 0.6 0.8 1 1.2 1.4 1.6 1.8
HWHM[μeV]
Q2 [Å−2]
5°C15°C25°C
FIG. 5. Line widths for selected temperatures 5, 15, and 25 °C for thehigher hydrated sample.
164505-5 Hydration dependent dynamics of DMPC J. Chem. Phys. 133, 164505 2010
Author complimentary copy. Redistribution subject to AIP license or copyright, see http://jcp.aip.org/jcp/copyright.jsp

Q→0, the data do not go to zero as for free diffusion, thenthey increase and asymptotically reach a constant value
for large Q. A constant value at small Q was assigned byVolino and Dianoux47 to a confinement effect at large radii.A similar behavior is assumed and has also been observed byCarpentier et al.49
However, we find a discrete kink only for the lowestmeasured temperature red points in Fig. 5. At this tempera-ture, the confinement radius Rconf obtained from the cross-over of the two regimes at a Q2-value of about 0.55 Å−1
following formula 7 was calculated to be 4.2 4 Å. Thesevalues are in between Rmin and Rmax obtained from the EISFfits for the corresponding sample at 5 °C and therefore con-sistent with these values,
Q =
Rconf. 7
No pronounced plateau is visible for higher temperatures, buta which does not decay to zero for small Q values is stillan indication for restricted motion as it has also been ob-served for proteins.53,54 As we find several radii for the dif-fusion volumes in the Carpentier model, a superposition ofdifferent kinks leads to the observed behavior, especially athigh temperatures. At larger Q-values, the line width fol-lows the “random jump diffusion” model.55
As for the EISF also for the line width, the influence ofthe coherent scattering arising from the chain orderingaround Q=1.48 Å−1 occurs below the main phase transition,whereas for 25 °C the predicted plateau is observed. There-fore, the data are drawn in the same range as for the EISF.
V. CONCLUSIONS
In the present study, we have investigated the hydrationdependent behavior of model membrane systems above andbelow the main phase transition of DMPC with a focus onthe head group motion. In contrast to existing studies, wetook explicitly into account the hydration effect on the dy-namics of model membrane systems. Therefore, we wereable to directly associate different models for the motions ofthe hydrogen atoms in the head group to different hydrationlevels. The elastic temperature scans show a strong depen-dence on the hydration: the phase transition temperature islower related to a higher mobility of the head groups in theL phase at full hydration compared to the less hydratedsample. The type of head group motions possible in the dif-ferent samples has been probed in more detail by the per-formed QENS studies. Here, the hydration influence in theobserved time and space window is clearly translated by thedifferent models necessary to fit the obtained elastic incoher-ent structure factor for the different hydrations and the result-ing radii. In summary, this study has shown that hydration oflipid bilayers plays a major role in understanding the dynam-ics of these kinds of systems and should always be properlycharacterized when dealing with samples containing lipids.
ACKNOWLEDGMENTS
The authors thank F. Natali and S. Busch for the fruitfuldiscussions. M. Trapp was supported by a Ph.D. scholarship
from the French Ministry for Research and Technology. Thisresearch project has been supported by the European Com-mission under the Sixth Framework Program through theKey Action: Strengthening the European Research Area, Re-search Infrastructures Contract No. RII3-CT-2003-5059825. We acknowledge the ILL and the FRM II for theallocation of beamtime and the financial support from theAccess to Major Research Facilities Program which is acomponent of the International Science Linkages Programestablished under the Australian Government’s innovationstatement, Backing Australia’s Ability.
1 J. Fitter, S. A. W. Verclas, R. E. Lechner, H. Seelert, and N. A. Dencher,FEBS Lett. 433, 321 1998.
2 J. Zanotti, M.-C. Bellissent-Funel, and J. Parello, Biophys. J. 76, 23901999.
3 F. Gabel, D. Bicout, U. Lehnert, M. Tehei, M. Weik, and G. Zaccai, Q.Rev. Biophys. 35, 327 2002.
4 J. Roh, J. Curtis, S. Azzam, V. Novikov, I. Peral, Z. Chowdhuri, R.Gregory, and A. Sokolov, Biophys. J. 91, 2573 2006.
5 J. Pieper, T. Hauß, A. Buchsteiner, and G. Renger, Eur. Biophys. J. 37,657 2008.
6 K. Wood, U. Lehnert, B. Kessler, G. Zaccai, and D. Oesterhelt, Biophys.J. 95, 194 2008.
7 P. J. Steinbach and B. Brooks, Proc. Natl. Acad. Sci. U.S.A. 90, 91351993.
8 M. Tarek and D. J. Tobias, Phys. Rev. Lett. 88, 138101 2002.9 C.-J. Högberg and A. P. Lyubartsev, J. Phys. Chem. B 110, 143262006.
10 T. Heimburg, Thermal Biophysics of Membranes Wiley-VCH, Wein-heim, Germany, 2007.
11 G. S. Smith, E. B. Sirota, C. R. Safinya, and N. A. Clark, Phys. Rev. Lett.60, 813 1988.
12 W. Pfeiffer, T. Henkel, E. Sackmann, W. Knoll, and D. Richter EPL 8,201 1989.
13 S. König, W. Pfeiffer, T. Bayerl, D. Richter, and E. Sackmann, J. Phys. IIFrance 2, 1589 1992.
14 S. König, T. M. Bayerl, G. Coddens, D. Richter, and E. Sackmann, Bio-phys. J. 68, 1871 1995.
15 M. Rheinstädter, J. Das, E. Flenner, B. Brüning, T. Seydel, and I. Kosz-tin, Phys. Rev. Lett. 101, 248106 2008.
16 Structure and Dynamics of Membranes, Handbook of Biological PhysicsVol. 1, edited by R. Lipowsky and E. Sackmann Elsevier, Amsterdam,The Netherlands, 1995.
17 M. C. Rheinstädter, C. Ollinger, G. Fragneto, F. Demmel, and T. Salditt,Phys. Rev. Lett. 93, 108107 2004.
18 M. C. Rheinstädter, W. Häußler, and T. Salditt, Phys. Rev. Lett. 97,048103 2006.
19 A. A. Nevzorov and M. F. Brown, J. Chem. Phys. 107, 10288 1997.20 S. König, E. Sackmann, D. Richter, R. Zorn, C. Carlile, and T. M. Bayerl,
J. Chem. Phys. 100, 3307 1994.21 S. H. Chen, C. Y. Liao, H. W. Huang, T. M. Weiss, M.-C. Bellisent-Funel,
and F. Sette, Phys. Rev. Lett. 86, 740 2001.22 B. Klösgen, C. Reichle, S. Kohlsmann, and K. Kramer, Biophys. J. 71,
3251 1996.23 E. Y. Shalaev and P. L. Steponkus, J. Phys. Chem. B 107, 8734 2003.24 R. Hirn, T. M. Bayerl, J. O. Rädler, and E. Sackmann, Faraday Discuss.
111, 17 1999.25 C. Eggeling, C. Ringemann, R. Medda, G. Schwarzmann, K. Sandhoff, S.
Polyakova, V. Belov, B. Hein, C. von Middendorff, A. Schonle, and S.Hell, Nature London 457, 1159 2009.
26 M. Doxastakis, V. G. Sakai, S. Ohtake, J. K. Maranas, and J. J. de Pablo,Biophys. J. 92, 147 2007.
27 U. Lehnert, V. Réat, M. Weik, G. Zaccaï, and C. Pfister, Biophys. J. 75,1945 1998.
28 V. F. Sears, Neutron News 3, 26 1992.29 L. Ding, T. Weiss, G. Fragneto, W. Liu, L. Yang, and H. Huang, Lang-
muir 21, 203 2005.30 H. Pfeiffer, H. Binder, G. Klose, and K. Heremans, BBA-Biomembranes
1609, 148 2003.31 See http://www.ill.eu/d16/.
164505-6 Trapp et al. J. Chem. Phys. 133, 164505 2010
Author complimentary copy. Redistribution subject to AIP license or copyright, see http://jcp.aip.org/jcp/copyright.jsp

32 See supplementary material at http://dx.doi.org/10.1063/1.3495973 forthe diffraction data taken on D16 to evaluate the repeat distance andmosaicity of the aligned multilayer samples.
33 N. Kucerka, Y. Liu, N. Chu, H. I. Petrache, S. Tristram-Nagle, and J. F.Nagle, Biophys. J. 88, 2626 2005.
34 F. Natali, J. Peters, D. Russo, S. Barbieri, C. Chiapponi, A. Cupane, A.Deriu, M. T. Di Bari, E. Farhi, Y. Gerelli, P. Mariani, A. Paciaroni, C.Rivasseau, G. Schiró, and F. Sonvico, Neutron News 19, 14 2008.
35 See http://www.ill.eu/instruments-support/computing-for-science/cs-software/all-software/lamp/.
36 T. Unruh, J. Neuhaus, and W. Petry, Nucl. Instrum. Methods Phys. Res. A580, 1414 2007.
37 S. Busch, C. Smuda, L. C. Pardo, and T. Unruh, J. Am. Chem. Soc. 132,3232 2010.
38 See http://sourceforge.net/projects/frida/.39 See http://www.ncnr.nist.gov/dave.40 B. Frick and L. J. Fetters, Macromolecules 27, 974 1994.41 D. Guard-Friar, C. H. Chen, and A. S. Engle, J. Phys. Chem. 89, 1810
1985.42 H. Pfeiffer, H. Binder, G. Klose, and K. Heremans, BBA-Biomembranes
1609, 144 2003.43 J. C. Smith, Q. Rev. Biophys. 24, 227 1991.44 M. Trapp, F. Juranyi, M. Tehei, L. van Eijck, B. Demé, T. Gutberlet, and
J. Peters, Spectroscopy 24, 461 2010.45 M. Bée, Quasielastic Neutron Scattering: Principles and Applications in
Solid State Chemistry, Biology and Materials Science Adam Hilger,Philadelphia, 1988.
46 J. Swenson, F. Kargl, P. Berntsen, and C. Svanberg, J. Chem. Phys. 129,045101 2008.
47 F. Volino and A. J. Dianoux, Mol. Phys. 41, 271 1980.48 M.-C. Bellissent-Funel, J. Teixeira, K. Bradley, and S. H. Chen, J. Phys.
I France 2, 995 1992.49 L. Carpentier, M. Bée, A. M. Giroud-Godquin, P. Maldivi, and J. C.
Marchon, Mol. Phys. 68, 1367 1989.50 F. Natali, A. Relini, A. Gliozzi, R. Rolandi, P. Cavatorta, A. Deriu, A.
Fasano, and P. Riccio, Chem. Phys. 292, 455 2003.51 F. Natali, A. Relini, A. Gliozzi, R. Rolandi, P. Cavatorta, A. Deriu, A.
Fasano, and P. Riccio, Physica B 350, E623 2004.52 M. Bée, H. Jobic, and C. Sourisseau, J. Phys. C 18, 5771 1985.53 M. Tehei, J. Smith, C. Monk, J. Ollivier, M. Oettl, V. Kurkal, J. Finney,
and R. Daniel, Biophys. J. 90, 1090 2006.54 Z. Bu, D. A. Neumann, S.-H. Lee, C. M. Brown, D. M. Engelman, and C.
C. Han, J. Mol. Biol. 301, 525 2000.55 P. A. Egelstaff, An Introduction to the Liquid State Academic Press, New
York, 1967.
164505-7 Hydration dependent dynamics of DMPC J. Chem. Phys. 133, 164505 2010
Author complimentary copy. Redistribution subject to AIP license or copyright, see http://jcp.aip.org/jcp/copyright.jsp

APPENDIX D. ARTICLES XXIII
D.3 Dynamics of model membranes
In the following a chapter for the e-book entitled “Dynamics of Biologi-cal Macromolecules by Neutron Scattering” is presented (editors SalvatoreMagazú and Federica Migliardo). I contributed to this review section 4about the hydration influence on membranes.

1
DYNAMICS OF MODEL MEMBRANES F. Natali1 and M. Trapp2 1CNR-INFM, OGG, c/o Institut Laue-Langevin, Grenoble, FR-38000, France 2Institut de Biologie Structurale J.-P. Ebel, UMR 5075, CNRS-CEA-UJF, Grenoble, FR-38027, France Abstract Biological membranes are complex multicomponent systems whose dynamics and structure provide their physiological function. Many parameters interplay to determine the membrane flexibility; among them, lipid composition, lipid-protein interaction, hydration, temperature etc. We provide here a tentative overview of recent successful neutron scattering experiments on different oriented model membranes, with the aim to demonstrate the many unique advantages that elastic and quasi-elastic neutron scattering offer for the investigation of membrane dynamics. Introduction Membranes are fundamental elements of all living cells, performing important active functions controlling transport of molecules and ions across them. The lipid bilayer itself is a complicated multicomponent system made up of about 100 different lipids, differing in the hydrocarbon chain and in the polar head groups. Structural properties of these bilayers are very important for their functional activity and have been investigated in detail [1]. Much less is known on bilayer dynamics. On the other hand, it is well acknowledged that the different kinds of motions of the lipid chains are of paramount importance for the physiological function of membranes and those motions can be modulated by a number of factors like lipidic composition and protein interactions. It is commonly accepted that at least six different lipid movements can be observed in oriented membranes, characterized by specific time scale windows [2]. In the 10-11-10-8 s range the chain defect motions and the rotational diffusion about the lipid molecular axis and the chain defect motions can be observed. In the latter, the lipid chain oscillates forming an angle θ with respect to the molecule axis, along the normal to the membrane plane (wobbling motion). The origin of this kind of motion is still not completely understood and could be due to a fluctuating cis-trans isomerization of the acyl chains emphasized when membrane defects, such as holes due to a missing or not complete lipid, appear. On the other hand, the 10-10 – 10-9 s time scale is characterized by the exhibition of the vertical (i.e. parallel to the membrane normal) vibrational motion of the lipid molecules. At lower times, lateral diffusion in the bilayer plane (10-9 s) and rotational and flip flop motion of the lipid head groups (3×10⁻⁹ s), take place. Finally, much slower membrane dynamics is promoted by the collective modulations of the bilayers, which, observed in the s time scale, conferees the membrane roughness.

2
Incoherent neutron scattering is a powerful technique to investigate dynamics of biological molecules, which are characterized by a extremely high hydrogen content, representing at least half of the total number of atoms of the system. In fact, the hydrogen incoherent neutron scattering cross section is about an order of magnitude larger than that of other atomic species typically present in biological systems. Thus, incoherent neutron scattering provides averaged information on the global dynamics of the system. In particular, elastic (ENS) and quasi-elastic incoherent neutron scattering (QENS) have been already demonstrated to represent an optimal tool to provide unique information on lipid dynamics [3-5]. For these measurements, highly ordered samples are required in order to allow selection of the direction of momentum transfer with respect to the membrane normal, and therefore separation of in-plane and out-of-plane motions (Fig. 1).
Fig. 1: By rotating the sample with respect to the incoming beam, the momentum transfer is predominantly oriented parallel (135°, panel a) and perpendicular to the membrane surface (45°, panel b) This is achieved using oriented lipid multilayer obtained drying a thin layer of liposome suspension on a solid support, typically SiO2 polished wafers. We report here few selected examples of the investigation of dynamical properties of different membrane model systems. 1. Effect of Myelin Basic Protein on the Dynamics of Oriented Lipid Bilayers Myelin is the discontinuous multibilayer membrane sheath wrapped around the nerve axon. The integrity of the myelin sheath is fundamental to optimize the action potential conduction along spike in the axon [6,7], while stacking disorder causes severe diseases like multiple sclerosis. It contains proteins which are believed to play an important role in maintaining the membrane stack order [8-11]. Among them, the Myelin Basic Protein (MBP) is the second most abundant myelin protein that counts for up to 30% of the total protein fraction in the Central Nervous System (CNS) [12]. MBP is an extrinsic protein that, when removed from its native environment in the membrane and isolated in the water-soluble form, appears as an extended, flexible, irregular coil having little secondary structure [8,13]. However, several studies have
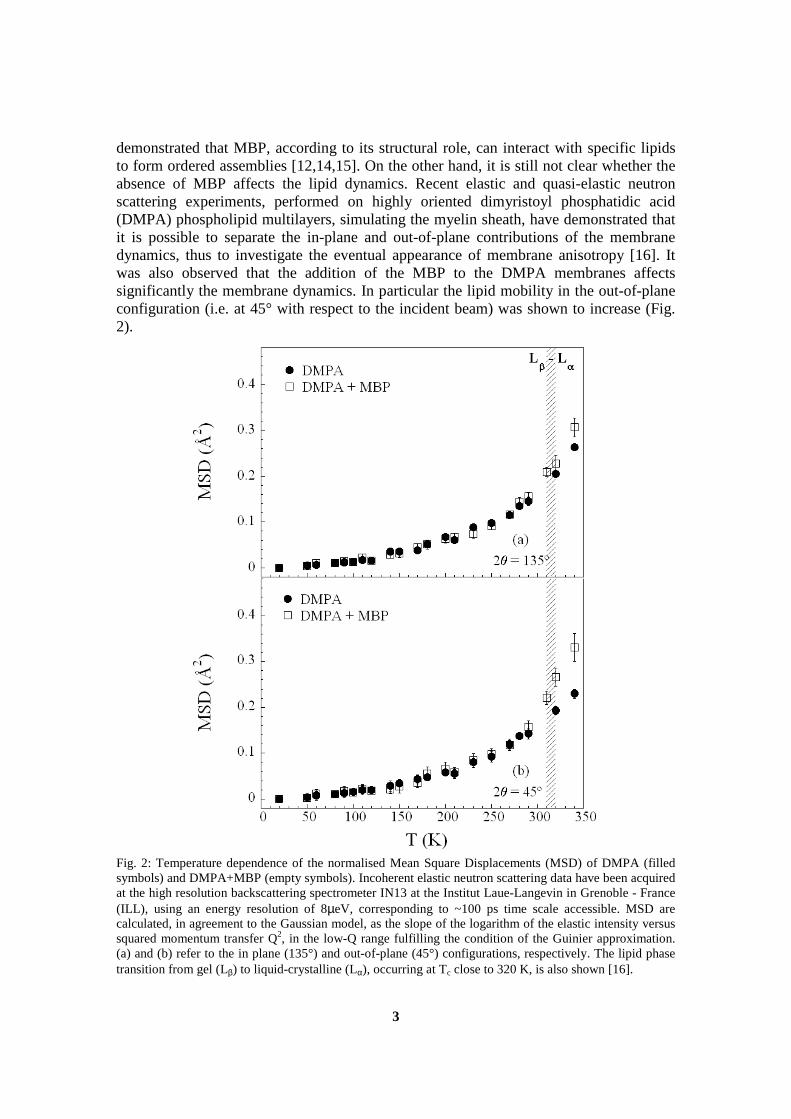
3
demonstrated that MBP, according to its structural role, can interact with specific lipids to form ordered assemblies [12,14,15]. On the other hand, it is still not clear whether the absence of MBP affects the lipid dynamics. Recent elastic and quasi-elastic neutron scattering experiments, performed on highly oriented dimyristoyl phosphatidic acid (DMPA) phospholipid multilayers, simulating the myelin sheath, have demonstrated that it is possible to separate the in-plane and out-of-plane contributions of the membrane dynamics, thus to investigate the eventual appearance of membrane anisotropy [16]. It was also observed that the addition of the MBP to the DMPA membranes affects significantly the membrane dynamics. In particular the lipid mobility in the out-of-plane configuration (i.e. at 45° with respect to the incident beam) was shown to increase (Fig. 2).
Fig. 2: Temperature dependence of the normalised Mean Square Displacements (MSD) of DMPA (filled symbols) and DMPA+MBP (empty symbols). Incoherent elastic neutron scattering data have been acquired at the high resolution backscattering spectrometer IN13 at the Institut Laue-Langevin in Grenoble - France (ILL), using an energy resolution of 8µeV, corresponding to ~100 ps time scale accessible. MSD are calculated, in agreement to the Gaussian model, as the slope of the logarithm of the elastic intensity versus squared momentum transfer Q2, in the low-Q range fulfilling the condition of the Guinier approximation. (a) and (b) refer to the in plane (135°) and out-of-plane (45°) configurations, respectively. The lipid phase transition from gel (Lβ) to liquid-crystalline (Lα), occurring at Tc close to 320 K, is also shown [16].

4
Moreover, the lipids are known to exhibit a complex temperature-dependent phase diagram, with at least two phase transitions from crystalline (Lc-phase), to gel (Lβ-phase), and then to liquid crystalline (Lα-phase) structures, reflecting different degrees of disorder. The transition from gel to liquid-crystalline phase (Lβ Lα) in saturated lipids normally occurs at temperatures around Tc ~ 320 K, depending on the membrane composition. Thus, the observed enhanced lipid flexibility in DMPA+MBP at T > 310 K (Fig. 2), that leads to higher MSD values, could be assigned to the effect of the membrane structural modification occurring across the lipid phase transition. Moreover, the out-of-plane membrane dynamics is markedly characterized by spatially restricted vertical diffusive motions of the lipids, significantly enhanced by the MBP above the gel to liquid crystalline (Lβ Lα) DMPA phase transition (Fig.3). On the other hand, the in-plane dynamics seems to involve predominantly the spatially restricted lateral diffusion of the lipids on the membrane surface that appears to be only slightly affected by the presence of the MBP.
Fig. 3: Q dependence of the Elastic Incoherent Structure Factor (EISF) of DMPA and DMPA+MBP, measured in the Lα liquid phase (T = 340 K) and at both geometrical configurations (135° and 45°). Incoherent quasi-elastic neutron data have been acquired at the IN16 backscattering spectrometer at ILL, using an energy resolution of 0.9µeV, corresponding to ~2 ns time scale accessible. The presence of an EISF indicates that the observed motions have a localized diffusive nature. The EISF values at high-Q show a tendency to an asymptotic non-zero value (close to 0.5), suggeststing that about 50% of the hydrogen contributing to the spectrum perform only fast vibrational motions and do not contribute to the quasi-elastic part of the spectrum.

5
2. Dynamics of lipoplex-DNA gene vectors Human gene therapy is defined as the transfer of nucleic acids to somatic cells of a patient providing a therapeutic effect [17,18]. Among the non-viral carriers, cationic liposomes (CL) attract a significant interest because of their unique properties and their efficiency in acting as vehicles for DNA delivery into eukariotic cells [18,19]. Many theoretical and experimental studies have been performed [20-24] to understand the factors governing the energetic, structural, and thermodynamic characteristics of CL-DNA complexes; these properties, strongly influenced by the specific composition of lipoplexes, are essential for optimizing their transfection efficiency. The cationic lipoplexes are normally constituted by the mixture of a neutral (helper) lipid and a charged lipid; the former determines a given structure (in particular lamellar or hexagonal geometry), whereas the latter is fundamental for delivering the genes into the cell [22,23-30]. The direct interaction of the positively charged lipid headgroup with the negatively charged phosphate of the DNA backbone is suggested by many authors to be the main mechanism for the complexation of DNA with cationic lipids [26,28]. This is also supported by both fluorescence techniques and differential scanning calorimetry [25] suggesting that the release of bound water and counterions is the driving force behind complex formation [26]. Besides, Choosakoonkriang and coworkers suggest that complexation with DNA induces a small increase in the disordered conformation of the lipid alkyl chain, altering the packing of the lipid (due to the alignment of the lipid headgroup with the DNA phosphate) and determining a greater fluidity of the apolar region of the membrane [27,28]. Unfortunately, very few studies have been performed on the dynamics of CLs-DNA systems to date; among them, is the recent investigation of highly oriented lamellar CLs-DNA complexes consisting of calf thymus DNA added to 1:1 ratio binary mixtures of cationic monovalent lipid DOTAP (dioleoyl trimethylammonium propane) and the neutral helper lipid DOPC (dioleoyl phosphatidylcholine), both lipids having two 18-carbon (C18) aliphatic chains per molecule [31]. The membrane dynamics is shown to be strongly dependent on the cationic lipid/DNA molar weight ratio ρ (Fig. 4). Indeed, CLs-DNA at the isoelectric point (Fig. 4, panel c), displays a marked anisotropy in the mean square displacements. In particular, higher dynamics is observed in the out-of-plane configuration. The main result is that a minimum amount of DNA phosphate groups is not sufficient to induce modifications in membrane dynamics. On the other hand, at the isoelectric point, the balance of the total net charge inside the complex, together with the displacement of bound water molecules into solution (accompanied by counterion release), provides new degrees of freedom to the lipoplex, enhancing the apolar region fluidity and resulting in a very large increase of the out-of-plane lipid motions, mainly assigned to spatially confined vertical translation of the entire lipid molecule. An exhaustive description of the results, together with a proposed model to interpret the data, is reported elsewhere [31].

6
Fig. 4: Normalised MSD of the CLs-DNA mixed multilayers vs. T, as a function of the cationic lipid/DNA molar weight ratio ρ. Panel a: pure lipids (ρ=0); panel b: excess of liposomes (ρ=4); panel c: isoelectric point (ρ=ρiso=2.2). Open squares: out-of-plane direction; filled circles: in-plane direction. Incoherent elastic neutron scattering data have been acquired at IN13-ILL, with an energy resolution of 8µeV [31].
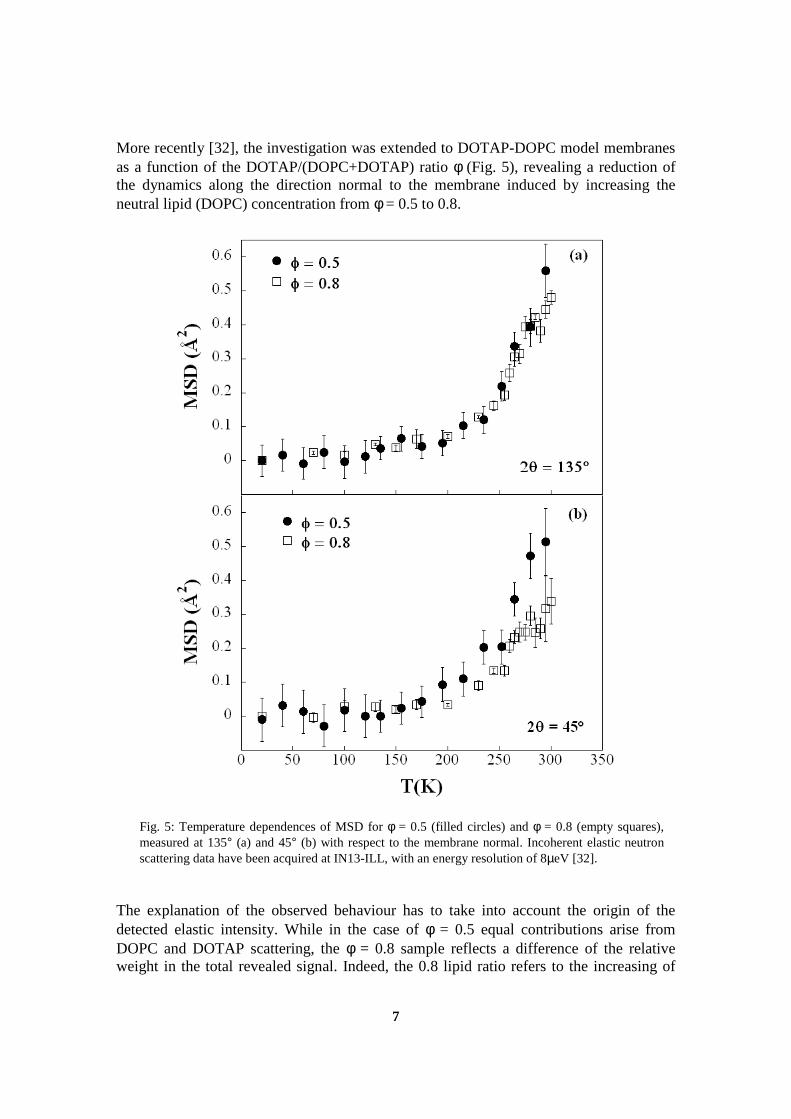
7
More recently [32], the investigation was extended to DOTAP-DOPC model membranes as a function of the DOTAP/(DOPC+DOTAP) ratio φ (Fig. 5), revealing a reduction of the dynamics along the direction normal to the membrane induced by increasing the neutral lipid (DOPC) concentration from φ = 0.5 to 0.8.
Fig. 5: Temperature dependences of MSD for φ = 0.5 (filled circles) and φ = 0.8 (empty squares), measured at 135° (a) and 45° (b) with respect to the membrane normal. Incoherent elastic neutron scattering data have been acquired at IN13-ILL, with an energy resolution of 8µeV [32].
The explanation of the observed behaviour has to take into account the origin of the detected elastic intensity. While in the case of φ = 0.5 equal contributions arise from DOPC and DOTAP scattering, the φ = 0.8 sample reflects a difference of the relative weight in the total revealed signal. Indeed, the 0.8 lipid ratio refers to the increasing of

8
DOPC concentration of a factor of 4 with respect to the DOTAP. Thus, being the density cross section comparable for the lipids, in the φ = 0.8 case the 80 % contribution to the total signal is assigned to the DOPC, while only 20 % arises from DOTAP. On the other hand, DOPC has greater hydrophilic heads, characterized by the presence of a phosphate PO4
- group not present in the cationic DOTAP where there is only the aminic one NH3
+. Thus, the decrease of the out-of-plane mean square displacements correlated to the increasing DOPC concentration may be interpreted in terms of more localized vertical diffusion due to less free space accessible (Fig. 6).
Fig. 6. Schematic representation of the DOTAP+DOPC oriented lipid mixture. The greater occupation of the interbilayer free space assigned to the DOPC, is evident. Moreover, the φ independent in-plane dynamics confirms that the key-role in the changes of membrane dynamics is mainly governed by the different size of the lipid heads. 3. The dynamics of the gangliosides in bilayer domains Many macromolecules of biological relevance are characterized by the presence of sugar moieties with different degrees of complexity. A particular class of sugar-containing molecules is that of gangliosides, glycosphingolipids abundant in neuronal plasma membranes, which are believed to play a role in a number of cellular functions, including cell recognition, adhesion, regulation, signal transduction, and development of tissues. They are predominantly located on the outer leaflet of the membrane and may act to protect the membrane from harsh conditions such as low pH or degradative enzymes [33, 34]. Ganglioside are amphiphilic molecules constituted of a ceramide and a saccharidic headgroup including one or more charged sugars (sialic acid). The mechanical properties and biological functions of gangliosides are strongly dependent on the behaviour of the lipids to which they are bound [35-38]. The properties of lipids are then likely to be strongly affected by the microdomain presence and arrangement.

9
One of the most commonly studied gangliosides is galactosyl-Nacetylgalactosaminyl(N-acetyl-neuraminyl)galactosylglucosylceramide (GM1) [39]. GM1 is a member of the glycosphingolipids family and contains four neutral sugar residues and a negatively charged sialic acid residue. The glycolipid monosialoganglioside GM1 is widely distributed in all tissues and reaches its highest concentrations in the central nervous system. It is primarily located in the outer surface of the mammalian cell’s plasma membrane and in synaptic membranes of the CNS. GM1 ganglioside modulates a number of cell surface and receptor activities as well as neuronal differentiation and development, protein phosphorilation and synaptic function. Recently the formation of ganglioside GM1-rich domains in monolayers and bilayers is an area of increased scientific interest. In particular, specialized membrane domains composed of phospholipids, glycolipids, and cholesterol-so called lipid rafts-are thought to play a role in a diverse range of processes ranging from membrane trafficking to signaling through specific membrane protein interactions where the raft microdomain acts as a platform for various cellular events [40-48]. The first investigation on the dynamics of low-hydration lamellar systems containing gangliosides concerned the effect induced by the presence of minority amount of GM1 molecules on the dynamics of oriented lamellar DMPC assemblies deposited on Si flat substrate [49]. A strong gap in the incoherent elastic neutron intensity, measured on IN13 at ILL, was observed across the gel-to-liquid lipid phase transition region (Tc ~ 320K, at the given membrane hydration) (Fig. 7).

10
Fig. 7: Normalised elastic intensity of in-plane DMPC vs. Q2, measured on IN13-ILL. Temperatures from 30 K to 350 K are reported. High temperature data points at high Q values are omitted for clarity, due to the large error bars associated to the low signals recorded [49]. Below the lipid phase transition, the in-plane lipid dynamics is sensibly increased upon addition of GM1, while a strong reduction of the out of plane mobility is observed across the phase transtion (data not shown, publication in progress, [49]). At a glance, the presence of GM1 results in a clear increase in anisotropy, damping the mean square displacement in out-of-plane direction a T > Tc, and in a kink mainly affecting the in-plane curve at temperatures slightly lower than 300 K, as if a double process is taking place. The presence of domains enriched in gangliosides could provide the clue for a reasonable interpretation of these results. Moreover, the present results would support the hypothesis, drawn on the basis of past experiments with various techniques evidencing their ability to establish an extended network of interactions, that gangliosides play a central role in the coordination of the structure and dynamics of their environment. 4. Influence of hydration on the dynamics of model membrane systems
Biological membranes are composed not only of different kinds of lipids but also of membrane proteins and molecules like e.g. cholesterol and ethanol. Lipid membranes consisting of only one type of lipid such as 1,2-Dimyristoyl-sn-Glycero-3-Phosphocholine (DMPC) serve as role models for their more complex counterparts in biological systems. The phase behaviour is strongly dependent on the hydration level of the membranes [50]. Inelastic neutron scattering (INS) [51], quasi elastic neutron scattering (QENS) [2,52-53] and neutron spin echo spectroscopy (NSE) [54] have already been employed to study local as well as collective dynamics of these membranes. However, most of these studies lack a systematic investigation of the behaviour of the model membranes in dependence on their hydration. By hydrating the mulilayer stack using pure D2O or saturated salt solutions, the relative humidity (rh) can be adjusted and thus the level of hydration of the membranes. From structural investigations [50] it is known that a lower degree of hydration causes a shift of the main phase transition to higher temperatures. As a result of the lower water content the repeating distance of the bilayers is reduced. The effect can be seen e.g. by neutron diffraction as a shift in the distance of the Bragg peaks originating from the lipid bilayers as shown in Fig. 8. Via the relation d=λ/2*sin(θ) (λ=neutron wavelength, θ=scattering angle) the repeating distance d can easily be calculated. For a fully hydrated DMPC bilayer the d-spacing lies in the order of 63 Ångstroms [55]. While the influence of the hydration on the structural properties of the membranes is well investigated, the knowledge about this influence on the lipid dynamics of these model systems is rather poor. From quasi-elastic neutron scattering investigations on pure lipid multilayer systems, the diffusive motions of lipids within the bilayer have been estimated. Consistent values for the diffusion constant in the order of D=11*10-10 m2/s [51-53] have been obtained. However, none of them take into account hydration effects.

11
Fig. 8: Diffraction data taken on D16 at ILL to evaluate the d-spacing for two samples with different hydrations levels [56]. Open squares: 100 % rh (pure D2O atmosphere); filled diamonds: 75% rh (D2O in saturated NaCl salt solution). The experimental d-spacing are 62.5 Å and 54.9 Å, respectively [56]. Only recently, a neutron scattering investigation, performed on highly oriented DMPC multibilayers, at two different rh levels, enhanced the strong influence of hydration effect on the membrane dynamics [56] (Fig. 9). The investigated temperature range covers both the main phase transition from the Pβ ripple to the liquid-crystalline Lα phase which occurs around 296K for DMPC, at the hydration here investigated, and also the pre-transition from the Lβ gel phase to the Pβ ripple phase about 10 degrees below the main phase transition. The higher hydrated sample (100 % rh) shows a clear bend at the main lipid phase transition around 300K, in agreement with an increased mobility of the alkyl chain in the liquid phase, whereas a clear shift of the phase transition temperatures for the less hydrated sample (75 % rh) is evident.
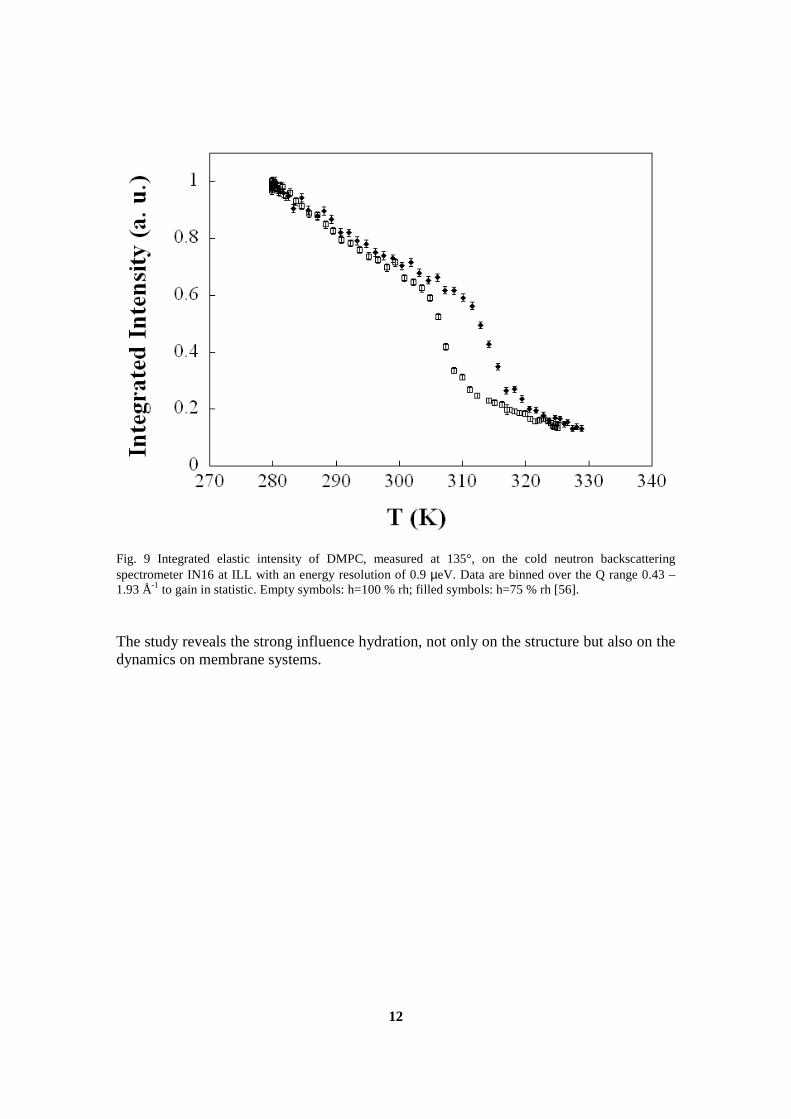
12
Fig. 9 Integrated elastic intensity of DMPC, measured at 135°, on the cold neutron backscattering spectrometer IN16 at ILL with an energy resolution of 0.9 µeV. Data are binned over the Q range 0.43 – 1.93 Å-1 to gain in statistic. Empty symbols: h=100 % rh; filled symbols: h=75 % rh [56]. The study reveals the strong influence hydration, not only on the structure but also on the dynamics on membrane systems.

13
References [1] Henkel T, Mittler S, Pfeiffer W, Rotzer H, Apell HJ, Knoll W. Lateral order in
mixed lipid bilayers and its influence on ion translocation by gramicidin: a model for the structure-function relationship in membranes. Biochimie 1989; 71: 89-98.
[2] Pfeiffer W, Henkel TH, Sackmann E, Knoll W, Richter D. Local Dynamics of Lipid Bilayers Studied by Incoherent Quasi-Elastic Neutron Scattering. Europhys Lett 1989; 8: 201-6.
[3] Deriu, A. 1993. The power of quasielastic neutron scattering to probe biophysical systems. Phys. Rev. B. 183:331–342
[4] Doster, W., S. Cusack, and W. Petry. 1989. Dynamical transition of myoglobin revealed by inelastic neutron scattering. Nature. 337:754–756.
[5] Zaccai, G. 2000. How soft is a protein? A protein dynamics force constant measured by neutron scattering. Science. 288:1604–1607.
[6] Martenson RE. Myelin: Biology and Chemistry, CRC Press, Boca Raton, 1992.
[7] Luzzati V, Mateu L. Order-disorder phenomena in myelinated nerve sheaths. I. A physical model and its parametrization: exact and approximate determination of the parameters. J Mol Biol 1990; 215: 373-84.
[8] Smith R. The basic protein of CNS myelin: its structure and ligand binding. J Neurochem 1992; 59: 1589-608.
[9] Riccio P, Masotti L, Cavatorta P, De Santis A, Juretic D, Bobba A, Pasquali-Ronchetti I, Quagliarello E. Myelin basic protein ability to organize lipid bilayers: structural transition in bilayers of lysophosphatidylcholine micelles. Biochem Biophys Res Commun 1986; 134: 313-9.
[10] Carnegie PR, Dunkley PR, in: B.W. Agranoff, M.H. Aprison (Eds.), Advances in Neurochemistry, Plenum Press, New York, 1975..
[11] Omlin FX, deH. Webster F, Palkovits CG, Cohen S. Immunocytochemical localization of basic protein in major dense line regions of central and peripheral myelin. J Cell Biol 1982; 95: 242-8.
[12] Boggs MJ. Lipid–Protein Interactions, P.C. Jost, O.H. Griffith 2, 1982.
[13] Inouye H, Karthigasan J, Kirschner DA. Membrane structure in isolated and intact myelins. Biophys J 1989; 56: 129-37.
[14] Haas H, Torrielli M, Steitz R, Cavatorta P, Sorbi R, Fasano A, Riccio P, Gliozzi A. Myelin model membranes on solid substrates. Thin Solid Films 1998; 627: 327–329.
[15] Facci P, Cavatorta P, Cristofolini L, Fontana MP, Fasano A, Riccio P. Kinetic and structural study of the interaction of myelin basic protein with dipalmitoylphosphatidylglycerol layers. Biophys J 2000; 78: 1413-9.

14
[16] Natali F, Relini A, Gliozzi A, Rolandi R, Cavatorta P, Deriu A, Fasano A, Riccio P. Protein-membrane interaction: effect of myelin basic protein on the dynamics of oriented lipids. Chem Phys 2003; 292: 455-64.
[17] Friedmann T. Overcoming obstacles to gene therapy. Sci Am 1997; 276: 96–101.
[18] Rubanyi GM. The future of human gene therapy. Mol Aspects Med 2001; 22: 113–42.
[19] Felgner PL, Gadek TR, Holm M, Roman R, Chan RW, Wenz M, Northrop JP, Ringold GM, Danielsen M. Lipofection: a highly efficient, lipid-mediated DNA-transfection procedure. Proc Natl Acad Sci 1987; 84: 7413–7.
[20] Cullis PR, de Kruijff B. Lipid polymorphism and the functional roles of lipids in biological membranes. Biochim Biophys Acta 1979; 559: 399–420.
[21] Farhood H, Serbina N, Huang L. The role of dioleoyl phosphatidylethanolamine in cationic liposome mediated gene transfer. Biochim Biophys Acta 1995; 1235: 289–95.
[22] Liu Y, Mounkes LC, Liggitt HD, Brown CS, Solodin I, Heath TD, Debs RJ. Factors influencing the efficiency of cationic liposome-mediated intravenous gene delivery. Nat Biotechnol 1997; 15: 167–73.
[23] Radler JO, Koltover I, Salditt T, Safinya CR. Structure of DNA-cationic liposome complexes: DNA intercalation in multilamellar membranes in distinct interhelical packing regimes. Science 1997; 275: 810– 4.
[24] Crook K, Stevenson BJ, Dubouchet M, Porteous DJ. Inclusion of cholesterol in DOTAP transfection complexes increases the delivery of DNA to cells in vitro in the presence of serum. Gene Ther 1998; 5: 137–43.
[25] Hirsch-Lerner D, Barenholz Y. Hydration of lipoplexes commonly used in gene delivery: follow-up by laurdan fluorescence changes and quantification by differential scanning calorimetry. Biochim Biophys Acta 1999; 1461: 47–57.
[26] Kennedy MT, Pozharski EV, Rakhmanova VA, MacDonanld RC. Factors governing the assembly of cationic phospholipid-DNA complexes. Biophys J 2000; 78: 1620–33.
[27] Regelin AE, Fankhaenel S., Gurtesch L., Prinz C., von Kiedrowski G., Massing. U. Biophysical and lipofection studies of DOTAP analogs. Biochim Biophys Acta 2000: 1464: 151–64.
[28] Choosakoonkriang S, Wiethoff CM, Anchordoquy TJ, Koe GS, Smith JG, Middaugh CR. Infrared spectroscopic characterization of the interaction of cationic lipids with plasmid DNA. J Biol Chem 2001; 276: 8037–43.
[29] Braun CS, Jas GS, Choosakoonkriang S, Koe GS, Smith JG, Middaugh CR. The structure of DNA within cationic lipid/DNA complexes. Biophys J 2003; 84: 1114–23.
[30] Zuhorn IS, Oberle V, Visser WH, Engberts JBN, Bakowsky U, Polushkin E, Hoechkstra D. Phase behavior of cationic amphiphiles and their mixtures with

15
helper lipid influences lipoplex shape, DNA translocation, and transfection efficiency. Biophys J 2002; 83: 2096–108.
[31] Natali F, Pozzi D, Castellano C, Caracciolo G, Congiu Castellano A. DNA-lipoplex: a non-invasive method for gene delivery. A neutron scattering investigation. Biophys J 2005; 88(2):1081-90.
[32] Castellano C, Natali F, Pozzi D, Caracciolo G, Congiu Castellano A. Dynamical properties of oriented lipid membranes studied by elastic incoherent neutron scattering. Physica B 2004; 350: 955-8.
[33] Alberts B. Molecular Biology of the Cell., 3rd Ed; Garland Publishing Inc., New York, 1994.
[34] Beitinger H, Vogel V, Möbius D, Rahmann H. Surface potentials and electric dipole moments of ganglioside and phospholipid bilayers: contribution of the polar headgroup at the water/lipid interface. Biochim Biophys Acta 1989; 984: 293–300.
[35] Brocca P, Cantù L, Corti M, Del Favero E, Raudino A. Cooperative behavior of ganglioside molecules in model systems. Neurochem Res 2002; 27: 559–63.
[36] Cantu’ L, Corti M, Del Favero E, Muller E, Raudino A, Sonnino S. Thermal Hysteresis in Ganglioside Micelles Investigated by Differential Scanning Calorimetry and Light-Scattering. Langmuir 1999; 15: 4975–80.
[37] Cantu’ L, Corti M, Del Favero E, Raudino A. Tightly Packed Lipid Lamellae with Large Conformational Flexibility in the Interfacial Region May Exhibit Multiple Periodicity in Their Repeat Distance. A Theoretical Analysis and X-ray Verification. Langmuir 2000; 16: 8903–11.
[38] Boretta M, Cantu’ L, Corti M, Del Favero E. Cubic phases of gangliosides in water: Possible role of the conformational bistability of the headgroup. Physica A 1997; 236: 162–76.
[39] Maggio B. The surface behavior of glycosphingolipids in biomembranes: a new frontier of molecular ecology. Prog Biophys Mol Biol 1994; 62: 55–117.
[40] Simons K, Ikonen E. Functional rafts in cell membranes. Nature 1997; 387: 569–72.
[41] Yuan C, Johnston LJ. Distribution of ganglioside GM1 in L-alpha-dipalmitoylphosphatidylcholine/cholesterol monolayers: a model for lipid rafts Biophys J 2000; 79: 2768–81.
[42] Sharom FJ, Grant CW. A model for ganglioside behaviour in cell membranes. Biochim Biophys Acta 1978, 507, 280–93.
[43] Peters M, Mehlhorn I, Barber K, Grant C. Evidence of a distribution difference between two gangliosides in bilayer membranes. Biochim Biophys Acta 1984; 778: 419–28.
[44] Delmelle M, Dufrane SP, Brasseur R, Ruysschaert JM. Clustering of gangliosides in phospholipid bilayers. FEBS Lett 1980; 121: 11–4.

16
[45] McIntosh TJ, Simon SA. Long- and short-range interactions between phospholipid/ganglioside GM1 bilayers. Biochemistry 1994; 33: 10477–86.
[46] Bunow MR, Bunow B. Phase behavior of ganglioside-lecithin mixtures. Relation to dispersion of gangliosides in membranes. Biophys J 1979; 27: 325–37.
[47] Sela BA, Bach D. Calorimetric studies on the interaction of gangliosides with phospholipids and myelin basic protein. Biochim Biophys Acta 1984, 771, 177–182.
[48] Thompson TE, Allietta M, Brown RE, Johnson ML, Tillack TW. Organization of ganglioside GM1 in phosphatidylcholine bilayers. Biochim Biophys Acta 1985; 817: 229–37.
[49] Natali F, Caronna C, Del Favero E, Deriu A, Cantu’ L. Directional dynamics in DMPC membranes containing gangliosides. In preparation.
[50] Smith GS, Sirota EB, Safinya CR, Clark NA. Structure of the L beta phases in a hydrated phosphatidylcholine multimembrane. Phys Rev Lett 1988; 60: 813-6.
[51] Rheinstädter MC, Ollinger C, Fragneto G, Demmel F, Salditt T, Collective Dynamics of Lipid Membranes Studied by Inelastic Neutron Scattering, Phys Rev. Lett., 2004; 93: 108107
[52] König S, Pfeiffer W, Bayerl T, Richter D, Sackmann E. Molecular dynamics of lipid bilayers studied by incoherent quasi-elastic neutron scattering. J Phys II France 1992; 2: 1589-615.
[53] Swenson J, Kargl F, Berntsen P, Svanberg C. Solvent and lipid dynamics of hydrated lipid bilayers by incoherent quasielastic neutron scattering. J Chem Phys 2008; 129: 045101.
[54] Rheinstädter MC, Häuβler W, Salditt T, Dispersion Relation of Lipid Membrane Shape Fluctuations by Neutron Spin-Echo Spectrometry, Phys. Rev. Lett., 2006; 97: 048103
[55] Kucerka N, Liu Y, Chu N, Petrache HI, Tristram-Nagle S, Nagle JF. Structure of fully hydrated fluid phase DMPC and DLPC lipid bilayers using X-ray scattering from oriented multilamellar arrays and from unilamellar vesicles. Biophys J 2005; 88: 2626-37.
[56] Trapp M, Juranyi F, Unruh T, Tehei M, Gutberlet T, Peters J. To be submitted.

XL D.3. DYNAMICS OF MODEL MEMBRANES
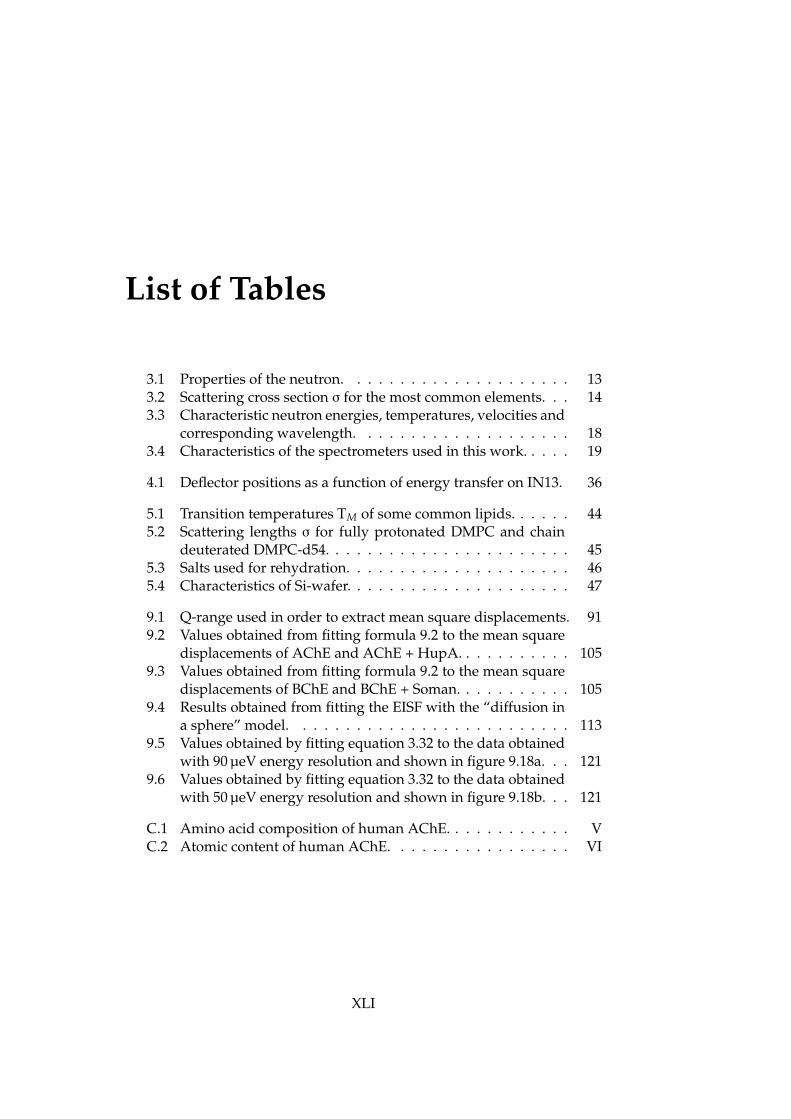
List of Tables
3.1 Properties of the neutron. . . . . . . . . . . . . . . . . . . . . 133.2 Scattering cross section σ for the most common elements. . . 143.3 Characteristic neutron energies, temperatures, velocities and
corresponding wavelength. . . . . . . . . . . . . . . . . . . . 183.4 Characteristics of the spectrometers used in this work. . . . . 19
4.1 Deflector positions as a function of energy transfer on IN13. 36
5.1 Transition temperatures TM of some common lipids. . . . . . 445.2 Scattering lengths σ for fully protonated DMPC and chain
deuterated DMPC-d54. . . . . . . . . . . . . . . . . . . . . . . 455.3 Salts used for rehydration. . . . . . . . . . . . . . . . . . . . . 465.4 Characteristics of Si-wafer. . . . . . . . . . . . . . . . . . . . . 47
9.1 Q-range used in order to extract mean square displacements. 919.2 Values obtained from fitting formula 9.2 to the mean square
displacements of AChE and AChE + HupA. . . . . . . . . . . 1059.3 Values obtained from fitting formula 9.2 to the mean square
displacements of BChE and BChE + Soman. . . . . . . . . . . 1059.4 Results obtained from fitting the EISF with the “diffusion in
a sphere” model. . . . . . . . . . . . . . . . . . . . . . . . . . 1139.5 Values obtained by fitting equation 3.32 to the data obtained
with 90 µeV energy resolution and shown in figure 9.18a. . . 1219.6 Values obtained by fitting equation 3.32 to the data obtained
with 50 µeV energy resolution and shown in figure 9.18b. . . 121
C.1 Amino acid composition of human AChE. . . . . . . . . . . . VC.2 Atomic content of human AChE. . . . . . . . . . . . . . . . . VI
XLI

XLII LIST OF TABLES

List of Figures
3.1 Schematic representation of a scattering event. . . . . . . . . 123.2 Schematic representation of the fission and spallation process. 173.3 Comparison of the elastic energy resolutions of three differ-
ent instruments and four different resolutions used for thiswork. . . . . . . . . . . . . . . . . . . . . . . . . . . . . . . . . 20
3.4 Schematic layout of the cold neutron backscattering spec-trometer IN16 at ILL. . . . . . . . . . . . . . . . . . . . . . . . 22
3.5 Sketch of the time-of flight principle. . . . . . . . . . . . . . . 233.6 Dynamic range for a given ki=1.23 Å−1. . . . . . . . . . . . . 243.7 Schematic layout of the cold time-of-flight spectrometer IN6
at ILL. . . . . . . . . . . . . . . . . . . . . . . . . . . . . . . . . 253.8 Schematic scattering spectrum. . . . . . . . . . . . . . . . . . 303.9 Schematic representations of the HWHM of the function rep-
resenting the quasi-elastic component of the scattering lawin the case of the diffusion in a sphere model and the modelintroduced by Hall and Ross. . . . . . . . . . . . . . . . . . . 31
4.1 Schematic layout of the IN13 backscattering spectrometer. . 344.2 Wide scan of the x and y axes of the deflector. . . . . . . . . . 384.3 Example for the adjustment of the length of the sample stick
using the new CCD camera. . . . . . . . . . . . . . . . . . . . 394.4 Schematic design of the high pressure cell. . . . . . . . . . . 39
5.1 Schematic composition of a membrane. . . . . . . . . . . . . 415.2 Schematic representation of the different phases that occur
as a function of temperature. . . . . . . . . . . . . . . . . . . 435.3 Phase diagram of DMPC as a function of temperature and
relative humidity. . . . . . . . . . . . . . . . . . . . . . . . . . 445.4 Schematic structure of DMPC. . . . . . . . . . . . . . . . . . . 465.5 Calorimetric melting profile of DMPC. . . . . . . . . . . . . . 47
6.1 Schematic layout of the small momentum transfer diffrac-tometer D16 at ILL. . . . . . . . . . . . . . . . . . . . . . . . . 51
6.2 Rocking scans of the two samples measured at D16. . . . . . 52
XLIII

XLIV LIST OF FIGURES
6.3 θ-2θ scans of the two samples. . . . . . . . . . . . . . . . . . . 546.4 Normalised elastic intensities for the parallel and perpendic-
ular orientation. . . . . . . . . . . . . . . . . . . . . . . . . . . 566.5 Summed intensities for both samples DMPC-d54 in the par-
allel orientation measured on IN13. . . . . . . . . . . . . . . . 576.6 θ-2θ data taken on D16 at ILL. . . . . . . . . . . . . . . . . . . 586.7 Comparison between summed intensities and mean square
displacements measured on IN16. . . . . . . . . . . . . . . . 60
7.1 Setup of the diffractometer TREFF at FRM II. . . . . . . . . . 627.2 Rocking scan of the two DMPC-54 samples measured at TR-
EFF (FRMII). . . . . . . . . . . . . . . . . . . . . . . . . . . . . 647.3 Plot of S(~Q,ω) for the higher hydrated sample (RW ≈ 12) at
two discrete Q-values at a temperature of 278 K. . . . . . . . 667.4 Elastic incoherent structure factors for both samples. . . . . . 687.5 Comparison of the line width for the higher hydrated sample
for selected temperatures. . . . . . . . . . . . . . . . . . . . . 697.6 Lorentzian width of the broader Lorentzian. . . . . . . . . . 717.7 Line width of the smaller Lorentzian for the higher hydrated
sample at 278 K. . . . . . . . . . . . . . . . . . . . . . . . . . . 72
8.1 Sample characterisation at D16. . . . . . . . . . . . . . . . . . 748.2 Peak position at both investigated pressure values. . . . . . . 768.3 Elastic intensities and mean square displacements of DMPC
in excess of heavy water at atmospheric pressure. . . . . . . 788.4 Values of MSDs extracted from MD simulations. . . . . . . . 80
9.1 Crystal structure of human AChE. . . . . . . . . . . . . . . . 849.2 Enzymatic hydrolysis of Acetylcholin by AChE. . . . . . . . 859.3 Logarithm of the normalised intensities of hAChE plotted
versus Q2. . . . . . . . . . . . . . . . . . . . . . . . . . . . . . 909.4 MSDs measured on IN13 of hAChE and hAChE with HupA. 929.5 MSDs of pure hAChE and with HupA measured at IN6, IN13
and IN16. . . . . . . . . . . . . . . . . . . . . . . . . . . . . . . 959.7 Intermediate scattering functions for both resolutions mea-
sured on IN6. . . . . . . . . . . . . . . . . . . . . . . . . . . . 1009.8 Crystal structure of human BChE. . . . . . . . . . . . . . . . 1019.9 Comparison of the mean square displacements of native AChE
and BChE taken on IN16. . . . . . . . . . . . . . . . . . . . . . 1029.10 Comparison of the mean square displacements of AChE and
BChE taken on IN16 in the presence of their inhibitors on IN16.1049.11 Evaluated mean square displacements of AChE and AChE +
HupA on IN16 with corresponding fits. . . . . . . . . . . . . 106

LIST OF FIGURES XLV
9.12 Evaluated mean square displacements of BChE and BChE +Soman on IN16 with corresponding fits. . . . . . . . . . . . . 108
9.13 Evaluated mean square displacements of AChE and AChE +HupA with corresponding fits on IN13. . . . . . . . . . . . . 109
9.14 κ calculated according to equation 9.3. . . . . . . . . . . . . . 1109.16 S(Q, ω) of native AChE taken on IN6 (90 µeV energy resolu-
tion) with corresponding fits. . . . . . . . . . . . . . . . . . . 1129.17 S(Q, ω) of AChE + HupA taken on IN6 (50 µeV energy reso-
lution) with corresponding fits. . . . . . . . . . . . . . . . . . 1149.18 Half widths of the quasi-elastic Lorentzian as a function of
Q2 for native AChE and AChE + HupA for both investigatedresolutions on IN6. . . . . . . . . . . . . . . . . . . . . . . . . 118
9.19 Elastic incoherent structure factor for both resolutions mea-sured on IN6. . . . . . . . . . . . . . . . . . . . . . . . . . . . 120

XLVI LIST OF FIGURES

Bibliography
[1] J. Chadwick. Possible existence of a neutron. Nature, 129:312, Feb1932.
[2] Amsler, C. et al. (Particle Data Group). Review of particle physics.Physics Letters B, 667(1-5):1–6, September 2008.
[3] B. N. Brockhouse. Lattice vibrations in silicon and germanium. Phys.Rev. Lett., 2(6):256–258, Mar 1959.
[4] http://nobelprize.org/nobel_prizes/physics/laureates/1994/.
[5] M. Trapp, T. Gutberlet, F. Juranyi, T. Unruh, B. Demé, M. Tehei,and J. Peters. Hydration dependent studies of highly aligned mul-tilayer lipid membranes by neutron scattering. J. Chem. Phys.,133(16):164505–7, October 2010.
[6] J.H. Roh, J.E. Curtis, S. Azzam, V.N. Novikov, I. Peral, Z. Chowd-huri, R.B. Gregory, and A.P. Sokolov. Influence of hydration on thedynamics of lysozyme. Biophys. J., 91:2573–2588, Oct 2006.
[7] M. Jasnin, M. Moulin, M. Haertlein, G. Zaccai, and M. Tehei. In VivoMeasurement of Internal and Global Macromolecular Motions in Es-cherichia coli. Biophysical Journal, 95(2):857–864, July 2008.
[8] A. Paciaroni, A. Orecchini, E. Cornicchi, M. Marconi, C. Petrillo,M. Haertlein, M. Moulin, H. Schober, M. Tarek, and F. Sacchetti.Fingerprints of amorphous icelike behavior in the vibrational den-sity of states of protein hydration water. Physical Review Letters,101(14):148104, 2008.
[9] W. Doster, S. Cusack, and W. Petry. Dynamical transitionof myoglobin revealed by inelastic neutron scattering. Nature,337(6209):754–756, February 1989.
[10] M. Tehei, B. Franzetti, D. Madern, M. Ginzburg, B. Z. Ginzburg, M.-T.Giudici-Orticoni, M. Bruschi, and G. Zaccai. Adaptation to extremeenvironments: macromolecular dynamics in bacteria compared invivo by neutron scattering. EMBO reports, 5(1):66–70, 2004.
XLVII

XLVIII BIBLIOGRAPHY
[11] Neutron data booklet, 2004. Institut Laue-Langevin.
[12] G. Squires. Introduction to the Theory of Thermal Neutron Scatering.Dover Publications, 1978.
[13] L. Van Hove. Correlations in space and time and born approximationscattering in systems of interacting particles. Phys. Rev., 95(1):249–262, Jul 1954.
[14] A. Taylor, M. Dunne, S. Bennington, S. Ansell, I. Gardner, P. Norreys,T. Broome, D. Findlay, and R. Nelmes. A route to the brightest possi-ble neutron source? Science, 315(5815):1092–1095, February 2007.
[15] H. F. Bohn, K. Clausen, A. Claver, R. Cywinsky, F. Frick, W. Rö-gener, B. Stahl-Busse, U. Steigenberger, H. Tietze-Jaensch, and P. Tin-demans. European source of science. In The ESS Project, Volume 1.ESS council, 2002.
[16] H. Maier-Leibnitz and T. Springer. The use of neutron optical deviceson beam-hole experiments on beam-hole experiments. Journal of Nu-clear Energy. Parts A/B. Reactor Science and Technology, 17(4-5):217–225,July 1963.
[17] C. F. Majkrzak, V. Nunez, J. R. D. Copley, J. F. Ankner, and G. L.Greene. Supermirror transmission polarizers for neutrons. In Proc.SPIE, volume 1738, pages 90–106, San Diego, CA, USA, November1992. SPIE.
[18] F. Mezei. Neutron spin echo: A new concept in polarized ther-mal neutron techniques. Zeitschrift für Physik A Hadrons and Nuclei,255:146–160, Apr 1972.
[19] H. Maier-Leibnitz. Grundlagen für die Beurteilung von Intensitäts-und Genauigkeitsfragen bei Neutronenstreumessungen. Nukleonik,8(2):61–67, 1966.
[20] http://www.ill.eu/instruments-support/instruments-groups/instruments/in16/characteristics/.
[21] http://www.frm2.tum.de/wissenschaftliche-nutzung/spektrometrie/toftof/prinzip-primaerspectrometer/index.html.
[22] http://www.ill.eu/instruments-support/instruments-groups/instruments/in6/characteristics/.
[23] T. Unruh, J. Neuhaus, and W. Petry. The high-resolution time-of-flight spectrometer TOFTOF. Nuclear Instruments and Methods in
BIBLIOGRAPHY XLIX
Physics Research Section A: Accelerators, Spectrometers, Detectors and As-sociated Equipment, 580(3):1414–1422, Oct 2007.
[24] M. Bée. Quasielastic Neutron Scattering:Principles and Applications inSolid State Chemistry, Biology and Materials Science. Adam Hilger,Philadelphia, 1988.
[25] M. C. Rheinstädter, C. Ollinger, G. Fragneto, F. Demmel, andT. Salditt. Collective Dynamics of Lipid Membranes Studied byInelastic Neutron Scattering. Physical Review Letters, 93(10):108107,2004.
[26] J. Fitter and R.E. Lechner. Incoherent neutron scattering (INS), 1998.
[27] A. Rahman, K. S. Singwi, and A. Sjölander. Theory of slow neutronscattering by liquids. Phys. Rev., 126(3):986–996, May 1962.
[28] J. C. Smith. Protein dynamics: comparison of simulations with inelas-tic neutron scattering experiments. Quarterly Reviews of Biophysics,24(03):227–291, 1991.
[29] A. Guinier and G. Fournier. Small-angle scattering of X-rays. JohnWiley & Sons, Inc, Hoboken, New Jersey, USA, 1955.
[30] V. Réat, G. Zaccai, C. Ferrand, and C. Pfister. Functional dynamicsin purple membranes. In Biological Macromolecular Dynamcis, Proceed-ings of a Workshop on Inelastic and Quasielastic Neutron Scattering inBiology, pages 117–122, 1997.
[31] F. Volino and A. J. Dianoux. Neutron incoherent scattering lawfor diffusion in a potential of spherical symmetry: general formal-ism and application to diffusion inside a sphere. Molecular Physics,41:271–279, Oct 1980.
[32] M.-C. Bellissent-Funel, J. Teixeira, K.F. Bradley, and S. H. Chen. Dy-namics of hydration water in protein. J. Phys. I France, 2(6):995–1001,jun 1992.
[33] P. L. Hall and D. K. Ross. Incoherent neutron scattering functionsfor random jump diffusion in bounded and infinite media. MolecularPhysics, 42:673–682, Feb 1981.
[34] K. S. Singwi and Alf Sjölander. Diffusive motions in water and coldneutron scattering. Phys. Rev., 119(3):863–871, Aug 1960.
[35] L. Carpentier, M. Bée, A. M. Giroud-Godquin, P. Maldivi, and J. C.Marchon. Alkyl chain motions in columnar mesophases. MolecularPhysics, 68(6):1367–1378, Dec 1989.

L BIBLIOGRAPHY
[36] S. König, W. Pfeiffer, T. Bayerl, D. Richter, and E. Sackmann. Molec-ular dynamics of lipid bilayers studied by incoherent quasi-elasticneutron scattering. J. Phys. II France 2, 2(8):1589–1615, Aug 1992.
[37] M. Doxastakis, V. Garcia Sakai, S. Ohtake, J. K. Maranas, and J. J.de Pablo. A Molecular View of Melting in Anhydrous PhospholipidicMembranes. Biophys. J., 92(1):147–161, 2007.
[38] M. Prager and A. Heidemann. Rotational tunneling and neutronspectroscopy : a compilation. Technical Report ILL95PR20T, ILL,1995.
[39] A. Deriu, A. Paciaroni, J. Zaccai, and C. Pfister. First experimental re-sults from the IN13-Collaborative Research Group (CRG) at the ILL.Physica B: Condensed Matter, 276-278:512–513, March 2000.
[40] http://www.ill.eu/instruments-support/instruments-groups/instruments/in13/characteristics/.
[41] http://www.neutronoptics.com/index.html.
[42] M. S. Appavou, G. Gibrat, M.-C. Bellissent-Funel, M. Plazanet,J. Pieper, A. Buchsteiner, and B. Annighöfer. The influence of amedium pressure on the structure and dynamics of a bovine pan-creatic trypsin inhibitor protein. Journal of Physics: Condensed Matter,17(40):S3093–3099, 2005.
[43] W. H. Freeman. Lehninger Principles of Biochemistry. Freeman, W. H.and Company, 2005.
[44] W. Pfeffer. Osmotische Untersuchungen. Studien zur Zellmechanik. En-gelmann, W., 1877.
[45] E. Gorter and F. Grendel. On bimolecular layers of lipid on the chro-macytes of the blood. J. Exp. Med., 41:439–443, 1925.
[46] S. J. Singer and G. L. Nicolson. The fluid mosaic model of the struc-ture of cell membranes. Science, 175(4023):720–731, February 1972.
[47] O.G. Mouritsen and M. Bloom. Mattress model of lipid-protein in-teractions in membranes. Biophysical Journal, 46(2):141–153, August1984.
[48] S. König, T. M. Bayerl, G. Coddens, D. Richter, and E. Sackmann.Hydration dependence of chain dynamics and local diffusion in L-alpha-dipalmitoylphosphtidylcholine multilayers studied by inco-herent quasi-elastic neutron scattering. Biophys. J., 68(5):1871–1880,1995.

BIBLIOGRAPHY LI
[49] B. W. Koenig, H. H. Strey, and K. Gawrisch. Membrane lateral com-pressibility determined by NMR and x-ray diffraction: effect of acylchain polyunsaturation. Biophys. J., 73(4):1954–1966, 1997.
[50] S. König, E. Sackmann, D. Richter, R. Zorn, C. Carlile, and T. M.Bayerl. Molecular dynamics of water in oriented DPPC multilay-ers studied by quasielastic neutron scattering and deuterium-nuclearmagnetic resonance relaxation. The Journal of Chemical Physics,100(4):3307–3316, 1994.
[51] S. Busch, C. Smuda, L. C. Pardo, and T. Unruh. Molecular mecha-nism of long-range diffusion in phospholipid membranes studied byquasielastic neutron scattering. Journal of the American Chemical Soci-ety, 132:3232 – 3233, 2010.
[52] M. C. Rheinstädter, W. Häußler, and T. Salditt. Dispersion Relationof Lipid Membrane Shape Fluctuations by Neutron Spin-Echo Spec-trometry. Physical Review Letters, 97(4):048103, 2006.
[53] R. H. Pearson and I. Pascher. The molecular structure of lecithin di-hydrate. Nature, 281(5731):499–501, October 1979.
[54] T. Heimburg. Thermal Biophysics of Membranes. Wiley-VCH, Wein-heim, Germany, 2007.
[55] G. S. Smith, E. B. Sirota, C. R. Safinya, and N. A. Clark. Structureof the Lβ phases in a hydrated phosphatidylcholine multimembrane.Phys. Rev. Lett., 60(9):813–816, Feb 1988.
[56] D. Guard-Friar, C. H. Chen, and A. S. Engle. Deuterium isotope effecton the stability of molecules: phospholipids. The Journal of PhysicalChemistry, 89:1810–1813, 1985.
[57] http://www.avantilipids.com.
[58] T. Heimburg. A model for the lipid pretransition: Coupling of rip-ple formation with the chain-melting transition. Biophysical Journal,78(3):1154–1165, March 2000.
[59] L. Ding, T.M. Weiss, G. Fragneto, W. Liu, L. Yang, and H.W. Huang.Distorted Hexagonal Phase Studied by Neutron Diffraction: LipidComponents Demixed in a Bent Monolayer. Langmuir, 21(1):203–210,2005.
[60] J. Fitter, S. A. W. Verclas, R. E. Lechner, H. Seelert, and N. A. Dencher.Function and picosecond dynamics of bacteriorhodopsin in pur-ple membrane at different lipidation and hydration. FEBS Letters,433(3):321 – 325, 1998.

LII BIBLIOGRAPHY
[61] J. Zanotti, M.-C. Bellissent-Funel, and J. Parello. Hydration-CoupledDynamics in Proteins Studied by Neutron Scattering and NMR: TheCase of the Typical EF-Hand Calcium-Binding Parvalbumin. Biophys-ical Journal, 76(5):2390 – 2411, 1999.
[62] F. Gabel, D. Bicout, U. Lehnert, M. Tehei, M. Weik, and G. Zaccai.Protein dynamics studied by neutron scattering. Quarterly Reviews ofBiophysics, 35(04):327–367, 2003.
[63] J. Pieper, T. Hauß, A. Buchsteiner, and G. Renger. The effect of hy-dration on protein flexibility in photosystem II of green plants stud-ied by quasielastic neutron scattering. European Biophysics Journal,37:657–663, 2008.
[64] K. Wood, U Lehnert, B. Kessler, G. Zaccai, and D. Oesterhelt. Hy-dration dependence of active core fluctuations in bacteriorhodopsin.Biophysical Journal, 95(1):194 – 202, 2008.
[65] P. J. Steinbach and B.R. Brooks. Protein hydration elucidated bymolecular dynamics simulation. Proceedings of the National Academyof Sciences, 90:9135–9139, 1993.
[66] M. Tarek and D. J. Tobias. Role of Protein-Water Hydrogen BondDynamics in the Protein Dynamical Transition. Phys. Rev. Lett.,88(13):138101, Mar 2002.
[67] C.-J. Högberg and A. P. Lyubartsev. A molecular dynamics investi-gation of the influence of hydration and temperature on structuraland dynamical properties of a dimyristoylphosphatidylcholine bi-layer. The Journal of Physical Chemistry B, 110:14326–14336, 2006.
[68] E. G. Brandt and O. Edholm. Stretched exponential dynamics inlipid bilayer simulations. J. Chem. Phys., 133(11):115101–12, Septem-ber 2010.
[69] W. Pfeiffer, Th. Henkel, E. Sackmann, W. Knoll, and D. Richter. Lo-cal Dynamics of Lipid Bilayers Studied by Incoherent Quasi-ElasticNeutron Scattering. EPL (Europhysics Letters), 8(2):201–206, 1989.
[70] M. Rheinstädter, J. Das, E. Flenner, B. Brüning, T. Seydel, andI. Kosztin. Motional coherence in fluid phospholipid membranes.Physical Review Letters, 101(24):248106, 2008.
[71] A. A. Nevzorov and M. F. Brown. Dynamics of lipid bilayers fromcomparative analysis of 2H and 13C nuclear magnetic resonance re-laxation data as a function of frequency and temperature. The Journalof Chemical Physics, 107(23):10288–10310, 1997.

BIBLIOGRAPHY LIII
[72] S. H. Chen, C. Y. Liao, H. W. Huang, T. M. Weiss, M.-C. Bellisent-Funel, and F. Sette. Collective Dynamics in Fully Hydrated Phospho-lipid Bilayers Studied by Inelastic X-Ray Scattering. Phys. Rev. Lett.,86(4):740–743, Jan 2001.
[73] B. Klösgen, C. Reichle, S. Kohlsmann, and K.D. Kramer. Dielectricspectroscopy as a sensor of membrane headgroup mobility and hy-dration. Biophysical Journal, 71:3251 – 3260, 1996.
[74] E. Y. Shalaev and P. L. Steponkus. Glass transition of a synthetic phos-pholipid in the lamellar phase. The Journal of Physical Chemistry B,107:8734–8737, Aug 2003.
[75] R. Hirn, T. M. Bayerl, J. O. Rädler, and E. Sackmann. Collectivemembrane motions of high and low amplitude, studied by dynamiclight scattering and micro-interferometry. Faraday Discuss., 111:17–30,1999.
[76] C. Eggeling, C. Ringemann, R. Medda, G. Schwarzmann, K. Sand-hoff, S. Polyakova, V.N. Belov, B. Hein, C. von Middendorff,A. Schonle, and S.W. Hell. Direct observation of the nanoscale dy-namics of membrane lipids in a living cell. Nature, 457:1159–1162,Feb 2009.
[77] http://www.ill.eu/d16/.
[78] N. Kucerka, Y. Liu, N. Chu, H. I. Petrache, S. Tristram-Nagle, and J. F.Nagle. Structure of Fully Hydrated Fluid Phase DMPC and DLPCLipid Bilayers Using X-Ray Scattering from Oriented MultilamellarArrays and from Unilamellar Vesicles. Biophys. J., 88(4):2626–2637,2005.
[79] M. C. Rheinstädter, T. Seydel, F. Demmel, and T. Salditt. Molecularmotions in lipid bilayers studied by the neutron backscattering tech-nique. Physical Review E (Statistical, Nonlinear, and Soft Matter Physics),71(6):061908, 2005.
[80] http://www.ill.eu/instruments-support/computing-for-science/cs-software/all-software/lamp/.
[81] B. Frick and L. J. Fetters. Methyl group dynamics in glassy poly-isoprene: A neutron backscattering investigation. Macromolecules,27:974–980, 1994.
[82] H. Pfeiffer, H. Binder, G. Klose, and K. Heremans. Hydration pres-sure and phase transitions of phospholipids: I. Piezotropic approach.Biochimica et Biophysica Acta (BBA) - Biomembranes, 1609(2):144–147,Jan 2003.

LIV BIBLIOGRAPHY
[83] H. Pfeiffer, H. Binder, G. Klose, and K. Heremans. Hydrationpressure and phase transitions of phospholipids: II. Thermotropicapproach. Biochimica et Biophysica Acta (BBA) - Biomembranes,1609(2):148–152, Jan 2003.
[84] M. Trapp, F. Juranyi, M. Tehei, L. van Eijck, B. Demé, T. Gutberlet,and J. Peters. Elastic scattering studies of aligned dmpc multilayerson different hydrations. Spectroscopy, 24(5):461–466, January 2010.
[85] F. Natali, A. Relini, A. Gliozzi, R. Rolandi, P. Cavatorta, A. Deriu,A. Fasano, and P. Riccio. The influence of the lipid-protein interactionon the membrane dynamics. Physica B: Condensed Matter, 350(1-3,Supplement 1):E623 – E626, 2004. Proceedings of the Third EuropeanConference on Neutron Scattering.
[86] E. Flenner, J. Das, M. C. Rheinstadter, and I. Kosztin. Subdiffusionand lateral diffusion coefficient of lipid atoms and molecules in phos-pholipid bilayers. Physical Review E (Statistical, Nonlinear, and SoftMatter Physics), 79(1):011907, 2009.
[87] J. Peters, M. C. Rheinstädter, T. Seydel, and M. Trapp. A memoryfunction to measure difusion in membranes by elastic and quasi-elastic neutron scattering. ILL report CRG 1584.
[88] http://sourceforge.net/projects/frida/.
[89] http://www.ncnr.nist.gov/dave.
[90] J. Swenson, F. Kargl, P. Berntsen, and C. Svanberg. Solvent and lipiddynamics of hydrated lipid bilayers by incoherent quasielastic neu-tron scattering. The Journal of Chemical Physics, 129(4):045101, 2008.
[91] F. Natali, A. Relini, A. Gliozzi, R. Rolandi, P. Cavatorta, A. Deriu,A. Fasano, and P. Riccio. Protein-membrane interaction: effect ofmyelin basic protein on the dynamics of oriented lipids. ChemicalPhysics, 292(2-3):455 – 464, 2003. Quasielastic Neutron Scattering ofStructural Dynamics in Condensed Matter.
[92] M. Bée, H. Jobic, and C. Sourisseau. Neutron scattering studyof methyl group reorientations in trimethyloxosulphonioum iodide,(CH3)3SOI. Journal of Physics C: Solid State Physics, 18(31):5771–5781,1985.
[93] M. Tehei, J. C. Smith, C. Monk, J. Ollivier, M. Oettl, V. Kurkal, J. L.Finney, and R. M. Daniel. Dynamics of immobilized and native es-cherichia coli dihydrofolate reductase by quasielastic neutron scat-tering. Biophysical Journal, 90(3):1090–1097, February 2006.

BIBLIOGRAPHY LV
[94] Z. Bu, D. A. Neumann, S.-H. Lee, C. M. Brown, D. M. Engelman, andC. C. Han. A view of dynamics changes in the molten globule-nativefolding step by quasielastic neutron scattering. Journal of MolecularBiology, 301(2):525–536, August 2000.
[95] P. A. Egelstaff. An introduction to the liquid state. Academic Press, NewYork, USA, 1967.
[96] R. Winter and W. Dzwolak. Exploring the temperature-pressure con-figurational landscape of biomolecules: from lipid membranes toproteins. Philosophical Transactions of the Royal Society A: Mathemati-cal, Physical and Engineering Sciences, 363:537–563, Feb 2005.
[97] R. Winter. High pressure nmr studies on lyotropic lipid mesophasesand model biomembranes. In G. A. WEBB, editor, Annual Reports onNMR Spectroscopy, volume 50 of Annual Reports on NMR Spectroscopy,pages 163 – 200. Academic Press, 2003.
[98] G. N. Somero. Adaptations to high hydrostatic pressure. AnnualReview of Physiology, 54(1):557–577, October 1992.
[99] M. L. M. Lopes, V. L. Valente Mesquita, A. C. N. Chiaradia, A. A. R.Fernandes, and P. M. B. Fernandes. High hydrostatic pressure pro-cessing of tropical fruits. Annals of the New York Academy of Sciences,1189(1):6–15, 2010.
[100] J. P. P. M. Smelt. Recent advances in the microbiology of high pressureprocessing. Trends in Food Science & Technology, 9(4):152–158, April1998.
[101] E. F. DeLong and A. A. Yayanos. Adaptation of the membrane lipidsof a deep-sea bacterium to changes in hydrostatic pressure. Science,228(4703):1101–1103, May 1985.
[102] http://www.coml.org/.
[103] C. R. Woese, O. Kandler, and M. L. Wheelis. Towards a natural sys-tem of organisms: proposal for the domains archaea, bacteria, andeucarya. Proceedings of the National Academy of Sciences of the UnitedStates of America, 87(12):4576–4579, June 1990.
[104] J. R. Hazel and E. E. Williams. The role of alterations in membranelipid composition in enabling physiological adaptation of organismsto their physical environment. Progress in Lipid Research, 29(3):167–227, 1990.
[105] I. D. Skanes, J. Stewart, K. M. W. Keough, and M. R. Morrow. Effectof chain unsaturation on bilayer response to pressure. Phys. Rev. E,74(5):051913–, November 2006.

LVI BIBLIOGRAPHY
[106] L. F. Braganza and David L. Worcester. Hydrostatic pressure induceshydrocarbon chain interdigitation in single-component phospholipidbilayers. Biochemistry, 25:2591–2596, 1986.
[107] F. H. Johnson and E. A. Flagler. Hydrostatic pressure reversal of nar-cosis in tadpoles. Science, 112:91–92, 1950.
[108] T. Heimburg and A. D. Jackson. The thermodynamics of generalanesthesia. Biophysical Journal, 92(9):3159–3165, May 2007.
[109] D. H. Bartlett. Pressure effects on in vivo microbial processes.Biochimica et Biophysica Acta (BBA) - Protein Structure and MolecularEnzymology, 1595(1-2):367–381, March 2002.
[110] H. Dvir, I. Silman, M. Harel, T. L. Rosenberry, and J. L. Suss-man. Acetylcholinesterase: From 3d structure to function. Chemico-Biological Interactions, 187(1-3):10–22, September 2010.
[111] P. Masson and O. Lockridge. Butyrylcholinesterase for protectionfrom organophosphorus poisons: Catalytic complexities and hys-teretic behavior. Archives of Biochemistry and Biophysics, 494(2):107 –120, 2010.
[112] F. Zheng, W. Yang, M.-C. Ko, J. Liu, H. Cho, D. Gao, M. Tong, H.-H.Tai, J. H. Woods, and C.-G. Zhan. Most efficient cocaine hydrolase de-signed by virtual screening of transition states. Journal of the AmericanChemical Society, 130(36):12148–12155, September 2008.
[113] D. M. Quinn. Acetylcholinesterase: enzyme structure, reaction dy-namics, and virtual transition states. Chemical Reviews, 87(5):955–979,October 1987.
[114] J.L. Sussman, M. Harel, F. Frolow, C. Oefner, A. Goldman, L. Toker,and I. Silman. Atomic structure of acetylcholinesterase from Tor-pedo californica: a prototypic acetylcholine-binding protein. Science,253(5022):872–879, August 1991.
[115] M. Monkenbusch, D. Richter, and R. Biehl. Observation of proteindomain motions by neutron spectroscopy. Chem. Eur. J. of Chem. Phys.,11(6):1188–1194, 2010.
[116] R. Biehl, B. Hoffmann, M. Monkenbusch, P. Falus, S. Préost,R. Merkel, and D. Richter. Direct observation of correlated in-terdomain motion in alcohol dehydrogenase. Phys. Rev. Lett.,101(13):138102–, September 2008.
[117] J.A. McCammon and S.C. Harvey. Dynamics of proteins and nucleicacids, volume 17, page 220. Cambridge University Press, Cambridge,1987.

BIBLIOGRAPHY LVII
[118] H.-X. Zhou, S. T. Wlodek, and J. A. McCammon. Conformation gat-ing as a mechanism for enzyme specificity. Proceedings of the NationalAcademy of Sciences of the United States of America, 95(16):9280–9283,August 1998.
[119] S. V. Lushchekina, A. V. Nemukhin, D. I. Morozov, and S. D. Var-folomeev. Correlation between the substrate structure and the rateof acetylcholinesterase hydrolysis modeled with the combined quan-tum mechanical/molecular mechanical studies. Chemico-BiologicalInteractions, 187(1-3):59–63, September 2010.
[120] Y. Xu, J. P. Colletier, H. Jiang, I. Silman, J. L. Sussman, and M. Weik.Induced-fit or preexisting equilibrium dynamics? lessons from pro-tein crystallography and md simulations on acetylcholinesteraseand implications for structure-based drug design. Protein Science,17(4):601–605, 2008.
[121] S. Tara, V. Helms, T. P. Straatsma, and J. A. McCammon. Moleculardynamics of mouse acetylcholinesterase complexed with huperzinea. Biopolymers, 50:347–359, 1999.
[122] S. Tara, T. P. Straatsma, and J. A. McCammon. Mouse acetyl-cholinesterase unliganded and in complex with huperzine a: A com-parison of molecular dynamics simulations. Biopolymers, 50(1):35–43,1999.
[123] T. Shen, K. Tai, R. H. Henchman, and J. A. McCammon. Molecu-lar dynamics of acetylcholinesterase. Accounts of Chemical Research,35(6):332–340, June 2002.
[124] Y. Xu, J. Shen, X. Luo, I. Silman, J. L. Sussman, K. Chen, and H. Jiang.How does huperzine a enter and leave the binding gorge of acetyl-cholinesterase? steered molecular dynamics simulations. Journal ofthe American Chemical Society, 125(37):11340–11349, 2003.
[125] K. Henzler-Wildman and D. Kern. Dynamic personalities of proteins.Nature, 450(7172):964–972, dec 2007.
[126] G. R. Kneller. Quasielastic neutron scattering and relaxation pro-cesses in proteins: analytical and simulation-based models. Phys.Chem. Chem. Phys., 7(13):2641–2655, 2005.
[127] L. Larini, A. Ottochian, C. De Michele, and D. Leporini. Univer-sal scaling between structural relaxation and vibrational dynamicsin glass-forming liquids and polymers. Nature Physics, 4(1):42–45,January 2008.
LVIII BIBLIOGRAPHY
[128] A. Ottochian, C. De Michele, and D. Leporini. Universal divergence-less scaling between structural relaxation and caged dynamics inglass-forming systems. J. Chem. Phys., 131(22):224517–10, December2009.
[129] Y. Nicolet, O. Lockridge, P. Masson, J. C. Fontecilla-Camps, and F. Na-chon. Crystal Structure of Human Butyrylcholinesterase and of ItsComplexes with Substrate and Products. Journal of Biological Chem-istry, 278(42):41141–41147, 2003.
[130] R.M. Daniel, R.V. Dunn, J.L. Finney, and J.C. Smith. The role of dy-namics in enzyme activity. Annual Review of Biophysics and Biomolec-ular Structure, 32(1):69–92, June 2003.
[131] F. Natali, J. Peters, D. Russo, S. Barbieri, C. Chiapponi, A. Cupane,A. Deriu, M. T. Di Bari, E. Farhi, Y. Gerelli, P. Mariani, A. Paciaroni,C. Rivasseau, G. Schiró, and F. Sonvico. IN13 Backscattering Spec-trometer at ILL: Looking for Motions in Biological Macromoleculesand Organisms. Neutron News, 19:14–18, 2008.
[132] E. Carletti, H. Li, B. Li, F. Ekstrom, Y. Nicolet, M. Loiodice, E. Gillon,M. T. Froment, O. Lockridge, L. M. Schopfer, P. Masson, and F. Na-chon. Aging of cholinesterases phosphylated by tabun proceedsthrough o-dealkylation. Journal of the American Chemical Society,130(47):16011–16020, November 2008.
[133] T. L. Rosenberry and D. M. Scoggin. Structure of human erythro-cyte acetylcholinesterase. characterization of intersubunit disulfidebonding and detergent interaction. Journal of Biological Chemistry,259(9):5643–5652, May 1984.
[134] G. L. Ellman, K.D. Courtney, V. Andres jr., and R. M. Featherstone.A new and rapid colorimetric determination of acetylcholinesteraseactivity. Biochemical Pharmacology, 7(2):88–90, IN1, 91–95, July 1961.
[135] R. Zorn. On the evaluation of neutron scattering elastic scan data.Nuclear Instruments and Methods in Physics Research Section A: Accelera-tors, Spectrometers, Detectors and Associated Equipment, 603(3):439–445,May 2009.
[136] M. Bée. Localized and long-range diffusion in condensed matter:state of the art of QENS studies and future prospects. ChemicalPhysics, 292(2-3):121–141, Mar 2003.
[137] G. Zaccai. The case for an empirical high-throughput neutron scat-tering approach to protein dynamics. Acta Cryst D, 2010.

BIBLIOGRAPHY LIX
[138] H. H. Paalman and C. J. Pings. Numerical evaluation of x-ray ab-sorption factors for cylindrical samples and annular sample cells. J.Appl. Phys., 33(8):2635–2639, August 1962.
[139] M. Tehei, R. Daniel, and G. Zaccai. Fundamental and biotechnologi-cal applications of neutron scattering measurements for macromolec-ular dynamics. European Biophysics Journal, 35(7):551–558, 2006.
[140] E. Carletti, J.-P. Colletier, F. Dupeux, M. Trovaslet, P. Masson, andF. Nachon. Structural evidence that human acetylcholinesterase in-hibited by tabun ages through o-dealkylation. Journal of MedicinalChemistry, 53(10):4002–4008, May 2010.
[141] P. Masson, S. Rey, C. Cléry, N. Fontaine, C. Kronman, B. Velan, andA. Shafferman. Stability of aged phosphylated cholinesterases andchymotrypsin. Proceedings of the Medical Defense Bioscience Review,1:43–52, 1996.
[142] F. Gabel, M. Weik, P. Masson, F. Renault, D. Fournier, L. Brochier,B. P. Doctor, A. Saxena, I. Silman, and G. Zaccai. Effects of SomanInhibition and of Structural Differences on Cholinesterase MolecularDynamics: A Neutron Scattering Study. Biophys. J., 89(5):3303–3311,2005.
[143] P. Masson, C. Cléry, P. Guerra, A. Redslob, C. Albaret, and P. L.Fortier. Hydration change during the aging of phosphorylated hu-man butyrylcholinesterase: importance of residues aspartate-70 andglutamate-197 in the water network as probed by hydrostatic and os-motic pressures. Biochem. J., 343(2):361–369, October 1999.
[144] F. Gabel, P. Masson, M.-T. Froment, B.P. Doctor, A. Saxena, I. Sil-man, G. Zaccai, and M. Weik. Direct correlation between moleculardynamics and enzymatic stability: A comparative neutron scatter-ing study of native human butyrylcholinesterase and its aged somanconjugate. Biophys. J., 96:1489–1494, 2009.
[145] D. Rochu, C. Cléry-Barraud, F. Renault, A. Chevalier, C. Bon, andP. Masson. Capillary electrophoresisversus differential scanningcalorimetry for the analysis of free enzyme versus enzyme-ligandcomplexes: In the search of the ligand-free status of cholinesterases.Electrophoresis, 27(2):442–451, 2006.
[146] S. Sacquin-Mora, P. Sebban, V. Derrien, B. Frick, R. Lavery, andC. Alba-Simionesco. Probing the flexibility of the bacterial reactioncenter: The wild-type protein is more rigid than two site-specific mu-tants. Biochemistry, 46(51):14960–14968, December 2007.

LX BIBLIOGRAPHY
[147] M. Jasnin, L. van Eijck, M. M. Koza, J. Peters, C. Laguri, H. Lortat-Jacob, and G Zaccai. Dynamics of heparan sulfate explored by neu-tron scattering. Physical Chemistry Chemical Physics, 12(14):3360–3362,2010.
[148] L. Cordone, M. Ferrand, E. Vitrano, and G. Zaccai. Harmonic behav-ior of trehalose-coated carbon-monoxy-myoglobin at high tempera-ture. Biophysical Journal, 76(2):1043–1047, February 1999.
[149] W. Doster. The protein-solvent glass transition. Biochimica et Biophys-ica Acta (BBA) - Proteins & Proteomics, 1804(1):3 – 14, 2010. IncludesSpecial Section: Protein-Water Interactions.
[150] R. M. Daniel, J. L. Finney, and J. C. Smith. The dynamic transition inproteins may have a simple explanation. Faraday Disc., 122:163–169,2002.
[151] R. M. Daniel, J. L. Finney, V. Réat, R. Dunn, M. Ferrand, and J. C.Smith. Enzyme dynamics and activity: Time-scale dependence of dy-namical transitions in glutamate dehydrogenase solution. BiophysicalJournal, 77(4):2184 – 2190, 1999.
[152] T. Becker, J. A. Hayward, J. L. Finney, R. M. Daniel, and J. C. Smith.Neutron frequency windows and the protein dynamical transition.Biophysical Journal, 87(3):1436 – 1444, 2004.
[153] G. Zaccai. How soft is a protein? a protein dynamics force constantmeasured by neutron scattering. Science, 288(5471):1604–1607, June2000.
[154] T. Becker and J. C. Smith. Energy resolution and dynamical hetero-geneity effects on elastic incoherent neutron scattering from molecu-lar systems. Phys. Rev. E, 67(2):021904, Feb 2003.
[155] M Trovalet. privat communications.
[156] B. Varga, F. Migliardo, E. Takacs, B. Vertessy, S. Magazù, and C. Mon-delli. Neutron scattering studies on dutpase complex in the presenceof bioprotectant systems. Chemical Physics, 345(2-3):250–258, April2008.

Summary
Incoherent elastic and quasi-elastic neutron scattering were used tomeasure membrane and protein dynamics in the nano- to picosec-ond time and Ångstrom length scale.The hydration dependent dynamics of DMPC model membraneswas studied using elastic and quasi-elastic neutron scattering. Theelastic experiments showed a clear shift of the temperature of themain phase transition to higher temperatures with decreasing hy-dration level.The performed quasi-elastic measurements demonstrated nicely theinfluence, hydration has on the diffusive motions of the head lipidgroups. Different models are necessary to fit the Q-dependence ofthe elastic incoherent structure factor and show therefore the reducedmobility as a result of reduced water content.In addition to temperature, pressure as a second thermodynamicalvariable was used to explore dynamics of DMPC membranes. Theordering introduced by applying pressure has similar effect to de-creased hydration, therefore both approaches are complementary.Covering three orders of magnitude in observation time, the dynam-ics of native AChE and its complexed counterpart in presence of Hu-perzin A was investigated in the range from 1 ns to 100 ps. The meansquare displacements obtained from the elastic data allowed the de-termination of activation energies and gave evidence that a hierarchyof motions contributes to the enzymatic activity. Diffusion constantsand residence times were extracted from the quasi-elastic broaden-ing.
Key words: neutron scattering, dynamics, model membranes, hydration,AChE, BChE, high hydrostatic pressure

Résumé
La diffusion incohérente élastique et quasi-élastique de neutrons aété utilisée pour mesurer la dynamique de membranes et de pro-téines à l’échelle de la pico- à la nanoseconde et de la longueur del’Ångstrom.La dynamique de membranes modèles DMPC, en fonction de l’hy-dratation a été étudiée par diffusion neutronique. Les expériencesélastiques ont, clairement montré un décalage de la température detransition de phase principale vers une température plus haute pourune diminution du niveau d’hydratation.Les mesures quasi-élastiques effectuées ont montré l’influence del’hydratation sur les mouvements diffusifs des têtes lipidiques. Dif-férents modèles ont été nécessaires pour affiner les dépendances enQ des facteur des structure élastiques incohérents et montrent doncla mobilité réduite due à l’hydratation inférieure.En plus de la température, la pression comme deuxième variablethermodynamique a été utilisée pour étudier la dynamique des mem-branes DMPC. L’ordre induit par l’application d’une pression a uneffet similaire à une hydratation diminuée, donc les deux approchessont complémentaires.Couvrant trois ordres de grandeur, la dynamique d’AChE libre oucomplexée avec de l’Huperzine A a été étudiée dans le domaine al-lant de 1 ns à 100 ps. Les déplacemnts carrès moyens obtenues àpartir des données élastiques ont permis la détermination des éner-gies d’activation et prouvent que toute une hiérarchie de mouve-ments contribue a l’activité enzymatique. Les constantes de diffusionet les temps de corrélation ont été extraits de l’élargissement quasi-élastique.
mots clefs : diffusion de neutrons, dynamique, membranes modèles, hy-dratation, AChE, BChE, pression hydrostatique