universiti putra malaysia application of mike 11 gis … filekayu ara dalam model pemetaan banjir....
TRANSCRIPT

UNIVERSITI PUTRA MALAYSIA
APPLICATION OF MIKE 11 GIS MODEL FOR MODELING OF FLOOD IN SUNGAI KAYU ARA CATCHMENT
SABARIAH BINTI ARBAI
FK 2002 91
A�LlCATION OF MIKE 1 1 GIS MODEL FOR MODELING OF FLOOD IN SUNGAI KA YU ARA CATCHMENT
SABARIAH BINTI ARBAI
MASTER OF SCIENCE UNIVERSITI PUTRA MALAYSIA
2002
APPLICATION OF MIKE 1 1 GIS MODEL FOR MODELING OF FLOOD IN SUNGAI KA YU ARA CATCHMENT
By
SABARIAH BINTI ARBAI
Thesis submitted to the School of Graduate Studies, Universiti Putra Malaysia,
In Fulfilment of the Requirement for the Degree of Master of Science
October 2002

Dedication ......... . To my beloved hJlSbond, parents, brothers, sisters
and sweet ones ..... Nurshabido, Salman FaiiJ Nursakinah Nabilah,
Nurfodhilah, Amin andAmirah Solehah
" .... It is God Who sends Forth the Winds, so that They raise up the Clouds, And We drive them,
To a land that is dead, And revive the earth therewith
After its death; even so (Will be) the Resumetion!... ... "
[AJ Fathir : 9]
ii
Abstract of thesis presented to the Senate of Universiti Putra Malaysia in fulfi lment of the requirement for the degree of Master of Science.
APPLICATION OF MIKE 1 1 GIS MODEL FOR MODELING OF FLOOD IN SUNGAI KA YU ARA CATCHMENT
Chairman
Faculty
By
SABARIAH BINTI ARBAI
October 2002
Associate Professor Dr. Noordin b Ahmad
Engineering
Flash flood occurring from fast development and socio-economic
growth within Klang Valley has imposed a huge strain impact onto the entire
urbanized areas. Accurate techniques in ascertaining flood estimation and
prediction would normally be able to propose beneficial solutions in
counteracting the phenomena. However, this would require up to date
rel iable data and effective hydrological model ing coupled to socio-economic
stud ies. These types of studies is time consuming and costly. Complex
models produce large quantities of result and difficult for people without
specialized backgrounds to understand . New modeling techniques and
computer visualization would improve the timeliness and accuracy of
hydrological analysis and flood forecasting. With the l imited data, complex
hydrological approaches could be accomplished .
This study intends to i l lustrate the capability of MIKE 1 1 GIS to
simulate the flood map for Sungai Kayu Ara in modeling the flood mapping.
Direct runoff hydrograph could be generated from the rating curve to be used
i i i
as the input data in preparing the simulation for the flash flood . Crucial
ground survey data as one of the significant criteria in producing reliable
flood elevation profile is examined .
The study also shows that Geographical I nformation System (GIS) is
capable to integrate spatial data and applying spatia l simulation from l imited
data. It is able assist in the understanding of the flooding physical processes
and in facilitating the decision-making . The flood simulation can further be
modeled with changes in land-use and curve numbers features pertaining to
the future development growth.
I n achieving the above objective, flood modeling was carried out on
Sungai Kayu Ara catchment area. In the process M I KE 1 1 GIS was used as
a database and data processor. The avai lable hydrological (rainfal l and
water-level) data acquired from the data of 1 996 to 1 998 , were used to
produce the flow simulation during the time of the storm event. This result of
the study shows that it is possible to use l imited hydrological data to map the
flash flood using M IKE 1 1 and M IKE 1 1 GIS. However, ground survey data
with cross sectional intervals of 75 m to 1 00 m used in the study was found to
be insufficient to provide adequately the elevation profile and further
refinement is neccessary.
iv
Abstrak tesis yang dikeluarkan kepada Senat Universiti Putra Malaysia sebagai memenuhi keperluan untuk ijazah Master Sains.
APPLIKASI MODEL MIKE 1 1 GIS BAGI MEMODELKAN BANJIR 01 TADAHAN SUNGAI KAYU ARA
Oleh
SABARIAH BINTI ARBAI
Oktober 2002
Pengerusi Profesor Madya Dr. Noordin b. Ahmad
Fakulti Kejuruteraan
Pembangunan yang pesat dan pertumbuhan sosio-ekonomi telah
mengakibatkan kejadian banj ir kilat di sekitar Lembah Klang. In i telah
memberikan kekangan impak yang lebih tinggi lagi ke atas keseluruhan
kawasan-kawasan membangun. Dalam mempastikan kejituan jangkaan
banj ir, teknik yang tepat bagi menangani fenomena sedemikian
berkeupayaan memberikan cadangan penyelesaian yang bermenfaat.
Namun, ia memerlukan kewujudan data yang ' reliable' dan model hidrologi
yang 'efektif' d i gandingkan kepada kajian-kajian sosio-ekonomi . Kajian-
kajian tersebut perlu memakan masa dan perbelanjaan yang tingg i . Model
yang kompleks menghasilkan kepelbagaian keputusan . lanya sukar untuk
difahami oleh kebanyakan masyarakat yang tiada latarbelakang khusus.
Teknik model yang baru berserta visualisasi komputer boleh mempertingkat
keberkesanan dari segi masa dan ketepatan analisa h id rolog i . Dengan data
yang terhad, pendekatan hidrologikal yang kompleks dapat d icapai .
Kajian in i berhasrat memaparkan keupayaan M I KE 1 1 dan M IKE 1 1
GIS untuk mengsimulasikan dan memetakan banj ir bagi kawasan Sungai
v
Kayu Ara dalam model pemetaan banjir. H idrograf larian terus (d irect runoff
hydrograph) boleh d ijana daripada lengkung kadaran sungai (rating curve)
bagi d ijad ikan sebagai data input di dalam menyediakan simulasi bagi banjir
kilat. 8agi menghasilkan profil paras banjir yang ' rel iable', model tersebut
sangat perlu kepada data ukur di tapak yang mana begitu mustahak. Maka
kriteria dan kepentingan data tersebut juga perlu dikaj i .
S istem Maklumat Geografi [SMG] berupaya mengintegrasi data ruang
(spatial) bagi membantu memberikan kefahaman proses fizikal banjir dan
sebagai pemudahcara kata-putus. lanya d ilakukan melalui simulasi ruang
dari data yang terhad. Selanjutnya, simulasi banj ir in i boleh d i modelkan
terhadap perubahan d i dalam guna-tanah dan nombor lengkung yang
dihasilkan dari pertumbuhan pembangunan .
Dalam mencapai objektif-objektif di atas, banj ir di kawasan tadahan
Sungai Kayu Ara telah dimodelkan dimana M IKE 1 1 GIS digunakan sebagai
pengkalan data serta memproses data. Data hidrologi (data hujan dan aras
air sungai) di antara tahun 1 996 hingga 1 998 telah di gunakan untuk
melakukan simulasi sewaktu hujan lebat dalam tempoh tersebut. Hasil
kajian menunjukkan bahawa penggunaan data h id rologi yang terhad untuk
memeta banj ir ki lat boleh d i lakukan melalui M IKE 1 1 dan M IKE 1 1 GIS. Data
ukur yang telah d igunakan d i dalam kajian in i adalah dari data tapak dengan
sela keratan rentas sungai antara 75 m dan 1 00 m. lanya adalah didapati
tidak memadai untuk memberi profil ketinggian aras air sungai yang wajar
dan perlu kepada ketelitian selanjutnya.
vi

ACKNOWLEDGEMENTS
Alhamdul i l lah , first and foremost, praise be to Allah S .W.T. for g iving me the
faith , endurance, wisdoms and patience in completion of the Masters course.
I am obliged to the BLPS of Universiti Teknologi Mara (UiTM) for sponsoring
me to attend the Master Course in Remote Sensing and Geographical
Information System at Universiti Putra Malaysia.
My highest respect goes to Associate Prof. Dr. Noordin b. Ahmad , Assoc.
Prof Dr. Shattri b . Mansor and Dr. Muhamad Radzali b. M ispan , members of
my Supervisory Committee and thank you to Encik Abdul Hal im Ghazal i for
help and the gu idance they have g iven .
Special thanks go to Mr Low Koon Seng and Puan Yuslina bt Mohd Sani
from Water Resources Unit, Drainage and I rrigation Department (JPS) for the
assistance and supply of guidelines and hydrological data. I am indebted to
Puan Zali lah Selamat and Encik Arshad from the National Hydraulic
Research I nstitute of Malaysia (NAHRIM) for the permission and assistance
of using the M IKE 11 GIS software. My appreciation a lso goes to the Survey
& Mapping Department, Malaysia for the supply of the topographical map.
I would l ike to offer my appreciations to Dr Wan Mohd Naim b Wan Mohd
from Faculty of Architecture , Planner and Surveying , Universiti Teknologi
Mara (UiTM) as well as the laboratory staffs from Geometic and Surveying
Department, U iTM, for the privileged use of the Geometic laboratory and
vii
provid ing technical advice in the use of the GIS software. I am also grateful
to Puan Wardah bt Tahir, Dr Hamidah Mat Saman and I r Bahardin Baharom
from Faculty of Civil Engineering , U iTM for the technical opinion regarding
surface runoff and some Excel manipulation . I am grateful to Encik Faizu b
Hassan from MACRES for his assistance in facilitating the land-use image.
As with any project, this study could not have been undertaken without the
support and aid of many ind ividuals, some of their names not mentioned
here, and which I am indebted and could not be repay by my sincere thanks.
Last but not least, my warmest appreciation, a bouquet of love and prayer to
my husband, Encik Zaini b Abdul Rahman, my parents, brothers and sisters
and my ch ildren for their constant supports and efforts throughout my study.
Thank you very much .
Sabariah bt Arbai
viii

I certify that an Examination Committee met on 29th October 2002 to conduct the final examination of Sabariah bt Arbai on her Master of Science thesis entitled "Appl ication of MIKE 1 1 GIS Model for Modeling of Flood in Sungai Kayu Ara Catchment" in accordance Universiti Pertanian Malaysia (Higher Degree) Act 1 980 and Universiti Pertanian Malaysia (Higher Degree) Regulations 1 981 . The committee recommends that candidate be awarded the relevant degree. Members of the Examination Committee are as follows:
ABDUL HALIM GHAZALI Faculty of Civil Engineering, Universiti Putra Malaysia
(Chairman)
NOORDIN AHMAD, Ph.D. Associate Professor Faculty of Engineering Universiti Putra Malaysia (Member)
SHATTRI BIN MANSOR, Ph.D. Associate Professor Faculty of Engineering Universiti Putra Malaysia (Member)
MUHAMAD RADZALI BIN MISPAN, Ph.D. Faculty of Engineering Universiti Putra Malaysia (Member)
AMSHER MOHAMAD RAMADILI, Ph.D. Professor/Deputy Dean School of Graduate Studies Universiti Putra Malaysia
Date: '1 4 JAN 2003'
ix

This thesis submitted to the Senate of Universiti Putra Malaysia has been accepted as fulfi lment of the requirements for the degree of Master of Science. The members of the Supervisory Committee are as follows:
NOORDIN AHMAD, Ph.D. Associate Professor Faculty of Engineering Un iversiti Putra Malaysia (Member)
SHATTRI BIN MANSOR, Ph.D. Associate Professor Faculty of Engineering Universiti Putra Malaysia (Member)
MUHAMAD RADZALI BIN MISPAN, Ph.D. Faculty of Engineering Universiti Putra Malaysia (Member)
AINI IDERIS, Ph.D. Professor/Dean , School of Graduate Studies, Universiti Putra Malaysia
Date: 1 3 FEB 2003
x

DeCLARA liON
I hereby certify that the thesis is based on my original work except for quotations and citations, which have been duly acknowledged. I also declare that it has not been previously or concurrently submitted for any other degree at UPM or other institutions.
�BAI
Date: 1 err�"fAA� )(tdJJ
xi
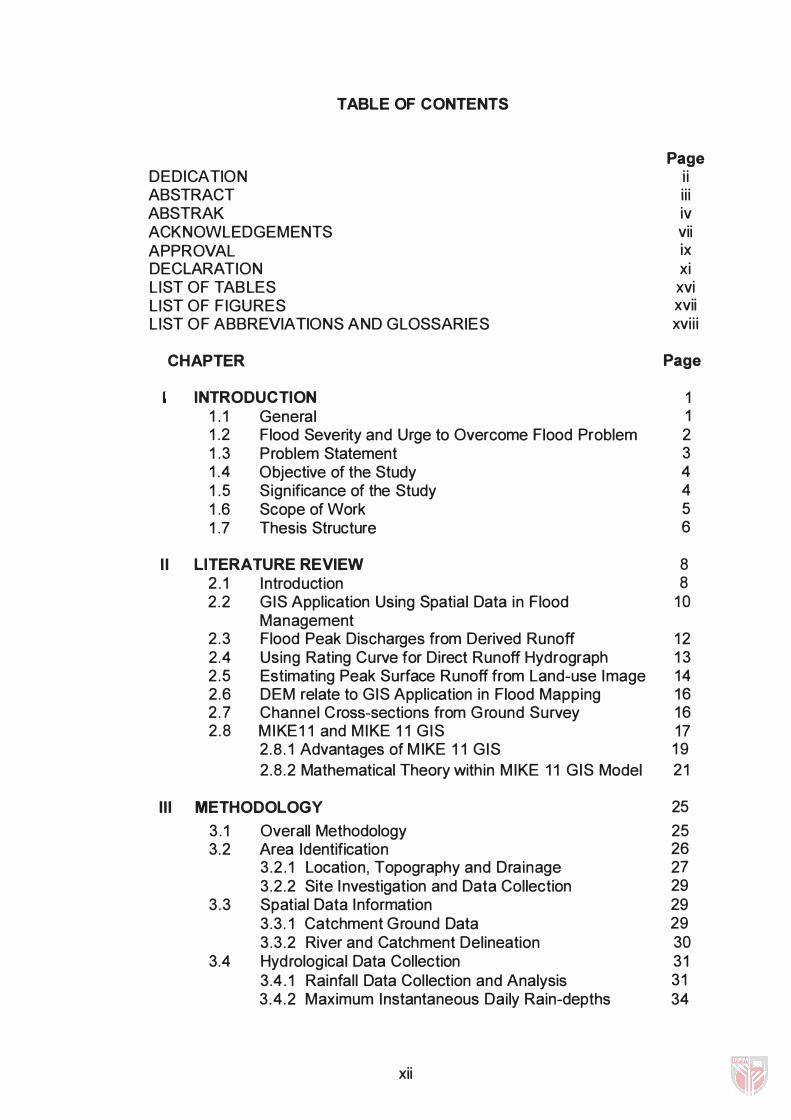
TABLE OF CONTENTS
Page DEDICATION i i ABSTRACT ii i ABSTRAK iv ACKNOWLEDGEMENTS vii APPROVAL ix DECLARATION xi LIST OF TABLES xvi LIST OF FIGURES xvii L IST OF ABBREVIATIONS AND GLOSSARIES xvi i i
CHAPTER Page
INTRODUCTION 1 1 . 1 General 1 1 .2 Flood Severity and Urge to Overcome Flood Problem 2 1 .3 Problem Statement 3 1 .4 Objective of the Study 4 1 .5 Significance of the Study 4 1 .6 Scope of Work 5 1 .7 Thesis Structure 6
II LITERATURE REVIEW 8 2 . 1 Introduction 8 2 .2 GIS Application Using Spatial Data in Flood 1 0
Management 2 .3 Flood Peak Discharges from Derived Runoff 1 2 2.4 Using Rating Curve for Direct Runoff Hydrograph 1 3 2 .5 Estimating Peak Surface Runoff from Land-use Image 14 2 .6 DEM relate to GIS Application in Flood Mapping 1 6 2 .7 Channel Cross-sections from Ground Survey 1 6 2 .8 M I KE1 1 and M IKE 1 1 G IS 17
2 .8 . 1 Advantages of M IKE 1 1 GIS 1 9 2 .8 .2 Mathematical Theory within M IKE 1 1 GIS Model 21
III METHODOLOGY 25
3 . 1 Overall Methodology 25 3.2 Area Identification 26
3 .2 . 1 Location, Topography and Drainage 27 3 .2 .2 Site I nvestigation and Data Collection 29
3 .3 Spatial Data Information 29 3 .3 . 1 Catchment Ground Data 29 3 .3 .2 River and Catchment Delineation 30
3.4 Hydrological Data Collection 31 3 .4 . 1 Rainfall Data Col lection and Analysis 31 3 .4 .2 Maximum Instantaneous Daily Rain-depths 34
xii
3.5
3 .6
3 .7
3 .8
3 .9
3 . 1 0
3 . 1 1
3 .4 .3 Information on Percentage Difference Comparing Rainfall Records
3.4.4 Thiessen Polygon Maximum Rainfal l Analysis 3.4.5 Water Level and Discharge Data Col lection and
Analysis Peak Runoff values for M IKE 1 1 Hydrodynamic Data Input 3 .5 . 1 Deriving Peak Discharge for Direct Runoff using
Rating Curve 3 .5 .2 Q peak: Computation and Sample Calculation Calibration of Direct Runoff Using SCS Unit Hydrograph 3 .6. 1 Image Data Acquisition for Land-use Curve
Number Determination 3 .6 .2 Curve Number of Sungai Kayu Ara Catchment 3 .6 .3 Sample Calculation SCS Parameters and Peak
Hydrograph 3 .6 .4 Adjusted Lag time, tp* for Sub-catchment IV 3 .6 .5 Calibration Output Modeling of Flood for Sungai Kayu Ara Catchment M IKE 1 1 GIS in Flood Study Sungai Kayu Ara 3 .7 . 1 Overall Procedure in Mapping Flood for Sungai
Kayu Ara Catchment Area, using M IKE 1 1 and M IKE 1 1 GIS
3 .7 .2 Preparation of the Modeling For Sungai Kayu Ara Catchment using M IKE 1 1 GIS
Creating Sungai Kayu Ara River Network Model Using M IKE 1 1 3.8 . 1 Creation of the River Network Model for Kayu
Ara River 3 .8 .2 Creation of River Cross Section Input File for
Kayu Ara River Network 3 .8 .3 Creation of Time Series and Boundary
Conditions Files 3 .8 .4 Hydrodynamic Parameters input for Flood
Simulation 3 .8 .5 Running Flood Simulation - Obtain Elevation
Profile of Sungai Kayu Ara Flash Flood Develop the Link between M IKE 1 1 GIS and M IKE 1 1 3 .9 . 1 Branch Route System (BRS) for Sungai Kayu
Ara Catchment 3 .9 .2 Importing MSD Data into M IKE 1 1 GIS 3 .9 .3 Extracting Simulation Results from Different
Points against Time Creation of the Flood Map for M IKE 1 1 GIS Kayu Ara River Model Software Requirement
xiii
36
38 40
40
40
42 46
47
50 50
54 54 55 40
56
56
58
59
60
63
67
67
68 68
69 69
70
70
IV RESUL TS AND DISCUSSIONS 72
4 . 1 I ntroduction 72 4 . 1 . 1 Derivation of Direct Runoff From Rating Curve 73 4.1.2 Simulation Output Producing Flood Elevation Profile 74 4 . 1 .3 Flood Modeling using M I KE 1 1 G IS 79 4 . 1 .4 F lood Map Generation 8 1 4 . 1 .4 Data Verification and Difficulties Encountered 8 1
4.2 Discussions 88 4.2. 1 Assumptions 88 4.2.2 Limitations 89
V CONCLUSION AND RECOMMENDATIONS 91
5. 1 Conclusion 91 5 . 1 . 1 Modeling flood using M IKE 1 1 G IS from Direct 91
Runoff Hydrograph 5 . 1 .2 Hydrodynamic flood modeling 9 1 5 . 1 .3 Sufficient Ground River Data 91 5 . 1 .4 I ntegrating Numerical River Modelling
Technologies into GIS 92 5 .2 Recommendations for Further Stud ies 93
5.2. 1 Quantitative Studies on Variations in 93 Hydrodynamic Parameters
5.2.2 Comparative Studies for Variations in Slope 93 Channels
5 .2 .3 GIS and Hydrological Modelling Capabil ity 94 5 .2.4 Powerful Automotive Support System 94
REFERENCES 96 APPENDICES
1 Map Showing Kayu Ara River Outflow into Damansara 1 0 1 2 Photographs Taken from Site Visits 1 02 3 List of Drawing Plans 1 06 4 Samples of Ground Survey Drawings 1 07 5 Sample Sungai Kayu Ara Cross Sections Data Plot 1 08
from Ground Survey 6 Ground Verification - GPS Observation 1 1 0 7 Sample Raw Rainfal l and Water level Data 1 1 2 8 List of Max Daily Rain-depth and Max Instantaneous 1 14
Water Level w.r.t. Dates ( 1 998/1 999) 9 Sample Thiessen Polygon Manual Analysis for Rainfall 1 1 6
Stations R4, R6, R8, R9 , R 1 0 , R 1 1 , R 1 2, R14 , R1 5 1 0 Sample Data Computation for Discharge, Direct runoff 1 1 7
and Unit Hydrograph 1 1 Land-use Description Code 1 22 1 2 Curve Numbers for Selected Soil Types and Land-use 1 23
(Soil Conservation Services) 1 3 Channel Improvement Factor and Impervious Factors 1 24
VITA
xiv
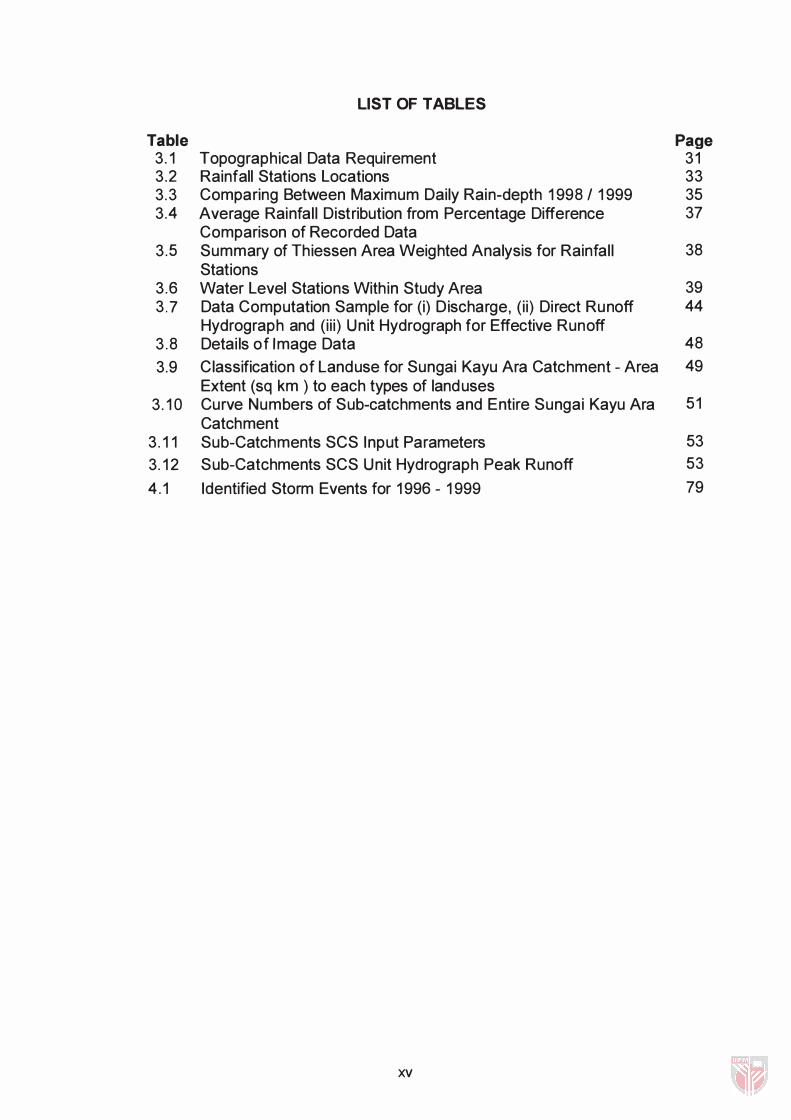
LIST OF TABLES
Table Page 3. 1 Topographical Data Requirement 31 3.2 Rainfall Stations Locations 33 3.3 Comparing Between Maximum Daily Rain-depth 1 998 I 1 999 35 3.4 Average Rainfal l Distribution from Percentage Difference 37
Comparison of Recorded Data 3 .5 Summary of Thiessen Area Weighted Analysis for Rainfal l 38
Stations 3 .6 Water Level Stations Within Study Area 39 3.7 Data Computation Sample for (i) Discharge, (i i) Direct Runoff 44
Hydrograph and (i i i) Unit Hydrograph for Effective Runoff 3 .8 Detai ls of Image Data 48
3.9 Classification of Landuse for Sungai Kayu Ara Catchment - Area 49 Extent (sq km ) to each types of land uses
3 . 1 0 Curve Numbers of Sub-catchments and Entire Sungai Kayu Ara 51 Catchment
3 . 1 1 Sub-Catchments SCS Input Parameters 53
3. 1 2 Sub-Catchments SCS Unit Hydrograph Peak Runoff 53
4 . 1 Identified Storm Events for 1 996 - 1 999 79
xv
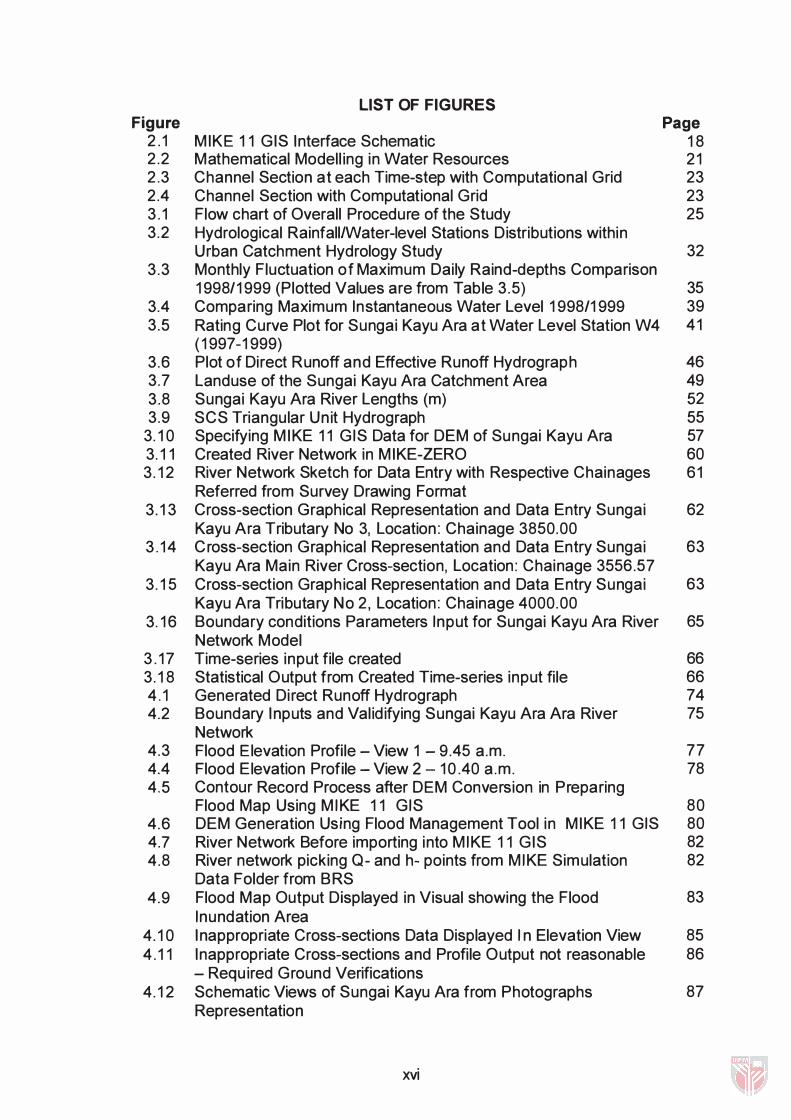
LIST OF FIGURES Figure Page
2 . 1 M IKE 1 1 G IS Interface Schematic 1 8 2.2 Mathematical Modell ing in Water Resources 21 2.3 Channel Section at each Time-step with Computational Grid 23 2.4 Channel Section with Computational Grid 23 3 . 1 Flow chart of Overall Procedure of the Study 25 3.2 Hydrological RainfalllWater-level Stations Distributions within
Urban Catchment Hydrology Study 32 3 .3 Monthly Fluctuation of Maximum Daily Raind-depths Comparison
1 998/1 999 (Plotted Values are from Table 3 .5) 35 3.4 Comparing Maximum Instantaneous Water Level 1 998/1 999 39 3 .5 Rating Curve Plot for Sungai Kayu Ara at Water Level Station W4 41
( 1 997-1 999) 3 .6 Plot of Direct Runoff and Effective Runoff Hydrograph 46 3.7 Landuse of the Sungai Kayu Ara Catchment Area 49 3 .8 Sungai Kayu Ara River Lengths (m) 52 3.9 SCS Triangular Un it Hydrograph 55
3. 1 0 Specifying M I KE 1 1 G IS Data for DEM of Sungai Kayu Ara 57 3. 1 1 Created River Network in M IKE-ZERO 60 3 . 1 2 River Network Sketch for Data Entry with Respective Chainages 61
Referred from Survey Drawing Format 3 . 1 3 Cross-section Graphical Representation and Data Entry Sungai 62
Kayu Ara Tributary No 3, Location : Chainage 3850.00 3 . 1 4 Cross-section Graph ical Representation and Data Entry Sungai 63
Kayu Ara Main River Cross-section, Location: Chainage 3556 .57 3 . 1 5 Cross-section Graph ical Representation and Data Entry Sungai 63
Kayu Ara Tributary No 2, Location : Chainage 4000.00 3. 1 6 Boundary conditions Parameters Input for Sungai Kayu Ara River 65
Network Model 3 . 1 7 Time-series input file created 66 3 . 1 8 Statistical Output from Created Time-series input fi le 66 4 . 1 Generated Direct Runoff Hydrograph 74 4.2 Boundary I nputs and Val id ifying Sungai Kayu Ara Ara River 75
Network 4 .3 Flood E levation Profile - View 1 - 9 .45 a .m. 77 4.4 Flood Elevation Profile - View 2 - 1 0 .40 a .m . 78 4.5 Contour Record Process after DEM Conversion in Preparing
Flood Map Using M I KE 1 1 GIS 80 4 .6 DEM Generation Using Flood Management Tool in M IKE 1 1 GIS 80 4.7 River Network Before importing into M IKE 1 1 G IS 82 4 .8 River network picking Q- and h- points from M IKE Simulation 82
Data Folder from BRS 4 .9 Flood Map Output Displayed in Visual showing the Flood 83
Inundation Area 4. 1 0 I nappropriate Cross-sections Data Displayed I n Elevation View 85 4 . 1 1 Inappropriate Cross-sections and Profile Output not reasonable 86
- Requ ired Ground Verifications 4 . 1 2 Schematic Views of Sungai Kayu Ara from Photographs 87
Representation
xvi
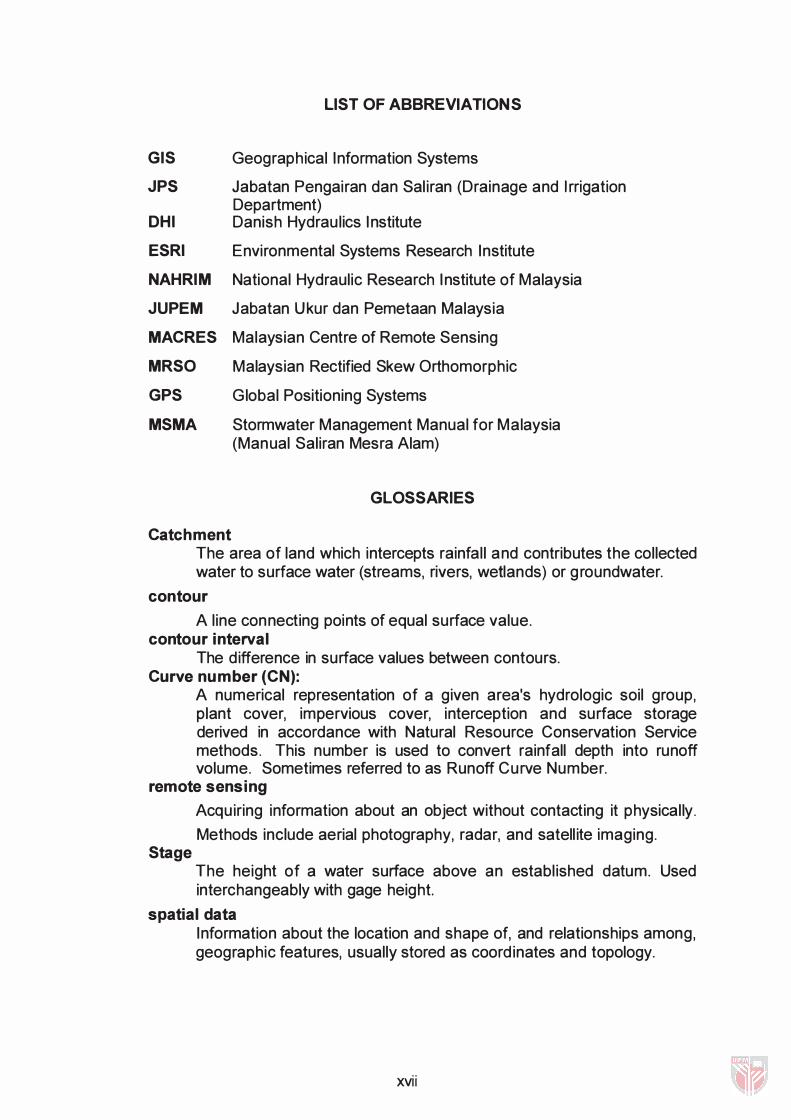
LIST OF ABBREVIATIONS
GIS Geographical Information Systems
JPS Jabatan Pengairan dan Sal iran (Drainage and Irrigation Department)
DHI Danish Hydraulics I nstitute
ESRI Environmental Systems Research Institute
NAHRIM National Hydraulic Research I nstitute of Malaysia
JUPEM Jabatan Ukur dan Pemetaan Malaysia
MACRES Malaysian Centre of Remote Sensing
MRSO Malaysian Rectified Skew Orthomorphic
GPS
MSMA
Global Positioning Systems
Stormwater Management Manual for Malaysia (Manual Saliran Mesra Alam)
GLOSSARIES
Catchment The area of land which intercepts rainfal l and contributes the collected water to surface water (streams, rivers, wetlands) or groundwater.
contour
A line connecting points of equal surface value. contour interval
The difference in surface values between contours. Curve number (CN):
A numerical representation of a given area's hydrologic soil group, plant cover, impervious cover, interception and surface storage derived in accordance with Natural Resource Conservation Service methods. This number is used to convert rainfall depth into runoff volume. Sometimes referred to as Runoff Curve Number.
remote sensing
Stage
Acquiring information about an object without contacting it physical ly.
Methods include aerial photography, radar, and satell ite imaging.
The height of a water surface above an establ ished datum. Used interchangeably with gage height.
spatial data I nformation about the location and shape of, and relationships among, geographic features, usually stored as coord inates and topology.
xvii
1 .1 General
CHAPTER I
INTRODUCTION
Flood or the water accumulation during storm, generates a large amount of
runoff which overtops the river bank and flows onto the floodplain , inundating
the low-lying areas. Malaysia, as a tropical country, is obviously subjected to
heavy rainfal l concentrated in short duration during certain months in a year
(Junaidah et aI . , 1 998). Heavy rainfal l also causes high runoff peak flow, in
short duration leading to flash flood occurrences.
Fast land development and urbanization process will cause tremendous
hydrological impacts due to land cover changes. It a lso leads to an increase
in peak runoff and/or a decrease in time of concentration . Peak values could
pred ict flood as it depends upon the coefficient of rainfal l-runoff. Soil curve
number (CN) is closely related to the coefficient of rainfall-runoff, by a d irect
assumption whereby CN values could be divided by 1 00 to obtain the
coefficients (JPS, 1 999; Bedient and Huber, 1 987) . These parameters
depend h igh ly on the land-use of a particular area and its changes
(Chow et aI . , 1 988). Urbanization from land-use changes results to a
decrease in the infiltration capacity and increase in the resulting runoff.
I ncrease in the density of bui ld ings from industrialization process also
1
contributes to an increase in pol lution concentration levels in the atmosphere.
This d isturbs the environment and affects the hydrolog ical cycle.
Previous studies indicated that an increase in rainfal l intensity and flood
frequency is caused by urbanization and industrialization
(Rustam et aI . , 2000; Annon . , 1 994) . Flood prevention and rehabil itation
work would require great efforts and carrying out continuous studies to
catalyze the achievement of sustainable environment. Klang Val ley's green
areas are reported to have been reduced by 21 % between 1 988 and 1 998
due to forest clearing, conversion of plantations into development projects and
lack of co-ord ination during the planning stage (New Straits Times,
May 2nd 200 1 ) .
1 .2 Flood Severity and Urge to Overcome Flood Problem
Flood effects may cause death and traffic disruptions. Although the severity
due to flood in Malaysia is not as serious as that in Bang ladesh, but damages
on infrastructures, commercial value losses and l ives threat have insisted
large annual expenses to control floods (Chan, 1 995) . Flood studies could
contribute to counteracting effects of hydrological changes and provide a
better drainage system without affecting the infiltration capacity. They should
also conform to the latest guidelines such as the Urban Stormwater
Management Manual for Malaysia Volume 4 (D ID , 2000). Obviously, critical
impacts of flash flood are serious especially on urbanized areas of high socio
economic growth and rapid land-cover change. Developing and improvising
2
models is an endless process, requiring data preparation and most likely, the
results could only be obtained through complicated procedures and expenses.
Nevertheless, it is beneficial to educate the public to make them well-informed
and hence assisting them to participate in working out the flood problems.
The profile output from flood through hydrological data processing would
enhance a better representation and would assist authorities to improve their
contingencies preparation for public alarms .
1 .3 Problem Statement
A complete solution for flood problem in Malaysia has not actually been met.
Nevertheless, al l parties involved in planning, decision-making and managing
the development are to conform to the sustainable environmental
requirement. To date, no standard approach or technique of flood
management has been col lectively adopted by participating agencies, since
each has individual respective areas suitability and limitation of application.
New modeling techniques, radar technologies and computer visualization
facilities, hold significant promise for improving flood forecasts and warnings.
However, the situational condition could only be described from ground
survey information .
Flood modeling is applicable i n simulating historical flood events using
hydrological (rainfal l I water level) data. These data combined with the river
ground survey data produce very significant flood mapping and would be very
understandable for everyone.
3
Flood mapping from real-time storm events will assist in producing a more
precise prediction of future events. The thesis is a study of an alternative
flood modeling technique by using M IKE-1 1 GIS and incorporating ground
based verification .
1 .4 Objective of the Study
The objective of the study is to use the M IKE 1 1 G IS Model to simulate the
flood map for Sungai Kayu Ara Catchment.
1 .5 Significance of the Study
This study has its significant contribution to Malaysian environment especially
to assist relevant departments in modeling flood . It would also be able to
highl ight the possibi l ity of producing a flash flood from the direct runoff
generated from the rating curve relationship of the water level to the
discharge. A preliminary hydrological data preparation of the rainfal l event
would be done. It also util ises the processed spatial data from remote
sensing to classify land-use and to pred ict soil curve number of the respective
land-use area. This is useful for determining the calibration flood peak
discharge. This study also makes use of the river ground survey data. This
study would elucidate in better understanding of the physical processes and
would be able to assist in decision-making . This study would assist relevant
department to highl ight flood problem with better contingency preparation.
4
1 .6 Scope of Work
The whole process involves several stages beginning from the l iterature
reviews, then to data processing and analysis, which involve processes in
handling hydrological data, river ground data and image capturing. The
identified data are processed and util ized for simulation input to produce
intermediate output. Interpolation would be performed to l ink the simulation
output into GIS flood model using ARCVIEW inter-phase software known as
MIKE 1 1 -GIS . The scope include the fol lowing:
1 ) Identification of study area which includes i) topographical data
acquisition , ii) scanning and d igitizing of river network, road , sub-catchment
d ivision and i i i) g round river data collection and information extraction from
surveyors drawings.
2) Processing hydrological data by performing i) rainfal l data analysis for
current storm events and return periods and i i) river data analysis;
3) Determination of direct runoff hydrograph , the hydrodynamic data input
for M IKE 1 1 flood simulation ;
4) Image processing from Spot Panchromatic data involving image data
capturing and land-use identification deriving soil curve numbers for the
catchment. Computation of peak discharge using Soil Conservation Services
(SCS) method for calibration ;
5) Application of M IKE1 1 , performing procedures of i) data input for river
network, cross-section, boundary conditions, time series, and i i) the simulation
of flood elevation profile;
5
6) Applying M I KE1 1 -GIS for i) OEM display of river network from image
data, ii) data retrieval from flood simulation, iii) flood mapping, by developing
the link between M I KE 1 1 G IS and MIKE 1 1 . Subsequently, this would enable
the creation of F lood Map and displaying the Animation file developed .
1 .7 Thesis Structure
A total of five chapters were covered in this thesis. Chapter I consists of the
general introduction , problem statement and objectives of the study. Chapter
I I presents the literature review of previous studies related to the research . It
concisely explains on the terms and issues related to the study.
Chapter I I I explains the methodology of the work carried out to achieve the
objectives of this study. I t covers a brief description of the site investigation
carried out on the study area, the background description of the study area
and explanation related to urban catchment. This chapter also describes on
the data col lection and processing. It also describes on preparing the flood
model for Sungai Kayu Ara elaborating on the file creation for the flood
simulation and data input. This chapter a lso elaborates the simulating
process carried out using M I KE 1 1 application to produce the flood elevation
profile for Sungai Kayu Ara. This chapter also explains the process carried
out to link the flood simulation result into M IKE 1 1 G IS for the flood map
generation .
6