university of birmingham body mass index and diabetes risk
TRANSCRIPT

University of Birmingham
Body mass index and diabetes risk in fifty-sevenlow- and middle-income countriesTeufel , Felix ; Seiglie , Jacqueline A. ; Geldsetzer, Pascal; Theilmann, Michaela; Marcus ,Maja-Emilia ; Ebert, Cara; Lopez Arboleda , William Andres ; Agoudavi, Kokou; Andall-Brereton, Glennis; Aryal, Krishna K; Brian, Garry; Bovet, Pascal; Dorobantu, Maria; SinghGurung, Mongal; Guwatudde, David; Houehanou, Corine; Houinato, Dismand; Jorgensen,Jutta Mari Adelin; Kagaruki, Gibson B; Karki, Khem BDOI:10.1016/S0140-6736(21)00844-8
License:Creative Commons: Attribution-NonCommercial-NoDerivs (CC BY-NC-ND)
Document VersionPeer reviewed version
Citation for published version (Harvard):Teufel , F, Seiglie , JA, Geldsetzer, P, Theilmann, M, Marcus , M-E, Ebert, C, Lopez Arboleda , WA, Agoudavi,K, Andall-Brereton, G, Aryal, KK, Brian, G, Bovet, P, Dorobantu, M, Singh Gurung, M, Guwatudde, D,Houehanou, C, Houinato, D, Jorgensen, JMA, Kagaruki, GB, Karki, KB, Labadarios, D, Martins, JS, Mayige, MT,McClure, RW, Mwangi, JK, Mwalim, O, Norov, B, Crooks , S, Farzadfar, F, Moghaddam, SS, Silver, BK, Sturua,L, Wesseh, CS, Stokes, A, Essien , UR, Neve , J-WDPG, Atun, R, Davies, J, Vollmer, S, Bärnighausen, TW, Ali,MK, Meigs , JB, Wexler , DJ & Manne-Goehler, J 2021, 'Body mass index and diabetes risk in fifty-seven low-and middle-income countries: a cross-sectional study of nationally representative individual-level data', TheLancet, pp. 238-248. https://doi.org/10.1016/S0140-6736(21)00844-8
Link to publication on Research at Birmingham portal
General rightsUnless a licence is specified above, all rights (including copyright and moral rights) in this document are retained by the authors and/or thecopyright holders. The express permission of the copyright holder must be obtained for any use of this material other than for purposespermitted by law.
•Users may freely distribute the URL that is used to identify this publication.•Users may download and/or print one copy of the publication from the University of Birmingham research portal for the purpose of privatestudy or non-commercial research.•User may use extracts from the document in line with the concept of ‘fair dealing’ under the Copyright, Designs and Patents Act 1988 (?)•Users may not further distribute the material nor use it for the purposes of commercial gain.
Where a licence is displayed above, please note the terms and conditions of the licence govern your use of this document.
When citing, please reference the published version.
Take down policyWhile the University of Birmingham exercises care and attention in making items available there are rare occasions when an item has beenuploaded in error or has been deemed to be commercially or otherwise sensitive.
If you believe that this is the case for this document, please contact [email protected] providing details and we will remove access tothe work immediately and investigate.
Download date: 26. Nov. 2021

Appendix: Body mass index and diabetes risk in fifty-seven low- and middle-income countries: a cross-sectional study of nationally representative individual-level data
Appendix 1: Data Search process-STEPS surveys .................................................................................. 3
Appendix 2: Search methods for low- and middle-income countries that did not have an eligible WHO STEPS survey .......................................................................................................................................... 4
Appendix 3: Flow diagram for participant inclusion in the analysis ....................................................... 5
Appendix 4: Country categories* ............................................................................................................ 6
Appendix 5: Country-Specific Sampling Methods ................................................................................. 6
Appendix 6: Detailed methodology for diabetes biomarkers by country .............................................. 33
Appendix 7: Fasting requirements per survey ....................................................................................... 34
Appendix 8: Detailed methodology for household wealth index calculation ........................................ 35
Appendix 9. Characteristics of the study population, overall ................................................................ 36
Appendix 10. Proportion of people with diabetes taking diabetes medications .................................... 36
Appendix 11. Demographic characteristics of the study population, by country .................................. 37
Appendix 12. Missing variables in the study sample and among those with missing diabetes biomarker ............................................................................................................................................................... 39
Appendix 13. Prevalence of diabetes, overweight, and obesity, by geographic region ........................ 40
Appendix 14. Multivariable regression models of categorical BMI and diabetes, by sex and geographic region ..................................................................................................................................................... 41
Appendix 15. Country-sex stratified risk ratios of BMI and diabetes ................................................... 42
Appendix 16. Country-sex stratified risk ratios of BMI and fasting blood glucose .............................. 43
Appendix 17. Geographic region-sex-age stratified generalized additive models of BMI and diabetes ............................................................................................................................................................... 44
Appendix 18. Global- and geographic region-sex stratified risk ratios of BMI and diabetes ............... 45
Appendix 19. Global- and geographic region-sex stratified risk ratios of BMI and fasting blood glucose ................................................................................................................................................... 46
Appendix 20. Risk ratios of BMI and diabetes (multiple imputation) .................................................. 47
Appendix 21. Risk ratios of BMI and diabetes (univariate analysis) .................................................... 48
Appendix 22. Risk ratios of BMI and diabetes controlling for education ............................................ 49
Appendix 23. Risk ratios of BMI and diabetes controlling for wealth .................................................. 50
Appendix 24. Risk ratios of BMI and diabetes including self-reported diabetes .................................. 51
Appendix 25. Risk ratios of BMI and diabetes including age polynomials .......................................... 52
Appendix 26. Logistic regression of BMI and diabetes ........................................................................ 53
Appendix 27. Risk ratios of BMI and diabetes using alternative weights............................................. 54
Appendix 28. Risk ratios of BMI and diabetes, stratified by survey year ............................................. 55
Appendix 29. Risk ratios of BMI and diabetes, assuming that all countries had a plasma glucose equivalent .............................................................................................................................................. 56
Appendix 30. Risk ratios BMI and diabetes among individuals with diabetes not on pharmacologic treatment ................................................................................................................................................ 57
Appendix 31. Risk ratios BMI and diabetes, defined according to HbA1c and fasting plasma glucose ............................................................................................................................................................... 58

2
Appendix 32. Univariate analysis of body mass index categories and diabetes ................................... 59
Appendix 33. Risk ratios of body mass index categories and diabetes controlling for education ........ 60
Appendix 34. Risk ratios of body mass index categories and diabetes controlling for wealth ............. 61
Appendix 35. Risk ratios of body mass index categories and diabetes including self-reported diabetes ............................................................................................................................................................... 62
Appendix 36. Risk ratios of body mass index categories and diabetes including age polynomials ...... 63
Appendix 37. Risk ratios of body mass index categories and diabetes using alternative weights ........ 64
Appendix 38. Risk ratios of additional body mass index categories and diabetes ................................ 65
Appendix 39. Risk ratios of body mass index categories and diabetes risk, assuming that all countries had a plasma glucose equivalence ......................................................................................................... 66
Appendix 40. Risk ratios of body mass index categories and diabetes risk among individuals with diabetes who were not on pharmacologic treatment ............................................................................. 67
Appendix 41. Risk ratios of body mass index categories and diabetes risk based on HbA1c and fasting plasma glucose ...................................................................................................................................... 68
Appendix 42. Country-sex stratified risk ratios of body mass index and HbA1c / RBG ...................... 69
Appendix 43: Country-specific contact information regarding accessing data used in this study ........ 70
Appendix 44: STROBE checklist .......................................................................................................... 71

3
Appendix 1: Data Search process-STEPS surveys
Inclusion criteria for a survey: (1) The survey was conducted during or after 2008; in cases where two surveys were eligible and
available for a particular country, the most recent survey was used; (2) The survey data were made available at the individual level; (3) The survey was conducted in an upper-middle, lower-middle or low-income country
according to the World Bank at the time the survey was conducted; (4) The survey was nationally representative; (5) The survey had a response rate ≥50%; (6) The survey contained a biomarker for diabetes (either a glucose measurement or HbA1c) (7) The surveys contained height and weight
We first identified all countries in which a World Health Organization (WHO) Stepwise Approach to Surveillance (STEPS) survey had been conducted during a year in which the country fell into an eligible World Bank country income category of low-income or middle-income. Prior to the STEPS surveys being made available in the WHO STEPS survey Central Data Catalog in 2019, we systematically requested each eligible STEPS survey from a list of these surveys that the WHO maintains on their website. The research team contacted the responsible party for each survey, based on the information provided on this website. If the contact information was out dated or unavailable, the authors relied on publications utilizing STEPS data and electronic searches of the survey or contact name. For the Caribbean region, country involvement was facilitated by the Caribbean Public Health Agency (CARPHA). In 2019, additional eligible surveys were downloaded from the Central Data Catalog. The search words used in the WHO Central Data Catalog were: (1) STEPS collection, (2) surveys conducted ≥2008, (3) low-and middle-income countries. The flow diagram below reflects the most recent systematic search of STEPS surveys to date (February, 2021).
**Tokelao and Niue do not have a GNI or LMIC classification according to the World Bank
134 STEPS surveys (129 in the Central Data Catalog)
n=37 conducted before 2008 n=11 surveys corresponding to high-income countries n=2 surveys without GNI/LMIC classification* n=1 survey response rate <50% n=10 subnational n=8 no biomarker for diabetes n=9 newer survey included n=1 pending eligibility assessment
55 eligible STEPS surveys
n=49 STEPS
surveys included
n=6 surveys not yet included in data set

4
Appendix 2: Search methods for low- and middle-income countries that did not have an eligible WHO STEPS survey Search engine: Google Search terms: “[country name]” AND (“population-based” OR household) AND (“blood glucose” OR “plasma glucose” OR “blood sugar” OR hemoglobin OR haemoglobin OR A1c OR HbA1c OR A1C OR Hb1c OR Hba1c OR HGBA1C OR “blood pressure” OR hypertension OR hypertensive OR cholesterol OR LDL OR HDL OR lipoprotein OR triglycerides OR triglyceride OR lipid OR lipids). Number of hits reviewed: Hits reviewed until eligible survey identified, or, in the case of no eligible survey identified, first 50 hits (10 hits per page/5 pages reviewed) Search engine: Demographic and Health Surveys (DHS) Data Search process: We conducted a separate search to identify eligible DHS surveys with the following criteria: (1) survey conducted during or after 2008, (2) diabetes testing available. Inclusion criteria for a survey was the same as for STEPS surveys described in Appendix 1 Countries included in search: Albania, American Samoa, Angola, Argentina, Armenia, Belize, Bolivia, Bosnia and Herzegovina, Brazil, Bulgaria, Burundi, Cabo Verde, Cameroon, Central African Republic, Chad, Chile, China, Colombia, Côte d'Ivoire, Cuba, Democratic People's Republic of Korea, Democratic Republic of the Congo, Djibouti, Dominica, Dominican Republic, Egypt, El Salvador, Equatorial Guinea, Fiji, Gabon, Gambia, Ghana, Grenada, Guatemala, Guinea, Guinea-Bissau, Haiti, Honduras, India, Indonesia, Jamaica, Jordan, Kazakhstan, Kosovo, Madagascar, Malaysia, Maldives, Mali, Mauritania, Mauritius, Mexico, Micronesia (Federated States of), Montenegro, Mozambique, Namibia, Nauru, Nicaragua, Niger, Nigeria, North Macedonia, Pakistan, Papua New Guinea, Paraguay, Peru, Philippines, Romania, Russia, Senegal, Serbia, Sierra Leone, Somalia, South Africa, South Sudan, Sri Lanka, St. Lucia, Suriname, Syrian Arab Republic, Thailand, Tunisia, Turkey, Turkmenistan, Ukraine, Uzbekistan, Venezuela, Yemen, Zimbabwe. Non-STEPS surveys included: 2009-2010 Chile National Health Survey (NHS), the 2009 China Health and Nutrition Survey (CHNS), the 2009 Fiji Eye Health Survey (EHS), the 2009-2012 Mexico Family Life Survey (MxFLS), the 2015-2016 Indian National Family Health Survey (NFHS), the 2014-2015 Indonesian Family Life Survey (IFLS), the 2013 Namibia DHS, the 2015-2016 Study for the Evaluation of Prevalence of Hypertension and Cardiovascular Risk in Romania III (SEPHAR), and the 2012 South African National Health and Nutrition Examination Survey (SANHANES).
86 Countries in Google search
n=10 not yet included in data set
19 eligible surveys
9 surveys included

5
Appendix 3: Flow diagram for participant inclusion in the analysis
Notes: Flow diagram illustrating the exclusion criteria applied to construct our study population. Share of individuals lost at each stage in relation to previous stage noted as percentages in brackets

6
Appendix 4: Country categories*
East/Southeast Asia Bangladesh, Bhutan, Cambodia, China, India, Indonesia, Laos, Myanmar, Nepal, Timor-Leste, Vietnam
Europe and Central Asia Azerbaijan, Belarus, Georgia, Kyrgyzstan, Moldova, Mongolia, Romania, Tajikistan
Latin America & the Caribbean Chile, Costa Rica, Ecuador, Guyana, Mexico, St. Vincent & the Grenadines
Middle East and North Africa Algeria, Iran, Iraq, Lebanon, Morocco Oceania Fiji, Kiribati, Marshall Islands, Samoa, Solomon
Islands, Tuvalu, Vanuatu Sub-Saharan Africa Benin, Botswana, Burkina Faso, Comoros,
Eritrea, Eswatini, Kenya, Lesotho, Liberia, Malawi, Namibia, Rwanda, Sao Tome, Seychelles, South Africa, Sudan, Tanzania, Togo, Uganda, Zambia, Zanzibar
*Countries were categorized according to the NCD Risk Factor Collaboration regions.1 1. NCD Risk Factor Collaboration (NCD-RisC). Worldwide trends in diabetes since 1980: a
pooled analysis of 751 population-based studies with 4.4 million participants. Lancet. 2016;387(10027):1513-1530. doi:10.1016/S0140-6736(16)00618-8
Appendix 5: Country-Specific Sampling Methods Country-Specific Sampling Methods Note: In order to ensure accuracy in reporting, sampling methods are pasted verbatim from specified sources. Algeria STEPS 2016-2017 A multi-stage cluster sample of households. One individual within the age range of the survey was selected per household. Analysis weights were calculated by taking the inverse of the probability of selection of each participant. These weights were adjusted for differences in the age-sex composition of the sample population as compared to the target population. Different weight variables are available per Step: wStep1 - for interview data wStep2 - for physical measures wStep3 - for biochemical measures This allows for differences in the weight calculation for each Step of the survey as the age-sex composition of the respondents to each Step can differ slightly due to refusal or drop out. Additionally, some countries perform subsampling for Step 2 and/or Step 3. When no subsampling is done and response rates do not differ across Steps of the survey, the 3 weight variables will be the same. Age range of participants included: 18-69 years Source: no report or fact sheet available. Sampling information obtained from: https://extranet.who.int/ncdsmicrodata/index.php/catalog/91/study-description Azerbaijan STEPS 2017 A multi-stage cluster sample of households. One individual within the age range of the survey was selected per household. Analysis weights were calculated by taking the inverse of the probability of selection of each participant. These weights were adjusted for differences in the age-sex composition of the sample population as compared to the target population.

7
Different weight variables are available per Step: wStep1 - for interview data wStep2 - for physical measures wStep3 - for biochemical measures This allows for differences in the weight calculation for each Step of the survey as the age-sex composition of the respondents to each Step can differ slightly due to refusal or drop out. Additionally, some countries perform subsampling for Step 2 and/or Step 3. When no subsampling is done and response rates do not differ across Steps of the survey, the 3 weight variables will be the same. Age range of participants included: 18-69 years Source: no report or fact sheet available. Sampling information obtained from: https://extranet.who.int/ncdsmicrodata/index.php/catalog/127/studydescription#page=overview&tab=study-desc Bangladesh: STEPS 2018 A cross–sectional survey was carried out from February to May 2018 among adult population aged l8-69 years including men and women residing in the households in all the divisions of Bangladesh. Sampling was done by multistage, geographically stratified probability based sampling on the basis of Primary Sampling Unit (PSU) developed by Bangladesh Bureau of Statistics (BBS) for census 2011. The sample size was calculated considering prevalence of different NCD risk factors, relative precision rate and feasibility of the survey. To calculate the final sample size, the design effect and non-response rate at the household and individual level were considered. Considering the findings of Demographic Health survey and previous BBS surveys, the person non-response rate and household non-coverage rate and design effect, security issue and non-clearance of local administration, the final adjusted sample size was 9,900 adults of 495 PSUs. However, based-on eligibility, refusal etc. finally, out of 9900 complete data were gotten from 8185 respondents, physical measurements could be done in 7208 participants, and blood and urine sample was collected from 7065 and 7028 respondents respectively. Both the blood and urine samples were given by 6901participants. Age range of participants included: 18-69 years Source: https://extranet.who.int/ncdsmicrodata/index.php/catalog/770 Belarus: STEPS 2015 The sampling frame is a collection of data and materials from which are selected for the survey. The optimal sampling frame should be complete, accurate and current. Best of all, the above criteria are met by the results of the population census, which became the basis for constructing the sample for the STEPS study. Census population represents a representative territorial sampling frame in the form a hierarchical set of parcels grouped in a certain way. Plots censuses are, on average, about the same size. For each site there is a schematic map that provides a clear, non-overlapping demarcation of geographic districts, as well as information on the population and the number of households. The largest in size is the census area, which includes several instructor sites. The smallest unit in the hierarchical structure of parcels by censuses - enumeration areas.A positive aspect of using enumeration areas as primary sampling units (PSUs) is that they have a small and approximately the same size (each includes about 100 HHs on average). Consequently this, the PSU is a territory within which it is possible to effectively organize field work. To conduct a population census, the territory of the Republic of Belarus was divided into almost 32 thousand enumeration areas. Due to the fact that the last population census in the Republic of Belarus was carried out in 2009, to update the sample, the current data of polyclinics were used, medical outpatient clinics, FAPs and rural Soviet accounting in rural areas. Age range of participants included: 18-69 years Source: Translated directly from the Belarus STEPS 2016 report. Available at: https://extranet.who.int/ncdsmicrodata/index.php/catalog/100/related_materials

8
Benin: STEPS 2008 “The STEPS survey in Benin was a population-based survey of adults aged 25-64. A cluster sample design was used to produce representative data for that age range. A total of 6,904 adults participated in the Benin STEPS survey. Recruitment was based on a random five-stage sampling frame. Sixty of 546 districts were randomly selected according to the sizes of their populations. In each district retained, a list of neighborhoods or villages was drawn up and half were selected. In each neighborhood retained, dwellings, households, and then subjects were randomly selected. An investigator went to the center of each neighborhood or village and randomly chose a direction to go before entering one out of every two dwellings. In the dwellings retained, he listed the households and randomly selected one out of two. Within each household, the participant was identified using the Kish method. This procedure was followed until the predetermined sample was obtained for the neighborhood or village concerned. The response rate for the survey was 99%. With respect to the biological data collected in STEP 3, this module was] systematically proposed to six subjects out of ten." Age range of participants included: 25-64 years Source: Houehanou YC, Lacroix P, Mizehoun GC, Preux PM, Marin B, Houinato DS. Magnitude of cardiovascular risk factors in rural and urban areas in Benin: findings from a nationwide steps survey. PLoS One 2015; 10(5): e0126441. Bhutan: STEPS 2014 “To achieve a nationally representative sample, a multistage sampling method was used to select enumeration areas, households and eligible participants at each of the selected households in three stages. The 2005 National Census was chosen as the basis for the sampling frame, with “Geogs” (blocks) in rural areas and towns in urban areas forming the primary sampling units (PSUs). Since the population distribution for urbanicity is 70:30 (rural:urban), 63 PSUs in rural and 14 PSUs in urban areas were chosen. PSUs were selected through the probability proportionate to size (PPS) sampling using the number of households in each PSU. Two secondary sampling units (SSUs) for every rural PSU and 4 SSUs for every urban PSU were selected. This led to the selection of 126 SSUs from rural and 56 SSUs from urban areas. This was also carried out by PPS sampling, using the number of households in each SSU. A total of 16 households from each SSU (both rural and urban) were selected using systematic random sampling. The sampling frame for this was the list of households with a unique identification number (ID) developed by the enumerators for the survey. At the household level, the Kish sampling method was used to randomly select one eligible member (aged 18–69 years) of the household for the survey. The Kish method ranks eligible household members in order of decreasing age, starting with males and then females, and randomly selects a respondent using the automated program for Kish selection in the handheld personal digital assistant (PDA).” Age range of participants included: 18-69 years Source: National survey for noncommunicable disease risk factors and mental health using approach WHO Steps Approach in Bhutan – 2014. Available at: http://www.who.int/chp/steps/bhutan/en/. Additional reference: World Health Organization Regional Office for South-East Asia. National survey for noncommunicable disease risk factors and mental health using WHO STEPS approach in Bhutan—2014. Geneva: World Health Organization; 2014. Botswana STEPS 2014 Botswana has a population of over 2 million with 27 districts and 4,845 enumeration areas and sample size of 300 enumeration areas with a target population of 6,400 people was systematically drawn from a pool of the whole enumeration areas. Against the identified enumeration areas numbers of households were listed and proportion of participants was calculated from the total sample size required for the country. Finally a computer generated random number was drawn to go into specific households in that specific enumeration area and at the end eligible participants residing in the household were listed into the electronic hand held data assistant (PDA) and at the end a name was picked automatically to participate in the survey. Age range of participants included: 15-69 years Source: Botswana STEPS report. Available at:

9
https://extranet.who.int/ncdsmicrodata/index.php/catalog/318 Burkina Faso: STEPS 2013 “Sampling methodology: The study was conducted on a sample obtained from a three-stage cluster stratified as recommended by the WHO STEPS. The sampling frame used was that derived from the general census of the population and habitat 2006 (RGPH 2006) and updated in 2010 during the survey Demographic and Health Survey of Burkina Faso (EDS-BF, 2010). This update concerned the enumeration areas (EAs) that correspond to the cluster as part of this study. Selection of clusters: The choice of clusters was made according to a systematic random selection proportional to their size (in number of households) within strata (regions). To do this clusters were organized by stratum and place of residence (urban / rural). A total of 240 clusters of which 185 were in rural areas and 55 in urban areas were selected for the investigation. Selection of households: Households were randomly drawn after an enumeration exhaustive list of all households in the cluster. A draw tool designed on Excel by the team. The technique was used in the field for selecting households to investigate. In total, 20 households in clusters were selected to participate in the study. Selection of individuals: The choice of individuals was made randomly using Kish's method. In total, an individual aged 25 to 64 living in a selected household was fired for participate in the survey.” Age range of participants included: 25-64 years Source, translated from: Rapport de l’enquete national sur la prevalence des principaux facteurs de risques communs aux maladies non transmissibles au Burkina Faso Enquete STEPS 2013. Available at: http://www.who.int/chp/steps/burkina_faso/en/. Cambodia STEPS 2011 “The initial planned sample size was designed to involve 5,760 persons in accordance with the NCD multi-stage cluster survey method (1.5 design effect, 95% confidence interval, 5% margin or error, and 50% baseline levels of the indicators) in order to provide an equivalent distribution of the participants in regards to age groups and gender after taking into consideration that the estimated potential rate for non-response in each group and refusals in the nest stages would equal to 20%. Estimates were obtained for each of the following eight age/sex groups: men ahed 25-34 years, 35-44 years, 45-54 years, and 55-64 years; and women aged 25-34 years, 35-44 years, 45-54 years, and 55-64 years. The survey was designed to cover all geographical areas of Cambodia and a 3-stage sampling process as part of the multi-stage cluster sampling was carried out to randomly select the target population: random selection of communes (Khum in rural areas and its equivalent Sangkat in urban area) as primary sampling unit (PSU), followed by villages (Phum) for the second sampling unit (SSU), and by households for the elementary units (EU). Finally, all members of the randomly chose households aged 25-64 years were invited to participate in this survey. The selection process was performed identically for urban and rural areas in order to get a self-weighted estimate for the whole population of the country. A total of 180 clusters with 34 clusters from the urban area and 146 clusters from the rural area were randomly selected.” Age range of participants included: 25-64 years Source: Cambodia STEPS 2010 survey report. Available at: https://www.who.int/ncds/surveillance/steps/cambodia/en/ Chile: NHS 2009-10 “The sampling frame was constituted from the Population and Housing Census 2002. The design of the study was transversal, with a random sample of complex type households (stratified and multi-stage by clusters) with national, regional and area representation rural / urban. The target population was adults older than or equal to 15 years. The survey had a response rate in the eligible population of 85%. The refusal rate was of 12%. 5,434 people were interviewed. A nurse performed clinical and examinations to 5,043 participants and 4,956 accepted laboratory tests (blood and urine). The total sample loss of the oversized sample was 28% (this including rejection, non-contact and other causes of random loss). The raw sample was designed with overrepresentation of some population groups (older adults, regions other than the Metropolitan Region and rural areas) to increase sample efficiency

10
and homogenize the accuracy of the estimators. The expansion of the sample data is because it grants each participant the weight that corresponds to it according to the design sample and at the same time corrects the distortion of the raw sample, making it coincide with the census population projection for January 2010 for Chilean adults over 15 years of age.“ Age range of participants included: 15 years or older Source, translated from: Resumen Ejecutivo: Encuesta Nacional de Salud ENS Chile 2009-10. Available at: http://epi.minsal.cl/encuesta-ens-anteriores/. China: CHNS 2009 “The China Health and Nutrition Survey is a longitudinal study across 228 communities within nine provinces of China. Surveys began in 1989, with subsequent surveys every 2–4 years, for a total of nine rounds between 1989 and 2011. The China Health and Nutrition Survey was designed to provide representation of rural, urban and suburban areas varying substantially in geography, economic development, public resources and health indicators,13 and it is the only large-scale, longitudinal study of its kind in China. The original survey in 1989 used a multistage, random cluster design in eight provinces (Liaoning, Jiangsu, Shandong, Henan, Hubei, Hunan, Guangxi and Guizhou) to select a stratified probability sample; a ninth province, Heilongjiang, was added in 1997 using a similar sampling strategy. Essentially, two cities (one large and one small city—usually the provincial capital and a lower income city) and four counties (stratified by income: one high, one low and two middle income counties) were selected in each province. Within cities, two urban and two suburban communities were selected; within counties, one community in the capital city and three rural villages were chosen. Twenty households per community were then selected for participation. The study met the standards for the ethical treatment of participants and was approved by the Institutional Review Boards of the University of North Carolina at Chapel Hill and the Institute of Nutrition and Food Safety, Chinese Center for Disease Control and Prevention.” Age range of participants included: all ages Source: Attard, Samantha M.; Herring, Amy H.; Wang, Huiling; Howard, Annie Green; Thompson, Amanda L.; Adair, Linda S.; Mayer-Davis, Elizabeth J.; & Gordon-Larsen, Penny. (2015). Implications of Iron Deficiency/Anemia on the Classification of Diabetes Using HbA1c. Nutrition & Diabetes, 5, e166. Comoros: STEPS 2011 “The STEPS survey on risk factors for chronic diseases in the Union of the Comoros took place from January to March 2011. This study has undertaken Step 1, Step 2 and Step 3. Indeed, socio-demographic and behavioral measures were collected in Step 1. Physical measures such as height, weight and tension were collected in Step 2 and biochemical measurements were collected to assess the levels of blood glucose and cholesterol levels in Step 3. The STEPS survey conducted in Comoros Union is a survey of general population, targeting adults aged 25 to 64 years. A stratified survey was used to produce representative data for this age group. A total of 5556 adults aged 25 to 64 participated in the STEPS survey on a sample of 5760 people representing an overall response rate of 96.5%.” Age range of participants included: 25-64 years Source, translated from Union des Comores STEPS 2011 Note de synthèse. Available at: http://www.who.int/chp/steps/comoros/en/. Costa Rica: STEPS 2010 “The Costa Rican NCRFSS survey was a cross-sectional survey based on a probabilistic cluster sampling design. The NCRFSS survey was conducted during 2010 under the supervision of the Caja Costarricense de Seguro Social, a government public healthcare provider, and covers the overall adult population aged ≥20 years. Multistage cluster sampling was performed stratified by geographical areas, age groups (20–39, 40–64, and ≥65 years) and gender. The first sample stage was the randomized selection of the country’s geographical areas as primary sample units followed by the random selection of sectors in selected areas as secondary sample units. The random selection of areas and sectors was performed with probability proportional to size; the area or sector size was determined

11
by the population >20 years during 2009, as estimated by the Costa Rican Census and Statistics National Institute (INEC). Households were chosen through a random number generator using dwelling lists obtained from the health technician assistant in every community until all age group and gender strata sample sizes were achieved. A family dwelling was defined as a group of people who share the same table to eat. Survey participants were selected by the Kish method, which samples participants within a household with equal probability of selection, as recommended by the WHO STEPwise methodology. To be eligible for inclusion in the study, subjects had to be ≥20 years of age, permanently residing in the selected homes, and to have provided written consent. Pregnant or lactating mothers and those who were within 6 months postpartum were excluded from the study. Each participant selected for the study was informed of the study objectives and details before agreeing to participate in the investigation. In all, 3653 noninstitutionalized adults were surveyed, with an 87.8% response rate of the eligible population.” Age range of participants included: 20 years or older Source: Wong-McClure R, Gregg EW, Barcelo A, Sanabria-Lopez L, Lee K, Abarca-Gomez L, Cervantes-Loaiza M, Luman ET. Prevalence of diabetes and impaired fasting glucose in Costa Rica: Costa Rican National Cardiovascular Risk Factors Survey, 2010. J Diabetes. 2016 Sep;8(5):686-92. Ecuador: STEPS 2018 The STEPS sample design used probability sampling techniques to ensure the geographic representativeness and of the study domains of the survey, and to calculate the factors expansion and errors associated with sampling. The target population or study universe included the total of adults aged 18 to 69 years, disaggregated by men and women, residents in the territory of Ecuador, except Galapagos. According to the INEC population projection, it included 10,249,369 people. The unit of observation and elementary unit of analysis were people between 18 and 69 years of the territory Ecuadorian, except Galapagos. The sampling frame for the STEPS Survey was defined from the Sampling Frame for household surveys of the National Institute of Statistics and Censuses - INEC. Nevertheless, due to the scope of the MSP-INEC inter-institutional cooperation agreement, the information cartographic information for gathering information was restricted to that used for the Census of Population and Housing - CPV 2010. The delimited frame contains mainly variables of ID; location variables; stratification variables; and, design and control variables selection units. Sample selection. The selection of PSUs, according to the established size, was carried out independently in a random way in each of the strata. They were also selected randomly 12 dwellings from each previously selected cluster. From second period of uprising, given the high rates of occupation change, 16 were chosen homes per cluster, to counteract this effect. The change affected the 230 remaining conglomerates, giving a total of 6,680 dwellings to be surveyed. Finally, a enlistment of the eligible persons within each dwelling, selecting in a manner random one of them. For the STEPS Ecuador 2018 survey, the standard STEPS version 3.2 instrument was used in Spanish, revised and adapted for the Ecuadorian context by the MSP, INEC and PAHO / WHO. All three steps were included:
• Step 1 - questionnaires on the behavior of tobacco and alcohol consumption, consumption • of fruits, vegetables and salt, practice of physical activity, and history of measurement and
diagnosis of hypertension, diabetes and high blood cholesterol. The modules were also applied options of: colon, prostate and breast cancer health screening, tobacco, and oral health.
• Step 2 - anthropometric data (weight, height, waist circumference, BMI, blood pressure). • Step 3 - biochemical data (glucose and total cholesterol in capillary blood).
Age range of participants included: 18-69 years Source: Translated from Ecuador STEPS 2018 report: https://extranet.who.int/ncdsmicrodata/index.php/catalog/774 Eritrea STEPS 2010 “A multi-stage cluster sample of households. One individual within the age range of the survey was selected per household. Analysis weights were calculated by taking the inverse of the probability of selection of each

12
participant. These weights were adjusted for differences in the age-sex composition of the sample population as compared to the target population. Different weight variables are available per Step: wStep1 - for interview data wStep2 - for physical measures wStep3 - for biochemical measures This allows for differences in the weight calculation for each Step of the survey as the age-sex composition of the respondents to each Step can differ slightly due to refusal or drop out. Additionally, some countries perform subsampling for Step 2 and/or Step 3. When no subsampling is done and response rates do not differ across Steps of the survey, the 3 weight variables will be the same.” Age range of participants included: 25-74 years Source: no report available. Sampling information obtained from: https://extranet.who.int/ncdsmicrodata/index.php/catalog/589/study-description#page=sampling&tab=study-desc Eswatini: STEPS 2014 “A Multi-stage cluster sampling design was applied. The survey covered all the four regions of the country. The size of the country and the distances between the regions and communities made it possible for the survey to sample a population representing all the 4 regions. The Multi-stage sampling procedure was implemented in the following procedural steps: Stage 1: All four regions were included as a sampling frame of our Primary Sampling Unit (PSU).The number of the PSUs at this stage ensured precision in the survey estimates and as a result 216 PSUs were selected using probability proportional to size sampling. Stage 2: The second stage of cluster sampling procedure entailed listing, sorting and random systematic sampling of the Secondary Sampling Units (Households) within the PSUs selected in stage1 where 20 households were selected from each PSU. Based on census data, only households with eligible participants were systematically sampled through random systematic sampling. Stage 3: At this level, all the eligible participants within a household were sequentially listed into the PDAs and only one participant per household was randomly sampled using KISH method built into the PDAs. The KISH method is a widely used technique that uses a pre-assigned table of random numbers to identify the person to be interviewed.” Age range of participants included: 15 to 69 years Source: WHO STEPS: Noncommunicable Disease Risk Factor Surveillance Report Swaziland 2014. Available at: http://www.who.int/chp/steps/swaziland/en/. Fiji: EHS 2009 “The sample frame (188 800 people aged ≥40 years; 50.3% female; 49.4% Melanesian Fijian, 44.9% Indo-Fijian, and 5.7% of other ethnicity; 43.2% rural dwellers) included all 8 provinces of Viti Levu, Fiji’s main island, where 79.1% of the total population resides. Using an anticipated prevalence of vision impairment of 11.0% in the target population (actual was 11.4%; 95% confidence interval [CI] = 9.9% to 13.2%), absolute precision of ±2.2% (20% relative difference), with 95% confidence, a design effect of 1.4 and a response rate of 80%, the sample size was determined to be 1354 persons. From the sample frame, 34 clusters of 40 people were required. Across Viti Levu, the clusters were selected through probability proportionate to size sampling, using national census data.” Age range of participants included: 40 to 90 years Source: pasted verbatim from email exchange with study team. Additional reference: Brian G, Ramke J, Maher L, Page A, Szetu J. The prevalence of diabetes among adults aged 40 years and over in Fiji. N Z Med J. 2010; 123(1327):68–75. PMID: 21358785

13
Georgia: STEPS 2016 “The STEPS survey of noncommunicable disease (NCD) risk factors in Georgia was carried out from June 2016 to September 2016. Georgia carried out Step 1, Step 2 and Step 3. Socio demographic and behavioural information was collected in Step 1. Physical measurements such as height, weight and blood pressure were collected in Step 2. Biochemical measurements were collected to assess blood glucose and cholesterol levels in Step 3. The survey was a population-based survey of adults aged 18-69. A Multi-stage cluster sampling design was used to produce representative data for that age range in Georgia. A total of 5554 adults participated in the survey. The overall response rate was 75.7%.” Age range of participants included: 18 to 69 years Source: Georgia STEPS Survey 2016 Fact Sheet. Available at: http://www.who.int/chp/steps/georgia/en/. Guyana: STEPS 2016 “A response rate of 66.68% will be selected based on the experience and response rates of other surveys over the years such as the recent Demographic Health Survey 2009. [...] STEPS 3 involve taking blood samples from a proportion of the sample, in this case 50% of the sample, in order to measure raised blood glucose levels and abnormal blood lipids. [...] The STEPS sample will be prepared by the Bureau of Statistics Guyana following the recommended STEPS sample methodology. A multi-stage cluster sampling design will be used. Guyana is divided into 10 administrative regions and within the administrative regions there are seven towns and each region is further divided into enumeration districts. For the STEPS survey 288 enumeration districts will be selected using the population probability sampling method and from each enumeration district 12 households will be selected giving a total sample size of 3456. Further at the household level each participant will be randomly selected by the electronic tablet. For STEP 3 50% of the sample will be randomly selected to participate. A re-listing of some households may also be necessary, such as those interior region locations, in which case in addition to household listings, enumeration districts maps will also be provided so that a re-listing can be done where required.” Age range of participants included: 18 to 69 years Source: STEPwise Approach to Chronic Disease risk factor surveillance (STEPS): Guyana’s Implementation Plan. June 20, 2016. Ministry of Public Health, Guyana. India: NFHS 2015-16 “The NFHS-4 sample was designed to provide estimates of all key indicators at the national and state levels, as well as estimates for most key indicators at the district level (for all 640 districts in India, as of the 2011 Census). The total sample size of approximately 572,000 households for India was based on the size needed to produce reliable indicator estimates for each district and for urban and rural areas in districts in which the urban population accounted for 30-70 percent of the total district population. The rural sample was selected through a two-stage sample design with villages as the Primary Sampling Units (PSUs) at the first stage (selected with probability proportional to size), followed by a random selection of 22 households in each PSU at the second stage. In urban areas, there was also a two-stage sample design with Census Enumeration Blocks (CEB) selected at the first stage and a random selection of 22 households in each CEB at the second stage. At the second stage in both urban and rural areas, households were selected after conducting a complete mapping and household listing operation in the selected first-stage units.” Age range of participants included: women 15-49 years, men 15-54 years Source: Ministry of Health and Family Welfare (MoHFW) - Government of India. India - National Family Health Survey 2015-2016. Report generated on: February 7, 2018. Indonesia: IFLS 2014-15 “Because it is a longitudinal survey, IFLS5 drew its sample from IFLS1, IFLS2, IFLS2+, IFLS3 and IFLS4. The IFLS1 sampling scheme stratified on provinces and urban/rural location, then randomly sampled within these strata (see Frankenberg and Karoly, 1995, for a detailed description). Provinces were selected to maximize representation of the population, capture the cultural and socioeconomic

14
diversity of Indonesia, and be cost effective to survey given the size and terrain of the country. For mainly cost-effectiveness reasons, 14 of the then existing 27 provinces were excluded.3 The resulting sample included 13 of Indonesia’s 27 provinces containing 83% of the population: four provinces on Sumatra (North Sumatra, West Sumatra, South Sumatra, and Lampung), all five of the Javanese provinces (DKI Jakarta, West Java, Central Java, DI Yogyakarta, and East Java), and four provinces covering the remaining major island groups (Bali, West Nusa Tenggara, South Kalimantan, and South Sulawesi). Within each of the 13 provinces, enumeration areas (EAs) were randomly chosen from a nationally representative sample frame used in the 1993 SUSENAS, a socioeconomic survey of about 60,000 households. The IFLS randomly selected 321 enumeration areas in the 13 provinces, over-sampling urban EAs and EAs in smaller provinces to facilitate urban-rural and Javanese–non-Javanese comparisons. Within a selected EA, households were randomly selected based upon 1993 SUSENAS listings obtained from regional BPS office. A household was defined as a group of people whose members reside in the same dwelling and share food from the same cooking pot (the standard BPS definition). Twenty households were selected from each urban EA, and 30 households were selected from each rural EA. This strategy minimized expensive travel between rural EAs while balancing the costs of correlations among households. For IFLS1 a total of 7,730 households were sampled to obtain a final sample size goal of 7,000 completed households. This strategy was based on BPS experience of about 90% completion rates. In fact, IFLS1 exceeded that target and interviews were conducted with 7,224 households in late 1993 and early 1994. In IFLS1 it was determined to be too costly to interview all household members, so a sampling scheme was used to randomly select several members within a household to provide detailed individual information.” Age range of participants included: all ages Source: Strauss, J., F. Witoelar, and B. Sikoki. “The Fifth Wave of the Indonesia Family Life Survey (IFLS5): Overview and Field Report”. March 2016. WR-1143/1-NIA/NICHD. Iran: STEPS 2016 “The sampling part, which includes determining the sample size and the cluster head, belongs to the pre-study phase and was planned in the form of a specific protocol for sample size and statistical sampling. All experts in the quality control team supervised the finding of samples and cluster heads. In order to estimate the prevalence rate of the risk factors for non-communicable diseases in the country in 1395, a sampling method proportionate to the population was used, which is a common approach in survey studies. Therefore, the selected sample size was proportionated to the population of that province. On the other hand, for estimating the prevalence of the risk factors in the province, in order to be on the safe side, the smallest sample size for achieving the predicted rates was calculated at 95%. This rate was equal to 384 samples, which was selected as the smallest sample size in the least populated province, Ilam. The required sample size for other provinces was therefore calculated according to the population of that province proportionate to the population of the reference province, Ilam. Besides, to control the non-response error, 10% was added to the calculated sample size in each province. In order to decrease costs and increase efficiency, for provinces with 800 samples or more, weights were given to their samples. Weight-giving is an effective method used in surveys in order to decrease the sample size. This was achieved in the selected provinces by considering the calculated sample size as half and the sampling weight as double. The total sample size was calculated to be 30150 and to achieve this sample size, sampling from 3015 clusters was required.” Age range of participants included: 18 and older Source: Iran STEPS 2015 report. Available at: https://www.who.int/ncds/surveillance/steps/STEPS_2016_Atlas_EN.pdf?ua=1 Iraq: STEPS 2015 “The sample frame consisted of the population of Iraq of (18+) years for both sexes residing in the urban and rural area. It was based on the results of listing and numbering operation for the year 2009 that covered all governorates. Due to the unstable conditions at the time of the survey three governorates (Naynawa, Salahaddin and Al-Anbar) were excluded. A major challenge confronted was

15
the late demographic change due to population movement, displacement and migration. All permanent residents of (18+) years of age, who were resident in Iraq within one month at the time of implementation of the survey were considered eligible. A cross‐sectional community based survey covering 15 governorates in Iraq. A Multi-stage cluster sampling technique was depended to select the minimum representative sample size to estimate the prevalence of the risk factors of noncommunicable disease through direct interview, physical examination and laboratory examination of blood samples of study participants. A total of 412 clusters were randomly selected each contain ten households. One subject from each household was randomly selected using KISH table to participate in the survey with a total sample size of 4120. The Sample was designed to provide estimates on a number of indicators on the situation of Noncommunicable diseases risk factors in Iraq at the national level. A national based rather than a governorate based sample is selected. A multi stage cluster sampling was used with stratification to urban and rural areas. Primary sampling units (PSUs) were the blocks, which consisted of 70 households or more before selection.” Age range of participants included: 18 years and older Source: Iraq STEPS 2015 report. Available at: https://www.who.int/ncds/surveillance/steps/Iraq_2015_STEPS_Report.pdf Kenya: STEPS 2015 “The 2015 Kenya STEPs survey was a national cross-sectional household survey designed to provide estimates for indicators on risk factors for non-communicable diseases for persons age 18 – 69 years. The sample was designed with a sample size of 6,000 individuals to allow national estimates by sex (male and female) and residence (urban and rural areas). The survey used the fifth National Sample Surveys and Evaluation Programme (NASSEP V) master sample frame that was developed and maintained by KNBS. The frame was developed using the Enumeration Areas (EAs) generated from the 2009 Kenya Population and Housing Census to form 5,360 clusters split into four equal sub-samples. A three-stage cluster sample design was adopted for the survey involving selection of clusters, households and eligible individuals. In the first stage, 200 clusters (100 urban and 100 rural) were selected from one sub-sample of NASSEP V frame. A uniform sample of 30 households from the listed households in each cluster was selected in the second stage of sampling. The last stage of sampling was done using Personal Digital Assistants (PDAs) at the time of survey, where one individual was randomly selected from all eligible listed household members using a programmed KISH method of sampling.” Age range of participants included: 18 to 69 years Source: WHO: Kenya STEPwise Survey for Non Communicable Diseases Risk Factors 2015 Report. Available at: http://www.who.int/chp/steps/Kenya_2015_STEPS_Report.pdf?ua=1. Kiribati; STEPS 2015 “The second Kiribati STEPS Survey was a population-based survey of 18-69 year olds. The decision was to use three age groups: 18-29, 30-44, 45-69 years for men and women using the following corrections:
• Design Effect of 1.0 (clustering at village and household level) • 95% confidence interval; p value .05 • 0.7% response rate • Baseline prevalence percentage indicator: 0.5 • FPC – not applicable • 6 age-sex groups (18-29 years, 30-44 years, 45-69 years)
As STEPS is intended to be nationally representative, a multi-stage cluster sampling method was used. The STEPS sampling spreadsheet was completed using the most recent census information (2012). The sample was selected in two stages assuming no replacement. At the first stage, a sample of

16
Enumeration Areas (Islands and villages) from each stratum using probability proportional to size (PPS) sampling was selected. In the second stage, a fixed number of households from each selected Enumeration Area using systematic sampling was selected. The third stage of sampling selection was done at the household level using the KISH method.
The sampling identified that data collection would be needed on the following islands: Makin, Butaritari, Marakei, Abaiang, North Tarawa, South Tarawa,Betio, Maiana, Abemama, Kuria, Aranuka, Nonouti, Tabiteuea North, Tabiteuea South, Arorae, Tabuaeran and Kiritimati. Further details in Annex 3.” Age range of participants included: 18 to 69 years Source: Kiribati STEPS 2015 report. Available at: https://extranet.who.int/ncdsmicrodata/index.php/catalog/724 Kyrgyzstan: STEPS 2013 A multi-stage cluster sample of households. One individual within the age range of the survey was selected per household. Analysis weights were calculated by taking the inverse of the probability of selection of each participant. These weights were adjusted for differences in the age-sex composition of the sample population as compared to the target population. Different weight variables are available per Step: wStep1 - for interview data wStep2 - for physical measures wStep3 - for biochemical measures This allows for differences in the weight calculation for each Step of the survey as the age-sex composition of the respondents to each Step can differ slightly due to refusal or drop out. Age range of participants included: 25 to 64 years Source: no report or fact sheet available. Sampling information obtained from: https://extranet.who.int/ncdsmicrodata/index.php/catalog/271/study-description#page=overview&tab=study-desc Lao People’s Democratic Republic: STEPS 2013 A multi-stage cluster sample of households. One individual within the age range of the survey was selected per household. Analysis weights were calculated by taking the inverse of the probability of selection of each participant. These weights were adjusted for differences in the age-sex composition of the sample population as compared to the target population. Different weight variables are available per Step: wStep1 - for interview data wStep2 - for physical measures wStep3 - for biochemical measures This allows for differences in the weight calculation for each Step of the survey as the age-sex composition of the respondents to each Step can differ slightly due to refusal or drop out. Additionally, some countries perform subsampling for Step 2 and/or Step 3. When no subsampling is done and response rates do not differ across Steps of the survey, the 3 weight variables will be the same. Age range of participants included: 18 to 64 years Source: no report or fact sheet available. Sampling information obtained from: https://extranet.who.int/ncdsmicrodata/index.php/catalog/588/study-description#page=sampling&tab=study-desc Lebanon: STEPS 2017 “A national cross-sectional survey adopting a two-stage cluster sampling design was conducted for Steps 1, 2 and 3. The sampling frames references used were the population distribution in Lebanon 2014, retrieved from the Central Administration for Statistics (CAS) and the Syrian population

17
distribution data 2015, retrieved from UNHCR. 144 clusters were selected for the Lebanese sample and 144 clusters for the Syrian sample. The Primary Sampling Units (PSUs) were cadastral areas (cadasters) and the Secondary Sampling Units (SSUs) were the households. Twenty participants were recruited from each cluster. The latest available population estimates (cadastral data) were used, to randomly recruit PSUs by Probability Proportionate to Size (PPS). To account for the issue of the variability in the cadasters’ sizes, very small cadasters (<200 individuals) were combined with neighboring PSUs before selecting the sample, to enhance the likelihood of finding 20 target participants. On the other hand, cadasters with a large population size that were guaranteed to be sampled at least twice were handled as strata and each stratum were assigned a fixed number of random starting points based on how often it was selected with certainty. This was done using satellite images divided into grids, previously obtained from the Centers for Disease Control and Prevention (CDC) for all Lebanese cadasters. For the Lebanese sample, the research team relied on the standard Expanded Program for Immunization (EPI) method for a systematic random selection of the households. Accordingly, within each selected PSU, households were identified using a systematic random approach following the WHO-UNICEF-EPI cluster method. The fieldworkers started with the highest floor on the right side of a building. If the household hosted an eligible participant, they proceeded with data collection, if not, they visited a second household which is selected by skipping 5 households. If during sampling, non-Lebanese households were selected, the fieldworker skipped them in a straight line until a Lebanese household was identified. This method has been previously used for national surveys in Lebanon. One participant was randomly selected within each household, using the eSTEPS application. Households were chosen until the target of 20 participants was reached. The PSUs for the Syrian refugees’ sample were identified, using the most recent available refugee estimates to randomly recruit PSUs by PPS. The same measures aforementioned were done to account for the variation in the cadasters’ sizes. The WHO-UNICEF- EPI cluster method was employed to select households. The fieldworkers targeted Syrian households; accordingly, when during sampling, non-Syrian households were selected, the fieldworker skipped them in a straight line until a Syrian household was identified. One participant was randomly selected within each household, using the eSTEPS application. For both samples, following STEPS’ team recommendations, sampling of participants was done without replacement, i.e. once a person was selected that person was not replaced with another one. Efforts were made to include all selected households. If the house was unoccupied at the time of the visit or if an adult was not available for an interview at the time of the visit, that house was revisited up to 4 times, with different visiting times. The number of refusals and non-responses was recorded.” Age range of participants included: 18 to 69 years Source: Lebanon STEPS 2016-2017 report. Available at: https://www.who.int/ncds/surveillance/steps/Lebanon_STEPS_report_2016-2017.pdf?ua=1 Lesotho STEPS 2012 A multi-stage cluster sample of households. One individual within the age range of the survey was selected per household. Analysis weights were calculated by taking the inverse of the probability of selection of each participant. These weights were adjusted for differences in the age-sex composition of the sample population as compared to the target population. Different weight variables are available per Step: wStep1 - for interview data wStep2 - for physical measures wStep3 - for biochemical measures This allows for differences in the weight calculation for each Step of the survey as the age-sex composition of the respondents to each Step can differ slightly due to refusal or drop out. Additionally, some countries perform subsampling for Step 2 and/or Step 3. When no subsampling is

18
done and response rates do not differ across Steps of the survey, the 3 weight variables will be the same. Age range of participants included: 25-64 years Source: Source: no report available. Sampling information obtained from: https://extranet.who.int/ncdsmicrodata/index.php/catalog/491/study-description#page=sampling&tab=study-desc Liberia: STEPS 2011 “Random multi-cluster sampling method was used to collect data during this survey in 5 of the 15 counties of Liberia with the district serving as the primary sampling unit. Different sampling frames were designed and used at the district (Primary Sampling Unit-PSU), Chiefdoms (Secondary Sampling Unit-SSU) and household levels. Households listing generated from the 2008 National Population Census was used, and in each household, the list of individuals’ resident was obtained and the Kish Method was used. Kish Method is a household sampling technique developed by WHO for STEPS. The field team selected households by using nutrition sampling method (throwing a pencil to get a selected direction). When the household enumeration sampling point is established, the interviewer counts all the households and using interval sample to get the household number. In each household, one person was selected using the Kish method.” Age range of participants included: 25 to 64 years Source: WHO: The Final Report on the Liberia STEPS Survey 2011. Available at: http://www.who.int/chp/steps/Liberia_2011_STEPS_Report.pdf?ua=1. Malawi: STEPS 2017 This survey was designed to obtain data that would be a representation of the population aged 18-69 years in Malawi. To achieve this, a multi-stage sampling method was used to select enumeration areas (EAs), households and eligible participants (three stages). Stage 1: Selection of enumeration areas (EAs): Sampling frame: Administratively, Malawi is divided into twenty-eight districts. In turn, each district is subdivided into smaller administrative units called traditional authorities (TAs). Each administrative unit is sub-divided into enumeration areas (EAs) by the National Statistical Office (NSO). Enumeration areas are classified as urban or rural. Each EA has a sketch map drawn by NSO. The sketch map shows the EA boundaries, location of buildings, and other landmarks. The list of EAs was obtained from NSO. This list was used as a sampling frame for random selection of EAs for the NCD STEPs In accordance with WHO STEPS Manual the recommended number of participants to be selected at each primary sampling unit (in our case in each EA) is 20. Given that the estimated required sample size was 5,088 (including the 20% non-response rate), the total number of EAs selected was 5,088/20=255. Thus a total of 255 EAs was therefore be randomly selected from the list of all EAs in Malawi. The EA sampling frame obtained from NSO had information on the total number of households in each EA. Twenty households were selected from each EA (as described above under the number of EAs to be selected). The sampling interval for household selection in each EA was therefore determined by dividing the total number of households in the EA by 20. Systematic sampling method (every nth household) was then used to randomly select the required 20 households. Only one eligible participant (an adult aged 18-69 years) in the selected households was enrolled in the survey. In households with more than one eligible participant, participants were randomly selected using an Android device. Age range of participants included: 18-69 years Source: Malawi STEPS 2017 report. Available at: https://extranet.who.int/ncdsmicrodata/index.php/catalog/629 Marshall Islands: STEPS 2017 „Participants eligible for the RMI Hybrid survey will include all RMI residents aged 18 years and over residing in Majuro, Kwajalein, Arno, Jaluit, Wotje, and Kili who were able to comprehend either English or Marshallese and provide consent. Data collection began on July 7, 2017 and ended on April

19
5, 2018. A total of 2,869 respondents completed the survey and measurements. All interviews and measurements were performed by trained surveyors recruited by the Marshall Islands Epidemiology Prevention Initiative (MIEPI). The original sample included 3107 adults. Sample size was determined based on overall adult populations on selected islands in the Republic of the Marshall Islands. (Majuro = 1659; Ebeye = 627; Kili = 200; Wotje = 207; Jaluit = 207; Arno = 207). The final response rate was 92.3%). Sampling procedures: Stage 1: Households were identified at random according to geographical stratification in Majuro and Ebeye. The country was stratified into two major groups, Urban (Majuro and Ebeye) and Rural (all outer islands). In Majuro and Ebeye, household cluster sampling was used to randomly select households in these areas. Stage 2: In Majuro and Ebeye, one individual was selected at random from each household using the KISH table method. All adults in Kili, Arno, Wotje, and Jabwor, Jaluit atolls were included in the sample because the adult populations are about 200 each on these atolls.“ Age range of participants included: 18 years and older Source: Marshall Islands STEPS 2017 Report. Available at: https://extranet.who.int/ncdsmicrodata/index.php/catalog/742 Mexico: Mexico Family Life Survey 2009-12 “The design of the first round, the baseline survey (MxFLS-1), was undertaken by the National Institute of Statistics and Geography (INEGI, per its name in Spanish). The baseline sample is probabilistic, stratified, multi-staged, and independent at every phase of the study. The population is comprised by Mexican households in 2002. Primary sampling units were selected under criterions of national, urban-rural and regional representation on pre-established demographic and economic variables. Regional definitions are in accordance with the National Development Plan 2000-2006. Currently, the MxFLS contains information for a 10-year period, collected in three rounds: 2002 (MxFLS-1), 2005-2006 (MxFLS-2) and 2009-2012 (MxFLS-3). Future rounds have been programmed in order to have a database that allows studying efficiently the well-being of the Mexican population at different moments in time. The first round or baseline survey (MXFLS-1), implemented in 2002, collected information on a sample of 35,000 individuals from 8,400 households in 150 communities throughout the country. The second (MxFLS-2) and third round (MxFLS-3) were conducted during 2005-2006 and 2009-2012, respectively. Given the longitudinal design of the survey, the MxFLS-2 and MxFLS-3 aimed to relocate and reinterview the sample of the MxFLS-1—including those individuals who migrated within Mexico or emigrated to the United States of America—and to interview the individuals or households that grew out from previous samples. The MxFLS-2 and MxFLS-3 relocated and reinterviewed almost 90 percent of the original sampled households. A primary goal of the Mexican Family Life Survey (MxFLS) is to create a longitudinal and multi-thematic database. On the one hand, the longitudinal design allows a long term tracking of individuals regardless of changes in residence and new household formations (split-offs). On the other hand, the multi-thematic design allows collecting—with a single tool—a wide range of socioeconomic and demographic indicators of the Mexican population. The first round of the survey (MxFLS-1) took place during 2002 reaching a sample of 8,400 households (35,000 individuals) in 150 urban and rural communities throughout the country. The second (MxFLS-2) and third round (MxFLS-3) were conducted during 2005-2006 and 2009-2012, respectively. Given the longitudinal design of the survey, the MxFLS-2 and MxFLS-3 aimed to relocate and reinterview the sample of the MxFLS- 1—including those individuals who migrated within Mexico or emigrated to the Unites States—and to interview the individuals or households that grew out from previous samples. The MxFLS-2 and MxFLS-3 relocated and reinterviewed almost 90 percent of the original sampled households.” Age range of participants included: 6 to 64 years Source: The Mexican Family Life Survey website. http://www.ennvih-mxfls.org/english/introduccion.html. Accessed 16 November 2017.

20
Moldova: STEPS 2013 “A total of 4807 randomly selected respondents participated in the survey. They were all aged 18–69 years, and the group comprised both sexes, as well as residents of all districts and the territorial administrative unit “Gagauz-Yeri”, along with Chişinãu and Balti municipalities. The survey did not cover the districts from the left bank of the Nistru River and the municipality of Bender. A two-stage cluster sampling procedure was carried out to select randomly participants from among the target population. Cluster sectors from the 2004 Moldova Population Census were used as a basic unit. Given the differences in lifestyle and disease status between populations in urban and rural areas, the target population was stratified into urban and rural areas of residence for the STEPS survey. At the first stage, within each stratum, primary sampling units (PSUs) (enumeration areas (EAs)) were selected systematically with probability proportional to the 2004 Population Census EAs (measure of size equal to the number of population in the EAs, provided by the census). Before selection, the census sectors were sorted geographically from north to south within each stratum, in order to ensure additional implicit stratification according to geographical criteria. A total of 400 clusters representing 400 EAs were selected from the 10 991 census EAs. These probabilistically selected clusters were used also in Moldova’s DHS conducted in 2005, and the Multiple Indicator Cluster Surveys (MICS) conducted in 2012. Cartographic materials from the Population Census conducted in Moldova in 2004 were not available, thus it was not possible to use them for the STEPS survey. Therefore, for the first stage the probabilistic samples from the abovementioned surveys were used. Out of the 400 selected clusters, 167 were rural and 233 were urban. The distribution of the sample of 400 PSUs (EAs) for the DHS/MICS surveys was inversely proportional to the number of population within each stratum, taking into account that the response rate is lower in urban areas than rural owing to the smaller average size of the households in urban areas compared with rural areas. Thus, disproportional allocation with oversampling for urban areas was applied in the STEPS survey. A final weighting adjustment procedure was carried out to enable estimates at national and urban/rural levels. At the second stage, 15 households (secondary sampling units (SSUs)) were selected within each of the 400 PSUs. From the updated list of households used for the MICS 2012 survey, 15 households were selected randomly per cluster, using the Microsoft Excel® random sample tool. A total of 6000 individuals were selected from among the 400 clusters. The Kish method (17) was applied for the random selection of one individual aged 18–69 years from each household.” Age of participants included: 18-69 years Source: Republic of Moldova STEPS 2013 report. Available at: https://www.who.int/ncds/surveillance/steps/Moldova_2013_STEPS_Report.pdf Mongolia: STEPS 2013 A nationwide, cross-sectional survey was conducted covering 8 districts of Ulaanbaatar city and 21 aimags of Mongolia. A total of 6013 individuals aged 15-64 years old, representing the Mongolian adult population, were involved in the survey. Sampling: The survey was designed to cover all geographical areas of Mongolia, and a multi stage stratified sampling process was carried out to randomly select participants from the target population. Given the urban vs. rural differences in lifestyle and disease status, the target population was stratified into urban and rural areas and the sample was drawn proportionally based on the target population in each area. Ulaanbaatar, Darkhan and Erdenet cities represented urban areas, while the remaining aimags and soums represented rural areas.
Primary units for Ulaanbaatar, Darkhan and Erdenet cities were khoroos, whereas soums served as primary units for rural areas. The same principle used in the previous STEPS surveys in 2005 and 2009 was applied for sampling unit selections for each stage. From each selected household at the tertiary units of multi-stage cluster sampling in both urban and rural areas, only one individual aged 15-64 years old was randomly selected. The survey covered a total of 65 cluster sampling units. These units included randomly selected individuals from 32 soums in 21 rural aimags and 33 khoroos in Ulaanbaatar, Darkhan and Erdenet cities. The below Table-1 presents selected clusters, cluster sampling units and the numbers and

21
proportion of participants out of the total population. In order to be able to compare the survey results and findings by urban and rural areas, we conducted sampling based on the principles to select approximately similar numbers of participants from both urban and rural areas. Age of participants included: 15-64 years Source: Mongolia STEPS 2013 reports. Available at: https://extranet.who.int/ncdsmicrodata/index.php/catalog/615/related_materials Morocco STEPS 2017 One of the essential elements for establishing a probability sampling plan is the constitution an adequate sampling frame. For the purpose of the STEPS survey, the sampling frame used to meet the sampling need was the 2014 master sample, developed by the HCP based on data from the 2014 population and housing census. It has the advantage extrapolate the sample results to the target population and estimate the accuracy desired. The stratification of observation units belonging to any sampling frame makes it possible to design sampling plans ensuring optimal sample size; a significant reduction in costs and a substantial improvement in the accuracy of expected estimators. However, the choice of criteria allowing the population to be divided into homogeneous groups (strata) and having recent and reliable data on these criteria is a task that requires generally considerable efforts (updating the sampling frame) both in terms of methodological than that of data collection. In Morocco, the particularity of cities containing several social categories for which, synthesizing the vector of heterogeneous demographic and socioeconomic behavior into a representative characteristic makes stratification a difficult task. The stratification adopted was geographical for the two environments according to the weight in terms of households, each of which has a specific stratification: For urban units, the criteria used were the administrative division into regions, provinces / prefectures and the dominant habitat type. As for the rural environment, the primary units were stratified according to the geographical criterion, and the type of relief dominant at the municipal level. Age range of participants included: 18 years and older Source: Morocco STEPS report [translated online]: https://extranet.who.int/ncdsmicrodata/index.php/catalog/544/study-description Myanmar STEPS 2014 To achieve a nationally representative sample, a multi-stage sampling method was used to select townships, wards and villages, households and eligible participants at each of the selected households. Stage 1: Selection of primary sampling units (PSUs) Administratively, Myanmar is divided into 330 townships. A township is subdivided into wards for urban settings and village tracts and then villages for rural settings. The list of townships has been used as the sampling frame at the first stage of sampling. Townships form the Primary Sampling Units (PSUs). Out of the total 330 PSUs, 52 PSUs were selected using Probability Proportionate to Size of population in each PSU (PPS). Stage 2: Selection of Secondary Sampling Units (SSUs) From each selected PSU (township), 6 SSUs (wards and villages) were chosen using probability proportionate to population size, totaling 312 SSUs for the whole country. Stage 3: Selection of eligible participants at household level From each selected SSU (ward/village), 30 households were selected using systematic random sampling. The sampling frame for this sampling is the list of households with unique identification number (ID) developed from a recent listing of households available from the Basic Health Staff. Stage 4: Selection of eligible participants at household level One eligible participant (aged between 25 and 64 years) in the selected households was recruited for the survey. The Kish sampling method was used to randomly select one eligible member of the household. Using the Kish Method, eligible participants (adults aged 25 to 64 years) in each household were ranked in order of 8 decreasing age, starting with males then females, then randomly selected using the automated program for Kish selection in the handheld PDA. Each

22
PSU (township) was estimated to contribute 180 participants, totaling 9,360 participants for 52 selected townships for the whole country. In actual study, the total sample size was 8757 participants. Age range of participants included: 18 years and older Source: STEPwise approach to chronic disease risk factor surveillance report 2014. Available at: https://www.who.int/ncds/surveillance/steps/myanmar/en/ Namibia: DHS 2013 “The sample for the 2013 NDHS was a stratified sample selected in two stages. In the first stage, 554 EAs were selected with a stratified probability proportional to size within the sampling frame. The EA size is the number of households residing in the EA and recorded in the 2011 NPHC. Stratification was achieved by separating each region into urban and rural areas. Therefore, the 13 regions were stratified into 26 sampling strata: 13 rural strata, and 13 urban strata. Samples were selected independently in each stratum, with a predetermined number of EAs selected as shown in Table A.3. Implicit stratification with proportional allocation was achieved at each of the lower administrative unit levels by sorting the sampling frame before the sample selection. Sorting was done according to the constituency and the EA code within a sampling stratum, and by using a probability proportional-to-size selection procedure. After the selection of EAs and before the main survey, a household listing operation was carried out in all selected EAs, and the resulting lists of households served as a sampling frame for the selection of households in the second stage. Some of the selected EAs may large. To limit the amount of work done to list each household, selected EAs with more than 200 households were segmented by the listing team in the field before the household listing. Only one segment was selected for the survey, with probability proportional to the segment size. Household listing was conducted only in the selected segment (see detailed instructions for segmentation in the DHS Manual for Household Listing). So a 2013 NDHS cluster is either an EA or a segment of an EA. In the second-stage selection, a fixed number of 20 households was selected in every urban cluster and rural cluster, by equal probability systematic sampling. A spreadsheet indicating the selected household numbers for each cluster was prepared. The survey interviewers interviewed only the pre-selected households. To prevent bias, no replacements and no changes of the pre-selected households were allowed in the implementing stages. In half of the selected households where there was no male survey, all women age 15-49 were interviewed; in the other half of the selected households where there was a male survey, all males and females age 15-64 were interviewed.” Age range of participants included: women 15 to 64 years Source: The Nambia Ministry of Health and Social Services (MoHSS) and ICF International. 2014. The Namibia Demographic and Health Survey 2013. Windhoek, Namibia, and Rockville, Maryland, USA: MoHSS and ICF International. Nepal: STEPS 2017 “Survey population included men and women aged 15-69 years who have been the usual residents of the household for at least six months and have stayed in the household the night. The nationally representative sample was selected through multistage cluster sampling. Sampling frame consisting of the distribution of old wards as in census 2011 was obtained from the Central Bureau of Statistics (CBS). A total of 25 households were sampled from each of the clusters. A sampling frame of all the households in the samples PSUs was obtained through a complete household listing and mapping carried out in the samples PSUs in September 6 to December 6 2018. Sampling frame for selection of households from each PSU was prepared by conducting household listings and mapping. The team of enumerators visited the sampled PSUs and carried out a complete mapping of all the households in the PSU. The lists of the households so prepared from all the sampled PSU served as the sampling frame for the selection of households in the next stage. From the prepared list, 25 households per PSU were sampled using equal systematic random sampling after determining the sampling interval by dividing the number of listed household by 25 and by randomly selecting the starting number between 0 and the sampling interval.” Age range of participants included: 15 to 69 years

23
Source: STEPS Survey Nepal 2019 Report. Available at: https://extranet.who.int/ncdsmicrodata/index.php/catalog/771/related_materials Romania: SEPHAR II “Sampling was performed by a multi-stratified procedure, leading to the selection of a representative sample of 1942 adults. Subject selection followed the principle of equality of chances of being enrolled in the study, regardless of the size of the place of residency. Stratification criteria for sample selection were:
• territorial regions (Romania's territory was divided into 7 regions plus the capital city Bucharest, based on the National Statistics Institute recommendations: the North-East region, the South-East region, the South region, the South-West region, the West region, the North-West region, the Central region and the Bucharest region);
• locality type (cities with over 200 000 inhabitants, cities with 50 000–200 000 inhabitants, cities with less than 50 000 inhabitants, Commune);
• gender (male and female); • age groups (18–24 years, 25–34 years, 35–44 years, 45–54 years, 55–64 years, 65–80 years).
In the first stage of selection, the adult population weighted average was calculated for each region and each district, and, based on this, the number of adult persons from each region/district was calculated from the working sample of 1942 subjects.
In the second stage of selection, the number of localities of a certain size from which the subjects were later selected was established for each district. This number was directly proportional to the population in the respective district. A random selection of a certain locality in a certain category was done using a computer software (generation of random numbers). The selected localities represent the interview centers where the study was to take place. The weighted average of the specific locality population in the district was calculated, and, based on this, the number of people selected to participate in the study.
The third stage of selection consisted of distribution by gender of adult people selected from each locality, using Romania's population gender distribution according to the 2002 census (F : M = 51.25% vs. 48.75%) and the fourth stage of selection consisted of distribution by age of male and female adult people selected from each locality, using Romania's population age distribution according to the 2002 census.” Age range of participants included: 18 to 80 years Source: Dorobantu M, Tautu OF, Darabont R, Ghiorghe S, Badila E, Dana M, Dobreanu M, Baila I, Rutkowski M, Zdrojewski T. Objectives and methodology of Romanian SEPHAR II Survey. Project for comparing the prevalence and control of cardiovascular risk factors in two East-European countries: Romania and Poland. Arch Med Sci. 2015 Aug 12;11(4):715-23.
Additional reference: Dorobantu M, Tautu O-F, Dimulescu D, Sinescu C, Gusbeth-Tatomir P, Arsenescu-Georgescu C, et al. Perspectives on hypertension’s prevalence, treatment and control in a high cardiovascular risk East European country: data from the SEPHAR III survey. J Hypertens. 2018;36(3):690–700.
Rwanda: STEPS 2012-2013 Participants were Rwandan residents aged 15-64 years. Because it was not feasible to conduct a census on the whole population, a representative random sample of participants was selected. To detect statistically significant differences between categories, the WHO STEPwise methodology suggests a minimum sample of 384 people for every age, sex rural/urban or province category the results will be stratified by. For the Rwandan survey the MOH was interested in looking at both males and females across five age groups (15-24 years, 25-34 years, 35-44 years, 45-54 years and 55-64 years), yielding a minimum required sample size of 3840. This was multiplied by 1.5 to account conservatively for the likelihood of a selected participant having the risk factor of interest and then divided by 0.80 assuming that only 80% of those invited to participate would actually participate. This yielded a required sample size of 7200 participants.

24
Multistage cluster sampling was used to select these participants from the population based on information from the last census. The three levels of clustering were: 1. Random selection of a statistical enumeration area (as defined by NISR) 2. Random selection of a household within the enumeration area 3. Random selection of an individual within the household. Administratively, Rwanda is divided into thirty districts. In turn, each district is subdivided into sectors. Each sector is sub-divided into cells and then into villages. Villages are synonymous with enumeration area’s (EAs) in Rwanda and there are a total of 14,953 EAs in Rwanda. A total of 180 EA’s (or 1.2%) were randomly selected from this total using a probability proportional to size method that gives those EA’s with more people living in them a higher chance of being selected. In this way, the representativeness of the selected EAs is maximized. Age range of participants included: 15-64 years Source: Republic of Rwanda Non-communicable Diseases Risk Factors Report 2012. Available at: https://extranet.who.int/ncdsmicrodata/index.php/catalog/709 Samoa: STEPS 2013 The STEPS survey of chronic disease risk factors in Samoa was carried out from April 2013 to May 2013. Samoa carried out Step 1, Step 2, and Step 3. Socio demographic and behavioural information was collected in Step 1. Physical measurements such as height, weight and blood pressure were collected in Step 2. Biochemical measurements were collected to assess blood glucose and cholesterol levels in Step 3. The STEPS survey was a population-based survey of adults aged 18-64. A multi-stage, cluster sample design was used to produce representative data for that age range in Samoa. A total of 1766 adults participated in the survey. The overall response rate was 64%. Age range of participants included: 18 to 64 years Source: Samoa STEPS Survey 2013 Fact Sheet. Available at: https://extranet.who.int/ncdsmicrodata/index.php/catalog/707 Sao Tome and Principe: STEPS 2009 The STEPS survey on risk factors for chronic diseases in São Tomé and Príncipe took place from January to February 2008. São Tomé and Principe has undertaken Step 1, Step 2 and Step 3. Sociodemographic and behavioral data were collected in Step 1. Physical measurements such as height, weight and blood pressure were collected in Step 2. Biochemical measurements were collected to assess blood sugar and blood sugar levels cholesterol in Step 3. The São Tomé and Principe STEPS survey is a survey of the general population, targeting adults aged 25 to 64. A cluster draw was used to produce representative data for this age group in São Tomé and Principe. A total of 2,457 adults participated in the São Tomé STEPS survey and Principle. Age range of participants included: 25 to 64 years Source: Translated from Sao Tome and Principe STEPS 2008 Fact Sheet. Available at: https://extranet.who.int/ncdsmicrodata/index.php/catalog/735 Seychelles: STEPS 2013 “The survey was performed in a sex and age stratified random sample of all adults aged 25‐64 years of Seychelles between October and December 2013 on Mahé and during 2 weeks in February 2014 in the islands of Praslin and La Digue. These three islands account for >98% of the total population of Seychelles. The eligible sample was extracted from the population registry. The survey was attended by 1240 adults, with a participation rate of 73%. Participants were invited to attend the survey on selected days in study centers located in Mahé, Praslin, and La Digue. All the eligible participants who did not attend were actively traced using (telephone, local administration, announcements on radio, etc) and invited to attend the survey. Since participants were randomly selected from the general adult population, findings of the survey can be inferred to the general adult population of Seychelles.” Age of participants included: 25-64 years Source: National Survey of Noncommunicable Diseases in Seychelles 2013‐2014 (Seychelles Heart Study IV): methods and main findings. Available at: http://www.who.int/chp/steps/seychelles/en/.

25
Additional reference: Bovet P, Romain S, Shamlaye C, Mendis S, Darioli R, Riesen W, et al. Divergent fifteen-year trends in traditional and cardiometabolic risk factors of cardiovascular diseases in the Seychelles. Cardiovasc Diabetol. 2009; 8:34. https://doi.org/10.1186/1475-2840-8-34 PMID: 19558646 Solomon Islands: STEPS 2015 A multi-stage cluster sample design was used to produce representative data. Analysis weights were calculated by taking the inverse of the probability of selection of each participant. These weights were adjusted for differences in the age-sex composition of the sample population as compared to the target population. Different weight variables are available per Step: wStep1 - for interview data wStep2 - for physical measures wStep3 - for biochemical measures This allows for differences in the weight calculation for each Step of the survey as the age-sex composition of the respondents to each Step can differ slightly due to refusal or drop out.” Age range of participants included: 18 to 69 years Source: no report or fact sheet available. Sampling information obtained from: https://extranet.who.int/ncdsmicrodata/index.php/catalog/710/study-description#page=overview&tab=study-desc South Africa: SANHANES 2012 “The survey applied a multi-stage disproportionate, stratified cluster sampling approach. A total of 1000 census enumeration areas (EAs) from the 2001 population census were selected from a database of 86,000 EAs and mapped in 2007 using aerial photography to create the 2007 HSRC master sample to use as a basis for sampling of households. The selection of EAs was stratified by province and locality type. In the formal urban areas, race was also used as a third stratification variable (based on the predominant race group in the selected EA at the time of the 2001 census). The allocation of EAs to different stratification categories was disproportionate, in other words, over-sampling or over-allocation of EAs occurred in areas that were dominated by Indian, coloured or white race groups to ensure that the minimum required sample size in those smaller race groups were obtained. Based on the HSRC 2007 Master Sample, 500 Enumerator Areas (EAs) representative of the sociodemographic profile of South Africa were identified and a random sample of 20 visiting points (VPs) were randomly selected from each EA, yielding an overall sample of 10 000 VPs. EAs were sampled with probability proportional to the size of the EA using the 2001 census estimate of the number of VPs in the EA database as a measure of size (MOS). One of the tasks of SANHANES-1 was to recruit and establish a cohort of 5 000 households to be followed up over the coming years. The sampling consisted of: Multi-stage disproportionate, stratified cluster sampling approach; 500 EAs within which 20 VPs/households per EA were sampled; Main reporting domains: sex (male, female), age-group (< 2 years, 2–5 years, 6–14 years, 15–24 years, 25–49 years, 50 years and older), race group (black African, white, coloured, Indian), locality type (urban formal, urban informal, rural formal [including commercial farms] and rural informal], and province (Western Cape, Eastern Cape, Northern Cape, Free State, KwaZulu-Natal, North West, Gauteng, Mpumalanga, Limpopo).” Age range of participants included: all ages; biomarker information collected on participants 6 years or older Source: Human Sciences Research Council. SANHANES: Health and Nutrition. 2015. Available at: http://www.hsrc.ac.za/en/research-areas/Research_Areas_PHHSI/sanhanes-health-and-nutrition Additional reference: Stokes A, Berry KM, McHiza Z, Parker WA, Labadarios D, Chola L, et al. Prevalence and unmet need for diabetes care across the care continuum in a national sample of South African adults: evidence from the SANHANES-1, 2011–2012. PLoS ONE. 2017; 12(10):e0184264. https://doi.org/10.1371/journal.pone.0184264 PMID: 28968435.

26
St. Vincent & the Grenadines: STEPS 2013 “The survey covered the entire island St. Vincent and the Grenadines, and was conducted using the following zoning categories: 1) Mainland (St. Vincent) 2) Northern Grenadines (Bequia and Mustique) 3) Southern Grenadines (Canouan and Union Island) The sample size was proportionately divided between the three main reporting strata (St.Vincent/Northern Grenadines/Southern Grenadines). The country’s most recent age breakdown based on the 2001 national census by St. Vincent was used to approximate the adult population 18-69 years by Island grouping. The survey was stratified by sex, age groups 18-29, 30-44 and 45-69 years and by geographical location – St. Vincent, Northern Grenadines and Southern Grenadines. A three-stage cluster sampling approach was used. Enumeration districts were randomly selected using Probability Proportional to Size (PPS) from the sampling frame. A total of 199 enumeration districts were selected. The sampling frame was developed using the number of households per enumeration district taken from the 2012 preliminary census report; enumeration districts had been subsequently revised (2010-2011) so that no enumeration district containing more than 150 Households would be randomly selected from the selected enumeration districts. The number of households per enumeration district to be selected was 26. Where an enumeration district had been split into 2 or more new enumeration districts the number of households in the previously defined enumeration district was divided equally between the newly revised enumeration districts. The household list for each selected enumeration district was updated prior to selection of households during a re-listing exercise. This was necessary as the existing household listing for each enumeration district was outdated. Eligible persons at the household level were randomly selected using the Kish method. If no one was present in the selected household, a notification of visit card was left and the interviewer revisited. There was a total of three visits to the household before it was listed as non-response (one initial recruitment visit and two call backs). The interviewer then moved on to the next house on the list in the original order. Although the person selected for interview were to be at least 18 years and not older than 69 years on the last birthday, there were a few instances where some participants were turning 18 or 70 years; those cases were addressed during data cleaning. Biological samples, testing and Nutrition intake (24 hour recall): Fifty percent (50%) of the survey participants were asked to provide a biological specimen (finger prick) for Glucose and cholesterol testing using Glucose and Lipid Sampling Kits and respond to the nutrition intake (24 hour recall). The biological sample was only collected with participants’ explicit consent; the samples were not stored or used for additional undetermined or undisclosed future testing to which respondents did not agree at the time of participation.” Age range of participants included: 18 to 69 years Source: WHO STEPS: Noncommunicable Disease Risk Factor Surveillance. Report for St. Vincent & the Grenadines 2015. Available at: http://www.who.int/ncds/surveillance/steps/stvincent/en/ Sudan: STEPS 2016 A four-stage cluster sampling design was implemented. The four sampling stages were; 1) selection of states from the six regions 2) selection of clusters (a cluster was a Popular Administrative unit), 3) selection of households and 4) selection of eligible individuals. First Stage (State): Administratively Sudan is divided into 18 states which are grouped in six regions, (North, East, Khartoum, Central, Kordofan and Darfur region (Table 1). States were randomly selected from each region. No geographical areas or populations were excluded from the sampling frame. Thus 11 states were selected, probability proportional to the size, to represent the six regions. A list of the selected states is shown in Table 2.1. Second Stage (Cluster PAU): The Popular Administrative Units (PAU) is the smallest geographically border unit. These were defined as the ‘cluster’ in the region. Clusters were

27
randomly sampled from all PAUs, from both urban and rural strata, according to probability proportional to size in each state, and urban/rural distribution. The PAUs inaccessible due to security conditions were not excluded from the sampling frame, because within certain areas the security status was continuously changing. However, it was planned that if a PAU was found to be inaccessible at survey time, it should be replaced. However, no replacement was required during this survey. Third Stage (Household): Within the selected PAUs, all households (HH) were included in the sampling frame. Accordingly (HH) were selected using systematic random methods. Fourth Stage (Individual): The members of the household were first listed in the mobile application (customized software). The inclusion criteria for the listed members were: all individuals aged between 18 to 69 years, from both sexes, irrespective of his health status and living in the selected household for a minimum of 6 weeks. The application was then run and it randomly selected the individual who will be selected to participate in the study. Age of participants included: 18-69 years. Source: Sudan STEPS 2016 report. Available at: https://www.who.int/ncds/surveillance/steps/Sudan_STEPwise_SURVEY_final_2016.pdf?ua=1 Tajikistan STEPS 2016 A multi-stage cluster sample of households. One individual within the age range of the survey was selected per household. Analysis weights were calculated by taking the inverse of the probability of selection of each participant. These weights were adjusted for differences in the age-sex composition of the sample population as compared to the target population. Different weight variables are available per Step: wStep1 - for interview data wStep2 - for physical measures wStep3 - for biochemical measures This allows for differences in the weight calculation for each Step of the survey as the age-sex composition of the respondents to each Step can differ slightly due to refusal or drop out. Age range of participants included: 18-69 years Source: report not available. Sampling information obtained from: https://extranet.who.int/ncdsmicrodata/index.php/catalog/270/study-description#page=sampling&tab=study-desc Tanzania: STEPS 2012 "The STEPS survey in the United Republic of Tanzania was a population-based survey of adults aged 25-64. The study used both multistage cluster and random probability sampling procedures. Fifty of 119 total districts were randomly selected as primary sampling units (PSUs). Within these PSUs, enumeration areas (EAs) of > 50 households were randomly selected. Any EA with < 50 households was merged with a neighboring EA. Within the EAs, households were randomly selected from a list of all eligible households in the EA. A total of 5762 adults participated in the Tanzania STEPS survey. Within each selected household, the Kish method was used to select the STEPS participant. This procedure was followed until the predetermined sample was obtained for the enumeration area. The response rate for this survey was 94.7%.” Age range of participants included: 25 to 64 years Source: Tanzania STEPS Survey Report. Available at: http://www.who.int/chp/steps/UR_Tanzania_2012_STEPS_Report.pdf?ua=1 Additional reference: Mayige M, Kagaruki G. Tanzania STEPS survey report. Dar es Salaam: National Institute of Medical Research; 2013. Timor-Leste: STEPS 2014 “Note: Data from Census 2010 were used for all sampling considerations. Even though planning and mapping for 2015 Census is ongoing, data from the Census will only be available after July 2015.

28
STEP 1: Selection of Enumeration Area (1) List of EA with number of HH by district for Census 2010 was obtained from the Directorate of Statistics. There are 1826 EAs in Timor-Leste. Out of these, 150 EAs were selected. (2) The number of EAs to be selected from each district was based on their proportion in the country’s population as per Census 2010. (3) The numbers of Households (HH) per EAs varied from 0 to more than 300. Therefore, probability proportion to size (PPS) was used. (4) For each district, the EAs were arranged in ascending order of HH size. (5) Sampling interval was obtained by dividing the total number of HH in the district by the number of EA to be selected from that district. (6) A random number was generated between one and the sampling interval for that district, using tools available at random.org. (7) The EA where that random number fell was the first EA to be selected. (8) Subsequently, the sampling interval was added to the random number and the EA where this new number fell was selected. For the next number, the sampling interval was added to the number and so on, till the population of HH was exhausted or target number of EA achieved. (9) This was done separately for each district. (10) The final list was compiled and had 150 EAs. These are spread over about 125 sucos. STEP 2. Selection of Households in an Enumeration Area Listing the house numbers to be visited (1) It was decided to use the 2010 HH size of each EA. Based on past experience, it was expected that the increase would be on an average about 4–5%. (2) The list of households to be selected by enumerators was decided centrally. (3) Sampling interval was calculated by dividing the total number of households in the EA by 18. (4) The first HH number was selected randomly by reading the last two digits of a currency note. If the number represented by the two digits was more than 18, the last digit was taken into consideration. For each EA, a different currency note was used. This could also be done it by using the tool at random.org. or by draw of lots. (5) The subsequent HH are identified by adding the sampling interval as was done for selection of EA.” Age range of participants included: 18 to 69 years Source: Timor-Leste STEPS Survey Report, [online] at http://www.who.int/entity/chp/steps/Timor-Leste_2014_STEPS_Report.pdf?ua=1 Togo: STEPS 2010 “Those included in this survey are male or female subjects, living in urban or rural areas, aged 15 to 64 on the day of the survey, residing in the enumeration area for at least 6 months and having given their informed consent to participate in this study. [...] Three hundred clusters were randomly selected in a systematic draw with probability proportional to the size of the cluster (number of households) in the 4620 areas of enumeration of the DGSCN (General Directorate of Statistics and National Accounts) sampling frame. In order to obtain the 4,800 households at the rate of 1 individual / household, 16 households per cluster were randomly selected at the second stage of survey. In each of the selected households, one individual was selected as a survey participant via the Kish Method. A household was defined as the group of persons, who regularly share the main meal (regardless of their relationship). Households were not replaced in the event of a refusal or two unsuccessful visits to the eligible person selected by Kish's method. If the selected person was unwell or not present at the time of the interview, the investigators either tried to find a new appointment or searched for the respondent.” Age range of participants included: 15 to 64 years Source: Translated from WHO: The Final Report on the Togo STEPS Survey 2010. Available at: http://www.who.int/chp/steps/2010STEPS_Report_Togo_FR.pdf?ua=1.

29
Tuvalu: STEPS 2015 “The Tuvalu STEPS Survey was a population based cross-sectional survey of 18-69 year olds. Analysis weights were calculated by taking the inverse of the probability of selection of each participant. These weights were adjusted for differences in the age-sex composition of the sample population as compared to the target population. Different weight variables are available per Step: wStep1 - for interview data wStep2 - for physical measures wStep3 - for biochemical measures This allows for differences in the weight calculation for each Step of the survey as the age-sex composition of the respondents to each Step can differ slightly due to refusal or drop out. Additionally, some countries perform subsampling for Step 2 and/or Step 3. When no subsampling is done and response rates do not differ across Steps of the survey, the 3 weight variables will be the same.” Age range of participants included: 18 to 69 years Source: no report or fact sheet available. Sampling information obtained from: https://extranet.who.int/ncdsmicrodata/index.php/catalog/639/study-description#page=overview&tab=study-desc Uganda: STEPS 2014 “Uganda has a total population of 34.9 million people, approximately 43% of which are adults aged 18 years or older [14]. The survey covered the whole country, and a three stage sampling design was used to select participants. The sampling procedure utilized the Uganda Bureau of Statistics (UBOS) master sampling frame of Enumeration Areas (EAs) that had just been demarcated throughout the country in preparation for the 2014 population and housing census. Each EA included 150–200 households. In the first stage, a random sample of 350 out of 78,950 EAs was selected with selection probability proportional to the size (PPS) of the number of households in the EAs. The EAs were stratified across the four regions of Uganda namely: Central, Eastern, Northern and Western region; and were selected with separate estimates for rural and urban areas. Urban areas were defined as EAs within government designated urban areas, or those within other geographic divisions with population density of more than 1000 per square kilometer. After selecting the 350 EAs, trained teams of UBOS staff were dispatched throughout the country to list the households and their household heads within the 350 EAs. A household was defined as a group of individuals that usually shared meals together, and had a household head who usually made major decisions for the household. In the second stage of sampling, 14 households were randomly selected from the listed households in each of the sampled EAs. Research Assistants (RA) that had received a five-day training on procedures and administration of the STEPs tool, enumerated eligible household members who were recorded in Personal Digital Assistants (PDA), which was then used to randomly select one subject for inclusion in the survey giving a total sample of 4900. Eligible subjects were household members aged 18 to 69 years, who had resided in the sampled households for at least six months preceding the date of interview.” Age range of participants included: 18 to 69 years Source: Guwatudde D, Mutungi G, Wesonga R, Kajjura R, Kasule H, Muwonge J, et al. (2015) The Epidemiology of Hypertension in Uganda: Findings from the National Non-Communicable Diseases Risk Factor Survey. PLoS ONE 10(9): e0138991. doi:10.1371/journal.pone.0138991. Additional reference: Bahendeka S, Wesonga R, Mutungi G, Muwonge J, Neema S, Guwatudde D. Prevalence and correlates of diabetes mellitus in Uganda: a population-based national survey. Trop Med Int Health. 2016; 21 (3):405–16. https://doi.org/10.1111/tmi.12663 PMID: 26729021 Vanuatu: STEPS 2011

30
“The survey used a cluster sampling design where the primary sampling unit was enumeration area (EA) and the secondary sampling unit was households. All 6 provinces in Vanuatu were included in the survey. One hundred and thirteen (113) EAs were randomly selected proportion to the size of the EA from a total of 411 EAs. Forty four (44) households were then randomly selected in each EA proportional to the number of households in each EA. The selection of participants within each household was done using the Kish method. The total number of households selected by combined Enrolment Areas was 4,972. The required sample size was calculated as 4972 households on a margin of error of 0.05, an anticipated response rate of 89% and with 80% power to detect statistically significant differences between six age/sex groups. Accordingly, from the 4,972 selected households 4,649 individuals aged 25-64 years participated in STEP 1 and STEP 2 giving an overall response rate of 94%. The response rate dropped to 85% for STEP 3 with 4,224 people participating.” Age range of participants included: 25 to 64 years Source: Vanuatu STEPS report [online]: https://extranet.who.int/ncdsmicrodata/index.php/catalog/714 Vietnam: STEPS 2015 At the same time of STEP survey, MOH also conduct the Global Adult Tobacco Survey (GATS) at the same scale, location, and study subjects (>15 years for GATS and 18-69 for STEPS). The sampling of STEPS was done in as part of the sampling for the (GATS) conducted in combination manner to save time and resources for these two surveys. Applied the multi-stages complex sampling process, the sampling process done by GSO was as follow: • Sampling of clusters (EA) In the first stage of sampling, the primary sampling unit (PSU) was an enumeration area (EA). There are about 170,000 EAs in the whole Viet Nam and the average number of households in each EA is different between urban and rural areas. An average number of households in an urban EA and a rural EA is 133 households and 120 households, respectively. Sample of EAs were selected from the master sample frame. The master sample frame was a cluster frame made by the GSO based on the frame of Population and Housing Census 2009 and updated with data of 2014. Based on the Population and Housing Census data 2009, GSO prepared a 15% of master sample to serve as a national survey sampling frame. The master sample frame contains 25,500 enumeration areas (EAs) from 706/708 districts of Viet Nam (2 island districts were excluded from the GSO master sample frame). The master sample frame of GSO was divided by two stratification variables: urbanization (1 = urban; 2 = rural) and district group (1 = district/town/city of province; 2 = plain and coastal district; 3 = mountainous, island district). It means that the master sample frame was divided into 6 sample frames or 6 strata. The probability proportional to size (PPS) sampling method was used to select sample of EAs from 6 strata of master sample frame. The final sample of GATS included 315 EAs in the urban and 342 EAs for the rural. From these 657 EAs, 315 EAs were systematically selected for STEPS. Sampling of households At the second stage of sampling, 10% households in each EA were selected. Thus, 15 households from the selected urban EA and 14 households from the selected rural EA were chosen using simple systematic random sampling. The total households for STEPS 2015 were 4,651 households. Sampling of individuals: One eligible person is then randomly selected from each selected household for the STEPS 1 interview. The selection of individual is automatically done by the PDA program after eligible household members are entered into the PDA. The selection probability of an eligible individual was calculated as a product of selection probability for each stage. The sampling base weight for an eligible individual was the inverse of the selection probability shown above. Age range of participants included: 18 to 69 years Source: National Survey on the Risk Factors of Non-communicable diseases (STEPS) Viet Nam Report 2015. Available at: https://www.who.int/ncds/surveillance/steps/viet_nam/en/ Zambia: STEPS 2017 To ensure that the sample reflected the entire country of Zambia, a multi-stage cluster sampling technique was used to select a nationally representative sample of adults in Zambia aged 18 to 69

31
years. It was decided to utilize the household listing from the Zambia PopulationBased HIV Impact Assessment (ZAMPHIA) - a household-based national survey that was conducted between March and August 2016 in order to measure the status of Zambia’s national HIV response. ZAMPHIA offered the most pragmatic up to date and accessible national household listing to be used as the sampling frame for this survey. The ZAMPHIA survey included 60,581 households drawn from 1,103 clusters referred to in this report as standard enumeration area (SEA) (Table 2.4.1). Thus the sample drawn for the STEPS survey was a subsample of the households selected for the ZAMPHIA survey. In the first stage of sampling, SEAs were selected from each province using probability proportional to size (PPS). In the second stage, 15 households in rural SEAs and 20 households in urban SEAs were selected systematically using appropriate sampling interval based on the number of households in that SEA. These households constituted the final list of households for the STEPS survey prepared for the field investigators (FI). In the third stage, while the FI approached the household and sought consent, all eligible members in the household were entered into the Android-based devise used for the survey. The device then selected one member from the eligible members using a simple random sampling technique. The selected member was then interviewed having gone through the ethical process of consent after being provided with information on the survey. If the selected member was not available, a scheduled visit was made. If the selected member could not be reached after two scheduled visits he or she was considered as non-response. There was no replacement strategy so as to maintain the integrity and representativeness of the sample. Age range of participants included: 18 to 69 years Source: STEPS 2017 Report. Available at: https://extranet.who.int/ncdsmicrodata/index.php/catalog/620 Zanzibar STEPS 2011 “The survey took place in June and July 2011, followed by data cleaning and analysis. One Principal Investigator and five assistant researchers coordinated the survey on site, checked completed questionnaires daily, and organized logistics. The six data collection teams consisted each of six interviewers, one supervisor, one laboratory technician and one driver. Interviewers were either health care workers or professional interviewers familiar with household surveys such as DHS. The sample size was calculated to be 2800 participants. Each interviewer did on average 3 – 4 interviews a day and was assisted on site by local village guides. The study was a cross-sectional population based survey with a sample of a sufficient size with a power to determine the proportion of adults that are exposed to selected risk factors associated with NCDs; including those having raised BP, FBG or blood lipids, had experienced injuries or traumas in recent times, and/or were mentally unwell (anxiety, depression), as well as linking these conditions with one another and with the sociodemographic and economic information obtained. People reported to be permanent residents (spending on average maximum 3 nights per week outside the house, and not holding an address in another place) in the selected households and fulfilled the inclusion criteria were enrolled into the survey. A person could only appear once in the study. Therefore we classified a husband practicing polygamy to be listed in the household of his first wife but not to be a member in the household of the following wives. Inclusion criteria was age between 25 - 64 years, able to understand the information given by the interviewer about the study prior to the beginning of the interview, signing of the informed consent for accepting participation. Exclusion criteria was inability to understand or comprehend the information given by data collector, inability to communicate through verbal expression for consent and for responding to the questionnaires, severe/terminal illness that hinders participation in the survey. The target population is the entire population in Zanzibar whereby the whole of Zanzibar was selected as the survey site, and hence all districts included. The total population is estimated to be 1.2 million distributed unevenly between 10 districts. The sampling frame represented the entire population in Zanzibar. The sampling strategy used is a multi-stage cluster sampling with stratification. The ten districts are considered as different strata, and the total number of primary sampling units, PSU, is allocated proportionately across all strata. Each district is divided into smaller clusters. These clusters

32
are the geographical and administrative units called Shehia11. The Shehia are divided into smaller clusters called zones (also called mitaa, vitongoji, or vijiji) which typically consist of 100-300 households. Zones smaller than that were merged to make up one larger cluster, and zones much larger were split in smaller clusters. At the first stage clusters were selected using Simple Random Selection, SRS, from the list of clusters (Shehia) within each district. At the second stage clusters (zones) were randomly selected using probability proportionate to size (PPS). At the third stage households were randomly selected from the household lists provided by the administrative leader of the Shehia. The two last stages of sampling were done using the software STEPSsampling.xls from WHO. Finally participants were selected from the household using Kish method. The household lists were complete and included households with no eligible participants for the survey. Therefore an extra 7 households were sampled at third stage in each cluster for replacement in case a selected household had no eligible participants and had to be changed. This was done before data collectors went to the cluster. Resources allowed for 100 PSU which was why 2800/100 = 28 households were selected from each PSU (and disproportionate from each SSU). A structured questionnaire was used, based on WHO STEPwise approach to chronic diseases risk factor surveillance.. After getting behavioural and socio-demographic information, anthropometric measurements (BP, height, weight, waist and hip circumference) was done the same day. Answers were recorded electronically during interview using a Personal Digital Assistant (PDA). Biochemical measurements (fasting blood glucose, triglyceride, and cholesterol levels) were done the next day at a central place in each study site according to appointment and were done by Laboratory technicians using dry chemistry for rapid and convenient results and to avoid suspicion surrounding sending away blood samples. Results were recorded electronically on site using a PDA, and participants received a paper copy of the results. Every study site was visited one day for interviews. Sampled households/ participants were visited at least three times before recorded as non-respondent. The following day the site was visited for biochemical measurements. Laboratory technicians called participants who did not show up to ask them to set up appointment for the following day (at a new study site). After all study sites had been visited call-backs were made to all eligible participants (non-respondents) who’s number we had obtained. A time and place near the participants was identified for data collection. Participants met fasting and started with having blood sample drawn, afterwards the interviews and anthropometric measurements were conducted. Laboratory technicians continued biochemistry measurements for another few days. Age range of participants included: 25 to 69 years Source: Zanzibar STEPS Survey Report, [online] https://www.who.int/ncds/surveillance/steps/2011_Zanzibar_STEPS_Report.pdf

33
Appendix 6: Detailed methodology for diabetes biomarkers by country Diabetes Biomarker Country Post Hoc
Adjustment* Point-of-care fasting capillary glucose Accu-check Samoa, Tuvalu None Accutrend® Plus (Roche, Basel, Switzerland)
Cambodia, Chile, Guyana, Liberia, Sao Tome, Togo, Zanzibar
Multiplied by 1.11
CardioCheck® PA (pts Diagnostics, Indianapolis, Indiana, USA)
Belarus, Benin, Bhutan, Burkina Faso, Eswatini, Kenya, Kiribati, Malawi, Moldova, Morocco, Nepal, Rwanda, Solomon Islands, St. Vincent & The Grenadines, Timor-Leste, Sudan, Uganda, Vietnam, Zambia
None
CONTOUR® (Ascensia Diabetes Care Holdings AG, Basel, Switzerland)
Seychelles None
FreeStyle Optium H glucometer India Multiplied by 1.11
HemoCue® Glucose 201 Analyzer (HemoCue, Brea, California, USA)
Namibia, Tanzania None
MultiCare-in© (Biochemical Systems International, Arezzo, Italy)
Georgia None
SD LipidoCare Analyzer (automatic plasma equivalent)
Myanmar None
Prima home test Mongolia None Unknown Algeria, Azerbaijan, Botswana, Comoros,
Ecuador, Eritrea, Kyrgyzstan, Laos, Lesotho, Marshall Islands, Tajikistan, Vanuatu
None
Laboratory-based Assessment of Fasting Plasma Glucose Auto analyzer Selectrao Pro M Human ®, Germany
Bangladesh N/A
Central laboratory was used for processing Lebanon N/A Cobas 6000 and C311 analyzer (Roche Diagnostics, Indianapolis, Indiana, USA)
Iran, Romania N/A
Enzymatic assay (glucose oxidase) Iraq N/A Hitachi 7600 modular chemistry analyzer (Hitachi, Tokyo, Japan)
China N/A
SYNCHRON® System (Beckman Coulter, Inc., Miami, Florida, USA)
Costa Rica N/A
Hemoglobin A1c (HbA1c) N/A
Point-of-care Bayer Consumer Care AG (A1cNow)
Seychelles
Capillary sample DCA 2000+ analyzer (Siemens/Bayer, Munich, Germany)
Fiji N/A
Dried blood spots using the Hemocue system
Indonesia N/A
Plasma sample by Cobas C311 auto-analyzer (Roche kits)
Iran N/A
Point-of-care In2ItTM device by Bio-Rad Mexico N/A Unknown Guyana N/A

34
Venous blood Cobas 6000 Romania Venous blood using automated high performance liquid chromatography
South Africa N/A
Whole blood using Bio-Rad HLC-723 G7/D10/PDQ A1c
China N/A
*Post hoc adjustment to convert from capillary to plasma equivalents
Appendix 7: Fasting requirements per survey Survey type Fasting instructions STEPS 12 hours with nothing to eat or drink, other than water DHS 8 hours or more of fasting from the time the participant
woke up until when they underwent glucose testing. Specific questions:
• When was the last time you had something to eat?
• When was the last time you had something to drink other than plain water?
Chile: NHS 2009-10 8 hours or more with nothing to eat or drink, other than water
China: CHNS 2009 Fasting required (minimum hours not specified in blood sample collection questionnaire). Specific questions:
• What time did you last eat, including candy and chewing gum?
• What time and date did you last drink anything other than water and tea without sugar?
Fiji: EHS 2009 N/A (only HbA1c collected) India: NFHS 2015-16 No fasting required Indonesia: IFLS 2014-15 N/A (only HbA1c collected) Mexico: Mexico Family Life Survey 2009-12
N/A (only HbA1c collected)
Romania: SEPHAR II From Dorubantu el at1 “Prior to taking a blood sample, the nurse made sure that the subject had not eaten for the past 8-14 hours or that he/she had not drunk any sweet drinks or drinks of any caloric value in the past 8-14 h”
South Africa: SANHANES 2012 N/A (only HbA1c collected) 1Dorobantu M, Tautu O-F, Darabont R, et al. Objectives and methodology of Romanian SEPHAR II Survey. Project for comparing the prevalence and control of cardiovascular risk factors in two East-European countries: Romania and Poland. Arch Med Sci. 2015;11(4):715-723. doi:10.5114/aoms.2015.53290

35
Appendix 8: Detailed methodology for household wealth index calculation Across surveys, several different wealth indicators were measured including continuous income, income categories, income quintiles, an asset index, or a combination of these (see table below). In an effort to homogenize wealth in the pooled analysis, we constructed household wealth quintiles for each survey.
Wealth Measure Country Asset index India, Indonesia, Kenya, Namibia, Iran Continuous income Bhutan, China, Eritrea, Fiji, Kiribati, Laos,
Malawi, Mexico, Myanmar, Romania, Timor-Leste
Continuous income and quintiles Algeria, Azerbaijan, Benin, Botswana, Cambodia, Comoros*, Ecuador, Eswatini*, Georgia, Kyrgyzstan, Lesotho, Liberia*, Moldova, Rwanda*, Samoa*, Sao Tome and Principe*, Solomon Islands, Tajikistan, Tanzania, Togo*, Uganda*, Vanuatu, Zambia, Zanzibar
Continuous income and categories Benin, Guyana, Lebanon, Marshall Islands, Mongolia, Morocco
Income categories only South Africa, St. Vincent & the Grenadines, Sudan
No wealth indicators assessed Bangladesh, Belarus, Burkina Faso, Chile, Costa Rica, Nepal, Iraq, Vietnam
*Quintiles were not used as they displayed large discrepancies with respect to continuous income range or could not be correctly identified The construction of wealth quintiles depends on the given wealth indicator. Countries using an asset index surveyed a range of assets, dwelling characteristics, and further country-specific variables. Utilizing the standard DHS approach, we used principle component analysis to derive an asset index, from which we create unweighted wealth quintiles. Countries using an income-based measurement mainly followed the STEPS template questionnaire put forward by the WHO. In this, respondents were asked about the average earnings (taking the past year) of the household in a week, month, or year. In cases where this question was left unanswered, a pre-coded estimate of the households’ annual income was indicated. This pre-coded estimate was usually expressed as quintiles and sometimes as categories that were defined by the countries’ survey teams. Using both the pre-coded estimates as well as the continuous income, we again created unweighted wealth quintiles. In this, we assumed that national incomes follow a log-normal distribution and made use of the procedure put forward by Harttgen and Vollmer (2013) in combining income quintiles and categories. In seven cases, we dismissed pre-coded quintiles or income as they displayed very large discrepancies with respect to the continuous income range or could otherwise not be correctly identified. However, as the pre-coded estimates were typically only asked of respondents that had not indicated a continuous income, this led to only minor information losses. Reference: Harttgen, K., & Vollmer, S. (2013). Using an asset index to simulate household income. Economics Letters, 121(2), 257-262

36
Appendix 9. Characteristics of the study population, overall
Total With diabetes Without diabetes
Characteristics Unweighted N
Weighted mean (SD) or
%
Unweighted n
Weighted mean (SD) or
%
Unweighted n
Weighted mean (SD) or
% Age 685,616 42.6 36,831 50.9 648,785 41.7 Sex Male 152,086 47.2 11,136 43.3 140,950 47.6 Female 533,530 52.8 25,695 56.7 507,835 52.4 Body mass index Thin (BMI < 18.5) 91,407 6.2 1,743 2.1 896,64 6.7 Normal (BMI 18.5 - 22.9) 274,256 30.2 7,505 13.3 266,751 31.9 Upper-normal (BMI 23 - 24.9) 108,017 15.3 5,239 11.5 102,778 15.7
Overweight (BMI 25 - 29.9) 146,746 27.2 12,334 31.6 134,412 26.8 Obesity (BMI > 30) 65,190 21.0 10,010 41.4 55,180 19.0 Education None 214,478 17.9 9,155 15.7 205,323 18.1 Primary 140,532 34.5 9,542 37.5 130,990 34.2 Secondary or more 326,922 47.6 17,441 46.8 309,481 47.7 Wealth quintile Poorest 128,942 20.7 4,520 20.6 124,422 20.7 Poorer 124,474 20.0 4,888 20.2 119,586 19.9 Middle 124,428 20.4 5,575 18.7 118,853 20.6 Richer 124,692 19.4 6,941 19.9 117,751 19.4 Richest 126,530 19.5 8,202 20.7 118,328 19.4 Diabetes 685,616 9.3 36,831 100.0 648,785 0.0
Notes: Mean or % use sample weights provided by the individual surveys and re-scaled so that every country contributes equally. Sample comprises participants 25 years of age or older. Abbreviations: BMI: body mass index.
Appendix 10. Proportion of people with diabetes taking diabetes medications
Treatment categories Diagnosed diabetes 17,469 (4.1%)
Total diabetes* 36,831 (9.3%)
Taking oral glucose-lowering medications 14,810 (3.0%) 14,874 (3.0%) Taking insulin 2,129 (1.0%) 2,145 (1.0%) Overall Treated 15,365 (3.2%) 15,440 (3.3%)
Note: values correspond to unweighted n and weighted percent. *Includes the proportion of undiagnosed diabetes

37
Appendix 11. Demographic characteristics of the study population, by country
Country Education: None, %
Education: Primary,
%
Education: Secondary,
% Rural, %
Total diabetes,
%
Diagnosed diabetes,
%
Treated diabetes,
% Latin America and the Caribbean
Chile 2.6 31.0 66.4 13.1 9.7 5.6 0.8
Costa Rica 24.1 56.9 19.0 ·· 11.6 8.8 8.7 Ecuador 9.8 41.1 49.1 ·· 9.1 4.7 4.3
Guyana 1.9 53.6 44.5 ·· 20.1 10.5 9.3 Mexico 15.9 47.6 36.5 ·· 34.4 15.1 13.8
SVG 0.6 58.1 41.3 ·· 11.2 8.9 8.3 Region total 9.0 48.0 43.0 13.1 16.0 8.9 7.5
Europe and Central Asia
Azerbaijan 0.3 2.0 97.7 46.9 8.3 4.6 4.3
Belarus 0.3 19.9 79.8 45.3 5.2 3.8 3.3 Georgia 0.1 1.2 98.6 52.5 6.4 4.3 3.8
Kyrgyzstan 0.3 1.8 97.9 66.1 5.4 2.5 2.2 Moldova 0.5 0.8 98.6 58.9 7.0 3.5 2.6
Mongolia 0.8 7.1 92.1 53.0 4.7 2.4 1.6 Romania 1.0 18.5 80.5 40.6 11.3 10.3 2.1
Tajikistan 0.8 69.9 29.3 ·· 1.9 1.4 1.1 Region total 0.5 15.2 84.3 51.9 6.3 4.1 2.6
East and Southeast Asia
Bangladesh 38.8 44.7 16.5 79.1 9.6 4.8 3.8
Bhutan 60.7 26.0 13.3 71.0 2.5 0.9 0.6 Cambodia 23.1 61.3 15.6 83.0 2.4 1.3 1.0
China 13.3 31.8 54.9 69.0 8.5 2.7 2.4 India 26.5 15.0 58.5 ·· 4.9 2.3 2.2
Indonesia 6.2 38.7 55.0 49.5 8.1 1.8 1.2 Laos 20.0 53.7 26.3 69.3 5.6 3.1 2.5
Myanmar 13.4 48.8 37.8 ·· 6.4 3.0 2.5 Nepal 38.9 29.2 31.8 9.7 7.1 2.0 1.5
Timor Leste 38.4 36.9 24.7 ·· 3.0 0.4 0.3 Vietnam 4.8 27.0 68.1 65.7 3.1 1.7 1.6
Region total 25.8 37.6 36.6 62.0 5.6 2.2 1.8 Sub-Saharan Africa
Benin 53.9 26.5 19.6 48.0 6.6 0.6 0.5 Botswana 10.0 24.8 65.2 ·· 3.8 1.5 1.5
Burkina Faso 77.5 15.0 7.5 ·· 2.8 0.2 0.2 Comoros 52.7 25.2 22.0 ·· 4.2 2.5 2.1

38
Eritrea 49.9 30.7 19.5 ·· 3.6 1.9 1.9
Eswatini 9.6 18.4 72.0 ·· 6.6 3.1 2.8 Kenya 13.8 49.3 36.9 63.3 2.4 0.7 0.6
Lesotho 11.5 64.4 24.2 ·· 2.8 1.1 1.1 Liberia 25.2 20.3 54.5 ·· 13.2 0.7 0.5
Malawi 18.7 40.2 41.1 88.9 0.9 0.2 0.1 Namibia 15.0 33.7 51.3 53.4 6.1 2.6 2.4
Rwanda 22.3 65.9 11.8 ·· 1.6 0.2 0.2 Sao Tome and Principe 10.3 47.2 42.4 ·· 2.9 1.4 1.2
Seychelles ·· ·· ·· ·· 19.1 6.7 5.8 South Africa 7.6 14.8 77.6 31.0 13.2 5.8 5.2
Sudan 45.0 24.8 30.1 63.3 8.4 4.4 3.9 Tanzania 14.6 11.0 74.4 69.1 2.8 1.1 0.9
Togo 37.6 41.6 20.8 62.6 3.3 0.7 0.6 Uganda 20.5 42.2 37.3 81.7 1.7 0.5 0.4
Zambia 9.6 47.9 42.4 56.0 8.3 1.2 0.8 Zanzibar 19.6 15.1 65.2 53.6 3.5 1.3 0.7
Region total 26.4 33.1 40.6 61.0 5.6 1.8 1.6
Middle East and North Africa
Algeria 15.3 42.1 42.6 34.2 11.5 7.3 6.8 Iran 17.2 29.2 53.6 29.8 11.3 8.2 5.7
Iraq 20.5 48.1 31.3 24.6 18.9 16.4 14.9 Lebanon 5.1 44.7 50.2 ·· 12.7 6.4 6.4
Morocco 47.5 22.7 29.8 35.8 13.7 7.3 6.4 Region total 21.9 37.0 41.0 31.1 13.6 8.6 7.5
Oceania Fiji 12.6 44.8 42.6 55.3 42.8 14.1 10.6
Kiribati 6.9 43.0 50.0 ·· 20.9 7.8 5.2 Marshall Islands 0.9 7.0 92.1 ·· 31.2 11.8 7.4
Samoa 1.2 24.0 74.8 ·· 24.6 3.9 2.7 Solomon Islands 8.6 59.6 31.8 ·· 5.4 0.7 0.4
Tuvalu 0.5 46.2 53.4 ·· 11.9 6.9 4.7 Vanuatu 8.6 70.7 20.6 ·· 9.7 1.8 1.4
Region total 5.6 42.2 52.3 55.3 20.9 6.7 4.6
World (all data) 17.9 34.5 47.7 53.9 9.3 4.1 3.2

39
Appendix 12. Missing variables in the study sample and among those with missing diabetes biomarker
Main Sample (N=685,616)
Missing diabetes (N=99,602)
Characteristics Weighted mean (SD) or %
Weighted mean (SD) or %
Age 42.6 (12.6) 42.5 (12.5) Sex Male 47.2 43.7 Female 52.8 56.3 Body mass index Thin (BMI < 18.5) 6.2 6.4 Normal (BMI 18.5 - 22.9) 30.2 30.4 Upper-normal (BMI 23 - 24.9) 15.3 15.9
Overweight (BMI 25 - 29.9) 27.2 27.4 Obesity (BMI > 30) 21.0 20.0 Education None 17.9 18.7 Primary 34.5 32.7 Secondary or more 47.6 48.6 Wealth quintile Poorest 20.7 20.3 Poorer 20.0 19.6 Middle 20.4 19.2 Richer 19.4 19.4 Richest 19.5 21.5

40
Appendix 13. Prevalence of diabetes, overweight, and obesity, by geographic region
Diabetes (%) Overweight (%) Obesity (%)
Women Global 10.0 26.9 26.5
World Region LA & C 18.6 33.6 39.4
E & CA 6.4 32.4 32.5 ESA & O 5.8 23.4 6.7
SSA 5.6 23.1 20.0 ME & NA 13.8 34.8 36.0
OCN 23.6 27.1 52.3 Men
Global 8.5 27.5 15.0 World Region
LA & C 12.8 40.5 20.3 E & CA 6.1 39.6 22.9
ESA & O 5.3 18.1 3.3 SSA 5.6 18.6 7.3
ME & NA 13.5 38.4 22.4 OCN 18.0 35.3 36.5
Note: Prevalence estimates were calculated using re-scaled sampling weights.

41
Appendix 14. Multivariable regression models of categorical BMI and diabetes, by sex and geographic region
Women Men BMI category RR 95% CI RR 95% CI Global
Upper-normal 1.41 1.28 - 1.55 1.43 1.30 - 1.56 Overweight 1.75 1.63 - 1.89 1.88 1.72 - 2.06 Obesity 2.30 2.12 - 2.49 2.65 2.37 - 2.96 Latin America and the Caribbean
Upper-normal 1.39 1.05 - 1.83 0.94 0.69 - 1.29 Overweight 1.33 1.07 - 1.65 1.75 1.36 - 2.26 Obesity 1.88 1.52 - 2.32 2.58 2.00 - 3.33 Europe and Central Asia
Upper-normal 1.14 0.79 - 1.64 1.04 0.73 - 1.48 Overweight 1.61 1.25 - 2.08 1.38 0.99 - 1.91 Obesity 2.59 1.96 - 3.43 2.62 1.82 - 3.76 East and Southeast Asia
Upper-normal 1.53 1.33 - 1.76 1.90 1.62 - 2.23 Overweight 2.18 1.94 - 2.45 2.84 2.44 - 3.30
Obesity 3.18 2.77 - 3.64 3.93 3.18 - 4.86 Sub-Saharan Africa
Upper-normal 1.24 1.04 - 1.46 1.43 1.22 - 1.68 Overweight 1.65 1.46 - 1.88 2.10 1.82 - 2.42 Obesity 2.49 2.17 - 2.86 3.46 2.98 - 4.02 Middle East and North Africa
Upper-normal 1.44 1.10 - 1.88 1.77 1.43 - 2.20 Overweight 1.70 1.37 - 2.12 1.80 1.47 - 2.20 Obesity 2.21 1.79 - 2.73 2.20 1.77 - 2.73 Oceania
Upper-normal 1.40 1.06 - 1.84 1.12 0.87 - 1.45 Overweight 1.71 1.35 - 2.16 1.23 1.02 - 1.47
Obesity 1.69 1.35 - 2.10 1.56 1.31 - 1.86

42
Appendix 15. Country-sex stratified risk ratios of BMI and diabetes
Notes: Figure shows adjusted risk ratios from multivariable Poisson regression models by country, separately for women (red) and men (blue). The outcome was diabetes based on measured biomarkers and the exposure measured body-mass index (BMI) in kg/m2. The risk ratio reflects the change in diabetes risk with every kg/m2 gain in BMI. All models controlled for age (years) and included country-level fixed effects. Error bars represent 95% confidence intervals. Abbreviations: SVG: Saint Vincent and the Grenadines; STP: Sao Tome and Principe.

43
Appendix 16. Country-sex stratified risk ratios of BMI and fasting blood glucose
Notes: Figure shows adjusted risk ratios from multivariable Poisson regression models by country, separately for women (red) and men (blue). The outcome was fasting blood glucose and the exposure measured body-mass index (BMI) in kg/m2. All models controlled for age (years) and included country-level fixed effects. Error bars represent 95% confidence intervals. Abbreviations: SVG: Saint Vincent and the Grenadines; STP: Sao Tome and Principe.

44
Appendix 17. Geographic region-sex-age stratified generalized additive models of BMI and diabetes
Notes: Figure shows generalized additive models of body mass index and proportion with diabetes for women (upper panel) and men (lower panel). All analyses stratified by world regions and ten-year age groups. Grey areas represent 95% confidence intervals.

45
Appendix 18. Global- and geographic region-sex stratified risk ratios of BMI and diabetes
Notes: Figure shows adjusted risk ratios from multivariable Poisson regression models in the pooled sample and by world region, separately for women (red) and men (blue). The outcome was diabetes based on measured biomarkers and the exposure measured body-mass index (BMI) in kg/m2. The risk ratio reflects the change in diabetes risk with every kg/m2 gain in BMI. All models controlled for age (years) and included country-level fixed effects. Error bars represent 95% confidence intervals. All estimates yielded p-values below 0. Geographic region abbreviations: Latin America and the Caribbean (LA & CA), Europe and Central Asia (E & CA), East/Southeast Asia (ESA), Sub-Saharan Africa (SSA), Middle East and North Africa (ME & NA), Oceania (OCN).

46
Appendix 19. Global- and geographic region-sex stratified risk ratios of BMI and fasting blood glucose
Notes: Figure shows adjusted risk ratios from multivariable Poisson regression models in the pooled sample and by world region, separately for women (red) and men (blue). The outcome was fasting blood glucose and the exposure measured body-mass index (BMI) in kg/m2. All models controlled for age (years) and included country-level fixed effects. Error bars represent 95% confidence intervals. All estimates yielded p-values below 0.01. Each country was weighted equally. Geographic region abbreviations: Latin America and the Caribbean (LA & CA), Europe and Central Asia (E & CA), East/Southeast Asia (ESA), Sub-Saharan Africa (SSA), Middle East and North Africa (ME & NA), Oceania (OCN).

47
Appendix 20. Risk ratios of BMI and diabetes (multiple imputation)
Notes: Figure shows adjusted risk ratios from multivariable Poisson regression models in the pooled sample and by world region, separately for women (red) and men (blue), using multiple imputation for missing data on age, sex, and BMI (n=7412). The outcome was diabetes based on measured biomarkers and the exposure measured body-mass index (BMI) in kg/m2. All models included country-level fixed effects. Error bars represent 95% confidence intervals. All estimates yielded p-values below 0.01. Each country was weighted equally. Geographic region abbreviations: Latin America and the Caribbean (LA & CA), Europe and Central Asia (E & CA), East/Southeast Asia (ESA), Sub-Saharan Africa (SSA), Middle East and North Africa (ME & NA), Oceania (OCN).

48
Appendix 21. Risk ratios of BMI and diabetes (univariate analysis)
Notes: Figure shows adjusted risk ratios from multivariable Poisson regression models in the pooled sample and by world region, separately for women (red) and men (blue). The outcome was diabetes based on measured biomarkers and the exposure measured body-mass index (BMI) in kg/m2. All models included country-level fixed effects. Error bars represent 95% confidence intervals. All estimates yielded p-values below 0.01. Each country was weighted equally. Geographic region abbreviations: Latin America and the Caribbean (LA & CA), Europe and Central Asia (E & CA), East/Southeast Asia (ESA), Sub-Saharan Africa (SSA), Middle East and North Africa (ME & NA), Oceania (OCN).
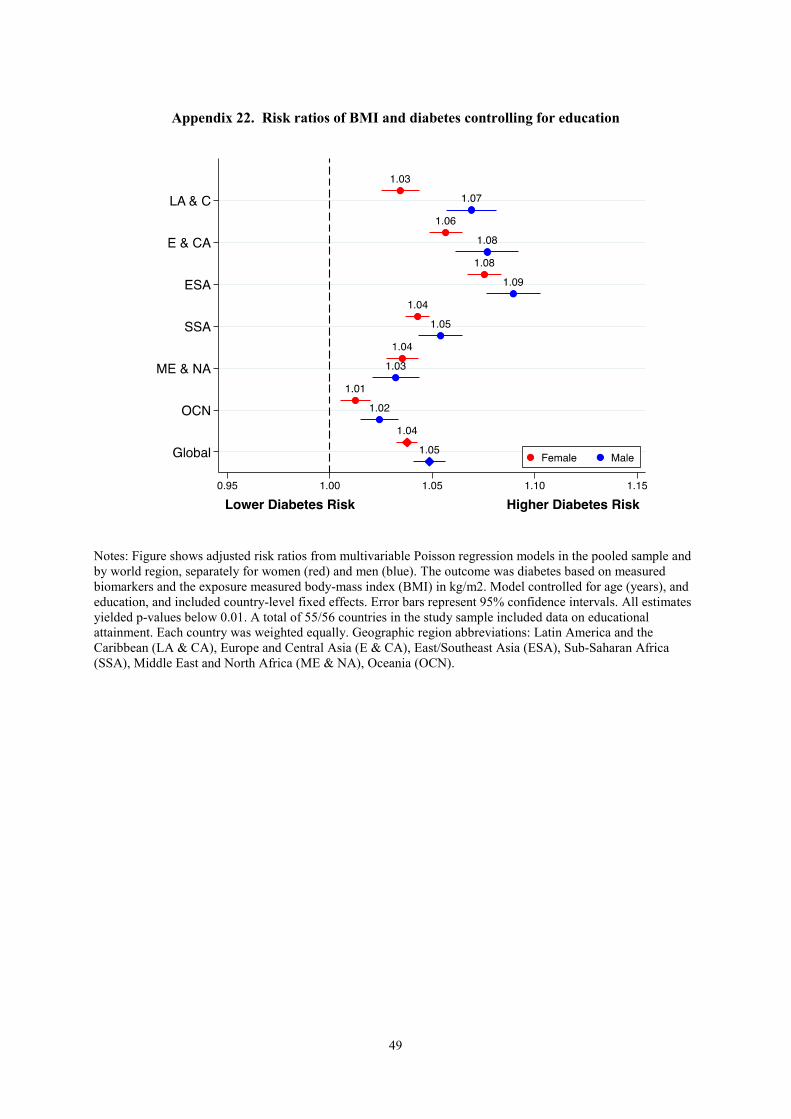
49
Appendix 22. Risk ratios of BMI and diabetes controlling for education
Notes: Figure shows adjusted risk ratios from multivariable Poisson regression models in the pooled sample and by world region, separately for women (red) and men (blue). The outcome was diabetes based on measured biomarkers and the exposure measured body-mass index (BMI) in kg/m2. Model controlled for age (years), and education, and included country-level fixed effects. Error bars represent 95% confidence intervals. All estimates yielded p-values below 0.01. A total of 55/56 countries in the study sample included data on educational attainment. Each country was weighted equally. Geographic region abbreviations: Latin America and the Caribbean (LA & CA), Europe and Central Asia (E & CA), East/Southeast Asia (ESA), Sub-Saharan Africa (SSA), Middle East and North Africa (ME & NA), Oceania (OCN).

50
Appendix 23. Risk ratios of BMI and diabetes controlling for wealth
Notes: Figure shows adjusted risk ratios from multivariable Poisson regression models in the pooled sample and by world region, separately for women (red) and men (blue). The outcome was diabetes based on measured biomarkers and the exposure measured body-mass index (BMI) in kg/m2. Model controlled for age and wealth quintile and included country-level fixed effects. Error bars represent 95% confidence intervals. All estimates yielded p-values below 0.01. A total of 48/56 countries included data on household wealth. Each country was weighted equally. Geographic region abbreviations: Latin America and the Caribbean (LA & CA), Europe and Central Asia (E & CA), East/Southeast Asia (ESA), Sub-Saharan Africa (SSA), Middle East and North Africa (ME & NA), Oceania (OCN).

51
Appendix 24. Risk ratios of BMI and diabetes including self-reported diabetes
Notes: Figure shows adjusted risk ratios from multivariable Poisson regression models in the pooled sample and by world region, separately for women (red) and men (blue). The outcome was diabetes based on measured biomarkers or self-report (N=4209; 0.6% of the overall sample) and the exposure measured body-mass index (BMI) in kg/m2. All models controlled for age (years) and included country-level fixed effects. Error bars represent 95% confidence intervals. All estimates yielded p-values below 0.01. Each country was weighted equally. Geographic region abbreviations: Latin America and the Caribbean (LA & CA), Europe and Central Asia (E & CA), East/Southeast Asia (ESA), Sub-Saharan Africa (SSA), Middle East and North Africa (ME & NA), Oceania (OCN).

52
Appendix 25. Risk ratios of BMI and diabetes including age polynomials
Notes: Figure shows adjusted risk ratios from multivariable Poisson regression models in the pooled sample and by world region, separately for women (red) and men (blue). The outcome was diabetes based on measured biomarkers and the exposure measured body-mass index (BMI) in kg/m2. All models controlled for age, age squared, and age cubic, and included country-level fixed effects. Error bars represent 95% confidence intervals. All estimates yielded p-values below 0.01. Each country was weighted equally. Geographic region abbreviations: Latin America and the Caribbean (LA & CA), Europe and Central Asia (E & CA), East/Southeast Asia (ESA), Sub-Saharan Africa (SSA), Middle East and North Africa (ME & NA), Oceania (OCN).

53
Appendix 26. Logistic regression of BMI and diabetes
Notes: Figure shows adjusted odds ratios from multivariable logistic regression models in the pooled sample and by world region, separately for women (red) and men (blue). The outcome was diabetes based on measured biomarkers and the exposure measured body-mass index (BMI) in kg/m2. All models controlled for age (years) and included country-level fixed effects. Error bars represent 95% confidence intervals. All estimates yielded p-values below 0.01. Each country was weighted equally. Geographic region abbreviations: Latin America and the Caribbean (LA & CA), Europe and Central Asia (E & CA), East/Southeast Asia (ESA), Sub-Saharan Africa (SSA), Middle East and North Africa (ME & NA), Oceania (OCN).

54
Appendix 27. Risk ratios of BMI and diabetes using alternative weights
Notes: Figure shows adjusted risk ratios from multivariable Poisson regression models in the pooled sample and by world region, separately for women (red) and men (blue). The outcome was diabetes based on measured biomarkers and the exposure measured body-mass index (BMI) in kg/m2. All models controlled for age (years) and included country-level fixed effects. Sample weights proportional to population size of each country were used. Error bars represent 95% confidence intervals. All estimates yielded p-values below 0.01. Each country was weighted equally. Geographic region abbreviations: Latin America and the Caribbean (LA & CA), Europe and Central Asia (E & CA), East/Southeast Asia (ESA), Sub-Saharan Africa (SSA), Middle East and North Africa (ME & NA), Oceania (OCN).

55
Appendix 28. Risk ratios of BMI and diabetes, stratified by survey year
Notes: Figure shows adjusted risk ratios from multivariable Poisson regression models in the pooled sample and by world region, separately for women (red) and men (blue). Regression analyses were stratified by time periods in which the surveys were conducted: 2009-2014 (left panel) and 2015-2019 (right panel). The outcome was diabetes based on measured biomarkers and the exposure measured body-mass index (BMI) in kg/m2. All models controlled for age (years) and included country-level fixed effects. Missing values for BMI, age and sex were calculated using multiple imputation. Error bars represent 95% confidence intervals. All estimates yielded p-values below 0.01. Geographic region abbreviations: Latin America and the Caribbean (LA & CA), Europe and Central Asia (E & CA), East/Southeast Asia (ESA), Sub-Saharan Africa (SSA), Middle East and North Africa (ME & NA), Oceania (OCN).

56
Appendix 29. Risk ratios of BMI and diabetes, assuming that all countries had a plasma glucose equivalent
Notes: Figure shows adjusted risk ratios from multivariable Poisson regression models in the pooled sample and by world region, separately for women (red) and men (blue).). The outcome was diabetes based on measured biomarkers (assuming all point-of-care glucose devices had a plasma equivalent) and the exposure measured body-mass index (BMI) in kg/m2. All models controlled for age (years) and included country-level fixed effects. Missing values for BMI, age and sex were calculated using multiple imputation. Error bars represent 95% confidence intervals. All estimates yielded p-values below 0.01. Geographic region abbreviations: Latin America and the Caribbean (LA & CA), Europe and Central Asia (E & CA), East/Southeast Asia (ESA), Sub-Saharan Africa (SSA), Middle East and North Africa (ME & NA), Oceania (OCN).

57
Appendix 30. Risk ratios BMI and diabetes among individuals with diabetes not on pharmacologic treatment
Notes: Figure shows adjusted risk ratios from multivariable Poisson regression models in the pooled sample and by world region, separately for women (red) and men (blue).). The outcome was diabetes based on measured biomarkers and the exposure measured body-mass index (BMI) in kg/m2. All models controlled for age (years) and included country-level fixed effects. Missing values for BMI, age and sex were calculated using multiple imputation. Error bars represent 95% confidence intervals. All estimates yielded p-values below 0.01. Geographic region abbreviations: Latin America and the Caribbean (LA & CA), Europe and Central Asia (E & CA), East/Southeast Asia (ESA), Sub-Saharan Africa (SSA), Middle East and North Africa (ME & NA), Oceania (OCN).

58
Appendix 31. Risk ratios BMI and diabetes, defined according to HbA1c and fasting plasma glucose
Notes: Figure shows adjusted risk ratios from multivariable Poisson regression models in the pooled sample and by world region, separately for women (red) and men (blue).). The outcome was diabetes based on measured biomarkers (> 7.0mmol/L in the presence of HbA1c <6.5% (n=450)) and the exposure measured body-mass index (BMI) in kg/m2. All models controlled for age (years) and included country-level fixed effects. Missing values for BMI, age and sex were calculated using multiple imputation. Error bars represent 95% confidence intervals. All estimates yielded p-values below 0.01. Geographic region abbreviations: Latin America and the Caribbean (LA & CA), Europe and Central Asia (E & CA), East/Southeast Asia (ESA), Sub-Saharan Africa (SSA), Middle East and North Africa (ME & NA), Oceania (OCN).

59
Appendix 32. Univariate analysis of body mass index categories and diabetes
Notes: Figure shows adjusted risk ratios from multivariable Poisson regression models in the pooled sample and by world region, separately for women (left panel) and men (right panel). The outcome was diabetes based on measured biomarkers and the exposure measured body-mass index (BMI) grouped into five categories: underweight (<18.5 kg/m2; not displayed), normal (18.5 to <23 kg/m2; reference category), upper-normal (23 to <25 kg/m2), overweight (25 to <30 kg/m2), and obese (>30 kg/m2). All models included country-level fixed effects. Error bars represent 95% confidence interval. Each country was weighted equally. Geographic region abbreviations: Latin America and the Caribbean (LA & CA), Europe and Central Asia (E & CA), East/Southeast Asia (ESA), Sub-Saharan Africa (SSA), Middle East and North Africa (ME & NA), Oceania (OCN).

60
Appendix 33. Risk ratios of body mass index categories and diabetes controlling for education
Notes: Figure shows adjusted risk ratios from multivariable Poisson regression models in the pooled sample and by world region, separately for women (left panel) and men (right panel). The outcome was diabetes based on measured biomarkers and the exposure measured body-mass index (BMI) grouped into five categories: underweight (<18.5 kg/m2; not displayed), normal (18.5 to <23 kg/m2; reference category), upper-normal (23 to <25 kg/m2), overweight (25 to <30 kg/m2), and obese (>30 kg/m2). All models controlled for age (years) and educational attainment (no formal schooling; completed primary school; secondary school or above) and included country-level fixed effects. Error bars represent 95% confidence intervals. A total of 55/56 countries in the study sample included data on educational attainment. Each country was weighted equally. Geographic region abbreviations: Latin America and the Caribbean (LA & CA), Europe and Central Asia (E & CA), East/Southeast Asia (ESA), Sub-Saharan Africa (SSA), Middle East and North Africa (ME & NA), Oceania (OCN).

61
Appendix 34. Risk ratios of body mass index categories and diabetes controlling for wealth
Notes: Figure shows adjusted risk ratios from multivariable Poisson regression models in the pooled sample and by world region, separately for women (left panel) and men (right panel). The outcome was diabetes based on measured biomarkers and the exposure measured body-mass index (BMI) grouped into five categories: underweight (<18.5 kg/m2; not displayed), normal (18.5 to <23 kg/m2; reference category), upper-normal (23 to <25 kg/m2), overweight (25 to <30 kg/m2), and obese (>30 kg/m2). All models controlled for age (years) and wealth quintiles (asset-based index) and included country-level fixed effects. Error bars represent 95% confidence intervals. A total of 48/56 countries included data on household wealth. Each country was weighted equally. Geographic region abbreviations: Latin America and the Caribbean (LA & CA), Europe and Central Asia (E & CA), East/Southeast Asia (ESA), Sub-Saharan Africa (SSA), Middle East and North Africa (ME & NA), Oceania (OCN).

62
Appendix 35. Risk ratios of body mass index categories and diabetes including self-reported diabetes
Notes: Figure shows adjusted risk ratios from multivariable Poisson regression models in the pooled sample and by world region, separately for women (left panel) and men (right panel). The outcome was diabetes based on measured biomarkers or self-report (N=4209; 0.6% of the overall sample) and the exposure measured body-mass index (BMI) grouped into five categories: underweight (<18.5 kg/m2; not displayed), normal (18.5 to <23 kg/m2; reference category), upper-normal (23 to <25 kg/m2), overweight (25 to <30 kg/m2), and obese (>30 kg/m2). All models controlled for age (years) and included country-level fixed effects. Error bars represent 95% confidence intervals. Each country was weighted equally. Geographic region abbreviations: Latin America and the Caribbean (LA & CA), Europe and Central Asia (E & CA), East/Southeast Asia (ESA), Sub-Saharan Africa (SSA), Middle East and North Africa (ME & NA), Oceania (OCN).

63
Appendix 36. Risk ratios of body mass index categories and diabetes including age polynomials
Notes: Figure shows adjusted risk ratios from multivariable Poisson regression models in the pooled sample and by world region, separately for women (left panel) and men (right panel). The outcome was diabetes based on measured biomarkers and the exposure measured body-mass index (BMI) grouped into five categories: underweight (<18.5 kg/m2; not displayed), normal (18.5 to <23 kg/m2; reference category), upper-normal (23 to <25 kg/m2), overweight (25 to <30 kg/m2), and obese (>30 kg/m2). All models controlled for age, age squared, and age cubic, and included country-level fixed effects. Error bars represent 95% confidence intervals. Each country was weighted equally. Geographic region abbreviations: Latin America and the Caribbean (LA & CA), Europe and Central Asia (E & CA), East/Southeast Asia (ESA), Sub-Saharan Africa (SSA), Middle East and North Africa (ME & NA), Oceania (OCN).

64
Appendix 37. Risk ratios of body mass index categories and diabetes using alternative weights
Notes: Figure shows adjusted risk ratios from multivariable Poisson regression models in the pooled sample and by world region, separately for women (left panel) and men (right panel). The outcome was diabetes based on measured biomarkers and the exposure measured body-mass index (BMI) grouped into five categories: underweight (<18.5 kg/m2; not displayed), normal (18.5 to <23 kg/m2; reference category), upper-normal (23 to <25 kg/m2), overweight (25 to <30 kg/m2), and obese (>30 kg/m2). All models controlled for age (years) and included country-level fixed effects. Sample weights proportional to population size of each country were used. Error bars represent 95% confidence intervals. Each country was weighted equally. Geographic region abbreviations: Latin America and the Caribbean (LA & CA), Europe and Central Asia (E & CA), East/Southeast Asia (ESA), Sub-Saharan Africa (SSA), Middle East and North Africa (ME & NA), Oceania (OCN).
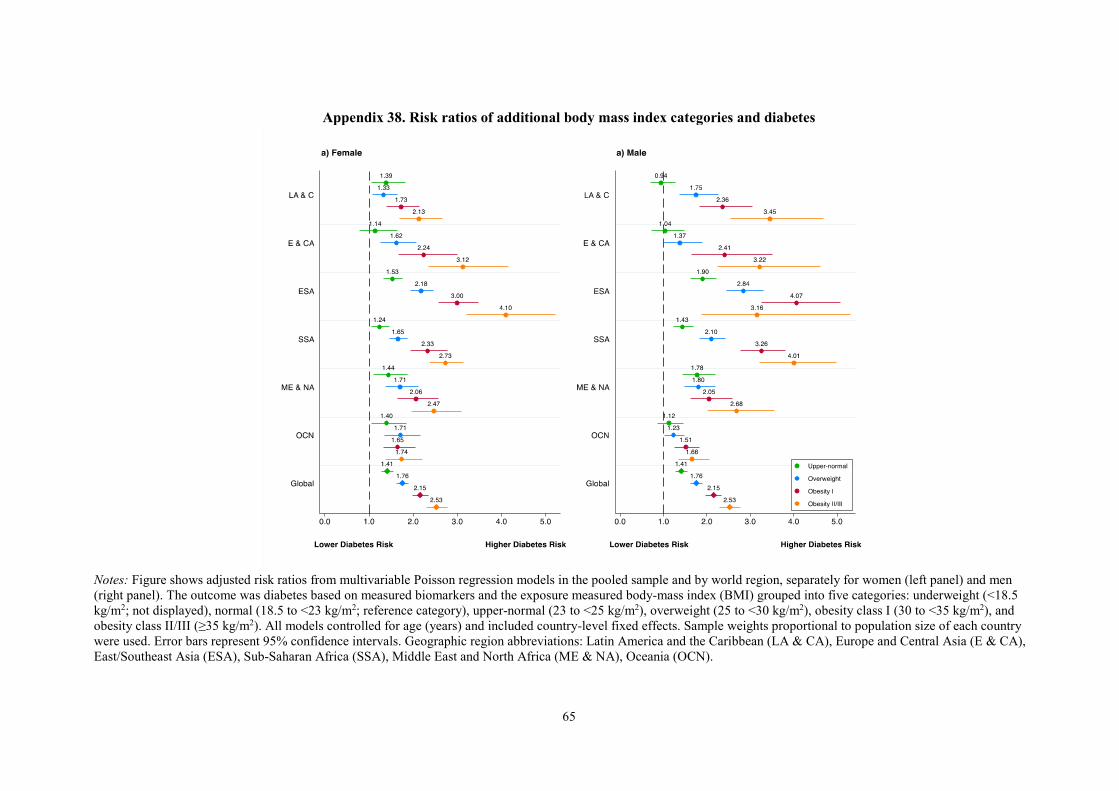
65
Appendix 38. Risk ratios of additional body mass index categories and diabetes
Notes: Figure shows adjusted risk ratios from multivariable Poisson regression models in the pooled sample and by world region, separately for women (left panel) and men (right panel). The outcome was diabetes based on measured biomarkers and the exposure measured body-mass index (BMI) grouped into five categories: underweight (<18.5 kg/m2; not displayed), normal (18.5 to <23 kg/m2; reference category), upper-normal (23 to <25 kg/m2), overweight (25 to <30 kg/m2), obesity class I (30 to <35 kg/m2), and obesity class II/III (≥35 kg/m2). All models controlled for age (years) and included country-level fixed effects. Sample weights proportional to population size of each country were used. Error bars represent 95% confidence intervals. Geographic region abbreviations: Latin America and the Caribbean (LA & CA), Europe and Central Asia (E & CA), East/Southeast Asia (ESA), Sub-Saharan Africa (SSA), Middle East and North Africa (ME & NA), Oceania (OCN).

66
Appendix 39. Risk ratios of body mass index categories and diabetes risk, assuming that all countries had a plasma glucose equivalent
Notes: Figure shows adjusted risk ratios from multivariable Poisson regression models in the pooled sample and by world region, separately for women (left panel) and men (right panel). The outcome was diabetes based on measured biomarkers (assuming that all point-of-care glucose measuring devices had a plasma equivalence) and the exposure measured body-mass index (BMI) grouped into five categories: underweight (<18.5 kg/m2; not displayed), normal (18.5 to <23 kg/m2; reference category), upper-normal (23 to <25 kg/m2), overweight (25 to <30 kg/m2), and obese (>30 kg/m2). All models controlled for age (years) and included country-level fixed effects. Sample weights proportional to population size of each country were used. Error bars represent 95% confidence intervals. Each country was weighted equally. Geographic region abbreviations: Latin America and the Caribbean (LA & CA), Europe and Central Asia (E & CA), East/Southeast Asia (ESA), Sub-Saharan Africa (SSA), Middle East and North Africa (ME & NA), Oceania (OCN).

67
Appendix 40. Risk ratios of body mass index categories and diabetes risk among individuals with diabetes who were not on pharmacologic treatment
Notes: Figure shows adjusted risk ratios from multivariable Poisson regression models in the pooled sample and by world region, separately for women (left panel) and men (right panel). The outcome was diabetes based on measured biomarkers among individuals with diabetes who were not on pharmacologic treatment and the exposure measured body-mass index (BMI) grouped into five categories: underweight (<18.5 kg/m2; not displayed), normal (18.5 to <23 kg/m2; reference category), upper-normal (23 to <25 kg/m2), overweight (25 to <30 kg/m2), and obese (>30 kg/m2). All models controlled for age (years) and included country-level fixed effects. Sample weights proportional to population size of each country were used. Error bars represent 95% confidence intervals. Each country was weighted equally. Geographic region abbreviations: Latin America and the Caribbean (LA & CA), Europe and Central Asia (E & CA), East/Southeast Asia (ESA), Sub-Saharan Africa (SSA), Middle East and North Africa (ME & NA), Oceania (OCN).

68
Appendix 41. Risk ratios of body mass index categories and diabetes risk based on HbA1c and fasting plasma glucose
Notes: Figure shows adjusted risk ratios from multivariable Poisson regression models in the pooled sample and by world region, separately for women (left panel) and men (right panel). The outcome was diabetes based on measured biomarkers (> 7.0mmol/L in the presence of HbA1c <6.5% (n=450)) and the exposure measured body-mass index (BMI) grouped into five categories: underweight (<18.5 kg/m2; not displayed), normal (18.5 to <23 kg/m2; reference category), upper-normal (23 to <25 kg/m2), overweight (25 to <30 kg/m2), and obese (>30 kg/m2). All models controlled for age (years) and included country-level fixed effects. Sample weights proportional to population size of each country were used. Error bars represent 95% confidence intervals. Each country was weighted equally. Geographic region abbreviations: Latin America and the Caribbean (LA & CA), Europe and Central Asia (E & CA), East/Southeast Asia (ESA), Sub-Saharan Africa (SSA), Middle East and North Africa (ME & NA), Oceania (OCN).

69
Appendix 42. Country-sex stratified risk ratios of body mass index and HbA1c / RBG
Notes: Figure shows adjusted risk ratios from multivariable Poisson regression models by country, separately for women (red) and men (blue). The outcome was random blood glucose (RBG) or HbA1c, respectively, and the exposure measured body-mass index (BMI) in kg/m2. All models controlled for age (years) and included country-level fixed effects. Error bars represent 95% confidence intervals. All estimates yielded p-values below 0.01. Abbreviations: RBG: random blood glucose.
70
Appendix 43: Country-specific contact information regarding accessing data used in this study Data included in this study are publicly available for 51 of the 58 surveys. The links to where data can be downloaded (upon free registration) are: Chile: https://www.minsal.cl/estudios_encuestas_salud/ China: https://www.cpc.unc.edu/projects/china/data/datasets India: https://dhsprogram.com/data/dataset/India_Standard-DHS_2015.cfm?flag=0 Indonesia: https://www.rand.org/labor/FLS/IFLS/access.html Mexico: http://www.ennvih-mxfls.org/english/index.html Namibia: https://dhsprogram.com/data/dataset/Namibia_Standard-DHS_2013.cfm?flag=0 The country surveys included in this analysis that are publically available through the STEPS Microdata repository (https://extranet.who.int/ncdsmicrodata/index.php/catalog/STEPS) are: Algeria 2016-2017, Azerbaijan 2017, Bangladesh 2018, Belarus 2015, Benin 2014, Bhutan 2014, Botswana 2010, Cambodia 2010, Comoros 2011, Ecuador 2018 Eritrea 2014, Eswatini 2014, Georgia 2016, Guyana 2016, Iraq 2015, Kenya 2015, Kiribati 2015-2016, Kyrgyzstan 2013, Lao People’s Democratic Republic 2013, Lebanon 2017, Lesotho 2012, Liberia 2011, Malawi 2017, Moldova 2013, Mongolia 2009, Morocco 2017, Marshall Islands 2017, Myanmar 2014, Nepal 2019, Rwanda 2012, Samoa 2013, Sao Tome 2009, Seychelles 2013, Solomon Islands 2015, Sudan 2016, Tajikistan 2016-2017, Tanzania 2012, Timor-Leste 2014, Togo 2010-2011, Tuvalu 2015, Uganda 2014, Vanuatu 2011, Vietnam 2015, Zambia 2017, Zanzibar 2011. For the remaining countries, including Burkina Faso, Costa Rica, Fiji, Iran, Romania, South Africa, St. Vincent & the Grenadines, please contact Sue Gilbert at [email protected] * For the member countries of the Caribbean Public Health Agency (CARPHA) - Guyana and St. Vincent and the Grenadines - data were shared through a Data Use Agreement signed with the Executive Director of CARPHA. The Senior Technical Officer for NCDs (Dr. Glennis Andall-Brereton), listed.

71
Appendix 44: STROBE checklist
Item No Recommendation
Title and abstract 1 (a) Indicate the study’s design with a commonly used term in the title or the abstract The title includes this information. (b) Provide in the abstract an informative and balanced summary of what was done and what was found This information is included in the Abstract.
Introduction Background/rationale 2 Explain the scientific background and rationale for the investigation being
reported This information is provided throughout the Introduction.
Objectives 3 State specific objectives, including any prespecified hypotheses This information is provided in the final paragraph of the Introduction.
Methods Study design 4 Present key elements of study design early in the paper
This information is provided in the Methods, in the subsection on Data Sources.
Setting 5 Describe the setting, locations, and relevant dates, including periods of recruitment, exposure, follow-up, and data collection This information is provided in the Methods, in the subsection on Data Sources.
Participants 6 (a) Give the eligibility criteria, and the sources and methods of selection of participants. Describe methods of follow-up This information is provided in the Methods, in the subsection on Data Sources. (b) For matched studies, give matching criteria and number of exposed and unexposed N/A
Variables 7 Clearly define all outcomes, exposures, predictors, potential confounders, and effect modifiers. Give diagnostic criteria, if applicable This information is provided in the Methods, subsections on Diabetes Biomarkers, Definitions of diabetes and body mass index, and Covariates
Data sources/ measurement
8* For each variable of interest, give sources of data and details of methods of assessment (measurement). Describe comparability of assessment methods if there is more than one group This information is provided in the Methods, under the subsections on Data Sources, Diabetes Biomarkers, Definitions of Diabetes and Body Mass Index, and Covariates
Bias 9 Describe any efforts to address potential sources of bias This information is provided in the Methods section, under the subsection on Statistical Analyses.
Study size 10 Explain how the study size was arrived at

72
This information is provided in the Methods, under the subsection on Data Sources.
Quantitative variables 11 Explain how quantitative variables were handled in the analyses. If applicable, describe which groupings were chosen and why This information is provided in the Methods, under the subsections on Data Sources, Diabetes Biomarkers, Definitions of Diabetes and Body Mass Index, and Covariates
Statistical methods 12 (a) Describe all statistical methods, including those used to control for confounding This information is provided in the Methods section, under the subsection on Statistical Analyses. (b) Describe any methods used to examine subgroups and interactions This information is provided in the Methods section, under the subsection on Statistical Analyses. (c) Explain how missing data were addressed This information is provided in the Methods section, under the subsection Study Population (d) If applicable, explain how loss to follow-up was addressed N/A (e) Describe any sensitivity analyses This information is provided in the Methods, under the subsection on Diabetes Biomarkers, Definitions of Diabetes and Body Mass Index, Statistical Analysis, and Sensitivity Analyses
Results Participants 13* (a) Report numbers of individuals at each stage of study—eg numbers
potentially eligible, examined for eligibility, confirmed eligible, included in the study, completing follow-up, and analysed A flow diagram is included in the Appendix. (b) Give reasons for non-participation at each stage A flow diagram is included in the Appendix. (c) Consider use of a flow diagram A flow diagram is included in the Appendix.
Descriptive data 14* (a) Give characteristics of study participants (eg demographic, clinical, social) and information on exposures and potential confounders This information is provided in the Results Section and in the Appendix (b) Indicate number of participants with missing data for each variable of interest This information is provided in Appendix 3. (c) Summarise follow-up time (eg, average and total amount) N/A
Outcome data 15* Report numbers of outcome events or summary measures over time This information is provided in the Results Section
Main results 16 (a) Give unadjusted estimates and, if applicable, confounder-adjusted estimates and their precision (eg, 95% confidence interval). Make clear which confounders were adjusted for and why they were included

73
This information is provided in the Results Section and in the Appendix (b) Report category boundaries when continuous variables were categorized These are reported in Figure 3 and in Appendix 3 and 12 (c) If relevant, consider translating estimates of relative risk into absolute risk for a meaningful time period N/A
Other analyses 17 Report other analyses done—eg analyses of subgroups and interactions, and sensitivity analyses These results are reported in the Appendix.
Discussion Key results 18 Summarise key results with reference to study objectives
This information is provided in the Discussion. Limitations 19 Discuss limitations of the study, taking into account sources of potential
bias or imprecision. Discuss both direction and magnitude of any potential bias This information is provided in the Discussion.
Interpretation 20 Give a cautious overall interpretation of results considering objectives, limitations, multiplicity of analyses, results from similar studies, and other relevant evidence This information is provided in the Discussion.
Generalisability 21 Discuss the generalisability (external validity) of the study results This information is provided in the Discussion.
Other information Funding 22 Give the source of funding and the role of the funders for the present study
and, if applicable, for the original study on which the present article is based We have provided this information in the section titled “Funding”.
*Give information separately for exposed and unexposed groups.