university of bradford ethesis - connecting repositories · 2017-12-14 · 6.1 the house types and...
TRANSCRIPT

University of Bradford eThesis This thesis is hosted in Bradford Scholars – The University of Bradford Open Access repository. Visit the repository for full metadata or to contact the repository team
© University of Bradford. This work is licenced for reuse under a Creative Commons
Licence.

ENERGY USE IN BUILDINGS AND DESIGN REQUIREMENTS
The energy costs and financial costs of building
materials7 structures and space heating2 the
detailed patterns of use of heating systems in
dwellings, and their interactions: their
implications for design
Robert Verdon SANSATA
Doctor of Philosophy
University of Bradford, Postgraduate School of
Studies in Science and Society
1981

ENERGY USE IF BUILDIVGS AVD DRSIGN REQUIRMMIMTS R. V. Sansam
Sub-titles The energy Costs and financial costs of building materiaTs-, structures and space heatingg the detailed patterns of use of heating systems in dwellings, and their interactionst their implications for design.
Abstract
The primary energy costs of building materials and structures are discussed and comparisons are made between typical dwelling types.
The economics of alternative wall, roof and floor constructions, providing various levels of insulationy are examined. Costs are assessed for a number of periods from 1970 to early 1980 for heating by gas and night rate electricity. The effect ofýprice changes-on the economic attractiveness of insulation is investigated and the likely effects of future price rises are considered. It is concluded that, in certain circumstances, higher levels of insulation than those normally used in the UK have been economically attractive for the last few years and may possibly become more so.
A survey of over fifty local authority houses with central heatingg, carried out by the author in Spring 1978, is described. Three types of housesq of similar sizef were involved, having gas-fired 'wet' systems, and ducted warm air heating from electric storage and gas-fired units respectively. The survey was designed to determine certain aspects of occupant behaviour relevant to fuel consumption. Using regression techniques, relationships are obtained which explain more than two thirds of the variance of mean useful energy input rate between the houses of a given type in cold weather in terms of hours of use of central heatingý window opening habits, andp for warm air heating, the closing of outlet registers. It was also revealed thatq for the house types with gas-fired heatingp the number of hours of use of the central heating was strongly influenced by household size and occupancy patterns.
The implications for building design of the effects of occupant behaviour and of financial and energy costs are discussed.

iii
CONTENTS
List of Tables vii List of Figures ix
Acknowledgments xi Preface xii
PART I
Chapter I Introduction I
1.1 ENERGY REQUIREMENTS OF BUILDINGS 2
1.1.1 Building Services 2
1.1.2 Building Construction 3 1.2 THE ECONOMICS OF INSULATION 5 1-3 DOMESTIC ENERGY USE 8 1.3.1 Heating 9 1-3.2 Ventilation 12
PART II
ENERGY REQUIREMENTS AND THE ECONOMICS OF INSULATION
Chapter 2 Energy Costs of Building Materials and Structures 14
2.1 ENERGY COSTS OF MATERIALS 15
2.1.1 Cement 20
2.1.2 Bricks 22
2-1-3 Iron and Steel 26
2.1.4 Glass 29
2.2 ENERGY COSTS OF STRUCTURES 33
2.2.1 Multi-Storey Structures 33
2.2.2 Dwellings 34
Chapter 3 The Economics of Thermal Insulation 48
3.1 INTRODUCTION 49
3.2 BASIS OF COMPARISON 51
3.2.1 Fuel Costs 51
3.2'. 2 Costs of Electricity and Gas for Space Heating 53
3.2.3 Heating Regimes and Annual Heat Loss 59
3.2.4 Calculation of Present Values 61
3.3 EXTERNAL WALLS 63
3.4 PITCHED ROOF 70

iv
3.4.1 Overall Costs at May 1976 Prices 70 3-4.2 Combined Costs for the Roof Structure at Various Times 77 3.4-3 Comparison of Combined Costs for the Roof Structure- 85 3.4-4 Further Changes in the Economics of Roof Insulation, 86 3-5 SOLID GROUND FLOOR 88 3-5.1 Overall Costs at May 1976 Prices 89 3-5.2 Combined Costs for the Solid Ground Floor at Various
Times 97 3-5-3 Comparison of Combined Costs for the Solid Ground Floor 105 3-5.4 Relationship between Combined Cost, Fuel Price and
Insulating Cost for the Solid Ground Floor 106 3.5-5 Factors Affecting the Choice of Floor Insulation 112
3.6 DISCUSSION 115
PART III
SURVEY OF ENERGY USE IN HOUSES
Cbapter. 4 Object, Scope and Design 118 4-1 OBJECT OF THE SURVEY 119
4.2 QUESTIONNAIRE DESIGN 121
4.3 DWELLING TYPES 123
4.4 SAMPLES AND RESPONSE RATES 129
4.5 DATA ON FUEL CONSLUPTIONS AND WEATHER CONDITIONS 133 4.5.1 Fuel Consumptions 133 4-5.2 Weather Data 135
Chapter ý Energy Input Results for the Houses 136 5.1 WEEKLY USE OF CENTRAL HEATING AID ENERGY CONSt&PTION 137 5-1-1 Type 1 137 5.1.2 Type 2 139 5-1-3 Type 3 139 5.2 It 2
AND ENERGY OONSULIPTION 146 5.2.1 Type 1 147 5.2.2 Type 2 146 5.2.3 Type 3 148 5-3 RESULTS OF REGRESSION ANALYSIS OF F 153 5-3-1 Variables Involved in the Regressions 154 5-3.2 Simple Regressions 155 5-3-3 Multiple Regressions 157 5.3.4 Use of Central Heating: H and S 163 5-3-5 Window Opening: v and w 163

V
5.3.6 Warm Air Outlet Grille Opening: G 164 5-3-7 Position in Terrace: E : L64 5-3.8 Number of Occupants, n 165
Chapter 6 Situations and Energy-Related Behaviour of
Occupants 166 6.1 THE HOUSE TYPES AND METHODS OF HEATING 167 6.1.1 Site 1 167 6.1.2 Site 2 168 6-1-3 Site 3 172 6.2 SOCIAL SITUATIONS AND PATTERNS OF ENERGY USE 178 6.2.1 Household Size and Composition 178 6.2.2 Occupation and Income 179 6.2-3 Occupancy Patterns 181 6.2-4 Use of Heating Controls 183 6.2-5 Use of Domestic Appliances 185 6.2.6 Window-Opening 185 6.3 SATISFACTION AND COMFORT 187 6.3-1 House Warmth Satisfaction 187 6.3.2 Draughts and Damp 187 6.3-3 Satisfaction with Domestic Hot Water 188 6.3.4 General Satisfaction with Heating Arrangements 189
Cbapter 7 Heat Loss Characteristics and Thermal Model of the Houses 191
7-1 HEAT LOSS CHARACTERISTICS OF THE HOUSES 192
7-1-1 Glazing 192
7.1.2 Exposed Frames and Wooden Parts of Doors 193 7-1-3 Brick/Block Cavity Walling 194 7-1-4 Infill Panels 195 7-1-5 Roof Structures 196 7.1.6 Ground Floors 197 7-1-7 Air Volumes 202
7.2 MODEL OF HEAT GAINS AND LOSSES 203
7.2.1 Fabric Losses 203
7.2.2 Ventilation Losses 204
7.2.3 Waste Water Losses 205
7.2.4 Heat Inputs 205
7.2-5 The Heat Balance 205
7.2.6 Application to Type 2 Houses 207

vi
PART IV
Chapter 8 Conclusion 210
8.1 ENERGY REqUIRMIENTS FOR THE CONSTRUCTION AND USE
OF BUIIJDINGS 211
8.1.1 Energy Costs and Savings associated with Insulation 214
8.1.2 The Economic Attractiveness of Thermal Insulation 215
8.2 THE EFFECTS OF OCCUPANT BEHAVIOUR ON ENERGY USE 217
8.2.1 Use of Space Heating 217
8.2.2 Window Opening 222
8.3 SUMARY OF FACTORS AFFECTING ENERGY USE 225
Appendix 1 Tables of Fuel and Combined Costs associated with
the Roof Structure and the Solid Ground Floor at Various Times 229
Appendix 2 questionnaire for the Survey of Energy Use in
Houses 243
Appendix 3 Data and Correlations from the Survey of Energy
Use in Houses 252
Appendix 4 Energy Units 259
References 261

vii
List of Tables
2.1.1 Primary Energy Costs of Building Materials 18 2.1.2 Energy Requirements of Crude Steel 29
2.2.1 Energy Costs of Construction Materials (Barnes & Rankin) 37 2.2.2 Materials Requirements of Typical Dwellings 38 2.2-3 Energy Costs of Typical Dwellings 39 2.2.4 Primary Energy Requirements of Building Materials
and Structural Elements (Gartner & Smith) 42 2.2-5 Materials Requirement of Local Authority Housing 11 45 2.2.6 Primary Energy Requirements for L. A. Housing if 46 3.2.1 Costs of Fuels in W. Yorks Regiong Dee 1975 52
3.2.2 Costs of Useful Heat from Fuels, W. Yorks Region, Dee 1975 52
3.2-3 Costs of Gross Delivered Energy & Useful Heat for
Electricity & Gas at various times 56 3-3-1 Thermal Characteristics & Construction Costs (Nov 1975)
of the Wall Types 67
3-3.2 Fuel Costs & Overall Costs - Wall Types (Nov 1975) 69 3.4-1 Costs of Adding Glass Fibre Loft Insulation (May 1976) 71 3.4.2 U-values & Construction Costs of the Roof Structure
for Various Thicknesses of Insulation (May 1976) 74 3.4-3 Fuel Costs & Overall Costs - Roof Structure (MaY 1976) 75 3.4.4 Total Costs of Incorporating Insulation in Roof Structure 79 3-5-1 Thermal Characteristics & Construction Costs (May 1976)
for the Solid Ground Floor 94
3-5.2 Fuel Costs and Overall Costs - Solid Ground Floor(MaY 76) 95
3.5.3 Costs of Insulating Solid Ground Floor at various times 99
3.5-4 Relationships between c/i & f/i for the Solid Ground Floor 107
3-5-5 f/i for the Solid Ground Floor at various times III
4.4.1 Samples and Response Rates 129
4-5-1 External Air Temperatures 135
5.2.1 Correlation of P with H and with., S 152
5-3-1 Fuel Metering Periods & Nos. of Houses for Regressions 153
5-3.2 Irl for various Levels of Significance - Simple
Regressions 155
5-3-3 Results of the Simple Regressions 156
5-3.4 R for the 1% Level of Significance - Multiple Regressions 157 5-3-5 Results of the Multiple Regressions 158

viii
6.1.1 Hours of Use of Central Heating in Cold Weather 174
7-1.1 Areas of Elements of the House Types 199
7.1.2 U-values of Elements of the House Types 200
7-1-3 Heat Loss Coefficients for the Elements of the House Types 201
7-1-4 Volumes of Air for One Air Change 202
7.2.1 Total Fabric Heat Loss Coefficients, F. 204
Annual Fuel Costs at various times - Roof Structure:
A 1.1 Night Rate Electricity: 0C 230
A 1.2 Night Rate Electricity: 200C 231
A 1-3 Cheapest Domestic Gas: 15 0C 232
A 1'. 4 Cheapest Domestic Gas: 20 0C 233
Combined Costs at various times - Roof Structure:
A 1-5 Night Rate Electricity: 15 0C 234 A 1.6 Night Rate Electricity: 20 0C 235 A 1.7 Cheapest Domestic Gas: 15 0C 236 A 1.8 Cheapest Domestic Gas: 20 0C 237
Fuel Costs & Combined Costs - Solid Ground Floor:
A 1.9 Night Rate White Meter Electricity: 150C 238 A 1.10 Night Rate White Meter Electricity: 20 0C 239 A 1.11 Night Rate Economy Seven Electricity 240
A 1.12 Cheapest Domestic Gas: 15 0C 241
A 1-13 Cheapest Domestic Gas: 200C 242
Survey Data:
A 3-1 Type I Houses 253
A 3.2 Type 2 Houses 254
A 3-3 Type 3 Houses 255
Correlation Coefficients for the Houses included in the
Regression Analysis of 15:
A 3-4 Type 1 256
A 3-5 Type 2 257
A 3.6 Type 3 258

ix
List of Figures
3.2.1 Costs of Useful Heat from Electricity and Gas together
with the All-Items Retail Price Index 57
3.2.2 Costs of Useful Heat from Electricity and Gas
converted to '1970 Pounds' 58
3-3-1 External Walls 66
3.4-1 Pitched Roof 73
3-4.2 Overall Cost - Roof Structure (May 1976) 76
Combined Costs at various times - Roof Structure:
3.4.3 Night Rate White Meter Electricity: 15 oc 80 3-4.4 Night Rate White Meter Electricity: 20 0C 81 3.4-5 Night Rate Economy Seven Electricity 82
3.4.6 Cheapest Domestic Gas: 15 0C 83
3-4-7 Cheapest Domestic Gas: 20 oc 84
3-5.1 Solid Ground Floor 93
3-5.2 Overall Costs - Solid Ground Floor (MaY 1976) 96
Combined Costs at various times -Solid Ground Floor: 3-5.3 Night Rate White Meter Electricityt 15 oc 100 3-5-4 Night Rate White Meter Electricitys 200C 101 3-5-5 Night Rate Economy Seven Electricity 102
3-5.6 Cheapest Domestic Gas: 15 oc 103 3-5.7 Cheapest Domestic Gas: 20 oc 104
c/i against f/i for the Solid Ground Floor:
3-5.8 for heating to 15 0c 109
3-5-9 fpr heating to 200C 110
Photographs of the Houses:
4-3-1 Type 1 125
4-3.2 Type 2 126
4-3-3 Type 3 127
4-3-4 Floor Plans of the House Types 128

x
Site Plans:
4.4-1 Type 1 Houses 130
4.4.2 Type 2 Houses 131
4.4-3 Type 3 Houses 132
Total Mean Useful Energy Input Rate from Fuels against H:
5-1-1 Type 1 Houses (Gas: 10-11-77 to 31-1-78ý or sim. ) 142
5.1.2 Type I Houses (Gas: 31-1-78 to 5-5-789 or sim. ) 143
5-1.3 Type 2 Houses 144
5-1.4 Type 3 Houses -145
Total Mean Useful Energy Input Rate from Fuels against S:
5.2.1 Type 1 Houses 149
5.2.2 Type 2 Houses 150
5.2.3 Type 3 Houses 151
Actual Value of P against Value given by the
Regression Equation involving:
5.3-1 Hy M and C: House Type 1 159
5.3.2 H9 w and G: House Type 2 160
5.3-3 S, w and G: House Type 3 161
5.3-4 S, w and G: House Types 2 &3 162
Space and Water Heating Systems: 6.1.1 Type 1 Houses 175
6.1.2 Type 2 Houses 176
6.1.3 Type 3 Houses 177
8.2.1 Fractional Heat Input to a House for a Single Daily Heating Period from the Survey Results and from
Billington's work 221
xi
Acknowledgments
I would like to thank all who have assisted me in the work leading
to the production of this thesis, in particular:
Dr G. M. Millsq my research supervisor, for his continued advice
and encouragementq
Prof. T. T. Stonier and Dr J. V. Wheelockq for the facilities of
the School of Science and Society,
Mr P. J. Minogue of An Foras Forbarthal Dubling for his
suggestions on energy use survey designq
Mrs P. C. Robinsong for typing the thesis
and my wife, Mrs M. A. Sansamq for her ideasý assistance, and
tolerance.
I_am grateful to the occupants who agreed to be interviewed for the
survey and gave their full cooperation. My thanks also go to the
many people in the employment of Bradford Metropolitan Council who
gave help based on knowledge and experience and to the Science
Research Council for their financial support.

xii
Preface
The thesis has made use of information from various sources.
Consideration of national energy use for building services and of
the energy costs of building materials has involved drawing on a
number of published sources, as referred to in the text. In
addition to widely available dataq assessment of the economics of
thermal insulation has made use of construction costs for
building elements produced by the Energy Efficient Design Action
Group of Bradford Metropolitan Council Architect's Department.
(The present author was involved with the work of this group, and
found it a source of ideas and encouragementj Use was made of
fuel prices published by the Gas and Electricity Boards serving
West Yorkshire.
For the survey of energy use in houses reported in Part III, the
interviews were conducted by the present author in Marchý April
and early Hay, 1978. Constructional details were obtained from
Bradford Metropolitan Council and from photographs of the houses
taken by the present author. The results of the survey have been
compared with those of other workers.

-1-
PARTI
hapt
Introduction

-2-
PART I
Chapter 1
Introduction
1.1 ENERGY REQUIREMENTS OF BUILDINGS
The construction and use of a building involves a requirement for
primary energy which is considerably greater than the energy actually
supplied to it in the form of fuels. Much of the primary energy is
released elsewhere in connection with the extractiong processing and
distribution of fossil fuels, with the generation and transmission of
electricity and with the manufacture and delivery of the building
materials and components. There is a small on-site use of energy during
construction, and a considerable energy use for space and water heatirgy
lighting and other purposes once the building is occupied.
1.1.1 BuildinR Services
Using United Kingdom Energy Statistics'q the Building Research
Establishment Energy Conservation Working Party 2 estimated that 40 to
50% of the national consumption 9f primary energy in 1972 was associated
with building services, and that over half of this amount was accounted
for by the domestic sector. For each of the years 1970 to 1979P the
total LK consumption of primary fuels for energy use 1
varied between
about 8500 and 9300 PTP the value for 1972 being near the middle of this
range. (1 PJ -1 petajoule . 10ý15 joules).
The energy actually supplied to the domestic sector in each of
these years varied between about 1490 and 1740 PJ. Electricity made
an almost constant contribution of about 300 PJ each year2 while that

-
of natural gaB-increaBod from 66 PJ in 1970 to 866 PJ in 1979. Domestic
use of town gas fell from 308 to 2 PJI and of coal, coke and other solid fuels from 753 to 402 PJ. Use of petroleum products for domestic heating was about 150 PJ a year.
The primary energy input to all the processes involved in the
generation and distribution of electricity is several times the elect-
rical energy supplied to the consumer. A value of 3-97 for the ratio
was obtained by Chapman et al? for the UK in 1971/2. The use of data
2 for 1972 by the BRE Energy Conservation Working Party 0 with no allowance
for the energy cost of machinery and equipment2 produced the value 3.73-
BY 1979t the industry had reduced its fuel requirement per unit of
electricity supplied I by about 7% compared with 1972.
For Other fuels the ratio of the primary energy input to the
energy supplied to final users is much lower. For coal and oil in 1971/23,
Chapman et alý obtained values of 1.05 and 1.12. The BRB2 values for
these fuels were about ' 4 lower, and a value of 1.06 was given for
natural gas.
Throughout the nineteen seventiesp only about a fifth of the energy
supplied to the domestic sector of the UK was in the form of electricity.
Howeverp because of its relatively high 'energy overbeadolp electricitr
accounted for almost a half of the primary energy requirement of-the
fuels used by this sector.
1.1.2 Building Construction
The Primary energy cost associated with building construction
consists largely of the energy requirement for the production of the

-4-
building materials. For a conventional low rise structure with little
steel reinforcement, much of the energy cost is accounted for by the
bricks used and the cement content of mortar, concrete and building
blocks.
For the United Kingdomf the energy actually supplied to the Ibricksp
tilesp fireclay and other building materials' industrial group 1 in each
of the years 1976 to 1979 was about 58 PJ- For the cement industry the
figure was about 95 PJ- So, taken together, these industries used
about 150 PJ of delivered energy a year. Only about 6% of this was in
the foxm of electricityp with the result that the primary energy asso-
ciated with the fuel use of these industries was only a little greater
than the delivered energy.
Compared with a total UK primary energy use of about 9000 PJ a
year, and the substantial proportion of this associated with energy use
in the home, the energy requirement of the industries considered above
is relatively small. It is also the case that constructional energy
costs for a dwelling are likely to be considerably less than the primary
energy requirement for space and water heatingg cookinglighting and
appliances over the lifo of the building.
The energy costs of building construction arep howeverp far from
negligible, and a number of workers have used various methods to deduce
the primary energy requirements for the productionibuilding materialsp
elements and structures. Some of their results are presented in
Chapter 2. It is of interest to compare any extra energy cost involved
in the provision of a more insulating form of construction with the
energy saving which results when the building is in use. (See
section 8.1.1. )

-
1.2 THE ECONOMICS OF INSULATION
Expenditure on higher levels of thermal insulation will generally
result in benefits to the building user in the form of reduced fuel
bills andq possiblyp higher internal temperatures. Calculations of
economic benefit to the user are normally made on the basis of unchanged
internal temperatureog the benefit of any temperature increase being
regarded as equivalent to the fuel saving forgone to produce it.
Increased insulation is also likely to benefit the community at'large by
reducing national energy requirements.
In 1971y Gardiner4 considerel the economics of building and
beating dwellings with various levels of insulation. Using the average
price of useful heat at the time, he expressed an annual fuel cost
saving as a return on the extra capital cost foramore insulating con-
struction. For houses in all regions of England except the South West,
with living areas heated to 18-3 OC and other parts to 12.80C, he
calculated that installing 51mm rather than 25mm mineral fibre in
pitched roofs resulted in a return of more than 23ý a year on the extra
capital cost. Similarlyp using 102mm thick aerated concrete blocks in
place of clinker blocks of the same thickness for the inner leaves of
the external brick/blook cavity walls of such houses gave a return of
more than 19%.
A method such as thisp which produces a result in the form of a
rate of return on extra investmentp suffers from the disadvantage that
it does not enable the most attractive form of construction to be
readily selected. Changing to the form which gives the highest rate of
return on the extra capital cost may not yield the greatest financial

-6-
saving. A more insulating alternative which gives a lower rate of
returnp but on a larger increase in capital costf may well result in
less expense over a given number of years. The most economically
attractive form of construction is nott therefore, directly identified
by the method.
An alternative approach is to construct a total cost which
involves both capital expenditure and heating costa. This can be a
total annual costý including interest on the initial capital expenditurep
orp as in Chapter 3 of this thesisp a total 'present value' of both
present construction costs and future fuel costs. In both cases an
appropriate interest rate must be chosen in view of the expected costs
of borrowing moneyp and results will be affected by any allowances made
for Maly rises in fuel prices. Such methods produce a total effective
cost for each foxm of constructionp representing both capital and fuel
costsp and enable the fo= with the lowest effective cost to be
identified.
In 1975p Becher5 presented resultsp for Danish prices and climatev
for the costs associated with solid external walls of lightweight
concrete and pitched roofs insulated with mineral wool laid between
the coiling joists. His approach involved calculatingp for various
thicknesses, of the insulating materialp the total annual cost associated
with a square metro of the elemento This total cost consisted of the
fuel costp any loss of rent due to space being tiken up by the element,
and interest on and depreciation of the capital cost of the element
and the associatea part of the heating system* For minimum total
annual cost when heating by oil to 17 0C in the absence of incidental
gainsp the thickness of the lightweight concrete wall was about 200 to

-7-
300mm, depending on the price assumed for the oilq and the thickness
of the loft insulation was about 200 to 250=.
The BRE Energy Conservation Working Party 2 considered the cost-
effectiveness to the consumer of certain fuel-saving measures. Net
annual savings for the average UIC dwelling were calculated using 1975
pricesq allowance being made for any depreciation and for interest at
a rate of 7N a year in real terms. On this basisq cavity fill wall
insulation and 50mm thick glass fibre loft insulation were found to be
economically attractive. The provision of mechanical ventilationg
solar-assisted water heating and a 10 kW aerogenerator all appeared
unattractive on their costings.
Assessment of economic attractiveness to the user requires know-
ledge of the relative costs of alternative forms of construction for
the elements of the building shell and their thermal transmittances
(U-values). Such information was given by Handisyde and Melluish 6
for
a number of wallp roof and floor constructions. Prices were for
November 1969 and solid ground floors were not considered.
Their work was updated to both July 1975 and July 1976 prices by
7 Fidler and Fairheadj with the addition of assessments of the present
value of the fuel costs associated with heat loss through the elementsp
including a number of commercially-available single and double glazed
windows. Fidler and Jacob 899
described methods of applying the infor-
mation to obtain the life-cvcle construction and fuel cost for the shell
of a building on a total present value basis. (Future fuel costs at
constant prices were discounted back at a rate of 10% a year). Their
approach can be used to compare designs for a building which differ in
the shape proposed for the shall as well as in the forms of construction
used for the elements.

-8-
1.3 DOMESTIC ENERGY USE
There are a nunber of energy flows within a. dwalling. Heat
enters the living space from the beating system and also in the form
of various incidental gains. These result from cooking activities,
the productionp storage and use of domestic hot water, the use of
lighting and various appliancesp the entry of thermal radiation
through glazing and the loss of heat from the bodies of occupants.
Interchange of convective and radiant heat occurs at surfaces within
the dwelling$ and the latent heat of water vapour will be released if
condensation occurs.
Energy leaves the living space by conduction through the shell
of the building and by air interchange with the outside environment.
The effects of varying rates of heat input on inside temperatures are
cushioned by thermal storage, especially when a heavyweight form of
construction is involved. 10911912
Some of the energy supplied to a dwelling leaves in waste warm
water. Except in the case of electrical beating, there is also a loss
represented by hot flue gases.
It has been estimated 2 that the average amount of energy supplied
to a UK household in 1972 was 81-GJ9 of which 52 GJ was used for space
heating, 18 GJ for water heating, 8 Gj for cooking and 3 GJ for lighting
and miscellaneous appliances. The figures for a particular dwelling
might be expected to depend on'its designp including the provisions
made for space and water heating, ventilationg cooking and lighting, on
the occupants' use of these, and on the outside environment.

-9-
1.3.1 HeatinR
Household energy use is found to vary greatlyp even for nominally
identical houses. For such houses, the energy usage of the IVv highest
energy users has sometimes been found to be several times that of the
10% lowest users. 134445
Sonderegger's analysis 16
of data collected at Twin Riversp New
Jerseyq indicated thatp for houses of the same designp variations in
energy use were largely due to differences in the behaviour of the
occupants. He investigated the effect of change of residents on the
winter gas consumption of a large number of houses with gas-fired central
heatingg and deduced thatv for nominally identical housesp about 70% of
the variation in consumption was related to occupant behaviour and only
Y)ý to remaining differences between the houses.
At Abbots Langley, near Tatford, for experimental houses heated
by coalq Westonl7 reported that there was often a clear shift in the
relationship between weekly heat input and outside temperature when the
tenancy of a house changed. Changes in the relationship between weekly
mean inside and outside temperatures were also noted.
Measurements carried out in Washingtong County Durham by Newcastle-
upon-Tyne University on seven similar occupied houses with gas-fired
central beating have been reported by Pickup and Miles 18 of British
Gas. It was found that about 6. -ý. of the variance of the beat inputs
from fuels to the houses for a 38 week period starting in September
1977 could be explained in terms of the mean internal temperatures of
the houses for the period. Similar results were obtained by the
Electricity Counci, 15 for 9 eleatrically-beated detached houses in

- 10 -
Kemnayp Aberdeenshirev but the effect was less clear for the 14 terraced
houses studied there.
The National Fuel and Heating Survey carried out in March and
early 1pril 1976 by Social and Community Planning Research 19 covered a
representative sample of nearly 1600 households drawn from all over
Britain. Heating levelsy as described by occupants, varied considerably.
In only 49% of households did they keep as warm as they wanted. In a
further 28, tv including nearly half of the households with electric
central heatingy the heating arrangements were considered adequates but
the occupants found it too expensive to keep as warm as they would have
liked. The remaining 23% of respondents regarded their heating arrange-
ments as inadequate.
Minogue 20 has reported a survey of similar size carried out in
Eire for An Foras Forbartha in the spring of 1975. For dwellings with
central beating, only 18% were heated overnightp and some 20 to 2
were occupied but not heated during the day time. In the evening nearly
all were both occupied and heated. Where there was no central beatingp
use of beating was very high (>Wo) all dayp and very low (15%) over-
night, the main methods of beating used being open fires and solid
fuel stoves.
These two large-scale surveys involved a considerable variety of
dwellings. Although some fuel consumption data was obtainedv it would
be difficult to relate this to the use made of the beating arrangements
in the absence of detailed infoxmation on the beat loss characteristics
of the dwellings. For this reasony the present author's survey reported
in Part III of this tbesis was restricted to groups of closely- similar
houses.

- 11 -
Dancep Harris and Wills 21 give results on heating usev temperature
levels and fuel consumption for 6 closely-similarp occupiedg two-
bedroomed flatsp all on the north-east corner of the same block and at
least eight floors above ground level. The flats had gas-fired ducted
warm air heating. Over the 11 weeks which had mean outside air temper-
atures in the range 0 to 2.80C, the individual gas consumptions of the
beating units of the various flats were closely related to both the
corresponding mean internal temperatures and numbers of bours of use
of the central beating. With the exception of one flatp the data
exhibited linear relationships to a good approximationp the correlation
coefficients being greater than 0.9 when the anomalous case was
excluded.
22 A survey carried out in Becember 1978 by Hitching in association
with G. H. Waldren of rest Midlands Gas and G. Conan of Brunel
University, obtained info=ation from 11 similar three-bedroomed houses
having partial gas-fired central beating with radiators in hall, living
room and dining room. A house was included in the survey only if the
graph of quarterly gas consumption against quarterly degree-days
approximated closely to a straigbt line. It was found that using the
beating at 0600 hours, tneverl turning off the dining room radiator
and using the beating at 2300 hours were significantlY associated with
the line having a high gradientg and using the 'low' setting for the
boiler control in winter with having a low gradient.
Data obtained by British Gas 18 from 120 dwellings with full gas-
fired central beating indicated that hot water consumption was clearly
influenced by family size, being approximately twice as much for a 4-
person household as for a I-person.

- 12 -
1.3.2 Ventilation
Loss of heat by air interchangep whether through gaps or through
open windows and doors, can represent a considerable proportion of the
energy requirements for heating, especially in well insulated dwellings.
The air change rate depends on the size of the openings in the shell
and the pressure differences acting across them.
The pressure differences are the result of wind and of the inside
air generally being wa=erl andq thereforeq less dense, than the air
outside (stack effect). Mese two effects interact in a complex way,
depending on the positioning of the openings and the direction of the
wind. Sinden 23 demonstrates that the air infiltration rate when they
act together is never greater than the sum of the rates they would
produce if each acted alone. The effects will usually only partially
reinforce each otherp and may even act in opposition on occasions.
From field measurements in Twin Rivers, Malik 24 found, that air change
rates did generally increase with wind speed and with inside-outside
temperature difference, but confirmed that there were complex inter-
actions*
Nevertbelessf the opening of windows and doors will almost always
result in some increase in the rate of loss of heaty although quantita-
tive prediction is difficult.
Dick and Thomas 25 did, howeverp succeed in accounting for nearly
70% of the variance of air change rates observed in occupied houses on
an exposed site at Abbots Langley. Their expression for air change
rate was the sum of a constant term and terms proportional to wind speed,
to the effective number of open windowsq and to the product of the two.

- 13 -
Results obtained on a sheltered site at Bucknalls Close indicated
that, at low wind oppeds, air change rates approximated to the product
of the square root of the inside-outside temperature difference and a
factor which increased linearly with the effective number of open
windows. The mean temperature difference for these observations was
about 90P, which resulted in a ventilation rate of about 0.9 air changes
per hour for a closed house. This increased by about 0-3 air changes
per hour when a small vent window was openp and by about 0.6 Uben a
large casement window was open.
As might be expectedo the incidence of window opening on both
sites tended to rise in warmer weather and to fall as wind speed
increased. During the heating season, for both siteso the average
increase in the air change rate due to window opening was found to be
about one air change per hour.
Window opening behaviour was one of the factors investigated in
the survey reported in Part III of this thesis.

- 14 -
PART II
ENERGY REQUIREMENTS AND
THEEC0N0MICS0F
INSULAT10N.
Chapter
nergy. costs0fBu11di
Materia1szndStructure

- 15 - PA RT II
ENERGY REQUIREMENTS AND THE ECONOMICS OF INSULATION
Chapter 2 Energy Costs of Building Materials and Structures
2.1 ENERGY COSTS OF MATERIALS
A number of techniques have been employed by researchers in order
to establish the primary energy required to produce a material. They
fall into three main categories: 26
1. The Istatistical'approach is to identifyy usingp sayttbe Report on , 27
the 1968 Census of Production,, the various materials and fuels
going into the industry which produces the materialg andp by tracing
backp to calculate their costs in terms of primary energy as
accurately as possible. The total of these energy costs gives the
energy cost of the material produced. If there is a variety of
products from one industry, as is frequently the casep the energy cost
must be allocated among these. Workers vary in the conventions they
use in this allocation and also in the thcroughness of their invest-
igation of processes coming earlier in the proauotion chaing e. g.
electricity generation. Not surprisingly, their results show consift-
able variation. In much of his work, Chapman 28
uses a 'statistical'
approach and clearly summarises his conventions:
I- the inputs to an industry which are given an energy cost are
purchased fuely materialsp capital equipment and transport.
- the energy costs ascribed to the inputs are themselves deduced from
the Census Report.
the energy costs of fuels are those described in ref-3.
the energy conversion efficiency for generating electricity is
23-85%.
- the energy cost of chemical feedsto*s includes the calorific
value of the feedstock'.

- 16 -
2. The 'input-output table' approach has been made considerable use
of by Wright. 299 30
Such a table gives the requirementsp including
fuels, of one industry from all others. The materials and fuels
required will themselves have energy costs incurred earlier in the
production chaing and a mathematical technique can be used to deduce
the total primary energy costv both direct and indirectv of the 31
products of an industry. The most recent U. K. table is for 1958
and it divides the economy into 90 industriesy whereas the U. S.
table 32
for 1963 uses a division into 363 industries. This finer
dLvision has attracted Wright t; o make considerable use of the older
U. S. tablep the U. S. economy also having the advantage of involving
a much smaller proportion of foreign trade. Use of the U. S. table
doesp howeverp suffer from two major disadvantages:
(i) Recent changes in the production process may have changed the
energy cost of the product.
(ii) Perhaps more seriously, the proportion of recycled material
used may have changed significantly and may vary considerably from
country to country. This is particularly important in a case such
as aluminium productionp where process analyses by Chapman 339 34
lead to primary energy cost figures of 31ý MJ/kg for aluminium
from bauxite(50% alumina) and 11-3MJ/kg for aluminium from scrap.
The 'process' approach involves an analysis of the actual energy
inputs to a production process. In addition to fuelop account
should be taken of the energy costs of the materialsp machineryp
transport and all other goods and services vhich are made use of.
Energy inputs at all stages of production are summed to give the
total energy cost of the end product. This method avoids the
- 17 -
aggregation of both production processes and products which is to
some extent unavoidable when 'statistical' or 'input-output' methods
are employed. A thozvugh understanding of the particular manufac-
turing process isp howeverp demanded of the researcherp and consider-
able care is required to ensure that all significant inputs are
included. Barnes and Rankin 35 use a 'process' approachp but make
no allowance for the provision of manufacturing facilities.
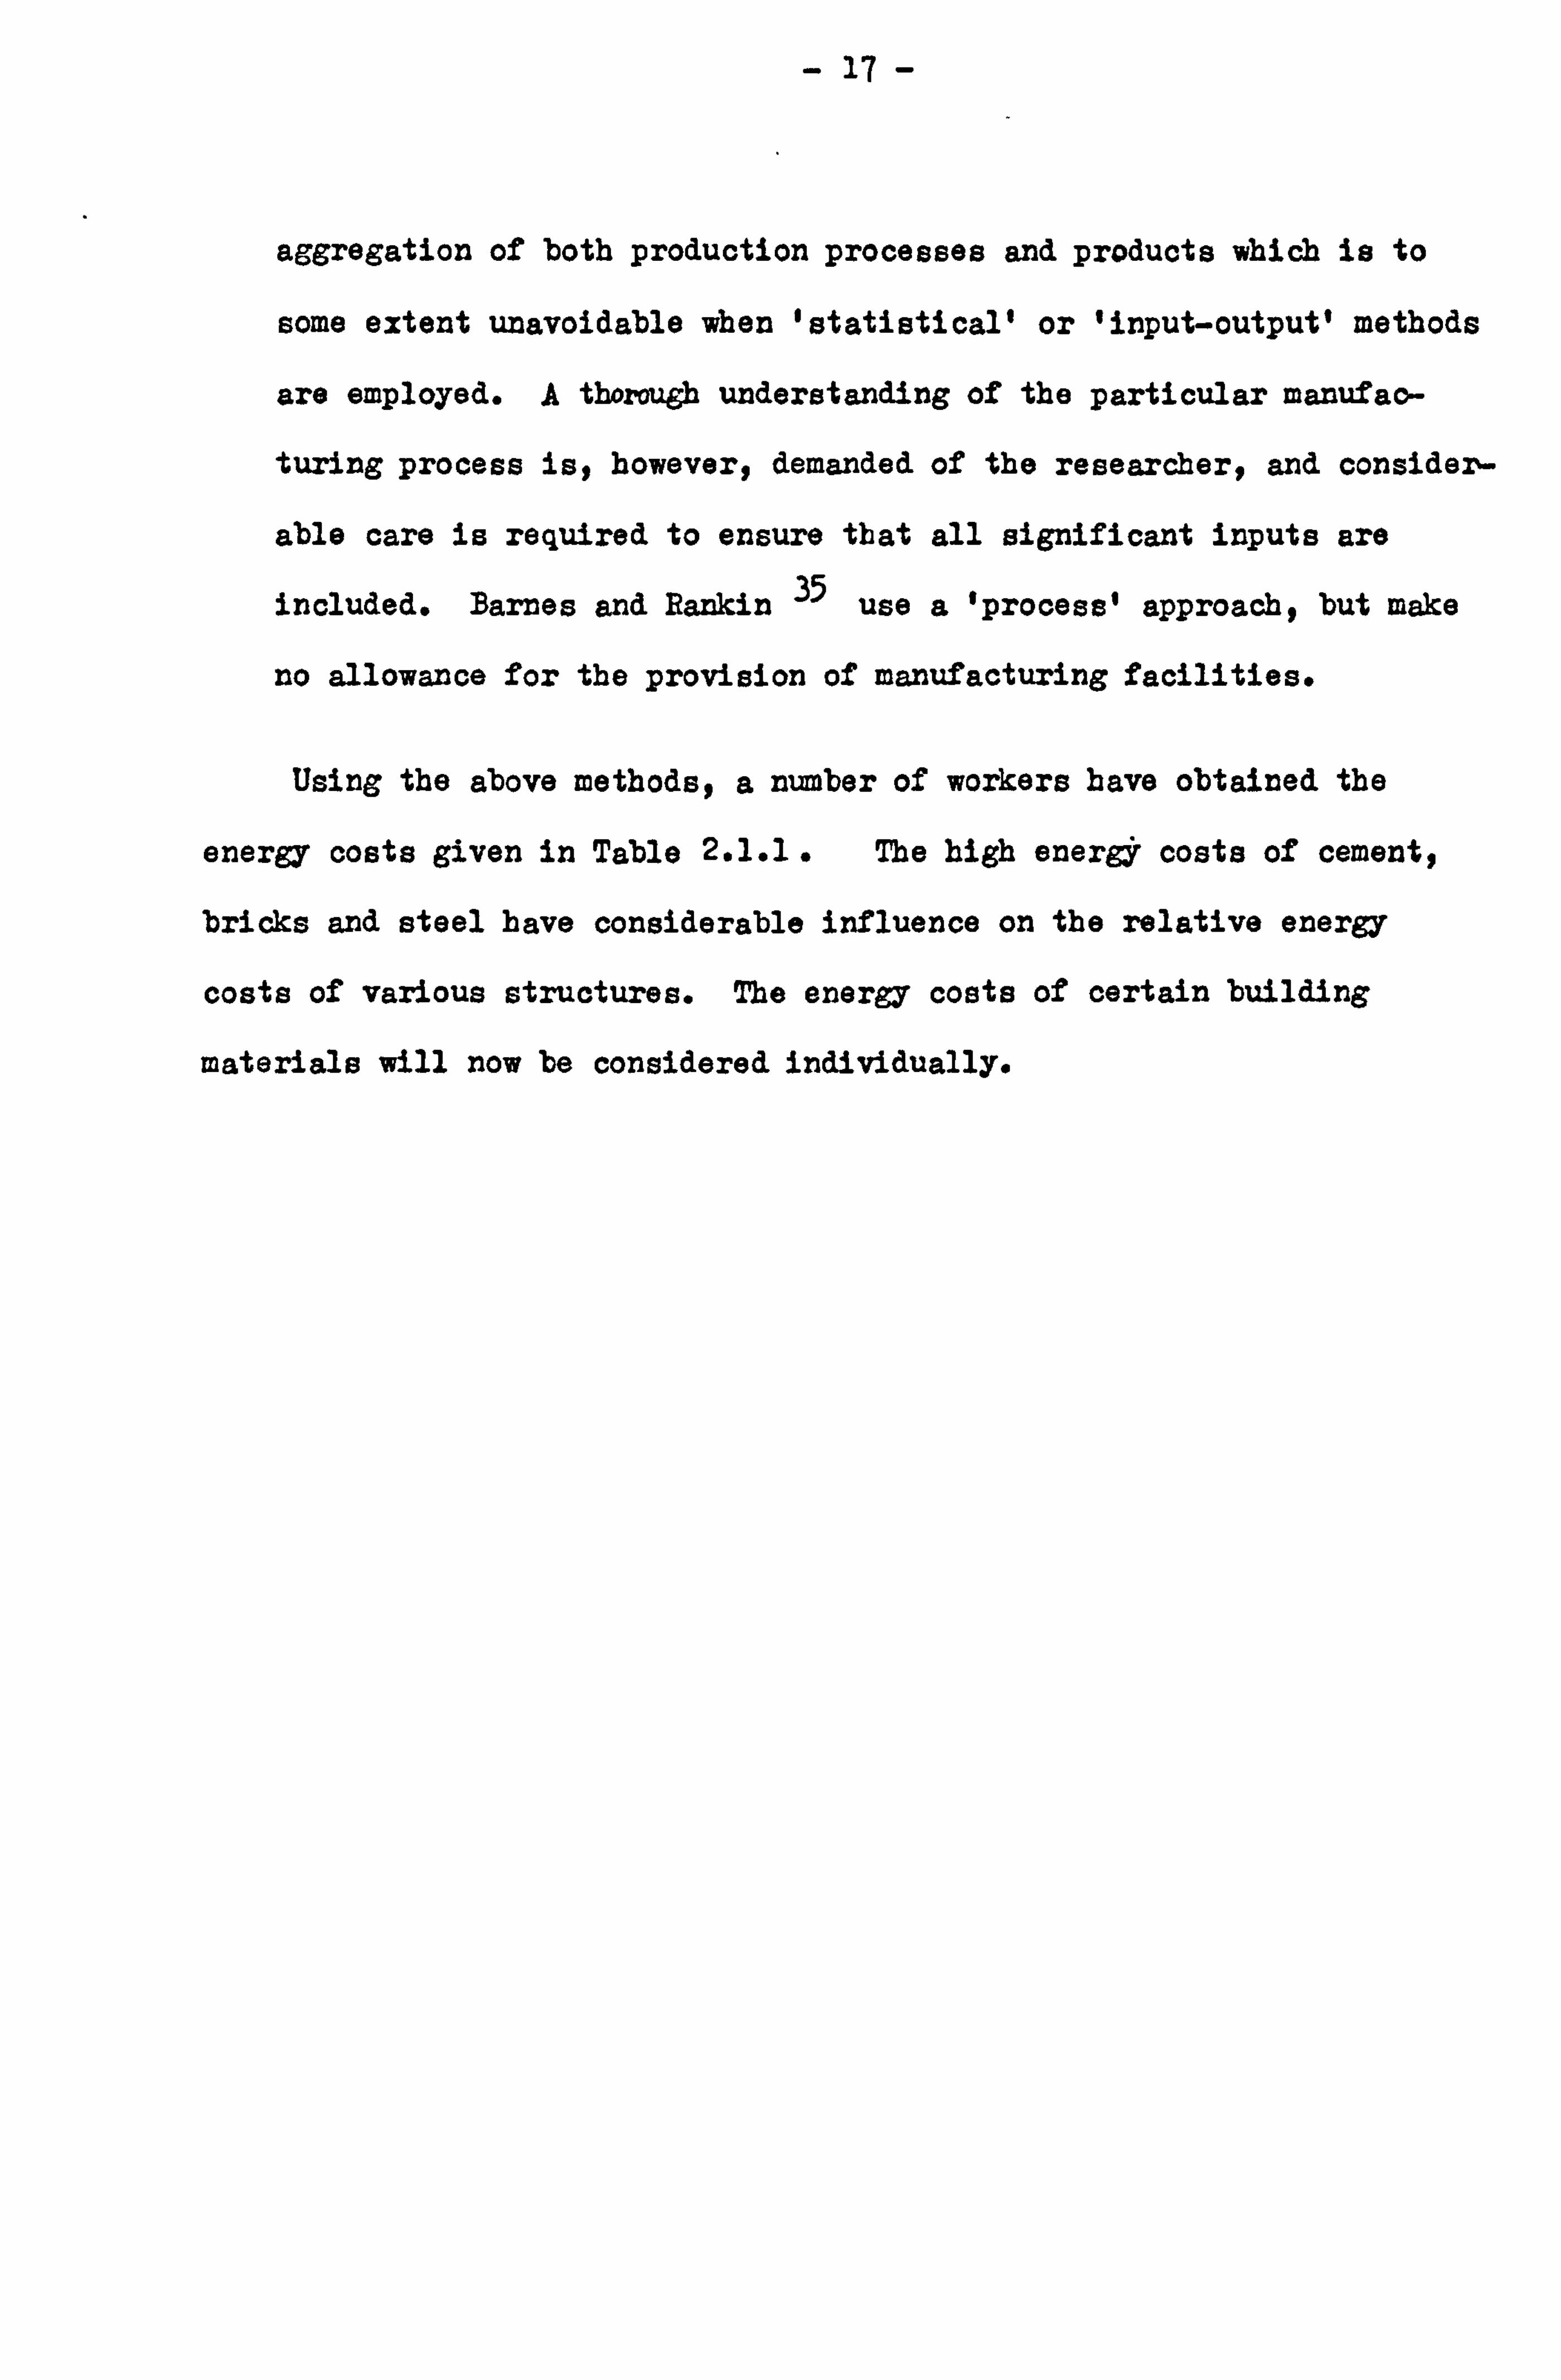
Using the above methodsp a n=ber of workers have obtained the
energy costs given in Table 2.1.1 . The high ener& costs of cement,
bricks and steel have considerable influence on the relative energy
costs of various structures. The energy costs of certain building
materials will now be considered individually.

- 18 -
*r4
m 43 92 0
r4
Z&
ca Ei
111 p4
i
cy
0 m
co rn bD
Ff 10
"A 42
A
H (D
0 -H P ri 0
42 +2 ca
42 m
a) rIIS3 co
PCI
440 Co
08
42
$4 0
1,04-4
,p co ý. o
0 cr-. f-I
CO CY
Co 94 Iß 0 ýH
Co r-i 0 clý c5
111
r-i Co t-- Co 0 ÜN
CC) rn
a' 0 S JJ
U-,
UN
,: ý % UN v) 0 t- 0
c; Ic; A
04 L-; 0
0\ I
I-
r-I 0 +2
m 41 %3 (1) 0 f-4
-P 4-4
0 0 P4
GA 110 It
R
ý%o 0
r? %D
P.
N
A cli . m
m o H 4a C,
-r4 +3 -ri H 0 M 0 P4 r-4 Cd
ca P4 P4
0 8
LCI%
a)
0 43
(D F4 4-V 0 m cd en $1 'S tko %0 - 0 4) Iým C) 0
141 C14 4-1
bD F-I r-I r-I to 53
;9 4a r -+a rl . (D
4) co 0 u ;A Q ;I
, I Fq
42 93 0

- 19 -
co en
F4
. r4 4a 1 's k
; 4H 0
4-4
-r4 42
0% cli
+b ?g 9,
co 04%, 0
0 ch et. 1 r-i
A%D 0) el r. 10
C\ä Co .2r. "ýo 0 CY%
r-4
pq CI0D2
Co CY
Co 94 %D 0 CY%
t- %Z cli
19 4)
0 Co r-i Ln cy 0
p4
%D 93 N r-1 cj IN o ri %0 CY% rn r-1 LA
CY
9
ri
cli Co
rn CM 4) bD Co 94 1 1 1 1 0 rei > UN ý4
cl c! UN rn
IIIIIII
UN UN LA cý cy Co t-- rn CY CY CY%
en
0
2
Ul
.0 r4 P4
cd r-4 0
13 io
9
f-I .4
2 P4
k P4
?I 4x m 'd
r P4

- 20 -
2.1.1 Cement
Chapman 28 quotes a figure of 7.9 MJ/kg for the primary energy
requirement of cement productionp and his analysis39 of the 'Report on 2
the Census of Productiong 1968 7 (with Casper and Mortimer) divides this
as follows: - Direct energy (Energy cost of fuel inputs) : 7-4 Mj/kg (94%)
Indirect energy (Total energy costs of materials, goodsq
including planty and services) : 0-5 kJlkg (6%)
Wright's value 29
for the energy requirement of the UC cement manu-
facturing industryp deduced from the 1968 input-output tableso3l is
rather lower at 5.69 UJlkg. Using statistics from the 'Report on the
Census of Production., 19681, 'Digest of UK Energy Statisticst 19681 1
and the 'Annual Bulletin of Construction Statisticep 1968140 Brown and
Stellon 26
obtain a result of 7.34 MJlkg, in fairly close agreement with
Chapmang as might be expected.
With no apparent allowance for the energy cost of the machinery
and equipmentp the process approach of Barnes and Rankin 35
gives the
following energy costs for the stages in cement production: -
kJlkg of cement produced
Quarryingg washing and grinding clay and chalk. 83
Burning the mix to form a clinker (rotary kiln). 5030
Grinding of clinker to powder. 477
02is results in a total energy cost of 5-59 MJlkgt wbich mavwell be
low because of the omission of an allowance for the provision of
machinery and other manufacturing facilities, and the inclusion of an
electricity consumption which is less than typical.

- 21 -
Gartner and Smith36 make use of data from a report prepared by
the Building Research Establishment 41
in conjunction with the Cement
Makers' Federation. They take figures for the delivered energy used by
the industry and convert them to primary energy requirements using
'energy requirement ratios' deduced from the information on fuel supply
in 1973 contained in the 'Digest of UK Energy Statistics, 1974't-
Fuel Delivered Energy Energy Requirement Primary Energy
(ki/kg of cement) Ratio of Fuel (ki/kg of cement)
Coal 4516 1.010 4561
Natural Gas 857 1-085 930
Oil 343 1.083 371
Electricity 367 3.779 1387
Total 6083 7250
In this way an energy cost of 7.25 MJ/kg is deduced which takes no
account of the indirect energy requirements of the industry in the form
of goods and services. It is in very good agreement with Chapman's
figure for direct energy cost.
Makhijani and Lichtenberg 38
analyse the use of energy in the
production of materials and goods in the United States, using data from
U. S. Government statistical publicationsp the United Nations Statistical
Handbook and personal communications with representatives of U. S.
industries. Electricity generation and distribution is assumed to be
30% efficient in energy terms. They obtain an energy requirement for
the production of cement of 8.7 MJlkg, to which they add 0.2 MJ/kg for
depreciation of machinery and. a further 0.2 MJ/ke for transporting the
cement producedv giving a total energy cost of 9.1 MJ/kg.

- 22 -
2.1.2 Bri oks
The manufacture of bricks usually involves the following processes 12
Clays are won from quarries by mechanical diggers driven by diesel
or electric power and transport to the brickmaking plant is achieved by
a variety of methods including conveyor beltsp aerial buckets and trucks.
The clay is then prepared and shaped in one of several ways. In
the wire-cut processp if the clay contains large bard piecesp the clay
is crushed in primary rolls before being passed to the wet pan. This is
a revolving roller mill in which water is added to increase the plasticity
of the clayp which then travels through one or more pairs of finely set
rolls. A pug mill is then used to knead the clay and extrude it in a
column which is cut by wires into brick units. Some drying is required
before firingg and is carried out in chamber or tunnel driers.
In the semi-dry processf which is a very important technique used
in the manufacture of fletton bricksp the clays and shales to be used
are ground in dry pans and passed through screens. The fine clay dust
which emerges is fed in a relatively dry condition to the brick making
macbiney where it is pressed and re-pressed several times in moulds.
Because of the low water contentp the bricks can proceed direct to the
kiln with no pre-drying.
The soft mud process uses clays from shallow surface deposits and
is used for the manufacture of multi-stock bricks in the south-east of
Englandj andy with the addition of chalk or limeg yellow stock bricks.
The clay is no=ally mixed in a wet pang where any additions are made.
These may include breeze (fine particles of coke), which is used to provide
some combustible material for the firing process and modify the appearance

- 23 -
of the finished brick* The clay is then prepared in much the same way
as in the wire-out processp but with a much higher water contentp and is
forced into sanded moulds. Drying is again required.
'Green' bricks produced by any of the processes are then stacked
in such a way as to permit the flow of hot kiln gases. In the kiln
they pass through the stages of final dryingg pro-heatingp the firing
proper and cooling.
The intermittent kiln is now used only for small-scale production.
The kiln is loaded when cold and the temperature is gradually raised
by fires in grates in the outer walls to take the bricks through the
first three stages of the firing process. The kiln is then allowed to
cool.
Me Hoffman continuous kiln consists of 12 to 20 separate cbambers
connected in such a way that hot gases can be led from one to another.
Fuel is fed to the chambers in such a way that the firing zone progresses
around the kiln. In this way the bricks in a chamber pass through all
the stages from setting and drying to cooling and drawingp the stages
being passed through at different times in the various chambers.
Continuous kilns have the advantage that heat from bricks which are
cooling can be used in the early stages of firing of other bricks.
Tunnel kilns, which also operate continuouslyq are now coming into
greater use. Green bricks are set on special cars which pass through a
long straight tunnel about 300 m longp with a central firing zone. The
bricks pass successively through dryingg pre-heating, firing and cooling
zones? Tunnel kilns are mostly gas or oil firedp though some use solid
fuel.

- 24 -
Flettons are pressed bricks made from the Lower Oxford Clay,
which is most accessible in the Peterboroughp Bedford and Buckinghamshire
regions. This clay has the advantage of a high carbonaceous content,
which greatly reduces the fuel id2ich must be added during firing. 'Stocks'
is a term which can simply mean the usual brick in a particular region,
but usually refers to yellow London stock bricks. Such bricks do not
have the reduced demand for fuel during firing which is associated
with flettons.
Barnes and Rankin 35 examine the energy requirements of some
brickmaking processes. For winning clay from an existing quarry with
mechanical shovels and bulldozersq plus some preliminary crushingthey
quote a figure of 8-4 kJ/kg of bricks. The wire-cut process for shapirg
the clay is then examined. Machinery comprising a crushing rolly
pugmill, and extruder requires primary energy at the rate of 59-5 kJ/kg
of bricks2 and tunnel drying requires no less than 1*25 MJ1k9 of bricks
dried. (Rankin 43 points out that the alternative of drying on a hot
floor uses more than twice as much energy). A highly efficient Hoffman
continuous kiln is considered for the firing process. This has an
energy requirement of 1.49 MJ/kg of bricks producedt a figure which
includes any energy obtained from combustible carbon in the clay. The
total energy requirement for brickmaking by the above processes is thus
2.81 MJ/kg, including any energy obtained from carbonaceous material
in the clay.
Rankin 43
notes thatv for clay with a high combustible contentp
the fuel needed for firing may represent as little as 210 kJ/kgp giving
a total primary energy requirement for the fuels used in makingbricks
from such clay as only 1-53 MJlkg.

- 25 -
Barnes and Rankin 35 go on to convert their gross figure of
2.81 mjlkg into a requirement of 4-78 W/m3 by assuming a density of
1700 kg/m3. The corresponding gross energy requirement per brick of
mass 2.4, kg (typical brick) - is 6-7 M-T/brickv while the energy
requirement for the fuels used may be as little as 3.7 MJ/brick.
Rankin 43
quotes a typical value of about 750 kJ/kg for the
fuel need for firing brickep which leads to a total primary energy
requirement for fuels of about 2-07 MJlkgl giving about 5 MJ for a
typical, brick.
Gartner and Smith 36
take the figure of 1.8 MJ/brickv given by
fletton brick manufacturers for coal used in firinSp to represent most
of the energy requirement. They propose 2-5 MJ as the upper limit for
the energy requirement of a fletton brick. Although this is lower than
Barnes and Rankin's study of the wire-cut process suggests, it may well
be reasonable for the semi-dry processwhich requires no pro-drying of
bricks before they enter the kiln.
Some bricks made from colliery spoil or coal-measure shales may
require as little as I MT1 brick for kiln fuelp which is taken as the
lower limit for the total energy cost of such bricks.
For other types of brick-st a primary energy requirement of 2-5
M, T/kg is considered appropriatep being derived from the fuels used in
the manufacture of lbrickov tilesp fireclay and other building materials'
in 1973y as given in the 'Digest of UK Energy Statistics, 1974- 1
So. a 3.6 kg engineering brick would have an energy cost of about 9 MJ9
and an upper limit of 10 ILT is proposed for facing bricks.

- 26 -
Using the 1968 Census Report, 27 Chapma .n 28
obtains an energy
cost of 5.8 MJ/brick, while a process analysis based on publications
of the Briek Development Association 449 45 results in a figure of
7.2 MJ/brick. Brown and Stellon 26
obtain a considerably higher value
of 10.0 MJ/brick using Goverment statistics for 1968, while Wright 29
deduces an energy requirement of 6.3 MJ/brick from the 1968 UX Input-
Output Tables ýl
Haseltine 37 makes use of energy costs of 0.63 lUlkg for flettons
and 3-13 MJ/k9 for loadbearing and facing bricks. This implies values
of 1-3 MJ for a2 kg fletton brick and 10 MJ for a 3.2 kg non-fletton
brick. To these basic energy costs# Haseltine then adds 0.24 MJlkg
for delivery (100 km round trip) and 0.18 MJ/kg for on site energy use.
It can be seen that a wide range of energy costs has been
obtained, depending on the type of brick and the manufacturing processes
involved.
2.1.3 Iron and Steel
Based on the 1968 Census of Production, Chapman 28 gives an
energy cost of 47.5 MT/kg for the production of rinished steell and
the Open University Energy Research Group Report 39
shows that 8414*
of the primary energy requirements of the general iron and steel
industry in the UK are accounted for by direct fuel inputs. Combining
the two figures implies a direct energy cost of 40 MJ/kg. Gartner and 36
Smith accept Chapman's analysis and use a figure of 47 MJ/kg for
the total energy cost of steel used in building. Wright 29
deduces a
considerably lower value of 23-8 MJ/kg from the 1968 UK Input-output
Tables as the primary energy requirement of the products of the iron

- 27 -
and steel industryv and Chapman obtains 37.9 MJ/kg for 'crude steel'.
The processes involved in the manufacture of iron are considered
by Barnes and Rankin. 35 Iron ore is mined and transportedp often over
considerable distancessto the iron works. There it is crushedv con-
centrated and usually calcined. A sinter containing some limestone is
noxmally producedg the primary energy requirement so far being 3-49
MJ/kg of sinter. Rankin43 then uses U. N. Commission figures for the
quantities of materials required for the production of iron in a blast
furnace using 100% sinter ore. For each kilogram of iron producedg
0.646 kg of coke (at 27.2 MT/kg) and 1.5 kg of sinter are used. This
results in an energy cost for iron of 22.8 MJ/kg.
Makhijani and Lichtenberg38 calculate a primary energy require-
ment of 46-4 MJlkg for the production of rolled steel in the United
States. In additionp an allowance of 2.8 Ujlkg is made for machinery
depreciation (30-year straight-line basis) and 0.8 MJ/kg for transporting
the steel (286 miles by rail plus 200 miles by truck). This leads to
a total energy requirement for the rolled steel of 50.0 MJlkg.
Chapman 28
notes that other American studies result in still
higher values. Berry and Fels 46 obtain an energy cost for steel of
about 60 MJ1kgj and Bravard et al. 47
about 56 MJ/kg. These results
are calculated using an energy conversion factor of 33ro for electricity
generation and supply. If Chapman bad used this value in place of his
23-85%9 his results for steel would have been lowered by about 4%. He
concludes that the LY steel industry may well be 15 to 2V,. more
efficient than the US industry in its use of primary energy.
A process analysis of the production of iron and steel in the UK9

- 28 -
based on British Steel Corporation statistiesp has been carried out by
Waller. 48He follows the convention of ascribing zero energy requirement
to scrap generated outside the iron and steel industry. The only energy
cost incurred in the use of such scrap is thus for transport to the
steelworks. Internally generated scrap is ascribed the full energy
cost of its production. So the use of large amounts of external scrap
reduces the energy cost of the product. The relatively small energy
requirement for the provision of the manufacturing facilitiesjs included
in the analysis.
Waller obtains energy costs of 5-54 and 5.65 IU1k9 for sinter
produced by the industry from UIC and imported iron ores respectively.
The imported ore has a much higher iron content than the M orev resulting
in a more concentrated sinter. A blast furnace operating on imported
ore and the sinter produced from itp thereforey requires less of these
materials per kilogram of iron produced. There are savings in both
indirect energy requirements for materials and direct energy requirements
for heating fuels. The energy costs deduced for the production of
molten irony termed 'hot metallp from UK and imported iron ores are
38-5 and 28-3 MJ/kg, respectively.
Since scrap purchased by the industry is assumed to only have an
energy cost equal to that required for its transport, the energy require. -
ments for the production of crude steel by the various processes are
sensitive to the amount of external scrap used as well as to the direct
energy requirement for fuels. Waller's figures are given in Table 2.1.2y
overleaf.

- 29 -
Table 2.1.2 Energy Requirements of Crude Steel Produced by the
rj8 Various Processes according to Waller.
Basic Electric Open
03ygen Arc Hearth
Purchased Scrap (as % of crude steel
produced) 14% 51% 24%
Direct Energy Requirement for
Fuels (MJlkg crude steel) 1-4 8-4 4-3
Energy Cost of Crude Steel Produced
(MJ/kg) I-
using hot metal from UIC ore 40-7 29.6 35-4
using hot metal from Imported ore 31.2 29.2 29-3
2.1.4 Glass
Virtually all glazing in buildings consists of soda-lime glass
(also called soda glass). The major ingredients are sandy soda ash
and limestonep of which soda ash has by far the highest energy cost.
Theseptogether with minor ingredients and some broken glassy or cullety
are heated to 15000C or morev an open hearth furnace normally being
used for flat glass and bottles. 49 Flat glass drawn from the melt
initialýy cools a little and must then be annealed by reheating
followed by slow cooling to room temperature.
The energy cost for basic raw materials (almost. etitirely sandt
soda ash and limestone) is built up by Rankin43 from. -the
quantities
of these three materials which would be required to produce I kg of
soda glass if no cullet were used: -

- 30 -
Energy Cost (U)
8OOg of sand 33
2709 of soda ash 3411
220g of limestone 9
3453
Thus the energy cost of these raw materials is about 3-45 MJ.
Although about 10 to 20% of cullet is added to the furnacep this figure
is taken to be the energy cost of raw materials per kilogram of glass
produced. Cullet is regarded as a substitute for raw materials and is
effectively ascribed the same energy cost.
The main fuels used in glass making furnaces in the UK are oil
and, more recentlyp natural gas. 49 Using such fuelep a furnace might
be expected 43 to have a thermal efficiency of about 25%P so that the
theoretical requirement of 2.91 MJlkg for heating the constituents and
carrying out the chemical reaction would be supplied at a primary energy
cost of about 11.6 MJ/kg of glass produced. Howevert in practicep
electric boosting is carried out by inserting molybdenum rod electrodes
into the molten glass and passing an electric current through the
glass itselfg this being a moderato'conductor of electricity at the
temperatures involved. Output is generally boosted in*this way by
about 11%9 and the electrical energy is utilised at virtually 100%
efficiency. Assuming an electricity generating efficiency of about
37%9 Barnes and Rankin 35 obtain a reduced primary energy cost for
furnace fuels of 10.9 MJlkg of glass, The energy cost of subsequent
annealing is taken to be about 0.63 MJ/kg- So a total energy cost for
soda-lime glass of 15.0 MJ/kg is obtained: -

- 31 -
Raw materials
Furnace fuels
Annealing
Energy cost (MJlkg of glass)
3.45
10.9
0.63
15.0
As usualp Barnes and Rankin take no account of the energy costs
incurred for the plant, buildingsp repairs and other capital goods
and services made use of by the industry. Analysis of the 1968 Census
of Production by Casper et al. 39
suggests, however, that only about
6% of the total energy costs of the inputs to the industry are of this
typep with a further 2j% being accounted for by packaging materials.
Chapman's value 28 for the energy requirement for glass
production, also from the 1968 Census of Production, is 22-5 MJ/kg9
representing the average perfomance of the UK industry. The associated
analysis of the Census Report by Casper et al. 39
shows that 77% of
the requirement is in the form of direct energy inputs in the foxm of
fuelsp corresponding to 17-3 MJ/kg- Sandi limestone and 'inorganic
chemicals' (presumably mainly soda ash) purchased by the industry
accounted for 8.8% of the total energy costp implying a requirement of
2.0 MJlkg of glass for major raw materials actually bought in.
37 In Haseltine's paperg a particularly low figure of 12.4
MJ/kg is used for the energy cost of glass9 though no further details
are givenp and Whittemore 50 of the University of Washington,
Seattlev quotes a value of 6.6 MJ/kg of Glass produced as the energy
requirement for firing the glass for containerep using a gas-fired
regenerator furnace.

- 32 -
Makhijani and Lichtenberg 38 obtain an energy cost of 26.6 MJ1kg
for the manufacture of finished plate glassy using data published by
the US Goverment and the United Nations. To this they add 1.2 MJ/kg
for depreciation of machinery and 0.8 MJlkg for transport (286 miles
by rail plus 200 miles by road) to give a total of 28.6 MJlkg. Such
figures are in reasonable agreement with Chapman's result for UK glass
manufacture.
Energy costs for the main types of glass products have been deduced
by Perry and Doyle5l for the processes used in certain M factories.
They obtain primary energy requirements of 22.8 MJ/kg for glass
containers, 20-35 MJ/ig for flat glass manufactured by the float process
and 63-7 MJlkg for glass fibre insulation. In the last casev fiberising
and subsequent processing account for 45% of the total requirement.
It can be seen that glass fibre insulation has a considerably
higher energy cost than either glass containers or window glass. This
35 is overlooked by Barnes and Rankin, who use the value 15-0 MJ/kg for
both window glass and glass wool insulation.

- 33 -
2.2 ENERGY' COSTS OF STPUCTURES
2.2.1 Multi-Storey Structures
Using the energy costs of materials attributed to him in Table
2.1.19 Haseltine 37 compares the primary energy requirement of a
number of wall typeep complete with their structural elements. The
types selected are typical of those being used in new buildings of
about 6 storeys. Considering the unclad struoturesy he concludes that: -
1. The use of reinforced concrete floors and loadbearing brick piers
results in a lower energy cost than a reinforced concrete frame,
which itself gives a lower energy cost than a concrete cased steel
frame.
2. A concrete frame with fletton brick or blockwork infill panels
gives a lower energy cost than loadbearing brick crosswalls sup-
porting concrete floors. The use of reinforced concrete cross-
walls further increases the energy costs
The range of energy costs for these unclad structures is fairly
small. The concrete-cased steel frame has the highest cost at about
Ij times that of the lowest (loadbearing brick piers), while the others
all bave costs less than 11 times. 3
The energy costs of different elevations (claddings and windows)v
as considered in Haseltine's paper, have a range of greater than 3 to 1-
However, the energy cost used for aluminiump where it appears in the
elevationsy represents its production from orey and thus neglects the
large energy saving resulting from the recycling of scrap. This is
justified by arguing that there is little useful scrap produced on
building sites. Haseltine fails to take account of the scrapq such as

- 34 -
aluminium from curtain walling and window frames2 which may well result
from the demolition of the building at the end of its life. To some
extent2 however, the use of this high value for aluminium will be
compensated for by the comparatively low energy cost used by Haseltine
for glass (see Table 2.1.1).
Haseltine concludes that an elevation incorporating precast
concrete panels backed with concrete blockwork has a particularly high
energy costf and that the cost for curtain walling made of glass and
aluminium is almost as high. The energy requirement for elevations
using brick cavity walls is considerably less.
2.2.2 Dwellings
To facilitate the calculation of energy costs of various types
of dwellings, Barnes and Rankin 35 convert the energy costs per
kilogram of material which they have deduced to more usable forms
(Table 292, il ). The energy cost per cubic metre of brickworkp for
examplep is obtained using a representative : Qigure for the density of
the bricksy though no allowance is made for mortar. Similarlyp the
density of glass is used to deduce the mass of 1m2 of window glassy
and hence its energy cost.
Use is then made of figures presented by Cullen 52 on the
materials requirement of new buildings. These are based on data collected
over many years and on some less formal background knowledge, and were
published in 1967. Three types of dwelling are involvedt-
a) Houses and bungalows (tELken togetherg allowing for relative
proportions built).

- 35 -
House: Typically semi-detachedp 2-storeyt 3 bedroomsp 84m 2
gross floor area.
Bungalows Tý, pically semi-detached with 70m 2 gross floor area.
Roofs are usually pitched and finished with concrete tiles.
b) Low flats (4 storeys and under).
Estimated on the basis of a 3-storey block with 4 flats per storevp
the gross floor area per flat being 73-5m 2 and the net floor area
2 per flat 63-5m . Again roofs are usually ptched and finished
witb concrete tiles.
0) Rith flats (5 storeys and over).
Estimated on the basis of a 12-storey block with 6 flats per storey,
with 76M 2 gross floor area per flat and 63.5m2 net floor area per
flat. Roofs are flatp asphalt being the most common finish.
Barnes and Rankin also consider timber framed houses and bungalows,
regarding these as a modification of the conventional versions. In
this way, and by making reference to some actual bills of quantities,
they obtained materials requirements for a total of four types of
dwelling (Table 2.2.2 ). Certain components which are common to
almost all new dwellings are omittedy including most of the plumbing
system and fittinvag and the electrical wiring.
The energy costs of materials (Table 2*2,, l ) and materials
requirement of dwellings (Table 2.2.2 ) are then combined to give the
energy costs of the typical dwellings (Table 2.2-3 ).
It can be seen that the energy cost for lbrickwoxkl is the major
item in all four cases. In the conventional bousee and bungalows it

- 36 -
is used for both leaves of the external walls, lightweight concrete
blocks being used only for internal walls. This is not representative
of current practicep which involves the use of lightweight blocks for
inner leaves in order to meet regulations on the=al transmittance.
The timber framed houses and bungalows are assumed to have the-frame,
carrying plasterboard and plywood sheathingg as the inner leaf, and a
brickwork outer leaf. Internal walls consist of timber frames faced
with plasterboard, so that no concrete blocks are used in the buildirg.
The use of timber framing in place of brick or block walling results
in a considerable reduction in the primary energy requirement for
materials. In additionp insulation such as paper-faced glass wool
quilts can be easily and economically incorporated during construction.
The external walls of both low and high flats have been taken
to consist entirely of brickworkq though blockwork is commonly incor-
porated and concrete panels are sometimes used. The internal walls
are aesumed to be brickwork in low flats and concrete in high flats,
The particularly high energy cost of 222 W for low flats would be
considerably less ift instead of consisting entirely of brickwork, the
walls included some blockworkq as in the low rise flats considered by
Gartner and Smith ?6
Steel reinforcement of the concrete structure of high flats has
not been included by Barnes and Rankin. This may well be a serious
omissiopy since Gartner and Smith 36
estimate that it accounts for
an energy cost of no less than 1.9 GJ/m2 of dwelling area for a 9-
storey block of flats with a reinforced concrete loadbearing, structure.

- 37 -
Table 2.2.1 Energy Costs of Construotion Materials: Barnes and Rankin35
Material Energy Cost
(MJ/kg)
Mass/
Construction
Unit
Energy Cost/
Construction
Unit
Concrete
Dense 0-538 2400 kg/m3 1290 Mj/m3
Lightweight 0-538 1200 kg/m3 645.6 Mj/m3
Lightweight Tiles 0-538 13- 4kg/M2 7.2 Mj1M 2
Bricks/Brickwork 2.81 1700 kg/m3 4780 Mj/m3
PlasterAllasterboard (10mm) 1.8 kg/ 2 1 7-5 m 13-5 VjIM2
Timber 1.68 650 jg/m3 logo Uj/m3
Window glass (3mm) . 15-0 7-5 kg/m2 112-5 Uj/M2
Glass wool (25 mm) 15-0 kg/M2 0-3 2 4-5 YJ/m
Plastic drainage pipes (PVC) 115.6 1-5 kg/m 173-4 MJ/m
Cast iron drainage pipes 22.8 15 kg/m 342 YJ/m
Thermoplastic flooring
(40% PVCp 2mm) 46.24 3 kg/M2 138-7 Ulm 2
Asphalt 0.210 20 kg/m2 4.2 M31M 2

- 38 -
Table 2.2.2 Materials Requirement of Typical Dwellings per Square
Metro of Gross Floor Areaq as used by Barnes and Rank-in
Unit Conventional
Houses/
Bungalows
Timber Framed
Houses/
Bungalows
Low
Flats
High
Flats
Dense concrete m3 0.12 0.25
Lightweight concrete
screed m3 - - - 0-003'
Brickwork m3 0.27 0.135 0-545 0-37
Lightweight concrete
blocks m3 0-154 - - -
Plaster and
plasterboard M2 5-00 5-00 4-45 3-385
Lightweight concrete
tiles m2 o. 86 o. 86 0-395 -
Asphalt m2 - - - 0-085
Timber m3 0.0655 0-0841 0.0196 0.0092
Window glass M2 0.12 0.12 0.18 0.18
Glass wooly 25mm M2 o. 60 Mo 0-345 -
Plastic drainage
pipesy PVC M 0.229 0.229 - -
Cast iron drainage
pipes m - - 0.102 0-007
Thexmoplastic
flooring m2 0.925 0.935

- 39-
35 Table 2.2.3 Energy Costs of Typical Dwellings: Barnes and Rankin.
Units Mj/m2 of gross floor areal unless stated
otherwise.
Conventional
Houses/
Bungalows
Timber Framed
Houses/
Bungalows
Low
Flats
High
Flats
Dense concrete 155 323
Lightweight concrete
screed - - - 2
Bri ckwork 1291 645 2605 1769
Lightweight concrete
blocks 99 - - -
Plaster and plasterboard 68 68 60 46
Lightweight concrete
tiles 6 6 3 -
Asphalt - - 0-4
Timber 71 92 21 10
Total for major components 1535 811 2844 2150
Window glass 14 14 20 20
Glass wooly 25mm 3 3 2 -
Plastic drainage
pipes, PVC 40 40
Cast iron drainage pipes 35 2
Thermoplastic flooring - - 128 130
Total energy coetp Mj/M2 1592 868 3029 2302
2 Gross floor area/dwelline, m 77 77 73-5 76
Energy cost/dwellingy GJ 123 67 222 174

- 40 -
Gartner and Smith 36
make use of the ranges of values which
they accept as the primary energy requirements of cementp sand and
various types of coarse aggregate to calculate the energy requirements
per cubic metro of three types of concrete and of lightweight concrete
blocks (Table 2.2-4 )- The energy costs of brickwork and blockwork
wallingp including mortarp and of tile bung blockwork lightweight
infills are also obtained. Except in the case of timber and aggregates,
the energy requirements for transporting materials is judged to be too
small a proportion of the total energy cost to be specifically includedy
as is energy used 'on site' for operations such as concrete mixing.
Four types of bousingt representative of local authority con-
structiong are then consideredp making use of data collected by
LemessaxV and Amos 53 on net materials usage from studies of drawings
and bills of quantities. (Table 2.2-5 )- Only the major components
of structurep roof and wall finishes are included. The types aret
Type 1. Houses or bungalows of conventional brick and block construction,
with loadbearing outer wallsp pitched roofsp concrete ground
floors and timber upper floors. For the analysisp a two-storey
house with 80 m2 of dwelling area is considered. The cavity walling
is assumed to be brick outside and block insidep and party
walls to be all block.
Type 2. Houses or bungalows with loadbearing cross walls and light-
weight infill panels, floors and roofs being as in type 1.
Igain calculations are for a two-storey house with 80m 2 dwelling
area. The crosewalls are assumed to be half block and half
brickp and the infills to be lightweight blockwork clad with
tiles.

- 41 -
Type 3- Flats or maisonettes with vertical loadbearine elements of
brick and blockv pitched roofs and reinforced concrete slab
upper floors. These are generally built with 2 to 5 storeysp
andq for calculationg a 4-storey block is takeng the load,
I bearing walls being assumed to be half brick and half block,
and the dwelling area per flat to be 55m 2-
Type 4. Flats or maisonettes with vertical loadbearing elements and
floor and roof slabs all of reinforced concretep representirg
medium and higb-rise construction. Calculations are based on
a 9-storey block with 150mm thick reinforced concrete walls
and 55m2 of dwelling area per flat.
The energy requirements and quantities of materials used in the
four types of dwelling are then combined to obtain the total energy
requirement of the major components of a dwelling of each type (Table
2.2.6 ). The resulting energy requirement ranges are 100 to 180 W
for a Type I house with brick/block outer wallop 95 to 145 W for a
Type 2 house with lightweight infills or for a Type 3 low-rise flatp
and 230 to 265 W for a Type 4 high-rise flat*
35 The approach of Barnes and Rankin gave-a total energy requirement
of 123 W for a conventional house or bungalow (Table 2.2-3 ). The
figure for the major components only would be 1.18 W, which is within
the range quoted above for the Type 1 house of Gartner and Smith. The
floor areas are similar in the two cases.
Energy costs of buildings are considered further in section 8.1.

- 42 -
Table 2.2.4 Primary Energy Requirements of Building Materials
and Structural Elementst Gartner and Smith ý6
Quantity Energy Cost/
Unit Quantity
Energy
Requirement
(M. T)
Cementp lm3 1500 k9 7.25 M-T/k9 10900
Sand, lm3 1500 k9 0-03 - 0-30 MJ/ki; 45 - 450
Dense coarse
aggregatep lm3 1500 k9 0-03 - 0-30 M-T/kg 45 - 450
Lightweight aggregate:
Low energy (foamed
slag)v lm3 375 k9 0.10 M. T/kc 37-5
High energy (sintered
clay) p Im3 400 kg 3-00 MJlkg 1200
Dense concrete,
1: 3: 6, Im3t
Cement 0-143m 3 10900 Mj/m3 1560
Sand 0-429m3 45 - 450 Mj/m3 20 - 190
Dense coarse aggregate 0-857M3 45 - 45o mi/m3 40 - 390
1600 - 2100
Dense concrete,
1: 2: 4, Im 3:
Cement 0.213m3 10900 Mj/m3 2320
Sand 0-426m3 45 - 450 Mj/m3 20 - 190
Dense coarse aggregate 0.853m3 45 - 450 Mj/m3 40 - 380
2400 - 2900
/Continued

- 43 -
quantity Energy Cost/ Energy
Unit quantity Requirement
W)
Lightweight concretep
1: 2s4, Im, 3:
Cement 0.213m3 10900 Mj/m3 2320
Sand 0-426m3 450 Mj/m3 Igo
Lightweight aggregate 0.851m 3 37.5-1200 Mj/m3 30 - 1020
2500 - 3500
Brick wallingy single
leafp lm 2s
Bri cks 60 1- 10 M. T/brick 60 - 6oo
Mortar 0.02m3 2400 - 2900 Mj/m3 50 - 60
110 - 66o
Tilingv Im2 60 kg 2-5 MJ/k9 150
Lightweight blocksq
. jm3 bulk vol.:
low energys Cement 120 kg 7*25 MJ/k9 870
Lightweight aggregate 1080 kg 0*10 MJlkg 110
1000
high energy: Cement 58 k9 7.25 MJ/k9 420
Lightweight aggregate 522 kg 3-00 MJ/kg 1570
2000
Blockwork wallingg
75-100mmt lm 2:
Lightweight blocks 0-075-0.10OM3 1000 - 2000 Mj/m3 75 - 200
Mortar 0,01m3 2400 - 2900 M. T/m3 24 - 29
100 - 230
/Continued

- 44 -
Quantity Energy Cost/
Unit quantity
Energy
Requirement
W)
Combined brickwork/
blockwork walling
(assumed half-brick,
half block)f single
leaf, lm 2:
Brickwork, single leaf 0-5M 2 110 - 660 Mj1m 2 55 - 330
Blockworki 75 - 100mm 0-5m 2 100 - 230 MS/M 2 50 - 115
100 - 450 Tile hung lightweight
blockworkq lm 2:
Blockworkt 75 - 100 mm lm 2 100 - 230 Mj/m 2 100 - 230
Tiling lm 2 150 MJIM 2 150
250 - 380
Timberp jm3 480 kg 5.2 MJ1kg 2500
Plaster or
plasterboardl Im 2 65 MJ/m 2 65
Steel reinforcementp -
1 kg 47 MJ/kg 47

- 45 -
Table 2.2.5 Materials Requirement 53 of Representative Types of
Local Authority Housing per Square Metre of Dwelling
Areap as used by Gartner and Smith. 36
Type Is Type 2s TYpe 3: Type 4:
2-storey 2-storey 4-storey 9-storey
house with house with block of block of
conventional loadbearing flats flats
brick/block crosswalls,
loadbearine and light-
outer walls weight infills
Dense concretep Foundations 0-035 0.020 0-040 0.100
1: 3: 6 (d) ', round f loor
slabs 0.075 0.075 0-035 ox16
Dense concrete) Screeds 0.024 0.024 0.055 o. o67
1: 2: 4 (m, 3) Wallsp roof-
slabs, etc. 0-005 0.001 0-005 o. 61o
Total dense concrete (d) 0-139 0.120 0-135 0.793
Steel reinforcement (kg) 0-30 - 11-5 40-5
Combined brickwork/blockwork
walling (m 2 of single leaf) 2.21 1000 1-85 0-31
Blockwork partitions (M 2 1.43 0.84 2.02 o. 83
Tile hung blockwork
infills (m 2) - 0.60 - -
Plaster and plasterboard. (m 2) 3-80 3-80 4.20 4-18
Roof tiling (m 2 0.66 0.66 0-41 0.15
Timber (m3) oaM 0.106 0.069 0.026

- 46 -
Table 2.2.6 Primary Energy Requirement of Constructional Materials
for Representative Types of Local Authority Housing:
Gartner and Smith. 36
Unit: MJ/m 2 of dwelling areap unless stated otherwise.
Type 1: Type 2: Type 3: Type 4:
2-storey 2-storey 4ýstorey 9-storey
house with house with block of block of
conventional loadbearing flats flats
brick/block crosswalls
loadbearing and light-
outer walls 3weight
'infills
Dense concratep
Foundations 56 - 74
ls3z6 Ground floor
slabs 120 - 158
Screeds 58 - 70
1: 2: 4 ' Wallsp roof .
sp etc. slab 12 - 15
Total dense concrete 246 - 317
Steel reinforcement 14
Combined brickwork/
blockwork walling 221 - 995
Blockwork partitions 143 - 329
Tile hung blockwork
infills -
32 - 42 64 - 84 16o - 210
120 . 158 56 - 74 26 - 34
58 70 132 - 160 161 - 194
23 12 - 15 1460 - 1770
212 273 264 - 333 1807 - 2208
541 1904
100 - 450 185 - 833 31 - 140
84 - 193 202 - 465 83- 191
200 - 304
/continued

- 47 -
Type 1: Type 2s Type 3: Type 4:
2-storey 2-storey 4-storey 9-storey
house wýth house with block of block of
conventional loadbearing flats flats
brick/block crosswalls
loadbearing and light-
outer walls weight
infills
Plaster and
plasterboard
Roof tiling
Timber
Total requirement for
major components
Average dwelling area
per bouse or flat (m')
Average energy require-
ment per bouse or
flat (GJ)
247 247 273 272
99 99 62 23
265 265 173 65
1235 - 2266 1207 - 1831 1700 - 2680 485 - 4803
80
loo - 180
80 55 55
95 - 145 95 - 145 230 - 265

-
Chapte
Th eE co no mi c s o f
Th erm a1 1 ns u 1 at ion

-49 - Chapter
.1 The Economics of Thennal Insulation
3.1 INTRODUCTION
The expenditure on fuel for beating a building can be reduced by
using more highly insulating forms of construction. This often increases
the initial cost and a balance must be struck between this and the
recurring fuel costs.
A useful approach is to combine construction and fuel costs to
produce an equivalent overall cost. This would be the amount of money
whichp if available when the building was completed, would cover the cost
of construction andp following appropriate investment of the remainderp
would also just provide for the purchase of heating fuel over the expected
useful life of the building.
It is convenient to consider separately each element of the building
shell, such as external walleg roofp etc. This approach has been used
by the Energy Efficient Design Action Group of Bradford Metropolitan 54 Council Architect's Department, with the involvement of the present
authorp and by Fidler and Fairbead 7 of the Property Services Agencyp
Reading. In both cases construction costs were presented along with
associated fuel costs for selected patterns of intermittent beating*
Fuel costs will here be assessed on the basis of continuous heating
to certain internal temperaturese They are applicable to intermittent
heating if the temperatures are taken to represent the time-averaged
yalues. Even when temperatures vary significantly from room to room it
may be possible to specify an effective internal temperature which deter-
mines the average fuel cost per unit area of a particular building
elementp such as the external walls*

- 50 -
In the examples ihich followp costs bave been given for elements
of buildings constructed in the West Yorkshire region in late 1975 or
in May 1976. The economic attractiveness of insulating pitched roofs
and solid ground floors at various times in the last tan years has also
been considered.

- 51 -
3., 2 BASIS OF COMPARISON
3.2.1 Fuel Costs
The economic comparison of alternative forms of construotiong
providing differing levels of thermal insulation, involves a knowledge
of the cost of supplying beat to the building. Tariffs for electricity
and natural gas usually involve a standing chargep payable for each
metering period, The size of such charges is important if a comparison
is to be made between fuels. The object berep however, is to compare
forms of construction for a given fuel. The standing charge will
normally be unaffected by the form of constructionq and is omitted from
the costings. This approach has the advantage of providing a constant
cost per unit of fuelo independent of total consumption. The resulting
overall costsp boweverg can only be used for comparing alternative forms
of construction when using a given fuel. Comparisons between alternative
fuels cannot be made with accuracy unless the effects of standing
charges are also taken into account for the particular building concerned.
Considerp for exampleg the fuel costs which obtained in December
1975- In the case of electricityp the cheapest rate available to new
domestic consumers at that time was the night rate of the Units Meter
tariffq this being suitable for storage heating. The cost per unit is
given in Table 3.2.1 together with the costs of alternative fuels
per tberm of gross calorific value. These costs were appropriate for
the West Yorkshire region in December 1975y and exclude standing charges
in the cases of electricity and natural gas.
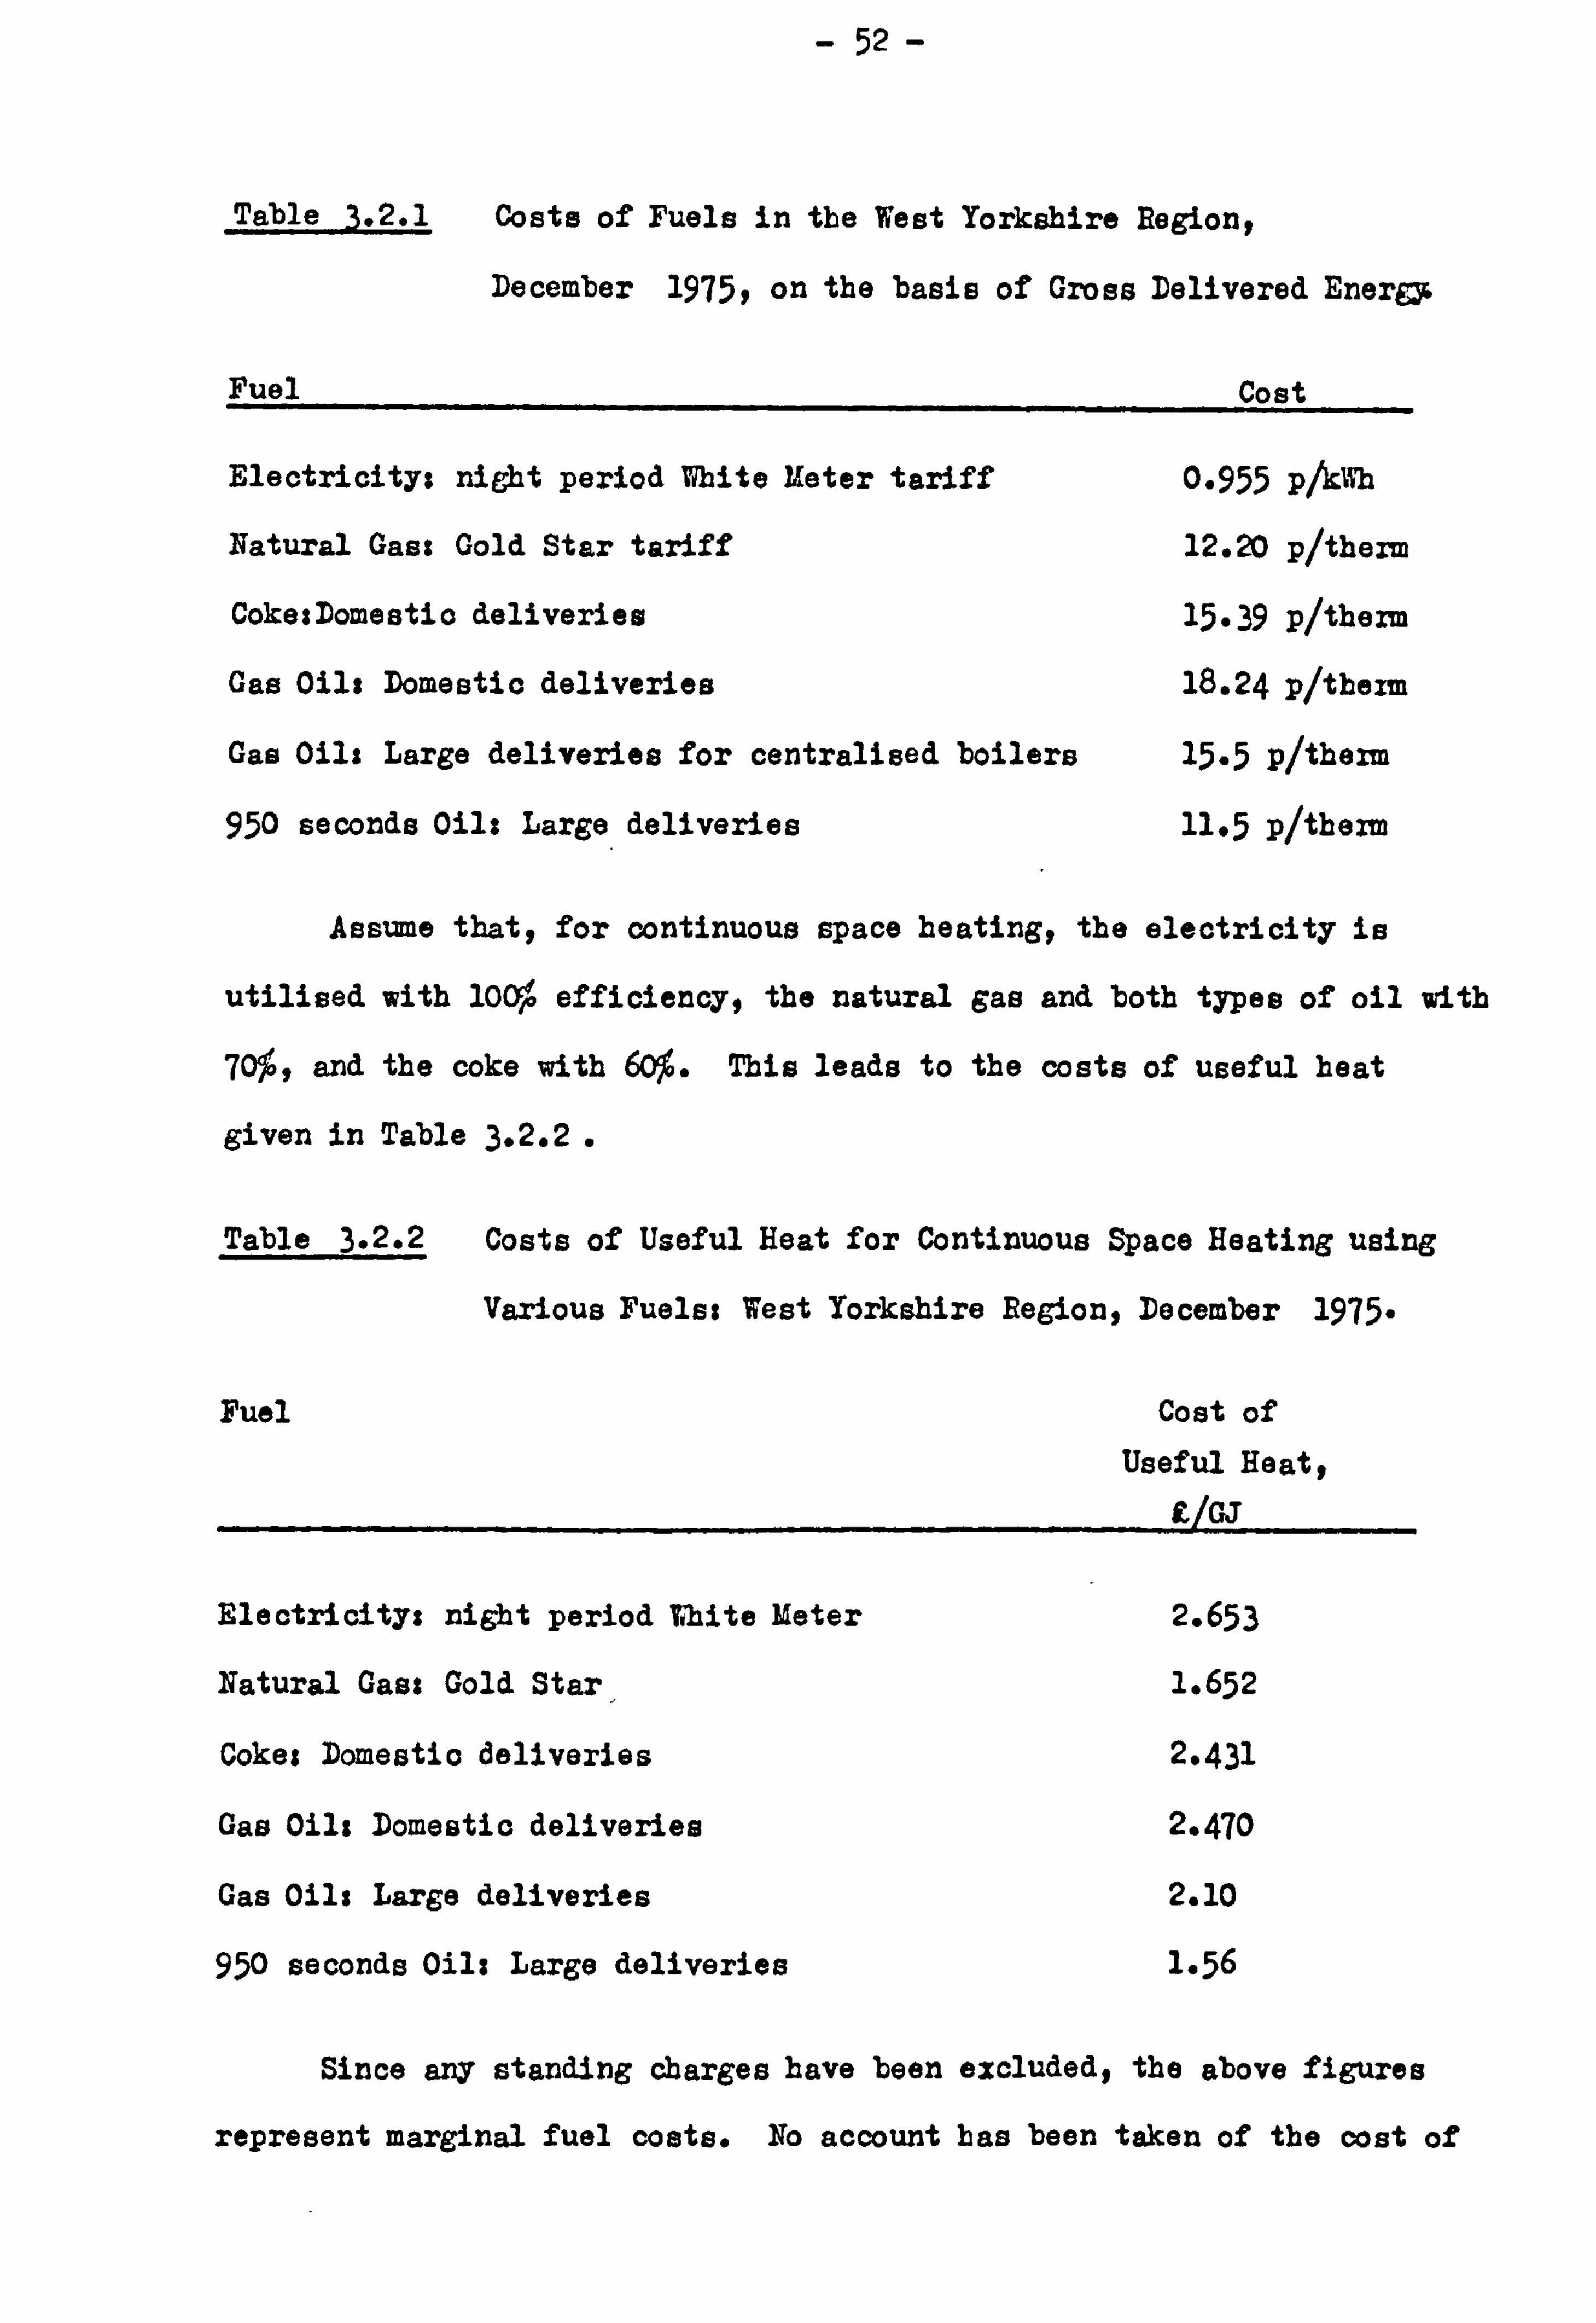
- 52 -
Table 3.2.1 Costs of Fuels in the West Yorkshire Regiony
December 19759 on the basis of Gross Delivered EnerfZ6
Fuel Cost
Electricity: night period White Meter tariff 0.955 p/klVh
Natural Gas: Gold Star tariff 12.20 p/therm
CokesDomestio deliveries 15.39 p/therm
Gas Oils DoMeBtio deliveries 18.24 p/tbeim
Gas Oils Large deliveries for centralised boilers 15-5 P/therm
950 seconds Oil: Large deliveries 11-5 p/tbe=
Aasume that, for continuous space beating, the electricity is
utilised with 100% efficiencyg the natural gas and both types of oil with
70%9 and the coke with 60%. This leads to the costs of useful heat
given in Table 3.2.2 .
Tabl a 3.2.2 Costs of Useful Heat for Continuous Space Heating using
Various Fuels: West Yorkshire Region, December 1975-
Fuel Cost of Useful Heatt
--- rL/W
Electricitys nigbt period White Meter 2.653
Natural Gast Gold Star, 1.652
Cokes Domestic deliveries 2-431
Gas Oils Domestic deliveries 2.470
Gas Oils Large deliveries 2.10
950 seconds Oil: Large deliveries 1-56
Since any standing charges have been excludedl the above figures
represent marginal fuel costs. No account has been taken of the cost of

- 53 -
heating applianceso although more highly insulated constructions
allow less powerful beating systems to be fitted. On the domestic
scalep howevery savings in the cost of the beating system are likely
to be small.
3.2.2 Costs of Electricity and Gas for Space Heatin
From April 1970 to September 2978 the cheapest domestic rate for
electricity was the night rate of the 112ite Meter tariff. This rate
is available for 8 hours during the nightp a higher rate being charged
at other times$ and it will be assumed to be used with 100% efficiency
by a storage heating system to provide space heating on a continuous
basis. In October 1978 the 1,13ite Meter tariff was restricted to those
already covered by itpand the Economy Seven tariff was introduced. This
has a lower night rate which is only available for 7 hours. Provided
the beating system has a reasonably high storage capacityp this tariff
may well be more attractive. Though in most practical systems some day
rate electricity is used for space beatingy it has been assumed in the
examples which follow that the heating is achieved entirely by night
rate electricity.
The rates introduced during the period under consideration have
been obtained from the Yorkshire Electricity Boardq which covers the West
Yorksbire regiong end cbecked against consumerglaccounts when available.
They include fuel cost adjustments but do not take account of the rebates late 1974 and
given for consumption inlearly 1975 as an emergency correction to the
imbalance between off-peak and full-price rates. The costs are given
in Table 3.2- 3-
The lowest price per therm charged to domestic consumers for gas

- 54 -
supplied by North Eastern Gasp which covers West Yorkshirep is also
givenp being the appropriate marginal rate for assessing savings in
fuel costs for gas central heating. Both natural and manufactured gas
were available at the rate given for April 1968 to December 1970, but
for later periods manufactured gasp while it was still being supplied,
was generally about 113
p/therm dearer than the rates given. The
corresponding cost of useful heat at 70 efficiency appears with the rates
in Table 3.2-3 - The reduction in cost in September 1974 is due to
the introduction of the Gold Star tariff in the region at the time.
It has been assumed that all the energy of the night rate
electricity and 70% of the energy represented by the declared calorific
value of the gas enters the building being heated as useful heat. No
allowance has been made for any excessive supply of beat from an electric
storage beating unit during the night. The approach used here for
electricityq therefore, is more appropriate for well-controlled con-
tinuous space heating than for intermittent beating.
The efficiency assumed for obtaining useful heat from gas
represents a reasonably well designed domestic central heating system.
Pickup and Miles14 have reported field tests by the British Gas
Corporation on occupied houses with Gas-fired 'wet' central beating
systems. Carefully designed systems with low thermal capacity boilers
were found to have efficiencies for the winter heating season in the
range 70 to 80%- For less well designed systems with high the=al
capacity boilers the range was 45 to 70%- (These figures do not include
heat from the cases of the boilersp inclusion of which would raise them
by several per cent). The same authors 18
make use of factors of 0-7
for gas and 1.0 for electricity in estimating energy inputs to a number
of occupied houses in cold weatherp and there factors have also been

- 55 -
used by the present author in the survey of energy use in three types
of local authority houses reported in this thesis. The full-load
efficiencies claimed for the gas-fired units involved in this survey
were about 75%.
The costs of useful beat from night rate electricity and the
lowest priced domestic gas supplied by the Boards operating in the West
Yorkshire region have been plotted in Figure 3.2.1 on a logarithmic
scale for the period from early 1970 to mid-1980. The all-items Retail
Price IndeX55to the base for which the average index for 1970, is 1.00V
is included for comparison. (A log. scale has been used so that a given
vertical distance always represents the same percentage cbangeý)
In Figure 3.2*29 costs of useful beat divided by the Retail Price
Index at the time have been plotted, these being the costs in '1970
Pounds'. This enables fuel costs to be compared with retail prices in
general.

- 56 -
Table 3.2.3 Costs of Gross Delivered Energy and Useful Heat for
Electricity bought at the Night Rates of the White Meter
and Economy Seven Domestic Tariffs, and for Gas bought
at the Cheapest Domestic Rate available at the time
from the Boards operating in the West Yorkshire Region.
Night Rate ELECTRICITY for 100% efficiency CHEAPEST DOMESTIC GAS
Date ZHITE METER ECONOMY SEVEN Date Delivered Useful Heat
Introduced Introduced Energy, at 70%
efficiency,
p/kWh LIW P/kwh E/W p/the= E/W
Apr 68 7-73. 1-044 Apr 70 0.292 0.810 Jan 71 7-8 . 1-056 Apr 71 0-343 0-953 Jan 72 8.18 1.108 Apr 72 0-360 1-000 Oct 73 0-387 1-075 Jan 74 8-79 1.190 May 74 0.679 1.886 Jul 74 0.703 1.953 Sep 74 7.34 0-994 Oct 74 0.768 2.133 Jan 75 0.850 2-361 Jan 75 9.5 1*286 Apr 75 0-938 2.6o6 J ul 75 0-949 2.636 Oct 75 0-955 2.653 Oct 75 12.2 1.652 Jan 76 0.988 2-744 Apr 76 1.069 2.969 Jul 76 1-090 3.028 Oct 76 1-109 3.081 Oct 76 14-1 1.909 Jan 77 1-157 3.214 Apr 77 1*205 3-347 Apr 77 15-3 2-072 Jul 77 1.237 3-436 Jan 78 1.288 3-578 Apr 78 1-318 3.661 Oct 78 1-318 3.661 1-058 2.939 Jun 79 1-42 3-944 1.14 3-167 Jun 79 16-5 2.234 Sep 79 1-56 4-333 1.25 3-472 Apr 80 1-87 5-194 1-50 4.167 Apr 80 19-3 2.613 Aug 80 2.10 5-833 1.69 4.694
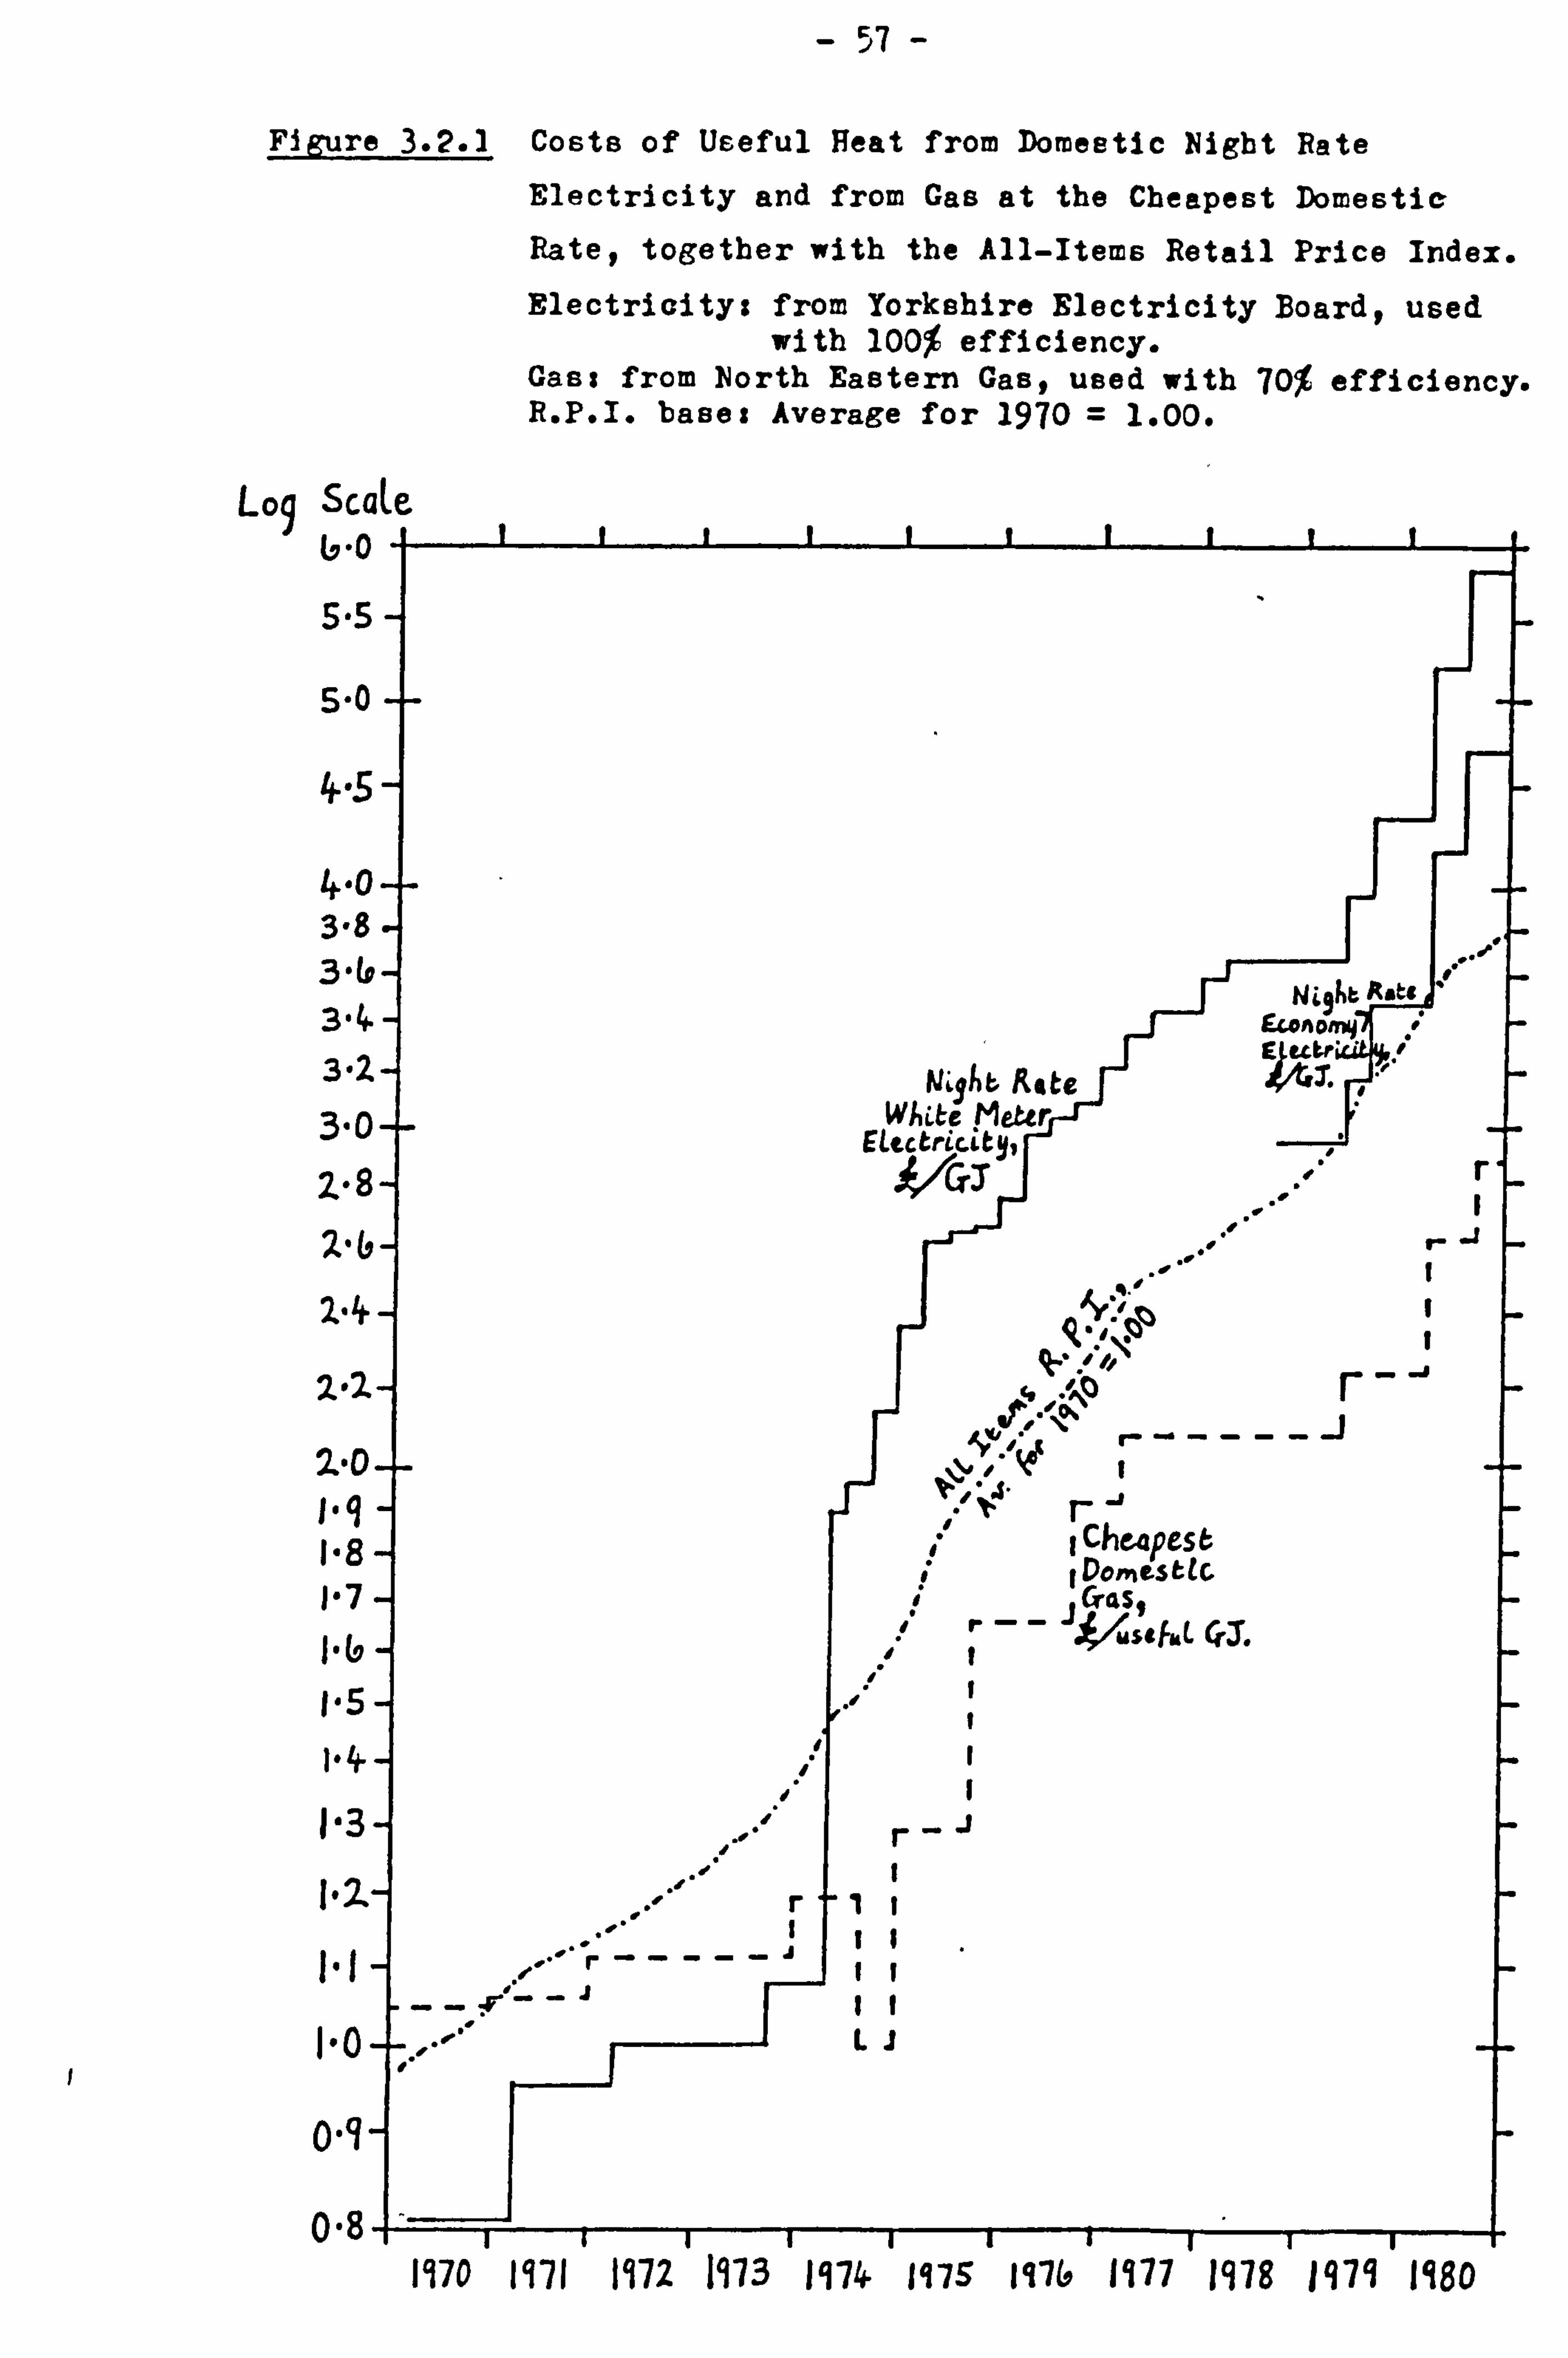
- 57 -
Figure 3.2.1 Costs of Useful Peat from Domestic Night Rate
Electricity and from Gas at the Cheapest Domestie
Ratep together with the All-Items Retail Price Index.
Electricity: from Yorkshire Electricity Board, used with 100% efficiency.
Gas: from Borth Eastern Gasp used with 70% efficiency. R. P. I. bases Average for 1970 = 1.00.
Loq scaLe U-0 -- 5.5-
5.0-.
ý-s -
4-C 3-8 34 3-4 3-; 3-C
Z-i 2-C,
z-4
2-2
1.0
I. q 1.8 1-7 1.6 1.5 1-4- 1-3
1.0
r
WIbb We whaF Meu
r
Che-4pCS
Cras.
L Q. T. J*IIA
LJ
0.5
0.8 1170 H71 1172 IJ73 1474 147S m7b 1177 1978 lq71 IqSD

- 58 -
Figure 3.2.2 COBtSOf UBeful Heat from Domestio Wight Rate
Electricity and from Gas at the Cheapest Domestic
Ratey converted to '1970 Pounds'.
Electricity: from Yorkshire Electricity Board, used with 100% efficiency.
Gast from Forth Eastern Gas, used with 70% efficiency.
.. Ik
C.
-L) 11
__a
oH -ul a:
-. i
1970 lq7l 1972 1173 1974 1975 IjAo 1977 N78 1975 1980

- 59 -
3,2-3 HeatinR R4gimes and Annual Beat Loss
In order to illustrate the thermal performance of building elements,
two idealized heating regimes have been considered. For simplioityv it
has been assumed that internal temperatures of 15 and 20 0C are being
maintained on a continuous basis in the West Yorkshire region by supplying
heat in the absence of incidental gains from any other heat sources
within the building or due to the entry of thermal radiation.
For beating to the lower levelp the internal temperature will still
unavoidably rise above 15 0C at certain times due to high external
temperatures, and it has been assumed that the heating system is simply
shut off while the internal temperature is above 15 0 C. A $degree day'
approach56 can then be used, For beating to the higher levelp since
external temperatures in the region exceed 20 0C for only a very small
proportion of the time and daily mean temperatures are rarely above this
valuep it has been assumed that the internal temperature can be kept at
the desired level by controlled beating in the absence of incidental
gains. The heat loss through the fabric can then be calculated on the
basis of a constant internal environmental temperature of 20 0 C*
Degree day figures from the Meteorological Office are published
regularly by the Department of Energy in 'Energy Management'. The figures
for a given area are calculated from maximum and minimum air temperature
readings taken at a meteorological station within the area. West YorkEhire
falls mainly within the 'East Pennines' areaq for which figures are
based on readings taken at Finningley near Doncaster. They are for a
base temperature of 15-5 0 C, and the average annual degree day figure
given 57
for the twenty years to 1976 is 23580C days. Examination of

- 60 -
30-year monthly-average maximum and minimum temperatures58 for
Finningley and a number of stations in West Yorkshire suggests that
mean annual degree day figures for Finnirgley are appropriate to West
Yorkshire provided they are regarded as being for a base of 15 0C rather
than 15-5 0 C.
So a figure of 23580C days per annum has been used for heating
to . 15 0C in West Yorkshire in the absence of incidental gains. Converting
from days to seconds and multiplying by the thermal transmittancog
U W/M 2 oC, an annual heat loss of 203-7 U MJ per square metro of building
element is obtained.
The fuel requirement to maintain a constant temperature of 20 0C In
the absence of incidental gains has been calculated using meteorological
data collected in Bradford59 from lot July 1977 to 30th June 1978P
a period of 365 days for which the East Pennine degree day total varied
little from the 20-year average. Since the daily mean external temper-
ature never exceeded 20 0 C9 the heat requirement was found using the mean
external temperature calculated from all the daily maximum and minimum
temperatures recorded in this period.
The mean external temperature so obtained was 8-59 0 Cy implyingo
0 day
0 for the base temperature of 20 Cy a degroeXtotal for the Year of 4163 C
days. The corresponding annual heat lose through a building element
with thermal transmittance U W/m 2oC is 359-7 U MJ/m 2-
Fuel costs have been calculated from beat losses on the assumption
that they consist entirely of useful beat at the cost given in
Table 3.2-3 for the particular fuel at the time. In this way the
costs of supplying the heat lost through the building element have been

- 61 -
found in the absence of any assistance from incidental gains.
3.2.4 Calculation of Present Values
Alternative fo=s of construction may vary widely in the levels
of thermal insulation they provide and it is desirable that a fuel cost
element should be included in any economic comparison. Unlike con-
struction costsg fuel costs are incurred throughout the life of the
building, and it is convenient to reduce them to their 'present value'
on the first day of occupancy.
This present value is the sum whicht suitably invested at the
beginning of the period of usep would just be sufficient to meet the
fuel costs arising over the'years. It is dependent on the assumptions
made concerning future interest rates and fuel prices. In calculations
of present valueep interest rates are often assumed to be substantially
greater than the rate of inflation of fuel pricesp and in such cases
the present value is affected little by the precise useful lifetime
allotted to the building. Under such conditions the present value is
dominated by capital sums whichp after only a short period of invest-ý
mentp must meet the fuel costs of the first-few years. Relatively high
interest rates encourage what is effectively a short-term view and make
spending on increased levels of insulation less attractive.
For the purpose of calculating present values it is commonly
assumed that investment will yield a real return of 10% per annum relative
to prices. Here an effective discount rate of 10% relative to the
fuel costs has been usedp although it is realised that distortions will
result if the price of the fuel rises at a substantially different rate
to prices in general. A useful building life of 60 years or more has

- 62 -
been assumed. In such circumstances, the present value of future fuel
costs is almost exactly ten times the annual fuel cost as calculated
from the price of the fuel at the time the building was completed. An
effective overall cost hasp thereforep been found by adding ten times
the annual fuel cost corresponding to heat lost through a building
element to its construction cost.
In the domestic situation, standing charges and the extra cost
of the first few units of a fuel will not be affected by the thermal
performance of the buildingg and alternative constructions are compared
using the marginal cost of the chosen fuel. Savings in the cost of the
heating system due to reductions in its design load are likely to be
smallp and have not been taken into account.
Whenpas for domestic gas in the early 1980sp fuel costs are
expected to rise at a particularly high rate, the present value of
future fuel costs may well be considered to be more than ten times the
annual fuel cost at initial prices. There will still, howeverp be a
desire for a reasonable rate of return during the early years of use on
any extra expenditure on insulationg especially ifq as in the case of
loft insulationt more can be added at a later date if required.
Comparisons of overall costs as defined above willp neverthelessp tend
to underestimate the economic attractiveness of the more insulating
constructions when fuel costs are rising more rapidly than prices in
general*

- 63 -
3.3 EXTERNAL WALLS
It is of interest to consider a. number of wall types representative
of those currently used for houses and similar buildingsp including
some which provide a significantly higher level of thermal insulation
than the minimum required by the Building Regulations. A number of types
have been selected and are shown in Figure 3-3-1-
U-values for normal exposure have been calculated using the methods
proposed in Section A3 of the I. H. V. E. Guide. 60
These are presented,
along with construction costsq in Table 3-3-1. The construction costs
are for building in West Yorkshire in November 19759 being based on
all-in hourly rates of Ll-58 for a craftsman and U*34 for a labourer.
They have been obtained from the report 54
of the Energy Efficient
Design Action Group of Bradford Metropolitan Council Architects' Departmentj
the present author having been involved in the production of the report.
A cost of PO per thousand was assumed for dense facing bricks.
Domestic electricity and gas prices were the same in November 1975
as in December 19759 the costs of useful heat from night rate White Motor
electricity and Gold Star natural gas being those given in Table 3.2.2..
Using these figuresp the annual fuel costs associated with the wall types
have been calculated from the U-values for beating to 15 and 200C as
described above. In each case an overall costq consisting of the con-
struction cost plus ten times the annual fuel costy has also been found.
The resulting costs are given in Table 3-3.2.
It can be seen thatp for the 'A' type brick/bloak wallsp the lowest
overall cost is for type A5, whetber beating is by night-rate White Meter
electricity or by natural gas on the Gold Star tariff. This is true
for both of the internal temperatures considered. Type A5 employs

- 64 -
relatively inexpensive concrete blocks along with urea formaldehyde
foam injected into the cavity between blockwork and brickwork. Such a
construction is generally considered unsuitable where there will be
high exposure to driving rain. The next lowest overall costy in all
cases except beating to 20 0C by electricityt is obtained using type A21
where the cavity is left empty and the inner leaf is built of aerated
concrete blocks 100 mm thick. For electrical heating to 20 0 C, type A4v
using 140 mm aerated concrete blockst has the next lowest overall cost
totype A5 with its cavity fill insulation*
The wall types Al and A3 both incorporate lightweight aggregate
blocks and an unfilled cavity. These blocks have significantly higher
thermal conductivity than the aerated concrete blocksp but are only a
little cheaper. The small reduction in construction costs is outweighed
by increased fuel costs. As a resultp the overall costs for types Al
and A3 are comparatively high.
The timber-framed wallop types Bp Cl and Up provide low U-values
at reasonable cost. This is partly explained by the presence of more
than one airspace in each of these wallsp and by the inclusion of a 50mm
thickness of glass fibre quilt in types B and C2. As a resultv for each
of the four combinations of fuel and temperature level consideredp the
overall costs for the timber-framed walls are lower than for any of the
'A' type brick/block walls. The only exception to this is that$ for
heating to 20 0C with electricity, the overall cost for type B is a little
greater than for the cavity-filled type A5-
The only walls which do not incorporate an outer leaf of dense
facing bricks are types C1 and C2. The fact that the construction costs
of all the other types are higher is partly due to the high cost of the
facing bricks used. If the cost of facings bad been reduced from E70

- 65 -
per thousand to about E30 per thousand by changing to flettonsp the
saving would have been about E2.50 per square metre of wall. With such
a changeg the overall costs for type A5 would lie between the corres-
ponding costs for types C1 and C2.
It is of interest that the timbei--framed wall type C2 has a lower
overall cost than type Cl in each of the four situations considered.
It is identical to type Cl except for having a 50mm. thick layer of glass
fibre quilt added between the studs of its frame. Sop on the basis
of overall costs as used here, the cost of adding the insulation is more
than compensated for by savings in fuel.

- 66 -
Figure 3.3.1 External Walls
Types Al, A2 and A5
IOZ-5mm brickwork (Jense facings)
73 mm seated cavit . (AS : fmm -Iiited)
100 mm blockwork AI end AS : AgUte, AZ: ThermaUte
12. min CarLCte pt4sber, mulsion point
TypeB A3 and A4
10,2-5 mm brickwork fac inj S)
73 MM SCAed C4VUY Mmm bLockurork A3: A9Llte JAA
4: Therinatite
12 mm Cartite ptaster, emutslon paint
Type B
OOV 101-S rnm brickurork Uense facings) SS min CAvity
BuE ding paper s toplej ýo sWs anj tanded to ljvuUlfvMý /All SCOnn Itilss fibre quLU -= =1 -= Z--Zl _r --- =-: - gins at Im centms
50 x SO mm Gorizonf4t nog fotL-backed pUsLe4Ward, towtsion paint
10 0
=x5:
0 m verb icaL stuJs a6450 min ceA tres
0
! -: - ý --'5
Types Cl and C2
Concrete We hit . nq ing SOXII min heri2ontel GUWlus id 114jnmceAtms BOLL inj ar
f
,
na t as slox so MI, on b4L AD 9 ns at lin centres D min 3 r*j goopt Wss
LM ULU: vre Cl onty s ing
MM 4 100 mm Tiwxm4LUe Rockwork -
Ilmon Cartue pL4StCj-, enjuLSion paint 100 X 50 inm VertLcsL Stu& at bOo snon cerstr"

- 67 -
Table 3.3.1 Thermal Characteristics and Construction Costs
of the Wall Types (November 1975 prices).
Wall Conductivity U-value of Construction
Type of Material, Complete Cost of
W/60 C W/ 2oC Wallp m Wallp j '/ 2
m
'A' Types: BricJc/Blor-k Outer Leafs
102-5mm brickwork in dense facings. 1.10
73mm Cavity. Inner Leaf:
Blockwork as below. 12mm Carlite lightweight
plaster. 0.19
Emulsion paint. Al loomm Aglite lightweight
aggregate blocks. 0-30 1.178 14-18
A2 100mm Thermalite aerated
concrete blocks. 0.22 1-030 14-37
A3 140mm Aglite- 0-30 1-017 15.21
A4 140mm Thermalite. 0.22 o. 868 15-40
A5 100mm Aglite. 0-30
73mm urea formaldehyde foam cavity fill. 0-038 o. 386 15-38
B Brick/Insulated Timber Frame 0.490 14.61
Outer Leafs 102-5mm brickwork in dense facings. 1.10
55mm Cavity. Inner Leafs
Building paperp stapled to studs of frame. 50mm glass fibre quiltp bonded to the paper. 0.036 100mm timber frame. 0-14 12mm foil-backed plaster- board. 0.16 Emulsion paint.
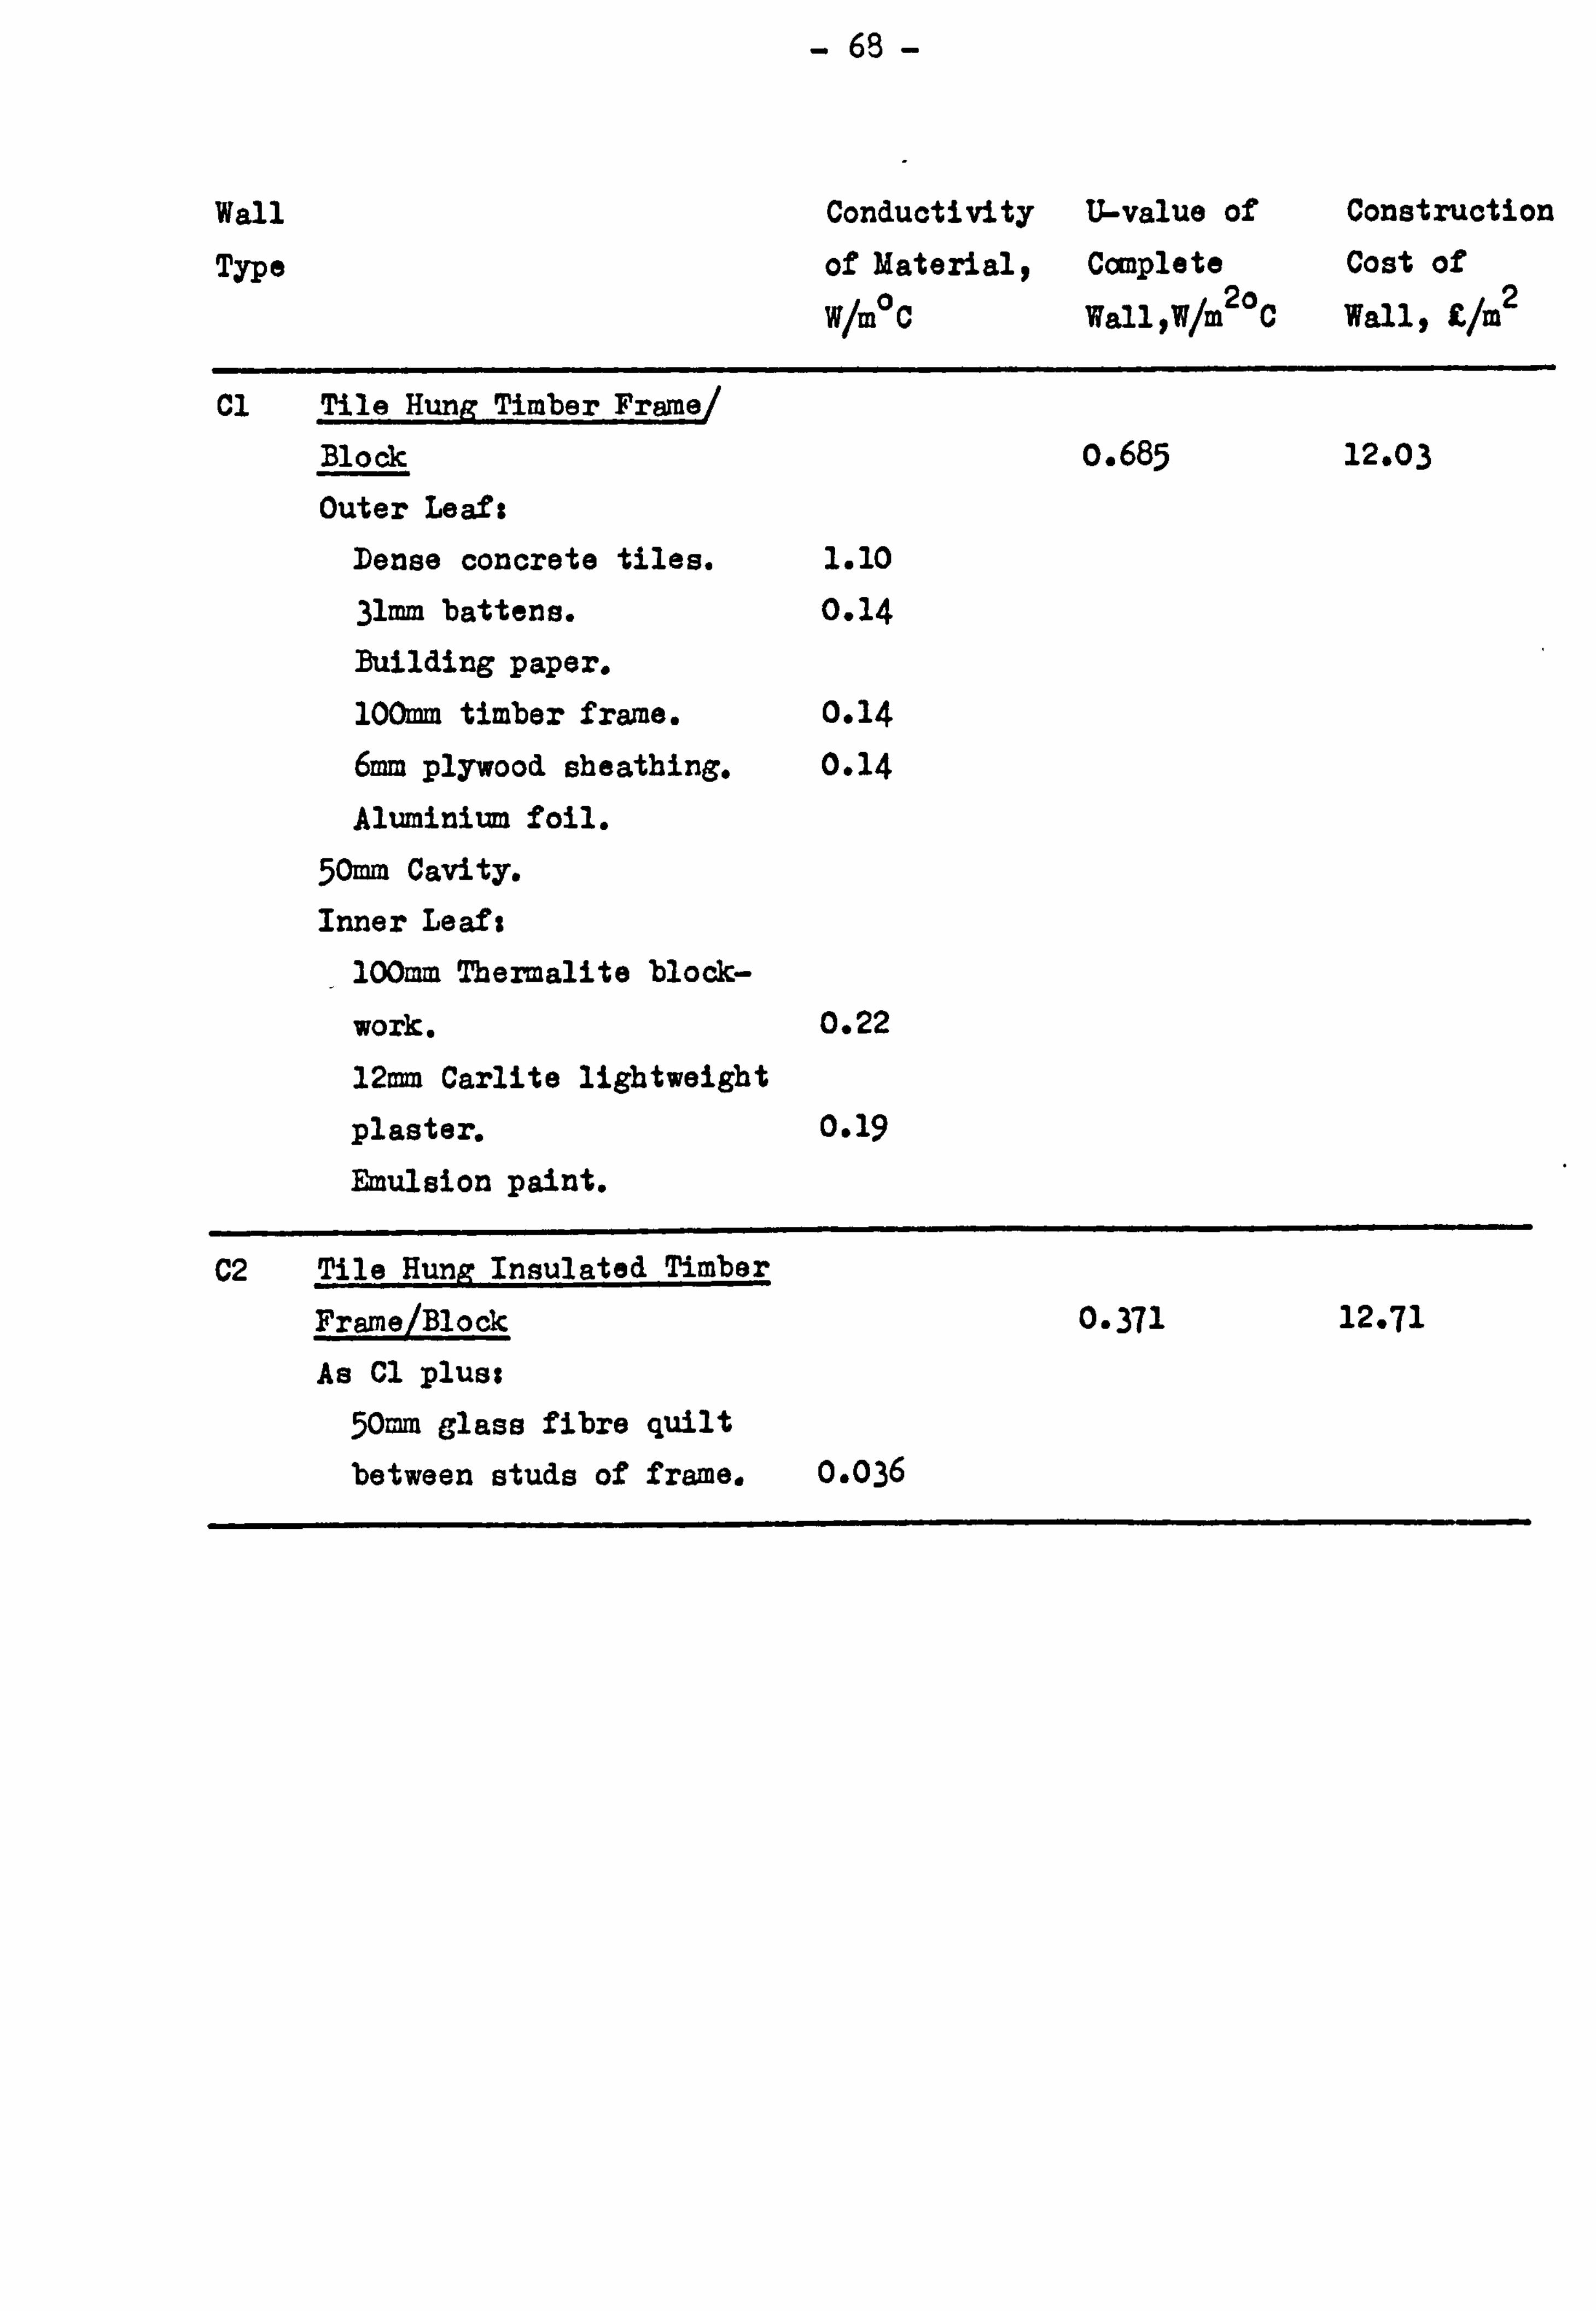
- 68 -
Wall Type
Conductivity
of Materialy
W/Mo C
U-value of Complete
Wall, W/M 2o C
Construction
Cost of Wallp E/m 2
Cl Tile Hung Timber Frame Block 0.685 12-03
Outer Leaft Dense concrete tiles. 1.10
31mm battens. 0.14 Building paper. 100mm timber frame. 0.14 6mm plywood sheathing. 0.14
Aluminium foil.
50mm Cavity. Inner Leaf %
100mm Tbermalite block-
work. 0.22 12mm Carlite lightweight
plaster. 0.19 Emulsion paint.
C2 Tile HunR Insulated Timber Frame/Block 0-371 12-71 As Cl plust
50mm glass fibre quilt between studs of frame. 0-036

- 69 -
Table 3-3.2 Fuel Costs and Overall Costs associated with the
Wall Types (November 1975 prices).
Wall Annual Overall Cost: Type Fuel Costp (Construotion
r , /m2 Cost) + 10 x
(Annual Fuel Cost)p E/m2
For 15 0C For 20 0C For 15 0C For 20 0C
Using ELECTRICITY (night rate White Meter)
Al o. 637 1.124 20-55 25-42
A2 0-557 0.983 19-94 24.20
A3 0-550 0.971 20-71 24.92
A4 0.469 0.828 20.09 23.68
A5 0.209 o. 368 17-47 3.9.06
B 0.265 0.468 17.26 19.29
cl 0.370 o. 654 15-73 18-57
C2 0.201 0.354 14-72 16.25
Using NATURAL GAS (Gold Star)
Al 0.396 0.700 18.14 21.18 A2 0-347 0.612 17-84 20.49 A3 0-342 0.604 18.63 21.25 A4 0.292 0.516 18.32 20-56 A5 0.130 0.229 16.68 17.67
B 0.165 0.291 16.26 17-52
cl 0.231 0.407 14-34 16.10 C2 0.125 0.220 13.96 14-91

- 70 -
3.4 PITCHED ROOF
3.4.1 Overall Costs at May 1976 Prices
The economics of adding various thicknesses of glass fibre quilt
insulation to a pitched roof will now be considered. The costs used
initially are those operating in May 1976. At that time the price of
natural gas on the Gold Star tariff was still the same as in ]December
1975t and the corresponding cost of useful heat can again be obtained
from Table 3.2.2 . The night rate for electricity supplied on the White,
Meter tariff in West Yorkshire had, howeverp increasedt as can be seen
from Table 3.2-3-
The report 54
of the Bradford Energy Efficient Design Group
includes construction costs for various types of roof at May 1976 prices*
For a concrete-tiled roof (Figure 3-4.1 ) with a pitch of 22joy trussed
timber rafters at 600mm centres incorporating 100 x 38mm spare and joistsy
75mm thick glass fibre quilt laid between the joists on a 12-7mm thick
plasterboard ceilingf and with 38 x 25mm tile battens on sarking felty
a cost of E10-14 per square metre of plan area is given.
In order that the effects of varying the thickness of the insulation
may be evaluated, the costsin materials and labour of adding the various
thicknesses of glass fibre quilt then available have been found. Table
3-4-1 has been constructed using material costs from 'Spon's Architects'
and lbilders' Price Book 1 61
and 'Building' 62
and allowing for 5,04
waste. The numbersof hours of labour required for laying the various
thicknesses are based on data used in the I Cost File' 63
published in-
'Building'. Labour has been costed at an all-in rate of El-44 per hourp
a typical rate for West Yorkshire at the time.

- 71 -
Table 3-4-1 Costs of Adding Various ThicIcnesses of
Glass Fibre quilt Loft Insulation (May 1976).
ThicIcness of Layer Cost of Labour Cost of Total Cost
of Insulationp Materialp Requirement, Labourp of Adding Layer
mm incl. Wastep h/M 2 E/M 2 of Insulationp
2 r/M2 E/M
25 0-35 0.15 0.22 0-57 50 0-59 0-15 0.22 0.81 75 0-83 0.20 0.29 1.12
100 1-07 0.25 0-36 1-43
The costs of adding layers of insulation have been used to find
how the cost of the roof structure originally considered would vary if
different thicknesses of insulation were incorporated. The cost of the
roof if the glass fibre were omitted completely wouldq by subtraotionp
be L9.02 per sqxre metre. The cost of the roof with one or more layers
of insulation can be found by adding the costs for the layers to this
basic price.
For a given overall thickness of insulationg the lowest total
cost is achieved by using the minimum number of layers and avoiding use
of the 25mm thickness where possible. The resulting construction costs
for the roof structure insulated with a range of overall thicknesses of
insulation are given in Table 3-4.2. Also included are the U-values
based on plan areat the thermal conductivity of the glass fibre insulation
being taken as 0.040 W/mOC. 'Bypassing'of insulation is assumed negligible.
The U-values have been used to calculate the annual fuel costs
0 for beating to 15 and 20 C, costs of useful heat from night period
electricity and natural gas at May 1976 prices being taken from Table
3.2-3- Overall cost has again been obtained by adding ten times the

- 72 -
annual fuel cost to the construction cost. The resulting costs are
given in Table 3.4-3, and overall cost is plotted against insulation
thickness in Figure 3.4.2 . For a given fuel and temperature
combination, the lowest overall cost figure is starred in the tablep and
the corresponding point on the graph is circled.
For all four combinations of fuel and temperaturep the addition
of a 25mm thick layer of insulation to the uninsulated roof structure
results in considerable reductions in overall cost. So long as the use
of the next greater thickness of insulation involves an increase in the
construction cost which is less than ten times the accompanying saving
in annual fuel costy a reduction in overall cost will result. Eventuallyp
howeverp since the fuel cost savings progressively decrease with each
increase in insulation thicknessp the point is reached where overall costs
start to rise.
For maintaining a temperature of 20 0C using night rate electricity,
the same lowest overall cost is given by 150 and 175mm thicknesses of
insulation. A 100= thickness results in the lowest overall cost both
for electrical heating to 150C and for heating to 20 0C by natural gas.
75mm is the corresponding thickness for heating to 1500 by natural gas.

- '73 -
0 LI)
-a A3 0W 40 L- IE t50%.
A- ... & -D -CA U 11- a Cý -. a Ab vi
E cr% Ab S rE -. 0 E :§F. . 2ý . 00 Qlz it to
A ft. tn cz IE
cn C14 E
c Go H in
---
a..
a --
--
P. 4
i lle en ) 1.
r

- 74 -
Table 3.4.2 U-vajues and Construction Costs of the Roof
Structure for Various Thicknesses of Glass
Fibre quilt Insulation (Mayq 1976 prices).
Thickness of U-valuev Number of Layers Construction
Insulation, W/m2 oC of Insulation Costp
r EIM /M2
0 1-859 0 9.02 25 o. 86o 1 9-59
50 0-559 1 9.83
75 0.414 1 10-14
100 0.329 1 10-45
125 0.273 2 10-95
150 0.233 2 11.26
175 0.204 2 11-57
200 o. 181 2 11.88
225 0.162 3 12-38
250 0.147 3 12.69
275 0-135 3 13-00
300 0.124 3 13-31

- 75 -
Table 3.4-3 Fuel Costs and Overall Costs associated with the Roof
Structure for Various ThicImesses of Glass Fibre Quilt
Insulation (MaY 1976 prices).
Thickness Annual Overall Cost:
of Fuel Costp CConstruction
Insulationp /M2 Cost) + 10 x mm (Annual Fuel Cost)q
e/M2
For . 15 0C For 200C For 15 0C For 20 0C
Using ELECTRICITY (night rate White
Meter) 0 1.124 1-985 20.26 28*87
25 0-520 o. g18 14-79 18-77
50 0-338 0-597 13.21 15-80
75 0. *250 0.442 12.64 14-56
100 0.199 0-351 12-44* 13-96
125 0.165 0.292 12.60 13-87
150 0-141 0.249 12.67 13-75*
175 0.123 0.218 12.80 13-75*
200 0.109 0-193 12-97 13.81
225 0.098 0-173 13-36 14-11
250 0.089 0-157 13-58 14.26 275 0.082 0-144 13-82 14-44
300 0-075 0-132 14.06 14.63
USING NATURAL GAS (Gold Star)
0 0.626 1ý105 15.28 20-07 25 0.289 0-511 12-48 14-70 50 0.188 0-332 11-71 13-15
75 0-139 0.246 11-53* 12.60
100 0.111 0-195 11-56 12*40*
125 0.092 0.162 11-87 12-57
150 0-078 0-138 12-04 12.64
175 0.069 0.121 12.26 12-78
200 0.061 0.108 12.49 12.96
225 0.055 o. o96 12-93 13-34
250 0-049 0.087 13-18 13-56 275 0.045 m8o 13-45 . 13-80
300 0-042 0.074 3.3-73 14-05

- 76 -
Figure 3.4.2 Overall Cost associated with the Roof structure
against Thickness of Glass Fibre Quili Insulation (May 1976 prices).
Iq 4%
4. )
-I
0
@C EL4ctrieitj6 000,
Gas, 20 C Aw
ISO 200 2SO Insutation Thickness, mm.

- 77 -
3.4.2 Combined Costs for the Roof Structure at Various Times
Combinations of cpital and fuel costs operating at a given point
in time can be used to assess the economic attractiveness of incor-
porating various levels of insulation at that time. Use has already
been made of the 'overall cost1q consisting of the total construction
cost of the insulated structure plus ten times the annual fuel cost at
the fuel prices operating at the time. A 'combined cost1v consisting
of just the cost of incorporating the insulation plus ten times the
annual fuel cost can be uced as an alternative. It will lead to the
same comparisons between the levels of insulationy since it merely
omits the cost of the uninsulated structure from the total.
Such a combined insulating and fuel cost has been calculated for
the prices operating during a nunber of periods from . 1970 onwardsp in
order to assess the attractiveness of various thicknesses of loft
insulation to the potential user at these times. All-in hourly rates
for building labourersp ýbich include allowances for bonus paymentog
National Insurance contributionsp holidaysp supervision, lost time and
othe; necessary expenseep were obtained for the earlier periods from
appropriate editions of 'Spods Architects' and Builders' Price 61
Book' as were the pricesp including deliveryp of the generally available
thicknesses of glass fibre insulating quilt. From April 1973 onwardst 62,64
the required rates and prices were given in 'Buildinglt usually in
the first issue of each montht and use has been made of these.
The cost of adding a layer of insulation has been found as beforeý
allowing for 5% waste and using the labour requirements given in Table
3-4-1 for laying 259 50P 75 and 100r= thicknesses. 60 and 80mm
thicknesses replaced 50 and 75mm early in 1978- It has been assumed

- 78 -
thatq in each case, the slight increase in thickness did not affect the
time taken to lay the insulation. The costs obtained for adding layers
of insulation of the thicknesses which were generally available are
given in Table 3-4-4 9 along with the labour rates and the prices of
glass fibre quilt. The insulating costs already used for May 1976t which
also apply to April 19769 are included in the table. The costs given
in the table for adding layers were combined so as to obtain the lowest
insulating costs for greater thicknesses.
Annual fuel costs associated with the roof structure in the West
Yorkshire region have been assessed for night rate electricity obtained
on the VvIaite Meter tariff, andy from when it became available in October
1978, on the Economy Seven tariff. They have also been assessed for gas
obtained at the lowest price per therm charged at the time to domestic
consumers by the Gas Board operating in the region (North Eastern Gas).
This lowest rate applied to both natural and manufactured gas supplies
up to December 19701 but to natural gas only thereafter. Costs of use: 911
heat at the time of assessmentp on the basis of 100114* efficiency for
electricity and 70% for gas, have been obtained from Table 3.2-3 P and
annual fuel costs have been calculated as before for heating to 15 and
20 0 C. The results are presented in Tables A 1.1 to A 1.4 in AppendLxl.
Combined insulating and fuel costs were then calculated for those
periods for vMch both the insulating costs and the annual fuel costs
had been assessed from the prices and rates operating at the time. The
combined costs obtained are given in Tables A 1-5 to A 1.8 in
Appendix 11 and are plotted against insulation thickness in Figures
3-4.3 to 3-4-7. For a given fuelp temperature and periodl the lowest
combined cost figure is starred in the tables and the corresponding point
on one of the graphs is circled.

- 79 -
Table 3-4.4 Labour Ratest Prices of the Generally Available Thicknesses of Glass Fibre Quilt Insulationg and Total Costep including Waste and Laboury of Incorporating such Insulation in the Roof Structure.
All-in labourer rate (CLIh)
(f 2) ,m Price /I of glass fibre quilt
insulation of thickness: 25mm 50mm 75m
Total cost (f 2) of adding a layer ,
/M
of insulation of thickness: 25mm
50m 75mm
All-in labourer rate (f. /h)
Price ( LIM 2) of glass fibre quilt
insulation of thickness: 25mm 50mm 75mm
loomm Total cost ( E/M 2)
of adding a layer
of insulation of thicknesss 25mm 50mm 75mm
loom
All-in labourer rate (E/h)
rrice, (E/m 2) of glass fibre quilt
insulation of thickness: 60mm 80mm
100mm Total cost ( E/M 2).
of adding a layer
of insulation of thickness: 60=
80mm loomm
May-Jun May-Jun 1970 1272
0-55 0-59
0.13 0.16 0,24 0.28 0.34 0.41
0.22 0.26 0.33 0.38 0-47 0.55
Jul 7 3-- Mar-Apr Apr-May May 74 1975 1976
1.02 1-36 1-44
0.23 0.25 0-33 0-36 0.40 0.56 0-50 0-55 0-79 0.64 0.70 1.02
0.39 0-47 0-57 0-53 0.62 0.81 0.73 0.85 1.12 0-93 1.08 1-43
Oot 78- Jun 79
Nov 79- Mar 80
2-07 2-42
0-71 0.87 0.94 1.14 1-13 1-40
l. o6 1.28 1.40 1.68 1.70 zos

- 80 -
Figure 3.4.3 Combined Cost associated with the Roof Structure
against Thickness of Glass Fibre Quilt Insulation.
For heating by Night Rate WHITE METER SOCTRICITT to _15
OC.
«44. jü 1
406)
cl 3
H
E 0
L)
\\
0
cý ,
je
A mIr ,m'
do,
10
W. . 0..
-
Thickne-u, mm. so ibo ISO 200
InsliLdElon

- 81 -
Figure 3.4.4 Combined Cost associated with the Roof. Structure
against Thickness of Glass Fibre quilt Insulation.
For heating by Night Rate WHITIC NST19R ILICTRICITT to 20 0c
II. '
41 d
�4
11 . Lr 4A
LZ
C
C
1-4
-v dk)
JE
oc,
Ir
Oct 13 14
-sun
ISO 250 IASUtdum Thickness, im m.

- 82 -
Figure 3.4.5 Combined Cost associated with the Roof Structure
against Thickness of Glass Fibre Quilt Insulation.
For heating by Night Rate XCOROMT SEVS1 ELLrCTRICITT.
44 .
- IE
Uli
q3
C
-U
C
H
-Cb lE
4
rvt- 20 T, Nov 71
For 20 Oct 7tg-ýMaj ý71
or 15 IC, Nov 71-Mar I
For IS T, Oct 78 7
1000 .0
ISO 200 250 Insut4tion Thickness, mrA,

- 83 -
Figure 3.4.6 Combined Cost associated with the Roof Structure
against Thickness of Class Fibre Quilt Insulation.
For heating by CHEAPEST DOMESTIC GAS to 15 OC.
N
IE
S
-U 'I 0
Q
d!
Itr% c
. -a .U
H
-%x
u
\
\\
00
Ilk -t lo;; -*,
en
mf
,I op
15
0-1 1*-, -- . 00 00,
-, ý, '17 Sol% dOp tA
OOV 0.
100 ISO 200 2so
Insutation Tbickness, mm.

- 84 -
Figure 3.4-7, Combined Cost associated with the Roof Structure
against Thickness of Glass Fibre Quilt Insulation.
For beating IW CHSAPEST DOMESTIC GAS to 20 0 C.
__j Go tz
-I. )
-Il
1 C
�I C
-Q E 0
(-)
I I'
'I \\
. l% 0
*lex -JIK
&- wp f. e69 "
p, pf
. -0 -4-
146 14 lot
sun Ton
I! IIII 0 so too lio 200 2SO Inisatation Thickness, mm.

- 85 -
3.4-3 Comparison of Combined Costs for the Roof Structure
It is clear that the installation of at least some roof insulation
has been most attractive in all the periods consideredp since the com-
bined cost would be much reduced in all cases ty installing the thinnest
layer of insulation considered. It can be seen that the use of thicker
layers would result in further reductions in the combined cost for
thicknesses up to at least 75 or 80mm.
The thickness of insulation required for the lowest combined cost
for electrical heatingto either temperature was affected by the large rise
in electricity prices between April 1974 and April 1975v which represented
a particularly high percentage in the case of the night rate of the White
Meter tariff. As a result there was a substantial increase in this rate
for electricity relative to insulating costs9 and the high relative level
has persisted. The effect of this has been thaty while the lowest cm-
bined cost for electrical heating to 15 0C for the periods up to April 1974
can be seen to have been for a 75mm thickness of insulationg for the
periods from April 1975 onwards it was for a 100mm thickness. This was
the case for night rate electricity obtained on the Economy Seven tariff
from when it became availablep as well as for that supplied on the White
Meter tariff. For heating by night rate White Meter electricity to 20 0 Ct
the thickness for the lowest combined cost increased from 100 or 125mm
for the earlier periods to 150P 160 or 175= for the later ones. Even
for the Economy Seven tariff in the two periods considered since it was
introduced in October 1978P the lowest combined costs for heating to 200C
were for a substantial thickness of 140mme
For the cheapest available domestic gasp howeverv there was a
tendency for the price to fall relative to the insulating costs during

- 86 -
the first few years of the decade as natural gas was coming into increasing
use. It remained fairly steady relative to the insulating costs from then
on. As a result the insulation thickness giving the lowest combined cost
for heating to 20 0C by gas fell from 150mm for May-June 1970 to 125mm for
May-June 1972s to remain at 100mm for all the later periods considered.
The changes bad less effect for heating to 150C by gasq for which the
lowest combined cost was for the 75mm thickness for all the periods con-
sideredp except that for the January to May 1974 assessment the combined
cost for 100mm was equally low. For the earliest two periods considered,
75mm Class fibre quilt was the thickest that was generally availablep and
a 100mm thickness hasy thereforep been costed on the basis of two layersq
making it relatively unattractive.
It can be seen that. for the latest two periods consideredg c=bined
costs increase less than 11% from their minimum values when a thickness
of insulation is used which is 40mm greater than that for the minimum.
Use of the increased thickness would result in considerable additional
energy savings over the life of the building with little increase in com-
bined cost. It would be unattractive to the building user because of
this calculated cost increasep but would be encouraged by rapidly rising
fuel prices or some extension of the present limited subsidy scheme for
roof insulation. Subsidies are unlikely to become available in such a
case, since they give the best return in terms of energy saving if applied
to limited thicknesses of insulation being installed in lofts which
previously had none. Fuel prices may well rise at a high rate, boweverv
and the Government is at present attempting to ensure that gas prices
rise considerably faster than the rate of inflation*
3.4-4 Further Changes in the Economics of Roof Insulation
For the periods considered in the cost assessments, the

- 87 -
insulating costs for the roof structure have been roughly proportional
to the all-items Retail Price Index 55
at the time, and it seems
reasonable to expect them to continue to increase in line with general
inflation. In April 1980, the cost of adding a layer of glass fibre roof
insulation increased by about 6-21% from the November 1979 to March 1980
level due to increases in material prices. The cheapest rate for domestic
gas increased at the same time by 17%, and it is the Government's policy
that domestic gas prices should rise by IN, a year in real terms.
So the price of gas for house heatingrelative to insulating costs,
rose by about 10% in April 1980p and the ratio may be expected to increase
by a further 10% each year. By April 1984 the ratio of gas price to
insulating cost should have increased to about 1.6 times its value for
the period November'79-March 180p and gas should be in much the same
position relative to insulating costs as was night rate Economy Seven
electricity in that period. In two further years its relative position
would become that of night rate Tlite Meter electricity in the earlier
period. As a resultv considerably greater thicknesses of insulation
would become attractive for heating by gasp and additional layers' could
be installed in pitched roofs of buildings already in use.
The night rates for*electricity increased by 20, Pof in April 1980
and by a further IN, $ in September 1980, and are thus leading the general
rate of inflation and making greater thicknesses of insulation more
attractive in electrically heated dwellings.

- 88 -
3-5 SOLID GROUND FLOOR
Heat lost from the interior of a building through a solid ground
floor follows curved paths of the following general appearance: j5
The heat fluz throu& the surface of the floor is much greater near the
walls than well away from themv and the flux through the wall below
ground level decreases with increasing depth.
If insulation is used as a horizontal layer it is nomally afforded
protection from concentrated loads by being laid underneath the concrete
floor slab* In such a case it is desirable that the insulation be turned
up at the edges to insulate the edge of the floor slab from the adjacent
wall. Because heat flow is largely concentrated near the edge of the
floor, there will be little loss in effectiveness if the insulation
extends only one metre inwards from the edgest fo=ing a one metro wide
horizontal strip lying Just within the external walls. Such an arrange-
ment uses less insulation material than overall insulationp but has the
disadvantage of introducing a step into one of the structural layers.
An overall layer of insulation involves no such complication and may

- 89 -
wall be-more economic for relatively narrow floor slabs such as those of
houses.
Floors can also be insulated using a vertical strip of insulation
just within the external wallsp preferably extending from floor level
down to a depth of at least 250mm-
3.5.1 Overall Costs at May 1976 Prices
The report of the Bradford Energy Efficient Design Action GrouP54
has been used as the source of the construction costst at May 1976 prices,
of a solid ground floor in both uninsulated and variously insulated forms,
as shown in Fi&"Ire 3-5.1 -
The Building Research Station Digest 65
on ground floor heat losses
gives average U-values for uninsulated solid ground floors of various
dimensions. They are based on a formula derived by Macey. 66 Using a
network analyser to produce an electrical analogue of the situation for
typical British winter conditions, Billington 67 obtained results which
were in reasonable agreement with Macey'sp and which seemed to be consistent
with full-scale test floor data. Billington also simulated the addition
of vertical edge insulation extending to various depths. The material
added to the analyser allowed no current to pass through it andq therefore,
represented 'perfect' thermal insulation. Results from the analyser were
used to estimate the effect on'average U-value of adding edge insulation
of high thermal resistance to a solid ground floor. The Digest 65
proposes the use of such results for assessing beat losses.
By way of example, the dimensions of the ground floor slab considered
here have been taken as 7-5 x 15 mp and it is assumed to be surrounded
by four external walls. It therefore approximates to the complete

- 90 -
floor slab of a pair of semi-detached houses. For the uninsulated case,
the effective U-value has been obtained direct from the Digest. The
corresponding effective resistance has been obtained by taking the
reciprocal of this value, andpfor the cases of overall insulationg the
resistance of the insulating layer has been added. This is the method
proposed in the Digest for finding the approximate value of the effective
resistance of the insulated floorp the new U-value then being found by
taking its reciprocal.
The Digest does not specify the effect of edge insulation on the
size of floor considered herep butfor the addition of vertical edge
insulation extending to a depth of 0.5mfit proposes reductions in U-value
of 12% for a floor which is 15m square and 15% for one which is 7-5m
square. Sol for the 7-5 x 15m slab considered here, the average U-value
has been assumed to be 1-3% less than for the uninsulated case. For
edge insulation to a depth of a metrej reductions of 20% and 25% are
given for 15m square and 7-5m square floorep respectivelyt and the
reduction for the 7-5 x 15m floor slab has been taken as 22%. The use
of 50mm thick expanded polystyrene board for the edge insulation strip
has been considered as an example of this technique*
Provision of edge insulation generally requires considerably less
insulation material than overall insulation. For the 7-5 x 15M floorp
edge insulation to 0.5 and I. Om depths requires about 1/5
and 2 /5 as
much materialy respectivelyp as a complete layer of the insulation. It,
has been assumed that there is a proportionate reduction in the cost of
incorporating the insulation. The case of insulation by incorporating
two complete layers of 50mm thick expanded polystyrene has similarly
been taken to have an insulating cost twice that for a single complete
layer of the material.

- 91 -
The resulting U-values and construction costa are given in Table
3.5-1. Fuel costs associated with the annual heat loss through the
floor have again been calculated for heating to 15 and 20 0C (assuming
no under-floor heating is involved), the costs of useful heat from
night period electricity and natural gas in May 1976 being taken from
Table 3.2-3- Overall costs were found bS in each Casey adding ten
times the annual fuel cost to the construction cost. The annual fuel
costs and the overall costs obtained are given in Table 3-5.2. The
overall costs are also plotted in Figure 3-5*2 . Again the lowest over-
all cost figure for each fuel and temperature combination is starred in
the tablep and the corresponding point on the graph is circled.
It can be seen that incorporating a complete layer of 25 or 50mm
thick cork board or 25mm thick mineral wool slabs results in higher ove]P-
all costs than for the uninsulated floory when heating to either tempera-
ture using either fuel. These types of insulation arep tbereforep
unlikely to be economic for a floor slab of the size considered. The
inclusion of a 50mm thick layer of expanded polystyrenev however,
reduces the overall cost except in the case of heating to 15 0C using
natural gas. If two such layers are incorporatedy overall costs are
increased compared with the single layerp and only for the case of
electrical heating to 20 0C is the overall cost still less than for the
uninsulated floor.
If 50mm expanded polystyrene is used instead to provide a vertical
strip of edge insulation to a depth of 0-5mo the overall cost is less
than for the uninsulated floor in all four cases. There are further
reductions in overall cost if the insulation extends to a depth of 1.0m
except in the case of heating to 15 0C by natural gasp for which there
is an increase in overall cost to a little above the value for the

- 92 -
uninsulated floor.
Of the various methods of insulation consideredq the single complete
layer of 50mm thick expanded polystyrene gives the lowest overall cost
except when heating to 15 0C by natural gas. In this caset only the edge
insulation to a depth of 0-5m, gives any reduction in overall cost from
the uninsulated valuep and this reduction is too small to be of practical
significance.

- 93 -
Figure 3.5.1 Solid Ground Floor
Uninsulated
floor LEW SOMM SWACACA& SCMCJ
woueove of ISOjný reinfercel coAcreke stsý v"queen $WE SOINN hMSUff
15 0 am bdrj cort
With Complete Layer of Insulation (Overall Insulation)
of 000000 00 00 oo 0 ove ec
00000je ei 0 ORF eop, ei Ofod 9 v00000 0 000 000V OOCP#oo A p0 ;pZ. Vt, P. u»f. gL 0 e-0 ' tv %0ý
0 de 0
Tites
R. C. stib, , -Insut&Elon visolleen sh"b
Harhore
Tdes scred I R-C. St4b -ViSJU49A Sh". 6
BUnding flarkore
T-nsubitlon ýwater resistoot)
'/4
Witb Vertical Edge Strip Insulation

- 94 -
Table 3-5-1 Thermal Characteristics and Construction Costs of the Solid Ground Floor incorporating Various Types of Insulation. (For floor slab 7-5 x 15m- May 1976 prices)
Insulation Conductivity Effective Construction
of Insulation U-value Cost of Materialp of floorp floorp
W/mO C W/m2o C Om 2
None 0.62 10-57
COUPLETE LAYER
25mm cork board 0-042 0-453 12-77 25mm mineral wool slabs 0-036 0-433 13-14 50mm cork board 0-042 0.357 14-78 50mm expanded polystyrene 0-037 0-337 11-85
2 layers of 50mm expanded polystyrene 0-037 0.232 13-13
VERTICAL EDGE STRIP
50mm expanded polystyreneg 0-5m in depth 0-037 0-539 10-83
1.0m in depth 0-037 0.484 3.1.08

- 95 -
Table 3-5.2 Fuel Costs and Overall Costs associated with the Solid
Ground Floor for Various Types of Insulation. (For
floor slab 7-5 x 15m- May 1976 prices)
Insulation Annual Fuel Cost,
f. /M 2
For 15 0C For 200C
Overall Costt (construction
Cost) + 10 x (Annual Fuel Cost),
x/M2
For 15 0C For 200C
Using ELECTRICITY (night rate 'White Meter)
None 0-375 0.662 14-32 17-19
COMPLETE LAYER
25mm cork board 0.274 0.484 15-51 17.61
25mm mineral wool slabs 0.262 0.462 15-76 17-76 50mm cork board 0.216 0-381 16-94 18-59 50mm expanded polystyrene 0.204 0-360 13.89* 15-45* 2 layers of 50mm, expanded polystyrene 0.140 0.248 14-53 15.61
VERTICAL EDGE STRIP 50mm expanded polystyrenep
0.5m in depth 0.326 0-576 14-09 16-59 l. Om in depth 0.293 0-517 14-01 16.25
Using NATURAL GAS (Gold Star)
None 0.209 0-368 12.66 14.25
COMPLETE LAYER 25mm cork board 0-152 0.269 14.29 15-46 25mm. mineral wool slabs 0-146 0.257 14-60 15-73. 50mm cork board 0.120 0.212 15*98 16.90 50mm expanded polystyrene 0.113 0.200 12.98 13-85* 2 layers of 50mm. expanded polystyrene 0-078 00 '138 13-91 14-51
VERTICAL EDGE STRIP 50mm expanded polystyrenep
0.5m. in depth 0.181 0-320 12.64* 14-03 1.0m in depth 0.163 0.288 12-71 13-96

- 96 -
Figure 3.5.2 Overall COBts aBSOciated with the Solid Ground Floor for Various Types Of Insulation.
(For floor slab 7-5 x 15 m- May 1976 prices.
ý4 C
k-)
-I
Non& plas EJje, 1 . 7. to depth to depib C omýete CMI6
vCf 0 Sm of 1-0)" Layer Logmsj
, V- so. thick
ExpmW Potystyrene BwJ
25 mon 25 MA 50#,,,, Cork MinerAt Cork Board Woot Stabs Board
v CofrTlete LAyer
InsuLation.

- 97 -
3-5.2 Combined Costs for the Solid Ground Floor at Various Times
Of the materials considered for insulating the solid ground floory
the 50mm expanded polystyrene board would appearp on the basis of the May
1976 costingst to be tbe. most economically attractive. Combined insulating
and fuel costs for the floor insulated with this material in the various
ways have been found for a number of periods from 1971 onwards.
The all-in hourly rate for a labourer from June 1971 to August 1972,
and pricesy including deliveryp for low density expanded polystyrene board
up to April 1978 have been obtained from appropriate editions of Spon's
Architects! and Builders' Price Bookýl Rates and prices for later dates 62,64
are from issues of 'Building'@
It has been assumed that the insulation material requirement for
incorporating a single complete layerv including the 'turn-ups' round
the edge and wastet is 10% greater than the area of the floor. The
operation has been assumed to require 0-35 hour of a labourer's time per
square metre of floor area. The total cost in material and labour of
the single complete layer has then been used to find the costs of the
other methods of insulating using the same material. It has simply been
doubled to give the cost of incorporating two complete layers, andp as
nefore for this floor of dimensions 7-5 x 15my multiplied by 1/5 and
2/5
to give the costs of including vertical edge insulation extending from
floor level down to depths of 0-5 and 1.0m respectively. The insulating
costs obtained are given in Table 3-5-3 v along with the all-in labour
rates and the prices of 50mm expanded polystyrene board. The insulating
costs implied by the costs already used for May 19769 which also apply
to April 1976p are included in the table.
Annual fuel costs associated with the floor in the West Yorkshire

- 98 -
region have been assessed for the various levels of insulation using
U-values from Table 3-5-1 , the previously-derived factors for heating to
15 and 20OCp and the costs of useful beat from Table 3.2-3- In this way
fuel costs were found for beating at 100% efficiency using electricity at
the night rate of the Z12ite, Meter tariff andp when available, the Economy
Seven tariffp and at 70% efficiency using gas at the cheapest domestic
rate charged at the time by North Eastern Gas. For the periods considered
for the ground floory this cheapest rate for gas applied only to natural
gasp the cheapest rate for manufactured gasp while it was still being
suppliedp being about 1/3 p/therm higher.
Annual fuel costs ca3=lated from the rates operating in a number of
periods during which both the cost of insulating, as previously calculatedp
and the price of the fuel remained steady are given in Tables A 1.9 to
A 1-13 in Appendix 1. The combined costsp each found by adding ton
times the annual fuel cost to the insulating costp are presented in the
same tables and are plotted against the level of insulation in Figures
3.5.3 to 3.5.7 - Again the lowest combined cost figure for a given fuelp
temperature and period is starred and the corresponding point on one of
the graphs is circled.

- 99 -
0 u
F4 0
01% Ll-
8 CM 0 r-4 Cli %D H
0 ri
FT4 0 Cý Cý
4ý 0
E-4 8
tl- r- r- LC% rn %0 %lo N 9 0 9 00 rn %. 0 10 rn
Id 43 0
ý? cli
0 C; c; r4 'A
rl o 0 r-I
-r-I 0 4ý C/2 Cd
V -! ý
co 0 co 9 V-4 fl
f-4
5 A I- r- L % 0
w 4-3 Cr%
0 0 -ri
P4 . Cq t-- Ict UIN l c Vý 4ý 4 r. - u l
ca r Cd
ON r-I
C; Cý r.
i m
4) W $4
4a m -8 1: 4 %. 0 r-4 -ýo
C-i r-4 tcl%
CC) cli
%0 WN t*8 r-
r-4 0
:5 m P,
ON rl C; cz
pw
Id 4)
ý?
-H 1ý A
rd 43 co r-I
P4 -4 U1% %. 0 co ,,, u a4 Q t-- rn %0 C li 0 cli
A4 0 m cis
(7% --I r4
4
rA U-% 0
04
0 0 ci co C\l l . 4-v VH F-4 0 %lo cli r. -I c i
0 m ON o Cý
0 0
0 r-4 44 0 to cc
14-4 r", r-
C'J
-4 L(N rn
1ý0 00
rn tl- $4 Llý r
qj 0 !f
0
F4 P-1 m
cli vi 0
4J m q .,, 0 $3 0 El Ul% S cd pi :3 0 7s r 0
-I 44 wl 0 %-ý
0) 0
-H r 44 co Id
:3 cd 0 +2 H 4-1 4-4 03 0 r--l > 4-2 go 4-4 :3 0 0 14
.0 ca 0 r a
(a k -r-I 15
0 co $3 A A
0) t?
0 ý?
1.4 .
-r-I -H A m CV -r-f 41 44 P 4J $3 13 1: 4 P4 A 6.4 Zý- W
r ID
Id 0
Id 4) ID . -rf 43 4a
1 0 0 4-1 0 0 0 0 ? J3
a 0) 4-1 +3 H H
Ll cd 04 02 k Cý ý r-I CH Pla 0 0 0 9
rn 13
0 4-1 w
U ý4 0 to
i
CD H CD ý. b 0 'd lrj ý 0 H 0 FA pq -4 Cii
r -0 0 P4 0
P-1 E-4

- 100 -
Figure 3-5-3 Combined Costs associated with the Solid Ground Floor
for Various Methods of Insulation with 50 mm thick
Expanded Polystyrene Board. (For floor slab 7-5 x 15 m-)
For heating by Night Rate WHITE METER ELECTRICITYto 150C.
7
IE Nl- -Q 4;
5 1'»
0
L
fz
IE 0
O1
1ýý
None EJ3et 2 Poýptebe to L ar to i pib Layers of 0-5 in of in

- 103 -
Figure 3.5.4 Combined Costs associated with the Solid Ground Floor
for Various Methods of Insulation with 50 mm thick
Expanded Polystyrene Board4For floor slab 7-5 x 15 m-)
For heating by Night Rate WHITE METER ELECTRICITY to 20 0 C.
Ale Lr-
c V
-u
ri
--in E 93
Q
10
t4! r 17.
ý,. pr -MG9 IU
Ar '75
1t
None E le, C154w. 2 ComAete to api h to k'th 6yer Layers p
of 0-5, n of I-om
'78

- 102 -
Figure 3-5-5 Combined Costs associated with the Solid Ground Floor
for Various Methods of Insulation with 50 mm thick Expanded Polystyrene Board. (For floor slab 7-5 x 15 m-)
For heating by Night Rate ECONOMY SEVEN ELECTRICITY.
9
97-
lcr% Z ju q3 ý- ýD
'3-
0
- None
20 OC V 8o
EJge, EJ eI Comptete 2- comptae, to &th to
Ycpýh Layer Layers of 0-5 m of I-Om
FOr 15 OCt Okb'78 - Ma q

- io3 -
Figure 3.5.6 Combined Costs associated with the Solid Ground Floor
for Various Methods of Insulation with 50 mm thick
Expanded Polystyrene Board. oPor floor slab 7-5 x 15 v6)
For heating by CHEAPSST DOMSSTIC GAS to 15 0 C.
C4
5
LL 4 -W c:
-63 VI C
H -lu 2
Q)
E 0 ¼. )
0
/
IIa Notie Use, Ejle, I Coln'te Ipu kocgpih to ýe'p Ldyer
of 0-5 m of Vom
2 Col"Ptete ýOyers

- 104 -
Figure 3.5.7 Combined Costs associated with the Solid Ground Floor
for Various Methods of Insulation with 50 = thick
Expanded Polystyrene Board. (For floor slab 7-5x 15m)
For heating by CHEApp: ST DOMESTIC GAS to 20 0 C.
C-
Li!
"43 Aj cr
-V: L 0 C
. -I
E 0 L)
0
0 I
0
None 6
EJ e to
rp-1, h of 0.5 m
tdqep toje"/ýh of Vom
4
comptete, Lauer
4 2 Comptde
Uyers
- 105 -
3-5.3 Comparison of Combined Costs for the Solid Ground Floor
It can be seen from the results obtained for the solid ground floor
that a complete layer of insulation gave the lowest combined cost for all
the periods considered from April 1975 onwards for heating to either temp-
erature with night rate White Meter electricityp and for heating to 20 0C
on the Economy Seven tariff in the two periods considered since it was
introduced. For heating to 15 0C with Economy Seven electricity the
combined cost was lowest for edge insulationy being almost the same for
either depth.
For the periods up to April 19749 the lower price of night rate
White Meter electricity relative to insulating costs meant that, for
heating to 15 0 Cp the use of any insulation in the ways considered increased
the combined cost as assessed on prices at the timep whilep for heating
to 20 0 C, edge insulation to one of the depths gave the lowest figure.
Decisions made on the basis of such costs shortly before the steep rise
in electricity prices would lead to levels of insulation which would prove
to be less than optimum.
The price of gas for central heating remained fairly stable relative
to the insulating costs. As a resultq for all the periods considered,
the combined cost for heating to 15 0C is lowest for either no insulation
or edge insulation to a depth of 0-5my and for heating to 20 0C it is lowest
for either a one metre depth or a complete layer. Since the Government
at present intends that domestic gas prices should rise by 10% a year in
real terms, the combined cost as calculated here may well underestimate
the present value of future fuel costs. It would therefore be expected
that higher levels of-insulation are becoming moro attractive for heating
by gas.
a

- lo6 -
3-5-4 Relationsbip between Combined Cost, Fuel Price and
Insulating Cost for the Solid Ground Floor
In order to obtain a relationship between combined costs, fuel
prices and insulating costs for the various ways of incorporating the
50mm thick expanded polystyrene board in the solid ground floorp let:
the insulating cost for incorporating one complete layer be i qm2p
r the insulating cost for the method of insulation used be Xi /M2P
the mean thermal transmittance of the floor insulated in this way
be U W/m2 o CO
the beat loss per square metre of floor per year be BU gigajoulesy
and the cost of useful heat from the fuel used be f E1W.
12 The insulating cost factor, Xq has values 09 15 9 15 91 and 2 for the
levels of insulation considered above, ranging from no added insulation
to two complete layers of the expanded polystyrene board. The appropriate
value for B depends on the internal and external temperatures through
the year. A value of 0.2037 has been used so far for heating to 15 OC in
the West Yorkshire regionp and 0-3597 for heating to 20 0 C. These values
will again be used.
Now the annual fuel cost, in X/M 29 associated with the beat loss
through the floor for the method of insulation used is given byt
(annual heat los a in Gjllm 2) x (cost of useful heat in EIGJ)
. BUf.
Soj working in units of L/m 2 of floorg the combined insulating and fuel
cost$
c. (insulating cost) + 10 x (annual fuel cost)
a Xi + 10 Buf.
Dividing through by ip
X+ 10 BUf T

- 107 -
Since X, B and U can be regarded, as independent of the time at
which the assessment of floor insulation is made, so will be the relation-
ship between c/i and f/i. The specifio forms of equation 3-5-1 for the
methods of insulating and the heating r6gimes are given in Table 3-5.4
below and plotted out in Figures 3-5-8 and 3-5-9 -
Table 3-5-4 Relationships between c/i and f/i for the Solid Ground
Floor insulated with 50mm thick Expanded Polystyrene
Board in various ways. (For floor slab 7-5 x 15m)
Insulation x u Expression for c/i
.X+ 10 BUf/i
For beating to
15 0C
(B. O. 2037)
None
Edgep to depth of 0-5m
Edget to depth of 1.0m
1 Complete Layer
2 Complete Layers
For heating to
20 0c
(B-0-3597)
2.2 30 f/i
0.2 + 1-939 f/i
0-4 + 1.741 f/i
1+1.212 f/i
2+ 0-835 f/i
At a given point in timey the insulating cost for one complete layer
of insulationg ip has a certain value. So the method of insulation which
has the lowest value of c at the time also has the lowest combined
costq c. The parameter f/i represents the cost of useful heat from the
chosen fuel relative to the cost of floor insulation with one complete
layer of the material used berep and varies with the time an assessment
is made. For either of the heating r4gimes considered, the method of
insulation which gives the lowest value of c/ij and hence the lowest using Table 3-5-4 9
combined cost at the timet can, ýbe found by calculation for any value of
0
0.2
0.4
1
2
0.620
0-539
0.484
0.337
0.232
1.263 f/i
0.2 + 1.098 f/i
0-4 + 0.986 f/i
1+0.687 f/i
2, + 0.473 f/i

- 108 -
f/iq and the result cbeckedv approximately at leastq on the appropriate
graph (Figure 3-5-8 -or
3-5-9) -
For heating to 15 0 Cp the lowest combined cost is for the uninsulated
floor for values of f/i up to 1.21, and from there up to a value of 1.78
it is for edge insulation to a depth of 0-5m. From there on up to a value
of 2.00, the lowest combined cost is for edge insulation to a depth of a
metre. As f/i increases still further, the combined cost is lowest for
one complete layer of insulationy and only sben f/i reaches the value 4.67
does it become lowest for two complete layerse
For heating to 20()C, the lowest combined cost is for the uninsulated
floor up to f/i . 0.69, for a 0.5m depth of edge insulation from there
up to 1.019 and for a metre depth from there up to 1-13. The combined
cost is then lowest for one complete layer of insulation until f/i reaches
the value 2.65, when it becomes lowest for two complete layers.
Values of f/i have been calculated for the periods considered
before for ground floor insulationy and also for April 19809 and are
given in Table 3-5-5 - Me relative sizes of the combined costs for the
various methods of insulation can be found by applying the value of fli
for the chosen fuel at the time to the graph for the beating r9gime
being considered. This is an alternativeg but equivalentq method to
that of calculating the combined costs for the various levels of insu-
lationp as was used earlierg and leads to the same comparisons.

log
rn
LZ
0
C' \.
-
f ---a4T7 277rA(, W-g 1 -j-j-J gf-03 keprrvi- c M-n "li -v " ki e y7" fi4, m">, vvv -glý D rvLrul-o ID

- 110
-' -' A -� -�
. -� ('\
0
rn
C, '
Ei k 4ý 0m WN 0 Plb r-4
? -A r-4 rx. o
rl PLI r-I P4
tR 00 0 "A ri J3 q-4 4-
k 0
4-1 C) 00
Lr-% OD
+. 0
p. I
. 1. *9 19 te I
ED w r. 1
M0 4-
1-1 m M90
rj PC4
\') '1
v) �a..
. Z.
-9
4d ta
; � --'9[yv-7 -`rrvmLo: ) 1 -44) --KOO lvqTwvl
mn , Vrvvi .
4, o rrW -Tr Y"-t r*rý. 7D, fwlwo
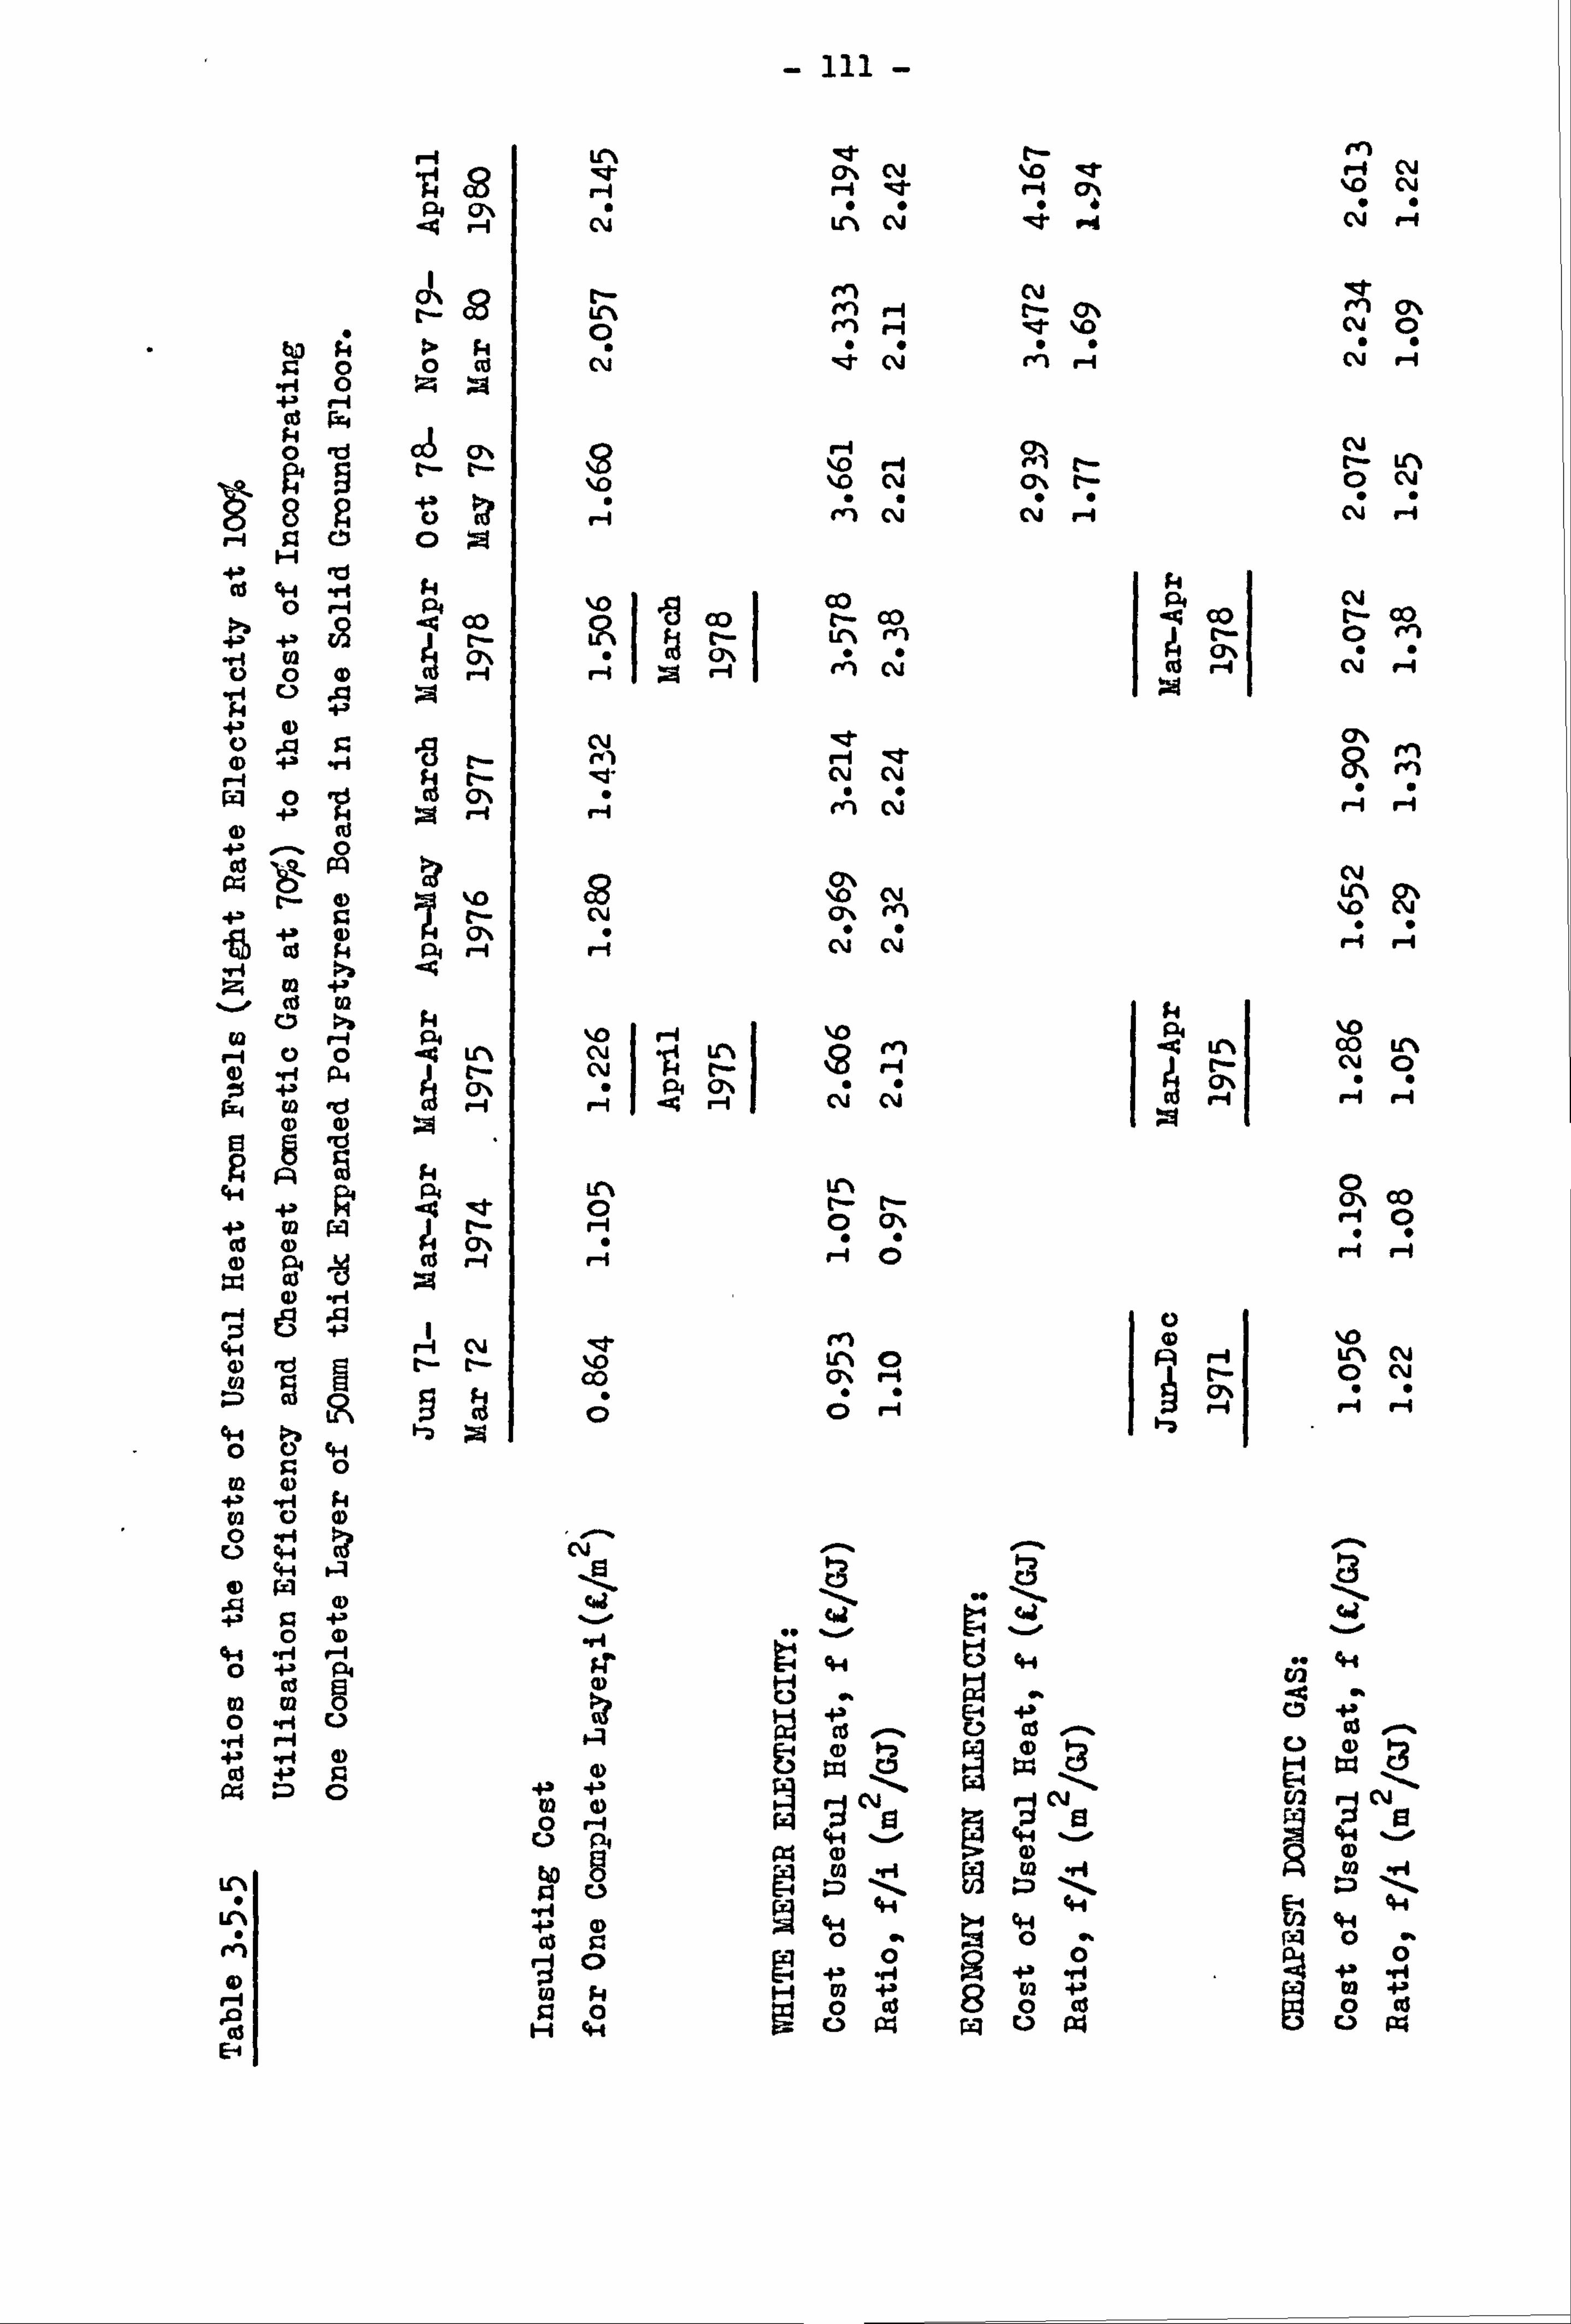
- ill -
r-i vl
Pf
Lr\ -t
ri cy le
11- %D '!
le cy,
6
erl mi i
CY
4 r-i C-4 LA CY le p4 c 1
b3 >
LI- en cli ch
le rl cý
r. . ri p
0 0
r-4
0 Co CY le CY týI r-1 C%i H
,e
Cd A 0 ý4
8
pq
5
2 CA t-
4" »I CY, t-
e
8
%lý
r-i ýo %0
A cu
ci Ch
ci r-
4
cli
t- 0
cz WN CY
1; , -1 53 H
0 C) 0 x r-4 1 -ei ca
r4
0
w
r-4
J%
CD
0%
Co CO r-i
Co c- Ch
CY r- 0 i
CO rn 4
0 0 (D
p r-1
4 A cö r-i c 1
o
pq 0
cli CNJ A
4t CM i
Cy% 91
A
rn rei A
+» 0
x m c
cd p4
t--
Pl 4) %ID
LI-
CYN 13 c C%i
A
e
i cli
i
CY
tü M A
r-i c c
(0 -1 4)
0
0 H
>b rf 0
P4
A --4 Ltl% ý. o 1
(M CY
md 1 r-
%0 's
rn i
pl «n %0 00 cý
VN
r-i
Ei
0 (P 8
0) -CJ
zz m m cli c
Co e Lr% LN
0
0 ON Co
0) m
A
, ZD
a)
5
_H
Al
ä Ci r- Co CY% ri r--
CY% -
9 -1
cý -1
4,1 0
A r f P r
0 C. )
9
1 4.4 ei-,
0
b-i CY
Ei 8 11-3
4-4
41
0 H , 0 _H
.. ý. W
0
02 0
-6
m H
,0
+r
m :Z 0
0 0 U 0 r-i
1 1 4-4
C>
u ý rn 4)
r-i -12
ri 1
m 13
r. C) A 0
9
H -p m 0
"-f -P 0
1
a +b ei 0
H -p ce
r4 24
0
+b in 0
1; 4-1 -p Co
m H C> r4 p3

- 112 -
3-5-5 Factors Affecting the Choice of Floor Insulation
It can be seen from Figures 3-5-8 and 3-5-9 thaty for some
values of f/ij there will be little to choose between certain levels of
insulation on the basis of combined cost. In any casep other factors
come into the decision how best to insulate a floor.
For high floor loadingsq vertical edge insulation may be preferred
to a complete layer. The compressive strength of even low-density
(l6kg/M3) expanded polystyrene 68
is, however, greater than 100 k Pa;
at this value of stress, its compression is about 7%. The layer of
insulation is protected from high point loadings by being located beneath
the reinforced concrete slab in the cases of overall insulation considered
here.
As in many situations where insulation is apparently economically
attractive, its use may be avoided in an attempt to keep initial building
costs down to a required level. The inclusion of insulation can, of
coursey be enforced for new building by suitable modifications to the
Building Regulationsý and will be encouraged by insulation subsidies
and the expectation of rapidly rising fuel prices. In the case of solid
ground floors it is important to take a fairly long term viewy since it
is unlikely to be feasible to add insulation once the building is in
use, apart from the possibility of changes in floor coverings in certain
situations.
The insulating costs for the methods using 50mm thick expanded
polystyrene for the periods from April-May 1976 onwards are roughly
proportional to the level of the all-items Retail Price Index 55
at
the time. It seems reasonable to assume that the insulating costs will

- 113 -
continue to rise in line with general inflationp and that higher levels
of insulation will become more attractive if fuel prices rise more
rapidly than this,
The ratio of the night rate in West Yorkshire for electricity on
the White Meter tariff to the Retail Price Index at the time the rate
was introduced varied by only a few per cent for all the rates introduced
from July 1975 to September 1979. (See Figure 3.2.2 .) The ratio
for the rate which came into operation in April 1980 was about 6% higher
than the mean of the others. Since the introduction of the Economy
Seven tariff in October 1978, the night rate for the tariff has remained
at almost exactly 80% of the rate for White Meter.
If it is assumed that insulating and electricity costs will both
remain reasonably near their earlier fairly steady levels relative to
general inflation, then values of f/i for heating by night rate elect-
ricity on either of the tariffs will change little. The comparative
attractiveness of the various methods of insulating the floory assessed
on the basis of combined costs, will then remain much the came as for
the periods considered from April 1975 onwards.
If, however, electricity prices rise relative to the insulating
costsp perhaps as a result of large oil or coal price increasesp then
increased values of f/i will make the use of the higher levels of
insulation more attractive. For examplep the lowest combined cost for
beating to 15 0C by night rate electricity on the Economy Seven tariff
in the two periods considered since it was introduced was for one or
other of the methods of edge insulation. By April 1980 the value of
f/i for this rate bad reached 1.94. (See Table 3-5-5 If it increases
to more than 2.009 then a complete layer becomes the most attractive

- 114 -
form of insulation on the basis of combined cost for beating to 15 OC.
The British Government has proposed thatf following the price , increases of April 1980, domestic gas prices should rise by 10% a year
relative to general inflation. The cheapest domestic rate per therm
introduced in that month led to a value of 1.22 for f/i. This meant
that the combined cost for heating to 15 0C was then lowest for'a 0.5m
depth of edge insulationg and only marginally higher for the Uninsulated
case.
Ifq in real terms, the cheapest domestic rate for gas did rise
by 10% a year and insulating costs remained constantp then after 5 years
f/i, would have increased by a factor of 1.61 to a new value of 1.96.
The lowest combined cost for beating to 15 0C would then be for a metro
depth of edge insulation. After a further yeary f/i would have the
value 2.16 and a complete layer would give the lowest combined cost.
by gas 0 For heating1to 20 C. the value of 1.22 for f/i in April 1980 means
that one complete layer of insulation was the most attractive on the
basis of combined cost. It would take 9 annual price increases on the
above assumptions to increase the value of f/i above 2.65 so that the
lowest combined cost was for two complete layerso
It should-be noted that the combined costs considered here include
ten times the annual fuel cost based on the price of the fuel at the
time of assessment. This amount is intended to represent the present
value of future fuel costs. When the price of the fuel is expected to
rise faster than the general rate of inflationp the present value of
future fuel costs may well be judged to be more than ten times the
annual fuel cost. This would have the effect of making higher levels
of insulation more attractive than might be indicated by combined costs
as calculated here.

- 115 -
3.6 DISCUSSION
From the overall and combined costs obtained for the building
elements it can be seen that it is sometimes economically soundf on the
assumptions madep to use more insulating constructions than those
usually specified for dwellings. External walls with foam-filled
cavities, or of timber-framed construction, pitched roofs insulated
with 100mm. or more of glass fibre quiltp and solid ground floors ir., --
corporating at least a vertical edge strip of 50mm thick expanded poly-
styrene often appeared relatively attractive when fuel costs were taken
into account.
It is important to remember that the overall and combined costs
apply only in the conditions assumedq and will be affected by the
following factors: -
1. Changes in construction costs. These may affect the relationship
between the costs of building alternative structures. A rapid
rise in the cost of timber wouldo for example, discourage the use
of timber-framed construction if the prices of bricks and concrete
blocks were increasing more slowly. The relative importance of
building and beating costs will also change if the construction
cost of the element increases at a different rate to the price
of the chosen fuel.
29 The effective discount rate to be used. This represents the rate
of growth of a sum of money which is investedv relative to the
price of the fuel used. The choice of rate cannot be made with
certaintyp since it involves future interest rates and fuel prices.
It is by no means inevitable that, over a period of a number of
yearsý investments will keep up with the price of fuel. If they

- 116 -
do not, the effective discount rate is negative and fuel costs.
incurred late in the life of the building have a particularly high
present value. Overall and combined costs are then very sensitive
to the number of years of use which are taken into account.
The internal temperature levels and external temperatures occurring
during the course of each year. Overall or combined costs for
alternative fo=s of construction have so far been compared for
the same internal temperature. Increased thermal insulationg
however, frequently leads to a higher mean internal temperaturep
particularly when heating is intermittent and confined to certain
rooms: temperatures fall more slowly when heating is turned offy
and unheated rooms are warmer at all times. In the domestic
situation, occupiers may well fail to realise most of the potentisa
fuel saving, the benefit of higher insulation levels being taken
up mainly in the form of increased temperatures. A large-scale
survey of local authority houses in Scotland by the Building Research
Establishment 13 indicated that average energy users would achieve
about half of the potential fuel saving from increased insulationg
the highest 10 percent of energy users about three-quarters of the
potential saving, and the lowest 25 percent of energy users would
achieve no fuel saving at all.
4- Incidental gains from solar radiation through windowsy from occupants
and from appliances used for purposes other than space beating.
In certain circumstances of a well-controlled beating system and a
fairly cool climatel moderate levels of incidental gains will have
little effect on the internal temperature. To a good approximation,
the reduction in the useful beat input from the heating system will

- 117 -
be equal to the incidental gains. There will be a saving in fuel
which will not depend on the precise level of thermal insulation.
Overall and combined costs have been deduced in the absence of
incidental gains and would all be reduced by the same amount in
these circumstances. Differences in overall or combined cost
between alternative forms of construction would thus be unaffected.
In many situations, howeverp high levels of insulation can lead
to simaner overheatingy and some of the incidental gains result in
reduced comfort rather than fuel saving. A highly insulating
construction would then be less attractive than a comparison of the
simple overall or combined costs would indicate*
From the above considerations it can be seen that comparis=-Of
alternatives will be affected by a number of factors. Costs need to be
reassessed to take account of changes in prices and financial expect-
ationsq and should allow for the conditions under which the building
will be operated.
Recent changes suggest that fuel costs are likely to rise faster
than insulating costs for a whiles making higher levels of insulation
more attractive. For some forms of constructions such as pitched roofs
and cavity wallst insulation can be added after the building is completed
and is in use. In other casesy such as solid ground floors, this is
not practicablej and it is important that sound decisions are made at
the time of construction, taking account of likely levels of fuel cost
in the future.

- 118 -
PART III
SURVEY OF ENERGYUSE
IN HOUSES
Chapter
bectISc0pean
esig

- 119 -
PART III
SURVEY OF ENERGY USE IN HOUSES
Chapter
Object, Scope and Design
4.1 OBJECT OF THE SURVEY
Men decisions have to be taken concerning the fozms of construo-
tion to be used for new housing and the types of thermal insulation 1o
be incorporatedv there are many factors to be considered. In addition
to providing a structurally sound dwelling which is aesthetically
acceptablep the design should take account of the costs of available
methods ofreducing heat losses and the energy savings which are likely
to result from the additional expenditure.
The financial costs of construction can usually be assessed wi*b
a fair degree of precision by the quantity surveyorp but the subsequent
energy use in the dwelling depends both on the house design and on the
ways in which occupants use the forms of heating and ventilation which
are available to them. In new public housingt some type of central
beating system will normally be involved.
Important factors in the behaviour of occupants which would be
eipected to affect energy consumption include: -
the detailed use made of any central beating systemp and of the
water beating system.
2) the use of auxiliary heating.
the ways in which tenants influence ventilation rates, especially
by the opening of windows.

- 120 -
It was intended that the survey should enable such factors to be
investigated ando if possiblep linked to more general characteristics
such as housebold sizag income and occupancy patterns.

- 121 -
4.2 QUESTIONNAIRE DESIGN
The Survey was conducted in order to obtain relevant info=ation
from the tenants of a number of centrally-heated local authority
bouses. A personally administered questionnaire was used, as it was
considered that this would result in a higher response rate and 69 P 70 greater accuracy than the less direct approach of a postal survey*
Questionnaire design was aided by a small number of informal interviews
with occupants of the types of houses involved. These provided back-
ground knowledge, and helped in the construction of questions which
would be meaningful to people living in the types of houses selected.
The questionnaire (Appendix 2) asked for the following
info: rmations-
1) The approximate date on which the occupants moved into the house.
(Question 1).
2) The use made of the heating controls and the detailed pattern of
use of beating through the week in cold weather on a room by room
basis. The questions covered both the central heating system and
any auxiliary heaters. (questions 2 to 8).
The numbers of adults and children in the house at specific times
of day, and the use of heating when the house was empty for an
hour or more. (Question 9)e
4) Satisfaction with the warmth of the house* (Question 10).
5) The occurronoe of draughts and damp patches. (Questions 11 and 12).
6) Window opening habits. (Question 13)-
7) Letails of loft insulation and any double glazing or cavity wall
insulation. (Questions 14 and 15)-
8) Information on the daytime closing of bedroom doors. (Question 16).

- 122 -
9) The main method of water heating and the adequacy of supply.
(Questions 17 and 18).
10) Satisfaction with the room and water beating arrangements and
comparison-witb those in the previous dwelling. (Questions 19
and 20).
11) The fuel used for cookingg and the use of electric kettleB9
washing machines and tumbler driers. (Question 21).
12) Purchases of paraffin and bottled gas. (Question 22).
13) Classification informationg including occupations, net incomep
the number of occupantsq and the number and ages of any children
living in the house. It was thought that these factors may have
some bearing on energy consumptionv affecting the level of
heating maintainedg the use of hot waterp and the frequency of
opening of doorewith associated loss of heat.

- 123 -
4.3 DWELLING TYPES
Since new local authority housing is likely to have full or
partial central heatingp it was decided to confine the survey to such
dwellings. It was also thought that the presence of central heating
would generally result in higher internýal temperatures and thus
justify more careful consideration of the thermal characteristics of
a design.
Housesp rather than flatep were chosen for investigationp since
flats exhibit greater variety in the positioning of one dwelline
relative to others. Houses of the type surveyed were in either mid-
terrace or end of terrace positions, while flats have additional
variation: they can be groundfloort mid-floor or top-floor. Plate
are also more likely to be affected by the temperatures maintained in
adjoining units, which in some cases are to be found above and belowl
as well as on either side.
Suitable centrally-heated local authority houses in the area
were generally of the 3 bedroomp 4 person (3-4), or 3 bedroomp 5 person
(3-5) sizes. The investigation was confined to the latter size,
since the former offered little variety of heating system. The survey
covered three types of 3-5 houseaq with gas-fired microbore (Type 3. ),
electric warm air (Type 2), and gas-fired waxm air central heating
(Type 3). There was very little variation in a number of character-
isticsp such as plan area, breadth and depthp though certain featuresp
such as the total area of glazingg varied considerable from one type
to another. None of the houses had a flue which could be used for a
fixed gas fire or solid fuel appliance. Photographs and floor plans
appear in Figures 4.3.1 to 4.3.4 - House Types 1,2 and 3 were on
separate sitesy which have been numbered in the same way.

- 124 -
boiler The balanced-fluelproviding space and water heating in the Type
1 houses had a rated output of 11.1 kW for a gross input of 15,2 kW
in the form of gas. For the gas-fired warm air unit installed in the
Type 3 houses, the figures were 6.6 kW and 8.8 kVI respectively. The
electric storage unit used for space heating in the Type 2 houses had
a maximum charging rate of 8.1 kW and a storage capacity of 55 kWh.
f

- 125 - Figure 4.3.1 Photographs of Type 1 Houses.
Front
t V.
Re ar
General
View
16-
13
JL.; -#- --, gff
RH
�
"t.

- 126 - Figure 4.3.2 Photographs of Type 2 Houses.
Front
Re ar
General
View

- 127 - Figure 4., 1.3 Photograpbs of Type 3 Houses.
Front
Rear
General
View

Figure 4.3.4 Floor. Plans of Ground floors.
Type 1.
ýýr
Store
Sitting Room
- 128- ; 49 House Types.
Type 2.
Store
SLEI; Lng Rocm
omý Type 3.
Sitting
900M.
First floors. I metre L---j
p-

- 129 -
4-4 SAMPLES AND RESPONSE RATES
For each site a nurnber of houses of the appropriate type were
selected, usually consisting of complete terrace blocks. Each house was
then visitedq and2sometimes after several attemptsp an adult occupant was
contacted in every case but one. The exception was a house on Site 29
which was standing empty due to a change of tenancy (which neighbours
attributed to high electricity bills). A house was then included in the
sample unlesaFthe occupants had lived there for less than three months
(as occurred in only two casesp one on each of Sites 2 and 3)-
Of this sample of established tenantsp the great majority were
willing to be interviewed, and answered the schedule of questions. On Site
1 only one person refused; on Site 2 there were two cases of effective
refusal, consisting of a few words on their use of heating and an obvious
unwillingness to spend time answering a number of questions; and on Site
3 there were three casess two being outright refusals and one a request
to call back in the evening from a tenant who proved to be absent from
the house each evening. Site plans are given in Figures 4-4- 1 to 4-4.3
From Table 4-4-1 it can be seen that response rates were higb.
Respondents often seemed to have considerable interest in the subject,
and were most co-operative in giving careful answers to the questions.
, Tabl8 4.4.1 Samples and Response Rates.
Site 1 Site 2 Site
Ng. of Houses in Sample
(Establisbed tenancies)
13 30 19
No. of Schedules Completed 12 , 28 16
Response Rate 92% 93-0 84%

- 130 -
Figure 4.4.1 Site Plan:. Type I Houses.
N
Respondents' houses are numbered.

- 131 -
Figure 4.4.2 Site Plan: Type 2 Houses.
10 mebres L---A
-
--I I t.. J
I!
P tq P
Fl, 111-1
n E: 3mP
FEE I
Cl Cl 1 1271
pppp I ho 117 118 1 Iq 120 1
N f
ýl 'T 23 IT - 22 IT - 21
F-F 1581
r
--9 26
LýD-
Ih1
IIr

- 132 -
Figure 4.4.1 site plan: Type 3 Houses.,
PLdVLA5 ReLA 10 metres
1-i El
-
U,
ol
Open
Space

- 133 -
4.5 DATA ON FUEL CONSUXPTIONS AND WEATHER CONDITIONS
4-5.1 Fuel Consumptions
Data on gas and electricity consumption were obtained from the
Boards on a systematic basisp though many occupants also volunteered the
information either from memory or from bills. This gave a useful cross-
check and increased confidence in this important data. Occasionally
actual readings were not availabley and estimates made by the Electricity
Board for some houses on Site 3 could not be used, since they were
obviously too high. (On the other two sitesp electricity meters could
be read without entering the bousesp and full sets of actual consumption
figures were available). In all casesp gas meters could only be read
from inside the house, but a combination of repeat visits by the meter
readers and the use of customer readings meant that readings were usuaw
available. Customer readings were acceptedp and used in the same way
as official readingsp since they appeared to be generally sound,
Respondents were systematically asked for their paraffin and bottled
gas consumptions, if anyt both for a cold week and for the whole of the
winter up to the time of the interview. It was found that respondents
usually felt able to give onev but not bothp of the figures for a fuel
which they used. It is interesting to note that these particular fuels
were used by respondents on Site 2 onlyl where a natural gas supply was
not available. In the main 1977/8 winter quarterv 7 of the 28 rei5pozi. -
dents on this estate used paraffint bottled gas or both - cause for
concern because of the associated safetyp condensation and air-quality
problems&
Gas consumptions for houses on Sites I and 3 were obtained in the
same form - the number of cubic feet used between motor readingsp which
- 134 -
were approximately quarterly. The declared calorific value of the gas
suppliedp which had not changed during the period under investigationv
was used to obtain the total energy content of the gas used in a period
between readings. The length of the period was then used to convert
total energy to the average rate of energy input (U) in the form of
gas. This was multiplied by an assumed average efficiency of 7eo for
useful heat production from gas (for central beating with some cooking)
to obtain the average rate of production of useful energy from gas within
each house during the period between readings.
For electricityp different tariffs and metering systems were in-
volved on the three estates: domestic tariff only on Site Is White Meter
(day and night rates) on Site 2j and off-peak for water heating plus
domestic tariff for other uses on Site 3- So for Types 2 and 3 there
were two separately metered electricity consumptions for a houses which
could be added to obtain the total consumption of electricity. For a
Type I houses all electricity used registered on a single meter. The
time between readings was again used to obtain the average electricity
consumption rate, in kWp for each house. This was all taken to be useful
energy. For houses on Site 2 which used no paraffin or bottled gas in
the periods it represented the total energy rate.
For each of the sites using both electricity and gasg it was found
that the general reading of electricity and gas meters on the estate
occurred in fairly close successiong with an interval of no more than 15
days. This was of advantage to the researcherp but presumably could lead
to financial difficulties for the occupants* It wasp therefore, reasonable
to add together the average rates of useful energy release from gas and
electricity for each house for the closely similar metering periods to
obtain a total rate, P. (See tables of results in Appendix 3. )

- 135 -
4-5.2 Weatber Data
Daily maximum and minimum temperatures are measured locally, 59
and were used to calculate mean external air temperatures for periods of
interest. Maximun and minimum readings were all given the same weightingg
use being made of all such readings collected between the most common meter
reading dates for the major fuel on each estate - natural gas for Sites
1 and 3P and electricity for Site 2. The resulting mean temperatures
are presented in Table 4-5-1 along with the highest and lowest temp-
eratures recorded in the periods.
The above procedure was expected to give reasonable mean external
temperatures to correspond with the total mean useful energy rates
calculated from gas and electricity motor readings. The approach was
based on the knowledge that, for Sites I and 3, the electrical energy
input was much smaller than that for gas, and the electricity and gas
meter reading dates did not vary greatly. Furthe=orej electricity
consmption changed little from one quarter to the next for the houses
on these sites.
Table 4-5-1 Meang Higbest and Lowest External Air Temperatures
for the Periods between the Most Common Meter Reading
Dates for the Major Fuel on Each Site,
Site
Number
Metering Period External
Mean
Air Temp
Highest
erature, 0C
Lowest
1 10-11-77 to 31-1-78 3-74 14-4 -3-5
1 31-1-78 to 5-5-78 4-77 15-0 -10.0 2 1-12-77 to 3-3-78 3.22 14-4 -10.0
3 5- 1-78 to 5-4-78 3.62 13-8 -10.0 3 6- 1-77 to 6-4-77 3-96 15.6 -6.1

- 136 -
Cha
nergyInputResu1ts
fortheHouses

- 137 - Chapter 5
Energy Input Results for the Houses
VNIKLT USE OF CENTRAL HEATING AND ENERGT CONSUMPTION
The energy consumption of a given type of house will depend on
many factors, including the detailed pattern of shutting off radiators
or warm air outletsv the use of supplementary heatingg the opening of
doors and windowag and the use of domestic hot water. Howeverp the
weekly hours of use of the central heating in cold weather might bi
expected to have a major effect on energy consumption in winter.
Because of thermal storage effects in the structure and contents
of a house, and the use of thermostatic controlp energy consumption
will not simply be proportional to weekly hours of usep as is sometimes
assumed. 71 Variation in the number of bours of use will have a less
than proportional effect on energy requirementsp since a house which is
heated for only a few hours a day will be losing beat to the external
environment at a significant rate for more than those few hours.
Looking at the energy inputp the thermostat initially runs the central
beating on a high duty cycle when warming the house up from 'coldip and
then normally settles down to a lower average rate of beat input as
steady-state conditions are approached.
For the houses of a particular typel the total mean rate of usefil
energy input to a house from fuels for a winter metering period,!;, was
plotted against weekly hours of use of central beating in cold weatherl
as deduced from the completed questionaires. Information obtained
from respondents on paraffin and bottled gas consumption was often
imprecisep and the seven houses using these fuels were exbluded from
this exercise. (For survey data, see Appendix 3
3.1.1 Typ eI
There was a choice of two winter metering periods for the major

- 138 -
fuels since most gas meters were read on 10-11-77P 31-1-78 and 5-5-78.
The mean external temperatures calculated for the periods between
these dates were 3-74 and 4-77 0C respectively. The higbest temp-
eratures recorded for the two periods were 14-4 and 15-0 0 C9 and the
lowest were -3-5 and -10.0 OC respectively. It can be seen tbatp for
both these periodso some heating would be required every day to maintain
temperatures which most people would regard as comfortable.
Graphs Of total mean useful energy rates against the weekly hours, H,
of use of central heating in cold weather were plotted for both periods.
(Figures 5-1-1 and 5.1.2 ). The graph for the former period fails
to show a clear trend. There were apparently two main reasons for thiss-
1) The houses had not long been completed, and the occupants had
not had sufficient time to become familiar with the heating
systems. Some respondents admitted that they had initially
been more extravagant in their use of heating.
2) There were a number of faults. These included a gas leak which
was eventually rectifiedp cases of inadequate hot water supply
to sitting room radiatorsp and a control faulty confirmed by
a Council beating engineert which caused the circulating pump
in one house to stop as soon as the boiler reached its shut-
off temperature.
The graph for the gas metering period 31-1-78 to 5-5-78 (Figure
5.1.2 ) omits house number 59 since no final gas meter reading was avail-
able. A clear trend is exhibited in all but two cases. For the two
exceptions, their relatively low use of energy for their hours of heating
is probably accounted for by the reported failure of an engineer to
rectify poor radiator performance in one house (number 10)p and to a

- 139 -
control fault in the other (number 1). For the remaining 9 houseeg the
total mean useful energy rates and the weekly hours of use of central
heating in cold weather have a correlation coefficienty rp of 0.8909
which is statistically significantp for a sample size of 99 at better
than the 1% leve, 12 The straight line giving the best 'least squares'
fit to these 9 points is drawn on the graph.
5.1.2 Type 2
The winter metering period for electricityp the major fuelp was
from 1-12-77 to 3-3-78. The calculated mean external temperature for
this period was 3.22 OC, and the highest and lowest temperatures recorded
were 14-4 and -10.0 OC respectively.
For each of the 21 houses using no paraffin or bottled gas in
this period, the total mean useful energy rate was calculated from the
sum of day and night rate electricity consumptionsp regarding all the
eleotrical energy as useful. This was then plotted against weekly hours, H,
of use of central heating in cold weather (Figure 5-1.3 ).
Although there is a fair amount of scatterp it can be seen that
greater use of central heating is generally associated with higher energy
consumptiong as might be expected. A straight line bag been fitted on
the 'least squares' criterion. The correlation coefficienty r, has the
value 0.6309 whichq for a sample size of 21y is significant at better
than the 1% level.
5.1.3 Type 3
Almost all respondents' gas meters were read on 5-1-78 or the day
af terv and on 5-4-78 or the following day. The mean external temperature

- 140 -
for the period between these dates was 3.2 0 C9 with highest and lowest
temperatures of 13-8 and -lOeC respectively.
For two of the houses the winter gas metering period differed
appreciably from the above datesp due to one late reading in each case.
The earlier reading for house number 7 was delayed by 19 days9 and the
later reading for house number 3 by 37 days. Consumption figures wereq
howevert available from normal meter readings taken the previous winter
on 6-1-77 or the day afterg and on 6-4-77. The mean temperature of
3.96 OC for the period between these dates was comparable to the figure
for the following yearp and gas consumptions for the two houses seemed
to be generally in line from one year to the other when allowance was
made for delayed readings. - For these two bousesp the gas meter
readings for the first quarter of 1977 were usedp rather than those for
1978.
Most electricity meters were read on 20-12-77 and 22-3-789 but
the latter reading for the houses numbered 29 4p 6 and 9 had not been
takent and the Board's estimates generally appeared to be excessive.
It was observedp however, that for houses of this type, electricity
consumption increased only a little in the winter quartery and at that
time of year represented only a minor part of the total useful energy
rate. Fresh estimates of winter quarter electricity consumption in the
four houses, made from the annual pattern of consumptionp were therefore
employed in calculations of useful energy rates.
The graph of total useful energy ratep for gas and both domestic
and off-peak electricity, against weekly hours of use (Figure 5-1-4)
fails to show a clear trend. The point for house number 5 represents
a particularly high energy rate for the hours of use, which may be

- 141 -
partly due to a very high off-peak electricity consumption for water
heating. A straight line was fitted to the remaining 15 pointsy for
which the correlation coefficient was 0-473. This is not quite
significant at the V1- level.
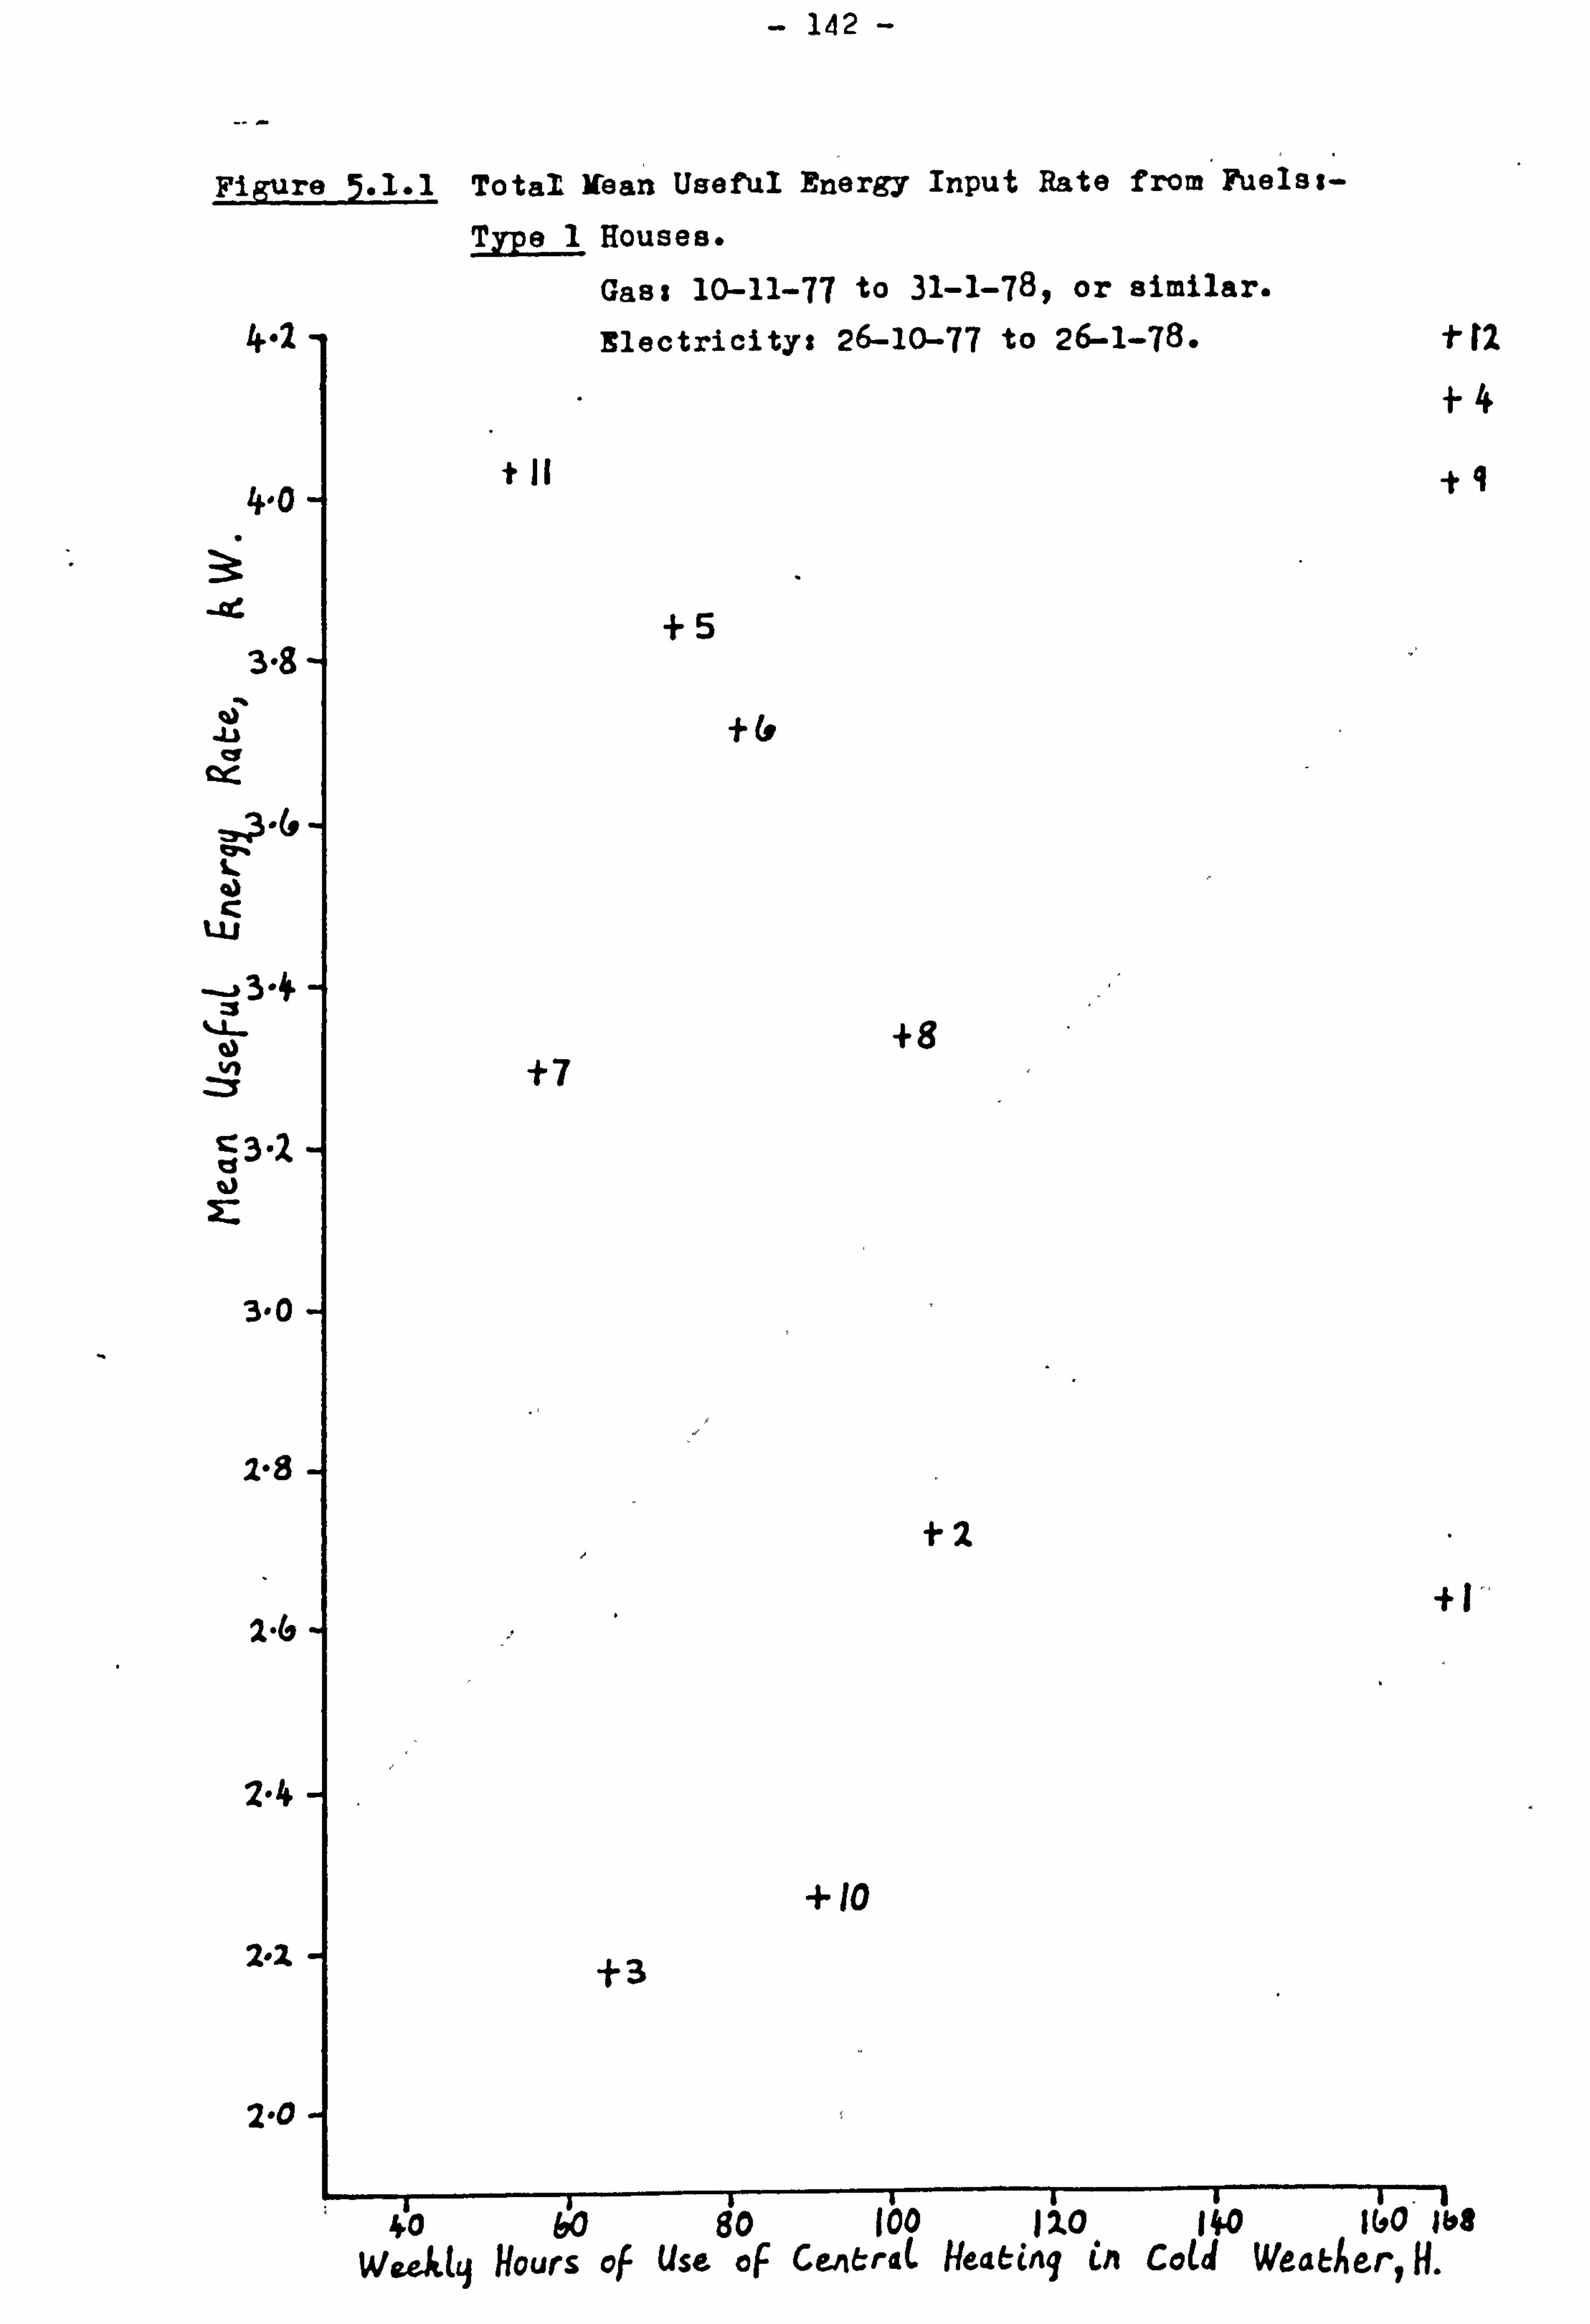
Figure 5.1.1
4.2
'tO
3-8
-234
1--3-1 u
2-64
2-2
2.0
- 142 -
Total Ifean Useful Energy Input Rate from Fuels: - Type I Houses.
Gas: 10-11-77 to 31-1-78, or similar.
--. - -ý -- -- . -. 1 . -n 12 1-4
q
Wealq Hours of Use. oF CeA&rdL Hea&! Aq !A Cotd WeaEher, H.

- 143 -
Figure . 1.2
4.2
4-0
ýý' 3-8
it
. 313.6 ty-, =WN
3-4
3-2
3-0
2.8
24
2-4
2-2
2-0
Total Mean Useful Energy Input Rate from Fuels against Hs-
Type 1 Houses. Gas$ 31-1-78 to 5-5-76P or similar. Plectriaitys 26-1-76 to 27-4-78'-
4
ll
Weekty Hours of Use of CentraL Haattq Cn COU Weather, H.

- 144 -
Figure 5-1.3 Total Mean Useful Energy Input Rate from Fuels
against H: 4
Type 2 Houses using no paraffin or bottled gas in the electricity metering period.
Blectriaitys 1-12-77 to 3-3-78.
3.
Bi -Ad
.4
=r%
LU -J
: ý3-1
2-1
2.1
2.4
2. "
2-1
Week(l Hows of Use of Centrat Heatiq en Cotd Weather, H.

- 145 -
Figure 5.1.4 Total Mean Useful ftergy InPu t Rate from Fuels against Ht-
Type 3 Houses. Gas: 5-1-78 to 5-4-789 or similar. Itlectricitys 20-12-77 to 22-3-78.
41
3-f je-
-u . 34 's C4- ZP%
ui
3 -2 C., 0 a)
3-0
2.9
240
2-4.
2-2
2-0
Weekly Hours of Use of C&ritriat HeatfWý CA CaU - Weathr,

- 146 -
5.2 jt2 AND ENERGY CONS94PTION
As noted abovev due to thermal storage effectsp the average rate
of loss of beat from a house would not be expected to be simply
proportional to the hours of use of the beating. A simple modelp which
takes some account of storage, assumes that the rate of loss of beat
is constant while the central heating is being usedq but falls linearly
during an *off' periodp to rapidly return to the constant rate when
use of the central heating begins againt-
Rate of Loss of Heat.
Central Heating NOT USED NOT USED NO T USED USED JUSED JUSED USED
Time
The sloping sections are all assumed to have the same gradientp
and represent an approximation to the expected exponentially decaying
beat loss rate. The model is best suited to houses which have only
small falls in internal temperature during periods when the heating is
not being usedy and exhibit rapid recovery when the heating is put back
on.
The mean rate of loss of beat will be less than the maximum value,
due to the periods when the beating is off. On the above model, the
reduction in the mean rate due to the occurrence through the weeklIperiods
in which the central heating is not being used will be proportional to
the total area of the triangular 'dips' in the curve. The reduction will,

- 147 -
therefore, be proportional to the sum of the squares of the lengths of
the non-use periods. The sum is conveniently taken over one week of
normal use in cold weather, and will be represented by It 2. Sop for
the model: -
mean rate of loss of beat -a- bY 9a and b being constants.
The total mean useful energy rate for a winter metering period
includeso in addition to fabric and ventilation beat lossesq the energy
loss via waste hot water. Alsop as calculated from fuel oonsumptionsp
it excludes gains from direct solar radiation and from the body heat of
occupants. Neverthelessp a plot of the energy rate against It 2
m, Sbt
be expected to reveal a definite trendq the higher values of It 2 being
associated with lower energy rates. (J: t2 is also represented by S. )
5.2.1 Type I
The graph of total mean useful energy rate against jt2 for the gas
metering period . 31-1-78 to 5-5-789 with electricity from 26-1-78 to
27-4-78ý (Figure 5.2.1 ) follows a clear pattern for most of the houses.
Again house number 5 had to be omitted due to the lack of a final gas
meter reading. Numbers I and 10 are out of line as beforey presumably
due to the faults in their central heating systems.
A straight line was fitted to the remaining 9 points. For these,
the correlation coefficient for total mean useful energy rate and 'tt, 2
was -0-856f which is significant at better than the 1% level for a sample
of
5.2.2 TYpe 2
Again the griph was plotted for the metering period 1-12-77 to
3-3-78 for the 21 houses using no paraffin or bottled gas (Figure 5.2.2 ).

- 148 -
A straight line was fitted to all the pointsy and the correlation
_y 2
coefficient for the total mean useful energy rate and t was -0-560Y
which is significant at the 1% level.
5.2.3 Type
When the previously calculated total mean useful energy rates
were plotted against Zt2 (Figure 5.2.3 )q a definite trend was revealed.
Again the point for house nmber 5 was well out of line. A straight
line was fitted to the remaining 15 points, for which the correlation
coefficient is -0-537. This is significant at the 5% leyel, but not
at the 1%q for this size of sample.

- 149 -
Figure 5.2.1 Total Mean Useful Energy Input Rate from Fuels against 'r t2 S_
lp -u is
3":
Z: 3-1
2.9
2.4
2.4
2.2
2.0
Type 1 Houses. *, Gass 31-1-78 to 5-5-78t or similar. Electricity: 2 6-1-78 to 27-4-78-
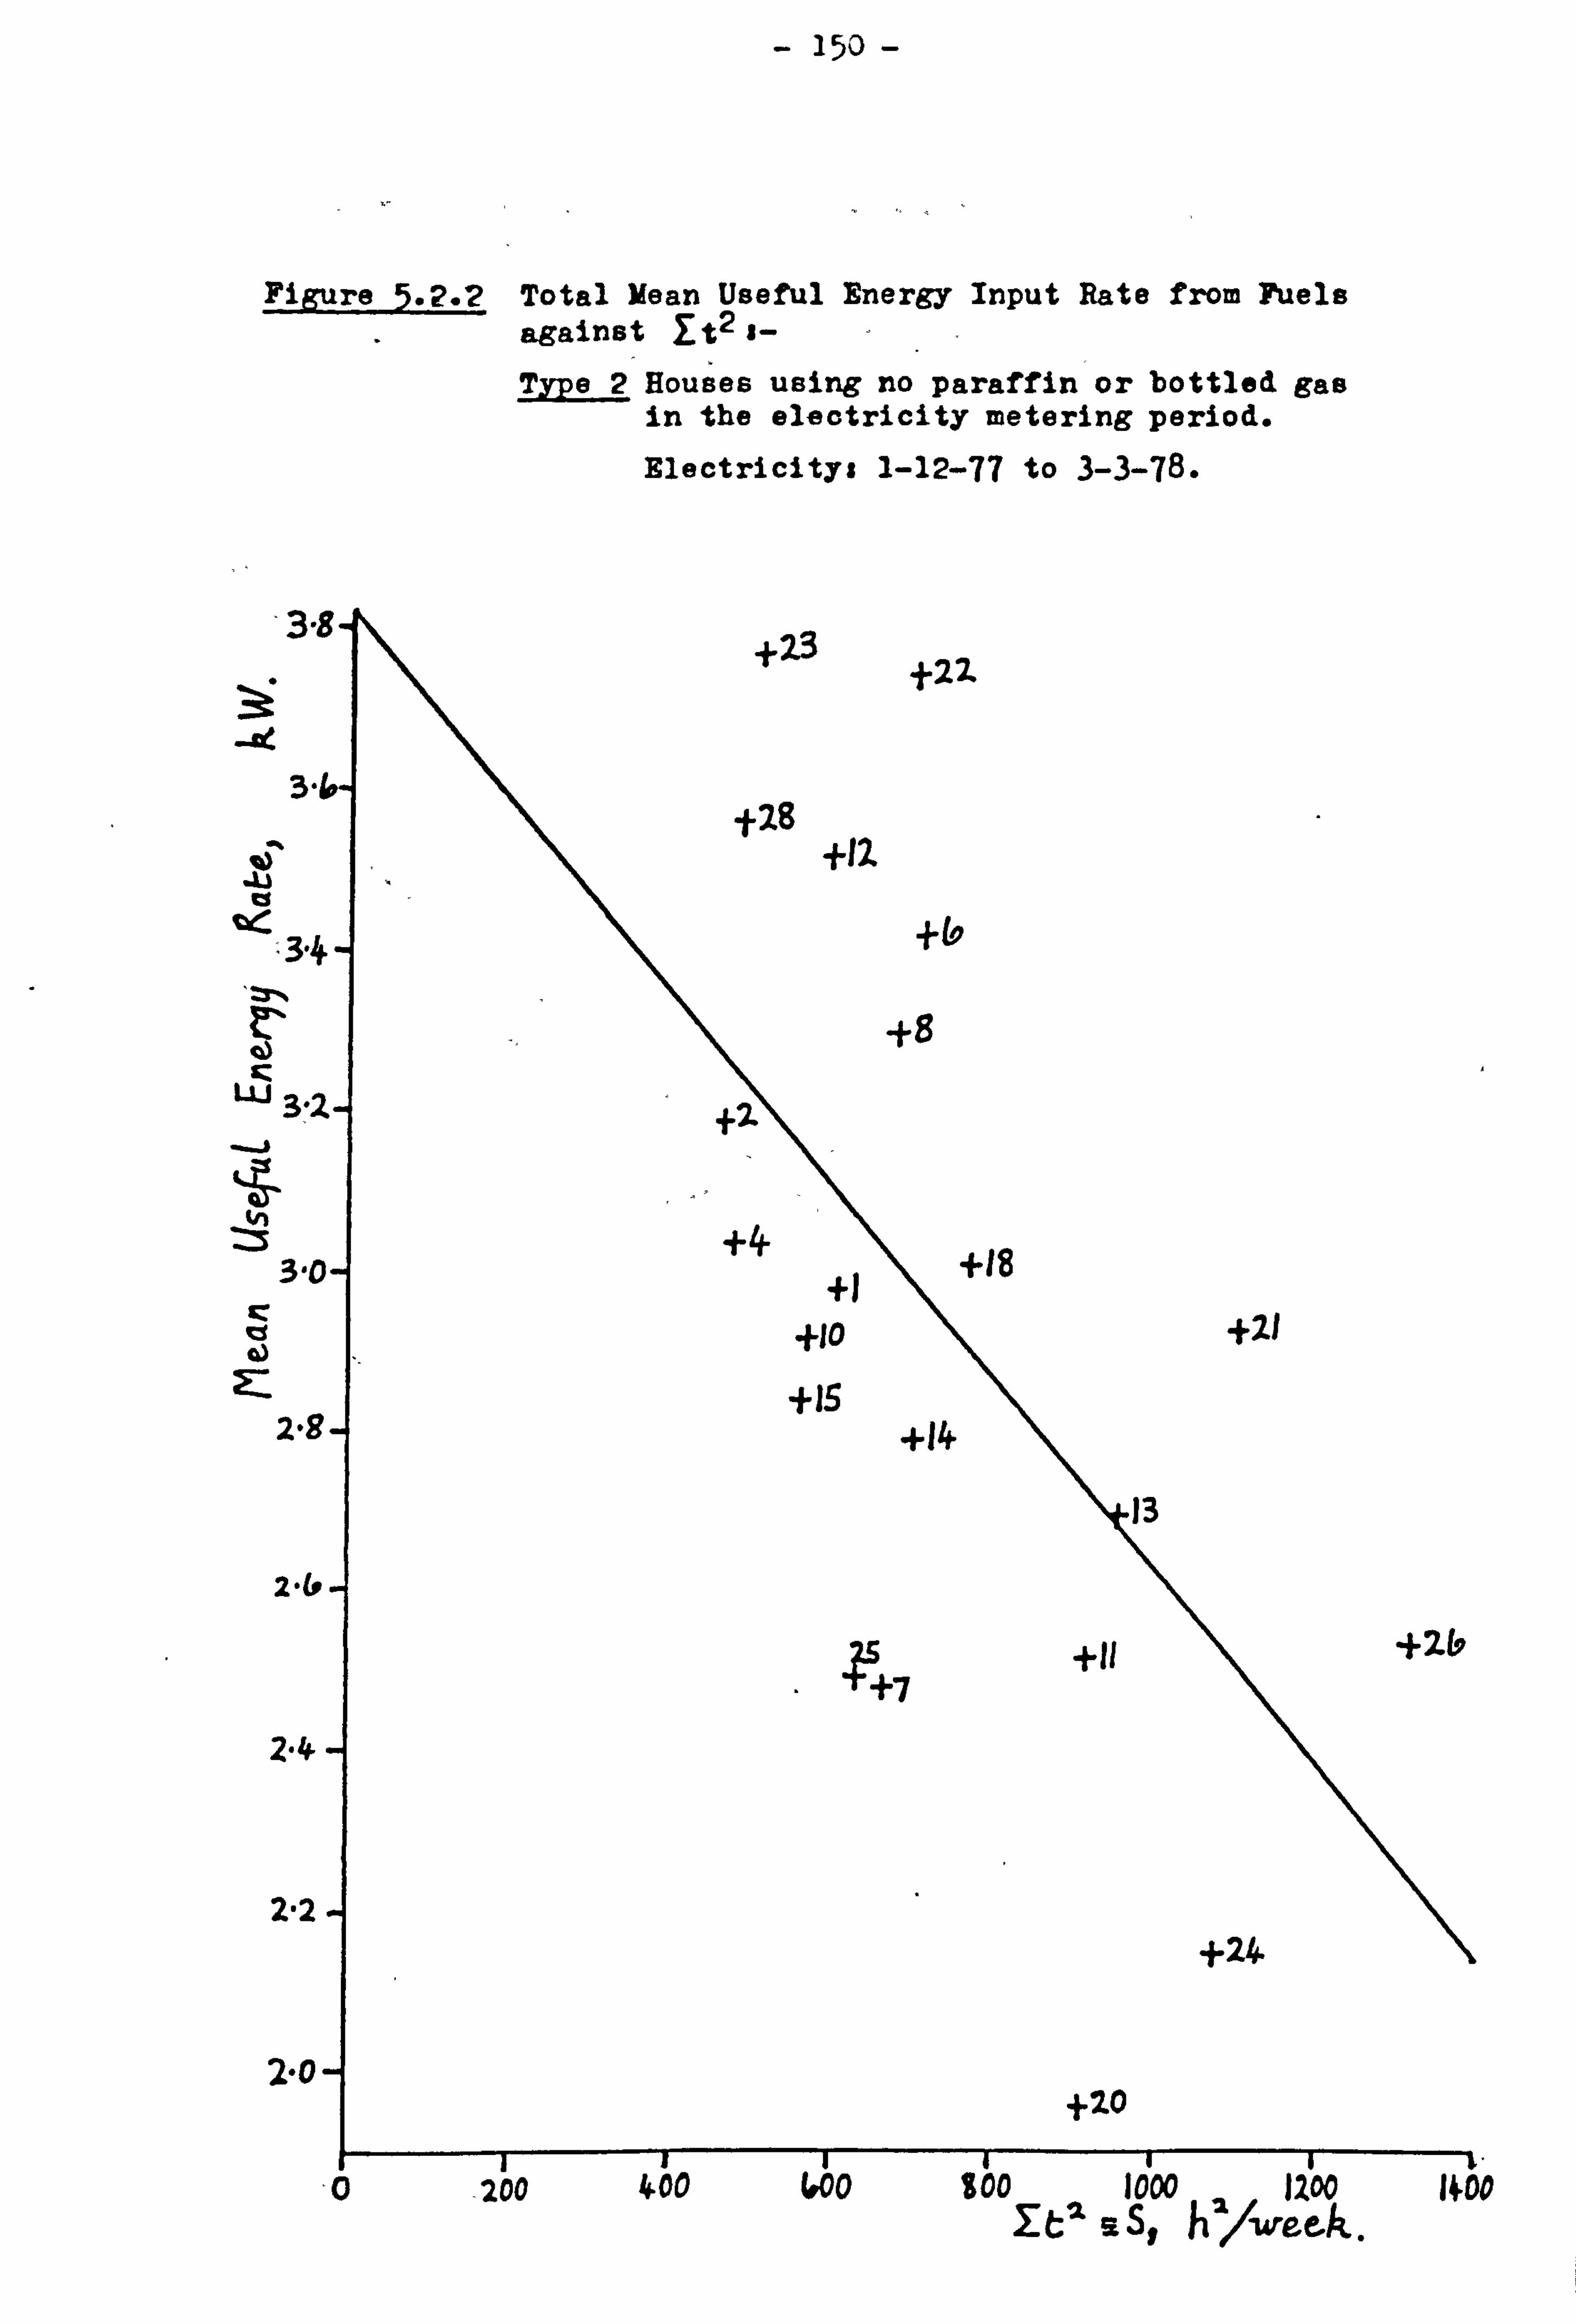
- 150 -
Figure 5.2.2, Total Mean Useful Energy Input Rate from Puels against yt2 j-
Type 2 Houses using no paraffin or bottled gas in the electricity metering period. Blectricitys 1-12-77 to 3-3-78.
of*-,
sz Lli
--i C
cc
4
4
.0 -200 400 wo too 1000 200 NO
%S# h'1-wftk.

- 151 -
Figure 5.2.3 Total Mean Useful Energy Input Rate from Fuels against 2: t2 S- Type 3 Houses.
Gas' 5-1-78 to 5-4-789 or similar. Electricitys 20-12-77 to 22-3-79-
IA
43 u ts
CY-1
IT
L5
44 =5
Ic
4
r
+5
ll-ý-
zm 4400 (000 goo lovo 1200 1400 IiPoo
Y-Ossl h2. /-wcek.
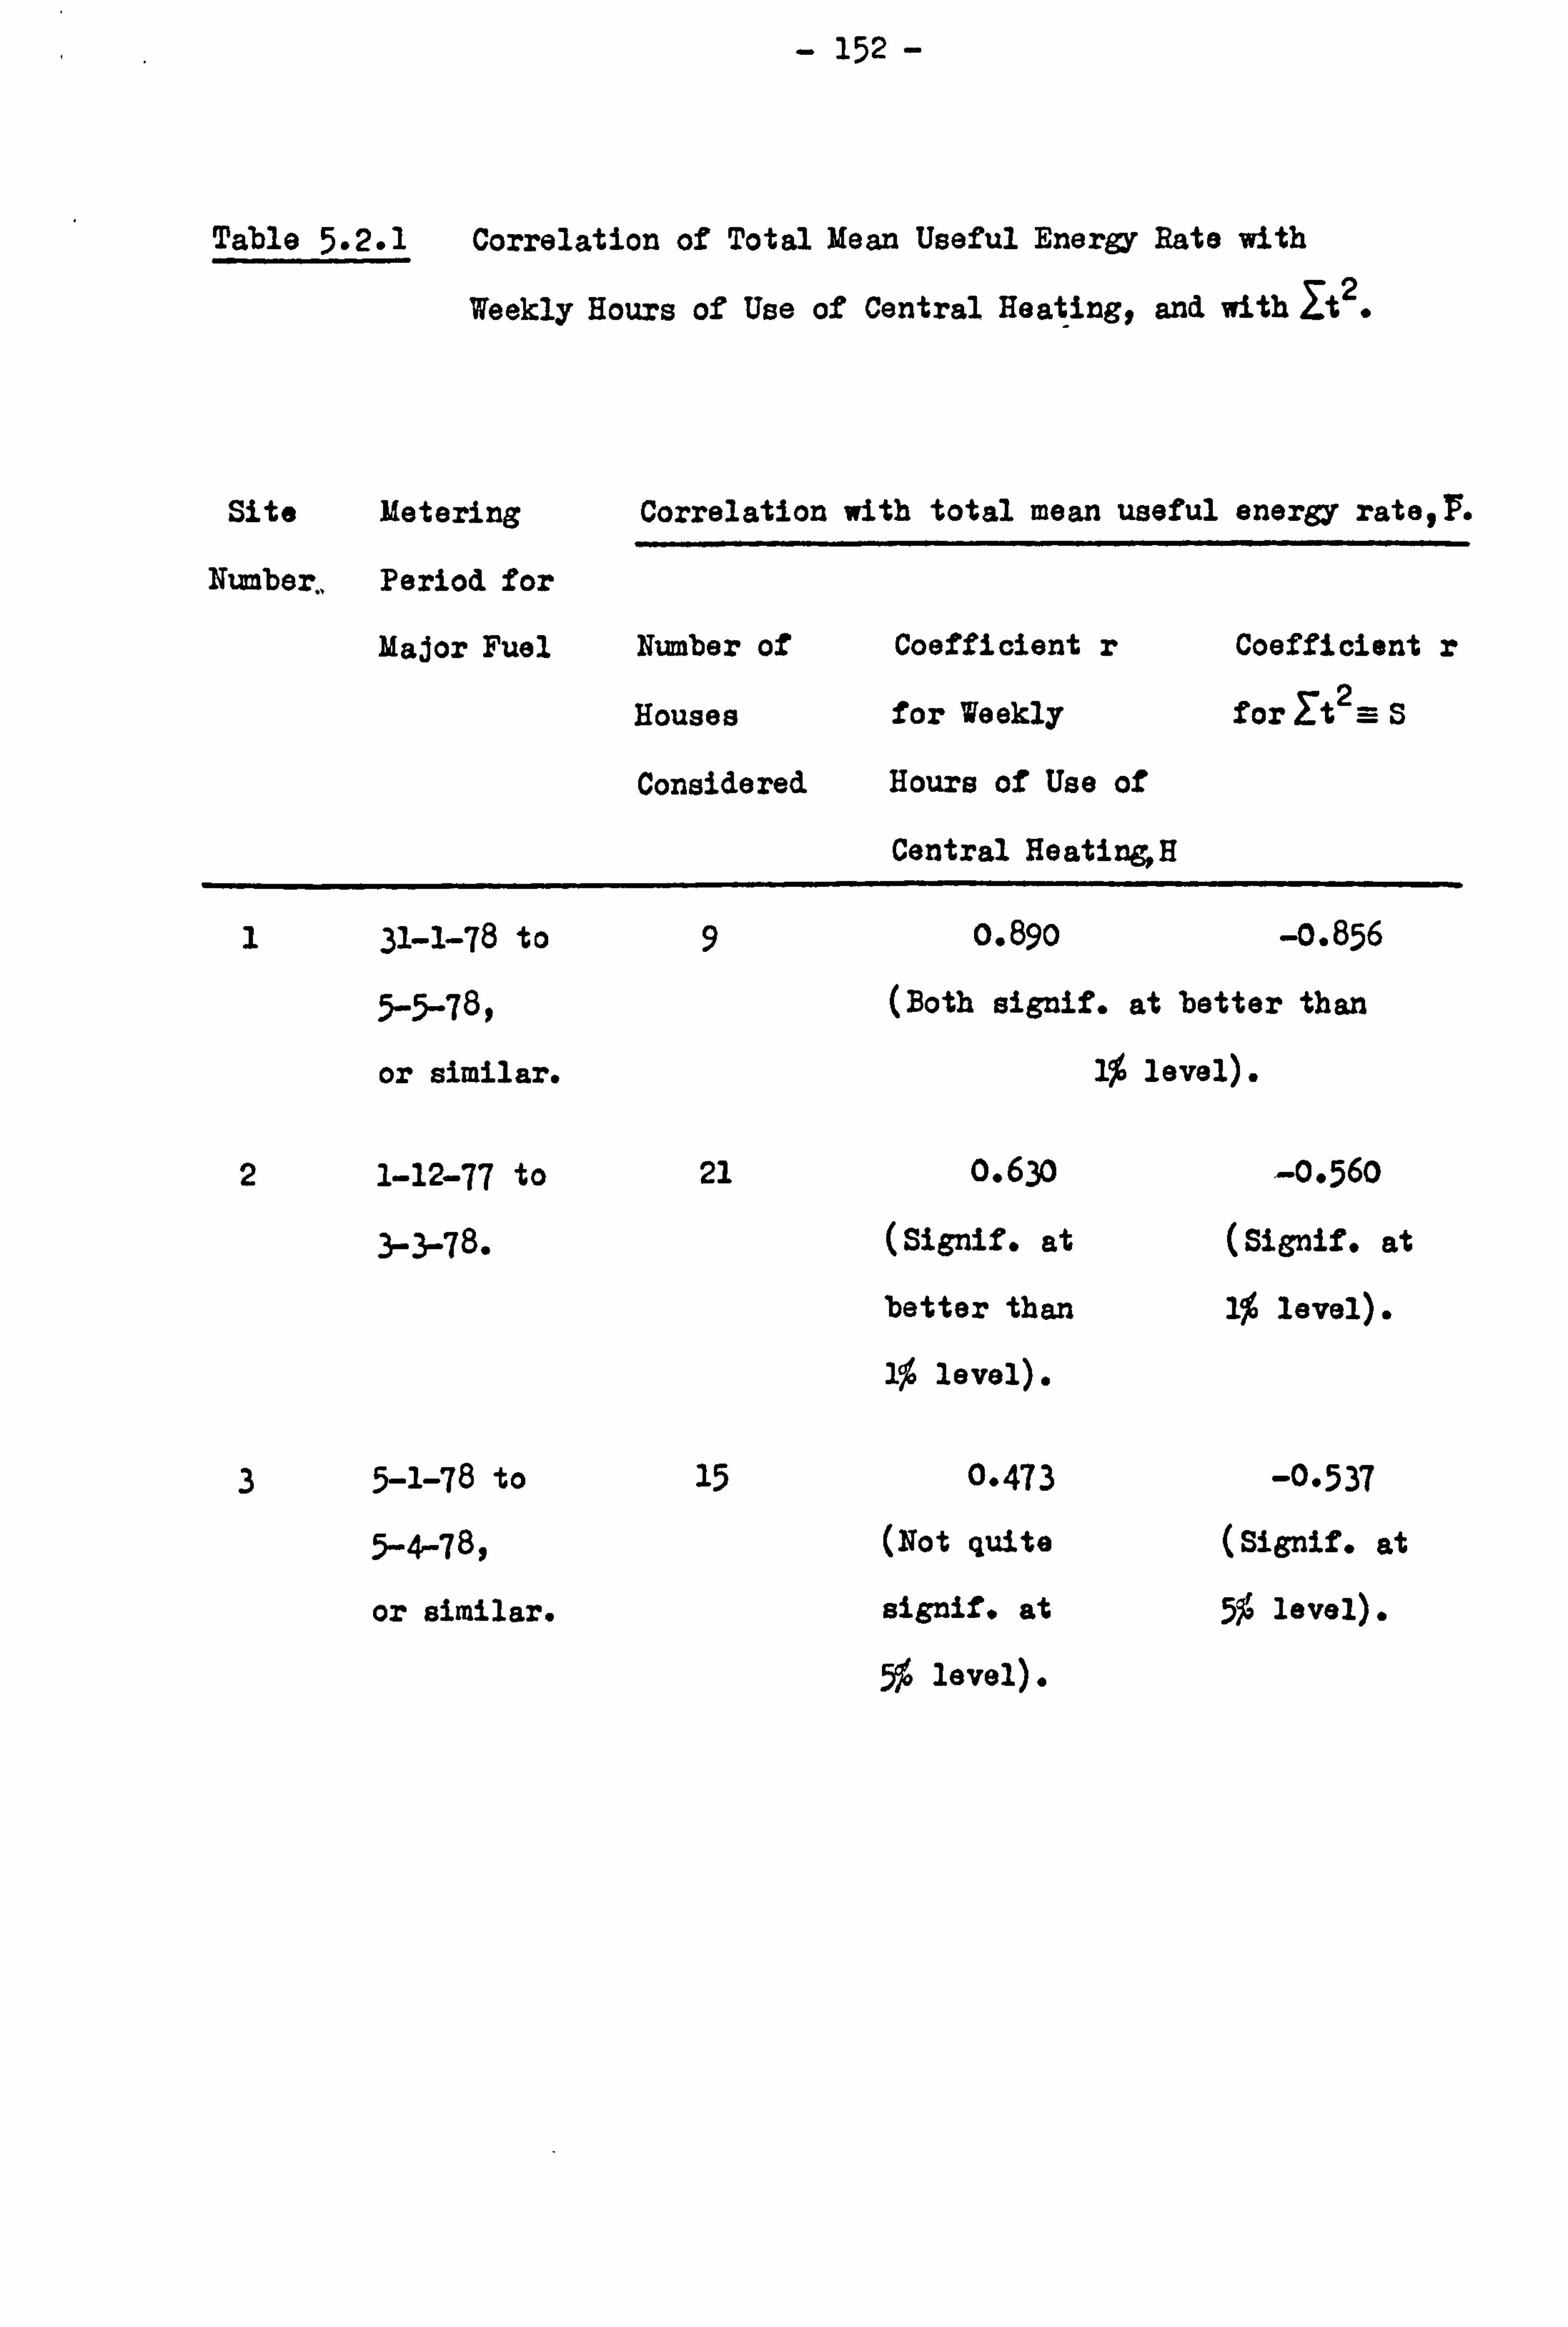
- 152 -
Table 5.2.1 Correlation of Total Mean Useful Energy Rate with
Weekly Hours of Use of Central Heatingp and with 7t2.
Site Metering Correlation with total mean useful energy ratepF.
Number., Period for
Major Fuel Number of Coefficient r Coefficient r
Houses for Weekly for . 7t 2= S
Considered Hours of Use of
Central HeatingH
1 31-1-78 to 9 0.890 -0-856
5-5-78p (Both signif. at better than
or similar. 1% level).
2 1-12-77 to 21 o. 63o -0-560
3-3-78. (Signif. at (Signif. at better than 1% level).
1% level).
3 5-1-78 to 15 0.473 -0-537
5-4-78P (Not quite (Signif. at
or similar. signif* at 5% level)-
5% level)-

- 153 -
-5.3 RESULTS OF REGRESSION ANALYSIS OF P
The interrelation of the total mean useful energy input rate from
fuels, Pj and responses to a number of items in the questionaire were
investigated for the three types of housespusing linear regression
techniques. Houses which were previously omitted from the linear r&-
gressions of total. mean energy rate against weekly hours of use of
central beating and against It 2
were again excludedp and the same fuel
consumption periods were considered. As beforep a few of the consump-
tion figures used for Type 3 houses were estimates.
The fuel metering periodsp with the corresponding mean external
air temperature in the case of the major fuelp and the numbers of
houses included in the analysis are sumarised in Table 5.3.1 .
Table 5.3.1 Fuel Metering Periods and Numbers of Houses
included in the Regression Analysis.
Fuel Metering Periods and No. of House Mean External Air Temperature Houses Houses
Type Oas Electricity Included Excluded
1 31-1-78 to 5-5-78 26-1-78 to 27-4-78.9 Nos. I and 10:
or similar. System faults.
4.77 OC. No- 5: No final
gas meter
reading.
2- 1-12-77 to 3-3-78. 3.220C.
21 The 7 houses
where paraffin and/or bottled
gas was used in the period.
3 5-1-78 to 5-4-78
or similar. 3.62 0 C.
20-12-78 to 22-3-78.15 No, 5:
Anomalously high
consumption.

- 154 -
5.3.1 Variables Involved in the Regressions
In addition to the total mean rate of input from fuels of useful
heat energyp F wattsp the following variables were involved in the
regressions: -
Ha Number of hours of use of central heating per week in cold weather.
S. It 2 as defined previouslyg and measured in h2 /wk.
v0 if no windows are regularly opened in cold weather.
I if some windows are regularly opened in cold weather.
Also for the regular opening of windows in cold weather,
w =10 for no windows,
1 for Upstairs windows onlyp
2 for downstairs windows only, and
.3 for both upstairs and downstairs windows.
For the use in Type 2 and 3 houses of warm air outlet grilles in cold
weatherv
G . 10 for some regular closingy
j for occasional closing, and
.1 for full use of the grilles.
n= Number of occupants.
M =f 0 if a 'hot fill' washing machine is not used.
I if such a machine is used.
C= Hours of use of an electrical heater in the sitting room which
coincide with the use of the central heating, per week in cold weather.
Ea0 for mid-terrace.
1 for and of terrace.

- 155 -
5.3.2 Simple R gressions
When a simple regression of a dependent variablep in this case
Pp against just one predictor variable is carried outp a correlation
coefficient, rg and a linear equation connecting the two variables are
obtained. The equation gives approximations top or predictions of 9
the value of F for each value of the predictor variablef and the predicted
values have only a fraction r2 of the variance of the actual values of
The correlation coefficientp rp or its squarep is therefore a
measure of the 'goodness of fit' of the straight line relationship
obtained 72
The statistical significance of the correlation betweenF and the
predictor variable does notp bowevert depend only on the value of r,
but also on the numberp Zy of pairs of values involved. Here Z is the
number of houses included in the regressionp and depends on the house
type. The values of Irl
corresponding to various levels of significance
axe given in Table 5.3.2 . The level represents the probability that
the variables are totally unrelated.
Table 5.3.2 Numerical Valuesp Irl p of the Correlation Coefficient
corresponding to Various Levels of Significance for
the Nurnbers of Houses Included in the SimPla Regressions.
House No. of Houses Level of Significance
Type Includedp Z 0-1,1-1 5% 10% 20%
1 9 0.898 0-798 0.666 0-582 0-472 2 21 0.665 0-549 0-433 0-369 0.291 3 15 0-76o o. 641 0-514 0-441 0-351
The correlation coefficients, significance levels and equations
obtained by carrying out simple regressions are given in Table 5.3-3.

- 156 -
Table 5.3.3 Results of the Simple Regressions
House Predictor
Type. Variable.
Correlation
Coefficientf
Level at which
r. Significant.
Equation obtained by
Regression.
Type I
H 0.890 1% F. 2045 + 10-77 H
B -o. 856 1% F- 3814 - 1-075 S
n o. 687 5% F- 1760 + 308-4 n
v -0.248 Not signif. at 20% F- 3355 - 280 v
W -0-149 Not signif. at 20% F- 3283 - 62.5 w
Type 2
H o. 63o lie. F- 1349 + 20-05 H
s -0-56o 1% F- 3820 - 1.201 S
v 0.561 1% F. 2594 + 559 v
w 0.672 0.1% F. 2591 + 244-5 w
n -0.229 Not signif. at 20% F- 3379 - 111-1 n
G 0.100 Not signif. at 20/, o F. 2900 + 105 G
Typ-e--a
H 0.473 io% F. 2478 + 7.84 H
s -0.537 5% F- 3700 - 0.760 S
n 0-562 e. Fm 2560 + 178-5 n
v 0-471 ioj�, Fm 2871 + 411 v
w 0-570 5% F. 2891 + 164-9 w
G 0-432 20% F. 2861 + 423 G

- 157 -
5.3.3 Multiple Regressions
P was regressed simultaneously against a number of predictor
variables 72
Various combinations of predictor variables' were tried, and
the results are given for the more successful of these in Table 5.3-5
A linear equation giving a prediction forFand a value for the 'multiple
correlationly R, are obtained. The predicted values have a fraction R2
of the variance of the actual values of F.
The statistical significance of the multiple correlation depends
on the number of predictor variables involved, as well as on the value
of R and the number of houses included. (See Table 5-3-4-) For all the
results appearing in Table 5.3-5 9 the level of significance was better
than 1%. It is to be noted that the 21 houses of Type 2 and. the 15
houses of Type 3 can be combinedl and significant multiple regressions
obtained for the combination.
For some of the multiple regressionsp the actual values of for
the houses have been plotted against the values predicted by the
regression equation. (Figures 5.3.1 to 5-3-4)-
Table 5.3-4 Values of the Multiple Correlation, Rp corresponding
to the 1% Level of Significance for the Numbers of
Houses Included in the Multiple Regressions.
House Number of Houses
Type Includedq Z
mber of Predictor Var
234
1 9 o. 886 0.937 0.970 2 21 0.633 0.691 0.738 3 15 0.732 0.793 0.840
2 and 3
combined. 36 0-494 0-544 0-584

- 158 -
Table 5.3-5 Results of the Multiple Regressions
House
Type.
Predictor
Variables.
Multiple
Correlationg R.
Equation obtained by
Multiple Regression.
Type 1
Hy v o. go8 2175 + 10.61H - 203v
HO M 0.952 F 1647 + 11-91H + 414M
H9 Up C 0-994 F- 1718 + 12.05H + 447M - 8-49C
Type 2
Hp w 0.776 F- 1609 + 13-52H + 180.5w
St w 0.797 F- 3328 - 0-942S + 211-4w
Hy w2 G o. 838 1086 + 18-71H + 160-1w + 368G
St wp G 0.821 3301 - 1.011S + 211. Ow + 205G
H, wp G, E 0.838 1118 + 18.68H + 155-Ow + 368G - 36E
-Typ-e3 Hp w 0.776 F- 2060 + 8-76H + 178.8w
S, w 0.817 F- 3414 - 0.832S + 178.8w
Hp w, 0 o. 8ol F. 1988 + 8.09H + 162.6w + 205G
S, w, G o. 841 F- 3247 - 0-781S + 162.9w + 204G
S, wp Gv E 0.847 3285 - 0.813S + 156-3w + 170G + 84E
Types 2
and 3
combined
H, wq G o. 81g 1705 + 11-05H + 181-5w + 209G
Sy wy G 0.836 P 3268 - 0.924S + 197-9w + 198G

- 159 -
Figure 5.3.1 Actual Value Of P agqinst Value given by, the
Regression Equation involving H9 N and Cs
House Type l..
A ct2,4[ uva tat
" I----- ---

- 161 -
Figure 5.3.2 Actual Value of I against Value given by the
Regression Equation involving Hp w and Gs
HouBe Type 2.
ActuaL_ViLtue nf
P-
Vmtue of F fredicted frOm H, ur cLrJ CT, waEks.
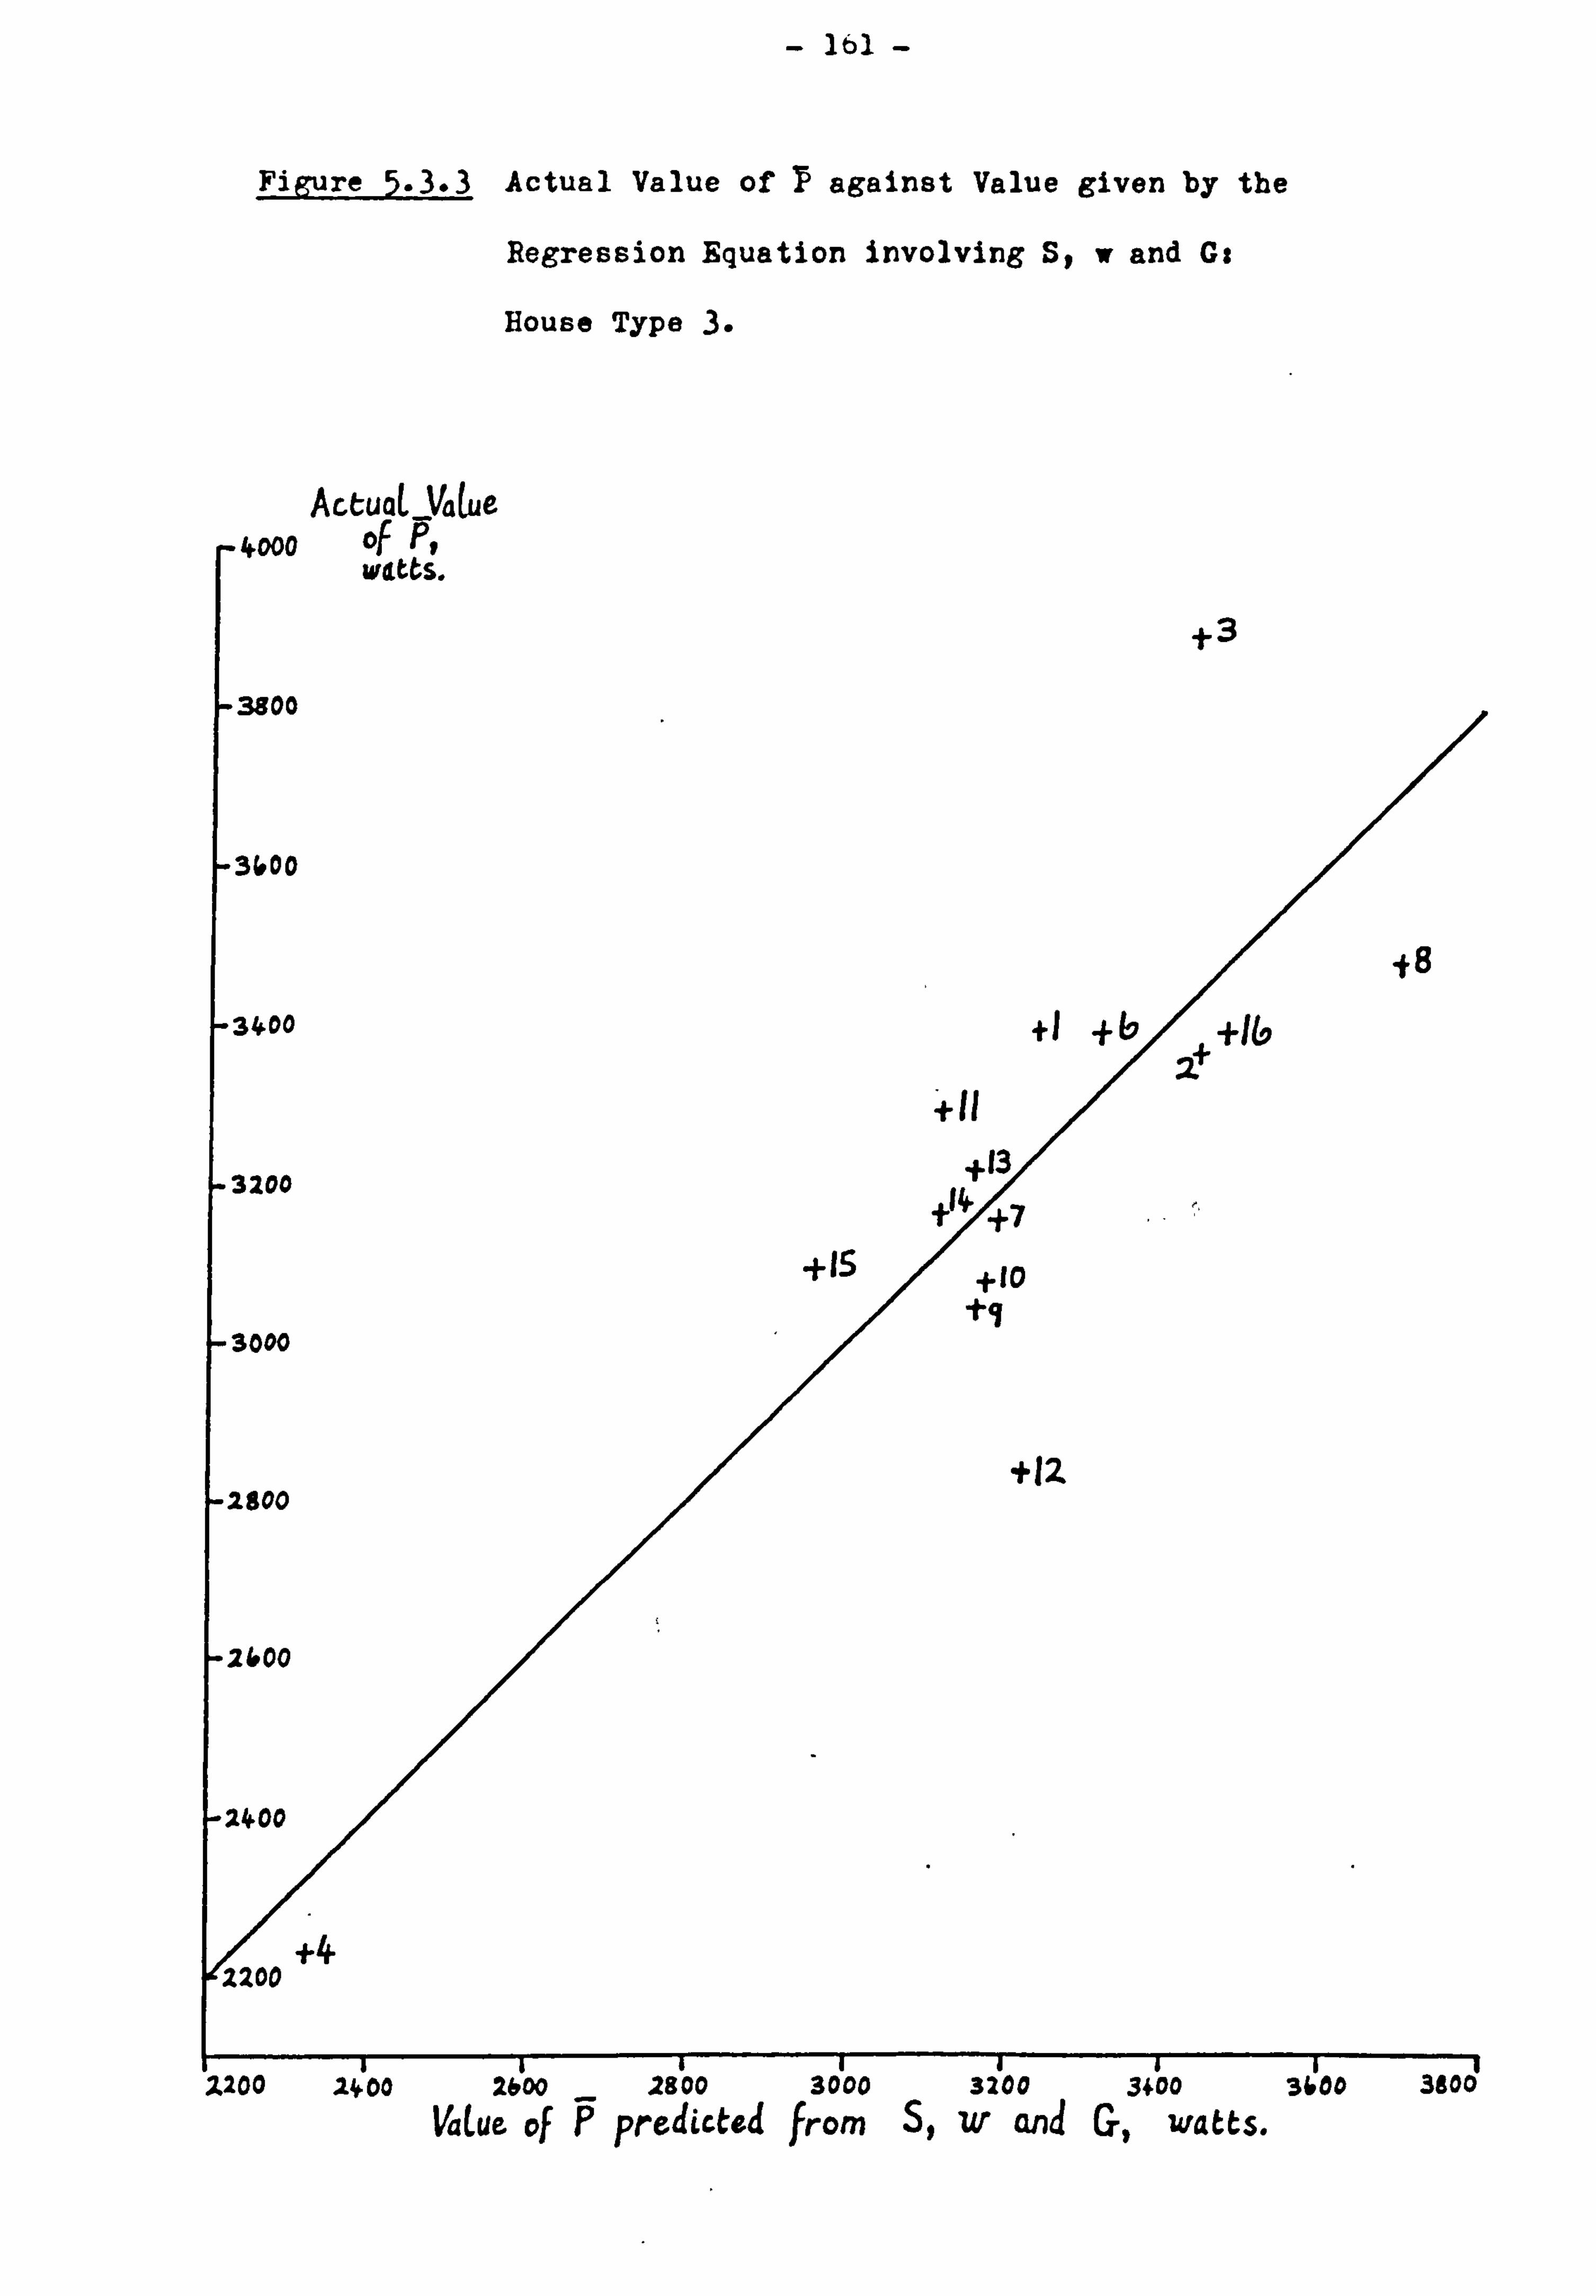
- 161 -
Figure 5.3.3 Actual Value of Y against Value given by the
Regression Equation involving Sy w and Gs
House Type
Actuat-Yaýe, Af P-
Vtu, of T pr,, dL, t-4 from 5, w and G, watts.

- 162 -
Figure 5.3.4 Actual Value of P against Value given by the
Regression Equation involving St w and 0:
House Types 2 and 3 combined.
AC&UdL-V4LUe. 4000 of P,
wabbs.
* sType 2.
* sType 3.
y,
3800
31
34
3
. 28
26
x4. / 7 +2.4.
-2000 +2.0
2. bý00 - 2800 3000 3200 34-00 31POO VaLue of P pregicteJ from -S, w anl Gr, watts.

- 163 -
5.3-4 Use of Central Heating: H and S,
In the simple and multiple regressionsp the coefficient of H.
varied between about 7.8 and 20 watts for each hour per week of central
beating use. For Type lp the range was about 10.6 to 12y for Type 2
it was about 13-5 to 209 and for Type 3 it was about 7-8 to 8-8-
The ranges of values for the coefficients of S were approximately
-0-94 to -1.20 for Type 29 and -0-76 to -0.83 for Type 3- The simple
regression for Type I gave a value of about -1.08. For all the
regressions the coefficients of S lay between -0-76 and about -1.20.
5.3-5 Window Opening: v and w
For Types 2 and 3P the four-valued variabley w, which weights the
opening of downstairs windows more beavilv than upstairog explained more
of the variance of than did the simple two-valued variable, v. This
might be expected, since the variable w was constructed in an attempt
to model the effect of window opening in a house where the lower floor
was at a significantly higher temperature than the upper floorp as would
be the case for Types 2 and 3P which-had central heating outlets on only
the lower-floor. Both v and w had only weak negative correlations with
F for the Type 1 housesp the correlation being stronger for v than w in
this case.
For the Type 1 housesp the simple correlation of with v was not
significant at the Will level. The coefficients of v in the equations
obtained for this house type by simple and multiple regression were
-280 and -203 watts respectivelyp the sign being opposite to that which
might have been expected.

- 164 -
For Type 2p the simple correlation of with the fouz--valuecl
variableg w$ was significant even at the 0.1% level. The coefficients
of w in the. regressions for these houses ranged from about 160 to 240
watts2 and so were all approximately 200 watts. This implies tbatp as
window opening increased from none to the regular opening of upstairs
and downstairs windowsp and w increased from 0 to 39 the mean useful
energy rate increased by about 600 watts,
For the Type 3 housest the simple correlation of P with w was
significant at the 5% level. The coefficients of w obtained in the
simple and multiple regressions varied from about 160 to 180 wattsp so
that extensive window opening would here seem to be associated with an
increase in the mean useful energy rate of about 500 watts.
5.3.6_ Warm Air Odtlet Grille Opening: G
On Sites 2 and 3 there was a mixture of full and limited use of
waim air outlet registers. For the Type 2 housesl and G had a very
low correlation coefficientf rp which was not significant at even the
20c, ý'a' levely and the corresponding correlation for the Type 3 houses
was significant at the 20ýo levelp but not at the MjL
The multiple regressions involving G (Table 5.3-5)gave consider-
. ably higher correlations which were significant -at the 1% level* In
thesep the coefficients of G had values of 205 and 368 watts for Type 2p
and ranged from 170 to 205 watts for Type 3p giving some idea of the
reductions inF associated with some regular closing of grilles.
5.3-7 Position in Terrace: E
E has the value 0 for a midterrace house and I for an end of

- 165 -
terrace position. For Types 2 and 3ý with their larger sample sizesp
it was included with wq G and either H or S in multiple regressions of
P. The resulting coefficients of E were small and of different sign,,
being -36 watts in the regression equation obtained for Type 2 and 84
watts for Type
The increase in fabric heat loss coefficient for the and of terrace
case appeared to result in no significant change in F. It may well be
that there was a compensating reduction in internal temperature levels.
5.3.8 Number of Occupants, n
I The simple correlation of F and number of occupantsj np was quite
strong for both the Type I and Type 3 houses included in the regressions.
This was associated with fairly strong correlations of n with each of
the central heating use variablesp H and S. (Appendix 3. )
For the 21 Type 2 houses using electricity as their only fuel,
all these correlations involving n were weakp the numerical values of
the coefficients being less than 0.24. This may be associated with the
fact that a considerable proportion of these households were supported
mainly by Social Security benefits.
- 166 -
Chapter
tuationsandEnergy-
Re1atedBehaviour
ccupant8

- 167 - Chapter 6
Situations and Energy-Related Behaviour of-Occupants
6.1 THE HOUSE TYPES AND METHODS OF HEATING
The three types of house included in the survey had differentkinds
of central heating and were located on separate sites. In order of
increasing age, the houses had gaa-fired microborev electric warm air
and gas-fired warm air beating. They havebeen designated Types 19 2 and
3 respectivelyp their sites being numbered in the same way. The house
types were all of the 3 bedroom, 5 person size.
6.1.1 site 1
This site contained 13 houses of the 3-5 sizop built in short terraces
of 3 or 4 units. These houses (Type 1) were completed in Sumner 1977 to
the thermal insulation standards of Part F of the 1974 Building Regulations. 73 'The hall and all rooms except the downstairs toilet were heated by
radiators on a microbore system. The gas-fired balanced-flue boiler was
mounted on the outside wall of the kitcheng and was activated by a time-
clock controller with manual over-ride, located in the airing cupboard.
(See Figure 6.1.1 .)
Space heating was controlled by a thermostat in the sitting roomy
mounted on a wall well away from the radiators but near the internal door.
The boiler also heated domestic hot water in a 140 litre (30 gall. ) in-
sulated storage cylinder fitted with its own thermostat. There was also
an electric immersion heater installed in the cylinder.
The sitep although within the urban areap was relatively exposedy
sloping steeply down to the North Eastp and the Type 1 house included
an external door which opened directly into the sitting room. Although
this type of house had the smallest total glazed area of the three types
investigatedt the sitting room glazing area was similar for all three.
In common with the other types of houses, the main method of space
beating used in the Type I houses was the central heatingg often coupled

- 168 -
with some use of a radiant electric fire in the sitting room. In just
one of the Type 1 houses covered by the survey was there some use of an
electric fire in another roomy this being the kitchen. Even in cold
weatberp with the exception of only one housep electric fires were used
for less than 6 hours a day, resulting in less than 40 'bar hours' of use
per week, and electricity consumptions of less than 5W in either of the
three-month metering periods of winter 1977/78. The exceptional casep
howeverp had about 16 hours of electrical heating of the sitting room on
cold days (about 160 bar hours per week)p and cooking was by electricity,
resulting in winter quarter electricity consumptions of about 8j W.
Gas consumptions in the heaviest quarter ranged from l4t4OO to
40P300 cu. ft. p representing useful energies, at 70/14- efficiencyp of 11
and 31 GJ. Seven of the twelve respondents on Site 1 cooked by gasp and
no use of any fuels besides electricity and mains gas was discovered.
During the cold weather in early 1978 there was a wide range of
weekly hours of use of the gas-fired central heating, from 521 hours/week
(described as an attempted economy measure) to four cases of constant use (168 h/wk). The mean was 108 h/wk with a standard deviation of 45 h/wk.
6.1.2 Site 2
This site included a considerable number of 3-5 bouseep and some
selection of houses was involved. The survey was confined to the upper
end of the sitep which was the more exposed. The houses (Type 2) were of
very similar design to Type 1, though having a different heating system
and windows of slightly larger area. They were completed in 1976 and the
first half of 1977- Construction had been spread over a number of yeargh
and the standard of thermal insulation did not meet the 1974 Building
73 Re6milations in all respects. The sitting room again contained an
external door.

- 169, -
Central beating was by ducted warm air from an electric storage
unit installed in a large cupboard in the kitchenp there being two out-
let registers in the sitting roomp one in the kitcheng and one in the
ball. (See Figure 6.1.2. ) Return air grilles were provided on the
landing and in the sitting room. The fan was controlled by a time clock
with *advance' buttong and by a wall-mounted thermostat in the sitting
roomp beside the internal door and almost directly over the main sittizg
room outlet register. The houses bad no gas supply and obtained el . eot-
ricity on the White Meter tariff.
The beating unit was normally charged at night during an 8-hour
cheap rate period starting between 11 p. m. and midnight G. M. T. Charging
was regulated by a storage block thermostat (input controller) which
could be continously varied from 'Low' to Ifighl by the userp but which
frequently gave faulty indications due to the displacement of the knob
on its shaft. Booster heating during the day could be brought in by
operating the 'Heat DA El (direct acting elements) switch, provided that
the input controller was set to 'High' and the core temperature had
fallen to a low value. Only three of the people interviewed were found
to use this facilityg one of these reporting only very occasional use.
The fan speed could be increased by means of a switch marked 'Fan
Boost'. Turning off the illuminated 'Fan Normall switch prevented the
fan runningg butt according to a number of tenantst though contrary to
the manufacturer's instruction sheet, this also prevented the unit
charging. A small unlabelled wall-mounted switch could also be used
to prevent chargingg but allow the fan to continue to be used. Operation
of a larger wall-mounted switch turned off the supply to both fan and
heating elementep and also caused the fan's time clock to stopy affecting
operating times unless the clock was reset.

- 170 -
Water heating was by electric immersion beaterv header and hot
water storage tanks being contained in an insulated unitt the hot water
storage capacity being about 140 litres (30 gall. ). Provided the
water beater switch in the kitchen was left onp the thermostatically
controlled immersion beater would be supplied with electricity for the
night rate period. The water heater could also be used during the day
by operating a timer switch located in the small store room, giving up
to 90 minutes of beating provided the kitchen switch was also on. The
timers in a number of houses werey boweverp found to stick in the 'On'
position from time to time. A neon lamp in the kitchen switch indicated
when the innersion beater was being provided with a supplyp but there
was no light to indicate when day ratep rather than night ratep elect-
ricity was being used.
The site sloped down to the Southp and# although in a city environ-
ments had a considerable area of higher open land to the North* Between
the Western edge of the site and an adjoining estate was a clear area
which varied in width from about 15 to 35 metres.
There was some use of paraffin and bottled gas beaters on this
site. Seven of the 28 responding households made use of such fuels in
the electricity metering quarter ending on the 3rd Marcbp 19789 and in
a further case use commenced in mid-Marcho Of the seven, there were tVW
who made no use of the central heatingp and two used it only for short
periods or occasional daysp amounting to less than 20 bours'use a week*
In six of the seven casesp use of anyelectric fires was low (less than
25 bar hours per week in cold weather)p and the total electricity con-
gumption of each of these for the above winter quarter was less than
11 W. In the seventh casep cold weather use of the electric fire was
about 95 bar hours per weekf and total consumption of electricity for the

- 171 -
quarter was 15 GJ- For the Type 2 houses where no paraffin or bottled
gas was usedg the total winter quarter consumptions ranged from 15 to
29 GJ.
On this sitep perhaps due to the absence of central heating using
a fuel as cheap as natural gasp there was a high incidence of heavy use
of electric fires. In 10 housesp the level of use was greater than 70
bar hours a week in cold weather. Only one of these used paraffin or
bottled gas. This large number of cases of heavy use of electric fires
among 28 respondents contrasts with the absence of heavy use on Site 3
(. 16 respondents)y and the single case on Site 1 (12 respondents).
In six of the Type 2 housesp electric fires were used in rooms
other than the sitting roomp taking the form of bedroom beating in three
of theseq and supplementary kitchen beating in the other three. In
addition# one of the latter three bad a 'heat and light bulb' as a
bathroom, beaterg andq in one of the former three bousesq paraffin beaters
were used in hall and landingg and bottled gas and paraffin heaters in
the sitting room. Apart from this casev the use of paraffin and bottled
gas heaters was confined to the sitting room.
For the 21 houses using no paraffin or bottled gas in the winter
quarterp the range of hours of use of central beating was restricted to mod-
erate values, presumably due to the high fuel cost. For these houses,
use in cold weather varied from 52f to 1031 b/wkp with a mean of 79-4
12/wk and a fairly small standard deviation of about 15 b/wk.
In the seven houses on this site using paraffin or bottled gas in generally
the cold weatherv there wasIless use of the central heatingg as might be
expected. The occupants of two of these did not use the system at all,
and in a third the system had only been charged up for a few days 0 use

- 172 -
during the winter. In a fourtbp the central beating was run for only
2 or 3 hours'each dayf amounting to 19 b/wk. (In this case, actual
charging of the unit was only carried out on three nigbts of the week,
although the fan was switched on for a few hours every day). Tbe
central beating use of the remaining tbree paraffin/bottled gas users
ranged from 56 to 112 h/wk in cold weather. For all seven houses, the
mean use of central beating was about 43 b/wkp with a large standard
deviation of similar size.
6.1.3 Site 3
Again the estate included a considerable number of 3-5 houses,
these being completed in 1970 and 19711 and three rows were selected for
investigation. Standards of thermal insulation were generally rather
lower than on the other two sitesp although there was some insulation in
the main front and rear infi3l panels. Of the house types covered by the
surveyp this type (Type 3) was alone in employing infillpanels in
addition to brick/block cavity construction for external walls. There
was a considerably greater total area of glazing in this casep although
the area of sitting room glazing was similar for all three types. Here,
bowever2 the sitting room extended from the front to the rear of the
housep with windows at both endep and contained no external door.
Space beating was by warm airy with outlets on the ground floor
onlyq distributed among the rooms as in Type 2. The beating unit was,
boweverl fired by natural gas, and the door of the beater cupboard opened
into the ball. Control was by time clocky with manual over-ridep and
by thermostats in both ball and sitting room. (The ball thermostat was
almost directly over a small outlet registerp but the sitting room
thermostat was a good way away from the two outlets in that room).

- 173 -
The occupants could select one or other of-the thermostats by setting
a switch in the beater cupboard to 'Eight or 'Lowtj thus putting the
heating under the control of the sitting room or hall thermostats
respectively. (See Figure 6.1-3. ) Many tenants were confused by this
feature, intended to facilitate the use of reduced temperatures during
the night under the control of the ball thermostat. In practicep the
switch was usually kept in one position.
Domestic hot water was provided by an insulated header/storage
unit fitted with an electric immersion heater. This was on an off-peak
tariff 9 where electricity should be available for 12j- hours in the night,
for 3 hours in the afternoong and also for the whole of Saturday and
Sunday. At other times there should have been no supply to the immersion
heater. In factp the Electricity Board's time clocks were often found
to be running ahead ofq or behindq time by a considerable number of hours.
However, this had little effect on the occupants because water beating
could in any case take place for a large fraction of the 24 boursq and
all respondents were satisfied with the hot water availability.
There was some use of a radiant electric fire in the sitting room
of about half of the Type 3 bousesp and some use of electric beating on
the upper floor was discovered in three bouseep being restricted to the
use of a wall-mounted radiant bathroom beater in two of these.
Electric fires were used for no more than 7 hours a dayp even in
cold weatherp and the number of bar hours per week was less than 70.
Domestic electricity consumptiong excluding the off-peak supply for water
heatingt was no mors than about 6 GT for a winter quarterp even in the
one case wherecooking was by electricity. Gas consumption in the heaviest
quarter ranged from 169200 to about 29pOOO cu. ft. 9 representing useful
energiesq at 70% efficiencyg of 22 and 22 GJ.

- 174 -
Use of the central beating system in cold weather varied from 49f
n to 12014L h/wk, the central heating being switched off just for the sleepi g
period in some cases. Mean weekly use was 90 h/wkq with a standard
deviation of about 22 h/wk - figures which lie between the correspondirg
ones for the other two groups of houses using no paraffin or bottled
gas. (See Table 6.1.1 .)
Table 6.1.1 Hours of Use of Central Heating in Cold Weather.
Hours of Use
Group of Houses Number of per Week in Cold Weatber
Houses Min. Max. Mean Standard
Deviation
Type 1: All respondents. 12
Type 2: No paraffin or 21
bottled gas useain the
quarter 1-12-77 to 3-3-78.
Type 2: Paraffin and/or
bottled gas useain the
above winter quarter.
521 168 108.0 45.1
5 2-', & 10-4 79.4 15.2
0 112 43.0 43.3
Type 3: All respondents. 16 49f 1201 90.0 21.8

- 175 -
Figure 6.1.1 Space and Water Heating System:
Type I Houses.
Time, CUCA] Co, &rctLe'r
Room The. r'MOSW;
&Lte. r
----
I

- 176 -
Figure 6.1.2 Space and Water Heating Systems:
Type 2 Houses.
S). dtL LOUIALgh WaLL swi Input; Off PPý4 k SUPPt5
AAL -I
MaLn EtemeAbS
He4t PAE Mrecý AWAI
WrWrizUJ SUPF 13 119EUTMLIJ
;w FaA Fin Red'
Normat Boost
Off Peak WE UAreStriaeadLIVEI=]ýý
Waber
Vag Time, Boost Týmer CSwv AN-)
Water HeaulAq swi"
OcacAeA)
plau
Warm W.,
sittin9 Room
................. NEUTAALI Uectrec rmmersfon Heate. -
with Bvdt-iA Theý-, %ostat

- 177 -
Figure 6.1.3 Space and Water Heating Systems:
Type 3 Houses.
LN Rg"
OFF ldci; lclol UArestrtcýed CLOCX rztectriCtty supfLy ON
cJei
SZtt;! Ay <_ Room
- -L Cos-"
Warm Air UAIL-
SIWAY <-- --4 HAL Room
Water Etuýric lftyý (on J#ApiAq er wttr LUa-iA Th6ii"OSUb
Off Pea k switch
EtatricIty swach

- 178 -
6.2 SOCIAL SITUATIONS AND PATTERNS OF ENERGY USE
6.2.1 Household Size and Composition
For all three types of house covered by the surveyp the average
number-of people in the responding households was close to four. There
were usually members of two generations of a family living together
in each house, but occasionally three generations or only one generation
were involved. The number of occupants ranged from one to seven, but
was only rarely less than three or more than five.
Only a few of the households included an Old Age Pen8ioner.
There was at least one person under 18 years old living in almost every
one of the Type 1 and 2 houses, their parents ages covering a wide
range. The ages of several of the children living in each of these
two types were less than two years. For the Type 3 bousesp howeverp
only just over half the responding households included someone under
18p and the youngest of these was six years old. Their parents ages
were at least 30. This difference was probably connected with the
fact that the Type 3 houses had been completed six or seven years
before the time of the survey and used for accommodating families the
which had then included children. Over half ofIrespondents had moved
in at that timeq, and all bad lived there for over two years. The
Type I and 2 houses were constructed more recently,
The occupants of each of the Type 1 and all but two of the Type
3 houses included a married couple. The two exceptions were occupied
by a mother and daughterp and by a father and sonsp reepectively.
Over a quarter of the Type 2 houses coveredp howeverl were occupied
by only a mother and childreny the father living elsewhere.

- 179 -
For the Type I and 3 houses the household size bad a fairly
clear influence on hours of use of central heating* For all twelve
responding households of Type 19 the correlation coefficient for
number of occupants and weekly hours of use in cold weather was 0-589-
For the fifteen Type 3 houses remaining when the anomalous case
(number 5) had been excluded the coefficient was 0-512. Both corre-
lations were significant at about the 5% level.
For the 21 Type 2 houses using electricity as their only fuel,
the correlation coefficient was only 0-194. The lack of a discernible
relationship may well have been associated with attempts to economise
by some of those living mainly on Social Security benefitev and with
the heavy use of electric fires in some of the houses.
6.2.2 Occupations and Income
In a number of cases, the household income consisted largely or
entirely of Social Security payments, Unemployment Benefit or the Old
Age Pension. This was particularly noticeable for the Type 2 houses,
where it applied to over a third of the responding households. On
this site2 the situation was usually associated with the father livirg
elsewherev and only occasionally with him being sick or unemployed.
In only two of the Type 3 houses were the occupants largely supported
by state benefits, these being payable in respect of old agep and in
a third the father was unemployed and received benefit which supple-
mented the earnings of other members of the family. In one of the
twelve Type 1 houses for zhich interviews were conducted the husband
was oick, and in another disabled. Both received benefits which added
to other family income. No other adult male occupants of these houses
were lacking employment.

- 180 -
Almost all the men who were in employment performed manual work
requiring varying degrees of skillo though a few held supervisory or
administrative posts. Most of the women also went out to work. They
were often involved in manual work in factories, though some served
in shops, carried out secretarial duties or worked in relatively low-
paid jobs with the Education and Social Services Departments of the
local authority. While the employment of fathers and their sons and
daughters who were no longer at school was full time in naturey about
two thirds of the mothers who went out to work from the Type 1 and
Type 2 houses, and about a quarter from the Type 3 houses worked on a
part time basis. Only one of the mothers in full time employment had
a child who was under school agep there being no such children living
in the Type 3 houses surveyed. For Types 1 and 2y about half the
mothers with part time employment had at least one child under five
years old.
Respondents were asked for total household income after stoppages
on the basis of a number of categories. Most were willing to attempt
to provide an answerv but were sometimes able to include only the
board paid by working sons and daughters. Some gave actual figures
for incomey while two on Site 3 declined to give financial informatiC4
and two more on the same site only gave some idea of the housekeeping
money they received. As a result, it was not possible to determine
whether there was a relationship between household income and energy
use.
When a category of total household income after stoppages was
identified by a respondent, it normally represented an amount between
E30 and L90 per week. A woman then living by herself in a Type 2 house

- 181 -
put her weekly income,, consisting of Supplementary Benefit payments
which included rentp at only E26. For Type 2 and 3 houses, a few
households were in the E90 to E105 a week categoryp and the weekly
income was greater than this for one responding bousebold on each of
Sites 1 and 3-
Then the figure was less that 9-45 a weekt there was rarely any
member of the household in full time employmentv and when it was more
than E45 there was almost always someone in such employment. Total not
incomes over E90 a week always included the earnings of more than
one person.
6.2.3- Occupancy Patterns
Respondents were asked how many adults and children there would
normally be in their homes each day of the week in winter at the
following times: 10 a. m-v 3 p. m., 8 p. m., and 2 a. m* From their
replies, the number of these times per week for which there would
usually be no one in the house has been calculated.
For Type I houses, the number of such times per week ranged from
0 to 71 the average being 1.9. For both Type 2 and 3 houses, the
number varied from 0 to about 14P and in both cases the average was
about 3-8- Just under half of the houses of each of the three types
usually had at least one person in them at all of the times.
For the Type I and 3 houses the amount of time for which the
house was occupied did have some influence on the use of the central
beating. When one of these houses was normally occupied at all the
times given abovep the central beating was used for at least 98 hours
a week in cold weather. There was one exception to thisp but the

- 182 -
house in question was occupied for much of the day time only by a
night shift worker asleep in bed, and low use of central heating was
reported. (The exception was house number 5 on Site 3, which was
excluded from the regressions because its total mean useful energy
rate was particularly high for the reported hours of use).
The effect was very clear for the Type 3 houses. Apart from
number 5t those houses which were normally empty up to two of the times
per week bad a central beating use between 98 and 121 hours/week.
For those empty between two and seven of the times a week on averaget
the central beating was used for between 80 and 90 h/wk. The four
remaining houses which were empty more than seven of the times per
week had uses of central beating ranging from about 50 to 80 b/vvk.
The Type I houses exhibited a similary though less clearly defined,
trend.
The number of times for which a house was empty per week and
the weekly hours of use of the central beating were, bowevers very
weakly correlated for the Type 2 houses where no paraffin or bottled
gas was used. The low income relative to needs of the considerable
number of these households supported largely by Social Security
paymentel coupled with the high cost of electricityp which was their
only heating fuelo resulted in some attempts to reduce consumption.
(One respondent claimed to watch television at night wrapped in a
quilt to keep warm). In some cases part of the Social Security payments
were being held back towards future electricity bills, and there was
sometimes the impression that this would automatically cover the cost,
resulting in a reduced desire to economise on fuel. The situation was
further complicated by widely varying use of electric fires in this
type of house.

- 183 -
6.2.4 Use of Hsating Controls
Room thermostat settings were varied in a number of the
houses, often being set higher in colder weather. The thermostat
was sometimes used as anlon/offlcontrol by alternating between
extreme high and low settings. A number of respondents suspected
there were faults and inaccuracies in their thermostats. It was
not generally possible to obtain an accurate assessment of the level
of heating from the reported thermostat settings*
Some use was made of the time clock in almost all of the Type
2 houses covered by the survey. The time clock used in these
allowed manual advance of switching times buty without regular
interventionj would eventually resume control. Manual control was
straightforward in the other two house typesp and the time clock
was used in only a half of the Type I houses and a quarter of the
Type 3 houses.
The electric storage heating system in the Type 2 houses seemed
more confusing to occupants than either of the systems using natural
gas. An alteration of the setting of the charging thermostat on
the space heating storage unit would have bad no noticeable effect
until the following day, and was often made much more difficult by
the control knob giving false indications. The unit had a large
number of associated controls which often ciused confusion. The
user's time clock was sometimes disturbed by its power being turned
off accidentally. One respondent bad continued to charge up the
space heating unit in hot weatherl thinking this was unnavoidable
if water were to be heated during the night. The complexity of the

- 184 -
storage unit controls probably encouraged use of electric fires when
the occupants could have kept waim more economically by an increased
use of stored beat.
The water beating system of the Type 2 houses caused further
confusiont and a number of respondents were not sure how they could
beat minimise its use of expensive day rate electricity. This was
aggravated by day rate booster timers, which sometimes stuck in the
'on' position when set for a short period of use at the dearer rate.
Overbeatingt resulting in boiling of the watery was also an occasional
problem. Some users seemed to have very little understanding of
the water heating system, and those who were making good use of it
could still be caught out by a faulty timer* A larger hot water
storage tank would have been a considerable improvementp allowing
greater use to be made of night rate electricity. Advisors from
the Blectricilty. Board, had visited many of the respondents.
The occupants of the Type I and Type 3 houses seemed to experi-
ence less difficulty with their space and water heating systems.
The direct-acting gas-fired space beating seemed to be simpler to
operate than a night storage systemp though there were some complaints
of slowness of response from the wet system in the Type I houses.
The water heating associated with the wet system appeared to be
satisfactory and to be well understood by the respondents. The
electrical water heating in the Type 3 houses operated on an off-
peak tariff which made electricity available for much of the time,
resulting in adequate hot water at a reasonable price. (This was
an old tariff which had been restricted to existing installations).
There was some confusion in these houses as to the function of the

- 185 -
'High/Low' switch which selected either the living room or hall
thermostat and some users adjusted both the=ootats. This was
unlikely to have a great effect on either their comfort or energy
uses
6.2.5 Use of Domestic Appliances
No mains gas was available on Site 29 and cooking was by
electricity. On Sites I and 3 there was a choice of fuels for
cooking. Gas was used in just over half of the Type 1 houses and
all but one of the Type 3 houses for which interviews were conducted.
Electric kettles were used in almost all the houses which had
electric cookers and in about three quarters of those with gas
cookers.
Use was made of a washing machine in almost all of the houses.
In a few casesy howeverp clothes were taken to a laundrette. There
were no tumbler driers in the Type 1 housesp and they were used in
only three houses of each of the other types.
6.2.6 Window-Opening
The correlations between the four-valued window-opening
variablev wo and the number of occupantsp nj both for the twelve
Type 1 houses and for the fifteen Type 3 houses remaining when the
anomalous case (number 5) had been excluded, were positive and
significant at the 20% level, the correlation coefficients being
0.447 and 0.377 respectively. Window-openingg thereforeq tended to
increase with household size. This was also found to be the case in a
survey reported by Brundrett. 74

- 186 -
However, for the 21 Type 2 houses using electricity as their
only fuel, the correlation is negative and significant at the 5% level,
r having the value -0-451- So. in this caseo perhaps as a result of
the financial constraints referred to abovep larger households were
associated with less window-opening.
There was no significant correlation between w and the number of
the standard times per week for which a house was usually emptyfor
either the Type 2 or Type 3 houses. For the twelve Type I houses,
however, the correlation coefficient was -0-492t and there was a
tendencyp significant at the 10% level, for window-opening to occur
less in houses which were empty more often.

- 187 -
6.3 SATISFACTION AND OOMFORT
6.3.1 House Wamth Satisfaction
Satisfaction with the waimth of the houses was generally
fairly lowv except on Site 3 (gas-fired blown air beating)j where
most respondents thought their houses were usually as warm as they
would Me and the rest were undecided, often due to cold bedrooms.
On Site I (fullgasý-fired mocrobore central beating) only a
third of the 12 respondents were satisfied with the warmth, and one
was undecided. The sitting room was often considered to be in-
adequately heated. Of the 9 houses of this type included in the
regressionsp the 3 where the respondents were satisfied with the
warmth of their houses all bad lower than average useful energy input
rates.
Of the 21 Type 2 houses vbich used electricity as their only
fuelp only 6 were usually found wa= enoughp respondents being unsure
in 4 others. Satisfaction was apparently unrelated to energy use.
Howeverg over half of the 7 houses of this type where use of paraffin
or bottled gas was found were reported to be warm enough.
6.3.2 Draughts and Damp
The Type 1 houses were the most recently completed of the
three types and there were complaints of draughts by all respondents,
though some moves had already been made by the occupants to reduce
them. The Type 2 houses covered by the survey had generally been
occupied rather longerv and the tenants had installed substantial
amounts of draught stripping, though draughts remained in most.

- 189 -
water as they would like.
In the Type 2 housesp with their Wbite Meter electricity
water beatingv only about half the respondents reported that they
usually had sufficient hot waterv the main complaint being of too
little storage capacity for working entirely on night rate
electricity.
6.3.4 General Satisfaction with Heating Arrangements
Just under half of the respondents in the Type I houses con-
sidered their room and water heating arrangements to be generally
satisfactory, and half of them would have liked a gas fire in the
sitting room. Nevertbelessp two thirds of them preferred their
present arrangements to what they bad in their previous homes.
Almost half of the respondents in the Type 2 houses were also
generally satisfied with their room and water heating arrangements; p
but, in some casesv only because they were using paraffin or bottled
gas heaters. About three quarters would have preferred methods of
space heating using mains gasp and about half would have liked gas-
fired water heating. Less than a third of the respondents preferred
their present room and water heating arrangements to what they had
had previously.
By contrast, about three quarters of the respondents living
in the Type 3 houses found their room and water heating arrange-
ments generally satisfactoryp and a similar proportion preferred
present arrangements to previous. Few changes were desiradv though
a few occupants would have preferred full central heating and gas-
fired water heating.

- 190 -
It would seem that the all-electric system installed in the
Type 2 houses failed to meet the needs of many of the occupants,
partly due to limited means and lack of understanding of the system.
The gas-fired 'wet' central heating in the Type I houses often
failed to heat the sitting room adequatelyp perhaps because of the
external door. Satisfaction levels were much higher in the Type
3 housesy helped9no doubtp by the electricity for water heating
being obtained on a particularly suitable tariff.

- 191 -
Cha
atLossCharacteristi
andTherma1ModeI
theHouses.

- 192 - Chapter 7
Heat Loss Characteristics and Thermal Model of the Houses
7.1 HEAT LOSS CHARACTERISTICS OF THE HOUSES
Information concerning the construction of the 3 types of houses
involved in the survey was obtained from the architects' drawings and
by consulting the architects and clerks of works directly# Due to certain
changes in specificationg it was necessary to correct some dimensions
shown on drawingsv using photographs of the completed houses.
Reliable value's could then be calculated for the areas of the
various elements which make up the shells of the houses (Table 7.1.1
These areasy together with details of the materials used, foxm the basis
for assessing the beat loss characteristics of each type of house.
U-values were deduced for the various elements using the methods 60
proposed in Section A3 of the I. H. M. Guidep and are presented in Table
7.1.2. Products of areas and U-values gave the beat loss coefficients
of the elements (Table 7-1-3 )9 which were summed to give the beat
loss coefficient for the whole fabric. The volume of air involved in one
air change was also calculated for each type of house (Table '7-1-4 ).
The elements are considered individually belowp and the resulting
tables follow on pages 199 to 202.
Glazing
Actual areas of glazingg excluding window and door framesq were
calculated. The total areas of glazing in the sitting rooms of Types 19 2
and 3 are similarg being 3.789 4.25 and 4.35 m2 respectively. Employing
20 the U-value of 5.6 W/m C for single glazing subject to normal exposure
results in beat loss coefficients of 21*29 23-8 and 24-4 W/C-
There is greater variation in the total areas of glazing per house,
these being 8.06p 10-03 and 14-73m 2 respectively. The corresponding
heat loss coefficients are 45-li 56.2 and 82-5 W/0C.

- 193 -
7.1.2 Exposed Frames and Wooden Parts of Doors
The timber window and door framesp wooden parts of external doors
andp in the case of Type 3 houses, the exposed timber framing surrounding
the infill panels were considered together, their total area being found
by subtracting the areas of the other elements present in the openings
in the cavity walls from the total area of the openings. These wooden
components were assumed to haveon averagev the, same thermal transmittance
as a 60mm thickness of softwoodp which was calculated as follows: -
Thermal Resistance (m 2o
CAT)
Internal surface resistance, horizontal
beat flowp 0.123
Resistance of 60mm of softwoodp with a
thermal conduotivitY of 0.13 IT/m 0C
across the grainp 0-462 1
External surface resistancep normal
exposurep 0-055
:. Total resistance, Rwo. 64o
So the U-Value a l/R
- 1-56 W/M 2 oC.
The total areas of exposed frames and wooden parts of doors
2 present in each house of Types 19 2 and 3 are 6.60,6.26 and 11-77 m
respectively, resulting in heat loss coefficients of 10-39 9.8 and
18-4 W/OC-

- 194 -
7-1-3 Brick/Block Cavity Walling
Although the thirJcness of block used in the cavity walls of all
three house types was 100mmq the blocks varied in materials and designo
resulting in'different thermal transmittances.
The cavity walling of Type I houses has a fletton brick outer leaf
and the blocks used for the inner leaf have two cavities in each blockp
these being filled with a foamed plastic. The block manufacturers claim
a face-to-face thermal resistance of 0.601 m2o C1W. Assuming that the
conductivities of the brickwork and lightweight plaster are 0-84 and 0.19
W/M 0C respectively leads to a result of 0-87 W/m2 OC for the U-value
of the cavity walling.
The outer leaves of the Type 2 houses are built of denseq non-
fletton bricks. Steam-cured lightweight granular blocks were used for
inner leaves. For such a cavity wall, the block manufacturer quotes a
U-value of 1.18 W/M 2 OC resulting from measurements at 2-4% moisture
content.
The inner leaves of the cavity walls in Type 3 houses use solid
clinker blocks. Tests carried out by the London Brick Company on a
similar cavity wall forming part of the outer wall of a test laboratory
have been reported by Board and Dinnie !5A
result of 0-157 m2 oC/W
was obtained for the thermal resistance of the solid clinker block
inner leaf measured from face to face. Use of this resistance. and the
above values for the conductivities of the brickwork and lightweight
plaster leads to a U-value of 1.43 W/m 2 OC for the cavity walling. of
Type 3 houses-
The areas of brick/block cavitv wallinsp through which beat is lost
to the front and the rear of the dwelling space are 51-41Y 49-71 and

-195 -
28.11 m2 respectively for Type 11 2 and 3 houses- Combining these areas
with the appropriate U-values gives heat loss coefficients for front/
rear cavity walling of 44.71 58-7 and 40.2 W/*C.
End of terrace houses also lose heat through an end wall of the
same brick/block cavity construction. The internal areas involvedp
excluding the roof spacep are 33-33P 33-00 and 32-43m 2 respectivolyl
resulting in additional heat losses with coefficients 29. Op 38-9 and
46-4 W/oC-
-7.1.4 Infill Panels
the These are used in Type 3 houses only. Most oflarea occupied by
panels is-accounted for by two large plywood-faced, insulated panels
filling the space between the sitting room windows and the bedroom
windows directly abovep one at the front and one at the rear. They each
consist of a timber frame faced with 9-5mm plasterboard on the inside
and external grade plywood on the outside. The space between these is
about 100rin thick and contains a 75= thickness of lightweigbt glass
wool quilts and sarking felt is sandwiched between the plywood and the
frame. Neglecting the thermal bridging effect of the framep which is
small for timberg and regarding the structure as having a singlep low-
emissivity airspace about 25mm thickg leads to a calculated U-value of
0-42 U/M2 OC. Thus the total area of the two panels, 5-93 m2 , has a beat
loss coefficient of 2-5 W/OC-
An asbestos-sheeted panel occupies the space under each sitting
room window, and a similar section of panelling forms a small part of
the external wall of the downstairs toilet. Each panel consists of two
6mm thick asbestos cement sheets spaced about 20mm apart by a timber frame.
The timber has a similar thermal resistance to the airspacey and can be

- 196 -
meglectedq giving a calculated U-value of 2-58 W/m2 o C. The total area
of such panels in the house is 2,47m 2, and these will, therefore, have
a total beat loss coefficient of 6-4 W/oC-
The rest of the panelling consists of the same type of aBbestos-
sheeted panel backed up by a 100mm clinker blockwork inner leafj a
cavity being left between the two elements. This construction is used
below the kitchen window sill and below a small sill in the downstairs
toilet, the total area present being only 1-85 m2- Assuming lightweight
plaster is used leads to a U-value of 1.27 W/m2 OC and a total beat loss
coefficient of 2-3 W/o C.
7.1.5 Roof Structures
In all three cases the roofs have a trussed timber frame covered with
sarking felt and concrete tiles, the pitch being 22 . The first floor
coiling, consisting of 12-7m plasterboard fixed to Joistsj forms the base
of the structure and supports thermal insulation (liebtweight glass wool.
quilt).
All Type 1 houses and most of the Type 2 houses surveyed had a 75mm
thickness of insulationt resulting in a U-value for the roof structure
of 0.414 W/M 2 OC referred to the plan area. Type 3 houses were originally
fitted with a 25mm thicImeseq giving a U-value of 0.860 W/m2 oCq though
a few respondents seemed sure that the thickness actually present in
their houses was significantly different to this. A few of the Type 2
house included in the survey had only 25mm insulationg having been com-
pleted before more stringent Building Regulations came into force.
Applying the appropriate internal plan areas to the above U-values
gives beat loss coefficients of 18.1 W/OC for the Type I houses, 18-3
W/OC for most Type 2 houses and 38-7 W/OC for most of the Type 3 houses.

- 197 -
Ground Floors
In all three cases the ground floors are of solid construction and
laid with no insulation. The 1970 I. H. M. Guide 60
gives U-values
for such ground floors based on the following version of a formula 66
derived by Macey:
1.816 1+2.6 tanb -1 s+0.3
where U W/m2 OC is the average U-value of a reatangular floor, simaller
dimension s metres and larger dimension L metresp bounded by an external
wall of thickness 0.3m.
I L
0.3
The floor of a mid-terrace house effectively loses heat through
only two edges and has almost the same average U-value as an infinitely
long floor of the same b3wdthp S. Sol to calculate Up L is set equal
to infinity and s set equal to the distance between the inner faces of
the external walls. For both Type I and 2 houses, this distance is
W M2 o(;. 6.650m, giving a U-value of 0-521 /1 For Type 3 houses the breadth
of the floor slab is 6-706m, resulting in a calculated U-value of
0-518 WIM 2 OC for the mid-terrace case*
In an end of terrace housep the floor loses heat through three
sidesp and has virtually the same average U-value as a floor of the game
breadth and twice the lengthp which is exposed on all four sides and,

- 198 -
Ibereforeg covered by the formula. So S is set equal to the distance
between the front and rear external walls, and L set equal to twice
the distance between the end wall and the party wall:
Actual L_. ýMirror. Image Floor of Actual Floor
(added for calculation)
The breadths, sp are therefore the same as used above. For Type I
houses L is obtained by doubling an end wall to party wall distance of
6-592my and the formula gives an end terrace U-value of 0.678 WIM 2 oC.
For Type 2 the distance to be doubled for L is 6.650m and the resulting
U-value is 0.677 W/m2 OC. As in Type 29tbe floor of a Type 3 bouse is
square rather than oblongy so that the required L is equal to 28. The
calculation for the Type 3 end of terrace house then gives an average
U-ValUe for the ground floor of 0.673 W/m 2oC.
I The plan areas lying within the external and party walls of house
types ly 2 and 3 are 43-84P 44.22 and 44-97 m2 respectively. Applying
these areas to the above U-values gives heat loss coefficients of 22,8,
23.0 and 23-3 W/OC for the mid,. terrace situationt and 29-7y 29.9 and
30-3 W/OC for the ground floors of end of terrace houses,

- 199 -
Table 7.1.1 Areas of'Elements forming the shells of the House
Typesq as required for evaluation of heat lose.
Unit: m2
Plan area (internal)
Glazing:
Sitting room
Total
Exposed Frames and Wooden Parts of Doors
Brick/Block Cavity Walling (internal area):
Total for Front and Rear elevations
Infill Panels:
Plywood-facedvinsulated
Asbestos-sheeted (no backing wall)
Asbestos-sheeted with Blockwork
inner leaf
Total area of Front and Rear Elevations
(internal)
For End of Terrace: Extra Brick/Blor-k
Cavity Wallingp End Elevation
(internal area, excluding roof
space).
TYpe 11 Type 21 Type 3
43-84 44.22 44-97
3.78 4.25 4.35
8. o6 10-03 14-73
6.60 6.26 11-77
51-41 49-71 28.11
66. o8
5-93
2.47
1-85
65-99 1 64-86
33-33 1 33-00 1 32-43

- 200 -
Table 7.1.2 U-Values of the Elements forming the Shells
of the House Types.
Unitt W/m 2oc
Type II Type 21 Type
Glazing 5.6 5.6 5.6
Exposed Frames and Wooden Parts of Doors 1-56 1-56 1-56
Brick/Block Cavity Walling o. 87 1.18 1-43
Infill Panels:
Plywood, facedy insulated 0.42
Asbestos-sheeted (no backing wall) 2-58
Asbestos-sheeted with Blockwork
inner leaf - - 1.27
Roof Structure 0-414 0-414 o. 86o
Ground Floor:
Mid, terrace 0-521 0-521 0-518
End of terrace 0.678 o. 677 0.673
Increase for End of terrace
situation 0-157 0-156 0-155

201 -
Table 7.1.3 Heat Ioss Coefficients for the Elements forming the
Shells-of the House Types.
Unit: W/OC
Type II Type 21 Type
Glazing:
Sitting room 21.2 23-8 24-4
Total 45-1 56.2 82-5
Exposed Frames and wooden Parts of Doors 10-3 9.8 18-4
Brick/Block Cavity Walling: Total for
Front and Rear elevations 44.7 58-7 40.2
Infill Panels:
Plywood-faceds insulated - - 2-5
Asbestos-sheeted (no backing wall) 6-4
Asbestos-sheeted with Blockwork inner
leaf - - 2-3
Total for Front and Rear Elevations 100.1 124.7 152-3
Roof Structure 18,01 18-3 38-7
Ground Floor: Mid-terrace 22.8 23-0 23-3
Total Fabric Heat Loss Coefficient:
Mid, terrace 141-0 166. o 214-3
Additions for End of Terrace situation:
Brick/Block Cavity Wallingo
End elevation 29.0 38-9 46-4
Increase in Coefficient for Ground floor 6.9 6.9 7.0
Total Fabric Heat Loss Coefficient:
End of Terrace 176.9 211.8 267-7

- 202 -
7.1.7 Air Volunes
The volumes of air involved in one air cbange were calculated
separately for the upstairs and downstairs living spaces of each type
of housep neglecting the recesses of windows and doorsp and the
intrusion of internal walls and doors, cupboards and the contents of the
house. Each volume is simply the product of the appropriate internal
plan area (calculated for the rectangle formedt in planj by the inner
surfaces of the external and party walls) and the ceiling height,
The volumes are obtained in Table 7.1.4 below.
Table 7-1.4 Derivation of the Volmes of Air involved in One
Air Change
Type I Type 2 Type 3
Plan Areap Internal (m 2) 43.84 44,22 44-97
Ceiling Heights (m):
Downstairs 2-387 2.362 2.299
Upstairs 2-387 2-362 2.296
Air Volumes (m3):
Downstairs 104-6 104-4 103-4
Upstairs 104-6 104-4 -103-3 Total, V 209-3 208.9 -206.6

- 203 -
7.2 MODEL OF HEAT GAINS AND LOSSES
A simple model is employedp the rate of flow of beat through the
fabric at any time being assumed to depend simply on the difference
between the effective internal and external temperatures as in the steady
state. In line with the regression analysis, regular window opening
is taken to have twice the effect on heat loss for downstairs windows
as for upstairs. This applies only to Type 2 and 3 houses which are
heated only on the lower floor. Air entering downstairs might be expected
to undergo about twice the temperature rise experienced by air entering
upstairs.
Strictly speakingy fabric losses should be calculated from differences
in environmental temperature and ventilation losses from differencesin
air temperaturep but it will be assumed that this distinction need not be
made. Terms representing incidental gains will be included to cover
energy gains in the form of thermal radiation entering through windows
and heat emmitted ty the bodies of occupants.
7.2.1 Fabric Losses
The beat loss coOffiCiento Fs for the oomplete shell has been
found by summing the products of area and U-value for the componEate.
For an effective internal-external temperature difference AT9 measured
in centigrade degreesp the fabric loss in watts is
Pf wl: AUx AT mF AT (7.2.1)
Values of IF are given in Table 7.2.1 p which has been extracted
from Table 7-1.3-

- 204 -
Table 7.2.1 Total Fabric Heat loss Coefficients, Fq
for the Shells of the Houses.
Mid-Terrace Situation
End of Terrace Situation
7.2.2 Ventilation Losses
Units W/*C
Type I Type 2 Type
141-0
1
166.0 214-3
176.9 1 211.8 1 267-7
The beat capacity of one cubic metro of air at constant pressure
and a temperature of around 1000 is approximately 1200 J1 0 C. Therefor%
if air enters a house at a rate of I ml/bour and its temperature is
raised by AT a0C,
then the power requirement is
1200 1 AT a
joules I AT a watts
3600 seconds 3
If the infiltration of external airy when no windows are opened,
results in N air changes per hour throughout the house, and the volume
of air in one change is V m3 (Table 7.1-4 then NV ml/b are raised in
temperature by 4T OC on average, this being the mean internal - external
temperature difference for the whole house at the time. Such an
infiltration, thereforef represents a heat loss rate of NV AT watts. 3
When windows are opened there will be an additional infiltration
of air. Let the resulting additional rate of loss of beat be Pw watts.
The total rgte of loss of beat by air infiltration is thus,
paN VAT + pw (7.2.2)
3

- 205 -
7.2.3 Waste Water Losses
Water which is discharged from a house into the drains is usually
at a temperature higher than that at which it entered the house and
therefore represents a net beat lose. Let this lose be at a rate of
pd watts.
7.2.4 Heat Inputs
The main heat input to a house is from fuels used in the space
heating, water beating and lighting sYstemsp and in the cooker and other
fuel-using equipment. Let the living space and its contents, including
water being heatedv gain beat in this way at a rate of P watts. This
is the Veefull energy rate and does not include beat which escapes
directly to the outside air via a flue.
The otber gains are the net radiant beat entering directly through
glazingg at a rate of Pr wattsy and the beat emitted by the bodies of
occupantsp at a rate of Pb watts. I
7.2-5 The Heat Balance
The house gains heatp thereforep at a total rate,
p9=p+pr+p bI
and the total rate of loss of heat due to fabriop ventilation and water
discharge losses is
p10 "f + Pa + "d
Although the instantaneous values of P9 and P1 will not be equalp
due to storage effectsp when heat gains and losses are averaged out over
a period of a few days or more they will be approximately the same,
So the time averages (denoted by a bar over the symbol) of P9 and P1

- 206 -
can be taken to be equa, 19
i. Pogpg w Flo
+Fr+ Pb m Ff +Fa+ Pd
useful So the mean rate of1heat input from fuels is
(7.2.3) F+P+PF fad-r-Fb*
Nowq on the above modelo the fabrio beat lose rate,
Pf =F LT. (7.2.1ý part)
Pf aF YT is the corresponding time-averaged value.
Similarly the total rate of loss of heat by air infiltration
is
Pa. N VAT +P Wl (7.2.2, rep. )
3
and has a time-averaged valuel
VN0+ Pw a- 3
Nowq the time-averaged value of N ATj represented by NAT9 is notv in
generalp equal to 9X ZYT, the product of the time averages of N and I
A AT. But an effective air change ratey Np can be defined by the relatim
A N AT mN
FTF.
P can now be rewrittent a
Fa. v2 rT + 3
Sol substituting for Pf and Pa in equation 7.2.3 j the mean rate
of heat input from fuels is
A VN+ ly + F Z-T + wdr b*
+A Fb (7.2 N3v) XT +w+ Fd

- 207 -
7.2.6 Application to Type 2 Houses
The result of the multiPle regression of F against Ev w and 0
given in Table 5-3-5 for the 21 'all- electric' Type 2 houses is
1086 + 18-71 H+ 160.1 w+ 368 G,
libere, R. number of hours of use of the central beating in a cold weeký
w0 if no windows are regularly openedv
1 if only upstairs windows are regularly openedv
2 if only downstairs windows are regularly opensdp and
3 if both upstairs and downstairs windows are regularly
opened,
and Ga0 for some fairly regular outlet grille closing,
j for occasional closingg and
I for full use of wa= air outlet grilles.
The above approacb implies a model in shich the average rate of
loss of beat due to window openingt F. wattsp depends only on the value
Of the variablo wt and implies that F 160.1 w. w
In other words, The additional time-averaged rate of beat lose due
to window opening is 160.1 w watts. This takes on the value 160.1
matte if only upstairs windows are regularly openedt 320.2 watts if only
downstairs windows a" regularly opened and 480-3 watts if both upstairs
and downstairs windows are regularly opened.
Similarly, some fairly regular outlet grille closing is associated
with a reduction in F of 368 Watts.
In a case wbere no windows are regularly opened and no outlet
grilles are closedl w and Pw are both zero and G. 1. So equation

- 208 -
7.2-4 bec=es
N VI A 311 4, -Fd -
Fr -
Fb 31
and the result of the multiple regression becomes
1086 + 18-73. H+ 368
1454, + 18-73. H
Equating the two expressions for Vp
+A NA AT +Fd Pr - Fb 0 1454 + 18-71 H 3)
+ 18-71 H- 'ET - 1454 Fd + Fr +F b (7.2-5)
F+ 9V 3
For a Type 2 housep the volume, V m3, involved in one aIr change
is 208.9 d. Solassuming an effective air-chanee rate of I air change
per hour, the term 9 V3 has the value Ix 20899/3 . 69.6. For the
mid-terrace situationp the total fabric beat loss coefficientp Fq is
166.0 VI/'C.
The mean power lossp Fdq due to the discharge of waste water will I
be a significant term for many of the houses. In a Type 3 housep where
the off-peak supply of electricity to the immersion heater was metered
separatelyl the mean electrical power input was about 500 W- It is
likely that only about half of this power is lost due to the discharge
of waste waterv the rest eventually entering the living space. There
was little variation from house to house in the above electrical powerg
the standard deviation being only about 100 Wp and it seems reasonable
to assume a value for Pd of 250 W and to apply it to both Type 2 and
Type 3 houses.

- 2o9 -
Radiant beat will only enter a house at a significant rate for
a small proportion of the time, with the result that the time-average
of the ratev Pr9will be fairly small. For the present calculation a
figure of 200 W will be assumed. The mean rate of gain of beat from
the bodies of occupants, *Fb 9 will be assumed to be 250 W-
Substituting these values in equation 7.2-5p
AT . 1454 + 3.8,71 H- 250 + 200 + 250
166.0 + 69.6
1654 + 18-71 H
235.6
*% AT - 7.02 t 0.0794 11
This result would only be expected to give reasonable approxi-
mations for the time-averaged effective internal-external temperature
difference XT- for values of weekly hours of use, H9 of central
beating within the range encountered on Site 2j Ie. from about 50 to
100 hours per weeko since the true relationship between Z-T and H will
be non-linear due to storage effects*
0 The expression obtained fordT gives values of 11.0 C for 50
hours of use per weekq and 15-0 OC for 100 hours. Since the mean
OUtside air temperature for the metered period was about 3.2 0 Cp the
above mean temperature differences correspond to mean internal
temperatures of 14.2 and 18.2 0 C.
These results seem reasonable for an electrically- heated mid, terrace
Type 2 house in which no windows are regularly opened and no warm air
outlet grilles are closed. The model can be applied in similar ways to
other groups of houses, though a reasonably. large sample size is
desirable.

- 210 -
P k-R T IV
Chapter
onc1usion.

- 211 -
PART IV
Cbapter 8
fl-I 1-4 --
8.1 ENERGT REqUIREMENTS FOR THE CONSTRUCTION AND USE OF BUILDINGS
It is of interest to compare energy requirements for building ccn-
struction with those for the use of building serviceep in order to assess
the relative potentials for energy saving. The comparison can be made
more easily for dwellings or office buildings than for industrial
buildings, where the emission of considerable amounts of beat in the
production process causes complications. The energy requirements for
construction and use of dwellings will be compared. For a given method
of construction, the comparision for office buildings is likely to be
similarv though the energy requirement for space heating per unit of
floor area may well be lower due to restricted hours of use and greater
building size.
The overall picture for the TIK presented by the Building Research
2 Establishment 9 based on 1972 figures, was that energy use in the home
accounted for about 29% of the national requirement for primary fuels.
It represented an average primary energy requiriment per household of
about 130 GJ for the year. The average amount of energy actually
supplied to each household in the form of fuels wasp however, only
about 80 Wp the difference representing conversion and distribution
losseep which are particularly high in the case of electricity when
no use is made of reject heat from the power stations. Domestic per
capita consumption of electricity was much higher than that of other
similar countriesp being about 2J times that of Belgium, and twice
that of the Netherlands.

- 212 -
The results of Barnes and Rankin35 discussed in section 2*2.2
indicated energy costs of constructional materials for dwellings
ranging from 67 GJ for a timber-framed semi-detached house or bungalow
of 77 m. 2
gross floor area to 222 W for a flat of 63-5 m2 not floor
area in a 3, -storey block. A figure of 123 W was obtained for a house
or bungalow with external walls entirely of brickg and 174 GJ for a
flat in a 12-storey block with a concrete structure. The energy cost
of steel reinforcement was omitted by these workers.
Gartner and Smith's re sults36 for the energy costs for major com-
ponents (foundations, wallsl floors and roof) of representative types
of local authority housing were also considered in section 2.2.2. For
the two types of 2-storey houses and the 4-storey block of flats
involvedp all of which bad brick/ýlock loadbearing wallsp the energy
costs per dwelling for the major components were in the range 95 to
180 W, the precise values depending on the detailed choice of materials*
The range for the 9-storey block of flats with reinforced concrete
load, bearing elements was 230 to 265 GJ per flat* The energy cost of
steel reinforcement was included and made a particularly large con-
tribution of about 100 W to the energy cost per flat for the 9-storey
blockp resulting in the high energy cost for major components given
above. Average dwelling areas were taken to be 80 m2 for each of the
house types and 55 m2 for flats in each of the blocks.
In the same paperg Gartner and Smith also used the results of
Wright's input-output analYsisý' together with housing cost information
from 'Building, 76 to estimate the energy cost for a complete typical 9
local authority built, two-storeyp three-bedroomedy semi-detached house
of bri*/blook construction. The energy cost obtained for the finished

- 213-
house was 360 W, of which about 235 W was for the major components
forming the structure. The authors believed that their method over-
estimated the energy requirement for the reinforced concrete ground
floor slab in this case. Apart from thisp the energy cost obtained
for major components would have agreed fairly well with their other
results for two-storey houses.
I For a rather larger brick-built tbree-bedroomed, semi-detached
house of 100 m2 floor areap Brown and Stellon 26 have obtained an energy
cost of 397 W. A much lower figure of 167 W resulted from MacKillop's
analysis77 of a similar house. The difference arose mainly from the
different energy costs used for bricksp these being 10.0 and 0-7 MJ1
brick respectively.
The three-bedroomed semi-detached houses considered by the various
authors typically have about 100 m2 of external cavity walling and a
further 100 m2 of party and partition wallingg so that the walling as
a whole is equivalent to about 300 m2 of single leaf* As the energy
cost of the bricks used varies from I to 10 MJ/brickp Gartner and Smith36
calculate that the energy requirement for single leaf brick walling 2 increases from 110 to 660 MJ/m . Similarly the choice of lightweight
block can cause the energy requirement for 100 mm blockwork to vary
from 125 to 230 Mj/m2, while the alternative of timber studding has a
very low energy cost. It can thus be seen that the choice of walling
materials can affect the energy cost of a house by more than 150 GJ-
When such houses have solid ground floorsp the energy require-
ment for all the concrete which is cast 'in situ$ is also substantial,
Gartner and Smith36 obtaining values from about 17 to 24 GJ for two-
storey houses of 80 m2 dwelling area.

- 214 -
It can be seen that there is considerable scope for reducing the
constructional energy requirements of buildings by using designs which
minimise the need for high energy cost materials such as steelp cement
and certain types of bricks and blocks. Howeverp since a dwelling may
typically require about 50 GJ of beat every year it is occupiedp
savings in constructional energy requirements must result in little or
no deterioration in thermal performance if they are to be worthwhile in
the long term. A design with a higher constructional energy cost may
well be justified if it results in energy savings when the building is
in use. All such decisions willp of courseq be strorgly influenced by
financial considerations which will reflect costs other than those of
energy,
Energy Costs and Savings associated with Insulation
It is instructive to compare the primary energy costs of insu-
lation with the reductions in heat loss which will result from its
installation. As an examplep consider the use of glass fibre quilt of
density 12 kg/m3 in the pitched roof described in Section 3-4-1-
Perry and Boyle's analysis5l of the manufacture of glass fibre
insulation resulted in a primary energy requirement of 63-7 MJ/kg.
For each square metre coveredp the use of a thickness of loft insulation
which is greater by 20 mm requires an extra 0.020 m3 of glass fibrep
with a mass of 0.24 kg and an energy cost of 15-3 MJ.
Reductions in annual heat loss can be calculated for an average
internal temperature of 15 0C in the West Yorkshire region, as in Chapter
3, and depend on the initial thickness of insulation considered.
Using 100 rather than 80 mm of insulation reduces the annual heat lose

- 215 -
through each square metre by 13.2 MJ and going from 280 to 300 EM the
saving is still 1.7 MJ of beat a yearp amounting to the primary energy
cost of the additional insulation in about nine years of use* (The
heat loss reduction willv of coursep result in an even greater saving
in the primary fuel requirement for space heating). If it is assumed
that the building will be used for 60 yearsp tben, taken over this
period, the reduction in beat loss which accompanies each increase in
insulation thickness is greater than the primary energy cost of the
extra insulation until a total insulation thickness of about 780 mm is
reached. As might be expectedp such a thickness is not financially
attractiveg largely because of the cost of non-energy inputs to glass
fibre manufacture.
8.1.2 The Economic Attractiveness of Thermal-Insulation
It was concluded in Chapter 3 that higher levels of insulation
than commonly used can be economically attractive, even if the return
on alternative investments is assumed to be leja a year above the rate
of fuel price inflation. It was also noted that higher levels still
would become attractive in the future if fuel prices were to rise
relative to insulating costs.
For forms of insulation which can be added to an occupied building,
there is little pointt from the user's point of view, in installing
additional insulation unless fuel prices are high enough for likely
reductions in fuel bills to immediately represent at least as good a
return on the capital required as alternative investments. Then the
insulation cannot be conveniently added after construction, such as
that below ground floor slabst a longer term view is more appropriate.

- 216 -
A level of insulation which yields an unattractively low rate of
return at present fuel prices may well represent a better invest-
ment in the longer term due to relatively large fuel price increases.
In such cases it would be desireable to install the higher level of
insulation at the time of construction in the expectation of sub-
stantial returns after the first few years of use.
When an overall saving results from the use of higher levels of
insulation, this means that fuel cost savingsp suitably discounted
back, more than me(tt the costs of all the inputs involved in the
provision of the insulationt of which energy forms only a part. As
a result, the reduction in the primary energy requirement for space
heating over the life of the building willp in such a casey almost
certainly be greater than the energ7 cost of the extra insulation.

- 217 -
8.2 THE EFFECTS OF OCCUPANT BEHAVIOUR ON ENERGY USE
8.2.1 Use of Space Heatin
In the regression equations for the total mean useful energy
input rate to a house from fuelsp'Fp presented in sections 5-3.2 and
5-3-39' the coefficients of H (weekly hours of use of central heating
in cold weather) varied considerably. The coefficients of S (which was
the symbol used for It 21 the s= for a week in cold weather of the
squares of the lengths of the periods for which the central heating
was not used) had a limited range from -0-76 to about -1*20 W. wkA29
varying only a little between the three house types and being only
slightly affected by the choice of other variables to be included in
the regression analysis. So intermittent use of central heating was
associated with a reduction in of approximately 1.0 S watts.
The simple regressions of F against S (see Figures 5.2.1 to
5.2-3 and Table 5-3-3) indicate thatq for all three house typesq the
value of for continuous heating (S - 0) was about 3800 watts. The
fractional reduction in associated with intermittent use of central
heating wasq thereforep approximately 1.0 S/3800. This expression
will also represent the fractional reduction in mean internal-external
temperature difference for the fuel metering period due to inter-
mittent heatingg assuming that there is no significant change in
ventilation rateg and that the net effect of solar radiationp heat
gain from the bodies of occupantsp and heat loss in waste warm water
is negligible.
For intermittent heating for a single period of Z hours each dayv
S has the value 7(24 _, C)2. Compared with continuous heatingg the
2 expected fractional reduction in F is therefore 7 (24 -r This
3800

- 218-
2 implies a fractional heat requirement of about I-7 (21 -T) . This 3600
expression would only be expected to be valid for the range of values
of'l: encountered on the surveyp which was from about 12 to 24 hours
a day for houses where the central beating was used for only one period
a day. The expression is plotted against'C in Figure 8.2.1.
Billington78 has made use of the admittance procedure79 to
estimate the reduction in heat input associated with intermittent
heating. He considered the case of heating to a given internal en-
vironmental temperature for a single period of V hours each day. The
expression obtained for the ratio of the daily heat requirement for
such heating to that for continuous heating to the same temperature
was 1+ t24
vr _I)P0
where Po = 7-AU + Cv XAY + ov
JAU is the sum of the products of area and transmittance for
elements forming the building shellp
ZAY is the sum of the products of area and admittance for all
internal surfaces,
and Cy is the ventilation heat loss rate per degree of inside-
enviromental/outside-air temperature difference.
Ass-uming a ventilation rate of li air changes per hour, the value
of P0 for each of the three types of house involved in the survey was
about 0-3. Billington's result for the fractional beat requirement
for this value of Po has been added to Figure 8.2.1.
It can be seen that the survey and Billington's admittance
approach indicate similar fractional heat inputs for single daily
heating periods between 12 and 24 hours. When the heating is off for
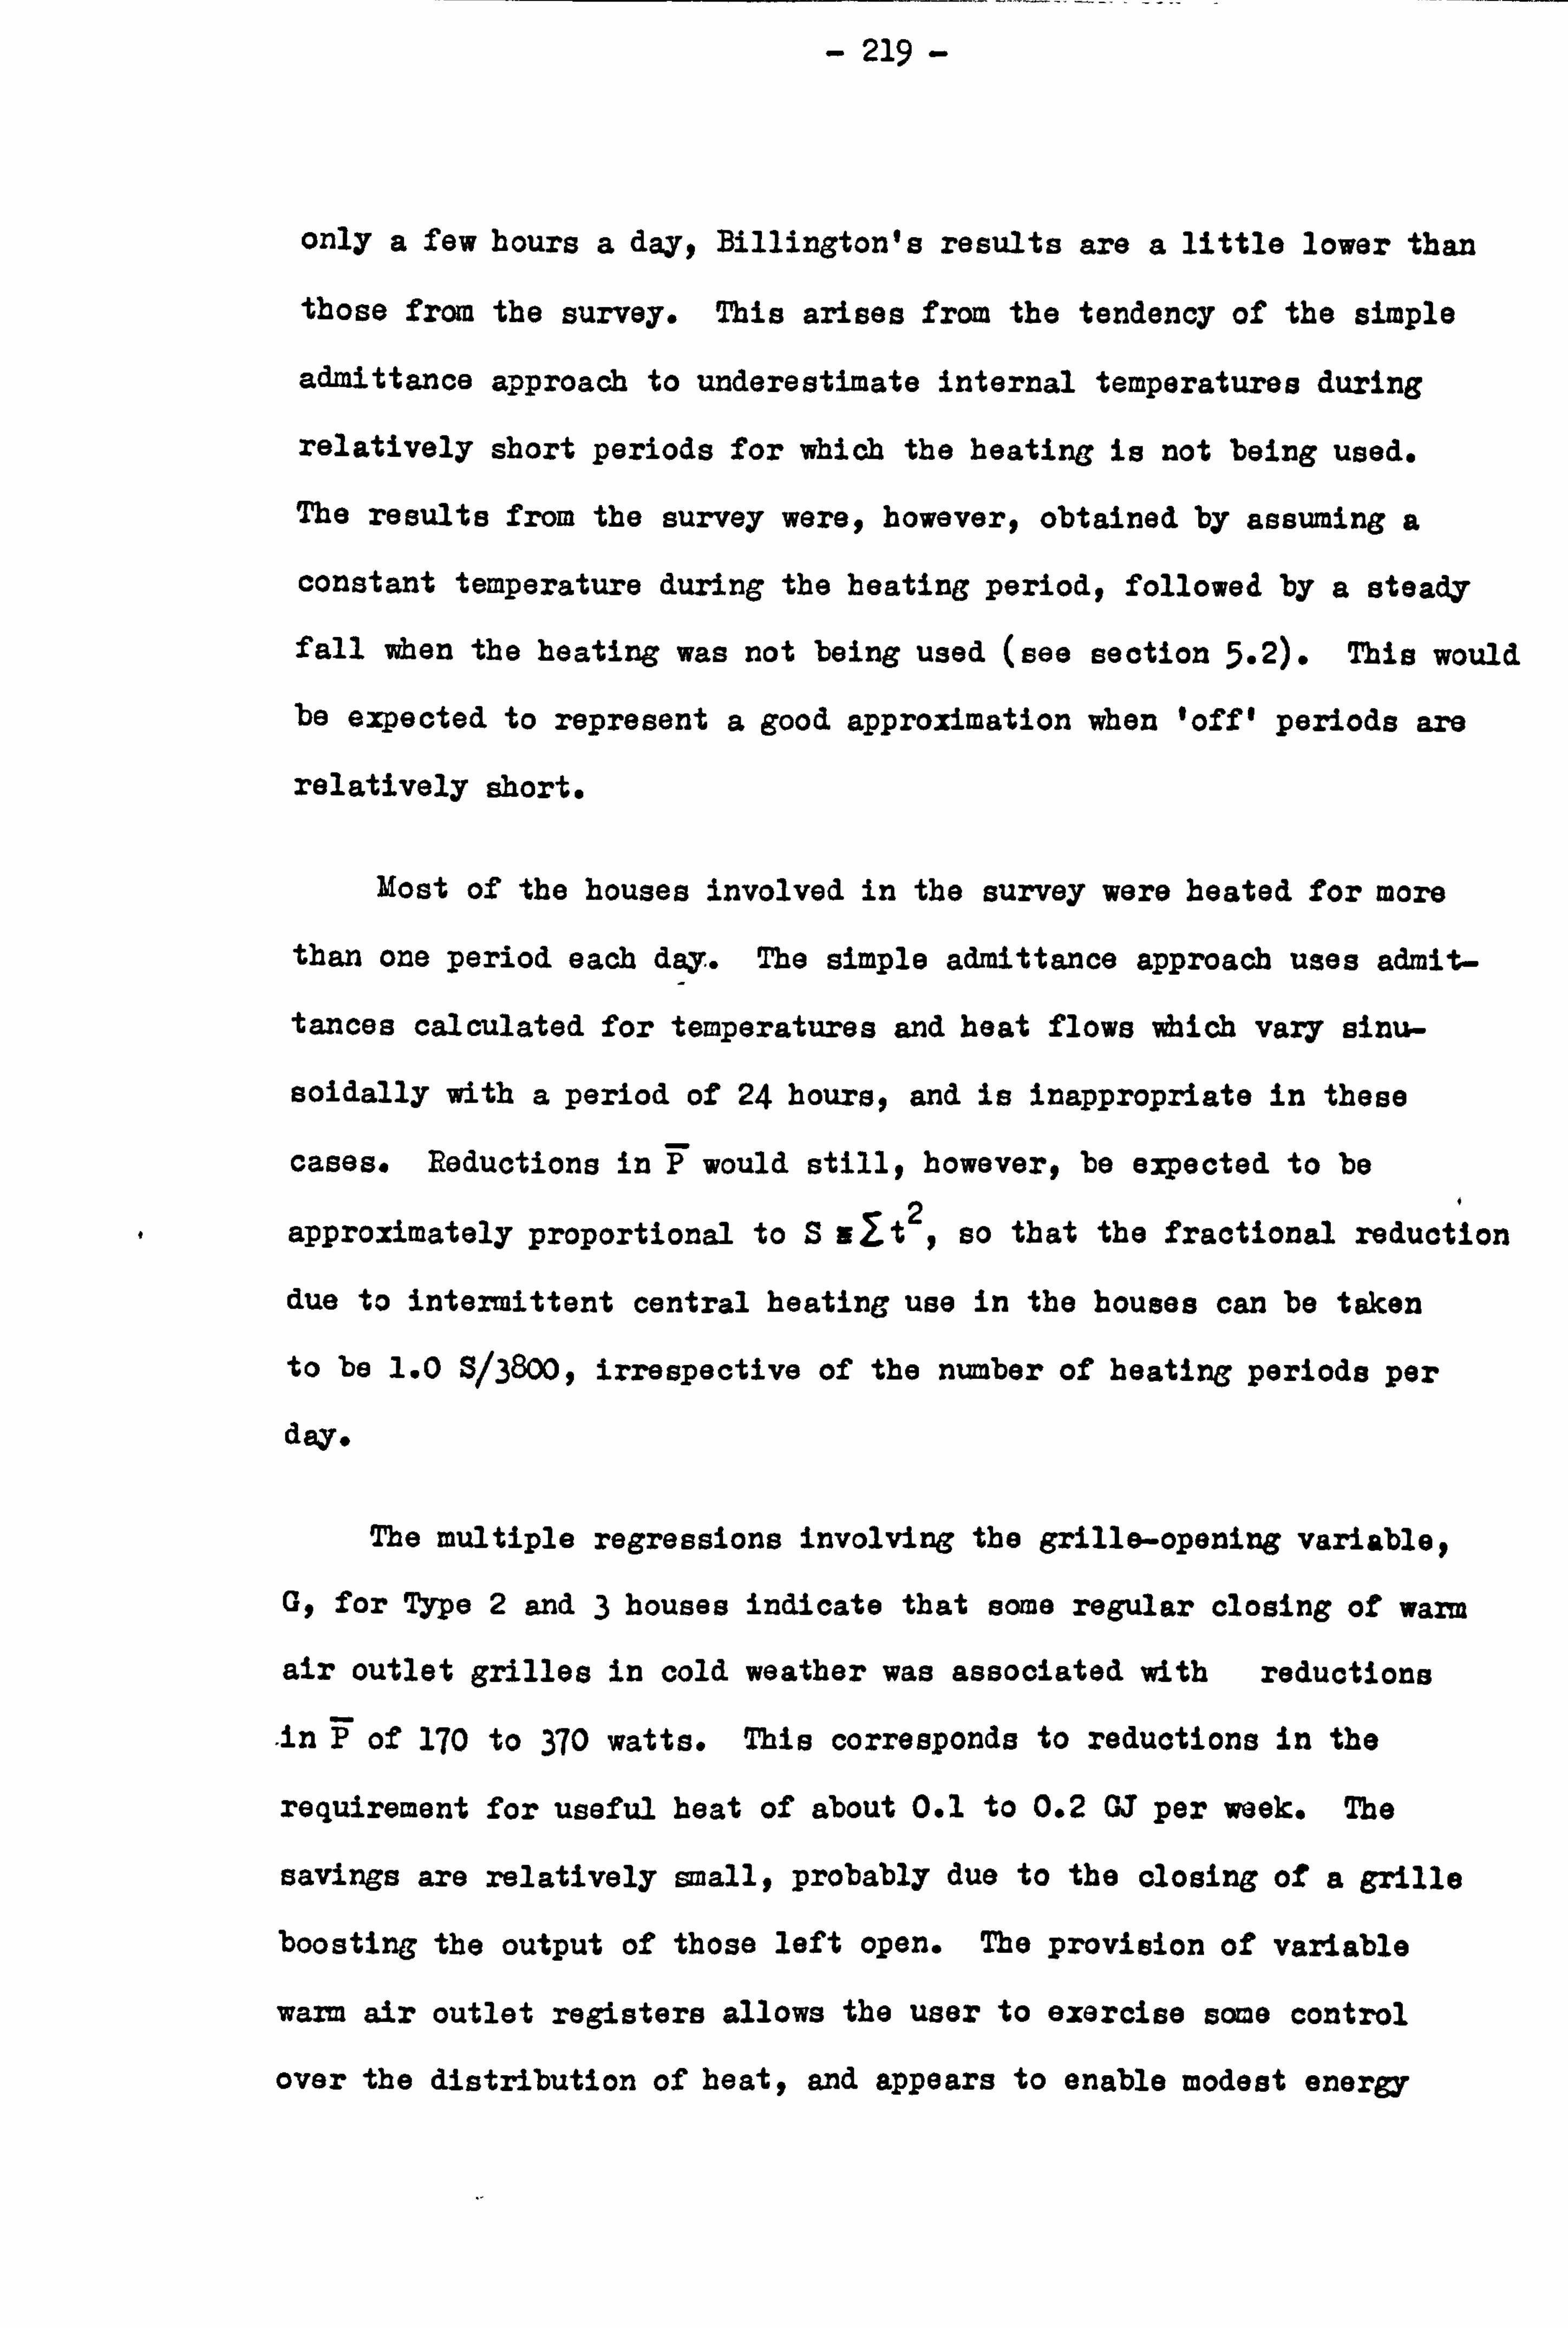
- 219 -
only a few hours a dayp Billington's results are a little lower than
those from the survey. This arises from the tendency of the simple
admittance approach to underestimate internal temperatures during
relatively short periods for which the heating is not being used.
The results from the survey werep howeverp obtained by assuming a
constant temperature during the heating period, followea by a steady
fall when the heating was not being used (see section 5.2). This would
be expected to represent a good approximation when 'off' periods are
relatively short.
Most of the houses involved in the survey were heated for more
than one period each day.. The simple admittance approach uses admit-
tances calculated for temperatures and heat flows vibich vary sinu-
soidally with a period of 24 houreq and is inappropriate in these
cases* Reductions in F would stillp howeverg be expected to be
I approximately proportional to S NY J,
so that the fractional reductýon
due to intermittent central heating use in the houses can be taken
to be 1.0 3/38009 irrespective of the number of heating periods per
day.
The multiple regressions involving the grille-opening variablep
G9 for Type 2 and 3 houses indicate that some regular closing of warm
air outlet grilles in cold weather was associated with reductions
In F of 170 to 370 watts. This corresponds to reductions in the
requirement for useful beat of about 0.1 to 0.2 W per week. The
savings are relatively smallp probably due to the closing of a grille
boosting the output of those left open. The provision of variable
wa= air outlet registers allows the user to exercise some control
over the distribution of heat, and appears to enable modest energy

- 220 -
savings to be achieved. It was found that in three quarters of the
Type 3 houses (gas-fired heating) all the outlets were left open
in cold weatherg while this applied to only a third of the Type 2
houses heated solely by electricity.
It is likely that a thermally 'lightweight' construotion and
better room-by-. room temperature control would have resulted in lower
fuel consumptionsp especially in those houses which were unoccupied
for much of the day. This wouldp boweverp have been at the expense
of lower minimum room and surface temperatures and increased
condensation problemsp unless insulation levels were also improved.
Greater use of shading devices and window opening would then have
been required to avoid overheating in summer.
It should be noted that the survey confirmed thatt for the houses
of Types I and 31 hours of use of central heating were influenced by
household size and the amount of time the house was occupied. In
contrastp such effects were not exhibited in the Type 2 houses in
which electricity was the only fuel usedp perhaps because of the high
cost of the fuel and the fact that a considerable number of the house-
holds were largely supported by Social Security benefits. It may
well be that ifq as is likely, fuel prices rise faster than incomes,
occupancy patterns will become a less reliable guide to the use which
is likely to be made of beating systems*

- 221 -
Figure 8.2*1 Fractional Heat Input to a House for a Single
Daily Heating Periodp from the Results of the
Survey and from Billington's application of the Admittance Procedure.
0.1
O-E
0-7-
0-10
IS
-4410-4-1
Ao 1ý 10 A :! 4. jjwsoF Use 6F ReaUAq per

- 222 -
8.2.2 Window Opening
The regression analysis reported in section 5-3 did not reveal a
significant association between window-opening behaviour in the small
number of Type I houses and the corresponding values of F9 the mean useful
energy input rate from fuels. The results for the larger numbers of
Type 2 and 3 houses were more significant. The regressions involving
the four-valued window-opening variablep w, indicated associated
increases in P of the order of 160w watts to 240w watts.
The simple regression ofF against w for the 21 Type 2 houses
using electricity as their only fuel revealed a highly significant
correlation. A value of about 2590 watts for was indicated for
houses in which no windows were regularly opened, compared with the
average value of 2940 watts for all 21 houses. This indicates thatp
on averagep window opening in cold weather was associated with an
increase in heat input equivalent to a continuous supply at a rate of
about 350 wattsp the mean value of w being 1-43-
For the Type 3 houses included in the regressionsy the corres-
ponding correlation was rather less significant and indicated a
smaller average increase in F of about 310 watts which could be
attributed to window opening. At 1.87, the mean value of w was higher
than for the 21 Type 2 houses, though the opening lights were generally
smaller.
If it is assurned that the average air-change rate for a house
in which no windows were regularly opened was 1 air change per hour,
and that average internal temperatures were independent of window-
opening habitsp then the relationships between and w imply that the
average levels of window opening in the Type 2 and 3 houses increased

- 223 -
the air-change rates by about 0-5 and 0-4 air changes per hourt
respectively.
Measurements in houses at Abbots Langley and Bucknalls Close by
the Building Research Station 25
revealed rather larger increases in
average air-change rate of about 1.0 air change per hour due to window
opening in cold weather. This result was based on actual measure-
ments of air-change rateaq and might be expected to be higher than a
value calculated from fuel consumptions on the assumption of unchanged
internal temperaturesp since window opening is likely to reduce these
temperatures. In this wayp increases in actual air-change rate may
result in smaller rises in heat loss rates than might at first be
expectedg especially if the heating system is slow to respond to the
opening of windows or is not being used at the times
When multiple regression techniques were used to also take account
of the effects of the way in which the central heating was used,
window opening in the Type 2 and 3 houses still appearedp on averages
to result in increases in of about 220 to 330 watts. Since
represents the mean useful beat input rate from fuels taken over a
quarterly metering period in cold weathers it can be seen thatp during
such weathers window opening in Type 2 and 3 houses appeared to result
in additional heat losses per house of about one sixth of a gigajoule
per week on average. Taken over a complete beating seasons window
opening might be expectedg thereforep to increase the requirement for
useful heat by about 5 GJ-
If the houses had been equipped with a small-scale mechanical
ventilation system and gasketted windows and doors, as suggested by
Hardy 12 v it might be expected that annual space heating requirements

- 224-
would be reduced by about the above figurev provided that the provision
of mechanical ventilation resulted in no window opening in cold
weather. The reasons given by respondents for opening windows during
cold weather were the airing of bedroomsy removal of steam from
bathrooms and kitchens and the general avoidance of condensation. A
mechanical ventilation system musty thereforep meet these requirements
if such window opening is to be avoided*
Further fuel savings can be achieved by incorporating a heat
exchanger into the ventilation system to transfer heat from outgoing
to incoming air. Such a system is being investigated by the Building
Research Establishment 80
in one of its experimental low energy bouses,
in which the two air streams pass through a heat exchanger located
in the roof space. In this design a considerable amount of ducting
is required, which could result in a high capital cost. It is
unlikely that it would be applicable to existing dwellings*
When ventilation can be increased only by opening large windowag
the building user is likely to experience difficulty in obtaining
the desired air change rate. The provision of smallp easily-adjustable
ventilators can enable adequate, rather than excessivep ventilation
to be obtainedt and result in reduced beat losses for a modest outlay.
It should be noted that the trend towards more insulating forms of
construction makes ventilation heat losses relatively more important.
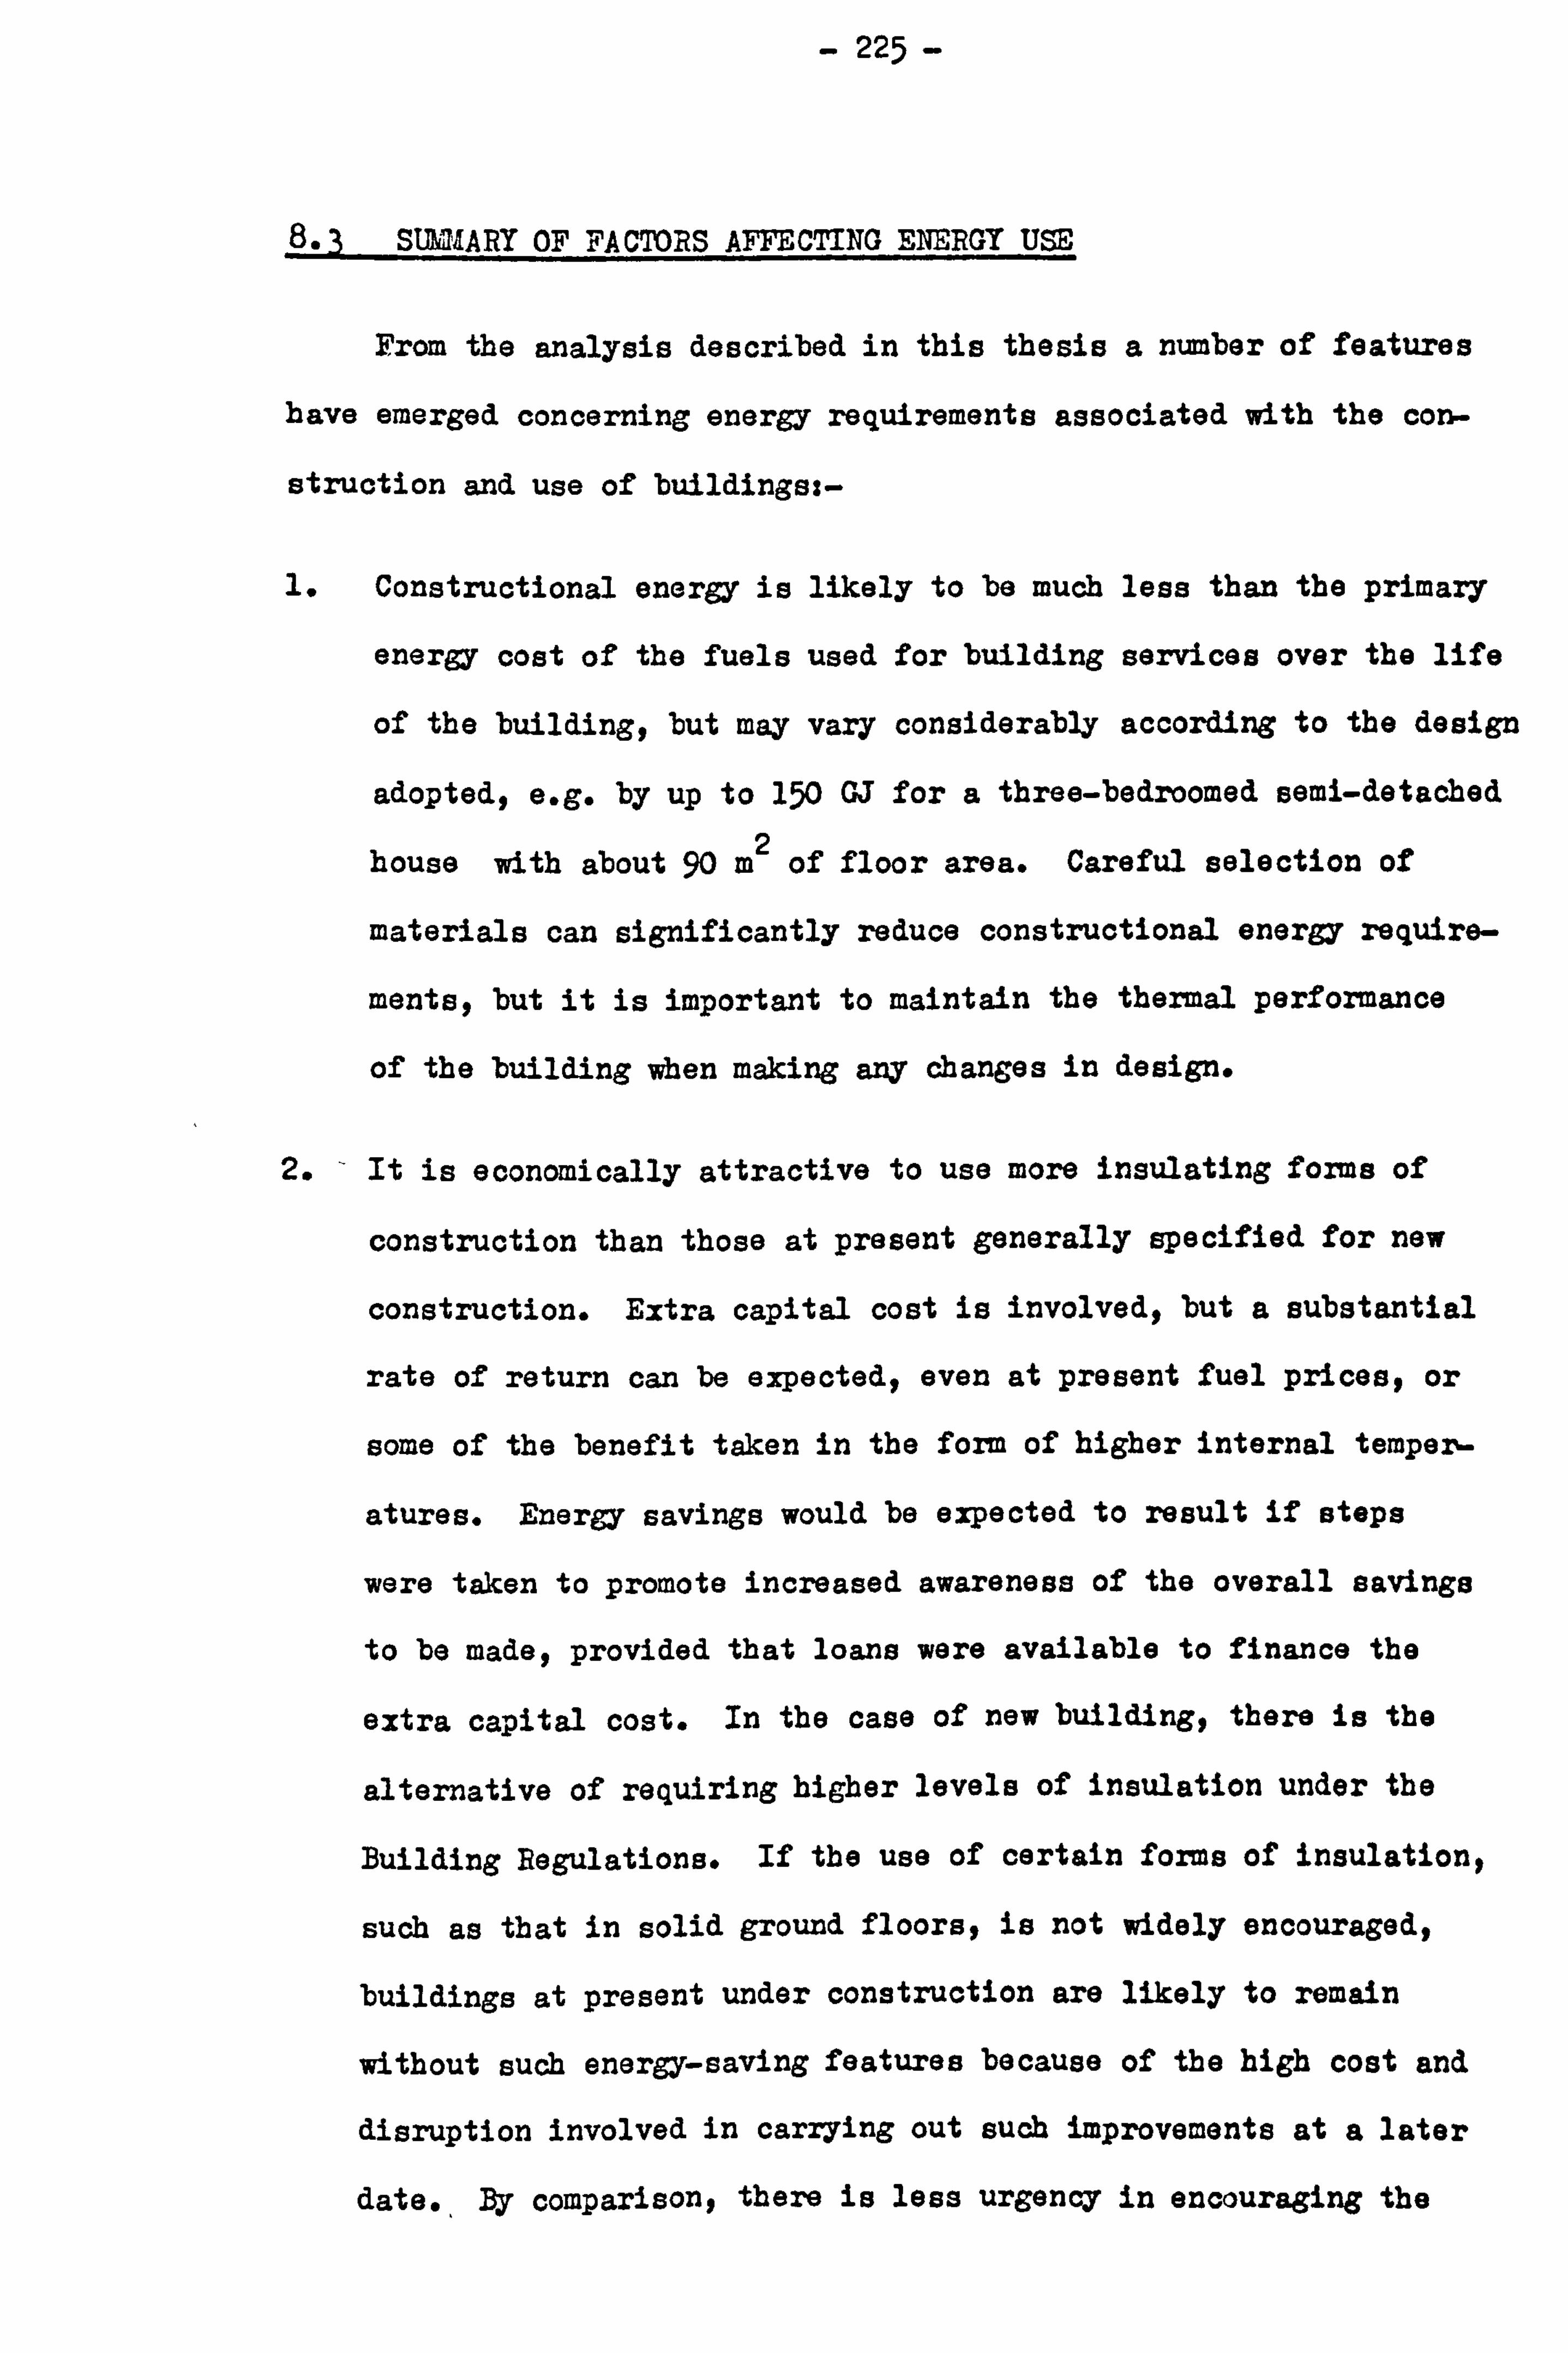
- 225 -
8.3 SUMARY OF FACTORS AFFECTING ENERGY USE
From the analysis described in this thesis a number of features
have emerged concerning energy requirements associated with the con-
struction and use of buildings: -
1. Constructional energy is likely to be much less than the primary
energy cost of the fuels used for building services over the life
of the building, but may vary considerably according to the design
adoptedg e. g. by up to 150 GJ for a three-bedroomed semi-detached
house with about 90 m2 of floor area. Careful selection of
materials can significantly reduce constructional energy require-
ments, but it is important to maintain the thermal performance
of the building when making any changes in design.
2. - It is economically attractive to use more insulating foxms of
construction than those at present generally specified for new
construction. Extra capital cost is involvedp but a substantial
rate of return can be expected, even at present fuel prices, or
some of the benefit taken in the form of higher internal temper-
atures. Energy savings would be expected to result if steps
were taken to promote increased awareness of the overall savings
to be madeq provided that loans were available to finance the
extra capital cost. In the case of new buildingg there is the
alternative of requiring higher levels of insulation under the
Building Regulations. If the use of certain fo=s of insulationt
such as that in solid ground floors, is not widely encouraged,
buildings at present under construction are likely to remain
without such energy-saving features because of the high cost and
disruption involved in carrying out such improvements at a later
date., By comparisong there is less urgency in encouraging the

- 226 -
installation of more loft insulationg since this can be carried
out at any time with little penalty and isq in any casep likely
to become particularly attractive if fuel prices rise rapidly
in the next few years.
3. The choice of heating fuel can greatly affect the primary energy
requirement associated with the use of a building. For present
methods of generation, electricity has particularly high energy
overheadsp mainly due to the large amounts of heat ejected to
the surroundings by power stations. Increased use of such beat
for district heating could improve the situationg but at present
it is desirable that electricity should remain relatively
expensive in comparison with alternative fuels to discourage its
use for space heating unless accompanied by high levels of
insulation and responsive controls*
4- The use which occupants make of their heating systems significantly
affects their energy requirementsp the actual hours of use of
central beating having a quantifiable effect. Hours of use can
be strongly influenced by occupancy patterns, but it appears
that this may not always be the case when a high cost fuel is
being used by households supported largely by Social Security
benefits. This may make prediction of energy use in the domestic
sector particularly difficult at a time of increasing unemploy-
ment and rapidly rising fuel prices.
The results of the survey indicated that window-opening behaviour
in cold weather in the houses with warm air heating had a clearl
though fairly smallp effect on energy use. Excessive ventilation
could possibly be discouraged by providing well-sealed dwellings

- 227 -
incorporating mechanical ventilation systems designed to supply
air, preferably preheated in an exchanger, at the rate required
to avoid condensation and odours.
6. The effect of position in the terrace on energy use was less
clear. It appeared that it was even possible for end-of-terrace
positions to be associated with a slight reduction in energy use,
such dwellings presumably being rather colder than average.
The survey revealed no effects of orientation on energy use in
fuel metering periods involving the months of December to April
and early May. This was partly due to glazing being distributed
between front and rear elevations, reducing the effect of
orientation on direct solar gain, and also due to much of the
solar radiation being diffuse rather than direct on many occasions.
In any caseý experiments reported by Siviour 81
involving unoo-
cupied houses of a similar design suggested thaty in Northern
England, solar gain through windows represents an average heat
input of only about 300 W over the period from December to April.
It can be seen that the energy requirement of a building depends
on many aspects of its design and mode of use. Consideration should
be given to these when attempts are made to discover the most economic
ways of reducing this energy requirement. It should also be remembered
that devices such as heat pumpsp solar collectors and aerogenerators
installed on or near the building can be used to reduce the use of
fuels. The attractiveness of these will depend on the costs of the
systems and the fuel cost savings likely to resultp coupled with
aesthetic and safety considerations. Use of such systems is at present
on only a limited scaley and technical developments are likely to

- 228 -
reduce costs and improve efficiencies in the future.
Buildings represent a considerable proportion of society's
demand for primary energy and there is scope for the achievement of
large energy savings. To this end there is a need for still greater
understanding of the ways in which energy is used in buildings and
of the influence of building design.

- 229 -
Appendix 1.
Tables of Fuel and Combined Costs
associated with the Roof Structure
and the Solid Ground Floor at
Various Times.

- 230 -
Table A 1.1 Annual Fuel Costs associated with the Roof Structure for
Various Thicknesses of Glass Fibre Quilt Insulation*
For heating by Night Rate ELECTRICITY to 150C
Unit: E/m 2 per annum
Thickness of Insulationg
mm
Apr 70-
Mar 71
Apr 72-
Sep 73
WHITE METER
Oct 73-
Apr 74
Apr-Jun
1975
Apr-Jun
1976
0 0.307 0-379 0-407 0-987 1,124 25 0-142 0-175 o. 188 0.457 0-520 50 0.092 0.144 0.122 0.297 0-338
75 0.068 0.084 0.091 0.220 0.250
100 0-054 0.067 0-072 0.175 0.199
125 0-045 0-056 0.060 0.145 0.165
150 0-038 0-047 0-051 0.124 0-141
175 0-034 0-042 0-045 0.108 0.123
200 0-030 0-037 0-040 0.096 0.109
225 0.027 0-033 0-035 o. o86 0.098
250 0.024 0-030 0-032 0-078 0.089
275 0.022 0.028 0-030 0.072 0.082
300 0.020 0.025 0.027 0.066 0-075
WHITE METER ECONOMY SOVEX
Apr 78- Sep 79- Oct 78- Sep 79- may 79 Mar 80 mav 79 Mar 80
0 1- 387 1.641 1-113 1-315 60 0-366 0-433 0.294 0-347 80 0.294 0-348 0.236 0.279
100 0.245 0.290 0-197 0.233
120 0.211 0.250 0.169 0.200
140 0-185 0.219 0-148 0-175 160 o. 164 0-194 0-132 0-156 180 0-148 0.175 0.119 0-140 200 0-135 0.160 0.108 0.128 220 0.124 0-147 0.099 0-117 240 0-114 0-135 0.092 0.108 260 0.106 0.125 0-085 0.100 280 0.099 0-117 o. o8o 0-094 300 0.092 0.109 0-074 0.088

- 231 -
Table A 1.2 Annual Fuel Costs associated with the Roof Structure for
Various Thicknesses of Glass Fibre quilt Insulation.
For heating by NightRate ELECTRICITY to 20 0C
Unit: L/m2 per annum Thickness of IHITE METER
k
Insulation,
mm Apr 70- Mar 71
Apr 72- Sep 73
Oct 73- Apr 74
Apr-Jun 1975
Apr-Jun
. 1976
0 0-542 0.669 0.719 1-742 1-985 25 0.251 0-309 0-333 o. 8o6 0.918 50 o. 163 0.201 0.216 0-524 0-597 75 0.121 0-149 0.160 o. 388 0-442
100 o. o96 0.188 0.127 o. 3o8 0.351 125 m8o 0.098 0.106 0.256 0.292 150 0.068 0.084 0.090 0.218 0.249 175 0-059 0.073 0.079 0.191 0.218 200 0-053 0.065 0-070 0-170 0-193 225 0.047 0-058 0.063 0.152 0-173 250 0-043 0-053 0-057 0-138 0-157 275 0-039 0.049 0-052 0.127 0-144 300 0-036 0.045 0-048 0.116 0-132
WHITE METER ECONOMY SEVEN
Apr 78- Sep 79- Oct 78- Sep 79- ma. v 79 Mar 80 May 79 Mar 80
0 2-448 2-897 1.965 2-322 60 o. 647 0-765 0-519 o. 613 80 0-519 0.614 0-417 0.492
100 0-433 0-513 0.348 0-411 120 0-373 0-441 0.299 0-353 140 0-327 0-387 0.262 0-310 160 0.290 0-343 0.233 0.275 180 0.261 0-309 0.209 0.247 200 0.238 0.282 0.191 0.226 220 0.219 0.259 0-175 0-207 240 0.201 0.238 0.162 0.191 260 o. 187 0.221 0-150 0-177 280 0-175 0.207 0-141 0.166 300 o. 163 0-193 0-131 0-155

- 232 -
Fuel T able A 1.3 AnnualACosts associated with the Roof Structure for
Various Thicknesses of Glass Fibre Quilt Insulation.
For beating by WEAPEST DOMESTIC GAS to 15 0C
Unit t E/m 2 per annum
Thickness of Insulationt
mm
Apr 68-
De 0 70 Jan 72-- Deo 73
Jan-Aug 1974
Jan-Sep 1975
Oct 75- Sep 76
0 0-395 0-419 0.451 0-487 0.626 25 0-183 0-194 0.209 0.225 0.289
50 0.119 0.126 0.136 0-146 o. 188
75 0.088 0-093 0.100 0.108 0.139
100 0.070 0.074 0.080 o. o86 0.111 125 0.058 0.062 o. o66 0-072 0.092
150 0.050 0-053 0-056 o. o61 0.078
175 0-043 0-046 0.049 0-053 0.069 200 0-038 0-041 0.044 0-047 0.061 225 0-034 0-037 0-039 0-. 042 0-055 250 0-031 0.033 0.036 0-039 0.049
275 0.029 0.030 0.033 0.035 0.045
300 0.026 0.028 0-030 0.032 0-042
Apr 77- Jun 79- Ma. v 79 Mar 80
0 0.785 0.846 60 0-207 0.223
80 o. 166 0.179 100 0-139 0.150 120 0.119 0.129 140 0-105 0.113 160 0.093 0.100 180 o. o84 0.090 200 0.076 0.082 220 0.070 0.076 240 o. o65 0.070 260 0.060 0.065 280 0.056 o. o61
300 0.052 0.056

- 233 -
Table A 1-4 Annual Fuel Costs associated with the Roof Structure for
Various Thicknesses of Glass Fibre Quilt Insulation.
For beating by CHEAPEST DOMESTIC GAS TO 20 0C
Unit: L/m 2 per annuu
Thickness of
Insulationg
mm
Apr 68-
Dee 70
Jan 72-
Dec 73
Jan-Aug
1974
Jan-Sep
1975 Oct 75- Sep 76
0 0.698 0-741 0-796 0.860 1-105
25 0-323 0-343 0-368 0-398 0-511
50 0.210 0.223 0.239 0.259 0-332 75 0-155 o. 165 0-177 0.192 0.246
100 0.124 0-131 0-141 0-152 0-195 125 0.102 0.109 0-117 0.126 0.162
150 0.087 0-093 0.100 0.108 0-138
175 0-077 0.081 0-087 0-094 0.121
200 o. o68 0-072 0-077 0-084 0.108
225 o. o61 0.065 o. o6q 0-075 0.096
250 0-055 0-059 o. o63 o. o68 0-087
275 0-051 0-054 0.058 0.062 0.080
300 0-047 0-049 0-053 0-057 0-074
Apr 77- Jun 79-
May 79 m ar 8o
0 1-385 1-494
60 0-366 0-395 80 0.294 0-317
100 0.245 0.264
120 0.211 0.227
140 o. 185 0.199
160 0.164 0-177
180 0-148 0-159
200 0-135 0-145
220 0.124 0-133
240 0-114 0.123
260 o. lo6 0-114
280 0.099 0-107
300 0.092 0.100

- 234 -
Table A 1.5 Combined Insulating and Fuel Costs associated with the
Roof Structure for Various Thicknesses of Glass Fibre
Quilt Insulation.
For heating by Night Rate ELECTRICITY to 15 0C
Thidmess of Insulation,
mm
(Cost of Insulating) + 10 x (Annual Fuel Cost).
WHITE METER
May-Jun May-Jun Oct 73- April
3.970 1972 Apr 74 1975
Unitt Z/m2
Apm--May
1976
0 3-07 3.79 4-07 9-87 11.24 25 1.64 2.01 2.27 5.04 5-77 50 1.25 1-52 1-75 3-59 4-19 75 1-15* 1-39* 1.64* 3-05 3.62
100 1.20 1-43 1.65 2.83* 3.42* 125 1.25 1-49 1.86 2.92 3-58 150 1-32 1-57 1-97 2.94 3.65 175 1-47 1-73 2.11 3-01 3.78 200 1-57 1-85 2.26 3-12 3-95 225 1.68 1.98 2-54 3.41 4-34 250 1.84 2.16 2-71 3-56 4-56 275 1.96 2-31 2.89 3-73 4-80 300 2.08 2-45 3. o6 3-90 5-04
WHITE METER ECONOMY SEVEN
Oct 78- Nov 79- Oct 78- Nov 79- may 79 Mar 80 May 79 Mar 80
0 13.87 16-41 11-13 13-15 60 4.72 5.61 4.00 4-75 80 4.34 5.16 3.76 4.47
100 4.15* 4.98* 3.67* 4-41* 120 4.23 5. o6 3.81 4-56
140 4.31 5.15 3.94 4.71
160 4.40 5-30 4.08 4.92 180 4.58 5.51 4.29 5.16 200 4.75 5.76 4.48 5-44 220 5. o6 6.11 4.81 5.81 240 5.30 6-39 5.08 6.12 260 5.52 6.69 5-31 6.44 280 5.79 7.01 5.60 6.78
300 6.02 7.33 5.84 7.12

- 235 -
Table A 1.6 Combined Insulating and Fuel Costs associated with the
I Roof Structure for Various Thidmesses of Glass Fibre
Quilt Insulation. For heating by Night Rate ELECTRICITY to 20 0C
Thickness of Insulationo
mm
(Cost of Insulating) +
May-Jun Uay-Jun
1970 1972
10 x (Annual
WHITE METER
Oct 73- Apr 74
Fuel Cost).
April
1975
2 Unit: m
Apr-May
1976
0 5-42 6.69 7-19 17-42 19-85 25 2.73 3.35 3-7,2 8-53 9-75 50 1.96 2-39 2.69 5.86 6-78 75 1.68 2-04 2-33 4.73 5-54
100 1.62 1-94 2.20* 4-16 4.94 125 1.60* 1.91* 2.32 4-03 4-85 150 1.62 1.94 2-36 3.88 4-73* 175 1-72 2-04 2-45 3-84* 4-73* 200 1.80 2.13 2-56 3.86 4-79 225 1.88 2.23 2.82 4.07 5-09 250 2-03 2.39 2.96 4.16 5.24 275 2.13 2-52 3-11 4.28 5-42 300 2.24 2.65 3.27 4-40 5.61
WHITE METER ECONOMY SEVEN
Oct 78- Nov 79- Oct 78- Nov 79- may 79 Mar 8o may 79 Mar 80
0 24-48 28.97 19.65 23.22 60 7-53 8-93 6.25 7-41 80 6-59 7.82 5-57 6.60
100 6-03 7.21 5-18 6.19
120 5-85 6.97 5-11 6. og
140 5.73 6.83 5-08* 6.06*
160 5.66* 6-79* 5-09 6.11
180 5-73. 6.85 5-19 6.23
200 5.78 6.98 5-31 6-42 220 6.01 7.23 5-57 6-71 240 6.17 7-42 5-78 6-95 260 6.33 7.65 5.96 7.21 280 6-55 7-91 6.21 7-50
300 6.73 8-17 6-41 7-79

- 236 -
Table A 1.7 Combined Insulating and Fuel Costs associated with the
Roof Structure for Various ThicImesses of Glass Fibre
Quilt Insulation* For heating by CHEAPEST DOMESTIC GAS to 15 oc
(Cost of Insulating) + 10 x (Annual Fuel Cost). Unit: L/m2
Thickness of Insulationg
cm
May-Jun 1970
Mai-Jun 1972
Jan-May 1974
Mar-Apr 1975
Apr-May 1976
0 3-95 4-19 4.51 4-87 6.26
25 2.05 2.20, 2.48 2.72 3-46 50 1-52 1.64 1.89 2.08 2.69
75 1-35* 1-48* 1-73* 1-93* 2.51* 100 1-36 1.50 1-73* 1-94' 2-54 125 1-38 1-55 1.92 2.19 2.85 150 1-44 1.63 2.02 2.31 3-02
175 1-56 1.77 2.15 2-46 3.24 200 1.65 1.89 2.30 2.63 3-47 225 1-75 2.02 2.58 2-94 3-91 250 1.91 2.19 2.75 3-17 4-16 275 2.03 2-33 2.92 3-36 4-43
300 2-14 2.48 3-09 3-56 4.71
Oct 78- Nov 79- ma, y 79 Mar 80
0 7.85 8.46 60 3-13 3-51 80 3-06* 3-47*
100 3-09 3-58 120 3-31 3-85 140 3-51 4-09 160 3.69 4-36 180 3-94 4.66 200 4-16 4-98 220 4-52 5-40 240 4-81 5.74 260 5. o6 6. og 280 5-36 6.45
300 5.62, 6.80

- 237 -
Table A 1.8 Combined Insulating and Fuel Costs associated with the
Roof Structure for Various Thicknesses of Glass Fibre
Quilt Insulation* For beating by CHEAPEST DOMESTIC GAS to 200C
2 (Cost of Insulating) + 10 x (Annual Fuel Cost). Unit: m Thickness of Ineulatione
mm
May-Jun 1970
MaY-J= 1972
J an-M ay 1974
Mar-Apr 1975
Ap r-U ay 1976
0- 6.98 7.41 7-96 8.60 11-05 25 3.45 3-69 4.07 4.45 5-68 50 2.43 2.61 2.92 3.21 4.13 75 2.02 2.20 2-50 2.77 3-58
100 1190 2.07 2.34* 2.60* 3.38* 125 1.82 2.02 2.43 2.73 3-55 150 1.81* 2.03 2.46 2.78 3-62 175 1.90 2.12 2-53 2.87 3.76 200 1-95 2.20 2.63 3-00 3-94 225 2.02 2.30 2.88 3-30 4.32 250 2.15 2.45 3.02 3-46 4-54 275 2.25 2-57 3-17 3.63 4.78 300 2.35 2.69 3.32 3-81 5-03
Oct 78- Nov 79- may 79 Mar 80
0 13.85 14-94 60 4.72 5.23 80 4-34 4-85
100 4-15* 4-72* 120 4.23 4-83
. 140 4-31 4-95 160 4-40 5-13 180 4-58 5-35 200 4-75 5.61 220 5. o6 5-97 240 5-30 6.27 260 5-52 6-58 280 5-79 6.91
300 6.02 7.24

- 238 -
m
0 r-4 % m
0
r-I 0
ts
la 0:
0
cc C13 >
0 0 $3 LC) 02 -H to
4-3 M 0
0
(D
0 P4 P.,
4-V rd ca 9r
r4
Id -ý *42) cd
10 4. a
4a rd -, j m (D +3 0 +2 cc
U Cd (D J3
:390 Pr4
loý
H
> Cd
Cý ON
.8 co
4 C7% 1: 4 r-i le. r-I . rj F4 P4 4
F-4
ON A
r-i C-i t--
cy C% 0 cli cli
c;
cli cy -q %0 0 %, 0 u-, L--
N rn rn %0 C% Lr% cy% UN qt %0 le fyi (VI cu r-i
0 0 0 0
c; 0 0 0 0
%0 rn r- r-f C%i cu UN
rn CY ri
c; lý eý (ý c; %D el CV ch r? cý cý ri
0 0 0 0 0
r-
CM %D
4
C\l LCIN
.4
Lr%
11; rn
(Y% CM rn
%0 Co cu
lý
r-- U-ý cy
cý
(y% r- r-1
lý
(11 CY r-f
(ý
U% CY
0
xo Co %0 c)
Kt, r-4
-ct LEN tr%
0 0
en d-i r- 0
zr ýr rrl e
cy 9
A
cm "t CM %D
uý nt r? le . r-i en rn rn
ý, 0 Cm CO
en evi r-i 4141
l"ý %j E3 R 9 r7 0 A -i cm
CM C% f-1 CO
cý Ilý ri #-i r-4 CY
+ Ei 8 C2 IR
9
CY C. ) 4* 0 c2
02 CY H r-4 c4 M +m 0 -p 0 4.4
-II, Co ;3 14 0
E-4 ci 02 0,1
`4 CO,
r-f cl m r-i r-i m Cil +, 4A
gi E-fr. 04-4nop, H D2 H :1 )-4 Ici 00 0)
Id +m +M -d
ID 0 4) 02 4)
-p r-1 r-1 c4 +a p4 0 pl c14 -" ce
mmuU C> C. ) 94 to r. 0 10 Ici
m C> 0 r. 0d
-ri 0 Pl pq -H 0 ri CY 1
93 0--1 ri

- 239 -
Ei L£, %
ý0 o t- %0 0 g Mt C, % Lr% CNJ %D %0 r -0 pý
r-4 %0 Co
L t.; LC, % r, 1 CD ri t-
c2 0 Co Co t-
94 0 9-1
0 0 0
r-4 ý (h %D C) p; ýt - t
%ýo %0 rn 0" :? Co
Iti 4-4 t- t- r-1
cý r-i ": %D
, -e
0 ', H e
z (D teb
,4 r-f Fi 0 , 0 e 0 c) . - 0 - 0 03 r 0 0 u2
CO CY
CP% Ch Ll%
CD ON CY%
vi
. g) 1;
1 e r- rn
M 8 0
cr Co r- cy t- :ý
rel mt UN t- C % rl CIJ > o k
-0 0 r4 0 0
X G, r-i 1
+» CY "0 r- q CD N (%i Co Co -Ct 02
-4-1 0 t: %0 c--
%10 r- Lr\
H Ln rl CY %D 0
0 %0
. -
9 9
02 0
Pci H
ON r-i
o %0 U N nt UN
(D 53
r-i 4)
C)
c2 N ri -
r-i Co Ln l r-t CD
ri 0
ch A
cli 119
>b 94 ý u ,
r- UN g
r-A 0 Pi pl U%
m c; o o bD r.
-ri -p
E) lii
p4 « l % Co
0 &T g 0
C% mi A
zý P-4 r-4
ci 5 4 e
ci ci :i Q H 0 0, % -1 c; o 0 ýo 0
1 cy Ci 1 c2 cli N r-4 0 _H Co t- t- f-4 OD %0 H r-i 0 9 9 CM
; ; ci cy N CY
:i Cd c c
ig +a
+3 Id -ri p to
0 Lcl.
g
0 p 0 CM r. c; CU ca r.
0 0 ý, 0
i eH 4H
92 13 0 » Co
44
0 CH 0
G2 c
Co ;j c6 0
Al 0
A rm4 -ri PCI
0 'A r, 0 > e 0 m A G2 cw ,i
4-4 r. 0 -d ta H -d 0 0
4-1 ri
2 4) m
CI 0 . 43
0 +v
0 r-4
0 r-4 0 .4 -0- o +v +3 +B r-1 p4 el pl
-4 1 + Cd
p H
, p4 9 43
vi
'
m
C P-1 0
g - j ä 8
0 Z
V 0 e e 100 ""l Z 0
0 -CJ
m 9
u 0 n 0
:D p4 --4 ýD rzt

- 240 - 0-1 13 LCN r-I m
ug"
P4 r-4 m
0 0
r-I
'i F-i r-i 0 0 rr4
0 m
0 *9 m P4 :j
Id 0 CD
4a
-ro 0 0 53 m -ro m ca
mýt! 4z
P3 H
al U 0
4a
-0
P4
-, -4 (D 0
104
$3 FA P P4
P4 . r4 -ta . 43 42
4&
w ID 42 0 4s co
CO (D
to 14 ;30
0
8 ON tl- r-
4-1 a
0
I CYN
Q1a'
43 C,
o
lit
UN Ul%
C7% 'n IT 0
rn r-4 0 t-- C%j 57
C;
CY %0 LA t. - «, e
CY
H cu (0 -t Co x fli 10
C'j cli 8
I- .
UN ti«%
%Z
S
CC) cli
w rn Co cli t- 0 g- CY t- 19 u; A ÜA
C-i U-% Lr% Kr ul,
%0 %0 2 r4 Illý rm er% 0" Mt
0 c5 0 c4 wi 4"
4» 00 441 00
Co Co . :500
00 ri ;:; 0e0ee 0 CN p4 ID 4)
Ij 0
0008
Co 19
0i90 04
99
%3 0 180530. ek OH i3 el cy ri A0m CY fi p4 Z) 9:

241
u
0 12 c Co LN 0 cy Co UN r-4
Ici 0
r-f
0 0 rö C%i
0 cy
c; oi
c; m
4ý r-i
Ic; ci ci A A A s f4
>; Z 0 j4 0
0 ä 0 r-i 4.4 ý t- a\ t-- CM %0
r- C%i
-Kt CM CO CM f g CO 0 A
cý cý r-1 0
0 0 0 C) CY cli 02
0 Al
A p4
«n 00 CM %10
t. - CM mt 0
cy ýt
CO c\ CM r- et
c 13 ý - cý cý cý m
- - ý
en Al p M: 0 0 , 1 0 0 0 cli cy cy cy 19
+a id
1 0 t-
t-- -i
le C> r-i
OD OD
pý 0 0%
A
fli Q wt
r- %0 t-
i > 94 cy\ cli cm r-i f--i 0 0 4 0
0 $3 cu ri 0
o 41
o CY ci cli
tý -ri
o
m
U e > %0 (Y% A
H CO
en %D
rn M
CO L'- 0'. r-
c) #--1 .. f e
X
-p 0 pl 4 t-
C% r-i
c; 0
c; ci Iri (D 94 >b
ci 0
ulý F, A C%i r_t
nt iz OD
Co r-t ýlo cli %0 %0 0-4 10
p4 02 -< W%
cl- %0 r-i m r-1 0 0 %ý
Ici 5 e 0
p
Z
0 el el r-4 cy 0', ',
0 bD p4 rJ2
2 9
.H : +a
Id (D
ro
0
u p4
--4 Ict rn 4 cq (ID
IID U'% 9 rn
u-, 0-4 3
rl (7,
r- r
U2 r-i cý c; 0 0
z CY
93
Id 0 -3 -v-i E-4 0 p m
rm rn rvl
rn rn «i
c% rn
CY% UN
en CY
V2 m A ; ý0
r-4
c; 0
c; 0
c; '; 0
.. f A
ci 10 m g
1
!ý >--., r-i c 0
(D, N Id
02 R a +
to 0 U
4) -p 0
-p ra (1) 13
L
tý A
0 4
Fi 0 9.1
0 -v-i -fi 0
4-4 0
4-4 0 94
92 cy EI
H +D
H o g4
0
H U
4-4 0
4 0 14 ID
2
0
p4 E-4 8 1 Ja D 1-10 0
', m +
A A A 4-4 53
H d 4) +b
0 43
cn
8 2 " , Z 0
0 J, 0 0 0 0 0 --4
, -� 0 C,
+0 +0 0-1 mi
43 ei ,
rg
. -1 1 to Id
to Id
c> c. > 2
rs 0 m in 0 CY
Co -ri
r-4 W A -i cm ýI
93
ZD 0 r-4
CLI p4

242 -
r-f r=§ 10 0 CY% LI- c9
Co en rn le
al% r4 Co e- en CM
%0 Co m
Co cr%
it 0. -1 C- r- e- r- t- (7%
> 0
94 0 0
0 0
0 0
0 0
0 .
0
CD 10
0 0 i C" c3 r- O\ t-
CM %0 l
c%i
Z --1 %0
1? r-i Ul%
c r- CY
%lý U'% iz
r? t- VN
1111 0 0 x4
e 0 4 0 C)
ý 0
u2
0 .U
j3 ý
> A
--4 CD t--
C%i ýID -
c%i % -f %0
rei -i
Lfl% M
rn r- -
cli %D
CM r-4 rvl cli r- +Z ic ý o\ r-i
ct 0
C r 4 0
(9 c; c9 0
Cd _H
0 >
-8 94
L. - t- C%i t p;
CY rei rei
;A cy
Q% UN r-i
%0 CY
C% cv 0%
«e UN t- le
o 0 Z Cd
x o\ 0
0 0
m
+»
t?
%e
LI- Co %0
rgi rei cu cu r-4 Co %D %D Ch e; t A CY cr% 0 C> CD
pf ri 0 0 (9 0 c9 A AA
r-i 0
93 (D Fi
C> 0 94
e, +, >3 ,a to
g -4 '-, LI-
s37
cli
gý
cy
e
cli C%i
%0 LC% r-4
r- 0 H t- r- t- VN
Ici 9
>b m
0 o
-p Co CY% r-i c5 c; (5 (9 CY ci ci ci A
to PA
Cd H -4 le
r. - '
%I0 cu
rn cu
0 cy
CY% LA %D LA VN
tn UN
E-1 to
1
CY % c; 0 ci ci ci ci
A
Ici 0
-9 ýI il
E-f U2
0 ri LI-
lIZ ri CY
tt-, 0 CY
-it OD r-i
CO CY H
CO CO 0
%ýo ri
CY ch Cli r4
«e P-1
0 0 0 ci ci ci cm cy
p
41 to
c$ CD ýi 4.3 »
1-% u% Co A
0 -p Co
cy - si
0 0 0
(5
P-4 '5 ra 93
F, 0
ca 0 H -p W
44 o
44 0 94
4)
0 9, 0 EI -Z, 4-
Co 4)
_p +B 00
-H p4 E-4 u2
0 0
rj ja +a
A +»
CFJ %-. -
rj p4
8 4r 92 42' A 0
b4 64 &4
0 93
9-1 0 14-4 r.
04 Pf 4) 4)
4
H 4) +b
4) -p
u2
8 H 0
P-4 9
+» ca Al 43 +a -p 4) r-4 pl 0 F-4 A
0
"4 "a "" «" +0
r', f"' 400 to C. ) 0 m 3 r-i
. 92 1 9
0 p4 H cy c 0 M
ni f -4 CY
to C-4 --4
93 ti r-f rgf Q p4

- 243 -
Appendix 2.
Questionnaire for the Survey of 'Rnergy
Use in Houses, -

- 244 -
I
SURVEY: USE OF HOME HEATING.
Address: Site No. 11 Interview No.
am from Bradford University and we are conducting a survey to find out
how people use heating in their homes. I would be very grateful if you
would answer-some questions as part of the survey.
Could you tell me when you moved in here?
Month Year
Q. 2. What type of central heating (if any) do you have? Gas with radiators ... 1. Other (spec. ). Gas warm air.... ... 2. Electric warm air ... 3. None ... 000 as* 9.
Q. 3a) Are there thermostats in any of your rooms for controlling the central heating?
Yes 1. No ... 9 (-*Q. 4a) D. K. ... 5' (-iQ. 4A)
b) Could you tell me where they are and what they are usublly set at when the heating is on? Location. Setting.
IF ONLY ONE: SKIP TO Q. 4a. Boiler setting.
C) Do you regularly switch from one thermostat to the other?
Yes ... 1. No ... 9
At what times do you usually Why not? switch over? From to at Which one is normally From to at in use?
Q. 4a) Is there a time clock to control the times rooms are heated?
Yes .... 1. No .... 9 (-iQ. 5) V. K . .... 5 (-+Q. 5)
Do you make at least some use of the time clock?
Yes ... 1. No
For what times is the time clock Why not? (PROBE) normal. ly set for 'On" in cold webther? From to
and from to 60 TO Q. 5.

- 245 -
Q. 4c) As well as using the time clock, do you also regularly switch the central heating system on or off manually? First for weekdays'and then for week-ends. WEEKDAYS: Yes .... 1 No ... 9 D. K. 5 WEEKENDS: Yes ... I No ... 9 D. K. 5
, Q. 5. We would like to know if you ever: turn off any of your radiators using the valves (shut off any of your hot air grilles using the levers). Are any of your radiators (grilles) ever shut off in this way during cold weather? Yes ... 1 No ... 9
Is there any particular reason why you don't shut them off?
I iQ. 6. ASK 'ELECTRIC WARM AIR' ONLY.
What charge setting do you use?
High ... I Medium ... 2 Low .. -. 3 D. K.
2.
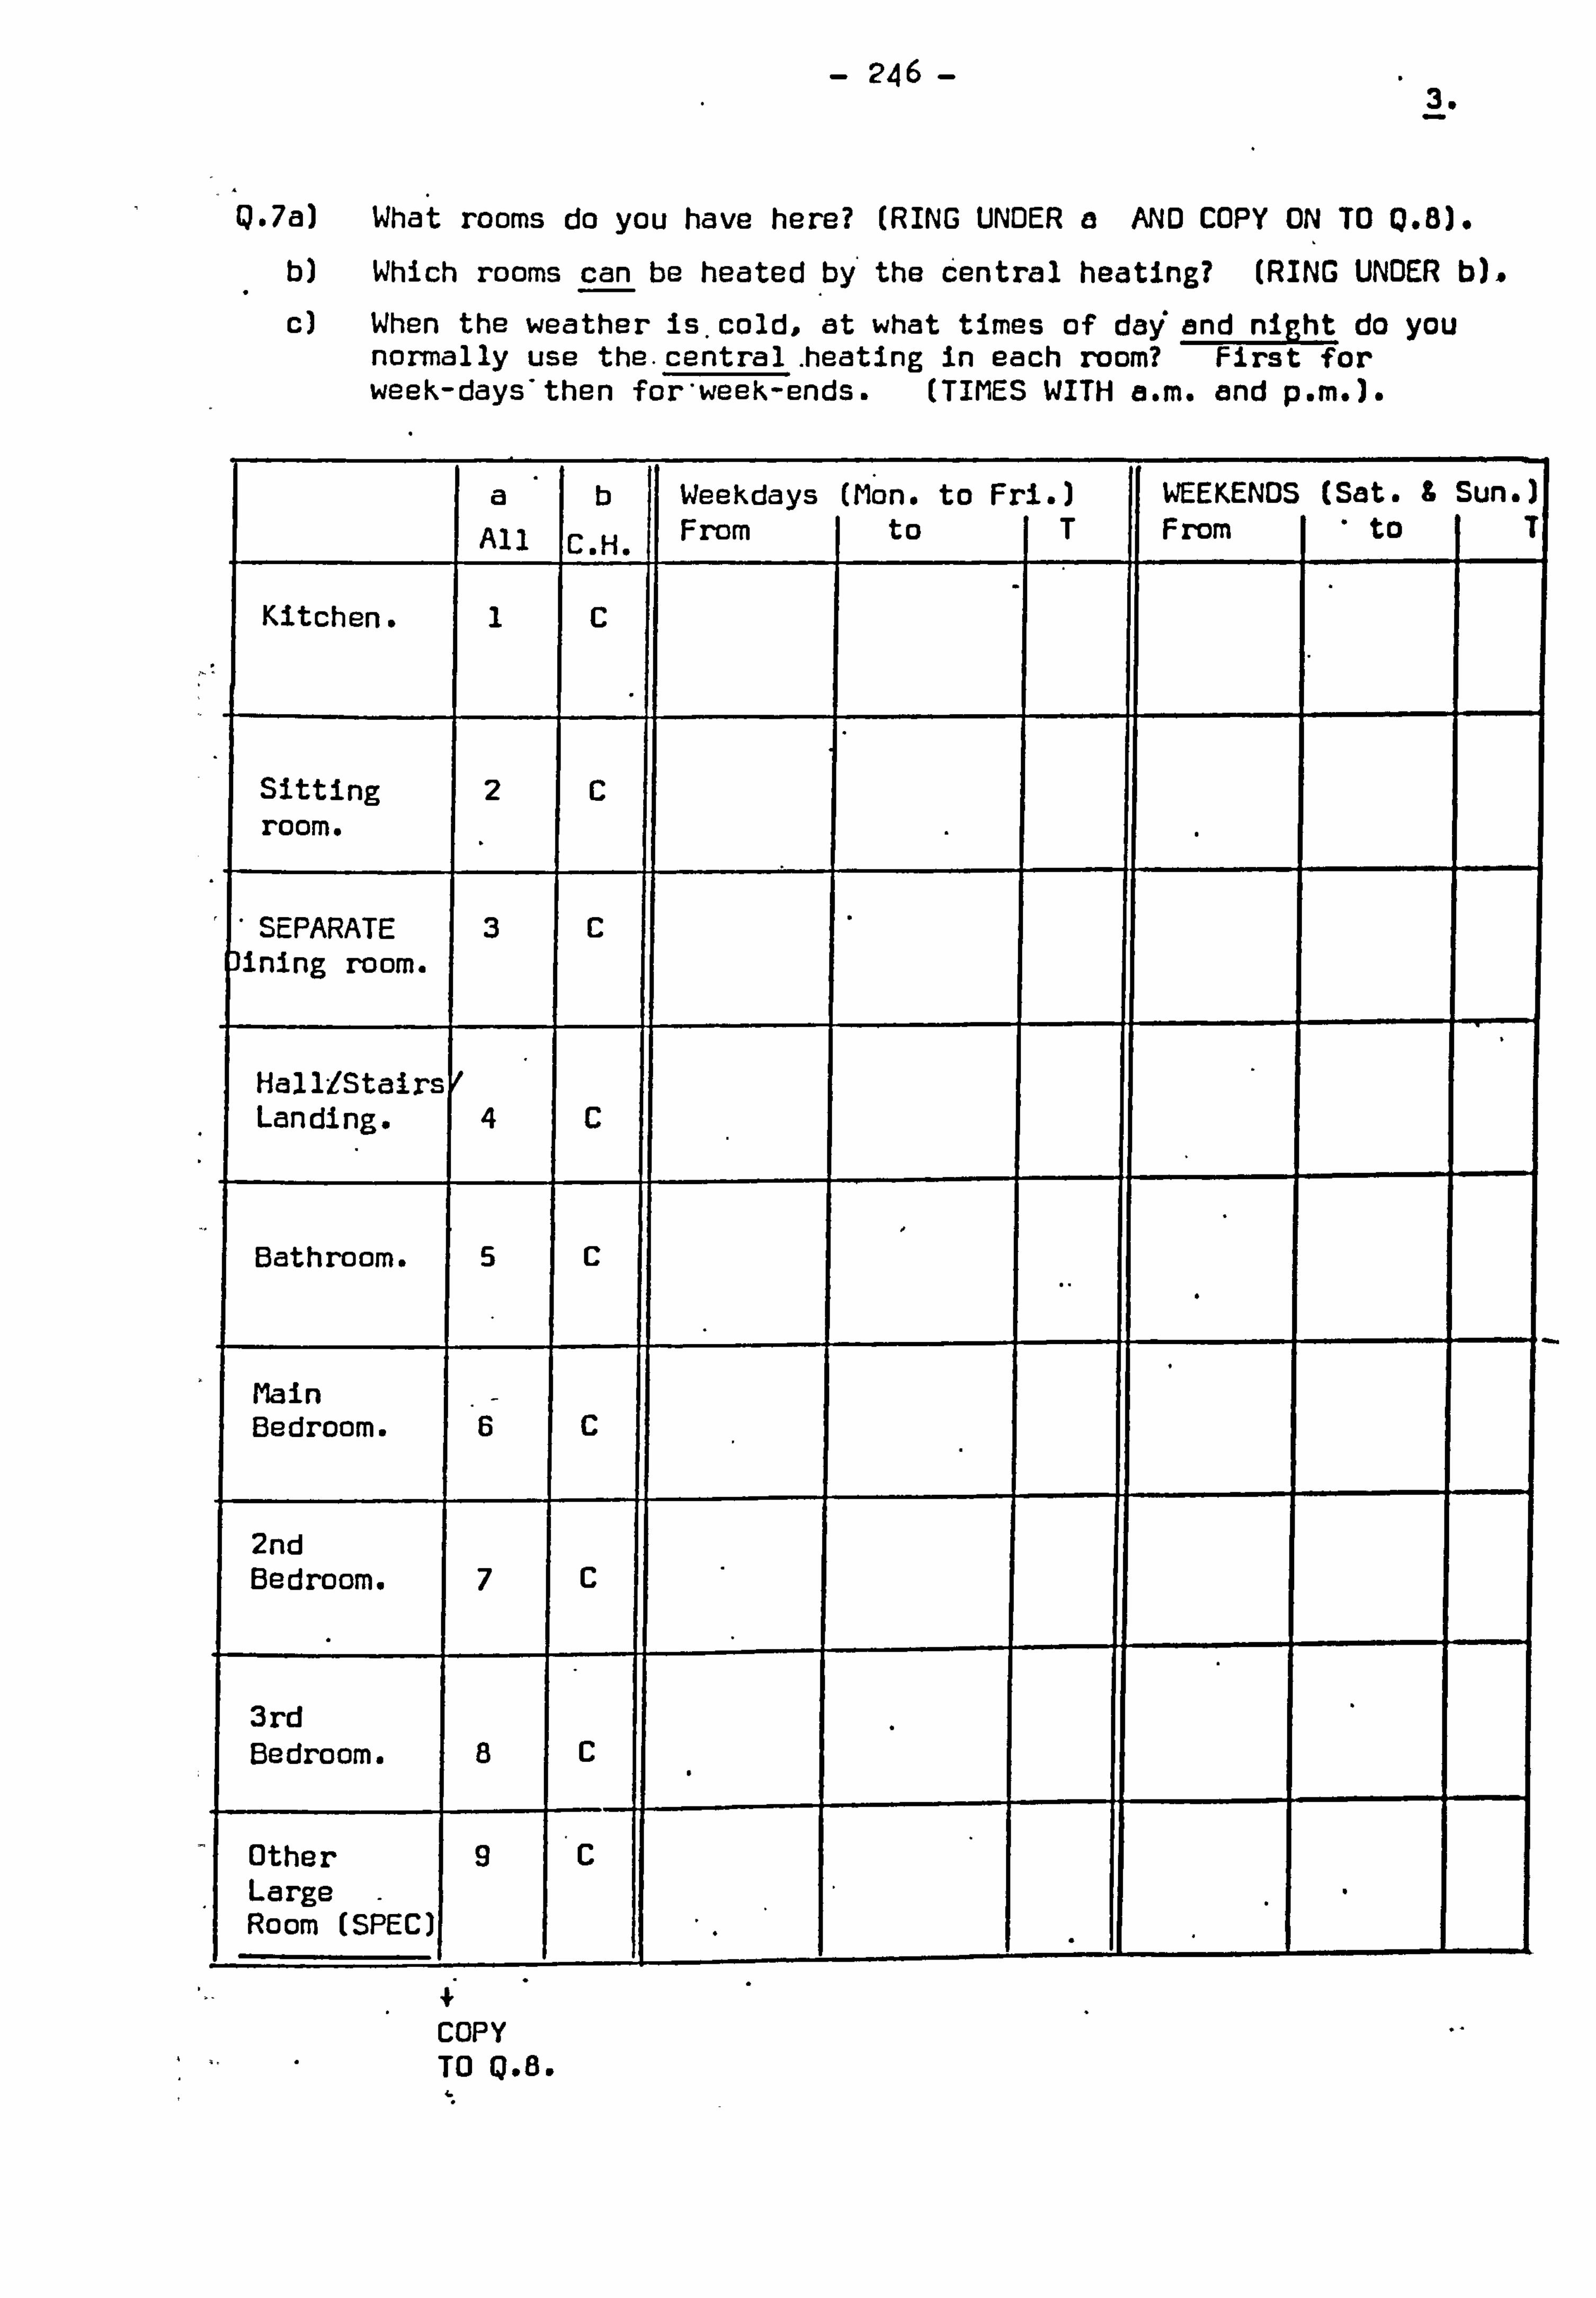
- 246 - 3.
Q. 7a) What rooms do you have here? (RING UNDER a AND COPY ON TO 0.8).
b) Which rooms can be heated by'the central heating? (RING UNDER b),
c) When the weather is. cold, at what times of daj and night do you normally use the- central heating in each room? First for weeK-days'then for*week-ends. (TIMES WITH a. m. and p. m. ).
a b Weekdays (Mon. to Fri. ) WEEKENDS (Sat. Sun. ) All
. C. H From to T From to T
Kitchen. 1 C
Sitting 2 C room.
SEPARATE 3 C Uning room.
HallZStairs / Landing. 4 C
Bathroom. 5 C
Main Bedroom. 6 C
2nd Bedroom. 7 C
3rd Bedroom. 8 C
Other 9 C Large Room (SPEC)
COPY TO Q. 8.

- 2, d 7-
Q-8a) Apart from central heating, what types of heating do you use in-cold weather?
Radiant Electric Fire ... 1 Paraffin Heater 6 Electric Convector. 2 Battle (Calor) Gas Heater 7 Electric Fan Heater. 3 Other (SPEC) 8 Radiant Mains Gas Fire.. 4 None ... 9 Mains Gas Convector. ... 5
b) When the weather is cold, which of these types do you*use in each room, and for what times of day and night do you normally use it? First for week-days and then for week-ends.
ENTER HEATER CODE(S]*UNDER b, THEN THE TIMES (a. m. &
Copy from
b Type-
Weekdays (Mon. to Fri. ). From To T
Weekends From
(Sat. & Sun. ). To T
Kitchen.
All.
I
Sitting room. 2
SEPARATE Dining room.
3
Hall/Stairs/ Landing.
4
Bathroom. 5
Main Bedroom. 6
2nd Bedroom. 7
3rd Bedroom. 8
Other-large room (SPEC).
9

- 248 5.
Q-9a) Could you tell me how many adults a*nd how many children (undar 18) there would normally be in your home at the following times of day during the winter? First for weekdays and then for weekends. READ OUT TIMES.
WEEKDAYS. (Mon. to Fri
Adults. Chil; ren.
I WEEKENDS. (Sat. and Sun. ).
Adults. Children.
10 o'clock in the morning.
3 o'clock in the after noon.
8 o'clock at night.
2 o'clocL in the morning
b) Do' you of ten have heating orf. for periods of an hour or more when there is no-one in the house (flat)?
Yes ... 1 No ... 9 (-*Q. 10al D. K... 5 (-*Q. 10a).
When do you do this and why?
Q. 10a) Is your house Cflat) usually as wam as you would like?
Yes ... I C-*Q. 1w No... 9 D. K. 5 (-*Q. IU
b) What is the mason for this? [PROBE).
Q. 11al Do you suffer from draughts in any of your moms?
Yes ... 1 No ... 9 Ca. 12a) D. K... 5 (1.12a)
b) In which rooma?
Q12a) Do you get any damp paýches on the wall?
Yes No ... 9 (-*Q. 13a)
b) In which rooms

- 249 - 6.
Q-13a) Do you regularly open any windows in cold weather?
Yes ... I No ... 9 (-+Q. 14a) D. K... 5 (-*Q. 14a)
b) In which rooms. and why?
ROOP. REASON.
14 a)
b)
c)
Could you give me details of any loft insulation here?
Type Thickness
When installed
Do you have double glazing in any of your rooms?
Yes No ... 9 15a)
In which rooms?
Q. 15a) Has cavity wall insulation been installed here?
Yes ... I No ... 9 (-+Q. 16)
b) What type is it and when was it installed?
Type Installed
Q. 16. Do you normally leave your-bedroom doors open or closed during
ýhe day time?
Open ... I Closed ... 9 D. K... 5.
Q-17a) What is your main method of water heating?
Central Heating System ... 1. Gas Geyser-(Ascot ... 3. Electric Immersion Heater. 2. Other (SPEC)
Supplementary method. (PROBE)
b) Do you have a hot water cylinder?
Yes ... I No 9 (-, -18a) D-K.... 5 0-18a)
C) Is it lagged?
Yes ... 1 No ... 9 D. K... 5
d) Do you know the setting of any thermostat on the immersion' heater or cylinder?
Q. 18a) Do you usually have as much hot water as you would like?
Yes ... I (-*Q. 19a) No ... 9 O. K... 5 (-*Q. lga)
b) What is the reason for this?

- 250 -
7.
Q. 19a) Taking your room and water heating arrangements as'a whole, do you consider them generally satisfactory? Yes ... I No ... 9 D. K... 5
b) If you had the opportunity, would you choose to have different heating arrangements? Yes ... I No ... 9 (-+Q. 20a) D. K... 5 (-*Q. 20a)
C) Considering both room and-water heating, what sort of heating arrangements would you choose?
d) What are your reasons for this choice?
Q. 20a) What type of room and water heating did you have before you moved here? (PROBE).
b) Do you like the heating arrangements here more than what you had before, or not as much?
More ... I Not as much ... 9 D. K... 5
Which of the following appliances are used regularly here?
Gas Cooker Washing Machine ... 4. Electric Cooker ... 2. Electric Tumble Drier ... 5, ' Electric Kettle ... '3.
Q. 22a) This last winter, how much paraffin and battle (Calor) gas have you used? First for a week in cold weather and then for the whole" winter CENTER BELOW).
b) How much did you pay for each battle and each gallon? Used in a Used In whole PRICE. cold week. winter.
Paraffin. gallons. gallons. P/gall.
Bottle Gas. bottles. bottles. E lbottle.

- 251 - B.
CLASSIFICATION.
A. NAME ADDRESS
B. DATE
C. TYPE OF DWELLING:
Centre Terrace House.. 1. End Terrace House. ... 2. Semi-Detached House... 3.
Detached House ... ... 4. Ground Floor Flat ... S. First Floor Flat.. 6. Other (SPEC)
D. ORIENTATION: Facing
E. TENURE:
Council ... ... 1. Housing Assoc. 2. Rented: Private 3.
Owner Occupied 4. Other (SPEC)
F. TOTAL NUMBER OF PEOPLE 'IN HOUSEHOLD:
Number aged under 18: - Ages of these:
Number of O. A-P-s:
G. OCCUPATIONS:
Full time
Part time
NOTE ANY DETAILS.
H. TOTAL HOUSEHOLD INCOME, AFTER STOPPAGES. (USE CARD).
Per WEEK. Per MONTH. Per YEAR.
Up to E15 (1) Up to 165 (1) Up to E750 E15 to 130 (2) 165 to 1130 (2) E750 to 11,500 E30 to E45 (3) E130 to E195 (3) E1,500 to E2,250 E45'to 160 (4) E195 to E260 (4) 12,250 to E3,000 160 to E75 (5) E260 to E325 (5) MOOD to E3,750 E75 to E90 (6) E325 to E390 (6) E3,750 to E4.500 Ego to E105 (7) 1390 to E455 (7) 14,500 to E5,250 Over 1105 (8) Over 1455 (8) Over E5.250

- 252 -
Appendix 3.
Data and Correlations from the Survey
_of Fmezýcnr Use in Houses.

- 253 -
>b r4 cl- r-1 D2 (D cil M
0 0 0) ca Id
92 0 0 cd im
0 it
+B E-4 +z
cm 0 cm 0 r-1 ri LA 0 CY nt L, - 0
qj (D
+b 0 t02 m
9 rn Ul% Lt% \o e41 le en -'t til% rl rf) t-
Xd r-i 0 r-4 r-1 0 r-4 r-4 0 0 0 r-i r-i
19 r-i P-1 ri (D C) cu 0 d-i 0 0 C) en
19 Co Cd Cd Cd Cd to Cd 0 0 g4 0 ci pq m ri 0 r4 pl CD
0 7p C. ) 0 r- CY 0 H
0 m
C: ) 0 0 CY 0
r-1
$Z p, --
r--1 0 +a %-ý
0 0% Co R -f ri
0 0 0 cy
0 ja ,'
94 f--1 _H 0
c--4 r-, c> Z
0
U2 ý 0 q: t r-i %0 iz 0 ei
r-1 Ltl% c--
0 0 CM (D
0 ri
r-i r-t
(D c tr% Vl% (7%
0 CY
M Co UN Lr% Co
c4, u g %0 r-i 00 r-4 ICIIMJ Co
m_
, %ID (D %e %0 t- Lr% C) %0 CY% W% \O
02 CD CO 0 ca
+3 Co
4) L-- t-- a A 13d m
U-% %0 cy 2
cu CM
Cj %D -4 äD Ä
0 %D r-
%, 0 r-i 11 1
p 0p 't +, ýA 1 Ln
cy c
cy Mt
CY P-4 le p; A CY 11 (9 iz .4
44 0
CD q 09 4) 9 1. - C%
CM er% f-t
53 c
ert H
9 CY m
LA cr%
H rn
en r-4
%10 %0
%0 e-i
b-i 0%
" r-i 01 r-1 +M H c2 %ýo
CM r- cu
r-f CY
f-4 nt
CO rel
rý 5;; cu rrl
en rn
Z N N
0 nt
r. 4 -t
u14 m ý 21 s, d C c 0 P-4 ri 0
, 00 r-t cm rei e tr% %0 r- CO 0% C) r. 4 P. 1
cy r-i 9 1 0
E-4 =

>b H cl-
it
co 8 -124 .
19DI I
4) 4a r-I 0 cd
0 ri 4 'd $4 42 F-f co 4-
o ý4 0 .0 r- E--o ILI- c"i Ell
Cj +* CY
V4
4a
r-4
4-0
cc IN 4a
w -. 0 =1 0
t.. j 4a cd 42
cc 4a
V
P. 4
CY
CD r-i -12
- 254-
cow go i4
MM 02 00ýl(D(D(WD4aW)04MD000009CDOOWOOOOOO* 0.2i 1*4 : 2; 14 j)--f ;4 ;4 jq ARA
;AW. A 1;, 4 >-I DI-I ý-4 ýM >-4 P!; ý2; k; >-I 0-4 A 1-4 M,
I
00 rn 000 r-A 0 CY OC% 0 r-, 00 0 ul% 0 W% 0 Lr%O cm 00 UNO N
r-4 P-1 r-f ri r-i r-i 1
02 a) ri Co M :i
93 Ici
oel m :100 0 ca NC
(P 19
A0 Z Co :i
-p 0 02 M
rn u-, U-% LN en -; t U-% U-% qt -t rn 0-4 LC% LCN 't en i-1 e U-N e rn rn nt '%t W% rn 'Kt gt 1
13
r-I 0 r-f 0 r-4 C) VýCQ H r-I 00 rl rM4 0000 rml I r4m 00 r-4 00 r-I 101 0
', rn q ', 'n oo rn -4 C) In 0 04 14" -, .j,, r. 4 0 rn rn en 00H rn rn I
Nr
cl or 0% C*4 Ll- %D 'A UN fn UN Cy% t- 0 0 %ýo 00 -4 CO r-I 00 LC% ON
IDONO 5 : ý) Lf. % ul% C*J C14 'IV,
N r-t rl
tl'% C', 00 t-- wt H UN *V 'o -0,
t- r-4 tch Lt-, k ýN
- "A 14 10 -. 0 1ý0 U'% Cr% Lc, % CYN r- LC'% aN P-1 r-910 1.014- rl- r-i r-q f-f
I
re r-
--4 t-%000 cj %Z ch 0 0,0 CY%CO 0
twxt", l 0
(X ch r-i r- r- r- ri Co -0 r- u-% c% a'. Ln r-, t- U-% L- (A g% U«% CO "ýO
r-i r-f 21
tr% CO e* t- %, 0 OD Nt CO c%% ciýh
* Ch j gt r- * -e * ei e ct * UN r-i tt'% CY
Co V. % cu rn %0 UN t--CO ri -1 ý; o% r-4 -4 r-1 CY\ en
9 ýe r-co cm CY% U'% LN rei CY% r-i ;g9 <7% &h 'P; 'P; ei cy cm rvl CY týI cy cy rr) CY CY CY r-i CY
1
cli tl- loý Uý C; A *4t rr r-4
r-I
C'S Inten Icy r-"
,., cy rm e Lg, % %0 r- CO C% 0 f-t CY «, 'gt W% %0 t- CO C% ýf CY rn -e ctQ
\O 17 Co 1 r-1 r-4 r-t r-1 el r-4 r--1 m P-f r-4
R CM CIJ CY cu CY CY
en 0 -w4- rn rn a% C%J r-f rn 0 f--4 rnS 14 0 r-f UN 0 U% q1t C4 "t U "% !4ý SET -U-4%
C;, 'n U-N C'i 0 'n -1 -4- rn 0 r- . 4-co co 0-4 C'i 0 U'% t- CY% U'% 1-4 "t
'tr ýt rn 0 ýD (7% Lr% 00 C-4 (7% r- 0 r-4 -4 Cl- 0 rn en UN oi co CO %D Cy% 0% 0%
Cý **0-0*000a**a*00 17 C'q C4 1-4 C\l r-I CM r-I CY cli f-4 CY CY CM C-4 r-4 CY r-4 C14 C4 C\j V-4 r-4 rt
o 14 ID
4& +b Vk8 0 1-4 $4
CA 4ý4
E0
0) CD 0 :j0 0
rg
140
od (D
r1l 4A
S
�I
4a 0
4m

- 255 -
cc)
m C, 4 C
Cj *j
(D 0 J4
+. V -IA 0
C"i
A; a
C\j
ca
r" -rl El . rj m F4 0
aý
Uý
0
co
Uý
4) In 0 0
Cd
N
.
a, F-I
Ei
>b r-i c4
0) (P
a) ein ra
4) mA A 0)
ILI (D 5w
0 +* 0 03 t13
r.
-H 'Al 0:
4) +* -", r-I 0 CIJ to
(D $4
42
C13
cm R C14
W A3 1 .0
J IR
(D 4a
4-4
0;
Co (D
-9 (P U 14 19
pa Co
0m
ca co M pq a
0
to ý; m 0 (D 4 d) ý-4 1.4 ý-4 ý-4
r- t- CO t-
0, ýý A0 "e 0
A0 r-4 000 ei -t 0, e 0 C) C) r-i r-i m r-i
Co 17
rr) e C, 4 CIJ CY CY VN
r-4 r-I 43 0 1-4 r-4 -40 r"I 0 rl -4 -4 -4 r-4 '-'
CY rn rn 0 -1 Cy en rrl r-1 #, el 0 rl r', rn 0 "r%
Am 0o0 e-i r--0, % 000 ri 00
r-i ', 2Z %D Z2 e
rn gý R r-t en cy «i a, 4 AP Pt %0,137 g' N rn ch 00 erl 0'% elll P-4 CM C) W% rrI G% %0 %0 Ln r-4 ý, 0 U-%CO en rl CY% Itt ur\ LA 0 %0 U-N
r-4 r-4 r-1
rn o ce c
en E%i rgtzli 4
C9 co 'UNZO
co r-4 0 u, %O 0 2 r-I r-4 r-4 H r-I fl-4
, -i N Co H 'Ks. 0 #-ýII ti"% Cy '%t 0A UN P-4 -4 g%
A \o Co en 0 ON VN t'- e t- tecc>
mi %0 ch
", 1"91 g'n ci crn
-, Co cy rrl ri rn en CY
CY rn t- U-N U-N 'm; r CIJ UN (Nog & C'i un ý; R- CYN r'- fn 'I
N Kt 'r- W-t, -q rn r-I CIJ
Cy% rr100 H Co 2 LN %0 c"i <7% r1,9 c� 91 Pi %0' %0 a, Q :ý Lc% v, % L-- e t,
4- LA CNCO CO LIVZ r'l LC% CU rl L(N 0 r- %D
CY, % g «e CY% ON '. e , -, L-- g0 cu tcl%
u-, 00 u-% u-. ' mt r- l, leu, %
N CY CY H cm CY iz
r-4 (%j CY cli CY C, 4 cli CUY
A ,i CY en qt Lg. % %0 t- 00 g\ 0 r-1 CIJ s'm qt UN \o
r-i r-i V-1 r4 r-i M r-1
A 0 pq 9
to
7: 42
0) t. - t- 4-4
0 :3o 00
+*
t- P, 9) t- , $3 1 0 m t-
93 ri
R
00 f. 4 1 93
4A 4a 0 P4
88 4A co tic
ro
4-D 04 m
rý pq
a 4-
1.2 Co Cd 09
4)
pp
i3 9

- 256 -
Table A 3.4 Correlation Coefficients for the 9 Type 1 Houses
included in the Regression Analysis of P.
Gas: 31-1-78 to 5-5-78P or similar.
Electricity: 26-1-78 to 27-4-78.
pRs
H
s
c
v
0.890
-o. 856 -o. 96o
-0.245 0.011
-0.248 -0-078
-0-149 -0-031
o. o85 -0.268
o. 687 0.822
-0-446 -0.634
0-527 0-551
0.2o8
0.134
0.328
-0-733
0.085
0*299 0-334
-o. 6o6 -0-514 -0-724
0-511

- 257 -
Table A 3.5 Correlation Coefficients for the 21 Type 2 Houses
included in the Regression Analysis of F (those using no
paraffin or bottled gas in the electricity metering
period 1-12-77 to 3-3-78).
p
H
s
v
w
G
E
o. 63o
-0-56o -0-749 0-561 0.452 -0-185
0.672 0.414 -0.208
0.100 -0.402 o. 16i 0-010 -0-033
-0-328 -o. 2o6 0-077 -0-413 -0-411
-0.229 0.194 -0*238 -0-430 -0-451
-0-040 -0.065 0.101 -0.230 -0.080
0.010
-0.219 0-355

- 258 -
Table A 3.6 Correlation Coefficients for the 15 Type 3 Houses
included in the Regression Analysis of
Gas: 5-1-78 to 5-4-78# or similar.
Electricity: 20-12-77 to 22-3-78-
1; H
H1
_0-473 s 0-537 -0.896
* 0.471 0.107 -0-180
* 0.570 -0-090 0.082 0-775
G 0-432 0.170 -0-152 0,249
E 0.231 -0-219 0.183 0.302 0-317 0-339
n 0-562 0-512 -0-477 0.264 0-377 -0-044
0 -0-405 -0-905 -0-114 0-048 -0.293
0.231
-0-347

- 259 -
Appendix 4.
Fnem Units.

- 260 -
Appendix 4
Energy UnitB
The basic unit of energy used in this thesis has been the joule (J).
In order to aid comparisong the values of other energy units are given
below in joules.
1 kWh - 3.6 mi
I Btu . 1055 J
.1 the= - 105-5 MJ I calorie - 4-185 J
Also, with regard to units for U-valuest
1 Btu/ft 2b0F-5.678 W/M2 oC.

- 261 -
References

- 262 -
References
1. Department of Energyq 'Digest of W Energy Statistics. ' BMSO.
Published annually.
2. Building Research Establishment Energy Conservation Working Partyf
'Current Paper 56/75- Energy Conservationt a Study of Energy
Consumption in Buildings and Possible Means of Saving Energy in
Housing'. BRE, Watfordq June 1975-
3- PF Chapmang G Leach and M Slesserl 'Energy Budgets 2. The
Energy Cost of Fuels'. Energy Policy, Vol 21 No 39 SOP 1974p
pp 231 - 243.
J Cardinerv 'The Economics of Thermal Insulation in Housing'.
First National Symposium on Structural Insulationg held in London,
23-24 March 1971: SYmPosium Papersp Structural Insulation Asso-
ciationp Paper
Becherp 'Econ=ic Thermal Insulation'. Clima 2000t 6th Inter-
national Congress of Climatistics bold in Milang 2-6 Itarch 1975
by the Representatives of European Heating and Ventilating
Associations: Paperst. PEOp Milany 19759 Vol ly PP 03-1-0 to
03.22. o.
CC Handisyde and DJ Melitiish, 'Thermal Insulation of Buildings'.
2nd Editionp Dept pf the Enviromentp HUSO, 1971*
AH Fidler and J Fairbeadp 'Thermal Insulation of New Buildings.
C. omparative Cost Tables'. Property Services Agencyp Reading.
Ist Edition, 1975.2nd Editionp 1976,

- 263 -
AH Fidler and J Jacobf 'Thermal Insulation of New Buildings.
Early Cost Comparisons'. Property Services Agencyp Readingg
1976.
AH Fidler and J Jacobj 'Thermal Insulation of New Buildings.
Shell Perfoxmance Comparisons'. Property Services Agency,
Readingp 1976.
10. NS Billingtono KJ Colthorpe and DN Shortery 'Heating and
Ventilating Research Association Laboratory Report No 26.
Intermittent Heating'. HVRAq Bracknellp 1964.
11. AG Loudon, 'Current Paper 47/68. Summertime Temperatures
In Buildings without Air Conditioning'. Building Research Stationo
watford, 1968.
12. AC Hardyp 'Low Energy Housing'. Thermal Performance and Energy
Use in Housing: Proceedings of the Symposium bold in Dublin, April 5-6,1977 An Foras Forbarthay Dublin,
March 19789 pp 1ý1-146.
13- JP Cornish (BRE, East Kilbride)p 'The Effect of The=al Insula-
tion on Energy Consumption in Houses'. Energy Conservation in
the Built Environment: Proceedings of the 1976 Symposium of the
International Council for Building Research Studies and
Documentation (CIB) hold at BEE2 Watford. Ed: R0 Courtney.
Construction Pressp Laneasterl 1976v PP 458-468.
14. GA Pickup and AJ MileGy 'The Perfo=ance of Domestic Wet
Heating Systems in Contemporary and Future Housing'. Gas
Engineering and Managementy Vol 18p No 69 June 1978P pp 188-204-

- 264 -
15. Environmental Engineering Sectionp Electricity Councilp IECR/
R1304t Heating in Well Insulated Houses of Lightweight
Construction at Kemnayp Aberdeenshire by Direct Electric Heaters
during 1977-1978- Electricity Council, Londong Deo 1979-
16. RC Sondereggerp 'Movers and Stayers: the Resident's Contribution
to Variation across Houses in Energy Consumption for Space
Heating'. Energy and Buildingev Vol 19 1977/8p pp 313-324.
17- JC 17estong 'Heating Research in Occupied Houses'. Journal of
the Institution of Heating and Ventilating Engineersy Vol 19,
No 189, May 19511 pp 47-108.
18. G, A Pickup and AJ Miles, 'Energy Conservation Field Studies in
Domestic Heating'. Communication 1086, the Institution of Gas
Engineers, 1979-
19. J Field and B Hedges, 'National Fuel and Heating Survey'. Report
prepared for National Consumer Council. Social and Community
Planning Research, Londong March 1977.
20. PJ Minoguep 'Occupancy Patterns and Energy Use in Housing'.
Thermal Performance and Energy Use in Housingt Proceedings of the
Symposium held in Dublin, April 5-6,1977. An Foras Forbartbal
Dublinp March 1978, PP 51-83-
21. EWG Dancep JA Harris and DR Wills, 'Recent Field and Laboratory
Investigations into Domestic Warm Air Heating'. Institution of
Gas Engineers Journaly Vol 59 Feb 1965P PP 130-170-
22. ER Hitching Heating Divisionp British Gas Corporation Research
and Developmentp Watson House, London. Personal communications

- 265 -
23. FW Sinden, 'Windt Temperature and Natural Ventilation - Theoretical Considerations'. Energy and Buildingsp Vol It 1977/89
pp, 275-280.
24- N Malikp 'Field Studies of Lependence of Air Infiltration on
Outside Temperature and Wind'. Energy and Buildingal Vol 1,
1977/89 pp 281-292.
25- JB Dick and DA Thomasy 'Ventilation Research in Occupied Houseel.
Journal of the Institution of Heating and Ventilating Engineersý
Vol 19y No 7P Oct 19519 pp 306-326.
26. G Brown and, P Stellonp 'After Profligacy - 4. The Material
Account'. Built Enviromentg Vol 39 No. 8p Aug 1974Y PP 415-
417-
27- Department of Trade and Industryp 'Report on the Census of
Production, 19681. HUSO, 1971-1973-
28. PF Chapmanq 'Energy Budgets 4. The Energy Costs of Materials'.
Energy Policyp Vol 39 No- 19 Mar 1975P PP 47-57.
29. DJ Wrightq 'The Natural Resource Requirements of Commodities'.
Dept of the Environmentg 3-974-
30. DJ Wright, 'Energy Budgets 3- Goods and Servicess an Input-
Output Analysis'. Energy Policyp Vol 29 No 41 Boo 1974t PP 307-
315-
31- Central Statistical Officep IInput-Output Tables for the Mt
19681. HMSOP 1973.
32. US Department of Commerce, 'Input-Output Structure of US
Economy: 1963'. 3 Volst US Govt Printing Officep 1969.

- 266 -
33. PF Chapmanq 'The Energy Costs of Producing Copper and Aluminium
from Primary Sources'. Open University Energy Research Group
]Report No ERG 0019 Aug 1973 (rev. Dec 1973)-
34. PF Cbapmanq 'The Energy Costs of Producing Copper and Aluminiun
from Secondary Sourcest. Open University Energy Researcb Group
Report No ERG 0029 Oct 1973-
35. D Barnes and L Ranking 'The Energy Economics of Building
Construction'. Build Intermationalp Vol 8p No lp Jan-Febp 19759
PP 31-42.
36. EM Gartner and UA Snithp 'Energy Costs of House Construction'.
Energy Policyp Vol 4. No. 29 June 1976, PP 144-157-
37. BA Haseltine, 'Comparison of Energy Requirements for Building
Materials and Structures'. Structural Engineerp Vol 53P No 9p
Sep 1975, pp 357-365.
38. AB Makhijani and AJ Lichtenbergp 'Energy and Well-Being'.
Environment, Vol 149 No- 59 June 19729 pp 10-18.
39'. DA Casperg PF Chapman and ND Mortimer, 'Energy Analysis of
the "Report on the Census of Productiong 19681". Open
University Energy Research Group Report No ERG oo6v Aug 1974
(finalised Nov 1975)-
40. 'Annual Bulletin of Construction Statieticep 19681. HMSO.
41- Building Research Establishment/Cement Makers' Federation,
IBRE PD82/75- Materials and Energy Use in UK Portland Cement
Manufacture'. BREP Watfordo 1975-
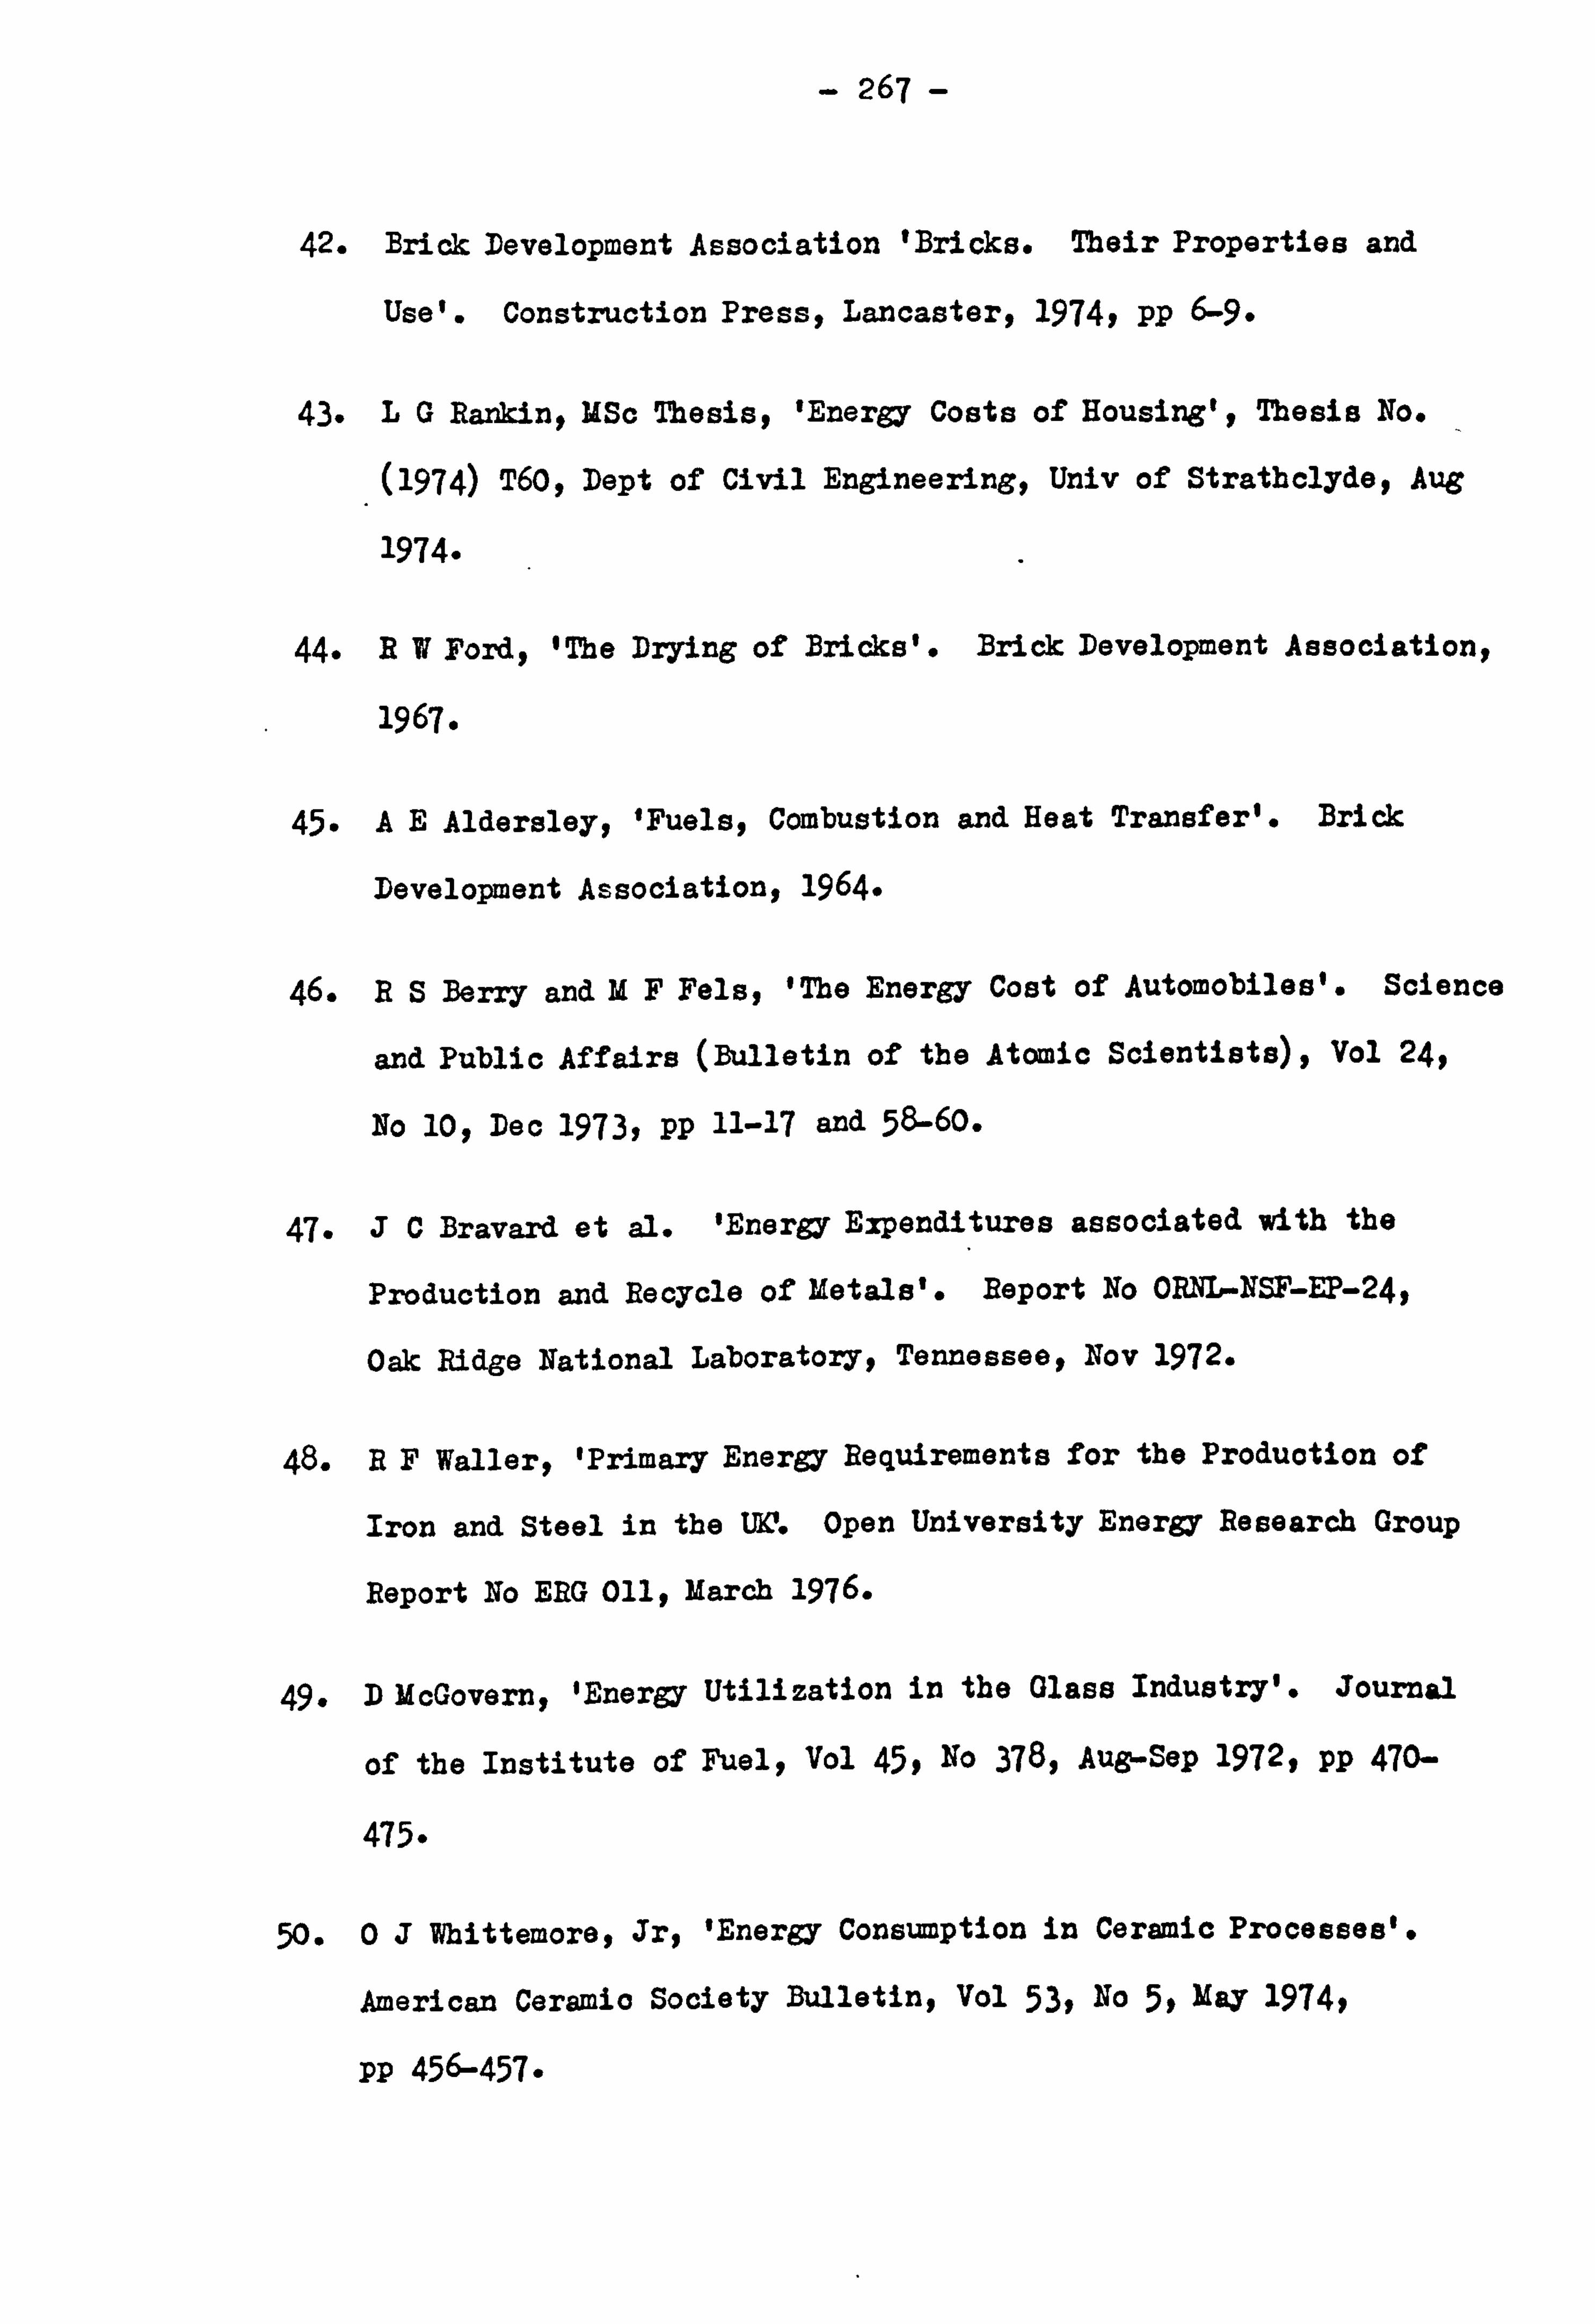
- 267 -
42. Brick Development Association 'Bricks. Their Properties and
Use'. Construction Fressv Lancaster, 19749 PP 6-9-
43. LG Rankint MSc Thesisq 'Energy Costs of Housing' 9 Thesis No. _
(1974) T609 Dept of Civil Engineeringp Univ of Strathelydeq Aug
3.974.
44- RW Ford, 'The Drying of Bricks'. Brick Development Association,
1967.
45. AE Aldersleyp 'Fuelsp C=bustion and Heat Transfer'. Brick
Development Association$ 1964-
46. RS Berry and MF Fels, 'The Energy Cost of Automobiles'. Science
and Public Affairs (Bulletin of the Atomic Scientists), Vol 24,
No 109 Dec 1973Y PP 11-17 and 58-60.
47. J0 Bravard et al. IEnerg7 Expenditures associated with the
Production and Recycle of Metals'. Report No ORNL-NSF-EP-24,
Oak Ridge National Laboratoryp Tennesseep Nov 1972.
48. RF Wallert 'Primary Energy Requirements for the Produotion of
Iron and Steel in the UV- Open University Energy Research Group
Report No ERG 0119 March 1976.
49. D McGovern, 'Energy Utilization in the Glass Industry'. Journal
of the Institute of Fuelp Vol 459 No 378, Aug-Sep 19729 PP 470-
475.
50.0 J Whittemoreq Jrq 'Energy Consumption in Ceramic Processes'.
American Ceramic Society Bulleting Vol 53P No 5p May 1974p
pp 456-457.

- 268 -
51. G Perry and Pj 3)oylef 'Energy Audit Series. No 5p Glass Industry.
Dept of Energy and Dept of Industryp June 1979-
52. BD Culleng 'Materials Usage in New Buildings'. Building Research
Station Current Paper, Design series No 58v 1967-
53. J Lemessany and-E E Amos. Building Research EstablishmOnto Watfords
internal communication.
54- City of Bradford Metropolitan Council Architects' Department Energy
Efficient Lesign letion Groupp II)esign for Energy Conservation' o
1976.
55- Central Statistical Officep fEconomic Trends' . HMSO- Publisbed
monthly.
56. Department of Energyj 'Fuel Efficiency Booklet 7. Degree Days'.
HUSO, 1979.
57- Department of Energy. Energy Management, July 19789
Meteorological Officep #met 0 883. Averages of Temperature for
ýhe Unitod Kinýomq 1941-70'- EIISOP 1976.
59. CitY of Bradford Metropolitan Council, Meteorological Obser-
vations Taken and Recorded at Lister Park, Bradford'. 1977-78.
6 60. Institution of Heating and Ventilating Engineersp IJHVE Guidep
1970'. IHVEI London, 1971.
61- Davisv Belfield and Everest (Editors), I Spon' a Architects' and
Builders' Price Book'. E and FN SPon Ltd. t Londone Published
annually.

- 269 -
62. 'Current Prices'. Building, usually the first issue of each
month.
63. Building Cost Info=ation Service of the Royal Institution of
Chartered Surveyorsp 'Cost File'. Buildingg Vol 234Y No 7031P
7 April 19789 PP 103-115p and later issues.
64- 'All-in Labour Rates'. Buildingg usually the first issue of each
month.
65. Building Research Stationg 'Digest 145- Heat Losses through
Ground Floors'. JIMSOP SeP 1972*
66. HH Maceyp 'Heat Loss through a Solid Floor'. Journal of the
Institute of Fuel, Vol 229 No 128p Oct 1949P PP 369-371.
67. NS Billingtong 'Heat Loss through Solid Ground Floors'. Journal
of the Institution of Heating and Ventilating Engineersp Vol 19,
No 195t Nov 19519 pp 351-372.
68. RME Diamant, 'Insulation Deskbookl. Heating and Ventilating
Publicationsp Croydong 1977-
69. Social and Community Planning Researchq 'Technical Manual Serisel
1. Postal Survey Methods 3- Interviewer's Guidebooko 5- Question-
naire Design'. SCPRp Londont 1972.
70. HW Smithp 'Strategies of Social Research. The Methodological
imagination'. Prentice-Hallp Englewood Cliffs, New Jerseyj 19755,
isBN o-13-851147-0, p 182.
7.1. RA Dessont ICP 37/76. Energy Conservation: the Intermittent
Occupation of Dwellings and Domestio Energy Consunption'. Building
Research Establishmentf Watfordt May 1976.

- 270 -
72. K Schuesslerp 'Analyzing Social Data. A Statistical Orientation'.
Houghton Mifflin, Boston, 19719 ISBN 0-395-05384-6.
73. Department of the Environmentp 'Building (Second Amendment)
Regulationsp 1974'- Statutorv Instr=enty EMS09 1974-
74. GW Brundrettv 'Ventilation: a Behavioural Approach'. Energy
Conservation in the Built Envirornents Proceedings of the 1976
Symposium of the International Council for Building Research
Studies and Documentation (CIB) held at BRE9 Watford. Eds
RG Courtney. Construction Preasp Lancasterp 19769 pp 272-281.
75. R Beard and A Dinniev 'Thermal Transmittance of Wall Constructions'.
in 'Bricks. Their Properties and Use'. Brick Development
Association, Construction Pressp Lancasterv 1974P PP 131-145-
76. 'The "Building" House Cost Index'. Buildingg Vol 228v No 6864,
3 Jan 1975, pp 41-42.
77. A Mackillopy 'Low Energy Housing'. The Ecologistv Vol 2p No 12,
Dec 19729 pp 4,10.
78. NS Billingtong 'The=al Insulation and Tbe=al Capacity of
Buildings'. Building Services Engineerv Vol 439 No- 119 Feb 1976p pp 226-233-
79- N0 Milbank and J Harrington Lynnp 'The=al Response and the
Admittance Procedure'. Building Services Engineer, Vol 429
No 2, MaY 1974, pp 38-54.
80. GW Bruhdretty SJ Leachl MJ Paxkinsons 0A Pickupq and NT Reeal
'Reseach into Energy Conservation in Dwellings', Gas Engineering
and Management., Vol 179 Doc 1977v PP 430-441-

- 271 -
81- J3 Siviourf 'ECRC/N840. Solar Heating in Unoccupied Houses'.
Electricity Council Research Centrep Capenhurstp Aug 1975-