university of groningen a complete cleavage map of
TRANSCRIPT

University of Groningen
A Complete Cleavage Map of Neurospora crassa mtDNA Obtained with Endonucleases EcoRI and Bam HITerpstra, P.; Holtrop, M.
Published in:Biochimica et Biophysica Acta %28BBA%29 - Nucleic Acids and Protein Synthesis
DOI:10.1016/0005-2787(77)90318-5
IMPORTANT NOTE: You are advised to consult the publisher's version (publisher's PDF) if you wish to cite fromit. Please check the document version below.
Document VersionPublisher's PDF, also known as Version of record
Publication date:1977
Link to publication in University of Groningen/UMCG research database
Citation for published version (APA):Terpstra, P., & Holtrop, M. (1977). A Complete Cleavage Map of Neurospora crassa mtDNA Obtained withEndonucleases Eco RI and Bam HI. Biochimica et Biophysica Acta %28BBA%29 - Nucleic Acids andProtein Synthesis, 475(4). https://doi.org/10.1016/0005-2787(77)90318-5
CopyrightOther than for strictly personal use, it is not permitted to download or to forward/distribute the text or part of it without the consent of theauthor(s) and/or copyright holder(s), unless the work is under an open content license (like Creative Commons).
The publication may also be distributed here under the terms of Article 25fa of the Dutch Copyright Act, indicated by the “Taverne” license.More information can be found on the University of Groningen website: https://www.rug.nl/library/open-access/self-archiving-pure/taverne-amendment.
Take-down policyIf you believe that this document breaches copyright please contact us providing details, and we will remove access to the work immediatelyand investigate your claim.
Downloaded from the University of Groningen/UMCG research database (Pure): http://www.rug.nl/research/portal. For technical reasons thenumber of authors shown on this cover page is limited to 10 maximum.

571
Biochimica et Biophysica Acta, 475 (1977) 571--588 © Elsevier /North-Hol land Biomedical Press
BBA 98920
A COMPLETE CLEAVAGE MAP OF NEUROSPORA CRASSA mtDNA OBTAINED WITH ENDONUCLEASE8 Eco RI AND Barn HI
P. TERPSTRA, M. HOLTROP and A.M. KROON
Laboratory of Physiological Chemistry, State University of Groningen, Bloemsingel 10, Groningen (The Netherlands)
(Received November 17th, 1976)
Summary
A physical map of Neurospora crassa mitochondrial DNA has been con- structed using specific fragments obtained with restriction endonucleases. The DNA has 5 cleavage sites for endonuclease Bam HI, 12 for endonuclease Eco RI and more than 30 for endonuclease Hind III. The sequence of the Eco RI and Barn HI fragments has been established by analysis of partial fragments. By digestion of the Eco RI fragments with Barn HI, a complete overlapping map has been constructed. The position of the largest Hind III fragment on this map has also been determined. The map is circular and the added molecular weight of the fragments is 40 • 106, which is in good agreement with earlier measure- ments on intact DNA, using the electron microscope.
Introduct ion
The mitochondria of Neurospora crassa contain 19--20 #m duplex circular DNA [1--3]. On this DNA there is one gene for each of the mitochondrial rRNAs [4--6] and a number of tRNA genes [7]. The exact number of tRNA genes remains to be established, but is probably not much higher than 30 (H. de Vries and A. Shtal, personal communication). Further, it has been demonstrated that the mitochondrial r ibosomes take part in the synthesis of some mitochondrial inner membrane proteins: 3 from the 7 subunits of cyto- chrome oxidase [8], 2 of the 9 subunits of the ATPase complex [9] and one of the 7 subunits of the cytochrome bcl complex [10]. Although it is very likely that the genes for these proteins are located on the mtDNA, direct
Abbreviat ions: E co RI, res tr ic t ion e n d o n u c l e a s e f r o m Escherichia coli RYI3; Barn HI, res tr ic t ion e n d o n u c l e a s e from Bacillus amyloliquefaciens H; Hind III, restriction endonuclease from Haemo- philus influenzae Rd; Hae III, res tr ic t ion e n d o n u c l e a s e f r o m Haeraophilus aegyptius, mtDNA, mitochondrial DNA; rRNA, ribosomal RNA; tRNA, transfer RNA.

572
evidence is still lacking in N. crassa. The total coding capacity required for the products mentioned above only amounts to about one quarter of the N. crassa mitochondrial genome. As there is no indication for a large amount of spacer sequences in N. crassa mtDNA [6], this could mean that there are still many genes of which the function remains to be elucidated (for a review of the genetic function of organelle DNAs, see refs. 11 and 12). A physical map of the mtDNA would be useful to get a better insight in the organization of the structural RNA genes, to localize and confirm the existence of the genes for the already known mitochondrial translation products and to unravel the proposed regulatory function of mtDNA genes in the interaction with nuclear genes [13].
To construct a physical map of the mtDNA, we have made use of three restriction enzymes Bam HI, Eco RI and Hind III, which cleave the DNA in 5, 12 and more than 30 fragments, respectively. By analysis of partial fragments and digestions of isolated fragments with different endonucleases, we have constructed a complete overlapping map of all the Eco RI and Bam HI fragments, with a fragment-length range from 425 to 33 800 basepairs. Also we have determined the position of the largest Hind III fragment (14 500 base- pairs) on this map as a starting point for finer analysis. While this work was in progress Bernard and Kiintzel have published [14,15] a physical map of N. crassa mtDNA on which seven Eco RI fragments and the large Hind III frag- ment were ordered. The crucial part of their map was established by electron microscopy and denaturation mapping [3,14]. Our results confirm and com- plete the sequence. In addition we have extended the physical map with all the Barn HI fragments and obtained independent proof that the map must be circular. Some of our results have been summarized elsewhere [16].
Materials
Neurospora crassa strains. Wildtype strain E 5256, mating type A (ATCC no. 10815) and wildtype strain E 5297, mating type a (ATCC no. 10816), were obtained from the Centraal Bureau voor Schimmelcultures, Baarn, The Nether- lands, where they are registered as C.B.S. 327.54 and C.B.S. 195.57, respec- tively.
Enzymes . Endonucleases Eco RI and Hind III were obtained from Miles Laboratories Inc. Endonuclease Bam HI and for some experiments also endo- nucleases Eco RI and Hind III, were obtained from New England Biolabs. Proteinase K was obtained from Merck.
Marker DNAs . Phage k DNA was a gift from Mrs. F. Fase-Fowler (Labora- tory of Biochemistry, section for Medical Enzymology, University of Amster- dam, The Netherlands). Hind II + III restriction fragments of Saccharomyces carlsbergensis mtDNA [17] were kindly donated by Dr. J.P.M. Sanders (Labo- ratory of Biochemistry, section for Medical Enzymology, University of Amster- dam, The Netherlands). Hae III restriction fragments of M13 DNA [18] were a gift from Dr. C.A. van den Hondel (Department of Molecular Biology, Univer- sity of Nijmegen, The Netherlands).
Chemicals. Ethidium bromide was obtained from Serva, agarose from
573
SeaKem, N,N'-methylenebisacrylamide from Fluka, acrylamide from Merck and sodium N-lauroylsarkosinate from Koch-Light.
Methods
Isolation of mitochondria and extraction of mtDNA. Mitochondria were prepared as described previously [6]. The isolation of mtDNA from the mito- chondria followed method A described in ref. 6, which includes: lysing DNAase treated mitochondria with N-lauroylsarkosinate, extraction with phenol and chloroform, RNAase A treatment, concentration and sucrose gradient centri- fugation. From the sucrose gradient a fraction with a molecular weight higher than 107 was selected, dialyzed against 1 M NaC1, 10 mM Tris. HC1, 0.2 mM EDTA pH 7.4, and concentrated by pelleting in a SW41 rotor at 41.000 rev./ min for 16 h at 0 ° C. The pellet was dissolved in 10 mM Tris. HC1, 0.2 mM EDTA, pH 7.4, at a concentration h~gher than 150 pg/ml.
¢29 DNA preparation. Phage ~b29 and Bacillus subtilus 1G20 trp C2 were gifts from Dr. J. Buitenwerf (Department of Genetics, University of Groningen, Haren, The Netherlands). ¢29 phage and ~29 phage DNA were isolated accord- ing to Streeck et al. [19] including a proteinase K treatment: 50 #g/ml in 0.5% N-lauroylsarkosinate, 10 mM Tris • HC1, 10 mM NaC1, 0.5 mM EDTA, pH 7.4, for 3 h at 37°C.
'Restriction enzyme incubations. For analytical sixteen slot slabgels the standard incubation mixture usually contained 3 #g of mtDNA in a total volume of 30/21 with enough enzyme to obtain a complete digestion in 2 h at 37°C. For preparative gels with one slot an amount of 100 #g of mtDNA was usually employed. The incubation mixture for Eco RI and Hind III consisted of 10 mM Tris • HC1, 10 mM MgCl2, 150 mM NaC1, 5 mM 2-mercaptoethanol, pH 7.6. For Bam HI: 6 mM Tris • HC1, 6 mM MgCI2, 50 mM NaC1, 6 mM 2- mercaptoethanol, 10 pg/ml relatin, pH 7.6. Double digestions with Barn HI and Eco R1 were carried out first with Bam HI alone in the Barn HI incubation buffer for 2 h at 37°C, whereafter NaC1 MgC12 and Eco RI were added to the concentrat ion required for the Eco RI incubation. The incubation was continued for 2 h at 37 ° C. Reactions were terminated by adding ~ volume of a buffer con- taining 0.1 M EDTA, 70% sucrose, pH 7.4. Bromophenol blue was added (0.025%) to some mixtures as a mobili ty marker.
Slabgel electrophoresis. A gel system similar to the one described by De Wachter and Fiefs [20] was used. The electrophoresis buffer contained 40 mM Tris, 20 mM sodium acetate and 2 mM EDTA, pH 7.8. Composite slabgels (300 × 200 × 4 mm) were constructed as ' fol lows: the bo t tom of an empty gelchamber was placed in a small trough containing 10% acrylamide, 0.25% N,N'-methylene bisacrylamide in electrophoresis buffer to obtain a sealing layer of 10 mm. After polymerization, a layer of approx. 60 mm 3% acryl- amide, 0.15% N,N'-methylene bisacrylamide in electrophoresis buffer was poured in the sealed chamber. After polymerization of this layer, 0.7% agarose, dissolved by autoclaving in electrophoresis buffer, was poured on top at 60 ° C. For analytical gels a perpex slotformer with sixteen 5 mm slots was used, for preparative gels one slotformer of 140 mm. Gels were run at room temperature at a constant voltage of 120 V for 15 h. After electrophoresis gels were stained

574
with 2 #g/ml ethidium bromide in electrophoresis buffer for 1 h. Photography of slabgels. The gel was placed on a long wave ultraviolet lamp
(U.V. Products Inc.) and photographed through a Kodak Wratten No. 23A filter with a Nikon F Camera and Kodak Panatomic X film. Suitable negatives were scanned with the Gilford 2400 spectrophotometer equipped with a linear transport mechanism.
Isolation of restriction fragments from slabgels. Appropriate bands were cut out from the agarose gel and the DNA was purified by the KI equilibrium cen- trifugation method of Blin et al. [21]. The DNA bands from the gradient tubes were extracted by sidewise puncture, extracted times with isoamylalcohol to remove the thidium bromide, diluted three-fold, made 0.1 M in sodium acetate (pH 5) and precipitated with 2 vol. of ethanol. After one night at --20°C, the precipitate was spun down in a SW41 rotor at 40 000 rev./min for 30 min at 0°C. The ethanol precipitate was dissolved in 10 mM Tris. HC1 0.2 mM EDTA, pH 7.4, and reprecipitated with ethanol. The second ethanol precipitate was dried in a vacuum dessiccator and dissolved in 10 mM Tris. HC1, 0.2 mM EDTA, pH 7.4, and used for incubations with restriction endo- nucleases. DNA from polyacrylamide gels was extracted and purified as described by Van den Hondel et al. [18].
Nomenclature of restriction fragments. Bands obtained from a complete digest with endonucleases Eco RI, Bam HI and Hind III are indicated with E, B and H, respectively, and bands from partial digests are indicated with Ep, Bp and Hp, respectively. EB and EH bands are the products of double digestions with endonucleases Eco RI plus Bam HI and Eco RI plus Hind III, respectively. Bands are numbered in order of increasing mobility. If one band contains two fragments, this is notated with a, b following the number of the band: e.g. E7a.
Results
Digestion of Neurospora crassa mtDNA with endonucleases Barn HI, Eco RI and Hind III
Construction of a restriction fragment map would preferably require an intact DNA as starting material. This, however, is not possible for Neurospora crassa mtDNA because preparative isolation gives only broken linear fragments [6,22], although 19 pm circular DNA can be observed with the electron microscope in osmotically shocked mitochondria [1]. For restriction enzyme analysis we have used fragments larger than 107 daltons taken from a sucrose gradient [6]. The DNA in this fraction contains all the sequences of total mtDNA, because the restriction fragment pattern is identical to the pattern obtained with total mtDNA, only the yield of high molecular weight restriction fragments is lower in total mtDNA. In Fig. 1 the results are shown of agarose gel electrophoresis of the digestion products obtained with endonucleases Bam HI (Fig. 1A), Eco RI (Fig. 1B) and Hind III (Fig. 1C). Scannings of the photographs of the gels are also presented in Fig. 1 to judge the molar propor- t ion of the bands present. Prolonged incubation with the endonucleases and adding more enzyme to the incubation mixture did not al ter the pattern of bands that can be observed in Fig. 1. From this we conclude that the bands in Fig. 1 represent the end products of digestion. The consequence of fragmented

575
o j (J e-
u I/I
o
B5
,.t ] .~
\ J
E2E3 E7
E/.
] 1 | ~! ' ' '
B
Ell
H7 H6
W'~"i'lt iHU ": H9 HI5 IIII I h.. ,,, :HI6
HI, HI8
i; . . . . . . . . . . . . . . . . } JJJ2+ • J~ " •
I I t I
0 10 20 migrotion (cm)
Fig. 1. Aga rose gel e l e c t r o p h o r e s i s o f r e s t r i c t i o n f r a g m e n t s f r o m Neurospora crassa m t D N A . F o r e a c h d iges t a p h o t o g r a p h o f t he gel is p r e s e n t e d t o g e t h e r w i t h a t r a c i n g o f th i s p h o t o g r a p h . The b a n d s are n u m b e r e d in r e l a t i o n w i t h i nc r ea s ing e l e c t r o p h o r e t i c m o b i l i t y (cf . Tab le I). 3 #g o f m t D N A w a s i n c u b a t e d w i t h e a c h o f t he e n d o n u c l e a s e a n d e l e c t r o p h o r e s e d in a n a l y t i c a l 0 . 7 % aga rose gel as d e s c r i b e d in M e t h o d s . A, c o m p l e t e d iges t w i t h e n d o n u c l e a s e B a m HI; B, c o m p l e t e d iges t w i t h e n d o n u c l e a s e E c o RI ; C, c o m - p l e t e d iges t w i t h e n d o n u c l e a s e H i n d III.
DNA as starting material is clearly illustrated in Fig. 1A: complete digestion with endonuclease Barn HI gives five fragments. Because fragment B1 is longer than half a molecule (see Table I) it can only be observed as a faint sharp band, marking the upper size limit of a long tail of fragments that have only one or no cleavage site for Bam HI. Complete digestion with endonuclease Eco RI gives eleven bands (Fig. 1B). For the same reason as mentioned above, the moiar amount of the large fragments E1 and E2 is lower than that of the

5 7 6
T A B L E I
L E N G T H OF T H E R E S T R I C T I O N F R A G M E N T S OF N E U R O S P O R A C R A S S A m t D N A O B T A I N E D W I T H E N D O N U C L E A S E S Ba m HI, Eco RI A N D Hind III
Molecular w e i g h t values were o b t a i n e d f r o m the ca l ibrat ion curve in Fig. 2 and reca lcu la ted in basepalrs on the basis o f the s o d i u m salt ¢~f DNA. Hind III fragment~ smal ler than H1 9 are n o t inc luded in this l ist (see t ex t ) .
M r × 106 Basepairs M r × 106 Basepairs
Eco RI f r a g m e n t s
E1 12 .5 18 700 E2 6.8 10 .200 E3 5.8 8 700 E4 3.0 4 500 E5 2.3 3 500 E6 1.9 2 900 E7a 1.8 2 750 E7b 1.8 2 750 E8 1.5 2 250 E9 1 .35 2 000 E l 0 1 .25 1 875 E l l 0.3 425
40.3 60 550
Barn HI f ragment s
B1 22.5 33 800 B2 10.3 15 450 B3 3.1 4 650 B4 2.8 4 200 B5 0.6 900
39.3 59 000
Hind III f ra g ment s
H1 9.7 14 500 H2 2.6 3 9 0 0 H3 2.3 3 500 H4 2.0 3 0 5 0 H5 1.9 2 9 0 0 H6 1.8 2 .750 H7a 1 .65 2 470 HTb 1;65 2 470 H8 1.58 2 370 H9 1.35 2 020 H 1 0 a 1.20 1 800 H 1 0 b 1 .20 1 800 H l l a 1 .07 1 600 H l l b 1.07 1 6 0 0 H12 0.87 1 300 H13 0 .83 I 250 H14 0.73 1 100 H15 0.66 9 8 0 H 1 6 a 0 .63 950 H16b 0 .63 9 5 0 H17 0.56 840 H18 0 .43 640 H19 0 .28 420
36.7 55 160
smaller fragments. Because the fluorescence intensity of band E7 is higher than can be expected on the basis of its fragment size (see tracing in Fig. 1B), we conclude that band E7 consists o f two fragments with the same mobil ity in 0.7% agarose gels. This gives a total of twelve Eco RI terminal fragments. Com- plete digestion with endonuclease Hind III gives nineteen bands (Fig. 1C). There are, however, more than nineteen fragments, because some of the bands contain more than one fragment, as judged by their fluorescence intensity. From the scanning presented in Fig. 1C we conclude that band H7, H10, H l l and H16 contain at least two fragments each. In gels containing 10% acryl- amide, eight additional smaller bands could be detected visually, but these have not been calibrated in length. In this way we arrive at a total of at least 31 Hind III fragments (Table I). This is about two and a half times as many as the fragments obtained with Eco RI, although the hexanucleotide sequences recognized by Eco RI and Hind III are expected to occur with equal frequency in a D NA with a random sequence of basepairs (Table II), We have looked for additional fragments in the 3% and 10% polyacrylamide layers of preparative gels (see Methods) on which approximately 100 pg of Eco RI or Bam HI

577
T A B L E II
C O M P A R I S O N O F T H E N U M B E R O F R E S T R I C T I O N F R A G M E N T S E X P E C T E D A N D F O U N D
R e s t r i c t i o n S e q u e n c e Ref . No. o f f r a g m e n t s e n d o n u c l e a s e r e c o g n i z e d
F o u n d E x p e c t e d *
E c o RI G ~ A A T T C 23 12 19 H i n d III A ~ A G C T T 24 > 3 1 ** 19 Barn HI G ~ G A T C C 3 3 5 8
• C a l c u l a t e d f r o m a r a n d o m s e q u e n c e o f 6 0 5 5 0 b a s e p a l r s w i t h a G • C p e r c e n t a g e o f 4 0 % [ 3 , 6 ] . • * 31 f r a g m e n t s is a m i n i m u m e s t i m a t e (see t ex t ) .
digested DNA was loaded. As we have not observed smaller fragments than E l l and B5 in such gels, we have assumed that there are not more than 5 and 12 recognition sites on the mtDNA for Bam HI and Eco RI, respectively.
Calibration of fragment lengths The restriction fragments larger than 106 daltons were calibrated in 0.7%
agarose gels with intact phage X DNA and its Eco RI restriction fragments [25] and intact phage ~b29 DNA and its Eco RI restriction fragments [19] (Fig. 2A).
50
A B-~2
~, 10 o
I
5 10 15 migration (cm)
o x
0.5
0 2
Fig. 2. C a l i b r a t i o n o f r e s t r i c t i o n f r a g m e n t l eng ths . A. C a l i b r a t i o n f o r 0 .7% aga rose gels. Mob i l i t y o f t h e b a n d s re la t ive to t h e o r ig in o f t h e gel was m e a s u r e d in n e i g h b o u r i n g lanes , c o n t a i n i n g s t a n d a r d l e n g t h f r a g m e n t s a n d u n k n o w n f r a g m e n t s r e spec t i ve ly , o, i n t a c t ;k D N A a n d i t s E c o RI f r a g m e n t s , × 1 0 6 : 3 0 . 8 , 1 5 . 3 , 13 ;7 , 4 .7 , 3 .7 , 3 .5 , 3 .0 a n d 2 . 1 5 [ 2 5 ] ; o i n t a c t ~ 2 9 D N A a n d i ts E c o RI f r a g m e n t s : 1 1 . 0 , 6 .5 , 3 .5 a n d 1 .2 [ 1 9 ] ; ×, m t D N A Barn HI f r a g m e n t s ; o, m t D N A E c o RI f r a g m e n t s . B. C a l i b r a t i o n f o r 3% p o l y - a e r y l a m i d e gels. o, ~b29 E c o R I f r a g m e n t s . X 1 0 6 , 1 .2 , 0 . 5 6 a n d 0 . 4 [ 1 9 ] ; e , M 1 3 Hae III f r a g m e n t s : 1 . 0 8 , 0 . 5 5 a n d 0 . 2 1 [ 1 8 ] ; ~, f r a g m e n t BS; o, f r a g m e n t E l l . H i n d III f r a g m e n t s o f Neurospora crassa m t D N A have b e e n c a l i b r a t e d aga in s t t he de r ived l e n g t h s o f Eeo RI f r a g m e n t s f r o m m t D N A a n d the l e n g t h s o f ~ 2 9 Eco R I f r a g m e n t s .

578
As expected [26] large fragments r un relatively fast in 0.7% agarose. This tendency persists in our gel system in a less pronounced way down to a fragment length of 3 . 7 . 1 0 6 daltons. Fragments smaller than 0 . 5 . 1 0 6 are sometimes difficult to .de tec t in agarose gels. Therefore we have calibrated the smaller fragments in 3% acrylamide gels using the three smallest Eco RI frag- ments of ¢29 DNA and Hae III fragments B, C and D of M13 DNA [18] as markers (Fig. 2B). The length of the restriction fragments calibrated in this way are presented in Table I. There are minor differences with the values presented earlier [16], where the lengths were calibrated with ~29 Eco RI fragments only. A further check on these lengths comes from redigestion of isolated terminal and partial fragments (see below), which gives consistent results within a margin of 5%.
The size o f Neurospora crassa mtDNA The sum of the lengths of the restriction fragments should be equal to the
size of intact mtDNA, which corresponds to its kinetic complexi ty if there is no major gene repetition. The sum obtained with Eco RI fragments (Table I) gives an average of 60 550 -+ 1300 (S.D.) basepairs, obtained with four different incubations on four different gels. This corresponds to a contour length of 19.5 -+ 0.4 #m (27), which is in excellent agreement with the 19 pm previoUsly measured in our laboratory with the electron microscope [1] and with the other length measurements of 20 pm [2,3]. The sum of 59 000 basepairs ob- tained with Barn HI fragments (Table I) is also in good agreement. The uncer- tainty in the calibration of the very large fragment B1, however, is about 10%, due to the poor resolution of bands in that region of the agarose gel. The sum of the Hind III fragments (Table I) is somewhat lower than the other two: 55 160 basepairs. This may be due to two reasons: firstly, we have not included fragments smaller than 400 basepairs in this sum, and in the second place, it is difficult to establish clearly the multiplicity of bands from a scanning of a photograph of a gel, especially in the lower molecular weight range (Fig. 1C), which may have led to an underestimation of the number of double bands.
Partial digestion with endonuclease Eco RI Eighteen partial bands were reproducibly observed on digestion with a
limiting amount of endonuclease Eco RI (Fig. 3). The length distribution of these partials is not favourable for ordering the fragments by calculation of the possible composi t ion of the partial fragments. Even in the more favourable case of Saccharomyces carlsbergensis mtDNA [17] such a procedure may lead to errors [28]. We have therefore isolated on preparative scale some of the partial fragments and redigested these with Eco RI to observe their composi t ion (Table III). Seven partials allowed straightforward conclusions: the observed fragments added up to their partial length within 5%. Three partial fragments gave variable results on separate redigestions with Eco RI. Partial E p l 0 on redigestion gave E4, E7 and E6. As the sum of these three fragments is too large for E p l 0 and is already assigned to Ep7b, we decided that E p l 0 consisted of two different partial fragments with approximately the same mobili ty and that these two had the composi t ion E4 + E7 and E4 + E6. Partial Ep7 on one occasion gave only E4, E6 and E7 on redigestion. On another redigestion Ep7

5 7 9
o
"6
12
/ 1 0 5 I0 15
migration (cm)
Fig. 3. Part ial Eco RI digest of Neurospora crassa m t D N A . Elec t roPhores is was d o n e in a 0 .7% agarose gel. A scan of a p h o t o g r a p h o f this gel is p resen ted . The Eco RI f r a g m e n t s are n o t n u m b e r e d and are ind ica ted wi th the b l ack peaks . T h e y c o r r e s p o n d to f r a g m e n t s E l - - E 1 0 in Fig. lB . F r a g m e n t E l l has r u n of f the gel. Part ial f r a g m e n t s are n u m b e r e d in the same o rde r as t h e y a p p e a r in Table I I I , w i t h o u t the pre f ix Ep.
gave rise to E3 and E l0 with strong.fluorescence, E4, E6 and E7 with low fluorescence and E5 with very weak fluorescence. From this result we con- cluded that Ep7 is a double band and contains two partial fragments con-
T A B L E I I I
L E N G T H A N D C O M P O S I T I O N OF T H E P A R T I A L F R A G M E N T S O B T A I N E D W I T H E N D O N U C L E - ASE Eco RI (Fig. 3)
Eco RI f r a g m e n t sequence 1 - - -6 - -4 - -7 - -11 - -9 - -8 - -7 - -5 - -3 - -10 - -2
Partial Observed Calcula ted Dif fe rence C o m p o s i t i o n of par t ia l f r a g m e n t s f r a g m e n t length length (%) No. (basepairs) (basepairs)
Ep6a 12 500 12 200 - -2 .4 EpSb * 12 500 12 075 - -3 .4 Ep7a * 10 700 10 575 - -1 .2 Ep7b 10 700 10 150 - -5 .1 6 - -4 - -7 Ep8 ** 8 450 8 500 0.6 8--7--5
Ep9 ** 7 800 7 825 0.3 4--7--11
Epl0a * 7 500 7 400 --1.3 6--4
E p l 0 b * 7 500 7 250 - -3 .3 4--7 E p l l ** 7 000 7 000 0 9 - -8 - -7 Ep12 6 000 6 250 4.2 7- -5 E p l 3 ** 5 000 5 175 3.5 7 - -11- -9 E p l 4 4 800 5 0 0 0 4.2 8--7 E p l 5 ** 4 600 4 6 7 5 1.6 11 - -9 - -8 EpI6 4 I00 4 250 3.7 9--8 Epl7 3 050 3 175 4.1 7--11
Ep18 2 550 2 425 --4.9 11--9
5--3 10--2
3--10
* The c o m p o s i t i o n of these part ials is based on isolat ion and red iges t ion wi th Eco RI and on calcula- t i on (see text ) .
** T he c o m p o s i t i o n of these par t ia ls is based on ly on ca lcu la t ion (see tex t ) . All o t h e r par t ia ls y ie lded a f t e r i sola t ion and red iges t ion wi th Eco RI on ly the f r ag men t s p r e sen t ed in this table. The observed length of the part ials was based on in te rpo la t ion , using the Eco RI f r a g m e n t lengths as in te rna l ca l ibra t ion points .
580
sisting of E3 + E l 0 (Ep7a) and E4 + E6 + E7 (Ep7b), with a contamination of a third partial: representing E5 + E3, which is the composit ion of E6a. On close inspection of the gels, it was noted that partial Ep6 consists of two closely spaced bands, which cannot be isolated separately. On one redigestion it gave only E5 + E3 (assigned to Ep6a), but in another redigestion of Ep6 with Eco RI, seven fragments were produced: E2, E3, E5 and E l 0 with strong fluor- escence and E4, E6 and E7 with weak fluorescence. If we ascribe E4 + E6 + E7 to contamination with Ep7b and assign E3 + E5 to Ep6a, then it follows that Ep6b may represent E2 + El0 . The composit ion of five other partials has been derived solely on the basis of calculation (Table III), taking into account the order of fragments already established with the partial fragments described above. Partial fragments Ep8 and Ep9 give information on the polarity of the sequence E11-E9-E8 in between the two fragments E7. Additional indirect evidence for the polari ty of E l l -E9-E8 comes from the consideration that all the observed partials can be explained with the proposed sequence in Table III, whereas, if one reverses the polarity of El l -E9-E8, it is not possible to find a reasonably accurate composi t ion for partial Ep9. Isolation of partial fragment Ep l to Ep5 was not successful. It makes no sense to calculate probable com- positions for these partials in view of the many, equally satisfactory, solutions within 5% accuracy.
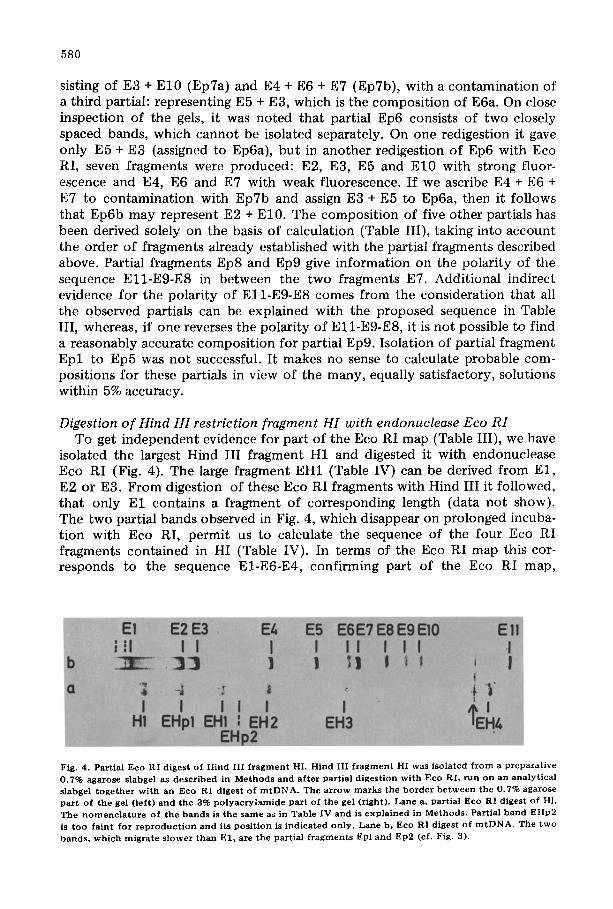
Digestion of Hind III restriction fragment HI with endonuclease Eco RI To get independent evidence for part of the Eco RI map (Table III), we have
isolated the largest Hind III fragment H I and digested it with endonuclease Eco RI (Fig. 4). The large fragment EH1 (Table IV) can be derived from El , E2 or E3. From digestion of these Eco RI fragments with Hind III it followed, that only E1 contains a fragment of corresponding length (data not show). The two partial bands observed in Fig. 4, which disappear on prolonged incuba- tion with Eco RI, permit us to calculate the sequence of the four Eco RI fragments contained in HI (Table IV). In terms of the Eco RI map this cor- responds to the sequence E1-E6-E4, confirming part of the Eco RI map,
Fig. 4. Par t ia l Eco RI diges t o f H i n d I I I f r a g m e n t HI. H ind I I I f r a g m e n t HI was i so la ted f r o m a p r e p a r a t i v e 0 .7% agarose s labgel as d e s c r i b e d in M e t h o d s a n d a f ter part ial d i g e s t i o n w i t h Eco R L run o n an ana ly t i ca l s labgel t o g e t h e r w i t h an Eco RI d iges t of m t D N A . The arrow marks the b o r d e r b e t w e e n the 0.7% agarose part o f the ge l ( l e f t ) and the 3% p o l y a c r y l a m i d e part o f the ge l (r ight) . Lane a, par t ia l Eco RI diges t o f HL T h e n o m e n c l a t u r e o f the b a n d s is t h e s a m e a~ in Table I V and is e x p l a i n e d in M e t h o d s . Partial b a n d E H p 2 is t o o fa int for r e p r o d u c t i o n and i ts p o s i t i o n is i n d i c a t e d o n l y . Lane b , E c o RI d iges t o f r n t D N A . T h e t w o
b a n d s , w h i c h migra te s l o w e r t h a n E l , are the partial f r a g m e n t s Epl and Ep2 (cf. Fig. 3).

581
T A B L E IV
D I G E S T I O N O F H I N D I I I F R A G M E N T H1 W I T H E N D O N U C L E A S E Eco RI (Fig . 4)
F r a g m e n t s e q u e n c e E H 1 - - E H 3 - - E H 2 - - E H 4
F r a g m e n t Obse rved l eng th Obse rved l eng th Calcu la ted C o m p o s i t i o n No. f inal pa r t i a l l eng th par t ia l o f pa r t i a l f r a g m e n t s
f r a g m e n t s f r a g m e n t s f r a g m e n t s (basepa i r s ) (basepal rs ) Coasepalrs)
E H p l - - 9 750 9 350 E H 1 - - E H 3 EH1 6 4 5 0 - - - - ' E H 2 - - E H 4
E H p 2 - - 5 250 5 300
EH2 = E4 4 500 - - - -
EH3 = E6 2 900 - - - - E H 4 [800 - - - -
To t a l l eng th 14 6 5 0
E x p e c t e d l e n g t h 14 500
based on partial analysis and providing the overlap of HI with the Eco RI map.
Partial digestion with Barn HI Digestion of the m t D N A with limited amounts of endonuclease Barn HI
gives a simple pattern: three partial fragments can be observed in Fig. 5. The composit ion of Bp2 and Bp3 can be accurately determined by calculation (Table V) in view of the very limited possibilities, but the composit ion of Bpl is ambiguous: it may be the sum of B2 + B3 + B5 or of B2 + B4 + B5. In the first case we arrive at map A in Table V, in the second case at map B in Table V. The latter would require a partial fragment with a length of 8850 basepairs (B3 + B4), which we have never observed. However this is not conclusive and
u
1[ 2
0 10 20 migration {crn)
Fig. 5. Par t ia l B a m HI d iges t o f N e u r o s p o r a crassa m t D N A . E l e c t r o p h o r e s i s was d o n e in a c o m p o s i t e s labgel : t he a r r o w m a r k s the b o r d e r b e t w e e n the 0 .7% agarose p a r t ( l e f t ) a n d the 3% p o l y a c r y l a m i d e pa r t ( r igh t ) o f t he gel. A scan o f a p h o t o g r a p h o f th i s gel is p r e se n t e d . The base l ine of the 3% p o l y a c r y l a m i d e gel scan is ac tua l ly a t a l o w e r level due to the g r ea t e r t r a n s p a r e n c y of such gels as c o m p a r e d to agarose
gels. The Barn HI f r a g m e n t s are n o t n u m b e r e d and are i n d i c a t e d w i t h the b l a c k peaks . T h e y c o r r e s p o n d to f r a g m e n t s B1- -B5 in Fig. 1A, Par t ia l f r a g m e n t s are n u m b e r e d in the s a m e o rde r as t h e y a p p e a r in Table V, w i t h o u t the p r e f i x Bp.

582
T A B L E V
L E N G T H A N D C O M P O S I T I O N O F T H E P A R T I A L F R A G M E N T S O B T A I N E D WITH E N D O N U C L E - A S E Barn HI (Fig . 5)
Possible s e q u e n c e s d e d u c e d (A) 1 - - 4 - - 5 - - 2 - - 3 f r o m pa r t i a l ana lys i s * (B) 3 - - 4 - - 5 - - 2 - - 1
Par t i a l O b s e r v e d C a l c u l a t e d C o m p o s i t i o n o f pa r t i a l f r a g m e n t s f r a g m e n t l e n g t h l e n g t h No. (basepa l r s ) (basepa i r s )
B p l 21 8 0 0 (A) 21 0 0 0 5 - - 2 - - 3 (B) 2 0 5 5 0 4 - - 5 - - 2
B p 2 16 5 0 0 16 3 5 0 5 - -2 Bp3 5 0 5 0 5 1 0 0 4 - - 5
• See t e x t .
to decide which of the two sequences is the correct one, additional data were collected (see below).
Digestion of the Eco RI fragments with endonuclease Bam HI To decide which of the t w o possible Bam HI maps in Table V is correct and
to align that map with the Eco RI map in Table III, we have isolated all the Eco RI fragments, except E l l and digested these with endonuclease Bam HI. From these redigestions it could be concluded that E2, E3, E4, E8, E9 and E l 0 contain no cleavage site for Barn HI (Table VI). The five Bam HI recogni- tion sites are located on the Eco RI fragments E l , E5, E6 and E7 (Fig. 6 and Table VI) in the following way: E1 is cleaved once, giving rise to fragment EB1 and EB4 (Fig. 6, lane d) of which EB4 has the same mobili ty as E4. E5 yield EB5 (Fig. 6, lane i), which is only 200 basepairs shorter than E5 itself (Table VI) implying the existence of a small fragments EN14, which is too short to be observed in our gel system. The digestion pattern of E6 and E7 is rather complicated: E6 is shortened by 150 basepairs resulting in EB6, with the same mobil i ty as E7 (Fig. 6, lane g) and EB15 which is too short to be observed. One of the two fragments in band E7 is not cleaved by Bam HI, but the other contains two cleavage sites, giving rise to the three small fragments EB10, EB11 and EB12 (Fig. 6, lane e and Table VI), of which E B l l has the same mobil i ty as B5. The two corresponding partial fragments EBI0 + E B l l and E B l l + EB12 have been detected in another gel (data not whown). It could be argued that due to contamination of E7 with E6, the three small fragments EB10m E B l l and EB12 originate from E6 and that both E7a and E7b are not cleaved by Bam HI. Electrophoresis of E6 and E7 on the same gel (Fig. 6, lanes h and f) however, shows that the cross contamination is negligible. By comparing the double digestion products obtained with Eco RI plus Bam HI with an Eco RI digest alone )Fig. 6, lanes a and c), we conclude that E l l is not cleaved by Bam HI. As expected from the digestion of Eco RI fragments with Bam HI, bands EB4 and EB6 are double and contain two fragments each (Fig. 6, l ane a). This is confirmed by and optical scan of lane a in Fig. 6 (data not shown).

TA
BL
E V
I
LE
NG
TH
O
F
TH
E
FR
AG
ME
NT
S
OB
TA
INE
D
AF
TE
R
INC
UB
AT
ION
O
F
ISO
LA
TE
D
Ec
o
RI
FR
AG
ME
NT
S
WIT
H E
ND
ON
UC
LE
AS
E
Bar
n H
I (F
ig.
6)
Bar
n H
I X
Eco
E
co
RI
fra
gm
en
ts d
ige
ste
d w
ith
Bar
n H
I
RI
fra
gm
en
t N
o.
(Fig
. 6
) E
1
E2
E
3
E4
E
5
E6
E
7
E8
E
9
El0
E
ll
EB
1
EB
2
EB
3
EB
4
EB
5
EB
6
EB
7
EB
B
EB
9
EB
10
EB
11
=
B5
E
B1
2
EB
13
E
B1
4
EB
15
14
50
0
4 500
10
20
0
8 7
00
To
tal
len
gth
(bas
epai
rs)
19
00
0
10
20
0
8 7
00
E
xp
ec
ted
le
ng
th
(bas
epai
rs)
18
70
0
10
20
0
8 7
00
4 5
00
3
30
0
20
0
*
2 7
50
2
75
0
15
0 *
97
5
90
0
76
5
2 2
50
2 0
00
1 875
4 5
00
3
50
0
2 9
00
5
39
0
2 2
50
2
00
0
1 8
75
4 5
00
3
50
0
2 9
00
5
50
0 *
*
2 2
50
2
00
0
1 8
75
42
5
42
5
42
5
* N
ot
ob
serv
ed
, b
ut
ca
lcu
late
d
(see
te
xt)
.
**
Th
e s
um
of
E7
a a
nd
E7
b.
C~
GO
O
~

584
b s c | + I
+,I+ f t g l
h !
j I
E~
2 |
:3
I J! t J l ES ~ E I I B ~
Fig. 6. Digest ion of Eco RI f r a g m e n t s w i th endonuc lease Barn HI. E lec t rophores i s was done in a com- pos i te slabgel: the a r r o w m a r k s the b o r d e r b e t w e e n the 0.7% agarose pa r t ( left) and the 3% polyacry l - arnide pa r t ( r ight) of the gel. The p o l y a c r y l a m i d e pa r t has b e e n exposed for a longer t ime to increase the visibi l i ty of the small f r agmen t s . Lane a, a c o m p l e t e doub le d iges t ion of r n t D N A wi th Eco RI and Barn HI (see Methods) . The bands are n u m b e r e d in the s ame o rde r as t hey a p p e a r in Table VI. Lane b, a c o m p l e t e digest o f r n t D N A wi th Barn HI. Lanes c and j, a c o m p l e t e digest of m t D N A wi th Eco RI. The bands are n u m b e r e d b e l o w lane j in the s ame o rde r as in Fig. lB . Lane d, f r a g m e n t E1 digested wi th Bam HI. Lane e, f r a g m e n t 57a + E7b diges ted wi th Barn HI. Lane f, f r a g m e n t E7a + E7b w i t h o u t rediges t ion. Lane g, f r a g m e n t E6 d iges ted wi th Barn HI. Lane h, f r a g m e n t E6 w i t h o u t rediges t ion. Lane i, f r a g m e n t E5
d iges ted wi th Barn HI.
Fig. 7. Res t r i c t ion f r a g m e n t m a p of N e u r o s p o r a crassa m t D N A . For the c o n s t r u c t i o n of this m a p , the Eco RI f r a g m e n t sequence of Table I I I was c o m b i n e d wi th the Barn HI f r a g m e n t sequence A in Table V and the Eco RI f r a g m e n t sequence of f ragrnen ~. HI in Table IV. Ou te r s egmen t , Hind I I I f r a g m e n t H1. Inner ring, Barn HI f r agmen t s . Middle ring. Eco RI f~.qRrnents are s epa ra t ed b y solid lines. The Barn HI and Hind
I [ [ cleavage are ind ica ted wi th b r o k e n lines.

585
T A B L E VII
D I G E S T I O N O F H I N D III F R A G M E N T H1 WITH E N D O N U C L E A S E Barn HI
F r a g m e n t s e q u e n c e : H B I - - H B 2 - - H B 3
F r a g m e n t O b s e r v e d l e n g t h O b s e r v e d l e n g t h C a l c u l a t e d Composit ion of p a r t i a l No. f ina l p a r t i a l l e n g t h p a r t i a l fragments
fragments fragments fragments (basepa i r s ) (basepa i r s ) (basepa i r s )
H B p l HB1 8 0 0 0 H B p 2 H B 2 = B3 4 6 5 0 H B 3 1 7 5 0
T o t a l l e n g t h 1 4 4 0 0 Expected l e n g t h 1 4 5 0 0
1 2 5 0 0 1 2 6 5 0 H B 1 - - H B 2
6 4 0 0 6 4 0 0 H B 2 - - H B 3
Construction o f the complete cleavage map Once the place of the Bam HI recognition sites on the Eco RI fragments is
known, it is immediately clear that a correct overlap of the Eco RI map in Table III with the two Bam HI maps in Table V is only possible with map A in ,Table V. To get a full circular overlap, we have made the sum of the Barn HI fragment lengths equal to the sum of the Eco RI fragments lengths (Table I) by adding 1550 basepairs to fragment B1. This falls within the 10% error of the length calibration of B1. A complete restriction fragment map of Neuro- spora crassa mtDNA is presented in Fig. 7. As predicted from this map, diges- tion of the isolated Hind III fragment H I with Barn HI yields three fragments: HB1, HB2 and HB3 of which HB2 is identical to B3 (Table VII).
Up till now we have assumed that the restriction fragment map would be circular in view of the electron microscopic observation of circular mtDNA molecules [1--3]. Without this assumption, however, we can now conclude from the overlap of the Eco RI map and the Barn HI map that the complete map must be circular: there are two Eco RI sites, one on B3 and one on B1, which are so close to Bam HI sites that they yield on double digestion two small unobserved fragments (EB14 and EB15 in Table VI). It is not possible to consider these two Eco RI sites as termini of a linear map, because these sites have been located within Eco RI partial fragments. (Ep6a in Table III and EHpl in Table IV).
Discussion
The most important reason for constructing a physical map of a DNA is to provide a basis for studying the arrangement of genes on the genome. The map presented in Fig. 7 has already proven its usefulness for the localization of the rRNA genes (for a preliminary account see ref. 7). Moreover independent evidence on the circularity of the mtDNA is obtained. From the fact that all fragments add up to the molecular weight expected from the length measure- ments of the DNA [1--3], it can be concluded that major sequence repetition and intermolecular heterogeneity is absent. Therefore, the sequence complexity

586
of N e u r o s p o r a crassa mtDNA corresponds to 4- 107 daltons. Direct measure- ments of the kinetic complexi ty of N. crassa mtDNA resulted in values about 50% higher [6,29]. This is probably an overestimation because the values obtained by renaturation measurements vary depending on the conditions used [30].
Concerning the construction of the map there remain a few points which need further discussion:
(1) The polarity of the sequence E8-E9-El l has only been established indirectly. Analysis of the Bam HI digestion products of Eco RI partial frag- ments E p l 7 and E p l 4 {Table III) will provide more direct evidence.
(2) The sequence E3-E10-E2 was inferred by combining data from rediges- tion of partial fragments and from calculation. More direct evidence would come from partial digestion of fragment B1 with Eco RI.
(3) We have observed that one of the two E7 fragments has nearly the same mobili ty as fragment E6 in 3% acrylamide gels. This could be caused by a relative high A . T content of this fragment, because it has been reported that DNA fragments with a high A" T content migrate slower in acrylamide gels than fragments of the same size and rich in G • C [31]. Isolation of the separated E7 fragments and digestion with Bam HI, revealed that the putative A • T-rich fragment contains the two G • C-rich Bam HI cleavage sites (cf. Table II). This identifies in an unequivocal way fragment E7a in the map presented in Fig. 7.
(4) Calibration of the restriction fragments of N. crassa mtDNA with phage and ¢29 DNA (Fig. 2) gave internally consistent results. However, when we per- formed a calibration against Hind II + III restriction fragments of S a c c h a r o m y - ces car l sbergens i s mtDNA [ 17], we obtained a set of length values significantly lower for all fragments smaller than E3, thus preventing the construct ion of any overlap between the Eco RI map and the Barn HI maps. This may be explained when we assume that DNA fragments with such a high A • T content as yeast mtDNA (82% [32] ) migrate slower than expected even in 0.7% agarose gels.
The restriction fragment map in Fig. 7 partly confirms and extends the incomplete physical map of N. crassa mtDNA presented by Bernard et al. [15], which is based partly on denaturation mapping [3,14] and partly on restriction enzyme analysis [ 14,15]. The differences that arise are the following:
(a) Bernard et al. [15] place fragment E9 in between E2 and E3. This may be due to the fact that in their case the composi t ion of the smaller Eco RI partials has been inferred only from calculation, which did not clearly resolve the sequence between E7a and E7b.
(b) Our Eco RI fragment pattern of N. crassa wild type strain 5256 mtDNA is identical to the Eco RI fragment pattern of wild type strain 7A mtDNA used by Bernard et al. [15]. Our derived calibration of the length of the Eco RI fragments gives a sum in agreement with the electron microscopic measure- ments from our laboratory [1]. This sum is 3.5 • 106 daltons lower than the electron microscopic measurement of Bernard et al. on Eco RI fragments [15,22]. There is, however, no significant 'difference in the relative length of the fragments.
(c) The mtDNA of the identically labelled w i l d t y p e strain 5256, used by Bernard et al. [15] gives a slightly different Eco RI restriction fragment
587
pattern: fragment E5 is significantly shorter and migrates between E7 and E8 [15]. It would be interesting to check whether this is caused by an internal deletion in E5, in which case B4 would also be shorter (Fig. 7) or by two point mutations, in which case the Eco RI recognition site separating E3 and E5 could have a location on B4. It will, however, be difficult to resolve whether these two strains 5256 are really of the same origin, in which case the differ- ence in the mtDNA could be explained by a recent mutation, or whether the two strains are of different wild-type origin and are mislabelled. Small differ- ences are not uncommon in the patterns of large restriction fragments obtained from mtDNAs of different wild-type origin and have been noted for example in yeast mtDNA [28].
We have compared the Eco RI restriction fragment pattern of N. crassa wild type strain 5297 with that of strain 5256. No differences in terminal and partial fragment lengths were found. But in the mitochondria of strain 5297 a populat ion of small circular DNA molecules, heterogeneous in length, has been detected by electron microscopy together with a few full-length 19 #m [1]. The restriction fragment pattern then would suggest that these small circles contain random sequences of a circular 19 pm DNA. In one preparative CsCl-ethidium bromide gradient of 5297 mtDNA we have isolated a small amount of closed circular DNA with a mitochondrial density. It is very likely that this fraction contained small circles, because we found it impossible to isolate 19 pm circular DNA in the same way from strain 5256 (unpublished results). Repeated at tempts to isolate more of this circular mtDNA from strain 5297 to examine directly its composit ion have, however, failed. Possibly the occurrence of the heterogeneous small circles in strain 5297 mitochondria is a transient phenomenon, influenced by, as yet, unknown factors. Without further information on this point, we conclude that the Eco RI restriction fragments of mtDNA from strain 5297 are derived from full-length 19 pm circles.
Acknowledgements
We are indebted to Dr. J.G.G. Schoenmakers (Department of Molecular Biology, University of Nijmegen, The Netherlands} who allowed us to perform some initial experiments in his laboratory, and to B. Tebbes for the photog- raphy of the gels. The technical assistance of Hennie Bakker during the final stage of the experimental work is also gratefully acknowledged. This work was supported in part by a grant from the Netherlands Foundat ion of Chemical Research (S.O.N.) with financial aid from the Netherlands Organization for the Advancement of Pure Research (Z.W.O.).
References
1 Agster lbbe,E. , Kroon, A.M. and Van Bruggen, E.F.J. (1972) Biochim. Biophys. Acta 269, 299--303 2 Clayton, D.A. and Brambl, R.M. (1972) Biochem. Biophys. Res. Commun. 46, 1477--1482 3 Bernard, U., Piihler, A., Mayer, F. and Kilntzel, H. (1975) Biochim. Biophys. Acta 402, 270--276 4 Sch~'fer, K.P. and Kilntzel, H. (1972) Biochem, Biophys. Res. Commun. 46, 1312--1319 5 Kuriyama, Y. and Luck, D.J.L. (1973) J. Mol Biol. 73, 425--437 6 Terpstra, P., Holtrop, M. and Kroon, A.M. (1977) Nucleic Acid Res. 4, 129--139

588
7 K r o o n , A.M., T e r p s t r a , P . , ' H o l t r o p , M., De Vries , H., V a n d e n Boge r t , C., De J o n g e , J . a n d Agste- r i b b e , E. ( 1 9 7 6 ) in The G e n e t i c s a n d Biogenes i s o f M i t o c h o n d r i a a n d C h l o r o p l a s t s (Bi icher , Th . , N e u p e r t , W., Seba ld , W. a n d Werne r , S., eds . ) , pp . 6 8 5 - - 6 9 6 , N o r t h - H o l l a n d Pub l i sh ing Co. , Ams te r - d a m
8 Seba ld , W., M a c h l e i d t , W. a n d O t t o , J . ( 1 9 7 3 ) Eur . J . B i o c h e m . 38 , 3 1 1 - - 3 2 4 9 J a c k l , G. a n d Seba ld , W. ( 1 9 7 5 ) Eur . J . B i o c h e m . 54 , 9 7 - - 1 0 6
1 0 Weiss, H. a n d Z i g a n k e , B. ( 1 9 7 4 ) in The Biogenes i s o f M i t o c h o n d r i a ( K r o o n , A.M. a n d S a c c o n e , C., eds.) , p p . 4 9 1 - - 5 0 0 , A c a d e m i c Press, N e w Y o r k
11 S a c c o n e , C. a n d K r o o n , A.M. ( 1 9 7 6 ) The G e n e t i c F u n c t i o n o f M i t o c h o n d r i a l D N A , N o r t h - H o l l a n d P u b l i s h i n g Co., A m s t e r d a m
1 2 B/ icher , Th. , N e u p e r t , W., Seba ld , W. a n d Werne r , S. ( 1 9 7 6 ) The G e n e t i c s a n d Biogenes is o f Mito- c h o n d r i a a n d C h l o r o p l a s t s , N o r t h - H o l l a n d P u b l i s h i n g Co. , A m s t e r d a m
13 B a r a t h , Z. a n d Ki in tze l , H. ( 1 9 7 2 ) Proc . Nat l . A c a d . Sci. U.S. 69 , 1 3 7 1 - - 1 3 7 4 1 4 B e r n a r d , U., P~ihler, A. a n d Ki in tze l , H. ( 1 9 7 5 ) F E B S Le t t . 60 , 1 1 9 - - 1 2 1 1 5 B e r n a r d , U. a n d K/ in tze l , H. ( 1 9 7 6 ) i n The G e n e t i c F u n c t i o n o f M i t o c h o n d r i a l D N A ( S a c c o n e , C. a n d
K r o o n , A.M., eds . ) , p p . 1 0 5 - - 1 0 9 , N o r t h - H o l l a n d P u b l i s h i n g Co. , A m s t e r d a m 16 T e r p s t r a , P., H o l t r o p , M. a n d K r o o n , A.M. ( 1 9 7 6 ) in The G e n e t i c F u n c t i o n o f M i t o c h o n d r i a l D N A
( S a c c o n e , C. a n d K r o o n , A.M., eds.) , p p . 1 1 1 - - 1 1 8 , N o r t h - H o l l a n d P u b l i s h i n g Co. , A m s t e r d a m 17 S a n d e r s , J .P .M. , Bors t , P. a n d Weijers, P.J . ( 1 9 7 6 ) Mol. Gen . Gene t . 1 4 3 , 5 3 - - 6 4 18 V a n d e n H o n d e l , C .A. a n d S c h o e n m a k e r s , J . G . G . ( 1 9 7 5 ) Eur . J . B i o e h e m . , 53, 5 4 7 - - 5 5 8 1 9 S t r e e c k , R .E . , Ph i l l ppsen , P. a n d Z a c h a u , H .G. ( 1 9 7 4 ) Eur . J. B i o c h e m . , 45 , 4 8 9 - - 4 9 9 2 0 De W a c h t e r , R. a n d Fiers , W. ( 1 9 7 1 ) in M e t h o d s in E n z y m o l o g y ( G r o s s m a n , L. a n d Moldave , K. , eds . )
Vol . 21 , pp . 1 6 7 - - 1 7 8 , A c a d e m i c Press, N e w Y o r k 21 Blin, N., V o n G a b a i n , A. a n d Bu ja rd , H. ( 1 9 7 5 ) F E B S Le t t . 53 , 8 4 - - 8 6 22 B e r n a r d , U., Bade , E. a n d Ki in tze l , H. ( 1 9 7 5 ) B i o c h e m . B i o p h y s . Res. C o m m u n . 64 , 7 8 3 - - 7 8 9 23 H e d g p e t h , J . , G o o d m a n , H.M. a n d Boye r , H.W. ( 1 9 7 2 ) P roc . Nat l . A c a d . Sci. U.S. 69 , 3 4 4 8 - - 3 4 5 2 2 4 Old , R. , M u r r a y , K. a n d Roizes , G. ( 1 9 7 5 ) J . Mol. Biol . 92 , 3 3 1 - - 3 3 9 2 5 T h o m a s , M. a n d Davis, R.W. ( 1 9 7 5 ) J . Mol. Biol . 91 , 3 1 5 - - 3 2 8 26 Hel l ing , R .B. , G o o d m a n , H.M. a n d B o y e r , H.W. ( 1 9 7 4 ) J . Vixol. 14, 1 2 3 5 - - 1 2 4 4 27 L a n g , D. ( 1 9 7 0 ) J. Mol. Biol. 54 , 5 5 7 - - 5 6 5 28 Sande r s , J .P .M. , H e y t i n g , C., Di F r a n c o , A., Bors t , P. a n d S lon imsk i , P.P. ( 1 9 7 6 ) in The G e n e t i c F u n c -
t i o n o f M i t o c h o n d r l a l D N A (Saccone , C. a n d K r o o n , A.M., cds . ) , pp . 2 5 9 - - 2 7 2 , N o r t h - H o l l a n d
P u b l i s h i n g Co. , A m s t e r d a m 29 W o o d , D.D. a n d L u c k , D . J .L . ( 1 9 6 9 ) J . MoL Biol. 41 , 2 1 1 - - 2 2 4 3 0 C h r i s t i a n s c n , C., Ch r i s t i an sen , G. a n d L e t h Bak , A. ( 1 9 7 4 ) J . Mol. Biol. 84 , 6 5 - - 8 2 31 Zeiger , R .S . , S a l o m o n , R. , D i n g m a n , C.W. a n d P e a c o c k , A.C. ( 1 9 7 2 ) N a t u r e N e w Biol. 238 , 6 5 - - 6 9 3 2 P rune l l , A. a n d Be rna rd i , G. ( 1 9 7 4 ) J . Mol. Biol . 86 , 8 2 5 - - 8 4 1 33 R o b e r t s , R . J . , Wilson, G .A . a n d Y o u n g , F .E . ( 1 9 7 7 ) N a t u r e 265 , 8 2 - - 8 4