university of groningen - kapteyn instituut | research at
TRANSCRIPT
University of Groningen
Kapteyn Astronomical Institute
&
KVI Atomic and Molecular Physics
MSc Project
Hydrogen Addition to Polycyclic AromaticHydrocarbons
The First Step to the Formation of H2 in Space
by
L.M.P.V. Boschman
Supervisors
Kapteyn
Dr. Stephanie Cazaux
Prof. Dr. Marco Spaans
KVI
Drs. Geert Reitsma
Dr. Thomas Schlatholter
Prof. Dr. Ir. Ronnie Hoekstra
Abstract
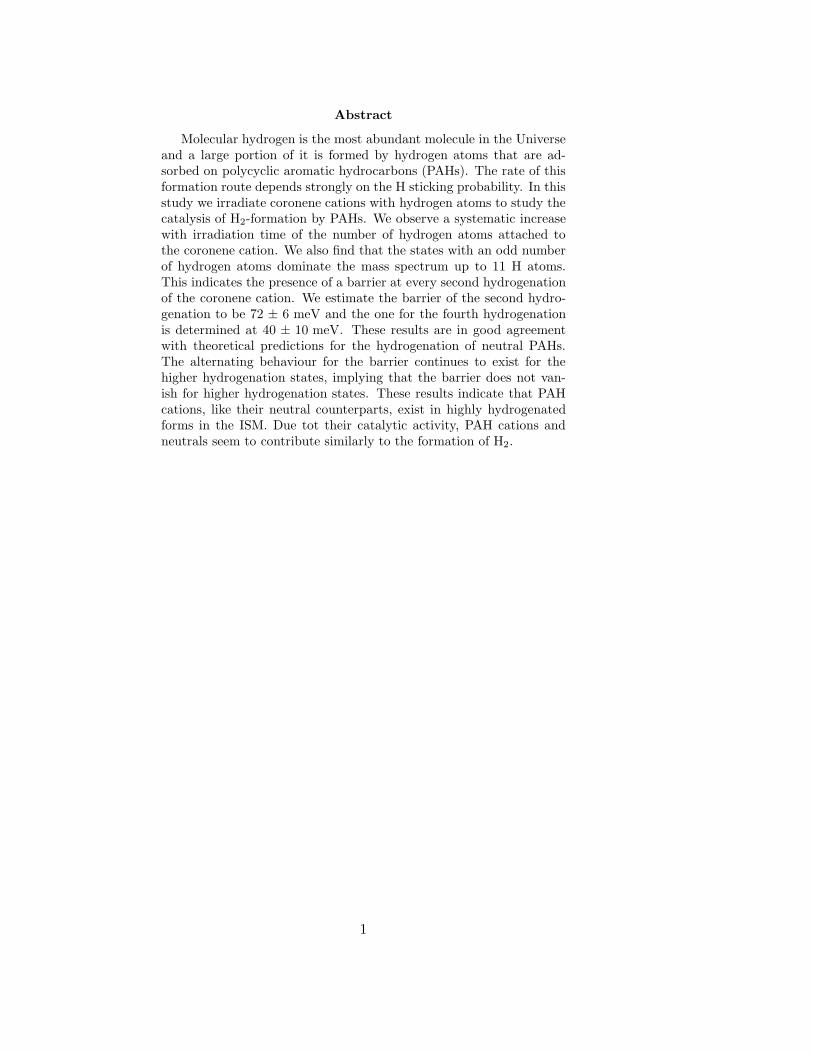
Molecular hydrogen is the most abundant molecule in the Universeand a large portion of it is formed by hydrogen atoms that are ad-sorbed on polycyclic aromatic hydrocarbons (PAHs). The rate of thisformation route depends strongly on the H sticking probability. In thisstudy we irradiate coronene cations with hydrogen atoms to study thecatalysis of H2-formation by PAHs. We observe a systematic increasewith irradiation time of the number of hydrogen atoms attached tothe coronene cation. We also find that the states with an odd numberof hydrogen atoms dominate the mass spectrum up to 11 H atoms.This indicates the presence of a barrier at every second hydrogenationof the coronene cation. We estimate the barrier of the second hydro-genation to be 72 ± 6 meV and the one for the fourth hydrogenationis determined at 40 ± 10 meV. These results are in good agreementwith theoretical predictions for the hydrogenation of neutral PAHs.The alternating behaviour for the barrier continues to exist for thehigher hydrogenation states, implying that the barrier does not van-ish for higher hydrogenation states. These results indicate that PAHcations, like their neutral counterparts, exist in highly hydrogenatedforms in the ISM. Due tot their catalytic activity, PAH cations andneutrals seem to contribute similarly to the formation of H2.
1

CONTENTS
1 Introduction 4
1.1 Star formation . . . . . . . . . . . . . . . . . . . . . . . . . . 4
1.2 The H2 problem . . . . . . . . . . . . . . . . . . . . . . . . . 5
1.3 Polycyclic aromatic hydrocarbons . . . . . . . . . . . . . . . . 6
1.4 Previous work . . . . . . . . . . . . . . . . . . . . . . . . . . . 8
1.5 This project . . . . . . . . . . . . . . . . . . . . . . . . . . . . 9
2 Theory 10
2.1 Hydrogen addition to coronene . . . . . . . . . . . . . . . . . 10
2.2 Kinetics of hydrogen addition . . . . . . . . . . . . . . . . . . 11
3 Experimental setup 15
3.1 Electrospray ionisation . . . . . . . . . . . . . . . . . . . . . . 15
3.2 Ion funnel . . . . . . . . . . . . . . . . . . . . . . . . . . . . . 16
3.3 Ion mass filter . . . . . . . . . . . . . . . . . . . . . . . . . . . 18
3.4 Paul ion trap . . . . . . . . . . . . . . . . . . . . . . . . . . . 21
3.5 Mass spectrometry . . . . . . . . . . . . . . . . . . . . . . . . 21
3.6 Atomic hydrogen source . . . . . . . . . . . . . . . . . . . . . 22
4 Experimental procedure 24
4.1 Sample preparation . . . . . . . . . . . . . . . . . . . . . . . . 24
4.2 Operational procedure . . . . . . . . . . . . . . . . . . . . . . 25
5 Results 27
5.1 Raw data . . . . . . . . . . . . . . . . . . . . . . . . . . . . . 27
5.2 Observed trends . . . . . . . . . . . . . . . . . . . . . . . . . 29
6 Data analysis 30
6.1 Line evolution . . . . . . . . . . . . . . . . . . . . . . . . . . . 30
2
6.2 Deriving energy barriers . . . . . . . . . . . . . . . . . . . . . 34
7 Discussion 37
7.1 Summary . . . . . . . . . . . . . . . . . . . . . . . . . . . . . 377.2 Comparison with previous work . . . . . . . . . . . . . . . . . 377.3 Consequences for H2 formation . . . . . . . . . . . . . . . . . 397.4 Outlook . . . . . . . . . . . . . . . . . . . . . . . . . . . . . . 39
8 Conclusion 41
9 Acknowledgements 42
A Mass spectra 47
B Paper 71
3
CHAPTER 1
Introduction
Until very recently, stars were thought to be eternal, unchanging sourcesof light. People considered stars to be deities or, like the Romans, thoughtthat they were pinholes in the veil that shielded us from the heaven wherethe gods lived. As human knowledge progressed, stars have been demotedfrom their divine status to that of giant balls of glowing gas. Initially peoplestill thought that stars had existed as long as time itself, but soon it becameclear that stars are born, change and die just like mortals.
Ever since mankind discovered the true nature of stars, these processeshave been subject of vigorous research and investigation, leading to manya theory about the birth, life and death of stars. To encompass all thesestages is beyond the scope of this project, so we will now focus on the phaserelevant for this thesis, the formation of stars.
1.1 Star formation
For a star to be born, a lot of gas has to be accumulated into a relativelysmall volume. This is possible when a gas cloud collapses after it has crossedthe Jeans stability limit, i.e. it is heavier than the Jeans mass correspondingto its temperature and density. As soon as that limit is reached, the cloudis no longer able to support its own weight with its internal pressure, andthe cloud collapses under its own weight. Before this collapse can happen,a molecular cloud has to form dense cores who can then turn into stars. Forthis process to happen, efficient cooling of the molecular cloud is necessary.The cooling agent present defines the efficiency of this cooling and thus ofthe star formation, as well as the characteristics of the stars formed (massand binarity).
Star formation happens primarily in molecular clouds, which are coldregions of the interstellar medium (ISM) with a temperature of T ≈ 20 K
4

CHAPTER 1. INTRODUCTION Leon Boschman
(Wolfire et al. 2003; Norman and Spaans 1997). With gas number densitiesof n ≈ 104 − 105 cm−3, these clouds are gravitationally bound and theypossess dense cores (106 cm−3) that lead to star formation.
The most dominant molecule in these molecular clouds is the hydrogenmolecule H2. Via several heating and cooling pathways this molecule has alarge influence on the thermal energy budget of the gas cloud, and thereforeon the process of star formation.
H2 can heat the gas through photodissociation by UV irradiation. An-other heating method is collisional de-excitation of an H2-molecule that isvibrationally excited upon formation or after radiative excitation (Tielens2005).
H2 has cooling properties as well, via collisional vibrational excitationand subsequent radiative de-excitation. The formation of the first starswas probably possible due to cooling by molecular hydrogen (Norman andSpaans 1997).
Furthermore, molecular hydrogen is important as cooling agent in shocks,low metallicity galaxies and other warm gas regions where other coolingagents are of little importance (Cazaux 2004).
Because of its abundance, it is also involved in a plethora of chemicalpathways, enhancing the complexity of the ISM chemistry. Reactions of H2
with other species, both neutral and ionized, can lead to the formation ofcooling agents, such as CO, OH and H2O (Meijerink and Spaans 2005).
1.2 The H2 problem
The most abundant molecule in molecular clouds is the hydrogen molecule,H2. The gas phase route to the formation of this molecule is an indirect one,because the direct formation out of two single hydrogen atoms is impossibledue to conservation of energy. One needs either a three-body collision oranother process to dissipate the excess energy. The most common processuses a surplus electron to get rid of the momentum. The dominant gas phaseH2-formation process is then summarized in equations (1.1) and (1.2).
H + e− → H− + hν, (1.1)
H− + H → H2 + e−. (1.2)
This formation route has a reaction rate that depends on the ionizationof the ISM (Tielens 2005) which is given by
R (H2) = 1.3 × 10⁻⁹n(
H−)
n (H) cm−3 s−1. (1.3)
Observations of molecular clouds have revealed that there is much moreH2 present than can be accounted for by gas-phase chemistry alone. Based
5

November 16, 2012 1.3. POLYCYCLIC AROMATIC HYDROCARBONS
on these observations, an actual H2-formation rate has been found that isseveral orders of magnitude larger than the gas-phase chemistry predictions(Tielens 2005). This H2 excess can be explained by a formation route whereinterstellar dust surfaces catalyze the necessary chemical reactions (Oortand van de Hulst 1946; Gould and Salpeter 1963).
Observations of diffuse clouds allowed to derive direct H2-formation rateson dust grains, which have become the canonical value used in astrophysicalmodels. This rate has a typical value of 1 − 3 × 10⁻¹⁷cm3 s−1 and can bewritten as
Rd(H2) =1
2n(H)vHngrainσǫH2
S(T ), (1.4)
where n(H), is the number densities of H atoms in the gas phase, vH is
the thermal velocities of H atoms calculated as√
8πkTmH
, ǫH2, is the for-
mation efficiency of H2. S(T ) is the sticking coefficient. The mean crosssection for collisions between grains and atoms, ngrainσ, is determined as
<ngrain(a)
nHπa2 > with ngrain(a) the grain density with radius between a and
a+∆a.The surface area available for chemistry (ngrainσ) is provided by dust and
polycyclic aromatic hydrocarbons (PAHs). These PAHs are large, graphiticcarbon molecules and make up 50 % of the available surface area (Weingart-ner and Draine 2001). The catalysis of H2-formation by PAHs is describedin equations (1.5) and (1.6).
[PAH] + H → [PAH + H], (1.5)
[PAH + H] + H → [PAH] + H2. (1.6)
1.3 Polycyclic aromatic hydrocarbons
For this project we study polycyclic aromatic hydrocarbons, which are largegraphite-like molecules of carbon atoms arranged in a hexagonal pattern.This gives the molecule a planar, honeycomb structure and due to the aro-matic carbon bonds, they are very stable molecules. These PAHs come invarious sizes, where the smallest is the two-ring system naphthalene. LargerPAHs also exhibit a certain irregularity in their overall shape, while theystill maintain their almost lattice-like atom configuration as shown in figure1.1. In this study we focus our attention to one particular PAH, coronene,since this molecule is widely commercially available.
Consisting of 24 carbon atoms, coronene is an intermediate between thetwo extreme sizes of PAHs. It is named after its crown-like structure of sixbenzene rings surrounding a seventh one and has a large degree of symmetry,as shown in figure 1.2.
6

CHAPTER 1. INTRODUCTION Leon Boschman
Figure 1.2: The coronene molecule (C24H12). Labels have been added to allcentral (1), edge (2) and outer edge (3) carbon atoms.
Figure 1.1: A large, irregularPAH.
Although it is a relatively small PAH, itis large enough to exhibit some of the chem-ical and physical features observed in thelarger PAHs. One of these features is thepresence of three chemically different car-bon atoms as shown in figure 1.2: the cen-tral (1), edge (2) and outer edge (3) carbonatoms. The outer edge atoms are those thathave formed a bond with a hydrogen atomand they are usually found at the perimeterof a PAH molecule. Edge carbon atoms areto be found on the perimeter as well, butthey do not have a bond with a hydrogen atom. Instead, they are neigh-bouring the outer edge carbon atoms. The central carbon atoms are found inthe central regions and only possess bonds with other central or edge carbonatoms. These three categories of carbon atoms differ significantly in theirchemical properties, such as the activation energy for hydrogen addition.
Coronene and H2 formation
For this project we study the role of coronene in the catalysis of H2 for-mation. The most important mechanism for the catalyzed formation of H2
happens in two steps via the so-called Eley-Rideal mechanism. First, ahydrogen atom from the gas phase bonds with a PAH molecule to form ahydrogenated PAH. A second hydrogen atom can then abstract this H atom
7

November 16, 2012 1.4. PREVIOUS WORK
from the PAH and form a hydrogen molecule.
The rate limiting step in this process is the first one, because it is themost difficult one. The barrier that the incoming hydrogen atom mustovercome is much higher than for the second step (Rauls and Hornekær2008). In this study we explore the first step of the catalysis experimentallyby studying the hydrogenation of coronene cations after irradiation withhydrogen atoms. We use coronene as a probe molecule for PAHs, because itis large enough to exhibit the dynamics that govern the behaviour of largePAHs, but it is still small enough to be easily handled.
1.4 Previous work
The interstellar relevance of PAHs is a field where theory and experimentgo hand in hand. Most of the studies performed focus on coronene forthe same reasons as stated above. For example, Rauls and Hornekær (2008)derive barriers for the addition of H atoms to neutral coronene using densityfunctional theory calculations. They find that the barrier depends stronglyon the location of the addition. Hydrogen addition to the outer edge carbonatoms has an energy barrier of 60 meV compared to approximately 200 meVfor addition to the other carbon atoms. Rauls and Hornekær (2008) alsofind that hydrogen addition to an outer edge carbon atom next to an alreadyhydrogenated outer edge carbon atom is barrierless. This is in accordancewith calculations done by Bauschlicher (1998), who found that for smallerPAHs hydrogenation takes place preferentially next to already hydrogenatedcarbon atoms.
Mennella et al. (2012) irradiate coronene films with D atoms and findproof for both addition and abstraction. They do this by measuring the in-tensity of the aromatic C-H band and the aliphatic C-H band after differentdoses of D irradiation. Thrower et al. (2012) thermally desorb a coronenefilm after exposure to a dose of D atoms. This evaporated film is analyzedwith a quadrupole mass spectrometer to measure the number of D atomsattached to each coronene molecule. With this method they find super-hydrogenated coronene molecules where even the central carbon atoms arehydrogenated, although this has a much larger energy barrier (Rauls andHornekær 2008).
Experiments with gas-phase PAHs (Snow et al. 1998; Betts et al. 2006)are predominantly performed with PAH cations. Snow et al. (1998) findthat small PAH cations react very efficiently with atomic hydrogen, oxygenand nitrogen. They conclude that cationic PAHs are therefore unlikely to beobserved in the ISM, but that one should look for protonated PAHs instead.Betts et al. (2006) perform similar measurements and include the coronenecation as well. Both studies are able to determine rate constants for the firsthydrogenation.
8

CHAPTER 1. INTRODUCTION Leon Boschman
1.5 This project
For this study we perform experiments at the Zernike-LEIF facility at theKVI Atomic and Molecular Physics group. We use the Paultje setup to bringcoronene cations in the gas phase and trap them in a Paul ion trap. Theions are then irradiated with a room temperature beam of atomic hydrogen.Subsequently performing mass spectrometry of the trap contents allows usto study the addition of hydrogen atoms to the coronene cations.
We present the detection of multiply hydrogenated coronene cations afterirradiation with room temperature H atoms. We find that every secondhydrogenation of the coronene cation has an associated barrier and that thisholds up to high hydrogenation states. Finally, we are able to determine theheight of these barriers at the second and the fourth hydrogenation andmeasure them to be 72 ± 6 meV and 40 ± 10 meV, respectively.
From the existence of these barriers we infer that the reaction rates forPAH-catalyzed H2 formation have a strong temperature dependence in theastrophysically relevant temperature regime.
9

CHAPTER 2
Theory
There is a lot of theory behind the experiments in this project. For example,there are the chemical reactions taking place and the mechanisms that drivethem. These mechanisms come with certain kinetics that govern the rate atwhich they are happening. There is also the theory behind the componentsof the experimental setup, which is described in chapter 3. This chaptertries to provide a theoretical background to the chemical reactions betweenhydrogen and coronene.
2.1 Hydrogen addition to coronene
When it comes to hydrogen addition to coronene, one can distinguish threedifferent locations for the hydrogen atom to stick, the central carbon atoms,edge carbon atoms and outer edge carbon atoms (Rauls and Hornekær 2008).They differ from each other in their respective reaction energies and barriers.
The addition of hydrogen to a central carbon atom is a reaction thathas an energy barrier. This energy barrier is due to the so-called puckeringof the carbon atom the hydrogen attaches to as it changes its electronichybridization from sp2 to sp3. This change of hybridization is necessary,because the three sp2 orbitals of the C atom are already involved in chem-ical bonds and an H atom cannot form a bond through overlap with theremaining p-orbital. As the hybridization changes, so does the spatial con-formation of the covalent bonds formed by the changing C atom. An sp2
hybridized C atom has its sp2 orbitals lying in one plane with the remainingp-orbital perpendicular to that plane, whereas an sp3 C atom has its foursp3 orbitals in a tetrahedral orientation. If the C atom is already covalentlybonded to three other C atoms in the coronene molecule, the change of hy-bridization causes the C atom to move out of the molecular plane. Becauseof this movement, the orbital overlap between this C atom and its direct
10

CHAPTER 2. THEORY Leon Boschman
neighbours decreases. This so-called conformational stress gives rise to anenergy barrier of 200 meV (Rauls and Hornekær 2008) that has to be over-come before the addition reaction can take place and therefore reduces therate at which the reaction is occurring.
The edge and central carbon atoms are all surrounded by three otherC atoms. In the case of the central atoms, the C atoms that surroundthem are in turn surrounded by three other C atoms, leading to even lessconformational freedom than in the case of the edge C atoms.
The outer edge carbon atoms are only bound to two other C atomsand the remaining hydrogen atom can move freely during the hybridizationtransformation from sp2 to sp3. This reduces the conformational stress sig-nificantly, making the outer edge carbon atoms the preferred hydrogenationsite.
Rauls and Hornekær (2008) calculate the height of the barriers associ-ated to hydrogenation of neutral coronene molecules and confirm that thefirst hydrogenation experiences the lowest barrier at an outer edge carbonatom. They also find that hydrogen addition to the outer edge carbon atomimmediately next to the first hydrogenation site does not have a barrier.Calculations by others support this preference for outer edge hydrogenationnext to hydrogenated outer edge carbon atoms (Bauschlicher 1998). It istherefore expected that every second outer edge hydrogenation of a neutralcoronene molecule is barrierless.
For practical reasons we are using radical cations instead of neutralmolecules, so these calculations are not entirely valid anymore. However,the second hydrogenation of the cation is electronically equivalent to thefirst hydrogenation of the neutral molecule. We therefore expect that everysecond hydrogenation of the cation has a barrier, while the odd-numberedhydrogenations can happen unobstructed, as depicted in figure 2.1. Thisimplies that the cations remain longer in odd hydrogenation states, since itis more difficult to hydrogenate further from one of those states.
2.2 Kinetics of hydrogen addition
To interpret our experimental results better, we use a kinetic chemicalmodel. In this model we incorporate both hydrogen addition and hydro-gen abstraction reactions, which can be described as
HnCor+ + H → Hn+Cor+ (2.1)
HnCor+ + H → Hn−Cor+ + H2 (2.2)
We start the model with the coronene cation as the only present molecule,which is then hydrogenated via a barrierless reaction with rate constantk1 = A1. Then we treat the site that is initially hydrogenated as chemically
11

November 16, 2012 2.2. KINETICS OF HYDROGEN ADDITION
Figure 2.1: A schematic drawing of the second and third hydrogenationsteps. The molecule on the left is the coronene cation with one hydrogenatom already attached. The first incoming H atom experiences a barrierto hydrogenate this molecule, while the second H atom can hydrogenatewithout a barrier.
inactive. The next hydrogenation takes place preferably at one of the outeredge sites adjacent to the already hydrogenated outer edge site.
This leaves four outer edge carbon atoms where the first step of furtherhydrogenation can take place with a rate similar to k1 but an additional en-ergy barrier of approximately Ea,2 = 60 meV (Rauls and Hornekær 2008).Using Arrhenius-like rate constants, this yields the rate constant k2 as de-scribed in equation (2.3), where AH denotes the hydrogenation cross sectionper carbon atom.
k2 = 4 AH e−Ea,2
kT (2.3)
A subsequent barrierless hydrogen addition reaction can take place, againwith a reaction rate constant k3 = AH. However, a barrierless hydrogenabstraction reaction is also possible with rate k2,abs = Aabs.
For the third hydrogenated state, hydrogen addition can take place atthe four remaining outer edge sites via a reaction with a barrier of Ea,4.Hydrogen abstraction is also possible, but now it has a barrier of Eabs,3 =30 meV (Rauls and Hornekær 2008), yielding the reaction rate constant:
k3,abs = Aabs e−Eabs,3
kT . (2.4)
These processes continue until all the low-barrier outer edge sites arehydrogenated, adding up to a total of 11 extra H atoms. In short, thedifferential equations governing the model can be described by equation (2.5)and the reaction rate coefficients are given by equations (2.6) and (2.7)
12

CHAPTER 2. THEORY Leon Boschman
∂
∂t
[
HnCor+]
= kn
[
Hn−Cor+]
nH − kn,abs
[
HnCor+]
nH
− kn+1
[
HnCor+]
nH + n kn+1,abs
[
Hn+Cor+]
nH, n = 1, 2, ...(2.5)
kn =
{
4 AH e−Ea,n
kT when n is even
AH when n is odd(2.6)
kn,abs =
{
Aabs e−Eabs,n
kT when n is even
Aabs when n is odd(2.7)
From the experiments performed by Mennella et al. (2012) we use therelative cross sections AH ≈ 20Aabs.
We use these equations to construct a numerical model for the hydro-genation of the coronene cation. The model yields the time evolution of thecontribution of all hydrogenation states given the hydrogen beam tempera-ture, the relative cross sections for addition and abstraction and the heightof the barriers present. A typical result is shown in figure 2.2.
13

November 16, 2012 2.2. KINETICS OF HYDROGEN ADDITION
Irradiation time (arb. units)10-2
10-1
100
Fractio
nal hydrogenatio
n state populatio
n # of H atoms01234567891011
Figure 2.2: Theoretical calculations of the hydrogenation of coronene cationswith increasing atomic hydrogen irradiation time. For this model we usethe relative addition and abstraction cross sections of Mennella et al. (2012)and we used a hydrogen temperature of 300 K and hydrogenation barriers(if applicable) of Ea = 60 meV.
14

CHAPTER 3
Experimental setup
The experiments are done in an experimental setup named Paultje, whichis shown schematically in figure 3. This experimental setup enables us totrap and study molecular ions in the gas phase. These molecular ions areproduced chemically in a solution, which is then electrosprayed to bringthem into the gas phase.
An ion funnel focusses these ions into a quadrupole ion guide/mass filterbefore they are electromagnetically trapped in a Paul trap. While beingtrapped, the ions are bombarded with a mixture of atomic and molecularhydrogen (H/H2), produced by a Slevin-type hydrogen source (Slevin andStirling 1981).
After the bombardment, an electric field is used to extract the ions fromthe trap towards a detector with a high time-resolution. If the distancebetween the trap and the detector is known, we can determine the massesand charges by time-of-flight mass spectrometry, allowing us to determinethe contents of the Paul trap.
3.1 Electrospray ionisation
Electrospray ionisation, hereafter abbreviated as ESI, is an effective meansof bringing large molecular ions into the gas phase. In 2002 J.B. Fennreceived the Nobel Prize in Chemistry for establishing ESI as a means ofidentification and analysis of large biomolecules (Gaskell 1997).
The basic operation principle is to pump the analyte solution through aneedle at a high potential into a grounded capillary. The strong electric fieldresulting from the potential difference permeates the solution and separatesthe charges in it. The Coulomb repulsion due to the charge accumulationat the needle tip leads to the formation of a Taylor cone. As soon as this
15

November 16, 2012 3.2. ION FUNNEL
Figure 3.1: A schematic drawing of the Paultje setup at the KVI in Gronin-gen.
electrostatic repulsion overcomes the surface tension of the solution, chargeddroplets are emitted towards the capillary.
During their flight the solvent evaporates from the droplets, decreasingthe droplet size while it retains its charge, hence increasing the surface chargedensity. When this charge density is high enough, the so-called Rayleighlimit is reached, meaning that the Coulomb repulsion can no longer be com-pensated by the surface tension of the droplet, causing a fission into smallerdroplets.
After this so-called Coulomb explosion, solvent evaporates again fromthe smaller droplets and the entire process repeats itself untill the dropletradius shrinks below 10 nm. At this point the ions evaporate from thedroplet directly into the gas phase, while being further accelerated by theelectric field.
3.2 Ion funnel
After electrospraying, the ions present themselves as a diffuse cloud in arelatively high-pressure environment. Since we eventually want to trap theions in the Paul trap, we need to focus the cloud into a beam that can beinjected into this trap. Also, the performance of the quadrupole mass filterincreases significantly when it is applied to a small beam instead of a diffusecloud.
For this purpose we use an ion funnel, consisting of stacked ring elec-trodes with decreasing inner diameter. We use an ion funnel instead of aquadrupole ion guide because the ion funnel is very effective at focussing a
16

CHAPTER 3. EXPERIMENTAL SETUP Leon Boschman
diffuse cloud into a narrow beam, whereas a quadrupole device works verywell at maintaining this narrow beam (Shaffer et al. 1997).
Two things are necessary for focussing this cloud: a force that drivesthe ions towards the beam axis and a mechanism to keep them there, i.e.to prevent oscillatory motion with large amplitudes. The former can beeasily accomplished with an electromagnetic field that has a correspondingeffective potential minimum at the beam axis. This field generally leadsto an oscillating trajectory, but at high enough pressures this motion iscollisionally damped via interactions with other gas-phase molecules, leadingto axial focussing.
In addition to being poor focussing devices for broad beams, quadrupolesare not designed to work at high pressures, contrary to ion funnels. Us-ing an ion funnel has the additional advantage that the device bridges thepressure difference between the electrospray chamber and the high-vacuumquadrupole. An ion funnel consists of a series of equally spaced, axiallyaligned ring electrodes with decreasing inner radius. A radio-frequency volt-age is applied to all rings, and adjacent rings have an equal potential ofopposite sign. To understand how this can confine the ion cloud, one canhave look at the detailed explanations in Guan and Marshall (1996) andKelly et al. (2010), a summary of which is provided here.
Let us first look at an ion funnel with ring electrodes of equal innerradius. First we apply a time-varying potential
Φ0 (t) = V0 cos ωt
to the ring electrodes, and make sure that the voltages of adjacent electrodeshave opposite signs. Setting the inner radius of the ring electrodes at r0 andthe distance between the rings at z0, we obtain the potential
Φ (r, z, t) = Φ0 (t)I0 (r/z0)
I0 (r0/z0)cos
(
z
zo
)
(3.1)
and the corresponding electric field
~E (r, z, t) = −~∇Φ (r, z, t)
=Φ0
z0
(
I1 (r/z0)
I0 (r0/z0)cos
(
z
zo
)
r +I0 (r/z0)
I0 (r0/z0)sin
(
z
zo
)
z
)
, (3.2)
where I0 and I1 denote the modified Bessel functions of the zeroth and firstorder, respectively. r and z indicate the unit vectors in the radial and theaxial direction. Separating equation (3.2) into a spatial and a temporal part,we obtain
~E (r, z, t) = ~E0 (r, z) cos ωt. (3.3)
As a result of the field in equation (3.3), the ion will perform a fastoscillatory motion superimposed on its drift motion. Under the condition
17

November 16, 2012 3.3. ION MASS FILTER
that this driven oscillation is fast compared to the drift motion, the ionexperiences the time-averaged rf-field as a static potential, the so-calledpseudo-potential (Silveira et al. 2010)
V ∗ (r, z) =q |E|24mω2
, (3.4)
which can be expanded into
V ∗ (r, z) =qΦ2
0
4mω2z20
1
I20 (r0/z0)
×[
I21
(
r
z0
)
cos2
(
z
z0
)
+ I20
(
r
z0
)
sin2
(
z
z0
)]
. (3.5)
This potential field clearly drives the ions towards the center of the funneland additional collisional cooling will confine the ions axially. The initialdesign with equal ring electrode inner diameter throughout the funnel wasimproved by letting the inner diameter decrease throughout the ion funnel(Shaffer et al. 1997). Together with a DC voltage gradient along the z-axis,this allows for ion focussing and converts the initial diffuse ion cloud into asmall collimated beam, which is perfectly suitable for a multipole ion guide.These effects are clearly visible in simulations performed by Shaffer et al.(1997).
3.3 Ion mass filter
After the passage through the ion funnel, the ions pass through a quadrupolemass filter. This device enables us to select the ions with the exact mass-over-charge ratio that we wish, which is necessary because the electrosprayedsolution practically always has contaminants. The quadrupole mass filterallows us to remove these contaminants almost completely. The exact work-ings of these quadrupoles are described in Paul (1990), but we will summa-rize the most important aspects here.
Our ion guide consists of four identical, hyperbolically shaped, metalelectrodes, arranged concentrically in a circle. Assuming a Cartesian coor-dinate system, we assign the z-axis to the (long) axis of our system. Wechoose our x- and y-axis in such a manner that two electrodes are placedsymmetrically on the x-axis and two on the y-axis. Generally, the electricquadrupole potential is given by
Φ =Φ0
2r20
(
αx2 + βy2 + γz2)
. (3.6)
In this specific electrode configuration, we have α = −β = 1, γ = 0 to satisfythe Laplace condition
∇2Φ =Φ0
r20
(α + β + γ) = 0, (3.7)
18

CHAPTER 3. EXPERIMENTAL SETUP Leon Boschman
This gives rise to the following electric fields
Ex = −Φ0
r20
x, Ey =Φ0
r20
y, Ez = 0.
For a constant voltage Φ0 = U , this leads to the equations of motion
x = − e
mr20
Ux, y =e
mr20
Uy, z = 0.
It can be easily seen from these equations that ions will oscillate in the x-direction, whereas they will be driven away exponentially in the y-direction.However, if we apply an additional radio-frequency voltage V with frequencyω, the time-varying potential becomes
Φ0 = U + V cos ωt,
leading to the following equations of motion
x +e
mr20
(U + V cos ωt)x = 0, (3.8a)
y − e
mr20
(U + V cos ωt) y = 0. (3.8b)
After substituting
au =4eU
mr20ω
, qu =2eV
mr20ω
, τ =ωt
2,
ax = −ay = au, qx = −qy = qu,
we obtain
d2x
dτ2+ (ax + 2qx cos 2τ) x = 0, (3.9a)
d2y
dτ2+ (ay + 2qy cos 2τ) y = 0. (3.9b)
These differential equations are second-order Mathieu differential equationsin their canonical form. These equations have two types of solutions, stableand unstable, depending on the values of a au and qu.
In a stable region of the au, qu-plane, the Mathieu equation has a stablesolution, leading to oscillatory motion. In an unstable region, however, theamplitudes diverge exponentially, so the particles will not be confined.
Since we want to confine the ions in the x- and y-direction and both ax, ay
and qx, qy have opposite signs, au and qu have to be chosen very carefullyto lie in stable regions for both spatial dimensions. A part of the stabilitydiagram for a quadrupole is presented in Figure 3.3.
It is possible to define an operation line in such a diagram, with differentpoints on this line corresponding to different masses while keeping U and V
19

November 16, 2012 3.3. ION MASS FILTER
0.0 0.2 0.4 0.6 0.8 1.0qu
0.00
0.05
0.10
0.15
0.20
0.25
au
x stable,y unstable
x unstable,y stable
x stable,y stable
m1
m2
m3
Figure 3.2: The stability diagram for a quadrupole mass filter. The reddashed line represents the operation line on which all the masses lie. Onlymass m2 lies in a stability region and the other masses are filtered out.a = 4eU/mr2
0ω, q = 2eV/mr20ω.
20

CHAPTER 3. EXPERIMENTAL SETUP Leon Boschman
constant. Such an operation line is shown in Figure 3.3. It is clearly visiblethat only a small part of this operation line lies in a stability region, so onlythe masses corresponding to the points on the operation line in the stabilityregion are confined. Hence, by carefully selecting the values for U and V ,it is possible to filter for very specific masses while getting rid of the othermasses.
3.4 Paul ion trap
After having travelled through the quadrupole ion guide, the ions are in-serted into the Paul trap. The Paul trap, named after Wolfgang Paul whoreceived the 1989 Nobel Prize in Physics for its invention, works in a similarmanner as the quadrupole ion guide.
Instead of four identical electrodes, one hyperbolically shaped ring elec-trode and two hyperbolic, rotationally symmetric caps are used. The ringelectrode is placed in the x, y-plane, while the end caps electrodes are placedperpendicular to the z-axis on both sides of the ring. For this electrode con-figuration to meet the condition in equation (3.7), we have α = β = 1,γ = −2, giving rise to an electric field of the form
Φ =Φ0
2r20
(
r2 − 2z2)
(3.10)
where r2 = x2 + y2 represents the radial distance to the z-axis.
The equations of motion for an ion inside a trap will again resemble theMathieu differential equations if we apply the voltage Φ0 = U + V cos ωtbetween the ring electrode and the end cap electrodes,
d2r
dτ2+ (ar + 2qr cos 2τ) r = 0, (3.11a)
d2z
dτ2+ (az + 2qz cos 2τ) z = 0. (3.11b)
Consequently, using the right values of au and qu will lead to oscillatorymotion in both the r- and the z-direction and thus entrapment of the ions.Although being trapped, the ions still have a kinetic energy of several eVwhen they enter the trap. To dispose of this energy, helium is injected intothe trap as a buffer gas, collisionally cooling the ions to room temperature.
3.5 Mass spectrometry
After the Paul trap, the ions are extracted into the Time-Of-Flight (TOF)tube with an electric field V0. A micro-channel plate (MCP) is placed atthe end of the TOF tube as a detector. Since the initial kinetic energy of
21
November 16, 2012 3.6. ATOMIC HYDROGEN SOURCE
the ions is negligible compared to the potential electric energy, we can statethat after the extraction
1
2mv2 = zV0, (3.12)
m
z=
2V0
v2, (3.13)
where z represents the ion charge. Setting the distance between the extrac-tion electrodes and the detector equal to d, we can derive the time-of-flightτ as a function of the mass-over-charge ratio.
τ(m
z
)
= d/v =d√2V0
√
m
z. (3.14)
After its flight through the TOF tube, the ion reaches the MCP detector.The MCP is a 50 mm diameter silicon plate of typically 2 mm thicknessperforated by tubes of approximately 10 µm diameter. These tubes are ata slight angle with respect to the normal, typically around 8°, ensuring thata particle that enters a tube hits one of the walls. Since there is a largeelectric field applied through the detector, a particle hitting the detectorfrees some electrons, triggering an avalanche as these electrons subsequentlyhit the walls of the tube, freeing even more electrons and thus creating adetectable signal at the electrode at the back of the MCP.
3.6 Atomic hydrogen source
Since we are looking at the sticking of hydrogen atoms to PAHs, we need adevice to spray atomic hydrogen at the gaseous PAHs. The device we use isan RF discharge source as described in Slevin and Stirling (1981), consistingof a vacuum pyrex tube inside a metal resonance cavity. There is a helicalcoil around the pyrex tube which is fed with a radio-frequency signal thatresonates inside the metal cavity. This produces a very strong alternatingaxial magnetic field, leading to the dissociation of the molecules (Toennieset al. 1979) inside the pyrex tube. Before use, the tube is cleaned to removeimpurities that enhance recombination and the pyrex tube is cooled withwater to reduce recombination even further (Ciric et al. 1985).
We also employ a teflon tube to guide the beam into the trap. This tubeis cleaned beforehand with ortho-phosphoric acid to remove impurities thatwould enhance recombination on the walls. The teflon tube is also cooledvia a liquid nitrogen bath to lower the recombination on the wall.
We determine the dissociation fraction of the hydrogen beam with a 40keV 4He2+ ion beam produced with an ECR ion source (ECRIS). We crossboth beams inside the Paul trap of our setup and as the ion beam collides
22

CHAPTER 3. EXPERIMENTAL SETUP Leon Boschman
with the hydrogen beam, it ionizes both H and H2through electron capture.Other processes than electron capture are also taking place, but electroncapture is the most dominant process. The interested reader can have alook at Hoekstra (1990) to see their characteristics.
The produced H and H2 ions are then extracted into the TOF tube toproduce a mass spectrum in order to measure the relative amounts of H+
and H2+
4He2+ + H → 4He+ + H+
4He2+ + H2 → 4He+ + H2+
4He2+ + H2 → 4He + 2H+
The probability with which these reactions occur is directly proportionalto their collisional ionisation cross sections, which are σ21 (H), σ21 (H2) andσ20 (H2) respectively. These cross sections are experimentally determinedby Shah and Gilbody (1978) for 3He2+ at energies between 4 and 343 keV.Because the cross section varies with velocity, we use their cross sections foran ion energy of 30 keV, since a 30 keV 3He2+ ion has the same velocity asa 40 keV 4He2+ ion.
If we set the amount of detected H+ as AH+ and the amount of H2+ as
AH2+ , we find
AH+ = nHσ21 (H) + nH2σ20 (H2) , (3.15)
AH2+ = nH2
σ21 (H2) . (3.16)
Rewriting this into eq. (3.17), it is very straightforward to determinethe dissociation fraction from the peak ratios.
nH
nH2
=σ21 (H2)
σ21 (H)
(
AH+
AH2+
− σ20 (H2)
σ21 (H2)
)
(3.17)
From our observed peak ratios, we eventually find nH
nH2≈ 0.4.
23

CHAPTER 4
Experimental procedure
4.1 Sample preparation
We are able to produce the coronene cation in a chemical solution. The basisof a sample is 1 mL of an oversaturated solution of coronene in methanol.After centrifuging to remove sediment from the upper layers, a sample of600 µL saturated coronene solution is obtained without solid residue. Thechoice of the solvent is crucial in this matter, since it should be able todissolve both the apolar neutral coronene and its ionized counterpart. Forexample, hexane is superior to methanol when solely considering dissolvingneutral coronene, but as soon as the coronene is ionized, the hexane is notsufficient anymore, since it lacks the polarity (asymmetric internal chargedistribution) to dissociate the ionic bonds. The opposite is true for water.As a very polar molecule, it cannot dissolve neutral coronene and hencedoes not suffice as a solvent for the experiment. For the purpose of ionizingcoronene in solution, methanol turns out to be the Aristotelian golden mean,as it dissolves both neutral and ionized coronene.
We create the coronene cation based on the procedure as described inMaziarz (2005). Starting from 600 µL saturated coronene solution, we add50 µL of a 10 mM solution of AgNO3 in 50:50 methanol:ethanol. An addi-tional 350 µL methanol ensures a sample volume of 1 mL. With 7.29 eV,coronene has a slightly lower ionization energy (Lias 2005) than silver (7.58 eV,Loock et al. (1999)) and therefore the Ag+-ion transfers its charge to theneutral coronene. The newly formed coronene cation remains dissolved,while the neutral silver precipitates from the solution as a solid, making thereaction irreversible:
Ag+ + C24H12 → Ag (s) + C24H+12. (4.1)
24

CHAPTER 4. EXPERIMENTAL PROCEDURE Leon Boschman
4.2 Operational procedure
The mass spectra shown in chapter 5 are the average of typically 100 in-dividual measurements. These individual measurements are all controlledand performed by software written in LabView, and this software operatesin experimental cycles. Each individual measurement is represented by onecycle, which consists of the following operations:
1. Inject electrosprayed ions into the Paul trap. This phase lasts typicallyfor 0.4 seconds.
2. Simultaneously, helium buffer gas is pumped into the trap to cool theions collisionally. This improves the trapping significantly. This buffergas phase lasts just as long as the trap loading phase.
3. The ions are now kept trapped in the Paul trap. At the same time,the hydrogen source is irradiating the trap contents with a beam ofatomic hydrogen.
4. After a predetermined amount of time, the trap contents are ejectedinto the time of flight tube. Having the same kinetic energy, the heav-ier ions will fly slower and thus reach the detector at the end at alater time. This allows us to perform mass spectrometry of the trapcontents.
Since the setup is not designed for trapping molecules for longer than afew seconds, problems start to arise for irradiation times exceeding 5 seconds.
First of all, the signal suffers from trap losses. These losses emanatefrom the fact that the energy distribution always contains the high-energytail that can escape from the trap. Another problem is that coronene cationsand their hydrogenated counterparts may at some time have their chargeremoved during a reaction. Being free of charge, these molecules do not feelthe electromagnetic field anymore and are therefore no longer trapped.
The second problem is due to the helium buffer gas. As soon as thehelium valve is closed after the trap loading is finished, pressure is buildingup inside the helium tube. If this pressure becomes too high when thenext cycle begins, the pressure in the entire setup will become too highand certain sensitive parts, such as the detector, might be damaged. Itis therefore crucial that the pressure build-up is mitigated by a mass flowcontroller between the helium bottle and the buffer tube that ends insidethe trap.
The tuning of the present mass flow controller is too coarse to allowfor a sufficiently slow pressure build-up for irradiation times longer than 5seconds. We work around this problem by venting the helium tube multipletimes during one cycle when we wanted to irradiate longer than 5 seconds.
25

November 16, 2012 4.2. OPERATIONAL PROCEDURE
It remains unclear whether this affects the simultaneous hydrogenation pro-cess, so we decide not to use those measurements for quantitative analysis.However, a qualitative look at the spectra of those measurements alreadyprovides us with a lot of insight.
26

CHAPTER 5
Results
5.1 Raw data
The raw data obtained from a measurement is a time-of-flight spectrum witha time resolution of 1 ns and a total duration of 50 µs. This is sufficientto detect particles with masses between 1 and 950 amu. To increase thesignal-to-noise ratio, this spectrum is actually the average of a series ofidentical measurements, where one series typically consists of 100 individualmeasurements. With the right calibration, one can convert these time-of-flight spectra to mass spectra using equation (5.1),
m
z(τ) =
(
τ − b
m0
)2
. (5.1)
We perform measurements for irradiation times between 1 and 5 secondsand two additional long exposures of 15 and 30 seconds. The mass spectraof the short exposures are shown in figure 5.1 and the long exposures areshown in figure 5.2.
Each mass in the spectrum is accounted for by a gaussian peak witha width that corresponds to the mass resolution at that mass. This finitemass resolution is caused by thermal dispersion and initial displacement ofthe ions and has a value of m
∆m≈ 200. Since the mass of the singly charged
coronene cation is 300 amu, peaks around this mass have FWHM ≈ 1.5. Itis therefore difficult to distinguish one hydrogenation state from the next,because their mass peaks will be blended. Luckily, their widths will beidentical, so the best way to extract all mass peaks from the mass spectrumis by fitting multiple Gaussians with an identical fixed width.
27

November 16, 2012 5.1. RAW DATA
296 298 300 302 304 306Mass (m/z)
0.0
0.2
0.4
0.6
0.8
1.0
1.2
1.4
Sign
al stre
ngth (V
)
t = 1s
296 298 300 302 304 306Mass (m/z)
0.0
0.2
0.4
0.6
0.8
1.0
1.2
Sign
al stre
ngth (V
)
t = 1.5s
296 298 300 302 304 306Mass (m/z)
0.0
0.2
0.4
0.6
0.8
1.0
Sign
al stre
ngth (V
)
t = 2s
296 298 300 302 304 306Mass (m/z)
0.0
0.2
0.4
0.6
0.8
1.0
Sign
al stre
ngth (V
)
t = 2.5s
296 298 300 302 304 306Mass (m/z)
0.0
0.1
0.2
0.3
0.4
0.5
0.6
0.7
0.8
0.9
Sign
al stre
ngth (V
)
t = 3s
296 298 300 302 304 306Mass (m/z)
0.0
0.1
0.2
0.3
0.4
0.5
0.6
0.7
0.8
0.9
Sign
al stre
ngth (V
)
t = 3.5s
296 298 300 302 304 306Mass (m/z)
0.0
0.1
0.2
0.3
0.4
0.5
0.6
0.7
0.8
Sign
al stre
ngth (V
)
t = 4s
296 298 300 302 304 306Mass (m/z)
0.0
0.1
0.2
0.3
0.4
0.5
0.6
0.7
Sign
al stre
ngth (V
)
t = 4.5s
296 298 300 302 304 306Mass (m/z)
0.0
0.1
0.2
0.3
0.4
0.5
0.6
0.7
Sign
al stre
ngth (V
)
t = 4.75s
Figure 5.1: Evolution of the coronene cation mass spectrum with increasingH irradiation time. For larger versions of these plots, see appendix A.
295 300 305 310 315Mass (m/z)
0.00
0.05
0.10
0.15
0.20
0.25
0.30
0.35
Signal strength (V)
t = 15s
295 300 305 310 315Mass (m/z)
0.00
0.05
0.10
0.15
0.20
0.25
0.30
Signal strength (V)
t = 30s
Figure 5.2: Mass spectra taken after exposing coronene cations to hydrogenfor 15 and 30 seconds.
28

CHAPTER 5. RESULTS Leon Boschman
5.2 Observed trends
A mass spectrum of coronene without hydrogen irradiation is shown in figureA.1. It has a clear peak at a mass of 300, which matches the mass of acoronene molecule exactly.
As we start irradiating, we see that the peak at 300 disappears and thata peak at m/z = 301 appears. We also observe an emerging peak at amass of 303 that grows more dominant with irradiation time and for higherirradiation times there is even a peak at m/z = 305 visible.
Comparing the spectra for different H irradiation times, there are twothings clearly visible. First of all, the only visible peaks are at odd hydro-genation states, e.g. at m
z= 301, 303, etc. If there is any signal from the
even hydrogenation states, it is not visible by eye, because the surround-ing odd hydrogenation states overwhelm it completely with their Gaussianwings. Although not visible by eye, we can still determine the contribu-tion of the even states. This contribution is relatively small, but it is stillmeasurable.
The second thing that is clearly visible in the spectra is the shift tohigher masses with increasing H irradiation time. This indicates that hy-drogenation increases with H irradiation time, as is especially clear from thelong exposure spectra.
29

CHAPTER 6
Data analysis
The raw mass spectra give us a rough indication of the hydrogenation pro-cess, but we need a more quantitative understanding of the process. Wetherefore analyze the short exposure data with a model that accounts forthe addition of up to 12 hydrogen atoms.
Every hydrogenation state is represented by a gaussian with a fixedwidth that corresponds to the resolution of the mass spectrometer, as shownin equation (6.1). Because of this fixed width, the amount of coronenemolecules in a certain hydrogenation state is measured directly by the am-plitude of the corresponding gaussian. An additional advantage is that theeven hydrogenation states can be measured as well, although they remainmore or less hidden in the gaussian wings of the odd states.
There is also a baseline present in the mass spectra. This baseline isuniform throughout the spectral region of interest and can therefore be in-cluded easily in the model as the additional constant C. The model canthen be summarized as:
y = C +11∑
i=0
Ai exp
[
−(x − m300+i)2
2σ2
]
, (6.1)
where σ denotes the standard deviation of the Gaussian peaks that corre-sponds to the resolution of the mass spectrometer.
6.1 Line evolution
The technique described above allows us to study the time evolution of eachseparate hydrogenation state individually. We show this evolution for thefirst five hydrogenation states in figure 6.2. In this figure we see that withina second there are no more bare cations left and that the relative abundance
30

CHAPTER 6. DATA ANALYSIS Leon Boschman
296 298 300 302 304 306Mass (m/z)
0.00
0.05
0.10
0.15
0.20
0.25
Signal strength (V)
t = 4s
Figure 6.1: Fixed width gaussian analysis of the mass spectrum obtainedafter irradiating coronene cations with atomic hydrogen for 4 seconds.
of the first hydrogenation state already starts to decrease with time. Thisclearly indicates that almost instantaneously all the coronene is in the firsthydrogenation state and starts to hydrogenate further. This observation fitsthe earlier prediction that the first hydrogenation is barrierless perfectly.
Furthermore we see that the second hydrogenation state, nCorH+2, de-
creases with time in a fashion similar to the first hydrogenation state. Thiscan be explained by the fact that the production of this state out of the firsthydrogenation state is impeded by a barrier. At the same time, nCorH+
2is
hydrogenated without a barrier, so this process happens a lot faster. There-fore, the amount of nCorH+
2is limited by the speed of its formation process,
which is in turn limited by the amount of ions in the first hydrogenationstate. Since the latter is decreasing with time, so is the amount of ions inthe second hydrogenation state. The third, fourth and fifth hydrogenationare all increasing with irradiation time. This is as expected, since most ionsare still in the first hydrogenation state after 1 second.
If we compare the results from figure 6.2 with the model for the hy-drogenation from section 2.2, we see that we are still in the early stages ofhydrogenation. In figures 6.3 to 6.5 we zoom in on this phase and we com-pare models with different values for the relative abstraction cross section.From these figures we see that abstraction does not play a significant roleat short irradiation times. This justifies the neglect of abstraction whenthe hydrogenation barriers are derived, which simplifies the mathematicssignificantly.
31

November 16, 2012 6.1. LINE EVOLUTION
0 1 2 3 4 5Irradiation time (s)
0.0
0.1
0.2
0.3
0.4
0.5
0.6
Relative abundance
nCor+
nCorH+1
nCorH+2
nCorH+3
nCorH+4
nCorH+5
Figure 6.2: The time evolution of the first five hydrogenation states.
Irradiation time (arb. units)10-2
10-1
100
Fractional hydrogenation state population # of H atoms
01234567891011
Figure 6.3: The model from section 2.2, but without abstraction.
32

CHAPTER 6. DATA ANALYSIS Leon Boschman
Irradiation time (arb. units)10-2
10-1
100
Fractional hydrogenation state population # of H atoms
01234567891011
Figure 6.4: The model from section 2.2 with a relative abstraction crosssection from Mennella et al. (2012).
Irradiation time (arb. units)10-2
10-1
100
Fractional hydrogenation state population # of H atoms
01234567891011
Figure 6.5: The model from section 2.2 with an abstraction cross sectionequal to the cross section for hydrogenation.
33

November 16, 2012 6.2. DERIVING ENERGY BARRIERS
0 1 2 3 4 5Irradiation time (s)
10-2
10-1
100
Ratio
nCorH+2/nCorH+
1
nCorH+3/nCorH+
1
nCorH+4/nCorH+
3
nCorH+5/nCorH+
3
Figure 6.6: Measured ratios of hydrogenation states.
6.2 Deriving energy barriers
The first barrier
One of the striking resemblances between theory and experiment is the con-stant ratio of the contributions from the first and the second hydrogenationstate (CorH+ and CorH+
2 ). This is very clear from figures 6.3 to 6.6. Wecan therefore use equation (6.2) to obtain the height of the first barrier.
d
dt
(nCorH+2
nCorH+
)
=nCorH+(t)n′
CorH+2
(t) − nCorH+2(t)n′
CorH+(t)
n2CorH+(t)
= 0 (6.2)
Recalling the equations from section 2.2, we get the following expressionsfor the temporal derivatives of CorH+ and CorH+
2 :
d nCorH+
dt= −A1 e
−Ea
kBT nCorH+nH , (6.3)
d nCorH+2
dt= A1 e
−Ea
kBT nCorH+ − A2nCorH+2nH . (6.4)
34

CHAPTER 6. DATA ANALYSIS Leon Boschman
Combining equations (6.2), (6.3) and (6.4), we get the following expres-sion:
(
1 +nCorH+
2
nCorH+
)
A1 e−
EakBT − A2
nCorH+2
nCorH+
= 0. (6.5)
This can be rewritten in an expression for the energy barrier, as shownin equation (6.6). We can apply this equation to all our data points, becausethe basic assumption that the ratio of CorH+ and CorH+
2 is constant is validthroughout our entire measurement sequence. This yields a very constantvalue for the energy barrier of approximately 72 meV, as can be seen infigure 6.7:
E2 = −kBT ln
A2
A1
1
1 +n
CorH+
nCorH
+2
. (6.6)
The second barrier
The second hydrogenation barrier is encountered by the fourth hydrogenatom that tries to bind to the hydrogenated coronene cation, so we willrefer to it as E4. Similarly to the first barrier, we observe that for thishydrogenation step the ratio nCorH+
4/nCorH+
3is more or less constant. Again
assuming that abstraction is negligible, we can derive this barrier in a similarfashion as we did for the first one, which yields the expression in equation(6.7):
E4 = −kBT ln
A4 +n
CorH+2
nCorH
+3
A2
A3
1n
CorH+3
nCorH
+4
+ 1
. (6.7)
Using this expression, we obtain the barrier for all measurements, asshown in figure 6.7. For the calculation of the second barrier, we ignore thedata points with an irradiation time of 2 seconds and shorter. At that time,the peaks of nCorH+
3and nCorH+
4are still too low to be detected with sufficient
accuracy. Additionally, at short irradiation times, these two peaks have notreached an equilibrium state yet, which can also be seen in figure 2.2. Takingthese conditions into account, we find a barrier height of E4 = 43 meV.
This fourth hydrogenation on the coronene cation is electronically equiv-alent to the third hydrogenation on a neutral coronene molecule. Rauls andHornekær (2008) predict that the third hydrogenation to an outer edge car-bon atom has an associated barrier of 40 meV, which is very close to thebarrier height we find experimentally for the fourth hydrogenation of the
35

November 16, 2012 6.2. DERIVING ENERGY BARRIERS
0 1 2 3 4 5Irradiation time (s)
0.00
0.02
0.04
0.06
0.08
0.10
0.12
Energy
barrie
r (eV
)
E2 = 72 meVE4 = 43 meV
Figure 6.7: The first and the second barrier as obtained from the massspectra. In calculating the average value for E4, we ignore the first threedata points with an irradiation time below 2 s. The errors along the timeaxis originate from the finite Paul trap loading time.
cation.
In figure 6.7 we show the estimated value of E2 and E4 at each irradiationtime. For the first barrier all the values agree with each other very well. Inthe second barrier we observe that for the shortest irradiation times thebarrier height appears to increase with time. This is probably due to thefact that for short irradiation times the third and fourth hydrogenationstate are not in equilibrium yet. We therefore ignore the measurementswith irradiation times shorter than 2 s for the calculation of the secondbarrier.
The errorbars shown in figure 6.7 include only errors from fitting thegaussian model to the experimental data. Other factors are not included inthese errorbars.
36

CHAPTER 7
Discussion
7.1 Summary
We irradiate coronene cations with a beam of atomic hydrogen and measurea mass spectrum of the irradiation products. After varying the irradiationtime from 1 second up to 30 seconds, we find that the measured massesincrease with irradiation time. We also observe that the mass spectra aredominated by the coronene cations with an odd number of hydrogen atoms.This indicates that the hydrogenation of the coronene cation is subject to abarrier at every second hydrogen atom addition. The first two barriers canbe measured using models for chemical kinetics featuring Arrhenius statisticsand are determined at a value of 72 ± 6 meV and 40 ± 10 meV.
The dominance of odd hydrogenation states is shown to continue untilhigh hydrogenation states. This indicates that the barrier for every secondhydrogenation also exists for these higher hydrogenation states.
7.2 Comparison with previous work
Hydrogenation of PAHs has been studied by Mennella et al. (2012), wholook at the changing IR spectrum of coronene films during irradiation withan atomic deuterium beam. They find clear evidence of hydrogenation andsubsequent abstraction and derive cross sections for these processes. Thecoronene hydrogenation cross section they obtain has a value of 1.1 A2 andfor abstraction a cross section of 0.06 A2 is found. This abstraction crosssection shows that hydrogenated PAHs are efficient at forming H2 in theISM.
Other studies are able to derive rate constants for the first addition ofhydrogen, oxygen and nitrogen atoms to cations of several PAHs (Betts et al.2006; Snow et al. 1998; Mennella et al. 2012).
37

November 16, 2012 7.2. COMPARISON WITH PREVIOUS WORK
We compare the experimental results of the coronene cation with thecalculations for the neutral coronene molecule from Rauls and Hornekær(2008). For the first few hydrogen additions, the barriers derived from ourexperiment are consistent with those predicted from the calculation for theneutral coronene molecule. We are able to calculate the barriers of the sec-ond and the fourth hydrogen sticking, and compare them to the calculationsof Rauls and Hornekær (2008). Considering that the second hydrogenationof the coronene cation is electronically equivalent to the first hydrogena-tion of the neutral molecule, the calculated barriers (60 and 40 meV) aresimilar to those derived from the experimental data (72 and 40 meV). Thisshows that at least for the first hydrogenations the coronene cation behavesin a fashion similar to the predictions for the hydrogenation of the neutralmolecule.
While for the first hydrogenation the agreement between the neutralcalculations and the cation experiment is rather stunning, our results startto diverge for the subsequent hydrogenations. Rauls and Hornekær (2008)predict that after the fourth hydrogenation the barrier vanishes, while weobserve alternating barriers beyond the fourth hydrogenation. Rauls andHornekær (2008) include a hydrogen atom sticking to an egde carbon atomin their calculations (see figure 1.2), which might change the course of thesubsequent hydrogenations. According to their calculations this is the fa-vorable path to follow, because it has the lowest reaction barrier.
The work by Rauls and Hornekær (2008) has been followed by Throweret al. (2012) to study the hydrogenation of neutral PAHs experimentally.They irradiate solid phase coronene films with a 2000 K atomic deuteriumbeam. After this irradiation, they gradually increase the film temperatureand simultaneously monitor the evaporating species with mass spectrome-try. Their data shows that all hydrogenation states are equally populatedwithout a preference for the odd hydrogenation states. However, in theirexperiment they use a hydrogen atom beam of 2000 K. A temperature of2000 K corresponds to an energy of approximately 170 meV, which is morethan enough to overcome possibly existing hydrogenation barriers. There-fore, their reaction rate for hydrogenation with a barrier does not differ thatmuch from unobstructed hydrogenation, hence the invisibility of the hydro-genation barriers.
In summary, while we see that the coronene cation behaves similarly toits neutral counterpart, we also observe that for higher hydrogenation statestheoretical predictions and our experimental data diverge.
38

CHAPTER 7. DISCUSSION Leon Boschman
7.3 Consequences for H2 formation
This research project is carried out to better understand the role of PAHsin the formation of H2. Especially superhydrogenated PAHs can enhancethe H2 formation rate through Eley-Rideal reactions with incoming H atomsfrom the gas phase. These superhydrogenated PAHs are produced by theaddition of H atoms to the fully aromatic PAH.
We show that this hydrogenation process can happen for coronene cationsin contact with hydrogen atoms at room temperature. The kinetic behaviourof this process matches the theoretical predictions for the neutral coronenemolecule. Given that neutral coronene plays a role in the H2-formation pro-cess, coronene cations should fulfill a similar role in the chemical reactionnetwork.
Molecular hydrogen is also present in clouds subject to an external UVfield, the so-called PDRs. This external UV field dissociates H2 but the factthat it is still found in PDRs indicates that it is shielded from this UV fieldat higher visual extinction AV .
Generally, PAH cations dominate over their neutral counterparts in lowUV (G0 ≤ 100) PDRs at low visual extinctions (AV < 2, Cox and Spaans(2006)), implying that PAH catalyzed H2 formation can already take placeat low AV . This increases the region of a cloud where H2 formation ispossible.
From our results we can also derive that reaction rate coefficients arenot valid for the entire temperature regime of the ISM. In regions wherehydrogenation of PAH cations plays a role, the temperature is typicallylower than the energy of the barrier associated with this addition, resultingin a strong temperature dependence of the reaction rate constants.
7.4 Outlook
To derive reaction rate constants that are valid throughout the entire ap-plicable temperature regime, we will derive individual cross sections for hy-drogenations. We will also combine our model with future experiments todetermine the subsequent hydrogenation barriers. This can then be com-bined to obtain a temperature-dependent reaction rate coefficient for everyhydrogenation step. In this manner the chemical models for the H2 forma-tion in the ISM will be improved significantly.
Ideally, the experiments performed for this project would be repeatedwith even larger PAHs, such as circumcoronene (C54H18). This would enableus to check the dependence of the barrier height on the size of the PAHand therefore to assess how H2 formation depends on the size of the PAH.Combining this knowledge with astronomical PAH size distributions wouldallow the derivation of actual H2 formation rates, which can be compared
39

November 16, 2012 7.4. OUTLOOK
to astronomical observations and used in numerical models.Future experiments will include the addition of oxygen atoms to PAHs.
This will provide a better knowledge about the formation of small oxygen-containing species, such as the OH radical and the water molecule. Thesesmall molecules open up a plethora of chemical pathways and understandingthe influence of PAHs on their formation would vastly improve our knowl-edge about the chemical processes in the ISM as well as the thermal balance,which are all of influence on star formation.
Another region of interest is the influence of hydrogenation on the IRspectrum of PAHs since the presence of PAHs is generally inferred from theirIR band emission. Knowing whether and how hydrogenation modifies thisemission might allow us to provide better estimates of the amount of PAHmolecules present. It might even give us a tool to estimate the amount ofhydrogenation of the PAHs present.
40

CHAPTER 8
Conclusion
In this study we show experimental evidence for the existence of barriers tohydrogenate coronene cations. These barriers present alternating behaviourup to the eleventh hydrogenation. We show that only every second hydro-genation is associated with a barrier and measure the height of the first twobarriers to be E2 = 72 ± 6 meV and E4 = 40 ± 10 meV.
These barrier heights match the theoretical predictions for the electron-ically equivalent reactions on the neutral coronene molecule. This indicatesthat cationic PAHs should contribute to the same extent to the formationof molecular hydrogen as their neutral counterparts.
These barriers also imply a strong temperature dependence of the PAH-catalyzed H2-formation rate, since these reaction barriers are generally higherthan the temperature at which these reactions take place. One simple reac-tion rate constant will therefore not suffice to succesfully model these reac-tions in the ISM. In a future work we will derive individual cross sections toobtain temperature dependent reaction rates. To make these studies evenmore encompassing, it is desirable to repeat these measurements with PAHsof a larger size than coronene, such as circumcoronene. This will allow usto study the dependency of the reaction rates on the size of the PAH.
We envisage future experiments to study the addition of oxygen atomsto PAHs as well as the modification of the IR spectrum of PAHs when theybecome hydrogenated.
41
CHAPTER 9
Acknowledgements
As the old saying goes, no man is an island. During this project I have hada lot of support and help from more than a few people. First of all I wouldlike thank my supervisors at the Kapteyn institute, Stephanie Cazaux andMarco Spaans. Stephanie, you always had confidence in my abilities, evenat moments when I did not anymore, and it was probably your incessantencouragement that kept me going in those cases. Thanks a lot for this, Ialways find it fun discussing science (and non-science) with you and I amreally looking forward to four more years of collaboration with you. Marco,many thanks for your support during the last year. Although being a the-orist at heart, you were really interested in the experimental part of thisproject as well, something I really appreciate. What I found most remark-able is that you always made it seem that your advice was just my own idea,and that you had just helped me discover it.
Furthermore I would like to thank the people from the ISM group at theKapteyn for their constructive feedback throughout the year.
My special thanks goes out to the people of the Atomic and MolecularPhysics group at the KVI, where the experiments of this project were per-formed. You really helped me a lot getting the experiments to work and Ienjoyed the time in the laboratory greatly. The beamtimes we had in Berlinand Lund were fantastic experiences and I am really looking forward to thenext experiments.
Ronnie, I would like to thank you for your good advice throughout theentire year and I am looking forward to making coffee for four more years.
Thomas, it is because of you and your energetic behaviour that I amnow more and more living by the creed of an experimental physicist, “justdo it and hope that nature is kind”.
42

CHAPTER 9. ACKNOWLEDGEMENTS Leon Boschman
Erwin Bodewits taught me many things during my year as his officemate,among which is the second most important rule of experimental physics:“boring is good, it means that everything is working”. I am afraid I havebit more trouble getting used to that one.
Geert, many thanks for your help and assistance during last year. I reallyenjoyed working in the lab with you and your jokes made the sometimes longhours worthwhile. Also the trips we made were very cool, although I wouldrecommend you to wear glasses the next time we pass some Danish tollbooths.
Olmo, thank you for your helping me in getting familiar with the setup,it really sped up my work in the laboratory. Ina, I would like to thank youfor teaching me to alleviate my experimental stress on punching bags ratherthan concrete walls, although it would have been better if you taught methat a bit earlier.
I would also like to thank the people from the mechanical workshop atthe KVI, who were never too busy to help me with many of the practicalproblems I encountered. They were often able to replace my well-thought,complex solution with an easier, better-working one.
Essential help was also provided by the electronic workshop and thevacuum support group.
The supporting staff at both the KVI and the Kapteyn have alwayshelped me with all the tiny little problems I encountered, for which I wouldlike to thank them.
My gratitude goes out to all my fellow (PhD) students at both theKapteyn and the KVI, who were always eager to provide me with the nec-essary distraction and coffee when I needed it the most.
Finally, I would like to thank my family, and my parents in particular.It must have been strange, seeing your son quitting chemistry with theannouncement that he will never do chemistry or work in a lab again, only tosee him growing up to become an experimental astrochemist. Nevertheless,I really thank you for your never-ending support during all those years.
43

BIBLIOGRAPHY
Bauschlicher, Jr., C. W. (1998). The Reaction of Polycyclic Aromatic Hydro-carbon Cations with Hydrogen Atoms: The Astrophysical Implications.The Astrophysical Journal, Letters, 509:L125–L127.
Betts, N. B., Stepanovic, M., Snow, T. P., and Bierbaum, V. M. (2006). Gas-Phase Study of Coronene Cation Reactivity of Interstellar Relevance. TheAstrophysical Journal, Letters, 651:L129–L131.
Cazaux, S. M. (2004). Grain Surface Chemistry in Astrophysical Objects:From H2 to complex molecules. PhD thesis, Kapteyn Astronomical Insti-tute.
Ciric, D., Dijkkamp, D., Vlieg, E., and de Heer, F. (1985). Selective electroncapture into He II (n, l) subshells in collisions of He 2+ with atomic andmolecular hydrogen. Journal of Physics B: Atomic and Molecular Physics,18(24):4745.
Cox, N. L. J. and Spaans, M. (2006). The effects of metallicity, radiationfield and dust extinction on the charge state of PAHs in diffuse clouds:implications for the DIB carrier. Astronomy & Astrophysics, 451:973–980.
Gaskell, S. (1997). Electrospray: Principles and Practice. Journal of MassSpectrometry, 32:677–688.
Gould, R. J. and Salpeter, E. E. (1963). The Interstellar Abundance ofthe Hydrogen Molecule. I. Basic Processes. The Astrophysical Journal,138:393.
Guan, S. and Marshall, A. G. (1996). Stacked-ring electrostatic ion guide.Journal of the American Society for Mass Spectrometry, 7(1):101–106.
Hoekstra, R. (1990). Photons Shedding Light on Electron Capture by HighlyCharged Ions. PhD thesis, Rijksuniversiteit Groningen.
44

BIBLIOGRAPHY Leon Boschman
Kelly, R. T., Tolmachev, A. V., Page, J. S., Tang, K., and Smith, R. D.(2010). The ion funnel: Theory, implementations, and applications. MassSpectrometry Reviews, 29(2):294–312.
Lias, S. (2005). Ionization Energy Evaluation. In Linstrom, P. and Mal-lard, W., editors, NIST Chemistry WebBook, NIST Standard ReferenceDatabase Number 69. National Institute of Standards and Technology,Gaithersburg MD, 20899.
Loock, H.-P., Beaty, L., and Simard, B. (1999). Reassessment of the first ion-ization potentials of copper, silver, and gold. Physical Review A (Atomic,Molecular, and Optical Physics), 59:873–875.
Maziarz, E. (2005). Electrospray ionization Fourier transform mass spec-trometry of polycyclic aromatic hydrocarbons using silver(I)-mediatedionization. Canadian Journal of Chemistry - Revue Canadienne deChimie, 85(11):1871–1877.
Meijerink, R. and Spaans, M. (2005). Diagnostics of irradiated gas in galaxynuclei. I. A far-ultraviolet and X-ray dominated region code. Astronomy& Astrophysics, 436:397–409.
Mennella, V., Hornekær, L., Thrower, J., and Accolla, M. (2012). TheCatalytic Role of Coronene for Molecular Hydrogen Formation. The As-trophysical Journal, Letters, 745:L2.
Norman, C. A. and Spaans, M. (1997). Molecules at High Redshift: TheEvolution of the Cool Phase of Protogalactic Disks. The AstrophysicalJournal, 480:145.
Oort, J. H. and van de Hulst, H. C. (1946). Gas and smoke in interstellarspace. Bulletin of the Astronomical Institutes of the Netherlands, 10:187.
Paul, W. (1990). Electromagnetic Traps for Charged and Neutral Particles.Reviews of Modern Physics, 62(3):531–540.
Rauls, E. and Hornekær, L. (2008). Catalyzed Routes to Molecular Hydro-gen Formation and Hydrogen Addition Reactions on Neutral PolycyclicAromatic Hydrocarbons under Interstellar Conditions. The AstrophysicalJournal, 679:531–536.
Shaffer, S. A., Tang, K., Anderson, G. A., Prior, D. C., Udseth, H. R.,and Smith, R. D. (1997). A novel ion funnel for focusing ions at elevatedpressure using electrospray ionization mass spectrometry. Rapid Commu-nications in Mass Spectrometry, 11(16):1813–1817.
Shah, M. B. and Gilbody, H. B. (1978). Electron capture and He+(2s)formation in fast He2+-H and He+-H collisions. Journal of Physics BAtomic Molecular Physics, 11:121–131.
45

November 16, 2012 BIBLIOGRAPHY
Silveira, J. A., Gamage, C. M., Blase, R. C., and Russell, D. H. (2010). Gas-phase ion dynamics in a periodic-focusing DC ion guide. InternationalJournal of Mass Spectrometry, 296(13):36–42.
Slevin, J. and Stirling, W. (1981). Radio frequency atomic hydrogen beamsource. Review of Scientific Instruments, 52(11):1780–1782.
Snow, T. P., Le Page, V., Keheyan, Y., and Bierbaum, V. M. (1998). Theinterstellar chemistry of PAH cations. Nature, 391:259.
Thrower, J. D., Jørgensen, B., Friis, E. E., Baouche, S., Mennella, V., Luntz,A. C., Andersen, M., Hammer, B., and Hornekær, L. (2012). Experimen-tal Evidence for the Formation of Highly Superhydrogenated PolycyclicAromatic Hydrocarbons through H Atom Addition and Their CatalyticRole in H2 Formation. The Astrophysical Journal, 752:3.
Tielens, A. G. G. M. (2005). The Physics and Chemistry of the InterstellarMedium.
Toennies, J. P., Welz, W., and Wolf, G. (1979). Molecular beam scatteringstudies of orbiting resonances and the determination of van der waalspotentials for h–ne, ar, kr, and xe and for h[sub 2]–ar, kr, and xe. TheJournal of Chemical Physics, 71(2):614–642.
Weingartner, J. C. and Draine, B. T. (2001). Photoelectric Emission fromInterstellar Dust: Grain Charging and Gas Heating. The AstrophysicalJournal, Supplement, 134:263–281.
Wolfire, M. G., McKee, C. F., Hollenbach, D., and Tielens, A. G. G. M.(2003). Neutral Atomic Phases of the Interstellar Medium in the Galaxy.The Astrophysical Journal, 587:278–311.
46

APPENDIX A
Mass spectra
The mass spectra shown here are obtained after irradiating coronene cationswith room temperature hydrogen atoms, except figure A.1. That figureshows the mass spectrum of coronene without any hydrogen addition. Fig-ures A.2 through A.10 have been used in a quantitative analysis, while figuresA.11 and A.12 are used in a qualitative manner.
For more details on the analysis, please have a look at chapter 6
47

Novem
ber
16,2012
296 298 300 302 304 306Mass (m/z)
0.0
0.2
0.4
0.6
0.8
1.0
1.2Signal strength (V)
t = 0s
Figure A.1: The coronene mass spectrum without hydrogen irradiation.
48


Novem
ber
16,2012
296 298 300 302 304 306Mass (m/z)
0.0
0.2
0.4
0.6
0.8
1.0
1.2
1.4Signal strength (V)
t = 1s
Figure A.2: The mass spectrum after irradiating coronene cations for 1 second.
50


Novem
ber
16,2012
296 298 300 302 304 306Mass (m/z)
0.0
0.2
0.4
0.6
0.8
1.0
1.2Signal strength (V)
t = 1.5s
Figure A.3: The mass spectrum after irradiating coronene cations for 1.5 seconds.
52


Novem
ber
16,2012
296 298 300 302 304 306Mass (m/z)
0.0
0.2
0.4
0.6
0.8
1.0Signal strength (V)
t = 2s
Figure A.4: The mass spectrum after irradiating coronene cations for 2 seconds.
54


Novem
ber
16,2012
296 298 300 302 304 306Mass (m/z)
0.0
0.2
0.4
0.6
0.8
1.0Signal strength (V)
t = 2.5s
Figure A.5: The mass spectrum after irradiating coronene cations for 2.5 seconds.
56


Novem
ber
16,2012
296 298 300 302 304 306Mass (m/z)
0.0
0.1
0.2
0.3
0.4
0.5
0.6
0.7
0.8
0.9Signal strength (V)
t = 3s
Figure A.6: The mass spectrum after irradiating coronene cations for 3 seconds.
58


Novem
ber
16,2012
296 298 300 302 304 306Mass (m/z)
0.0
0.1
0.2
0.3
0.4
0.5
0.6
0.7
0.8
0.9Signal strength (V)
t = 3.5s
Figure A.7: The mass spectrum after irradiating coronene cations for 3.5 seconds.
60


Novem
ber
16,2012
296 298 300 302 304 306Mass (m/z)
0.0
0.1
0.2
0.3
0.4
0.5
0.6
0.7
0.8Signal strength (V)
t = 4s
Figure A.8: The mass spectrum after irradiating coronene cations for 4 seconds.
62


Novem
ber
16,2012
296 298 300 302 304 306Mass (m/z)
0.0
0.1
0.2
0.3
0.4
0.5
0.6
0.7Signal strength (V)
t = 4.5s
Figure A.9: The mass spectrum after irradiating coronene cations for 4.5 seconds.
64


Novem
ber
16,2012
296 298 300 302 304 306Mass (m/z)
0.0
0.1
0.2
0.3
0.4
0.5
0.6
0.7Signal strength (V)
t = 4.75s
Figure A.10: The mass spectrum after irradiating coronene cations for 4.75 seconds.
66


Novem
ber
16,2012
295 300 305 310 315Mass (m/z)
0.00
0.05
0.10
0.15
0.20
0.25
0.30
0.35Signal strength (V)
t = 15s
Figure A.11: The mass spectrum after irradiating coronene cations for 15 seconds.
68


Novem
ber
16,2012
295 300 305 310 315Mass (m/z)
0.00
0.05
0.10
0.15
0.20
0.25
0.30Signal strength (V)
t = 30s
Figure A.12: The mass spectrum after irradiating coronene cations for 30 seconds.
70

APPENDIX B
Paper
The results that we present in this thesis have also been submitted as aLetter to the Astrophysical Journal, which was provisionally accepted. Themanuscript with the minor changes was resubmitted on Monday November19.
71

Hydrogenation of PAH cations: a first step towards H2 formation.
L. Boschman1,2, G. Reitsma 2, S. Cazaux1, T. Schlatholter2, R. Hoekstra2, M. Spaans1
and
O. Gonzalez-Magana2
ABSTRACT
Molecular hydrogen is the most abundant molecule in the universe. A large fraction of H2
forms by association of hydrogen atoms adsorbed on polycyclic aromatic hydrocarbons (PAHs),where formation rates depend crucially on the H sticking probability. We have experimentallystudied PAH hydrogenation by exposing coronene cations, confined in a radiofrequency ion trap,to gas phase atomic hydrogen. A systematic increase of the number of H atoms adsorbed on thecoronene with the time of exposure is observed. Odd coronene hydrogenation states dominate themass spectrum up to 11 H atoms attached. This indicates the presence of a barrier preventingH attachment to these molecular systems. For the second and fourth hydrogenation, barrierheights of 72 ± 6 meV and 40 ± 10 meV, respectively are found which is in good agreementwith theoretical predictions for the hydrogenation of neutral PAHs. Our experiments howeverprove that the barrier does not vanish for higher hydrogenation states. These results imply thatPAH cations, as their neutral counterparts, exist in highly hydrogenated forms in the interstellarmedium. Due to this catalytic activity, PAH cations and neutrals seem to contribute similarlyto the formation of H2.
Subject headings: astrochemistry — ISM: molecules
1. Introduction
Molecular hydrogen is the most abundantmolecule in the universe and the main constituentof regions where stars are forming. H2 plays animportant role in the chemistry of the interstellarmedium, and its formation governs the transfor-mation of atomic diffuse clouds into molecularclouds. Because of the inefficient gas phase routesto form H2, dust grains have been recognized to bethe favored habitat to form H2 molecules (Oort& van de Hulst 1946, Gould & Salpeter 1963).The sticking of H atoms onto surfaces has re-ceived considerable attention because this mecha-nism governs the formation of H2, but also othermolecules that contain H atoms. The sticking of
1Kapteyn Astronomical Institute, University of Gronin-
gen, P.O. Box 800, 9700 AV Groningen, the Netherlands2KVI Atomic and Molecular Physics, University of
Groningen, Zernikelaan 25, 9747 AA Groningen, the
Netherlands.
H atoms onto dust grains can also be an impor-tant mechanism to cool interstellar gas (Spaans& Silk 2000). In the past decades, a plethoraof laboratory experiments and theoretical modelshave been developed to understand how H2 forms.As H atoms arrive on dust surfaces, they can beweakly (physisorbed) or strongly (chemisorbed)bound to the surface. The sticking of H in the ph-ysisorbed state (Pirronello et al. 1997, 1999, 2000;Perry & Price 2003) and in the chemisorbed state(Zecho et al. 2002; Hornekær et al. 2006; Mennella2006) has been highlighted by several experimentson different types of surfaces (amorphous carbon,silicates, graphite).
In the ISM, dust grains are mainly carbona-ceous or silicate particles with various sizes andrepresent an important surface for the formationof H2. However, a large part (∼ 50%) of theavailable surface area for chemistry is in the formof very small grains or PAHs (Weingartner &
1

Draine 2001). These PAHs are predicted to havecharacteristics similar to graphite surfaces: How-ever, once the first H atom is chemisorbed on thebasal plane, subsequent adsorptions of H atoms inpairs appear to be barrierless for the para dimerand with a reduced barrier for the ortho dimer(Rougeau et al. 2006). H2 can then form by in-volving a pre-adsorbed H atom in monomer (Sha& Jackson 2002; Morisset et al. 2003; 2004b; Mar-tinazzo & Tantardini 2006) or in a para-dimerconfiguration (Bachellerie et al. 2007). However,while these routes represent efficient paths to formH2, the inefficient sticking of H atoms in monomersconstitutes an important obstacle to enter the cat-alytic regime for H2 formation. This results in avery low H2 formation efficiency on graphitic/PAHsurfaces (Cazaux et al. 2011).
The hydrogenation on the PAH edges has beenidentified as an important route to form H2 in theISM (Bauschlicher 1998; Hirama et al. 2004; LePage et al. 2009; Mennella et al. 2012; Throweret al. 2012). Density functional theory calcula-tions have shown that the first hydrogenation ofneutral coronene is associated with a barrier (∼60meV) but that subsequent hydrogenation barri-ers vanish (Rauls & Hornekær 2008). Recently,coronene films exposed to H/D atoms at hightemperature, were studied by means of IR spec-troscopy (Mennella et al. 2012) and mass spec-trometry (Thrower et al. 2012). These measure-ments showed that neutral PAHs, when highly hy-drogenated, are efficient catalysts for the forma-tion of H2, and confirmed the high H2 formationrate attributed to PAHs in PDRs (Mennella et al.2012).
PAH cations, which are usually present at lowerextinction AV, and therefore reside at the sur-faces of PDRs, also represent an important routeto form H2 (Bauschlicher 1998; Le Page et al.2009). The addition of the first H atom is pre-dicted to be barrierless. This reaction is exother-mic but the product should be stabilized by IRemission. A second H atom can react with thealready adsorbed H to form H2 without a barrier(Bauschlicher 1998; Hirama et al. 2004).
In this letter, we study experimentally the hy-drogenation of coronene cations in the gas phasethrough exposure to hydrogen atoms. By usingmass spectrometry, we show that odd hydrogena-tion states of coronene cations predominantly pop-
ulate the mass spectrum. Our results highlightthe fact that the further hydrogenation of PAHcations is associated with a barrier if the numberalready attached H atoms is odd, and no barrier ifthis number is even. This alternanting barrier-nobarrier occurence seems to remain with increasinghydrogenation. These results suggest that PAHcations can also enjoy highly hydrogenated statesin the interstellar medium, and acts as catalystsfor H2 formation.
2. Experiments
In this pilot experiment we show the feasibilityof studying the hydrogenation of PAHs in the gasphase. For this purpose, we use a setup designedto study molecular ions in a radiofrequency iontrap. Time-of-flight mass spectrometry of the trapcontent is used to identify the changes in mass ofthe coronene cations and therefore deduce theirrespective degrees of hydrogenation.
2.1. Set-up
The experiments have been performed usinga home-built tandem-mass spectrometer shownschematically in figure 1 (Bari et al. 2011). Abeam of singly charged coronene radical cations([C24H12]
+, m/z 300) was extracted from an elec-trospray ion source. The ions were phase-spacecompressed in an radiofrequency (RF) ion funneland subsequently in an RF quadrupole ion guide.Mass selection was accomplished by using an RFquadrupole mass filter. Accumulation of the ionstook place in a three dimensional RF ion trap(Paul trap). A He buffer gas at room temper-ature was used to collisionally cool the trappedcations. Exposure to gas-phase atomic hydrogenfor variable periods of time led to multiple hydro-gen adsorption on the coronene cations. An elec-tric extraction field was then applied between thetrap end-caps to extract the trapped hydrogenatedcations into a time-of-flight (TOF) mass spectrom-eter with resolution M/∆M ∼ 200. To obtain massspectra of sufficient statistics, typically a couple ofhundred TOF traces were accumulated.
Electrospray ionization allows to gently trans-fer ions from the liquid phase into the gas phase.Inspired by the method of Maziarz (2005) we haverun the ion source with a solution consisting of 600µL of saturated solution of coronene in methanol,
2

350 µL of HPLC grade methanol and 50 µL of 10mM solution of AgNO3 solution in methanol. Inthe liquid phase, electron transfer from a coronenemolecule to a silver ion leads to formation of therequired radical cation.
The trapped ions are exposed to hydrogenatoms produced from H2 by a Slevin type sourcewhich has been extensively used in crossed beamexperiments (Hoekstra et al. 1991,Bliek et al.1997). While in the earlier work the dissociationfractions were determined by means of electron im-pact excitation or HeII line emission, we now usecharge removal (captured ionization) and dissocia-tion induced by 40 keV He2+. For these processesthe cross sections are well-known (Shah & Gilbody1978). In this way we determine a hydrogen disso-ciation fraction of n (H) / (n (H) + n (H2)) ≈ 0.3.The temperature of the H beam is around roomtemperature (∼25 meV).
2.2. Results
Coronene ions are exposed to a constant flux ofH atoms for different periods of time before theirdegree of hydrogenation is determined by means ofmass spectrometry. The irradiation time is variedfrom 1.0 up to 30 s to study the time-dependenceof coronene hydrogenation.
The data obtained from our experiment are aseries of mass spectra of hydrogenated coronenecations as a function of H exposure time. Some ofthe spectra are shown in fig.2. Fig.2(a) shows themass spectrum of the native m/z=300 coronenecations. A similar, thus unchanged, mass spec-trum is obtained (not shown in this article) if we
Fig. 1.— The setup used, with the ion funnel,quadrupoles, ion trap, hydrogen source and detec-tor
irradiate coronene cations with molecular hydro-gen. This means that molecular hydrogen does notstick to coronene cations at room temperature.
After turning on the hydrogen source and ex-posing the coronene cations to the atomic hydro-gen beam for 1.0 s (fig.2, (b)), the peak at m/z =300 shifts to 301, which means that the trap con-tent main constituent is (C24H12+H)+. For in-creasing irradiation time (fig.2(c) t= 2 s, (d) 3 s,(e) 4 s and (f) 4.75 s), the peak at m/z=301 dis-appears progressively while a peak at m/z = 303and then at m/z = 305 (for t = 4.75 s see fig.2(f)) appears, which indicates the addition of 3 and5 hydrogen atoms, respectively. At longer expo-sure time (fig.3(a) t ∼15 s), the m/z=303 peakdominates the signal, and a peak at m/z=305 ap-pears. At even longer irradiation times (fig.3(b) t∼30 s), the peak m/z=305 dominates and peaksat m/z=307 and 309 appear. These peaks clearlyshow the evolution of the hydrogenation states ofcoronene cations with H irradiation time.
3. Analysis and discussion
Our results show that the most importantpeaks measured in the mass spectrum shift fromlower masses to higher masses with increasingH exposure time. In order to follow the evolu-tion of the first hydrogenated state of coronenecation (C24H12+H)+ (CorH+) to the second(C24H12+2H)+ (CorH+
2 ), third (CorH+3 ) and
fourth (CorH+4 ) hydrogenated states, we use a
simple model that describes this evolution :
d nCorH+
dt= −
(
A2 e−
E2kB Tgas nCorH+
)
nH (1)
d nCorH+2
dt=
(
A2 e−
E2kBTgas nCorH+ − A3 nCorH
+2
)
nH
(2)d nCorH+
3
dt=
(
A3 nCorH+2− A4 e
−
E4kB Tgas nCorH
+3
)
nH
(3)d nCorH
+4
dt=
(
A4 e−
E4kBTgas nCorH+
3− A5 nCorH+
4
)
nH
(4)
Hydrogenation of CorH2n+1+ follows an Ar-
rhenius expression where A2n+2 is the prefactorand E2n+2 is the barrier, while hydrogenation of
3
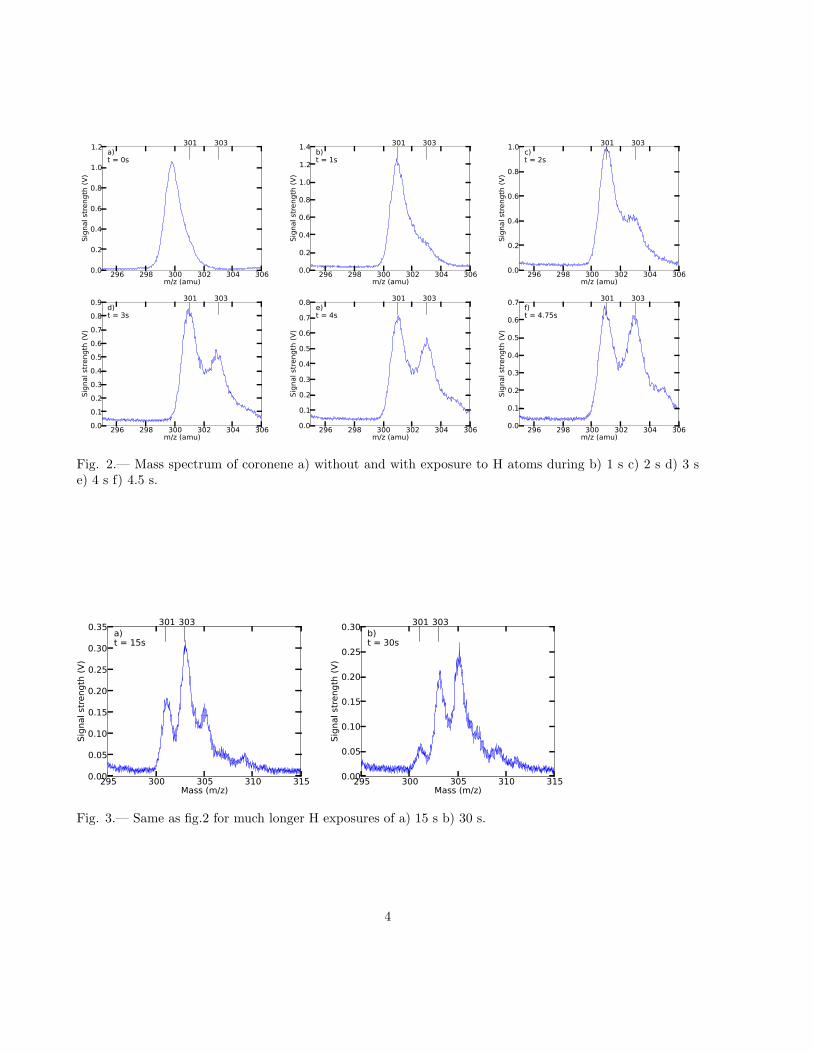
296 298 300 302 304 306m/z (amu)
0.0
0.2
0.4
0.6
0.8
1.0
1.2
Signal strength (V)
a)t = 0s
301 303
296 298 300 302 304 306m/z (amu)
0.0
0.2
0.4
0.6
0.8
1.0
1.2
1.4
Signal strength (V)
b)t = 1s
301 303
296 298 300 302 304 306m/z (amu)
0.0
0.2
0.4
0.6
0.8
1.0
Signal strength (V)
c)t = 2s
301 303
296 298 300 302 304 306m/z (amu)
0.0
0.1
0.2
0.3
0.4
0.5
0.6
0.7
0.8
0.9
Signal strength (V)
d)t = 3s
301 303
296 298 300 302 304 306m/z (amu)
0.0
0.1
0.2
0.3
0.4
0.5
0.6
0.7
0.8Signal strength (V)
e)t = 4s
301 303
296 298 300 302 304 306m/z (amu)
0.0
0.1
0.2
0.3
0.4
0.5
0.6
0.7
Signal strength (V)
f)t = 4.75s
301 303
Fig. 2.— Mass spectrum of coronene a) without and with exposure to H atoms during b) 1 s c) 2 s d) 3 se) 4 s f) 4.5 s.
295 300 305 310 315Mass (m/z)
0.00
0.05
0.10
0.15
0.20
0.25
0.30
0.35
Signal strength (V)
a)t = 15s
301 303
295 300 305 310 315Mass (m/z)
0.00
0.05
0.10
0.15
0.20
0.25
0.30
Signal strength (V)
b)t = 30s
301 303
Fig. 3.— Same as fig.2 for much longer H exposures of a) 15 s b) 30 s.
4

CorH+2n
follows the same expression with a pref-actor A2n+1 and no barrier. kB is the Boltzmannconstant and T the temperature of the H beam(T∼25 meV).
In these equations we do not include abstrac-tion, meaning that the time evolution of the con-tribution of each state is governed entirely by hy-drogenation. This assumption is made in orderto derive the first barriers of hydrogenation. Ab-straction can be neglected in the conditions ofour experiments for low exposure times. Thisis supported by previous experiments where thecross section for addition of hydrogen to neutralcoronene is predicted to be 20 times that for ab-straction (Mennella et al. 2012). Further supportis drawn from a kinetic chemical model we de-veloped, which shows that abstraction has to bevery low compared to hydrogenation to be able tomimic the experimental results (Boschman et al.in prep). However, for long H exposure time weexpect the hydrogenation degree of the coronenecations to reach a steady state which will allow usto derive the contribution of abstraction relativeto addition, and therefore derive the H2 formationrate due to PAH cations. It should also be keptin mind that in the conditions of our experiments,the H atoms are at room temperature meaningthat they cross the barriers for abstraction (10meV, Rauls & Hornekær 2008) and addition (40- 60 meV, Rauls & Hornekær 2008) with similarease. Under interstellar conditions, however, theabstraction will dominate by 8 orders of magni-tude (at 20 K) because of the barrier differences.
The first hydrogenation is expected to takeplace at the outer edge carbon atom (Hirama et al.2004). This state provides more conformationalfreedom to the four neighbouring outer edge car-bon atoms, ensuring a preference for the secondhydrogenation to take place at one of those fourcarbon atoms. The third hydrogenation will pref-erentially take place at the outer edge carbon nextto the second H atom. Again, the forth H atomcan be bound to one of the four neighbouring outeredge carbon atoms, and the fifth sticks on theneighboring outer edge carbon. This scenario ofH atoms sticking preferentially on outer edge car-bons next to already adsorbed atoms is describedin Rauls & Hornekær (2008).
The contribution of every peak is determinedby fitting our data with Gaussians with identical
widths (see fig.4(a)). The ratios between differ-ent hydrogenation states as function of time arereported in fig.4(b). It appears that the ratiobetween the contribution of the first (CorH+)and the second (CorH+
2 ) hydrogenation statedoes not evolve with time for short time scales(
nCorH+
nCorH
+2
∼ 3 until 5s
)
. Also, the ratio between
the third (CorH+3 ) and the forth (CorH+
4 ) hy-drogenation state shows identical behaviour af-
ter t≥ 2s
(
nCorH
+3
nCorH
+4
∼ 3 from 2s onwards
)
. Before
this exposure time the nCorH+3
and nCorH+4
signals
are very weak, and the ratio is uncertain. Wecan therefore assume that for these measurementsd
dt
(nCorH
+2
nCorH+
)
= 0 and d
dt
(
nCorH
+3
nCorH
+3
)
= 0. The ex-
pression for the CorH+ to CorH+2 as well as for
the CorH+3 to CorH+
4 energy barriers can then bewritten as:
E2 = −kBTgas ln
A3
A2
1
1 +n
CorH+
nCorH
+2
(5)
E4 = −kBTgas ln
A5 + A3
nCorH
+2
nCorH3
+
A4
1
1 +n
CorH+3
nCorH4
+
(6)
From these expressions we derive the energybarrier E2 as 72±6 meV and E4 as 43±8 meV,as shown in fig.4(c). This shows that hydrogena-tion barriers are decreasing with increasing hydro-genation. However, our results also show that oddhydrogenated states dominate the mass spectrumeven for high degrees of hydrogenation (fig.3).This highlights the presence of a barrier-no bar-rier alternation from one hydrogenated state toanother, up to high hydrogenation states. So ourresults indicate that even if the hydrogenation bar-riers decrease for the first hydrogenations, they donot vanish completely and remain at higher hy-drogenation states. The barriers derived in ourstudy are similar to the one calculated by Rauls& Hornekær (2008) for neutral coronene. Thismeans that the first hydrogenations of coronenecations should be comparable to the hydrogena-tion of neutral coronene. However, for higher de-gree of hydrogenation we show that these barri-ers still exist, while the calculations from Rauls &
5

Hornekær (2008) predict that these barriers van-ish after a few hydrogenations. Recent mass spec-trometric measurements of coronene films exposedto H/D atoms do not show preferences for evenor odd hydrogenation states of neutral coronene(Thrower et al. 2012). However, these measure-ments are not very sensitive to barrier heights wellbellow 100 meV, since the experiments were per-formed with atoms at beam temperature of 170meV.
In PDRs exposed to UV fields less than fewhundreds G0, the spatial distribution of H2 andPAHs does correlate (Habart et al. 2003, Habartet al. 2005, Compiegne et al. 2007) contrary towhat is seen in the presence of strong UV fields(Tielens et al. 1993, Berne et al. 2009). The H2 for-mation rates have been derived for several PDRsexposed to various UV radiation fields. Theserates can be explained by the contribution of PAHsto the formation of H2 (Habart et al. 2004). De-pending on the UV intensity, the PAHs observedcan either be PAH cations, that are present inregions at low visual exctinctions AV, or neu-tral PAHs, which are located at higher extinc-tions. Work by Wolfire et al. (2008) and Spaans& Meijerink (2005) has shown that high-UV andhigh density PDRs (nH≥103 cm−3 and G0≥100 ,G0 = 1.6 × 10⁻³ erg cm−3 s−1) can maintain a ∼
30% cationic fraction upto a few mag in AV. Morerelevant to this work, Cox & Spaans (2006) havestudied low-UV PDRs (G0≤100), and followed thePAH charge balance for different densities, UV ra-diation fields and metallicities. They found thatPAH cations dominate over neutrals and anionsfor AV≤2 mag. The H2 formation rates observedin PDRs exposed to different UV fields can there-fore be partly attributed to neutral and cationicPAHs.
Our results show that the hydrogenation pro-cesses of neutral and cationic PAHs are similarand should contribute similarly to the formationof H2. Further experimental investigations will al-low us to derive the H2 formation rate for PAHcations.
4. Conclusions
We have investigated the addition of hydrogenatoms to coronene cations in the gas phase and ob-served increasing hydrogenation with H exposure
time. Our results show that odd hydrogenatedstates dominate the mass spectrum, which evi-dences the presence of a barrier for the furtherhydrogenation of odd hydrogenation states. Thefirst hydrogen sticks to the coronene cations with-out a barrier (Snow et al. 1998, Hirama et al.2004). The second and forth hydrogenations areassociated with barriers of about 72 ± 6 meV and43 ± 8 meV, while the third and fifth hydrogena-tion are barrierless. These barriers are similar tothe one calculated for neutral coronene (Rauls &Hornekær 2008). Our results indicate that super-hydrogenated PAH cations (Li & Draine (2012))should also be found in the interstellar medium,and be important catalysts for the formation ofH2, as it is the case for their neutral counterparts.
ACKNOWLEDGMENTS
L. B. and S. C. are supported by the Nether-lands Organization for Scientific Research (NWO).G.R. recognizes the funding by the NWO DutchAstrochemistry Network. We would like to thankthe anonymous referee for the helpful comments.
REFERENCES
Bachellerie, D., Sizun, M., Teillet-Billy, D.,Rougeau, N., & Sidis, V. 2007, ChemicalPhysics Letters, 448, 223
Bari, S., Gonzalez-Magana, O., Reitsma, G., et al.2011, The Journal of Chemical Physics, 134,024314
Bauschlicher, Jr., C. W. 1998, ApJ, 509, L125
Berne, O., Fuente, A., Goicoechea, J. R., et al.2009, ApJ, 706, L160
Bliek, F., Woestenenk, G., Hoekstra, R., & Mor-genstern, R. 1997, Hyperfine Interactions, 108,121
Cazaux, S., Morisset, S., Spaans, M., & Allouche,A. 2011, A&A, 535, A27
Compiegne, M., Abergel, A., Verstraete, L., et al.2007, A&A, 471, 205
Cox, N. L. J. & Spaans, M. 2006, A&A, 451, 973
Gould, R. J. & Salpeter, E. E. 1963, ApJ, 138, 393
6

296 298 300 302 304 306m/z (amu)
0.00
0.05
0.10
0.15
0.20
0.25
Signal strength (V)
a)t = 4s
0 1 2 3 4 5Irradiation time (s)
10-2
10-1
100
Line ratio
nCorH+2/nCorH+
1
nCorH+3/nCorH+
1
nCorH+4/nCorH+
3
nCorH+5/nCorH+
3
0 1 2 3 4 5Irradiation time (s)
0.00
0.02
0.04
0.06
0.08
0.10
0.12
Energy barrier (eV)
E2 = 72 meV
E4 = 43 meV
c)
Fig. 4.— a) Contribution of every peak determined by fitting our data with Gaussians with identical widths.b) Ratios between different hydrogenation states as function of time. c) Barrier heights for the second andfourth hydrogenations.
Habart, E., Abergel, A., Walmsley, C. M.,Teyssier, D., & Pety, J. 2005, A&A, 437, 177
Habart, E., Boulanger, F., Verstraete, L., et al.2003, A&A, 397, 623
Habart, E., Boulanger, F., Verstraete, L., Walms-ley, C. M., & Pineau des Forets, G. 2004, A&A,414, 531
Hirama, M., Tokosumi, T., Ishida, T., & ichi Ai-hara, J. 2004, Chemical Physics, 305, 307
Hoekstra, R., de Heer, F. J., & Morgenstern, R.1991, Journal of Physics B: Atomic, Molecularand Optical Physics, 24, 4025
Hornekær, L., Rauls, E., Xu, W., et al. 2006, Phys-ical Review Letters, 97, 186102
Le Page, V., Snow, T. P., & Bierbaum, V. M. 2009,ApJ, 704, 274
Li, A. & Draine, B. T. 2012, ArXiv e-prints,1210.6558
Martinazzo, R. & Tantardini, G. F. 2006, Journalof Chemical Physics, 124
Maziarz, E. 2005, Canadian Journal of Chemistry- Revue Canadienne de Chimie, 85, 1871
Mennella, V. 2006, ApJ, 647, L49
Mennella, V., Hornekær, L., Thrower, J., & Ac-colla, M. 2012, ApJ, 745, L2
Morisset, S., Aguillon, F., Sizun, M., & Sidis, V.2003, Chemical Physics Letters, 378, 615
Morisset, S., Aguillon, F., Sizun, M., & Sidis, V.2004b, The Journal of Physical Chemistry A,108, 8571
Oort, J. H. & van de Hulst, H. C. 1946, Bull. As-tron. Inst. Netherlands, 10, 187
Perry, J. S. A. & Price, S. D. 2003, Ap&SS, 285,769
Pirronello, V., Biham, O., Manico, G., Roser,J. E., & Vidali, G. 2000, in Molecular Hydro-gen in Space, ed. F. Combes & G. Pineau DesForets, 71–+
Pirronello, V., Liu, C., Roser, J. E., & Vidali, G.1999, A&A, 344, 681
Pirronello, V., Liu, C., Shen, L., & Vidali, G. 1997,ApJ, 475, L69+
Rauls, E. & Hornekær, L. 2008, ApJ, 679, 531
Rougeau, N., Teillet-Billy, D., & Sidis, V. 2006,Chemical Physics Letters, 431, 135
Sha, X. & Jackson, B. 2002, Surface Science, 496,318
Shah, M. B. & Gilbody, H. B. 1978, Journal ofPhysics B Atomic Molecular Physics, 11, 121
Snow, T. P., Le Page, V., Keheyan, Y., & Bier-baum, V. M. 1998, Nature, 391, 259
Spaans, M. & Meijerink, R. 2005, Ap&SS, 295,239
Spaans, M. & Silk, J. 2000, ApJ, 538, 115
7

Thrower, J. D., Jørgensen, B., Friis, E. E., et al.2012, ApJ, 752, 3
Tielens, A. G. G. M., Meixner, M. M., van derWerf, P. P., et al. 1993, Science, 262, 86
Weingartner, J. C. & Draine, B. T. 2001, ApJ,548, 296
Wolfire, M. G., Tielens, A. G. G. M., Hollenbach,D., & Kaufman, M. J. 2008, ApJ, 680, 384
Zecho, T., Guttler, A., Sha, X., Jackson, B., &Kuppers, J. 2002, J. Chem. Phys., 117, 8486
This 2-column preprint was prepared with the AAS LATEX
macros v5.2.
8