university of groningen late-type spiral galaxies ganda, katia · 2016-03-09 · katia ganda,...
TRANSCRIPT

University of Groningen
Late-type spiral galaxiesGanda, Katia
IMPORTANT NOTE: You are advised to consult the publisher's version (publisher's PDF) if you wish to cite fromit. Please check the document version below.
Document VersionPublisher's PDF, also known as Version of record
Publication date:2007
Link to publication in University of Groningen/UMCG research database
Citation for published version (APA):Ganda, K. (2007). Late-type spiral galaxies: kinematics and stellar populations in their inner regions.Groningen: s.n.
CopyrightOther than for strictly personal use, it is not permitted to download or to forward/distribute the text or part of it without the consent of theauthor(s) and/or copyright holder(s), unless the work is under an open content license (like Creative Commons).
Take-down policyIf you believe that this document breaches copyright please contact us providing details, and we will remove access to the work immediatelyand investigate your claim.
Downloaded from the University of Groningen/UMCG research database (Pure): http://www.rug.nl/research/portal. For technical reasons thenumber of authors shown on this cover page is limited to 10 maximum.
Download date: 04-07-2019

2Two-dimensional stellar and
emission-line kinematics of 18late-type spirals observed with
SAURONKatia Ganda, Jesus Falcon-Barroso, Reynier F. Peletier, Michele Cappellari, Eric
Emsellem, Richard M. McDermid, P. Tim de Zeeuw, C. Marcella Carollo
Based on MNRAS 2006, 367, 46
ABSTRACT — We present the stellar and gas kinematics of a sample of 18 nearbylate-type spiral galaxies (Hubble types ranging from Sb to Sd), observed with the integral-field spectrograph SAURON at the 4.2-m William Herschel Telescope. SAURON covers thespectral range 4800-5380 A, allowing us to measure the Hβ, Fe, Mgb absorption featuresand the emission in the Hβ line and the [OIII]λλ4959,5007A and [NI]λλ5198,5200Adoublets over a 33′′
× 41′′ field of view. The maps cover the nuclear region of these late-type galaxies and in all cases include the entire bulge. In many cases the stellar kinematicssuggests the presence of a cold inner region, as visible from a central drop in the stellarvelocity dispersion. The ionized gas is almost ubiquitous and behaves in a complicatedfashion: the gas velocity fields often display more features than the stellar ones, includingwiggles in the zero-velocity lines, irregular distributions, ring-like structures. The lineratio [OIII]/Hβ often takes on low values over most of the field, probably indicating awide-spread star formation.
2.1 INTRODUCTIONFrom a theoretical point of view, we have a well-defined paradigm for the formation of discgalaxies within the Cold Dark Matter (CDM) hierarchical structure formation scenario (Fall& Efstathiou 1980, Silk 2003): discs quietly settle and cool inside dark matter haloes, while

24 CHAPTER 2: STELLAR AND EMISSION-LINE KINEMATICS
bulges form through mergers of multiple haloes. However, some of the observed proper-ties of spiral galaxies suggest a larger complexity in their formation history. The presenceof bulges is not ubiquitous and their nature can be ambiguous. Evidence has accumulatedin the past years showing that many bulges have a disc-like, sometimes exponential radialfall-off of the stellar density (Andredakis & Sanders 1994, Andredakis, Peletier & Balcells1995, de Jong 1995, Courteau, de Jong & Broeils 1996, Carollo & Stiavelli 1998, Seigar etal. 2002, MacArthur, Courteau & Holtzmann 2003). Numerical simulations seem to suggestthat the dissolution of bars inside the discs may trigger the formation of three-dimensionalstellar structures with roughly exponential profiles (Pfenniger & Norman 1990, Combes et al.1990, Raha et al. 1991, Norman, Sellwood, Hasan 1996); this could mean that some bulgesform through the evolution of dynamical instabilities in the disc. Quite recently, the qualityof imaging data made available through HST boosted the study of the inner regions of spi-ral galaxies, showing that they can host a variety of structures: bulges, nuclear star clusters,stellar discs, small bars, double bars, star forming rings (Carollo et al. 1997, Carollo et al.1998, Carollo, Stiavelli & Mack 1998, Carollo 1999, Perez-Ramırez et al. 2000, Carollo etal. 2002, Boker et al. 2002, Laine et al. 2002, Falcon-Barroso et al. 2005, Allard et al. 2005),without there being an agreement about their origin and evolutionary pattern. Ongoing largeprojects like the panchromatic SINGS survey (Kennicutt et al. 2003) which makes use ofobservations at infrared, visible and ultraviolet wavelengths represent a very useful approachto building a comprehensive picture of galactic structure, but at the moment rely mostly onimaging. Looking at disc galaxies from a spectroscopic perspective would add kinematicinformation and insight into stellar populations which cannot come from imaging, and couldhelp us tracing their star formation and mass assembly histories.
Contrary to the massive spheroids, the stellar populations and kinematics of late-typedisc-dominated galaxies are poorly known, due to the difficulty of reliably measuring andinterpreting such diagnostics in low surface brightness environments which are so full ofdust, star formation and substructures: not much attention has been paid to the spectroscopiccounterpart of all the mentioned imaging that has been carried out. There are a few excep-tions to this statement: Boker et al. (2001) started a project on STIS long-slit spectroscopyof 77 nearby late-type spiral galaxies previously imaged with HST/WFPC2; first results arediscussed in Boker et al. (2003); Walcher et al. (2005) analysed UV slit-spectroscopy of thenuclei of nine late-type spirals; these studies are mainly focused on the nature of the inner-most components, in particular on the nuclear star clusters.
We are currently engaged in a study aimed at investigating the properties of the nuclearregions of very late-type galaxies. In such environments, long-slit spectra are too limited tobe useful for modeling and interpretation and have generally been used only to discuss theproperties of emission-lines (see for example Matthews & Gallagher 2002, who measure theposition-velocity curve of 21 extreme late-type spiral galaxies using the Hα emission-line).Here we present deep integral-field spectroscopy that not only makes it easier to study thekinematics and physical properties of stars and gas, but also allows to study and model thestellar populations.
We were granted 6 nights at the William Herschel Telescope (WHT) of the Observatoriodel Roque de los Muchachos in La Palma, Spain, to obtain two-dimensional spectroscopywith the integral-field spectrograph SAURON, which was custom-built for a representativecensus of elliptical and lenticular galaxies, and Sa bulges (the so-called SAURON survey, seeBacon et al. 2001, de Zeeuw et al. 2002, hereafter, respectively, Paper I, Paper II). The present

THE SAMPLE 25
work can be regarded as a natural extension of the SAURON survey towards the end of theHubble sequence. Our purpose was to use SAURON in order to map the stellar and gaseous(Hβ, [OIII], [NI]) kinematics and the absorption line-strength distributions of the indices Hβ,Mg, Fe, in the region 4800-5380A. In this chapter we present the observations and data re-duction and the resulting kinematical maps for 18 Sb-Sd galaxies. The data and maps will bemade available via the SAURON website (http://www.strw.leidenuniv.nl/sauron).
The chapter is structured as follows. Section 2.2 describes the sample selection and char-acteristics; Section 2.3 summarizes the observations and data reduction; Section 2.4 describesthe methods applied to calculate the stellar and gaseous kinematics from our spectra; Section2.5 carries out a comparison with previous measurements; Section 2.6 presents and discussthe kinematical maps and looks in particular at the behaviour of the stellar velocity disper-sion. Finally, Section 2.7 summarizes the results. Detailed modeling and interpretation of thedata will come in the following chapters and in future papers.
2.2 THE SAMPLEOur sample galaxies were optically selected (BT < 12.5, according to the values given inde Vaucouleurs et al. 1991, hereafter RC3) with HST imaging available from WFPC2 and/orNICMOS. In practise, the galaxies were chosen from objects lists of recent imaging projectswith HST (Carollo et al. 1997, 1998, 2002, Laine et al. 2002, Boker et al. 2002). Theirmorphological type ranges between Sb and Sd, following the classification reported in NED∗
(from the RC3). Galaxies in close interaction and Seyferts were discarded. Only galaxieswith 0 <RA< 15h and δ > −20◦ were selected, to fulfill a visibility criterion during theallocated nights. The resulting sample contains 18 nearby galaxies.
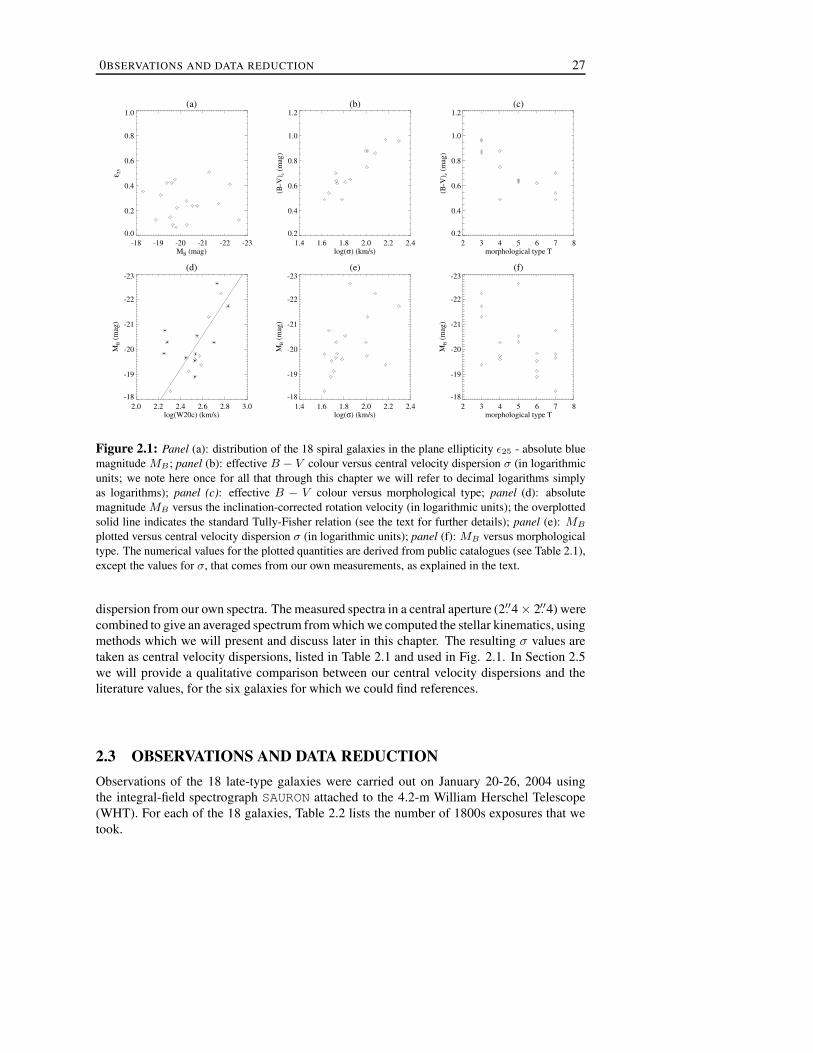
In Table 2.1 we list properties already measured and available through public catalogues,while in Fig. 2.1 we represent graphically the range spanned by our sample galaxies in anumber of global and nuclear properties. This can be useful for a visual comparison withthe galaxies of the SAURON survey (see Fig. 1 and Fig. 3 of Paper II). Panel (a) shows thedistribution of the selected galaxies in the plane (ε25, MB) . MB is the absolute magnitudein the B− band and ε25 is the ellipticity, derived from the axial ratio at the 25 mag arcsec−2
isophotal level inB. This panel shows that there is a lack of high-ellipticity objects, indicatingthat our disc galaxies are generally far from being edge-on systems. Panel (b) plots theeffective B − V colour versus the central velocity dispersion σ; a relatively tight trend isrecognizable, since galaxies with higher velocity dispersions tend to be redder. Panel (c) plotsthe effective B − V colour versus the morphological type; colours become bluer with latertypes. Panel (d) shows the distribution of our galaxies in the Tully-Fisher plane: MB versusthe inclination-corrected rotation velocity, obtained asW20c
= W20/ sin(i), whereW20 is the21-cm line width at 20 percent of the peak and i the inclination between the line-of-sight andthe polar axis. The overplotted solid line represents the Tully-Fisher relation, as determinedby Verheijen (2001) for the B− band from a sample of 45 galaxies with measured HI globalprofile: MB = − 2.91− 6.8 log(W20c
). In the figure, all the galaxies with inclination below45◦ are marked with an asterisk, since the reported relation was established on the basisof higher inclination objects: one can see that all the galaxies that deviate most from theoverplotted solid line have low-inclination, although not all of the low-inclination galaxiesare deviant. Panel (e) presents the relation between total luminosity (absolute blue magnitude
∗http://nedwww.ipac.caltech.edu .

26 CHAPTER 2: STELLAR AND EMISSION-LINE KINEMATICS
NGC Type T V21 MB (B-V )e d25 Re ε25 i PA σ W20c
(1) (2) (3) (4) (5) (6) (7) (8) (9) (10) (11) (12) (13)488 SA(r)b 3.0 2269 -21.71 0.96 315 52 0.260 42 15 196 675628 SA(s)c 5.0 656 -20.29 0.64 629 144 0.088 24 25 54 190772 SA(s)b 3.0 2458 -22.23 0.86 435 77 0.411 54 130 120 583864 SAB(rs)c 5.0 1560 -20.54 0.63 281 97 0.241 41 20 65 3561042 SAB(rs)cd 6.0 1373 -19.83 0.62 281 95 0.224 39 43g 55 1792805 SAB(rs)d 7.0 1734 -20.75 0.54 379 128 0.241 41 125 46 1812964 SAB(r)bc 4.0 1321 -19.74 0.75 173 26 0.451 57 97 101 3723346 SB(rs)cd 6.0 1260 -18.89 173 0.129 29 111g 48 3383423 SA(s)cd 6.0 1011 -19.54 228 36 0.149 32 10 49 3373949 SA(s)bc 4.0 798 -19.60 0.49L 173 0.425 55 120 61 3384030 SA(s)bc 4.0 1460 -20.27 0.88L 250 0.276 44 27 100 5034102 SAB(s)b? 3.0 837 -19.38 0.97L 181 0.425 55 38 150 3854254 SA(s)c 5.0 2407 -22.63 0.65 322 56 0.129 29 62g 72 5374487 SAB(rs)cd 6.0 1037 -19.12 250 0.324 47 75 51 2974775 SA(s)d 7.0 1567 -19.81 128 0.067 21 52g 42 3425585 SAB(s)d 7.0 305 -18.32 0.49 345 102 0.354 50 30 42 2045668 SA(s)d 7.0 1583 -19.65 0.70 199 38 0.088 24 164g 53 2805678 SAB(rs)b 3.0 1922 -21.30 0.88L 199 0.510 61 5 103 452
Table 2.1: Properties of our 18 galaxies. (1) Galaxy identifier. (2) Hubble type (RC3 through NED).(3) Numerical morphological type (RC3). (4) Heliocentric neutral hydrogen velocity in km s−1 (RC3,via VizieR). (5) Absolute blue magnitude MB in mag (quoted from HyperLeda), computed from thecorrected apparent magnitude and the distance modulus (also listed in HyperLeda); a Virgocentric flowmodel with vvirgo = 208 km s−1, an Hubble constant H0 = 70 km s−1 Mpc−1 and the correction to theLocal Group centroid of Yahil et al. (1977) are adopted. (6) Effective (B − V )e colour in mag; valuesmarked with ‘L’ have been taken from HyperLeda, the others from RC3. (7) Projected diameter at theisophotal level of 25 mag arcsec−2 in the B− band, in arcsec (RC3). (8) Effective radius Re in theB− band, in arcsec (RC3). (9) Ellipticity ε25 of the contour of 25 mag arcsec−2 B surface brightness(RC3). (10) Disc inclination in degrees, calculated from the axis ratio listed in RC3. (11) Positionangle of the major axis, in degrees (RC3); values marked with ‘g’ are taken from Grosbøl (1985). (12)Central velocity dispersion σ in km s−1, from our own measurement (averaging the spectra in a central2.′′4 × 2.′′4 aperture and measuring the kinematics on the resulting spectrum, as explained in the text).(13) Width of the 21-cm neutral hydrogen line at 20 percent of the peak in km s−1 (RC3), corrected forthe disc inclination, as listed in column (10).
MB) and central velocity dispersion; the galaxies cover a range of ≈ 100 in luminosityand a factor ≈ 5 in velocity dispersion and become more luminous with increasing velocitydispersion. To conclude, panel (f) plots MB against the morphological type; the luminositytends to decrease as the galaxies become later in type, as shown also by de Jong (1996b).The quantities plotted in this figure are all derived from catalogues, mainly from RC3 andHyperLeda†, (for a description and a list of references, see caption to Table 2.1), except for thecentral velocity dispersion. Since previously existing central velocity dispersion values areavailable only for six of the galaxies in our sample, we decided to measure the central velocity
†http://leda.univ-lyon1.fr .
0BSERVATIONS AND DATA REDUCTION 27
(a)
-18 -19 -20 -21 -22 -23MB (mag)
0.0
0.2
0.4
0.6
0.8
1.0ε 2
5
(b)
1.4 1.6 1.8 2.0 2.2 2.4log(σ) (km/s)
0.2
0.4
0.6
0.8
1.0
1.2
(B-V
) e (m
ag)
(c)
2 3 4 5 6 7 8morphological type T
0.2
0.4
0.6
0.8
1.0
1.2
(B-V
) e (m
ag)
(d)
2.0 2.2 2.4 2.6 2.8 3.0log(W20c) (km/s)
-18
-19
-20
-21
-22
-23
MB (
mag
)
(e)
1.4 1.6 1.8 2.0 2.2 2.4log(σ) (km/s)
-18
-19
-20
-21
-22
-23M
B (m
ag)
(f)
2 3 4 5 6 7 8morphological type T
-18
-19
-20
-21
-22
-23
MB (
mag
)Figure 2.1: Panel (a): distribution of the 18 spiral galaxies in the plane ellipticity ε25 - absolute bluemagnitude MB ; panel (b): effective B − V colour versus central velocity dispersion σ (in logarithmicunits; we note here once for all that through this chapter we will refer to decimal logarithms simplyas logarithms); panel (c): effective B − V colour versus morphological type; panel (d): absolutemagnitude MB versus the inclination-corrected rotation velocity (in logarithmic units); the overplottedsolid line indicates the standard Tully-Fisher relation (see the text for further details); panel (e): MB
plotted versus central velocity dispersion σ (in logarithmic units); panel (f): MB versus morphologicaltype. The numerical values for the plotted quantities are derived from public catalogues (see Table 2.1),except the values for σ, that comes from our own measurements, as explained in the text.
dispersion from our own spectra. The measured spectra in a central aperture (2.′′4 × 2.′′4) werecombined to give an averaged spectrum from which we computed the stellar kinematics, usingmethods which we will present and discuss later in this chapter. The resulting σ values aretaken as central velocity dispersions, listed in Table 2.1 and used in Fig. 2.1. In Section 2.5we will provide a qualitative comparison between our central velocity dispersions and theliterature values, for the six galaxies for which we could find references.
2.3 OBSERVATIONS AND DATA REDUCTIONObservations of the 18 late-type galaxies were carried out on January 20-26, 2004 usingthe integral-field spectrograph SAURON attached to the 4.2-m William Herschel Telescope(WHT). For each of the 18 galaxies, Table 2.2 lists the number of 1800s exposures that wetook.

28 CHAPTER 2: STELLAR AND EMISSION-LINE KINEMATICS
NGC # NGC #488 3 3949 3628 1+4a 4030 5772 5 4102 5864 4 4254 2
1042 4 4487 42805 6 4775 42964 2 5585 53346 6 5668 53423 6 5678 4
Table 2.2: Number of exposures of 1800 s each per galaxy. Note a: for the first exposure of NGC 628we pointed the telescope on a star offset by ≈ 13′′ with respect to the galaxy centre; so we have 2slightly different pointings on this galaxy.
We used the low spatial resolution mode of SAURON, giving a field of view (FoV) of 33′′
× 41′′. The spatial sampling of individual exposures is determined by an array of 0.′′94 ×0.′′94 square lenses. This produces 1431 spectra per pointing over the SAURON FoV; another146 lenses sample a region 1.′9 away from the main field in order to measure simultaneouslythe sky background. SAURON delivers a spectral resolution of 4.2 A FWHM and covers thenarrow spectral range 4800-5380 A (1.1 A per pixel). This wavelength range includes anumber of important stellar absorption-lines (i.e. Hβ, Fe, Mgb) and potential emission-linesas well (Hβ, [OIII], [NI]). For a more exhaustive description of the instrument, see Paper Iand in particular Table 1 there.
For each galaxy, two to six largely overlapping exposures of 1800s were typically ob-tained (Table 2.2). An offset of a few arcseconds, which corresponds to a few spatial el-ements, was introduced between consecutive exposures to avoid systematic errors due forexample to bad CCD regions. Fig. 2.2 outlines the (approximate) position of the SAURONpointings overlaid on R− band Digital Sky Survey images of our galaxies, showing that ourobservations cover the nuclear regions.
2.3.1 Data reductionWe reduced the SAURON observations using the dedicated software XSAURON developed atCRAL (Paper I). During the observing run, arc exposures were taken before and after eachgalaxy exposure for wavelength calibration purposes. Tungsten lamp exposures were alsotaken every night in order to build the extraction mask. At the telescope we had a misalign-ment of ≈ 1◦ between the columns of the CCD and the dispersion direction. To correct forthis misalignment and avoid interference patterns due to uneven sampling of the data, wedecided to rectify the spectra by rotating all of the frames by the same amount (≈ 1◦) and inthe opposite sense to the mentioned misalignment, at a very early stage of the reduction, bymeans of the IRAF‡ tasks geomap and geotran, available from the images.immatchpackage. The reduction steps include thus bias and dark subtraction, rotation of all the frames,extraction of the spectra using the fitted mask model, wavelength calibration, low-frequency
‡IRAF is distributed by the National Optical Astronomy Observatories, which are operated by the Association ofUniversities for Research in Astronomy, Inc., under cooperative agreement with the National Science Foundation.

0BSERVATIONS AND DATA REDUCTION 29
Figure 2.2: R− band Digital Sky Survey images of all 18 late-type spirals in the sample. The size ofeach image is 4′
× 4′ and the orientation is such that North is up and East is left. Overplotted on eachimage are the positions of the SAURON pointings. The small bar at the bottom-left corner of each imagecorresponds to the linear length of 1 kpc; when the effective radius is available from RC3 (Table 2.1),another bar indicating the size of 1 Re is provided, above the 1 kpc bar.
30 CHAPTER 2: STELLAR AND EMISSION-LINE KINEMATICS
flat-fielding, cosmic-ray removal, homogeneization of the spectral resolution over the fieldof view, sky subtraction and flux calibration of the spectra, although the data were not nec-essarily collected under photometric conditions. The individually extracted and calibrateddatacubes were finally merged by truncating the wavelength domain to a common range,recentering the exposures using reconstructed images and combining the spectra, while cor-recting also for the effect of atmospheric refraction. In this process, the datacubes werespatially resampled to a common grid, so that the final merged datacube is sampled on to arectangular grid with 0.′′8 × 0.′′8 pixels. The improvement in spatial sampling with respect tothe individual datacubes is due to the dithering of exposures.
2.4 ANALYSIS AND METHODSIn order to ensure the measurement of reliable stellar kinematics, we spatially binned ourmerged datacubes using the Voronoi 2D binning algorithm of Cappellari & Copin (2003),creating compact bins with a minimum signal-to-noise ratio (S/N)? ≈ 60 per resolutionelement. However, most of the spectra in the central regions have a (S/N)? greater than 60,so a large fraction of the original spatial elements remains unbinned.
2.4.1 Stellar kinematicsWe measured the stellar kinematics on each spectrum in our binned datacubes using the pe-nalized pixel fitting (pPXF) method by Cappellari & Emsellem (2004). A linear combinationof template stellar spectra, convolved with a line-of-sight velocity distribution (LOSVD) de-scribed as a Gauss-Hermite expansion (van der Marel & Franx 1993, Gerhard 1993), is fittedto each galaxy spectrum by χ2 minimization in pixel space, using a penalty term to suppressnoise. While fitting, the spectral regions that are potentially affected by nebular emission (cor-responding to the Hβ, [OIII], [NI] lines) are masked out. A low-order polynomial (generallyof order six) is also included in the fit to account for small differences in the flux calibrationbetween the galaxy and the template spectra. This allows us to derive the mean velocity (V ),velocity dispersion (σ) and the higher order Gauss-Hermite moments (h3 and h4). As stellartemplates we used a library of single-age, single-metallicity population models (SSP) fromVazdekis (1999), from which we selected 39 models characterised by 1.00 ≤ Age ≤ 17.78Gyr, -1.68 ≤ [Fe/H] ≤ +0.20. This is similar to what has been done by Falcon-Barroso et al.(2005, hereafter Paper VII) for the analysis of the 24 Sa galaxies part of the SAURON survey.
As we will show in Section 2.6, our galaxies display stellar velocity dispersions oftenlower than those measured in the early-type galaxies of the SAURON survey (Emsellem et al.2004, hereafter Paper III). SAURON has an instrumental dispersion of 108 km s−1, while ourmeasured velocity dispersions are in many cases below that level (see the central values forσ listed in Table 2.1). Thus, one might be concerned that velocity dispersions significantlybelow the instrumental dispersion cannot be reliably measured . This issue has already beenaddressed in Paper III: it reports tests of the uncertainties on the measured σ via Monte-Carlosimulations which prove that for a spectrum with (S/N)? ≈ 60 and σ ≈ 50 km s−1, thepPXF method will output velocity dispersions differing from the intrinsic one by no morethan 10 km s−1, a value within the measured error.
Another technical issue related to the low velocity dispersion values is that when theobserved velocity dispersion is less than about 2 pixels (σ ≤ 120 km s−1) it becomes moredifficult to measure the Gauss-Hermite moments h3 and h4 at our minimum (S/N)? ≈ 60; in

ANALYSIS AND METHODS 31
those cases the penalization in pPXF then biases the solutions towards a Gaussian (Cappellari& Emsellem 2004). In practise one expects the measured higher moments to be significantonly in the galactic regions where the velocity dispersion or (S/N)? are high.
2.4.2 Gas kinematicsNebular emission is almost ubiquitous in our sample of 18 spiral galaxies. Thus we havedecided to apply a ‘double-binning scheme’, in order to compute the gas kinematics on binssmaller than the ones with (S/N)? = 60 on which we calculated the stellar kinematics asdescribed above. The large amount of gas in fact allows us to reliably measure the kinematicsof emission-lines at a lower signal-to-noise level, and having smaller bins prevents loss ofspatial resolution, especially in the outer regions. To do this, we proceed as follows.
We call ‘star-bins’ the previously introduced Voronoi-bins with minimum (S/N)? = 60.We first reconstruct the gas map by running pPXF on each single unbinned spectrum (single-lens spectrum) keeping fixed the stellar kinematics at the values determined for the star-bin towhich the spectrum belongs, thus fitting only for the stellar template and polynomial coeffi-cients; this is done again by masking out the spectral regions potentially affected by emission.We recover the gas spectrum by subtracting the best-fit from the original spectrum. For eachgas spectrum we compute the signal-to-noise of the [OIII] line, (S/N)gas, taking the peakof the considered gas spectrum over the [OIII] region and dividing by the noise, calculatedon the gas spectrum over the emission-free part of the SAURON range. For the (S/N)gas
determination we could have used one of the other emission-lines in the SAURON spectralrange, i.e. Hβ or [NI], but they both present disadvantages compared to [OIII]. In fact, thelines of the [NI] doublet are normally quite weak, and it is difficult to measure their kine-matics and amplitude; the Hβ emission can instead be contaminated by stellar absorption atthe same wavelength. At this stage, we bin the merged datacube to a minimum (S/N)gas of5, according to the (S/N)gas values found for each single gas spectrum. We end up with a‘gas-binned’ datacube. We call these bins ‘gas-bins’.
In a second step, we determine the gas kinematics for each gas-bin. We proceed by run-ning pPXF on the average of all the star-bins spectra that have some spatial intersection withthe considered gas-bin. This is the input stellar kinematics for our determination of the gaskinematics.
The actual computation of the gas kinematics parameters requires a careful separation ofthe line emission from the stellar absorption. We follow the procedure described in Sarziet al. 2005 (hereafter Paper V) and in Paper VII, that has been fully tested on the SAURONsurvey galaxies. For each gas-bin spectrum, the method relies on an iterative search for theemission-lines velocities and velocity dispersions, while linearly solving at each step for theline amplitudes and the optimal combination of the stellar templates. The fit is performedover each ‘gas-binned’ spectrum, and no masking is applied, in contrast to the stellar kine-matics determination. A multiplicative Legendre polynomial of order six is included in thefit to correct for small differences in the flux calibration between the galaxy spectrum and thelibrary of models.
Most of our galaxies have conspicuous gas emission, so we proceed by fitting the Hβ and[OIII] lines independently, in order to detect differences in the kinematics of the two lines, ifpresent. The [NI] lines are instead forced to share the same kinematics with Hβ (see Paper Vand Paper VII for details on the method).
32 CHAPTER 2: STELLAR AND EMISSION-LINE KINEMATICS
NGC4102 − (1)
4900 5000 5100 5200λ (Å)
flux
(10−1
6 cm
−2 s−1
)
NGC4102 − (2)
4900 5000 5100 5200λ(Å)
flux
(10−1
6 cm
−2 s−1
)
−10 0 10 20arcsec
−20
−10
0
10
Log([OIII])
2
1
−17.
3 / −
14.5
−20
−10
0
10
arcs
ec
Log([OIII])
2
1
−17.
3 / −
14.5
−10 0 10 20arcsec
−20
−10
0
10
arcs
ec
V[OIII]
2
1
−180
/ 18
0
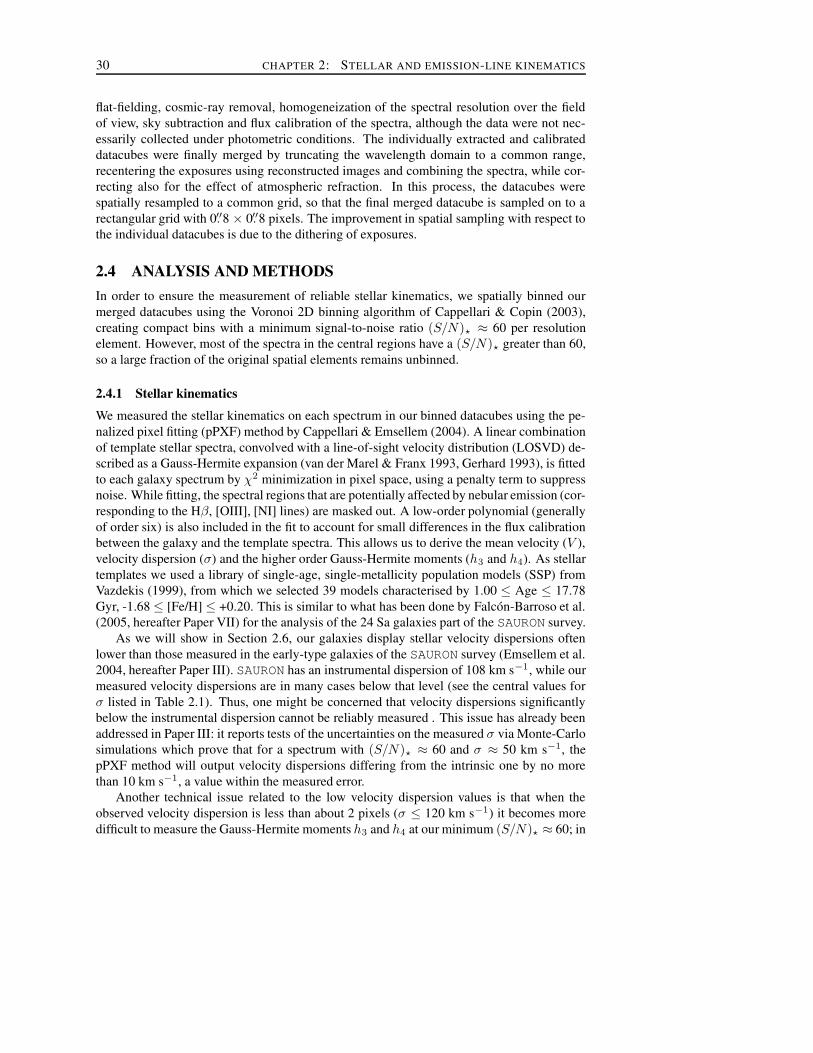
Figure 2.3: (Colour version in Colour Appendix). Top left panel: we show for NGC 4102 a spec-trum where the [OIII] lines are only badly fitted by a single Gaussian; the black solid line represents thegalaxy spectrum; the red line is the full spectrum fit; the green solid line is the best-fitting combinationof stellar templates, convolved with the kinematics; at the bottom of the panel, the purple line is thepure emission spectrum and the black dotted line represents the residuals from the fit; a constant hasbeen added to both. Along the vertical axis, the flux is in units of 10−16 erg cm−2 s−1. Top right panel:we show a spectrum for the same galaxy without deviations from Gaussianity in the line profiles. Thisis an example of the typical behaviour of our spectra and also illustrates the quality of fit that we obtain.Bottom row: the [OIII] flux (in erg cm−2 s−1 and logarithmic scale) and velocity (in km s−1) mapsare shown (bottom left and right panels respectively); the location of the two representative spectra ismarked on the maps with a dot. For a description of the maps, we refer the reader to Section 2.6.1. Thementioned colours refer to the version of the figure that the reader can find in the Colour Appendix.
We have visually inspected the emission-line profiles in our datacubes in order to assess theapplicability of our fitting method, which fits a single Gaussian profile to each line in theSAURON wavelength range. In the large majority of cases, we did not find deviations frompure Gaussians. Only NGC 2964 and 4102 present complex line profiles, but limited to spe-cific regions possibly related to activity (see the description of individual objects in Section2.6.4). This lack of complex line profiles may well be caused by the limited instrumentalspectral resolution. For completeness, in Fig. 2.3 (see also the Colour Appendix) we showfor NGC 4102 a spectrum where the [OIII] 5007 A line does not resemble a single Gaussianand a spectrum where the line profiles instead do not differ from the Gaussian fit; we showalso the [OIII] flux and velocity maps, in order to spatially locate the mentioned spectra.

COMPARISON WITH PUBLISHED MEASUREMENTS 33
2.5 COMPARISON WITH PUBLISHED MEASUREMENTSThe methods described in the previous sections were used to measure the stellar and gaseouskinematics and the amount of gas emission for the 72 galaxies of the SAURON survey (PaperIII, Paper V, Paper VII). The quoted papers showed that the methods give results in agree-ment with previous measurements.
We also carried out a direct comparison with previous work. As already mentioned inSection 2.2, measurements of the stellar velocity dispersion are available for one third of oursample. In addition, those few references are very heterogeneous and in some cases do notgive all the information required to perform a careful and systematic comparison. In anycase, we can qualitatively investigate the agreement of the central aperture velocity disper-sion listed in Table 2.1 with the literature. The left panel of Fig. 2.4 plots our measurementsagainst the average of the existing values§ (if more than one). Uncertainties in the literaturevalues are taken from the references; as for our own measurements, we give an estimate ofthe errors by running pPXF on the single-lens spectra within our aperture and looking at thescatter in the resulting velocity dispersions. The agreement is generally satisfactory; the onlydeviant galaxy is NGC 4254, for which the only references we could find date back from the1980’s (Whitmore, Kirshner & Schechter 1979, Tonry & Davies 1981).
In the case of the gas measurements, as a source for our literature comparison we choosethe Palomar spectroscopic survey of Ho, Filippenko & Sargent (1995, 1997a), which includes11 out of our 18 galaxies. We compare the [OIII]/Hβ line ratio and the width of the forbid-den emission, represented by the [OIII] and [NII] 6583A lines of the SAURON and Palomarsamples respectively. To perform a proper comparison, we measured the [OIII]/Hβ line ratioand [OIII] FWHM on central spectra obtained extracting from our datacubes a central aper-ture that matches the size (2′′ × 4′′) and orientation of the Palomar long-slit observations.Uncertainties in the [NII] FWHM in the Palomar survey are typically ≈ 10 percent, exceptfor NGC 3346 and 3949, where Ho et al. (1997a) report only the 3σ upper limit; for the[OIII]/Hβ line ratio, the quoted uncertainties are around 30-40 percent, except the case ofNGC 488, where the uncertainty is ≈ 50 percent. For our SAURON data, errors on the [OIII]line width come from the fitting procedure and vary percentually from galaxy to galaxy, whilean upper limit on the uncertainties on the [OIII]/Hβ line ratio comes from the typical errorson the line fluxes estimate given in Paper V.
The central panel of Fig. 2.4 plots the SAURON against Palomar [OIII]/Hβ line ratio. Theagreement appears to be reasonable, with all the galaxies lying on the 1:1 relation (indicatedin the figure by the solid line) within the error bar, with the exception of NGC 3949. Theright panel compares the FWHMs of the forbidden lines, and the agreement appears to beless satisfactory. In particular, NGC 4102 lies well above the 1:1 relation; this is due to thebroadening of the [OIII] lines in this galaxy, where the single Gaussian used in our methodfails to reproduce the line profile, as demonstrated at the end of the previous section. Westress the fact that the Palomar slit was oriented in the direction of the galactic region wherethe lines are double-peaked (see Section 2.4.2 and 2.6.4): our extracted aperture samples thenthat region and thus it is not a surprise that the comparison is not very accurate. In fact, atight correlation between the widths of the [OIII] and [NII] lines is expected if the lines areproduced in low-density regions (Ho et al. 1997a), and it is not clear that this condition issatisfied in all objects.
§From Shapiro et al. (2003) for NGC 4030 and from HyperLeda for NGC 488, 628, 772, 2964 and 4254.

34 CHAPTER 2: STELLAR AND EMISSION-LINE KINEMATICS
0 50 100 150 200 250σ[literature]
0
50
100
150
200
250σ[
SAU
RON
]
488
628
772
296440304254
0.0 0.5 1.0 1.5 2.0[OIII]/Hβ[Palomar]
0.0
0.5
1.0
1.5
2.0
[OIII
]/Hβ[
SAU
RON
]
488
772
86429643346
34233949
41024254
5585
5678
0 100 200 300 400 500FWHM([NII])[Palomar]
0
100
200
300
400
500
FWH
M([O
III])[
SAU
RON
]
488
772
864
2964
334634233949
4102
4254
5585
5678
Figure 2.4: Literature comparison for stars (left panel) and gas measurements (central and right pan-els). Left panel: SAURON against literature central stellar velocity dispersion (in km s−1); middlepanel: SAURON against Palomar [OIII]/Hβ line ratio; right panel: SAURON against Palomar forbiddenline width (in km s−1). In each of the plots, the overplotted solid line marks the 1:1 relation and theNGC galaxy identifiers are indicated close to the corresponding symbol; see the text for further details.
2.6 OBSERVED STELLAR AND GAS KINEMATICSThis section presents our results for the 18 spiral galaxies and points out and briefly describessome interesting features detectable in the maps. We first show the maps (Section 2.6.1 andColour Appendix at the end of the Thesis), then discuss some properties of the stellar andgaseous kinematics of the sample as a whole (Sections 2.6.2 and 2.6.3), and in the end give adetailed description of the individual galaxies (Section 2.6.4).
2.6.1 Stellar and gas flux and kinematics: the mapsFigures 2.5a-2.5r (Fig. 2.5a below; for a colour version of it and for all Figs. 2.5b-2.5r see theColour Appendix) present the flux and kinematical maps of stars and gas for our sample of18 spiral galaxies, obtained as explained in Sections 2.4.1 and 2.4.2. For each object, in thefirst row we give the unsharp-masked optical image of the galaxy from HST¶ together withthe UGC number when available, the FK5 2000 coordinates, the absolute blue magnitude,the ellipticity and the morphological type; NGC 772 represents an exception in that respect,since an optical space-based image is not available: we therefore show the unsharp-maskedSAURON image instead; the second row contains the total intensity reconstructed by col-lapsing the SAURON spectra in the wavelength direction (in mag arcsec−2, with an arbitraryzero point), and the stellar velocity and velocity dispersion (in km s−1); the third and fourthrows contain respectively the Hβ and [OIII] flux (in erg cm−2 s−1 and logarithmic scale)and kinematics (velocity and velocity dispersion, in km s−1); finally, the fifth row presentsthe line ratio [OIII]/Hβ, in logarithmic scale, and the stellar h3 and h4 kinematical moments.Overplotted on each map are the isophotal contours. All the plotted velocities are systemicvelocity subtracted; the same systemic velocity is assumed for stars and gas. No inclinationcorrection to the kinematics has been applied, thus the plotted velocities are in all cases pro-jected velocities. The stellar kinematics is shown on the (S/N)? = 60 star-bins, while thegas parameters are plotted on the (S/N)gas = 5 gas-bins. In each figure, the arrow and its
¶We used WFPC2 images taken with the F606W filter for NGC 488, 628, 864, 1042, 2964, 3423, 3949, 4030,4102, 4254, 4487, 5585, 5678 and with the F814W filter for NGC 2805, 3346, 4775, 5668.

OBSERVED STELLAR AND GAS KINEMATICS 35
associated dash at the top of the page, close to the galaxy name, indicate the orientation ofthe maps, pointing to the North and East directions respectively.
To display the gas maps, we have chosen to consider as real a detection of emission whenthe amplitude over noise ratio (hereafter A/N) of the line, defined as the fitted emission am-plitude divided by the noise in the residual spectrum (galaxy spectrum − best-fit over thewhole SAURON range), is larger than 4 (see also Paper V, Paper VII). The bins below thisthreshold are displayed using a dark grey colour. Despite this cut in A/N, the gas detectioncovers in most cases a very large fraction of the SAURON field.
In NGC 4030 and 4102 we detected also significant emission from the [NI] doublet; how-ever, in the large majority of our galaxies [NI] is very weak and hard to measure: since wewould not learn more about our galaxies considering also the [NI] maps, we decided not toinclude them in Figs. 2.5a-2.5r.

36 CHAPTER 2: STELLAR AND EMISSION-LINE KINEMATICS
-10
0
10
arcs
ec
NGC488[UGC907]
α=01h 21m 47s δ=+05d 15.3m 0s
MB= -21.71 ε= 0.26 Sb
-10
0
10
arcs
ec
V-band Flux
-150
/ 15
0
VSTARS σSTARS
120
/ 199
-10
0
10
arcs
ec
Log(Hβ)
-10
0
10
arcs
ec
-18.
5 / -
15.7
VHβ
-220
/ 22
0
σHβ
0 / 2
00
-10
0
10
arcs
ec
Log([OIII])
-10
0
10
arcs
ec
-18.
5 / -
15.7
V[OIII]
-220
/ 22
0
σ[OIII]
0 / 2
00
-20 -10 0 10 20arcsec
-10
0
10
arcs
ec
Log([OIII]/Hβ)
-20 -10 0 10 20arcsec
-10
0
10
arcs
ec
-1 /
1
-20 -10 0 10 20arcsec
h3
-0.1
5 / 0
.15
-20 -10 0 10 20arcsec
h4-0
.15
/ 0.1
5
Figure 2.5a: (Colour version in Colour Appendix). Maps of stellar and gaseous kinematics forNGC 488. First row: unsharp-masked image and some astrometric information; second row: stellarflux (in mag arcsec−2 , with an arbitrary zero point), velocity and velocity dispersion (in km s−1); thirdand fourth row: respectively Hβ and [OIII] flux (in erg s−1 cm−2 and logarithmic scale), velocity andvelocity dispersion (in km s−1); fifth row: [OIII]/Hβ line ratio (in logarithmic scale), stellar h3 and h4
moments. The ranges are indicated in the box on the right of each map. In the gas maps, the dark greycolour is used for the bins with A/N below the selected threshold.

OBSERVED STELLAR AND GAS KINEMATICS 37
2.6.2 Stellar kinematicsAll the objects show rotation, as expected. An interesting feature is the quite frequent centraldecline in σ (NGC 628, 772, 2805, 3346, 3949, 5668). We measured also the higher momentsh3 and h4, but unfortunately our spectra contain information only for the most early-typegalaxies in our sample (NGC 488, 772, 4030, 4102) which are generally the objects with thehighest (S/N)?, where penalization does not play an important role (see Section 2.4.1 andCappellari & Emsellem 2004). Some objects display misaligned photometric and kinematicalaxes (NGC 864, 3346, 4487), a possible indication of non-axisymmetric structures such asbars. In other cases, the situation is less clear, due to the presence of twists in the rotationaxis (NGC 772, 2964, 3949, 4254, 5678). In many galaxies our measurements indicate verylow velocity dispersions, as seen also on the basis of the central values reported in Table 2.1and in Fig. 2.1.
Radial behaviour of the stellar velocity dispersionWe addressed the radial behaviour of the stellar velocity dispersion σ by measuring the radialσ profiles and their slope and correlating this with the morphological type. For each of ourgalaxies, we computed a σ profile by averaging the stellar velocity dispersion map on ellip-tical annuli orientated as the galaxy isophotes; for some strongly barred galaxies, the chosenorientation does not coincide with the PA quoted in Table 2.1, which refers to the outermostisophotes. The ellipticity of the concentric ellipses is instead taken in all cases from Table2.1. The distance between consecutive annuli is 0.′′8 along the minor axis, correspondingto the pixel size of the unbinned SAURON cubes. In order to take into account the galaxysize, we rescaled the radial coordinate by dividing it by the disc scale length. The valuesfor the disc scale length hr come from exponential fits of the photometric profiles that weextracted from space- and ground- based images via isophotal analysis. The details of thisphotometric analysis will be given in Chapter 4‖. We then estimated the σ gradient acrossthe field by fitting a straight line to the data points by means of a least-squares algorithm.Fig. 2.6 illustrates the results. For each galaxy the computed σ profile is plotted against thescale-free radius r/hr; the solid lines overplotted are the best-fitting straight lines, the slopeof which is indicated in a corner of each panel. One can see that for some galaxies a straightline is clearly not an optimal description of the data, at least not over the whole radial rangeconsidered, but it serves as an indication of a global trend. The dotted line drawn on eachplot marks the r = 1.′′2 line, which represents the edge of the squared aperture within whichthe central σ values reported in Table 2.1 were computed. In the following Fig. 2.7 we plotthe slope of these scale-free fits against the morphological type of the galaxy. A weak globaltrend can be recognized: the slope tends to increase with later types, indicating that it is moreprobable for later-type galaxies to have a central region colder than the surroundings, ratherthan a hotter one. In the figure, we labelled with (B) the galaxies classified as barred (B andAB in Table 2.1), but we do not detect any significant correlation with bar classification.
The velocity dispersion profile is determined by the mass distribution of the galaxy, theanisotropy of the velocity distribution and the viewing angle. Galaxies with more concen-trated light distribution will have larger central peaks in their σ profiles. Elliptical galaxiesgenerally have outwards decreasing σ profiles (see for example D’Onofrio et al. 1995), and
‖The values here used for the disc scale length come from a preliminary photometric analysis, therefore they donot always coincide with those quoted in Chapter 4.

38 CHAPTER 2: STELLAR AND EMISSION-LINE KINEMATICS
NGC488
0.0 0.1 0.2 0.3 0.4 0.5 0.6r / hr
50
100
150
200
250σ
(km
/s)
slope=-156.62
hr= 42 NGC628
0.0 0.1 0.2 0.3 0.4r / hr
20
40
60
80
100
σ (k
m/s)
slope=73.13
hr= 63 NGC772
0.00 0.05 0.10 0.15 0.20 0.25 0.30r / hr
406080
100120140160
σ (k
m/s)
slope=105.24
hr= 90
NGC864
0.0 0.1 0.2 0.3 0.4 0.5 0.6 0.7 0.8r / hr
20
40
60
80
100
σ (k
m/s)
slope=-10.72
hr= 34 NGC1042
0.00 0.05 0.10 0.15 0.20 0.25r / hr
1020304050607080
σ (k
m/s)
slope=-69.44
hr= 81 NGC2805
0.0 0.1 0.2 0.3 0.4 0.5r / hr
20
40
60
80
σ (k
m/s)
slope=30.04
hr= 38
NGC2964
0.0 0.3 0.6 0.9 1.2 1.5r / hr
2040
60
80
100120
σ (k
m/s)
slope=-28.03
hr= 18 NGC3346
0.0 0.1 0.2 0.3 0.4 0.5 0.6 0.7 0.8 0.9r / hr
20
40
60
80
100
σ (k
m/s)
slope=22.16
hr= 27 NGC3423
0.0 0.1 0.2 0.3 0.4 0.5r / hr
20
40
60
80
100
σ (k
m/s)
slope=-4.70
hr= 52
NGC3949
0.0 0.3 0.6 0.9 1.2 1.5r / hr
20
40
60
80
100
σ (k
m/s)
slope=12.65
hr= 18 NGC4030
0.0 0.1 0.2 0.3 0.4 0.5 0.6 0.7 0.8 0.9 1.0r / hr
2040
60
80
100120
σ (k
m/s)
slope=-25.26
hr= 26 NGC4102
0.0 0.3 0.6 0.9 1.2 1.5r / hr
406080
100120140160180
σ (k
m/s)
slope=-68.32
hr= 19
NGC4254
0.0 0.1 0.2 0.3 0.4 0.5 0.6 0.7 0.8r / hr
2040
60
80
100120
σ (k
m/s)
slope=-1.87
hr= 33 NGC4487
0.0 0.1 0.2 0.3 0.4 0.5 0.6 0.7r / hr
2040
60
80
100120
σ (k
m/s)
slope=34.87
hr= 40 NGC4775
0.0 0.1 0.2 0.3 0.4 0.5 0.6r / hr
20
40
60
80
σ (k
m/s)
slope=18.93
hr= 44
NGC5585
0.0 0.1 0.2 0.3 0.4 0.5 0.6 0.7 0.8 0.9 1.0r / hr
1020
30
40
5060
σ (k
m/s)
slope=-12.88
hr= 26 NGC5668
0.0 0.1 0.2 0.3 0.4 0.5 0.6 0.7 0.8 0.9 1.0r / hr
2040
60
80
100120
σ (k
m/s)
slope=10.68
hr= 21 NGC5678
0.0 0.3 0.6 0.9 1.2 1.5r / hr
20406080
100120140
σ (k
m/s)
slope=-22.6
hr= 21
Figure 2.6: The plots present galaxy by galaxy the radial profile of stellar velocity dispersion (in km s−1),calculated on elliptical annuli as explained in the text; on the horizontal axis we plot a scale-free radius, obtaineddividing our radial coordinate (semi-major axis of the ellipses in arcsec) by the disc scale length hr (also expressedin arcsec and written above each plot). A straight line is fitted to the velocity dispersion profiles; the solid linesoverplotted are the best-fitting straight lines, the slope of which is recorded in a corner of each panel; the dottedvertical line indicates in each panel the r = 1.′′2 line within which the central values of Table 2.1 were calculated.

OBSERVED STELLAR AND GAS KINEMATICS 39
2 3 4 5 6 7 8morphological type T
-200
-150
-100
-50
0
50
100
150(∆
σ) /
∆(r/h
r)
488
628
772
34233949
4030
4254
47755668
864(B)
1042(B)
2805(B)
2964(B)
3346(B)
4102(B)
4487(B)
5585(B)5678(B)
Figure 2.7: The fitted slope ∆σ/∆(r/hr) of the velocity dispersion profiles is plotted here as afunction of morphological type; the values for this slope are those indicated in the panels in Fig. 2.6.The galaxies classified as barred are here labelled with (B) and represented by asterisks; the NGC galaxyidentifiers are indicated close to the corresponding symbol.
this is also the case for many early-type spirals (Paper VII), as a result of a centrally concen-trated bulge. Here we see that for the later-type spiral galaxies there is no sign anymore inthe σ profile of this central mass concentration, which is indeed expected for galaxies withlower bulge-to-disc ratios: for later-types bulges are smaller and have lower surface bright-ness (see for example Falcon-Barroso et al. 2002). In some cases, however, we see that σ isincreasing outwards, which is a sign of cooler central mass concentration. Emsellem et al.(2001), Marquez et al. (2003), Shapiro et al. (2003) and Paper VII have shown that these cen-tral σ-drops are quite common, and are in general associated with disc-like structures. Theyare most likely due to stellar discs formed from gas that has been accreted towards the centre.This is in agreement with simulations by Wozniak et al. (2003). Our measurements showthat also galaxies as late as Sd present velocity dispersion drops. The fact that the velocitydispersion profiles are flat or rising does not necessarily mean that these galaxies have nobulge - by detailed modeling in the following chapters and in future papers we will be able toanswer this question.

40 CHAPTER 2: STELLAR AND EMISSION-LINE KINEMATICS
NGC HST ref SAURON488 r1/4b C97 hot central region1042 nsc B02 low σ over the field2805 nsc B02 cold central region2964 sf+nuc C97, C02 σ enhanced in the centre3346 nsc B02 cold central region3423 nsc B02 low σ over the field3949 nuc C02 cold central region4030 irb+expb C98 hot central region4102 irb C97 hot central region4487 nsc B02 cold central region4775 nsc B02 low σ over the field5585 nsc B02 low σ over the field5668 nsc B02 cold inner region5678 nuc C02 hot central region
Table 2.3: Comparison with HST photometry. References in the table: C97 = Carollo et al. 1997,C98 = Carollo et al. 1998, C02 = Carollo et al. 2002, B02 = Boker et al. 2002; abbreviations: r1/4b=de Vaucouleurs bulge, irb = irregular bulge (when a galaxy possess a central dense component but doesnot have a featureless appearance), expb = exponential bulge, nuc = nuclear compact source, nsc =nuclear star cluster, sf = nuclear star forming region; for a more accurate description of the photometricfeatures, we refer the reader to the quoted papers.
Qualitative comparison with HST photometryIt is not straightforward to connect our kinematic results with photometry. In the last decadeanalysis based on HST imaging (Carollo et al. 1997, 1998, 2002, Peletier et al. 1999, Bokeret al. 2002, Laine et al. 2002) revealed that late-type galaxies do not necessarily possessclassical bulges∗∗; they can instead host small-scale structures such as nuclear bars, nuclearstar clusters, point-like sources. We cross-correlated the above mentioned samples with ourown and tried to look for kinematical signatures of the photometric features that they detectedin the images. In Table 2.3 we tabulate the results of this comparison, based on a review ofthe relevant literature, on the appearance of our maps (Figs. 2.5a-2.5r, Section 2.6.1) and ofthe radial behaviour of σ as well (Fig. 2.6).
According to Boker et al. (2002), NGC 1042, 2805, 3346, 3423, 4487, 4775, 5585and 5668 host a nuclear star cluster and do not have a stellar bulge; our data show that thecentral regions of these objects are indeed cold. For any speculation on nuclear star clusters,caution is needed, since the nuclear star clusters detected with HST imaging have a spatialscale usually much smaller than the SAURON resolution. There are also cases where ourobservations nicely support the photometrical results: NGC 488 has a classical r1/4 bulge(Carollo et al. 1997), and our maps show a hot, extended central region; NGC 4030 hasalso a large stellar bulge - although classified as ‘irregular’ and ‘exponential’ (Carollo etal. 1998) - and our data show a hot nuclear region. To conclude, the examples show that
∗∗We note here that Carollo (1997, 1998, 2002) refers to a definition of classical bulge as a centrally concentratedstellar distribution with an amorphous, smooth appearance. This implicitly excludes gas, dust, and continuing recentstar formation (Wyse, Gilmore & Franx 1997).

OBSERVED STELLAR AND GAS KINEMATICS 41
NGC logFHβ logF[OIII] NGC logFHβ logF[OIII]
488 -13.72 -13.79 3949 -12.32 -12.59628 -13.34 -14.12 4030 -12.51 -13.18772 -13.18 -13.59 4102 -12.69 -12.85864 -13.03 -13.53 4254 -12.48 -13.131042 -13.84 -13.92 4487 -12.91 -13.402805 -13.32 -13.84 4775 -12.64 -12.702964 -12.60 -13.03 5585 -12.98 -12.893346 -13.47 -14.14 5668 -12.89 -13.153423 -12.93 -13.45 5678 -12.80 -13.33
Table 2.4: The table reports galaxy by galaxy the decimal logarithm of the global fluxes in the Hβand [OIII] emission-lines, in erg s−1 cm−2.
there is a correspondence between the photometric lack of a stellar bulge and the kinematicalmeasurement that the inner regions are cold. At the moment this is a qualitative statement thatrequires further investigation. As previously stated, in the following chapters we will studydeeper the relation between the kinematical structures and the shape of the photometricalprofiles.
2.6.3 Gas kinematics
In our data, the gas rotates usually faster than the stars and around the same axis; the gasvelocity fields are much more complicated than the stellar ones, with zero-velocity lines thatare often wiggling, inclined or S-shaped (NGC 772, 2964, 3346, 3949, 4102, 4254, 5678).When comparing the results in the two diagnostic lines (Hβ and [OIII]), we notice that inmany cases the Hβ distribution is spatially more extended than the [OIII] one (NGC 488,628, 864, 1042, 2805, 3346) and that the flux in Hβ is in most cases higher than in [OIII],although there can be specific regions where the situation is opposite, with less emission inHβ rather than in [OIII], which is the case for NGC 4102 and 5585. In Table 2.4 we listthe total Hβ and [OIII] fluxes, obtained summing the line fluxes in all the bins that meet theA/N criterion. There are generally no major differences between the velocity fields in thetwo lines, while the velocity dispersion is usually higher in Hβ; exceptions to this statementwill be highlighted in the individual galaxies description (Section 2.6.4). The differencesbetween the two lines are particularly strong in the case of NGC 4102 (see also Fig. 2.3 andthe related text), which is classified as a LINER. Overall, the sample galaxies display low[OIII]/Hβ ratios over most of the SAURON field, suggesting star formation, as expected inspiral galaxies.
2.6.4 Notes on individual galaxies
Here we comment individually on the galaxies of our sample; for each of them, we firstsummarize the known properties from previous work, then we describe the most interestingfeatures seen in our SAURON maps, shown in Section 2.6.1 and in the Colour Appendix.

42 CHAPTER 2: STELLAR AND EMISSION-LINE KINEMATICS
NGC 488
NGC 488 is the most ‘elliptical-like’ galaxy in our sample; it is an unbarred Sb galaxy witha very regular tightly wound spiral pattern, with a pitch angle of only 5◦ (Kormendy 1984,Gerssen, Kuijken & Merrifield 1997), and a large and smooth central bulge. According toCarollo et al. (1997), this is a classical r1/4 bulge. The rotation curve has been measuredusing Hα and [NII] 6583A data by Peterson (1980) out to a radius of 20 kpc, where he foundthat the velocity reaches ≈ 363 km s−1, and continues to increase outward. This galaxy hasbeen studied using photometric and kinematic data to construct a dynamical model of bulgeand disc (Fuchs 1997), concluding that the disc is dynamically cold.
The SAURON maps show regular stellar and gaseous rotation, with stars and gas rotatingfast around the photometric minor axis and stellar velocity dispersion smoothly increasingtoward the centre (consistent with the presence of the large bulge), to reach the highest valuein our sample (around 200 km s−1, see also Table 2.1 and Fig. 2.6). The gas turns out to bequite patchy (Hβ) and centrally concentrated.
NGC 628
NGC 628, also known as M74, is a well-studied grand design spiral galaxy classified as Sc.It is known to be surrounded by an elliptical ring of neutral hydrogen extending well beyondthe optical disc, out to ≈ 3RHo (isophotal radius at the 26.5 mag arcsec−2 surface brightnesslevel), lying in a plane which is ≈ 15◦ inclined with respect to the plane of the bright innerdisc (see Roberts 1962, Briggs et al. 1980, Briggs 1982). The origin of the warped velocityfield of the outer galaxy has been debated, since the apparent isolation of this galaxy makesit difficult for tidal disruption to be responsible for the warp. UV observations of NGC 628have shown spiral arms with a more symmetrical appearance than in the optical; Chen etal. (1992) identified in the ultraviolet a possible companion 7.′6 southwest from the nucleus,which could have helped to clarify the origin of the outer warp, but later it turned out tobe a spurious detection. From both NIR spectroscopy of CO absorption and submillimetricimaging of CO emission, a circumnuclear ring of star formation has been seen (Wakker &Adler 1995, James & Seigar 1999). These rings are believed to exist as a result of a barredpotential; Seigar (2002) claims that ground-based NIR images suggest the presence of anoval distortion at ≈ 2 kpc from the centre, which could be part of the dissolution of a barand responsible for the circumnuclear ring. On the basis of their analysis of HST H− bandimages, Laine et al. (2002) found a bar on a ≈ 100 parsec scale; this would then be a case ofnested bars.
From the stellar population side, Cornett et al. (1994) concluded that the star formationhistory of NGC 628 varies with galactocentric distance; Natali, Pedichini & Righini (1992)suggested that the galaxy could be seen as an inner and an outer disc characterised by differ-ent stellar populations; according to them, the transition between the two regions is locatedat ≈ 8-10 kpc from the centre.
NGC 628 can be resolved from the ground into individual supergiants and HII regions(Sohn, Young-Jong & Davidge 1996). Many previous studies focused on the HII regions;Belley & Roy (1992) derived reddenings, Hβ emission equivalent widths and metallicitiesfor 130 HII regions; Ivanov et al. (1992) classified a similar number of stellar associations.Sohn & Davidge (1996) studied a large number (more than 300) of stellar objects in the discof NGC 628, measuring brightness and colours, finding some recent star formation and get-

OBSERVED STELLAR AND GAS KINEMATICS 43
ting an estimate of the distance modulus (29.3 mag).Our observations of NGC 628 are disturbed by the presence of a foreground star which
falls close to the centre (≈ 13′′ southern); as mentioned in the caption to Table 2.2 our firstexposure on this galaxy was centred on this foreground star. During our last two exposures,the observing conditions were not optimal: the seeing went up to ≈ 2′′.
From our data we can measure slow projected rotation around the minor axis, as expectedfor an almost face-on object. The stellar velocity dispersion decreases in the central zones,indicating a cold central region, maybe an inner disc. Photometric observations at UV wave-lengths from Cornett et al. (1994) did not show evidence for a bulge: the nucleus of NGC 628has the appearance of disc material in the UV. The ionized gas rotates in a way similar to thestars; the Hβ distribution turns out to be more extended than the [OIII] distribution, both ofthem suggesting an annular structure.
NGC 772
NGC 772, named also Arp78, forms a pair at 3.′3 with the E3 galaxy NGC 770. It is an Sbgalaxy characterised by a particularly strong spiral arm; it is known to have faint HII regions(Oey & Kennicutt 1993) and extended HI, to a radius ≈ 75 kpc (Rao & Briggs 1993).
The unsharp-masked SAURON image (no optical HST image is available) displays a welldefined dust pattern, with the dust following the spiral arms. From the stellar kinematicalmaps we can see that in the central region there is a clear drop in the stellar velocity dispersionand h3 turns out to anticorrelate with the velocity, as expected for a rotating disc; the stellarvelocity map shows rotation around the photometric minor axis and a mildly S-shaped zero-velocity line. The gas, especially in Hβ, rotates in a more complex way than the stars, with avery strongly S-shaped zero-velocity line, and its distribution follows the spiral arm pattern.The [OIII] velocity field is instead much more regular. The gas velocity dispersion in theHβ line is flat -and low- beyond ≈ 10′′, enhanced in an annular region around the centreand depressed again in the nucleus -although still well higher than in the outer parts. All ofthis is also seen in the [OIII]/Hβ map, where we can recognize regions with very low valuescorresponding to the spiral arms and to low values in the ionized gas velocity dispersion.
NGC 864
Nuclear radio emission has been found in this barred Sc spiral galaxy (Ulvestad & Ho 2002);the nuclear radio source has diffuse morphology, with linear size of ≈ 300 pc.
The SAURON maps show rotation both in the stellar and gaseous components, around thephotometric major axis, i.e. the rotation axis is oriented as the bar; but looking at a larger-scale image (see for example Fig. 2.2) we can see that the major axis of the bar turns outto be the global minor axis when considering the whole optical galaxy. The stellar velocitydispersion is flat and low over the entire SAURON FoV. The gas flux follows the nucleus + barstructure, as visible especially in the Hβ case. The line ratio [OIII]/Hβ is also structured ina similar way, assuming low values along the bar and in particular in the central ≈ 4′′ circle,which could indicate a star forming nucleus. Interestingly, this region corresponds to a localminimum in the Hβ velocity dispersion map, which assumes in the centre lower values thanthe dispersion in [OIII], differently to what happens in most of our galaxies.

44 CHAPTER 2: STELLAR AND EMISSION-LINE KINEMATICS
NGC 1042This Scd galaxy forms a pair with the Sc galaxy NGC 1035 at a separation of 22′ (corre-sponding to 177 kpc). It has a bright, small nucleus and otherwise low surface brightness.Neutral hydrogen has been detected at positions corresponding to the optical centre and twoadjacent regions (Bottinelli & Gouguenheim 1980).
In our data, this galaxy has a quite poor signal-to-noise, so that the stellar binning is quiteheavy. There are some indications of slow projected stellar rotation, but in general the kine-matical maps are difficult to interpret. The gas is quite patchy and does not cover, at thechosen A/N level, the whole SAURON field. In contrast to what is seen in the majority ofour galaxies, the velocity dispersion in [OIII] is higher than in Hβ, especially in the centralregion.
NGC 2805NGC 2805 is an Sd galaxy seen nearly face-on and it is the brightest member of a multipleinteracting system containing also NGC 2814 (Sb), NGC 2820 (Sc) at 13′ and IC2458 (I0).According to Hodge (1975), in this group the HII regions appear distorted on the side of thegalaxy opposite to the companion. HI has been detected (Reakes 1979, Bosma et al. 1980)and there are claims that the outer HI layers are warped (see for example Bosma et al. 1980).The galaxy seems to be also optically disturbed, since the spiral arms appear to be broken upinto straight segments.
From our SAURON data, we find slow projected stellar velocities and a central drop invelocity dispersion. The gas has a clumpy distribution and rotates consistently with the stars.The line ratio [OIII]/Hβ is low all over the field, possibly indicating ongoing star formationeverywhere.
NGC 2964NGC 2964 is a barred Sbc galaxy which forms a non-interacting pair with the I0 galaxyNGC 2968 at 5.′8. From HST images Carollo et al. (1997) detected a resolved central com-pact component, possibly star forming. CO has been detected by Braine et al. (1993); theysuggested that the galaxy might contain an unresolved nuclear ring.
Our data reveal a variety of features in this galaxy. The stars rotate in a quite regularway, although a twist in the zero-velocity line can be seen very close to the edge of the field,on both sides. The stellar velocity dispersion increases smoothly towards the centre. Two-dimensional maps of stellar velocity and velocity dispersion for this galaxy have recentlybeen published by Batcheldor et al. (2005). Although their maps deliver a lower spatial reso-lution than ours and a smaller FoV, there is a global agreement between the two observations.They also provide central values for the higher Gauss-Hermite moments h3 and h4; the lattervalue is larger than ours.
The ionized gas has a clumpy distribution, which could suggest a spiral arm structure,and complex kinematics in both lines, with a very irregular zero-velocity line and with thevelocity dispersion peaking in an off-centre region. The velocity dispersion in [OIII] is en-hanced with respect to Hβ. Overall, the gas motions are consistent with the stellar rotation.In the region of the gas-σ peak, the spectra show also complex line profiles: in some binswe find double-peaked lines in the [OIII] spectral region (see discussion in Section 2.4.2). Itcould be that we are seeing the regular gas motion together with an ionization cone, caused
OBSERVED STELLAR AND GAS KINEMATICS 45
by a central AGN, as is probably also the case in NGC 4102. Up to now, NGC 2964 has notbeen classified as an AGN yet. The double-peak line shape characterises only a few spectra,so we applied our standard method which fits single Gaussians to the emission-lines. The[OIII]/Hβ line ratio is small over most of the field, and is enhanced in a ring-like structure(see also Braine et al. 1993) surrounding an elongated nuclear region where the ratio becomeslow again. This could be a star forming region, in accordance with Carollo et al. (1997).
NGC 3346This is a barred Scd galaxy, for which only little information is available from the literature.The SAURON data show regular stellar rotation around an axis slightly misaligned with re-spect to the direction perpendicular to the bar, with complicated structures in the very innerregions; the stellar velocity dispersion is everywhere low and flat, and it seems to be depressedin a central region elongated in the same direction as the bar; the map is quite patchy. Theionized gas is concentrated along the bar and the spiral arms and rotates similarly to the stars,although the gas velocity fields appear quite patchy. The Hβ distribution is more extendedthan [OIII]. The line ratio [OIII]/Hβ is depressed along the bar, particularly in bubble-shapedspots, as the Hβ velocity dispersion does as well; these could be star forming regions.
NGC 3423Also for this Scd galaxy there is not much literature to refer to. In the SAURON maps wemeasure slow projected stellar rotation and low velocity dispersion. The gas shows a clumpydistribution and rotates faster than the stars and around the same axis. [OIII]/Hβ is every-where low, possibly indicating wide-spread star formation.
NGC 3949NGC 3949 is an Sbc galaxy in the Ursa Major cluster. Optical images show a diffuse extendedhalo (Tully et al. 1996). It has been observed with the Westerbork Synthesis Radio Telescope(Verheijen 1997): HI is detected well beyond the optical galaxy.
The SAURON maps show rotation both in the stellar and gaseous components. The stellarvelocity dispersion indicates a cold inner region. This galaxy is part of the sample observedby Batcheldor et al. (2005); as in the case of NGC 2964, their reported central h4 value islarger than ours. Integral-field observations of NGC 3949 are presented also by Westfall et al.(2005); their central values for the stellar velocity dispersion are in good agreement with ours;the agreement at larger radii and in the gas velocity dispersion is less satisfactory. The gashas a complex and clumpy distribution and its velocity fields present the same characteristicsas the stellar one: global rotation and irregular zero-velocity line. The global appearance ofthe previously mentioned HI velocity field resembles our SAURON velocity maps. Overall,[OIII]/Hβ is low, especially in a circumnuclear region. No correspondence between the lineratio and the highly complex gas velocity dispersion maps is evident.
NGC 4030Carollo et al. (1998) analysed the HST images of NGC 4030, and found tightly wound floc-culent spiral structure reaching the nucleus and an irregular, exponential bulge. Our observa-tions of NGC 4030 have a very high signal-to-noise, so that the data are of extremely goodquality. The kinematical behaviour of this Sbc galaxy is characterised by very regular rotation

46 CHAPTER 2: STELLAR AND EMISSION-LINE KINEMATICS
of stars and gas around the minor axis. The velocity dispersion increases smoothly movinginwards, becoming possibly flat in the nuclear region (see Fig. 2.6), and the stellar h3 anti-correlates with the velocity, as expected for a rotating disc. Our gas flux maps show a centralconcentration, although in Hβ some structure is visible that could be related to the spiralarms and/or dust lanes pattern: as can be seen in the unsharp-masked image and as alreadynoticed by Carollo et al. (1998), the spiral arms and dust lanes structures extend down tothe innermost scales. From long-slit Hα optical spectroscopy extended over ≈ 80 percent ofthe optical image, Mathewson & Ford (1996) derive a rotation curve with maximum rotationvelocity of ≈ 236 km s−1. Our gas velocity regularly increases going outward, up to a valueof ≈ 180 km s−1 at the edges of the field. Since the outermost radius of our data is smallerthan the one of the quoted observations, there is not necessarily a disagreement.
NGC 4102
NGC 4102 shows a bright central bar from which two tightly wound and dusty spiral armsdepart (Verheijen 1997). In the NED database this object is classified as a LINER; it isknown to be a powerful far-infrared galaxy (Young et al. 1989) and also to have a strongnuclear radio source (Condon et al. 1982). Devereux (1989) classified it as one of the mostpowerful nearby starburst galaxies. From optical spectroscopy of the ionized swept-up gas,Boer (1994) determined the time-scale of the central starburst wind to be of the order of106 years: a young starburst. Goncalves, Veron-Cetty & Veron (1999) recognized a weakSeyfert2 component, mainly detected by the broadening of the [OIII] lines. NGC 4102 hasalso been observed in CO: Jogee & Kenney (1996) found a compact CO morphology and aCO velocity field characterised in the inner 200 pc by purely circular motion, and a sharpdiscontinuity in gas kinematics at larger radii, around 3′′; this could be due to streamingmotions along the bar. HI has been detected in absorption against the bright central radiosource (Verheijen 1997).
The signs of all the documented activity going on in this galaxy are detectable also in ourSAURONmaps: the gas kinematics turn out to be extremely complicated. As mentioned in thediscussion in Section 2.6.3, this is the only case in our sample with a significant differencebetween the kinematics of the Hβ and [OIII] lines: the Hβ velocity field resembles moreclosely the stellar one, although it is more irregular, while the [OIII] maps trace more likelythe outflowing gas. This can be also seen by looking at the gas flux maps: in [OIII] thecentral gaseous concentration appears to be elongated in a northwestern direction, which isnot the case in the Hβ distribution, that follows instead the spiral arm pattern. The [OIII]velocity dispersion is also elongated in the same direction. Together with NGC 2964, thisis the only galaxy in our sample where we find emission-lines that are not well fitted bysingle Gaussians (see the discussion in Section 2.4.2 and Fig. 2.3). The complex line profilesare found only in the region corresponding to the maximum difference between the Hβ and[OIII] kinematics (which is also, as already noticed, the region of the [OIII] σ peak and fluxelongation); there the [OIII] lines turn out to be broadened, in accordance with Goncalves etal. (1999). According to our measurements, the [OIII]/Hβ line ratio is then enhanced in theoutflow region, as expected for an active object. As for the stellar kinematics, we do not seesigns of activity there: the stars behave in a much more quiet way, with regular rotation andvelocity dispersion increasing from the outer parts toward the centre.

OBSERVED STELLAR AND GAS KINEMATICS 47
NGC 4254
NGC 4254, known also as M99, is one of the brightest spiral galaxies in the Virgo cluster. Itsoptical appearance is characterised by the one-arm structure: the arms to the northwest aremuch less defined than the southern arm. This kind of spiral structure could be related to anexternal driving mechanism, but for NGC 4254 there are no close companions and no evidentsigns of past interactions (Rauscher 1995). Phookun, Vogel & Mundy (1993) carried out HIand Hα observations of this Sc galaxy, detecting non-disc HI emission, coming mostly froma region to the north of the galaxy and contiguous with it in the plane of the sky; accordingto the authors, the non-disc HI corresponds to 3 percent of the total HI mass; they do not findHα emission corresponding to the non-disc gas, which indicates little or no star formationthere. They interpreted these observational results as infall of a disintegrating gas cloud; thiscould have caused the asymmetry in the spiral structure. Hα intensity and velocity fields arepresented also in Chemin et al. (2005), confirming the asymmetry in the prominent spiralstructure and detecting streaming motions along the arms. There are also claims for thepresence of a weak bar with a PA of ≈ 60◦, although NGC 4254 is classified as unbarred(Sakamoto et al. 1999, from analysis of the molecular gas distribution).
We observed this galaxy under bad seeing conditions (≈ 3′′). Our kinematic maps revealregular stellar rotation, although the stellar zero-velocity line is twisting toward the edgesof the field. The gas flux follows the spiral pattern, which is particularly evident in the Hβcase and can be seen also in the [OIII]/Hβ line ratio, which assumes particularly low valuesin bubble-shaped regions along the arms. The gas rotation globally resembles the stellarmotions, but presents more complex structures, with S-shaped zero-velocity lines, whichcould be related to the mentioned possible bar; Fourier analysis of the velocity field will helpclarifying this. Velocity dispersion in [OIII] is higher than in Hβ, as particularly visible inthe central region.
NGC 4487
This Scd galaxy forms a pair with the Scd galaxy NGC 4504, at a separation of 35′ (corre-sponding to ≈ 165 kpc). Two principal arms of the grand-design type are recognizable inthe images; one of the two is less well defined than the other and splits into broad segmentswhich cover one side of the disc. The spiral pattern shows up also in our gas flux maps. Thestars and gas rotate around an axis misaligned with respect to the photometric minor axis.The stellar and gaseous velocity dispersions are everywhere very low. In the [OIII]/Hβ mapregions of possible star formation can be recognized, in the centre and along the spiral arm,in correspondence to a drop in the Hβ velocity dispersion. Contrary to what happens in themajority of our galaxies, in the very centre the velocity dispersion in Hβ is lower is than in[OIII].
NGC 4775
Very little is known about this low-inclination and very late-type (Sd) galaxy. Our maps,although based on 4 × 1800s exposures, are quite patchy and not easy to interpret; theysuggest very slow stellar and gaseous projected rotation, as expected for an almost face-ongalaxy, low stellar and gaseous velocity dispersion and a clumpy gas distribution in both Hβand [OIII] lines.

48 CHAPTER 2: STELLAR AND EMISSION-LINE KINEMATICS
NGC 5585NGC 5585 is a barred Sd galaxy; together with NGC 5204 (Sm), NGC 5474 (Scd), NGC 5477(Sm) , HoIV (Im) and M101 (Scd) it forms the M101 group. It is highly resolved into in-dividual stars and HII regions. In this galaxy Cote, Carignan & Sancisi (1991) detected HIextended out to more than twice the optical radius; the HI velocity field turned out to bestrongly warped; using these data and the B− band luminosity profiles, they constructed amass model finding that the contribution of the dark matter component dominates the rotationcurve at almost all radii, also when using a maximum-disc method. Later, Blais-Ouellette etal. (1999) pointed out that using two-dimensional Hα Fabry-Perot spectroscopy one can bet-ter constrain the orientation parameters and the rotation curve in its rising part, reducing by30 percent the dark-to-luminous matter ratio.
In our SAURON maps there is not much information about the stellar velocity (patchymap). There are some hints of slow projected rotation. The stellar σ decreases moving out-wards from the central region, although the map appears patchy and has everywhere lowvalues. The gas distribution follows the bar morphology; along the bar some spots can beseen where the flux in [OIII] is larger than in Hβ . The [OIII]/Hβ line ratio is enhanced in aregion elongated in a roughly perpendicular direction to the one defined by the bar.
NGC 5668NGC 5668 is another Sd galaxy, which has a high rate of star formation, as indicated by itslarge far-infrared and Hα luminosities (Schulman et al. 1996, and references therein); thementioned authors observed it in HI and detected high-velocity clouds of neutral hydrogen.High velocity clouds were found also in the ionized gas and interpreted as regions with verti-cal motions related to ongoing star forming processes in the disc, as pointed out by Jimenez-Vicente & Battaner (2000) on the basis of Fabry-Perot Hα observations.
Our SAURON data indicate very slow stellar projected rotation velocities and a cold innerregion. The gas distribution is clumpy, defining a ring-like structure also characterised byslightly lower [OIII]/Hβ values compared to the surroundings.
NGC 5678Not much is known from previous work on this barred and very dusty Sb galaxy. According toour SAURON data, the stars rotate in a rather regular way around the minor axis, although thezero-velocity line is strongly bent. The stellar velocity dispersion increases moving inwards,and becomes flatter in the nuclear region (see Fig. 2.6). The gas has instead a complexdistribution, more structured in Hβ than in [OIII], with kinematics consistent with the stars,but a zero-velocity line more disturbed and wiggling, similar to what we see in NGC 2964.Over a large part of the field, the velocity dispersion in the [OIII] line is higher than in Hβ.
2.7 SUMMARY AND CONCLUSIONSTwo-dimensional kinematics and stellar population analysis of spiral galaxies towards the endof the Hubble sequence (Hubble types later than Sb) is still a relatively unexplored field: late-type spirals are very complex objects, often faint and full of substructures, as recently provedby analysis of HST images. They have been the target of a few photometric and long-slit op-tical spectroscopic observations, but measurements of their two-dimensional kinematics were

SUMMARY AND CONCLUSIONS 49
still missing. We have started a project on a sample of 18 such objects using integral-fieldspectroscopic observations obtained with SAURON. This allowed us to measure the stellarkinematics, the flux and kinematics of the Hβ 4861A and [OIII]λλ4959,5007A emission-lines and the strength of the Hβ, Fe and Mgb absorption features over a two-dimensional areacovering the central region of our galaxies.
In this chapter we discussed the first results from this study, presenting the two-dimensionalkinematics for stars and ionized gas. The majority of our galaxies is shown to be kinemat-ically cold and to possess a considerable amount of ionized gas, covering in most cases alarge part of the SAURON FoV and frequently following bar or spiral arm patterns in thespatial distribution. A quite common feature of our measured stellar kinematical maps is acentral depression in the velocity dispersion, which assumes very often low values; we mea-sured the velocity dispersion profiles and correlated their slopes with the morphological type:later-type galaxies tend to have velocity dispersion profiles which increase outwards. This im-plies small bulge-to-disc ratios and the presence of inner, occasionally star forming, disc-likestructures. We also qualitatively compared the characteristics of our maps with the galaxy’sproperties known from literature HST isophotal analysis: the main conclusion common tospectroscopy and photometry is that the kinematic detection of a cold inner region turns outto be often related to the lack of a classical stellar bulge and the presence of small-scalestructures (nuclear star clusters, inner rings, inner bars). The gaseous component turns outto be almost ubiquitous and kinematically highly complex, displaying in many cases irregu-lar velocity fields, with the kinematic axis twisting or bending or wiggling, or even withouta clear sense of rotation, possibly because of the dust which strongly affects these objects.They also host intense star formation, often spread over the whole region we have observed,as suggested by the low values in the [OIII]/Hβ line ratio maps.
In the following chapters we will model the observed kinematic fields in detail, presentthe line-strength maps for these same galaxies, consider the bulge-disc decomposition, andcompare our results with those for the 24 Sa bulges in the SAURON survey.
AcknowledgmentsWe kindly acknowledge Anna Pasquali and Ignacio Ferreras for their help during the earlystages of this project. We thank Marc Balcells, Marc Sarzi and Kristen Shapiro for a carefulreading of and commenting on the draft. We also thank the referee of the published pa-per Torsten Boker for useful comments and suggestions which improved the paper/chapter.The SAURON - related projects are made possible through grants 614.13.003, 781.74.203,614.000.301 and 614.031.015 from NWO and financial contributions from the Institut Na-tional des Sciences de l’Univers, the Universite Claude Bernard Lyon I, the Universities ofDurham, Leiden and the Netherlands Research School for Astronomy NOVA. KG acknowl-edges support for the Ubbo Emmius PhD program of the University of Groningen. JFBacknowledges support from the Euro3D Research Training Network, funded by the EC undercontract HPRN-CT-2002-00305. MC acknowledges support from a VENI grant 639.041.203awarded by the Netherlands Organization for Scientific Research (NWO). This project madeuse of the HyperLeda and NED databases. Part of this work is based on data obtained fromthe STSci Science Archive Facility. The Digitized Sky Surveys were produced at the SpaceTelescope Science Institute under U.S. Government grant NAGW-2166. The images of thesesurveys are based on photographic data obtained using the Oschin Schmidt Telescope on

50 CHAPTER 2: STELLAR AND EMISSION-LINE KINEMATICS
Palomar Mountain and the UK Schmidt Telescope.