university of groningen no and o2 absorption in feii(edta ...103 chapter 7 an experimental study on...
TRANSCRIPT
University of Groningen
NO and O2 absorption in FeII(EDTA) solutionsGambardella, Francesca
IMPORTANT NOTE: You are advised to consult the publisher's version (publisher's PDF) if you wish to cite fromit. Please check the document version below.
Document VersionPublisher's PDF, also known as Version of record
Publication date:2005
Link to publication in University of Groningen/UMCG research database
Citation for published version (APA):Gambardella, F. (2005). NO and O2 absorption in FeII(EDTA) solutions. [Groningen]: s.n.
CopyrightOther than for strictly personal use, it is not permitted to download or to forward/distribute the text or part of it without the consent of theauthor(s) and/or copyright holder(s), unless the work is under an open content license (like Creative Commons).
Take-down policyIf you believe that this document breaches copyright please contact us providing details, and we will remove access to the work immediatelyand investigate your claim.
Downloaded from the University of Groningen/UMCG research database (Pure): http://www.rug.nl/research/portal. For technical reasons thenumber of authors shown on this cover page is limited to 10 maximum.
Download date: 05-04-2020
103
Chapter 7
An experimental study on EDTA degradation during the reactive absorption of oxygen in aqueous
FeII(EDTA) solutions
Abstract EDTA degradation taking place when reacting FeII(EDTA) with molecular oxygen in a G-L stirred cell contactor was studied in a range of process conditions relevant for the BiodeNOx process (T = 323 K, C0
FeII(EDTA) = 10 mol/m3, pH = 7, [EDTA]/[Fe] = 1.1, CO2 = 5 vol%, P = 105 Pa ). Of the possible degradation products, ED3A was used as a probe to assess the degradation levels. At typical BiodeNOx conditions, about 5% of the bound EDTA is converted to ED3A. When using higher temperatures, higher oxygen levels and higher initial FeII(EDTA) concentrations, the rate of ED3A formation increases. However, the integral selectivity towards FeIII(EDTA) remains constant and equals 95%, suggesting a coupling between the molecular mechanisms of FeII(EDTA) oxidation to FeIII(EDTA) and EDTA degradation. The presence of NO and in particular of an excess of (free) EDTA ([EDTA]/[Fe]= 1.5 � 2) result in a strong reduction of the EDTA degradation rates.

104
7.1 Introduction During the BiodeNOx process, the reaction between O2 and the Fe- chelate is an undesired side reaction and cannot be avoided as oxygen is always present in the flue gas. Oxygen is able to oxidize the iron chelate complex in the following way:
−−− +→++ OHEDTAFeOHEDTAFeO IIIII 4)(42)(4 22
2 (1) Pilot plant trials using the BiodeNOx concept were performed and promising NO removal efficiencies up to 65% were observed [61]. During these trials, EDTA degradation was observed, leading to a lowering of the NO removal efficiency. EDTA addition was required to regain the original NO removal efficiencies, leading to higher processing costs per ton NO removed. These findings prompted us to study the EDTA degradation levels in the BiodeNOx process in more detail. EDTA is used in large quantities in the paper- and pulp industry and in cleaning formulations [115]. Consequently, various technologies have been developed to degrade EDTA in waste water treatment plants. Effective methods are Advanced chemical Oxidation Processes (AOP) and biological, activated sludge processes [115]. The AOP process uses oxidants (ozone, hydrogen peroxide) to break down the EDTA molecule. The rate of degradation is higly dependent on the type and amounts of metals present. A large number of organic degradation products have been identified and all are expected to be more readily biodegradable than EDTA itself. A limited number of studies have been published on the degree of EDTA degradation when oxidizing FeII(EDTA) to FeIII(EDTA) using molecular oxygen. Chen et al [58] studied the rate of EDTA degradation and the product mixture formed for the process of wet H2S removal from flue gases using FeIII(EDTA). FeIII(EDTA), H2S, and oxygen were reacted at a pH of 8.5 and a temperature of 25 °C. At these conditions, FeIII(EDTA) is reduced to FeII(EDTA) by the reaction with H2S and subsequently re-oxidised with molecular oxygen (eq (2) and (3)).
+++→+ HEDTAFeSEDTAFeSH IIIII 2)(281)(2 82 (2)
−+→++ OHEDTAFeOHOEDTAFe IIIII 2)(221)(2 22 (3)
EDTA is slowly degraded under these conditions (80% conversion in 80 h) to form a mixture of various nitrogen containing compounds, e.g. nitrilotriacetic acid (NTA), iminodiacetic acid (IDA), ethylenediaminediacetic acid (EDDA), and glycine. A Fenton type of mechanism was proposed, involving OH radicals which are formed by decomposition of H2O2. The latter is assumed to be an intermediate in the reaction between FeII(EDTA) and molecular oxygen to form FeIII(EDTA). Motekaitis et al. studied the FeIII catalysed oxidation of EDTA in aqueous solutions. At temperatures exceeding 100°C, using an excess of EDTA and in the absence of oxygen, FeIII reacts stoichiometrically with the coordinated EDTA to form ethylenediamine-triacetic acid (ED3A). Free, un-complexed EDTA is not converted under these conditions. In the presence of oxygen, excess EDTA is quantitatively converted to ED3A whereby FeIII(EDTA) formed according to (1) acts as a catalyst (eq (4)) [56].
AEDEDTAFeEDTAEDTAFe IIIII 3)(2)(2 +→+ (4)
105
Indirect evidence for substantial EDTA degradation rates when reacting FeII(EDTA) with molecular oxygen was obtained by Wubs and Gambardella et al. [57, 107]. Both studies reveal that the stoichiometric coefficient of FeII(EDTA) for the reaction with oxygen (1) assumes values between 3 and 4, suggesting that the oxidation reaction is not the sole reaction taking place. EDTA oxidation was considered as a possible oxygen consuming side reaction. We here present a systematic study on EDTA degradation during the oxidation of aqueous FeII(EDTA) solutions in a stirred cell contactor. The degradation rates were studied as a function of the temperature, pH of the solutions, concentrations of FeII(EDTA) and oxygen, and the [EDTA]/[Fe] ratio. In addition, the effect of NO on the degradation rate was also investigated. The reactions were carried out in the range of process conditions relevant for the BiodeNOx process: T = 303 - 323 K, C0
FeII(EDTA) = 5 - 10 mol/m3, CO2in = 5 -20 %, CNOin = 0 - 1000 vppm, pH = 5 � 8,
[EDTA]/[Fe] = 1.1 � 2 mol/mol. With this information available, the optimum process conditions for the BiodeNOx process to minimize EDTA degradation may be established. 7.2 Experimental 7.2.1 Chemicals Na4-EDTA (Dissolvine E-39, 39 % in water) was obtained from Caldic Nederland; FeSO4.-7 H2O and CeSO4.-4 H2O (> 99%) from Acros; Na2CO3 and H2SO4 (99%) from Merck; NaOH (33% in water) from Boom; NO (1000 vppm in N2), O2 (> 99.5%) and N2 (> 99.99%) were from Hoek Loos. Reverse osmosis water was applied to prepare the iron solutions. 7.2.2 Experimental set-up All the reactions were carried out in a stirred cell reactor wrapped in Al-foil to avoid degradation of the Fe-chelate solution due to the presence of light [116, 117]. A stainless steel turbine impeller was used to stir the gas phase, while a magnetic stirrer bar (2 cm) in combination with an external magnetic drive was used for the liquid phase. The double wall of the reactor allowed the use of a water bath (Julabo, MV basis) to regulate the temperature of the liquid and gas phase during the experiments. Typical characteristics of the stirred cell reactor are given in Table 1. Table 1. Dimensions and characteristics of the stirred cell contactor.
Total reactor volume (m3) 1.245 · 10-3 Gas phase volume (m3) 1.0 · 10-3
Interfacial area (m2) 7.79 · 10-3 Gas flow (m3/s) 8.33 · 10-6
Ns liquid stirrer (min-1)a 100 Ns gas impeller (min-1) 2000
a. measured using a Philips PR 9107 stroboscope. A temperature indicator (PT - 100) and pressure transducer (Trafag, ECO 2.5 A) were used to determine the temperature and pressure during an experiment. The redox potential of the solution was monitored using a Pt/Ag redox potential electrode (WTW - ORP). The NO concentration in the outlet was measured using a NO analyzer (Thermo Electron-Model 10). The NO analyzer was calibrated before and after every experiment using NO gas mixture at known concentration. The oxygen concentration was measured with an oxygen analyzer (M&C, PMA 20). The NO

106
analyzer, the oxygen analyzer, the redox potential electrode, the temperature and pressure transducer were connected to a computer equipped with a NI - 4351 PCI (National Instrument) data acquisition card. The reactor set-up is schematically represented in Fig. 1. air
NO N2
1a 1b16
N2OCO2
1d1c
15
11
12 1311 19
17
7
18a
18b
18c
2a
B
9a 9b
8
43 5
6
2b2c2d
14
10
2e
Figure 1. Schematic representation of the experimental set-up. 1a, 1b, 1c, 1d: mass-flow controllers; 2a, 2b, 2c, 2d, 2e, 6, 8: open/close valves; 3, 4, 5: air valves and filter; 7: digital flowmeter; 9a, 9b: three way valves; B: bypass,; 10: redox potential electrode; 11: magnetic coupling and motor; 12: temperature transducer; 13: pressure transducer; 14: magnetic drive; 15: cold trap; 16: NO analyzer; 17: O2 analyzer; 18a, 18b, 18c: vacuum pump; 19: pc. 7.2.3 Preparation of the FeII(EDTA) solutions Aqueous solutions of FeII(EDTA) are extremely air-sensitive and should be handled under a protective nitrogen atmosphere. The FeII(EDTA) solution was prepared by diluting a predetermined amount of EDTA solution (Na4EDTA) in degassed water (10-4 m3). The pH was decreased from 11 to 9 by careful addition of some drops of a 1 M H2SO4 solution. The appropriate amount of FeSO4-7H2O (Fe : EDTA ratio = variable, but typically 1 : 1.1 mol/mol) was added to the EDTA solution, giving a slightly green, clear solution with a pH of about 5. Next, the solution was diluted with degassed water to 2·10-4 m3. At this stage, the pH was adjusted to the desired value by the addition of a 2 M NaOH or a 1 M H2SO4 solution. Finally, degassed water was added to adjust the total volume to 2.45·10-4 m3. 7.2.4 Description of a typical reactive absorption experiment The reactive absorption experiments were carried out batch-wise with respect to the liquid phase and continuously with respect to the gas phase. The reactor was first filled with the appropriate solution and degassed under vacuum for about 15 minutes. After degassing, the reactor was filled with nitrogen gas until atmospheric pressure was reached. The inlet gas mixture was prepared using mass flow controllers. Initially, the mixture gas was bypassed around the reactor to the analysis unit. The
107
reaction was started by closing the bypass valves and admitting the mixture gas to the reactor. The NO concentration and the concentration of oxygen in the outlet of the reactor were monitored as a function of time. The experiment was terminated when the conversion of FeII(EDTA) reached the desired value, as evident from the reading of the redox potential electrode (0 mV). 7.2.5 Determination of the FeIII(ED3A) and FeIII(EDTA) concentrations At the end of every oxidation experiment, a sample of the oxidized solution (5 · 10-5 m3) was collected and stored in darkness at 4°C. The concentrations of FeIII(ED3A) and FeIII(EDTA) in the solution were subsequently determined using Capillary Electrophoresis. As no standard material is available, the amount FeIII(ED3A) cannot be directly quantified. An estimation of the amount was given on the basis of the calibration line of FeIII(EDTA). In some cases, additional FeCl3 was added after the initial analyses and the samples were re-analysed to determine the concentrations of free EDTA and ED3A in the solutions. 7.3 Definitions The reaction between FeII(EDTA) and oxygen to form FeIII(EDTA) and EDTA degradation to form FeIII(ED3A) are the two main reactions considered in this study. The average overall reaction rates for both reactions at 100 % FeII(EDTA) conversion are determined as follows:
( )( )
end of reaction
III
IIIFe EDTA
Fe EDTA
CR
t= (5)
( 3 )( 3 )
end of reaction
III
IIIFe ED A
Fe ED A
CR
t= (6)
The integral selectivity of the degradation product FeIII(ED3A) at 100% FeII(EDTA) conversion is defined as [73]:
)3()(
)(
reaction of end),3(),(
),(
AEDFeEDTAFe
EDTAFe
measuredAEDFemeasuredEDTAFe
measuredEDTAFe
IIIIII
III
IIIIII
III
RR
R
CC
C
+=
+=σ (7)

108
7.4 Results and discussion 7.4.1 Experimental overview The rate of EDTA degradation during the reactive absorption of oxygen in aqueous FeII(EDTA) solutions, either in the presence or absence of NO, was measured in a standard stirred cell G-L contactor. A total of 20 experiments were performed, see Table 2 for an overview. All experiments but two were run to full conversion of FeII(EDTA) and as such, the reaction time was variable. The FeII(EDTA) conversion level was measured using a redox electrode and all reactions were terminated at a redox potential of 0 mV. Table 2. Experimental overview and resultsa
Exp. t (s)
T (K)
pH CO2in (vol%)
EDTA/Fe ratio (mol/mol)
CNOin (vppm)
CFeIII(EDTA)
final (mol/m3)
CFeIII(ED3A)
final (mol/m3)
σ
1 7620 323 7 5 1.1 0 10.2 0.49 0.95 2 13380 303 7 5 1.1 0 10 0.49 0.95 3 10680 323 5 5 1.1 0 10.1 0.5 0.95 4 8160 323 8 5 1.1 0 9.3 0.45 0.95 5 10200 323 7 5 2 0 10.5 0.1 0.99 6 6540 323 7 10 1.1 0 10.1 0.5 0.95 7 6120 323 7 5 1.1 0 4.9 0.29 0.94 8 8280 323 7 5 1.1 1000 10.3 0.43 0.96 9 8400 323 7 5 1.1 0 10.7 0.48 0.96 10 11640 303 7 5 1.1 0 9.6 0.51 0.95 11 8400 323 7 5 1.1 0 9 0.5 0.95 12 9480 323 7 5 1.5 0 10 0.1 0.99 13 6840 323 7 5 0.5 0 4.6 0.25 0.95 14 8340 323 7 5 1.1 1000 9.5 0.42 0.96 15.1b 1980 323 7 20 1.1 0 8.5 0.48 0.95 15.2b 5700 323 7 20 1.1 0 8.9 0.51 0.95 15.3b 11100 323 7 20 1.1 0 9.2 0.51 0.95 16.1b 4200 323 7 5 1.1 0 9 0.47 0.95 16.2b 8400 323 7 5 1.1 0 9.6 0.53 0.95 16.3b 15780 323 7 5 1.1 0 9.5 0.49 0.95
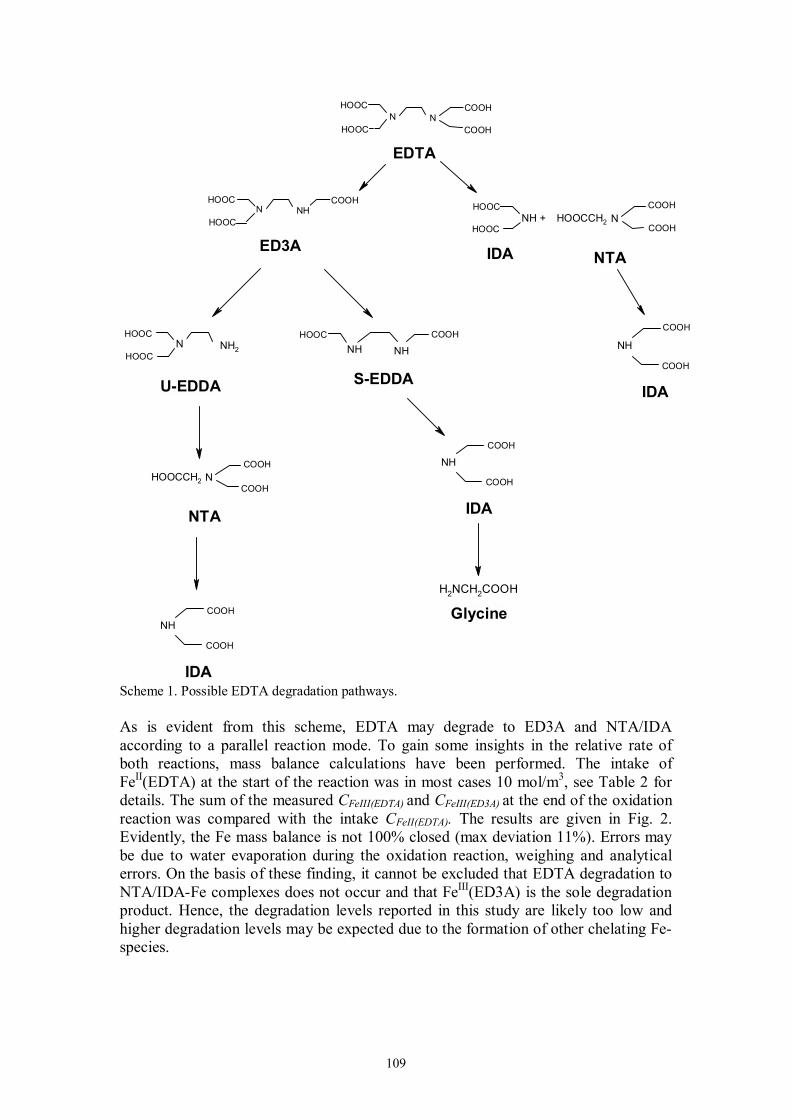
a. intake FeII(EDTA) is 10 mol/m3, except for exp. 7 and 13 (5 mol/m3) b. Exp 15 and 16 include samples collected at half conversion (1), complete conversion (2), and at twice the time necessary to reach complete conversion (3). We have selected ED3A as a probe for ligand degradation (Scheme 1). This compound is not the sole product which may be formed when EDTA is degraded. A large number of N-containing species like NTA, IDA and glycine may be formed by EDTA degradation [56, 58]. A schematic overview of possible reaction pathways and products is given in Scheme 1.
109
EDTA
N NCOOH
COOH
HOOC
HOOC
S-EDDA
NHCOOH
NHHOOC
NTA
HOOCCH2 NCOOH
COOHNH +
IDAHOOC
HOOC
NH
COOH
COOH
IDA
ED3A
N NHCOOHHOOC
HOOC
N NH2
U-EDDA
HOOC
HOOC
GlycineH2NCH2COOH
NH COOH
COOH
IDANTA
HOOCCH2 NCOOH
COOH
NH COOH
COOH
IDA Scheme 1. Possible EDTA degradation pathways. As is evident from this scheme, EDTA may degrade to ED3A and NTA/IDA according to a parallel reaction mode. To gain some insights in the relative rate of both reactions, mass balance calculations have been performed. The intake of FeII(EDTA) at the start of the reaction was in most cases 10 mol/m3, see Table 2 for details. The sum of the measured CFeIII(EDTA) and CFeIII(ED3A) at the end of the oxidation reaction was compared with the intake CFeII(EDTA). The results are given in Fig. 2. Evidently, the Fe mass balance is not 100% closed (max deviation 11%). Errors may be due to water evaporation during the oxidation reaction, weighing and analytical errors. On the basis of these finding, it cannot be excluded that EDTA degradation to NTA/IDA-Fe complexes does not occur and that FeIII(ED3A) is the sole degradation product. Hence, the degradation levels reported in this study are likely too low and higher degradation levels may be expected due to the formation of other chelating Fe-species.

110
0 2 4 6 8 10 12 14 16 18 20-0.08
-0.06
-0.04
-0.02
0.00
0.02
0.04
0.06
0.08
0.10
0.12
[1-(C
FeIII
(ED
TA)+C
FeIII
(ED
3A))/C
0 FeII(
ED
TA)]
n experiment
Figure 2. Mass balance calculations for Fe. For all experiments, EDTA was applied in excess. Typically, a 10% excess of EDTA on Fe was used, although a number of experiments were carried out at higher values (Table 2). At the end of the reactions, the amount of EDTA and ED3A bound to Fe was determined. To gain insights in the fate of the free, uncomplexed EDTA present at the start of the reaction, additional measurements were performed. A number of product samples (e.g. exp 12) were re-analysed after the addition of an excess of FeCl3, to ensure complexation of all free EDTA and related ligands. For exp 12 (EDTA/Fe ratio = 1.5), the amount of FeIII(EDTA) after the reaction was 10.0 mol/m3, whereas the amount increased to 15.1 mol/m3 upon the addition of FeCl3. These results clearly indicate that the free, uncomplexed ligand in solution was EDTA and not ED3A. Based upon this result, it may be concluded that ED3A complexed to Fe is not rapidly exchanged with free EDTA under the conditions employed in our experimental studies (eq (8)) and that the measured Fe-chelate product composition is a proper measure of the EDTA to ED3A conversion.
AEDEDTAFeEDTAAEDFe IIIIII 3)()3( ++ (8) These findings provide some interesting clues with respect to the mechanism of EDTA degradation by molecular oxygen (vide infra). 7.4.2 Base case A first group of experiments was performed at typical BiodeNOx process conditions. (experiments 1, 9, 11, and 16.2, see Table 3 for process conditions). The reaction time for 100% FeII(EDTA) conversion was about 8400 s. Using these conditions, an average of 5% of the initial amount of FeII(EDTA) was converted into FeIII(ED3A). Reproducibility appears to be good and the integral selectivity, σ, calculated using eq (7), was 0.95 +/- 0.004.

111
Table 3. Overview of the experimental conditions
Variable Base case Range CO
Fe(EDTA) (mol/m3) 10 5 - 10 CO2 (% vol) 5 5 - 20 CNO (vppm) 0 0 - 1000 pH 7 5 - 8 T (K) 323 303 � 323 Ratio [EDTA]/[Fe] 1.1 1.1 - 2
7.4.3 Time effects A number of experiments were conducted at shorter (4200 s) and longer reaction times (15780 s) than the base case (8400 s). For longer oxygen exposure times, the concentration of FeIII(ED3A) formed was approximately equal to that obtained for the base case (Table 2, exp 16.3). This result indicates that on the time scale of our experiments and when applying typical BiodeNOx conditions, FeIII(EDTA) is not actively involved in the degradation process of EDTA. These observations are in line with the research of Motekaitis et al. on the thermal degradation of FeIII(EDTA) [56]. Here, substantial EDTA oxidation occurs only at significant rates at temperatures exceeding 100°C. Photodegradation of FeIII(EDTA) to form ED3A, EDDA, IDA and glycine already occurs at room temperature. Our experiments were performed in the darkness and excessive photodegradation of the product FeIII(EDTA) is therefore not expected. The observation that extended reaction times do not affect the EDTA degradation levels also indicates that the degradation reaction stops when all FeII(EDTA) is oxidized to FeIII(EDTA). This is indicative for a mutual interaction between the oxidation reaction and the degradation of EDTA. When terminating the oxidation reaction at half of the reaction time needed for full FeII(EDTA) conversion, the CFeIII(ED3A) measured is equal to the value obtained at full conversion. This is not surprising, as oxidation of the highly air sensitive solution during sampling cannot be avoided, leading to 100% FeII(EDTA) conversion. As a consequence, the CFeIII(ED3A) is expected to be equal to that of the base case. 7.4.4 Temperature effects A number of experiment were performed at temperatures lower than the base case (T = 303 K, experiments 2 and 10, Table 2). The CFeIII(ED3A) after reaction was about equal for both reaction temperatures. Hence, the selectivity σ of the process is not a function of the temperature. Evidently, the average rate of EDTA degradation ( )3( AEDFeIIIR ) and the average rate of EDTA oxidation ( )(EDTAFeIIIR ) are higher at higher temperatures (Fig. 3). In combination with the observation that the integral selectivity is not a function of the temperature, these findings again imply the existence of a strong link between the rate of the oxidation of the ferric chelate complex and of the degradation reaction.

112
300 305 310 315 320 3250
5
10
15
20
0
5
10
15
20
RFe
III(E
DTA
) * 1
04
RFe
III(E
D3A
)* 10
5
T
Figure 3. )3( AEDFeIIIR (▄) and )(EDTAFeIIIR (●) as a function of the temperature at 100% FeII(EDTA) conversion. See Table 2 for the other conditions. 7.4.5 Effects of the initial pH The base case was performed at an initial pH of 7. Two additional experiments were performed at an initial pH of 5 and 8. The integral selectivity is 0.95 for all three pH values, indicating that the pH does not have a strong effect on the EDTA degradation levels. The average reaction rates, )3( AEDFeIIIR and )(EDTAFeIIIR , calculated according to eq (5) and (6), are reported in Fig. 4. The average rates are slightly depending on the pH. Again the trends for both the )3( AEDFeIIIR and )(EDTAFeIIIR are similar, leading to a constant σ.
4 5 6 7 8 90
5
10
15
20
0
5
10
15
20
RFe
III(E
DTA
) *10
4
RFe
III(E
D3A
) *10
5
pH
Figure 4. pH effect on )3( AEDFeIIIR (▄), )(EDTAFeIIIR (●) at 100% FeII(EDTA) conversion. See Table 2 for the other conditions.
113
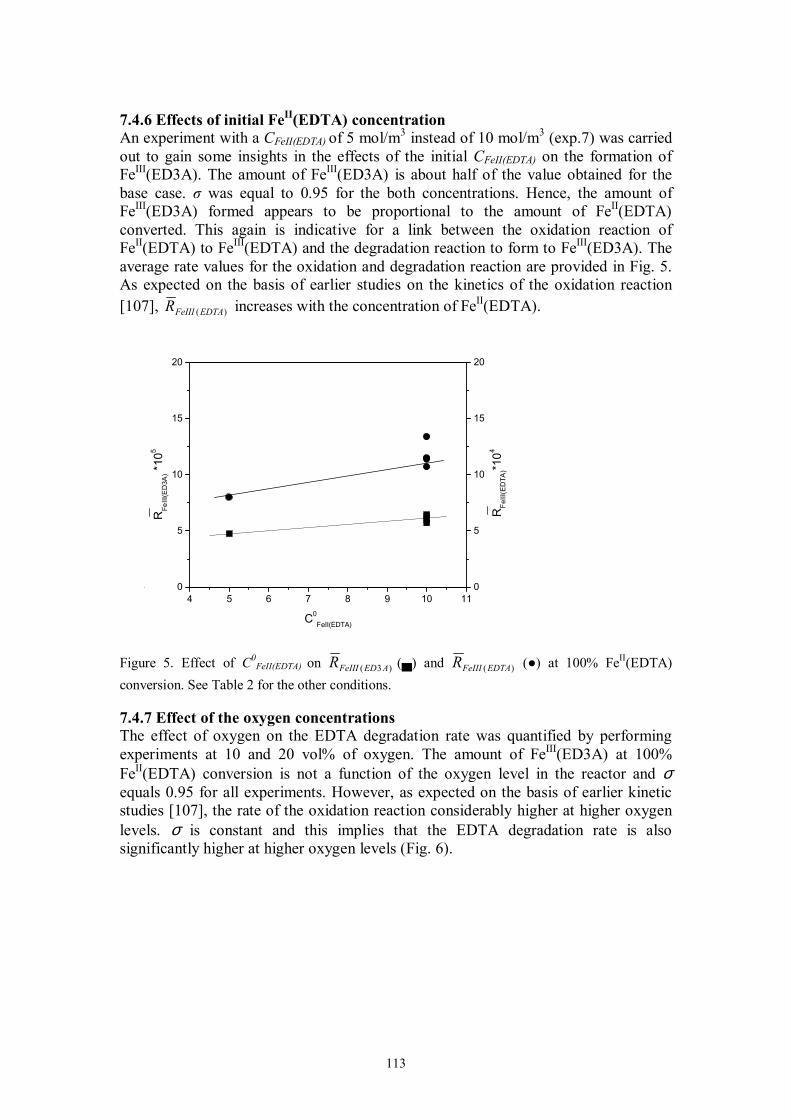
7.4.6 Effects of initial FeII(EDTA) concentration An experiment with a CFeII(EDTA) of 5 mol/m3 instead of 10 mol/m3 (exp.7) was carried out to gain some insights in the effects of the initial CFeII(EDTA) on the formation of FeIII(ED3A). The amount of FeIII(ED3A) is about half of the value obtained for the base case. σ was equal to 0.95 for the both concentrations. Hence, the amount of FeIII(ED3A) formed appears to be proportional to the amount of FeII(EDTA) converted. This again is indicative for a link between the oxidation reaction of FeII(EDTA) to FeIII(EDTA) and the degradation reaction to form to FeIII(ED3A). The average rate values for the oxidation and degradation reaction are provided in Fig. 5. As expected on the basis of earlier studies on the kinetics of the oxidation reaction [107], )(EDTAFeIIIR increases with the concentration of FeII(EDTA).
4 5 6 7 8 9 10 110
5
10
15
20
0
5
10
15
20
RFe
III(E
DTA
)*104
RFe
III(E
D3A
) *10
5
C0FeII(EDTA)
Figure 5. Effect of C0
FeII(EDTA) on )3( AEDFeIIIR (▄) and )(EDTAFeIIIR (●) at 100% FeII(EDTA) conversion. See Table 2 for the other conditions. 7.4.7 Effect of the oxygen concentrations The effect of oxygen on the EDTA degradation rate was quantified by performing experiments at 10 and 20 vol% of oxygen. The amount of FeIII(ED3A) at 100% FeII(EDTA) conversion is not a function of the oxygen level in the reactor and σ equals 0.95 for all experiments. However, as expected on the basis of earlier kinetic studies [107], the rate of the oxidation reaction considerably higher at higher oxygen levels. σ is constant and this implies that the EDTA degradation rate is also significantly higher at higher oxygen levels (Fig. 6).

114
4 6 8 10 12 14 16 18 20 220
5
10
15
20
0
5
10
15
20
RFe
III(E
DTA
) *10
4
RFe
III(E
D3A
) *10
5
CO2in (%)
Figure 6. )3( AEDFeIIIR (▄) and )3( AEDFeIIIR (●) as a function of the concentration of oxygen at 100% FeII(EDTA) conversion. See Table 2 for the other conditions. 7.4.8 Effect of NO In the BiodeNOx process, the desired reaction is the reaction between NO and FeII(EDTA) whereas the reaction between FeII(EDTA) and oxygen is undesired and should be suppressed. To mimic the FeII(EDTA) degradation rates under actual BiodeNOx conditions, two experiments were carried out in the presence of NO (1000 ppmv, exp 8 and 14). In both cases, the amount of FeIII(ED3A) was slightly lower (0.43 mol/m3) than that of the base case (0.49 mol/m3) and as such the selectivity increased from 0.95 to 0.96. Hence, it appears that the presence of NO has a small but significant effect and results in lower amounts of degradation products. )(EDTAFeIIIR , represented in Fig. 7, is not affected significantly when NO was present, which is in accordance with the results previously obtained in studies on the simultaneous absorption of NO and oxygen in FeII(EDTA) solutions [118]. However, )3( AEDFeIIIR decreased slightly in the presence of NO, leading to improved selectivity when NO is present.

115
0 200 400 600 800 10000
5
10
15
20
0
5
10
15
20
RFe
III(E
DTA
)*104
RFe
III(E
D3A
) *10
5
CNOin
Figure 7. )3( AEDFeIIIR (▄) and )(EDTAFeIIIR (●) as a function of the CNO at 100% FeII(EDTA) conversion. See Table 2 for the other conditions. 7.4.9 Effect of the EDTA/Fe ratio A number of experiments with a [EDTA]/[Fe] ratio different from the base case (1.1) were performed (exp. 5, 12, 13). The amount of FeIII(ED3A) at the end of the reaction is a strong function of the [EDTA]/[Fe] ratio, see Fig. 8. At higher ratios, the amount of FeIII(ED3A) is considerably reduced. As a result, σ is increased significantly from 0.95 for the base case to 0.99 when the [EDTA]/[Fe] ratio exceeds 1.5. Hence, it appears that the application of an excess of EDTA on Fe has a very positive effect and results in a dramatic decrease in the EDTA degradation levels. When performing experiments at [EDTA]/[Fe] ratio�s below 1 (exp 13, ratio = 0.5), σ is equal to the base case (0.95). For this experiment, the actual concentration of FeII(EDTA) at the start of the reaction is expected to be equal to 5 mol/m3. Similar results as found for an experiment with 5 mol/m3 (exp 7) of FeII(EDTA) at the start of the reaction are expected and indeed observed. In Fig. 9, the average rates ( )3( AEDFeIIIR and )(EDTAFeIIIR ) are provided. For ratio�s of [EDTA]/[Fe] above 1.1,
)3( AEDFeIIIR decreased considerably, whereas the )(EDTAFeIIIR is about constant. Hence, the positive effects observed when performing experiments at high EDTA/Fe ratio�s are due to a reduction in the degradation rate without affecting the oxidation rate. 7.5 Discussion In the previous paragraph, the effect of various process conditions on the EDTA degradation levels when reacting FeII(EDTA) with molecular oxygen to form FeIII(EDTA) were explored. Based on the results obtained at reaction times exceeding the time for 100% FeII(EDTA) conversion, it appears that FeIII(EDTA) induced ligand degradation does not play an important role. This is in line with literature data on the rate of EDTA degradation in the presence of FeIII(EDTA), which is known to proceed only at a significant extent at temperatures exceeding 100°C [56].

116
0.0 0.5 1.0 1.5 2.0 2.5
0.1
0.2
0.3
0.4
0.5
0.6
0.7
0.8
CFe
III(E
D3A
)
[EDTA]/[Fe]
Figure 8. Amount of FeIII(ED3A) as a function of the ratio [EDTA]/[Fe] at 100% FeII(EDTA) conversion. See Table 2 for the other conditions.
0.5 1.0 1.5 2.00
5
10
15
20
0
5
10
15
20 R
FeIII
(ED
TA) *
104
RFe
III(E
D3A
) *105
[EDTA]/ [Fe]
Figure 9. )3( AEDFeIIIR (▄) and )(EDTAFeIIIR (●) as a function of the EDTA/Fe ratio at 100% FeII(EDTA) conversion. See Table 2 for the other conditions. It was shown that the integral selectivity σ at 100% FeII(EDTA) conversion was not a function of the oxygen concentration (5 - 20 vol%) and the initial FeII(EDTA) concentration (5 - 10 mol/m3). These findings suggest that the overall average rate of EDTA degradation is coupled to the overall average rate of the oxidation reaction. In other words, when the oxidation rate increases, the EDTA degradation increases proportionally. This suggests a strong link between the molecular mechanism of the oxidation and degradation reaction and implies the existence of a common intermediate. Seibig and van Eldik have studied the kinetics of the reaction between FeII(EDTA) with molecular oxygen in detail using stopped flow techniques [98]. On the basis of
117
their findings, the following molecular mechanism was proposed:
−++− + )])(([)])(([ 22
2 OHEDTAFeHOHEDTAFe IIII (9)
OHOEDTAFeOOHEDTAFe IIII2222 )])(([)])(([ ++ −+−+ (10)
−−+−+ )])(([)])(([ 22 OEDTAFeOEDTAFe IIIII (11)
222
222
2
22
)])(([2)]()()[(
)])(([)])(([
OHOHEDTAFeOHEDTAFeOFeEDTA
OEDTAFeOHEDTAFe
III
IIIIII
IIIII
+
+
+
+
−+−+
−−+−+
(12)
OHOHEDTAFeOHOHEDTAFe IIIII
22222 ])([2)])(([2 ++ +−+ (13) Wubs [57] proposed a mechanism which is slightly different from that proposed by Seibig and van Eldik, however also contains H2O2 as an intermediate product. The question arises which of the intermediates is responsible for EDTA degradation. Wubs proposed that the intermediate H2O2 is responsible and that reaction with either free and coordinated EDTA may occur and lead to EDTA degradation products [57]. Chen et al. proposed [58] that OH radicals formed by Fenton like chemistry are responsible for the degradation reaction:
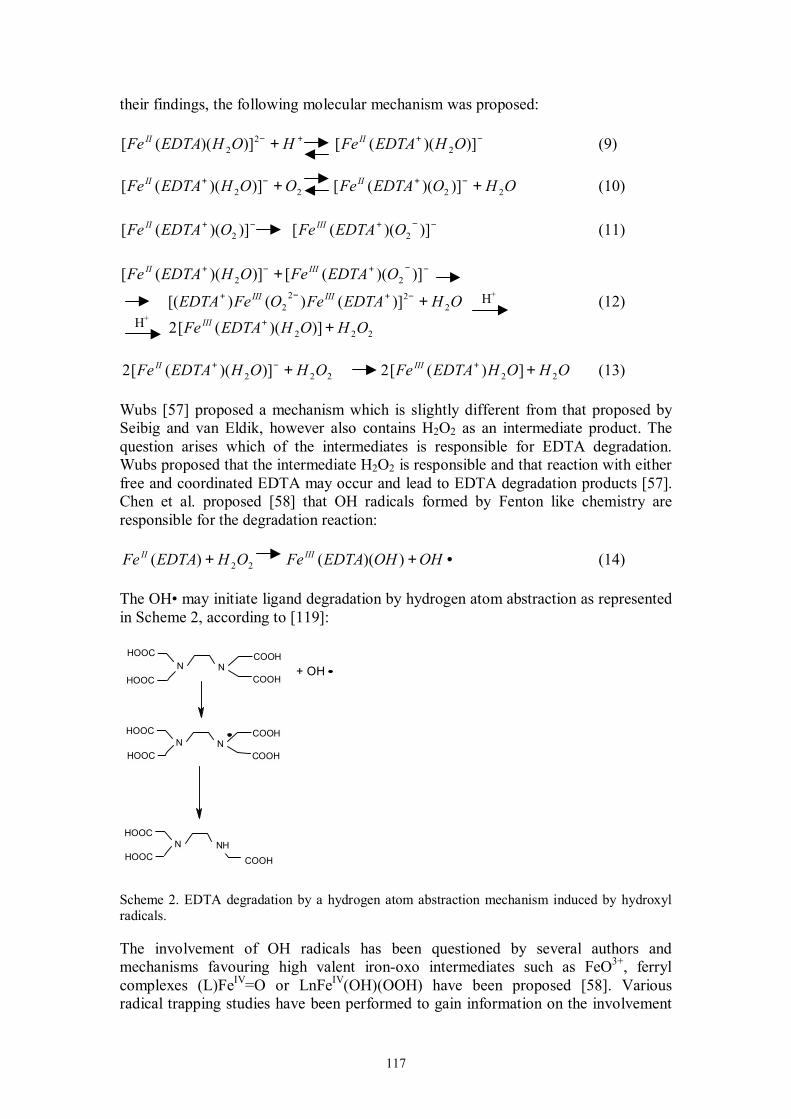
•++ OHOHEDTAFeOHEDTAFe IIIII ))(()( 22 (14) The OH� may initiate ligand degradation by hydrogen atom abstraction as represented in Scheme 2, according to [119]:
N NHCOOH
HOOC
HOOC
+ OHN NCOOH
COOH
HOOC
HOOC
N NCOOH
COOH
HOOC
HOOC
Scheme 2. EDTA degradation by a hydrogen atom abstraction mechanism induced by hydroxyl radicals. The involvement of OH radicals has been questioned by several authors and mechanisms favouring high valent iron-oxo intermediates such as FeO3+, ferryl complexes (L)FeIV=O or LnFeIV(OH)(OOH) have been proposed [58]. Various radical trapping studies have been performed to gain information on the involvement
H+
H+

118
of OH radicals, however, with conflicting results [58, 98]. On the basis of the literature available, it is not possible to draw definite conclusions on the common intermediate in the oxidation and ligand degradation reaction. However, one of our experimental observations is worth mentioning. It has been shown that the excess of EDTA ligand present at the start of the reaction is inert and is not degraded to ED3A. This suggests that ligand degradation takes place at the metal center and not in solution. The experimental studies have revealed that the level of FeIII(ED3A) after treatment of FeII(EDTA) solutions with oxygen are reduced considerably when an excess of EDTA is present, and particularly when the [EDTA]/[Fe] ratio exceeds 1.5. In addition, the presence of NO also reduces EDTA degradation levels, although to a lesser extent than uncomplexed EDTA. It appears that the rate of oxidation is not affected by EDTA and NO whereas the rate of ligand degradation is reduced. So far, we do not have a sound explanation for this observation. However, it is worthwhile to notice that both NO and EDTA are Lewis bases, capable of coordinating to an Fe-center. Upon coordination, both may affect the geometry of the various Fe-species present in solution and in this way affect and alter the favoured reaction pathways. Further molecular and kinetic studies with a broad range of Lewis bases will be required to check this hypothesis. 7.6 Conclusions The extent of EDTA degradation when reacting FeII(EDTA) with molecular oxygen in a G-L stirred cell contactor was studied in a range of process conditions relevant for the BiodeNOx process. ED3A, one of the possible degradation products, was used as a probe to assess the degradation levels. At typical BiodeNOx conditions (T = 323 K, C0
FeII(EDTA) = 10 mol/m3, pH = 7, [EDTA]/[Fe] = 1.1, CO2 = 5 vol%), about 5% of the bound EDTA was converted to ED3A. The rate of ED3A formation is increased when using higher temperatures, higher oxygen levels and higher initial Fe concentrations. However, the integral selectivity towards FeIII(EDTA) remained constant, suggesting that the rate of oxidation of FeII(EDTA) to FeIII(EDTA) is affected to a similar extent. This suggests a mutual interaction between the oxidation and the degradation reaction and the existence of a common intermediate (OH� or H2O2). The presence of NO and an excess of (free) EDTA resulted in reduced degradation rates. This implies that the BiodeNOx process might be best performed using an excess of EDTA on Fe. Further studies will be required to determine the optimum EDTA/Fe ratio and to assess the impact of an excess of EDTA on bioreactor performance.