university of nigeria - unn.edu.ng of... · purpose of the study-- --- -- ... re-statement of the...
TRANSCRIPT
University of Nigeria Research Publications
Aut
hor
ADEJOBI ABEL OLUTUNDE
PGIMED104139155
Title
ASSESSMENT OF POVERTY LEVEL AND
ENVIRONMENTAL DEGRADATION AMONG FARMERS IN CENTRAL AGRICULTURAL ZONE OF OSUN
STATE.
Facu
lty
Education
Dep
artm
ent
VOCATIONAL TEACHER EDUCATION,
Dat
e MARCH, 2007
Sign
atur
e
ASSESSMENT OF POVERTY LEVEL AND ENVIRONMENTAL DEGRADATION AMONG FARMERS IN CENTRAL AGRICULTURAL
ZONE OF OSUN STATE.
ARESEARCHPROJECT
ADEJOBI ABEL OLUTUNDE PGIMED104139155
DEPARTMENT OF VOCATIONAL TEACHER EDUCATION, UNIVERSITY OF NIGERIA, NSUKKA
MARCH, 2007

ASSESSMENT OF POVERTY LEVEL AND ENVIRONMENTAL DEGRADATION AMONG FARMERS IN CENTRAL AGRICULTURAL
ZONEOFOSUNSTATE.
A RESEARCH PROJECT
ADEJOBI ABEL OLUTUNDE PG/MED/04/39155
DEPARTMENT OF VOCATIONAL TEACHER EDUCATION, UNIVERSITY OF NIGERIA, NSUKKA IN PARTIAL FULFILMENT OF THE REQUIREMENTS
FOR THE AWARD OF MASTERS DEGREE IN AGRICULTURAL EDUCAIOTN
MARCH, 2007

APPROVAL PAGE
TIHIS THESIS HAS BEEN APROVED FOR THE DEPARTMENT OF VOCATIONAL TEACHER EDUCArT'ION
UNIVERSITY OF NIGIXIA, NSLJICKA.
........................... Dr. E.C. OSINEh4
SUPERVISOR
,. - # -- --
M Y " / ./=- I' ...... .................. .,:,..<. "*'
E X T E R N A J ; K ~ A M ~ E R I-
- . .... /<..
DEAN'OF ?'HE F
CERTIFICATION
Mr. ADEJOBI ABEL OLUTUNDE; a post graduate student of the
Department of Vocational Teacher Education with Registration Number
PG/MED/04/39155, has satisfactorily completed the requirement for the masters
degree in Agricultural Education. The work embodied in the project is original
and has not been submitted in part or full for any other degree of this or any
other University.
-7- >!=- : --
. . . . . . . . . . . . . . . . . . . . . . - . . . . . . . . . . Dr. E.C. OSINEM - Supervisor
ADEJOBI ABEL OLUTUNDE Candidate

DEDICATION
This project is dedicated to Almighty God.
ACKNOWLEDGEMENTS
With deep sense of reverence and adoration, I give thanks to Lord of
lords, King of kings, Almighty God for his protection, provision and wisdom he
gave him throughout this work. His special gratitude goes to his project
supervisor Dr. E.C. Osinem for his professional and brotherly advice during this
work. He was a source of inspiration for the period of this work.
I also wish to put to record the contributions of all the lecturers in the
Department of Vocation Teacher Education particularly the H.0.D Prof. N.J.
Ogbazi, Prof. S.O. Olaitan, Prof. O.M. Okoro, Dr. (Mrs.) T.C. Ogbuaya and Dr.
R . 0 Mama. He will ever remain grateful to them
Fondly remembered are my colleagues and my friends in the campus and
office, they include Mr. Adebiyi, Mrs. Oyinlola, Mrs. Adebayo. Gbenga Alao of
RUDEP, Akindoyin P.0, Mr. ljiyokun of Ossadep, Olusola, Amoyedo, Jekayinfa,
Adewole, ~akare , Gbadamasi, Keke Jude, Akpovero, Mr. Ajao of Adetoro
Commercial Centre and host of others.
My special thanks go to Prophet and Deaconess Oluwatimehin, Envag.
Ola, Olaobju, Taiwo and Kunle, pastor Ovada and other members of
Reconciliation Prayer Ministries Osogbo, Osun State for their daily Prayers that
sustained my family. May God bless you all.
Lastly special thanks goes to my darling wife Bolatito Elizabeth and my
children Opeyemi Abiodun, Adenike Mary and Deborah Ayomide for their
patience and endurance during the period of this research work.
TABLE OF CONTENTS
Title Page-- -- -- -- -- -- -- -- -- --
Approval Page -- -- -- -- -- -- -- -- --
Certification -- -- -- -- -- -- -- -- --
Dedication -- -- -- -- -- -- -- -- -- --
Acknowledgement -- -- -- -- -- -- -- --
Table of Contents-- -- -- -- -- -- -- -- --
List of Figure-- -- -- -- -- -- -- -- --
Abstract -- -- -- -- -- -- -- -- -- --
CHAPTER ONE: INTRODUCTION -- -- -- -- -- --
Background of the Study ---- -- -- -- -- --
Statement of Problem -- -- -- -- -- -- --
Purpose of the Study-- --- -- -- -- -- --
Significance of the Study-- -- -- -- -- -- --
Research Questions-- -- -- -- -- -- --
Research Hypothesis -- -- -- -- -- -- --
Scope of the Study-- -- -- -- -- -- --
Assumption of the Study -- -- -- -- -- -- --
CHAPTER TWO: REVIEW OF RELATED LITERATURE -- -- --
Conceptual Framework (Impact Analysis Model)-- -- --
- Effects of air pollution on Human, Animal and plants--- --
- Effects of water pollution on man, Animal and plants--- --
- Effects of land pollutionldegradation on human, Animal and plants -- -- -- -- -- -- -- --
Poverty Concepts -- -- -- -- -- -- -- --
i
II
iii
i v
v
vi
ix
X

- Absolute and Relative poverty-- -- -- --
- Objective and subjective perspective-- -- --
- Physiological and Sociological derivatives-- --
Assessment of Poverty-- -- -- -- -- --
- Methodological approach -- -- -- --
- Participatory Poverty Assessment (PPA) method poverty indicators-- -- -- -- --
Poverty Indicators ---- -- -- -- -- --
Environmental degradation indicators measures for reducing degradations-- -- -- -- --
Review of Related Empirical Studies -- --
Summary of Related Literature-- -- --
CHAPTER THREE: METHODOLOGY ---- --
Design of the Study -- -- -- --
~ r e a of the Study -- -- -- -- --
Population of the Study -- -- -- --
Sample of the Study -- -- -- --
Instrument for Data Collection -- -- --
Validity of the Instrument ---- -- --
Reliability of the Instrument-- -- --
Administration of the InstrumentIMethod of Data Collection---
Method of data Analysis -- -- -- -- -- -- --
CHAPTER FOUR: PRESENTATION AND ANALYSIS OF DATA-- ---
Result of Research Question I -- -- -- -- -- --
Test of Hypothesis 1 -- -- -- -- -- -- --
Result of Research Question 2 -- -- -- -- -- --
vii
33
33
34
35
36
37
38
44
48
52
54
54
54
54
55
55
56
56
56
57
60
60
61
62
Result of Research Question 3-- -- -- --
Test of Hypothesis 2-- -- -- -- --
Result of Research Question 4-- -- -- --
Result of Research Question 5-- -- -- --
Findings -- -- -- -- -- -- --
Discussion of Findings -- -- -- -- --
CHAPTER FIVE: SUMMARY, CONCLUSION AND RECOMMENDATIONS -- -- --
Re-Statement of the Problem -- -- -- --
Summary of the Procedure Used -- -- --
Principal Findings -- -- -- -- -- --
Conclusion ---- -- -- -- -- --
Implication of the Study -- -- -- -- --
Recommendation -- -- -- -- -- --
Suggestion for Further Research -- -- --
REFERENCES -- -- -- -- -- -- --
APPENDICES -- -- -- -- -- -- --
Appendix I: Request for Face Validation of Instrument---
Appendix II: Letter of Introduction-- -- -- --
Appendix Ill: Reliability of instrument-- -- -- --
Appendix IV: Formular for analysis of variance uced for testing hypothesis 1 -- -- -- --
Appendix V: Formular for calculating correlation using Pearson product moment correlation coefficient (Raw score method)-- -- -- -- --
Appendix VI: Questionnaire-- -- -- -- -- --

LIST OF FIGURE
1. Impact Analysis Model -- -- -- -- -- -- -- 13

LISTS OF TABLES
2.1 Atmospheric Deposition Rate of Dust for Some Nigerian Site ... .. . ... 15
2.2 Major Air Pollutants - Their sources and Health Effects.. . . 17
2.3 Damage to Materials from Air Pollutions .. . . . . . ... .. . . . .. 19
Distribution and Return of Questionnaire-- -- -- -- --57
Mean ratings of responses of farmers on the extent of environmental degradation in Central Agricultural Zone of Osun State-- -- -- -- -- -- -- -6 1
Summary of ANOVA for testing the mean difference of the responses of 4 categories of farmers on the extent of environmental degradation in the study area-- -- -- -- --63
Mean rating of responses of farmers on their level of poverty-- --64
Comparison between the mean ratings of responses of farmers on extent of environmental degradation and poverty level of the farmers-65
Correlational testing between mean ratings of responses for environmental degradation and poverty level of farmers-- -- --67
~ e a n ratings of responses of farmers on other pre-disposing factors of environmental degradation in the zone-- -- -- -- -68
Mean rating of responses of farmers on the efforts of ministry of environment and other stakeholders in combating environmental degradation in the zone-- -- -- -- -- -70

Abstract
The study focused on the assessment of poverty level and environmental
degradation among farmers in the central Agricultural Zone of Osun State.
Specifically the study sought for: (1) the extent of the manifestations of
environmental degradation in the agricultural zone; (2) the level of poverty
among farmers in the study area; (3) determination of the relationship between
environmental degradation and poverty level of the farmers; (4) other pre-
disposing factors to environmental degradation in the area; and (5) suggest ways
of reducing environmental degradation, so as to avert poverty in the study area.
The area of the study was the Central Agricultural Zone of Osun - State, which
was made up of 9 Local Government Areas. Survey research design was
employed for the study covering a target population of 1,220 registered farmers,
out of which a sample of 120 farmers was taken. Fifty two (52) items structured
questionnaire divided into five sections (A, B, C, D & E) was developed,
validated, tested for reliability and administered. Out of 150 copies given out, 120
copies were duly completed and returned mean and standard deviation was
used to answer the research questions while ANOVA was used to test
hypothesis 1, Pearson product moment correlation coefficient together with t-
transformation was used to test hypothesis 2 at .05 level of significance. The
findings of the study revealed that: environmental degradation manifested to
higher extent in the area, level of poverty among the farmers in the area was
equally high; there was a close association and significant relationship between
poverty and environmental degradation in the area. The study recommended
that: (i) faculties of education in universities and other institutions of higher
learning should incorporate Environmental Agriculture into their training
programme; (ii) officials of the ministries should use the findings in making
reform in secondary school Agricultural Science curriculum; and (iiiO State and
Local Governments can use the findings to organize radio talk, workshop and
seminars for their farmers.

CHAPTER ONE
INTRODUCTION
Background of the Study
Agriculture accounts for most land use in developing Countries and thus is
probably the single most powerful influence on environmental quality. At the
same time, agriculture remains the principal livelihood of the rural poor (Malik,
1999). Yet the patterns of rural population growth, agricultural expansion and
intensification and income growth projected for the next few decades pose
serious challenges to achieving both environmental improvements and rural
poverty reduction (Pinstrup, Pandya and Rosegrant, 1977).
Although much has not been written about the relationship between
poverty and the environment and a lots of questions remain largely un answered.
Thus the needs for this research work to assess poverty and environmental
degradation among farmers in central Agricultural zone of Osun State, Nigeria.
The world Development Report (1994) defined poverty from economic
perspective, as the inability to attain a minimal standard of living. In the same
vein Sen (1984) pointed out that a family is poor, if her total earnings are in
, sufficient to obtain the minimum necessities for the maintenance of a merely
physical efficiency.
Anagbogu (2000) sees poverty as when a nation is unable to meet her
education, social, political and psychological needs, its regarded as being poor.
Thus, she defines poverty as the inability of a Country to cope with her economic
and social problems. Adesanya (1998) in her view, defines poverty as the state of
living with less than the smallest income necessary to provide the minimum
standard of living. That is to say, inability to attain a minimum standard of living.
Poverty is therefore influenced by age, education, nature of job. Hence the
culture of poverty is characterized by low income, low educational attainment and
occupational status which resulted in low life style.
In the same vein, Ukwu (1998) simply relate poverty to people as a serious
in adequacy of economic condition, a situation of not having access to condusive
environment and its facilities and opportunities for decent living. While
Okorodudu-Fibura (2000) in her own, viewed poverty as the state of being poor,
, or existing in too small amount, scarcity or lack. To be poor literally means having
a little money with which to buy ones basic needs. This may be caused by so
many factors such as low economic growth, low productivities and low wages in
the informal sectors, economic mismanagements and macro-economic instability,
Deficiency in the labor market resulting a limited job growth, decline in the quality
of social services and neglect of rural area, customs and tradition of people
among many other things.
Moreover poverty is usually manifested and can be measured by using the
following indices: High infant mortality rate, Hunger, Lack of access to safe
drinking water, High level of illiteracy and unemployment, low income and Low
GDP, Poor shelter, poor clothing and Lack of access to modern health facilities
among other things.
The New Book of Knowledge (2003) reported that in a broadest sense
environment is the surrounding in which living things grow, reproduce and die. He
emphasized that the environment include the Earth, the water, the air and all
factors that help or hurt living things chances of surviving.
United Nations (1996) classified the environment as either cultural or
physical. The physical environment is the natural environment which consists of

the Biosphere, Atmosphere, Hydrosphere and Lithosphere. The cultural
environment has to do in general with the way of life of a set of people in a
specific location. The existence of man depends partly on the exploration and
exploitation of the physical environment around him and his way of life as
influenced by his Cultural environment. Consequently the four basic components
of the physical environment are subject to the influence of man and of institutions
of the society in the process of economic growth and development.
Nigerian Environmental studylAction Team - NEST (1991) explained that
the most important things, which make the earth's environment suitable for plant
and animal life is its envelope of air called the atmosphere. It is made up of just
the right combinations of nitrogen, oxygen, argon, carbon iv oxide and several
other gases. It acts as an effective shield against dangerous forms of radiation
from the sum. It also provides us with conditions of temperature and humidity
without which life could not exist. Moreover its weather condition affect human life
in one way or another, from farming activities to the movement of nomadic
pastoralist, from building construction to industries and aviation.
Webster's Encyclopedic unabridged Dictionary of English Language
. ('19941 demed Uegradari-on as pfiysrcaf or geofogicar - the wearrng aown or tne -

The problem created by the natural disasters of floods and drought are
worsened by human interaction with the environment. Thus various human
activities culminated with poverty are helping to aggravate the problems of floods
and erosion in terms of both the frequency and magnitude: Human use of land
has also combined with the drought to promote desertification, the process by
which desert - like conditions are formed in area which lie outside the desert.
Also there are yet other human activities which pollute the atmosphere and
degrade the environment. The population explosion together with industrial and
technological advances have resulted in increased needs for food, shelter, better
comfort and a higher standard of living, and thus maximized the technical ability
of successive generation to explore and exploit the environment. This sequence
of events has in turn caused dislocation in many of the environmental process
that support life and sustained development.
Titilola (2005) explained that, in spite of the acknowledged and important
role of the environment in production and productivity in the agricultural sectors of
the economy, adequate attention is not often given to the proper use of the
environment in order to realize maximum benefits. This view stems from the
contention that several activities inimical to the efficient use and exploitation of
the environment are often embarked upon. Firstly, in appropriate farming systems
and technologies leave the soil worse off. Secondly, the desire to obtain mineral
resources in the shortest possible time in order to realize adequate financial
resources has resulted in the environmentally dangerous exploitation of mineral
resources such as petroleum, Tin, Gold and other solid minerals. Thus there is
air, soil and water pollution. With polluted air, water and Soil, and hence food
Crop, fodder, fish and wildlife, human beings in general and rural people in

particular are prone to ill health. Thirdly, certain government policies have also
adversely affected the Nigerian rural environment. In particular, the absence of a
policy compelling exploring and extracting industries to re-invest and repair the
damaged soil. However, the damaged environment is measured by the following
indices: Soil erosion, Poor vegetative growth, Soillland degradation,
Desertification, Climatic change, Pollution, Poor water quality and Lost of wild life
and Biodiversity.
The indices above can be used as a parameter to conceptualise and
assess the prevalence of poverty and devise strategies for eliminating it. The
term assessment therefore "is the collection of data to specify and verify
problems and to aid in decision making" (Salvia and Ysseldyke, 1985). While
John and Jeffrey (1999) defined Assessment as the process by which data are
collected and reviewed about an individual or object in term of behaviour and
performance. This allows appraisal which can be seen as an analysis of over all
capabilities and potentials, allowing a decision to be made in line with a purpose.
Therefore poverty Assessment is concerned with two main tasks: Identifying the
poor and Assessing the magnitude and depth of poverty (Siddiqur, 2003). Some
empirical poverty assessment exercises go one step further to include analysis of
the causation of poverty, but this study will limit itself to the first two tasks above.
The methodology of poverty assessment would obviously depend on the concept
of poverty one employs. Until recently, poverty was conceived primarily as a
matter of inadequate income and thus methodological debates centered naturally
around what was perceived to be the best method of identifying and measuring
the inadequacy of income (Rarallion, 1995). Poverty can therefore be assessed
by methodological approach or participatory poverty assessment method (PPA).
Statement of the Problem
Most of the rural small-scale farmers and the young farmers club are not
fully aware of the impact of their various farming practices on the environment.
Thus, Osinem (2005) stressed that the ultimate goal of the national policy on
environment is sustainable development, providing this nation and its citizenry
with a sense of environmental direction. Among the guidelines and strategies for
achieving the goal is the raising of public awareness and promoting
understanding of the essential linkage between environment and development.
Obaseki (1999) submitted in his report that ecological situation in Osun
state needs an Urgent and drastic Solution by the State Environmental Protection
Agency and other stakeholders in order to avert national disaster in the state,
thus the evidence and extent of environmental degradation in the State. Cleaven
& Schreiber.(2000) maintained that, the poor are also thought to be important
agents of environmental damage. He explained further that, with little land
available to them, poor farmers may resort to cultivating steeply sloped erosion
prone hill-sides or to clearing tropical forest. Also their inability to afford other fuel
sources may make them cut down trees at an unsustainable rate. Hence, the
level of poverty among farmers in the state.
Moreover, environmental degradation is as result of the dynamic interplay
of socio-economic, institutional and Technological activities with poverty still
remains a problem at the root of several environmental degradation (on-line
2006) Hence, the interplay of environmental degradation and the level of poverty
among the farmers in the study area. Also, Akinbami, Akinwumi & Salami (1996)
maintained that environmental degradation has resulted into dislocation in many
of the environmental process that support life and sustained development. It also
has a serious impact on the sustainable Net National Product (SNNP) per annum
of the nation. All these points to the magnitude, the evil effects and economic loss
resulted from environmental degradation in Osun State.
The problem of this study therefore is to identify the poor, and assess the
magnitude of poverty among the farmers in relation to environmental degradation
in the study area. So as to explore ways and strategies of protecting the
environment in order to reduce the poverty level among farmers in central
agricultural zone of the state.
Purpose of the Study
The major purpose of this study was the assessment of poverty level and
environmental degradation among farmers in central agricultural zone of Osun
State, Nigeria. Specially, the study sought to:
1. find out the extent of manifestations of environmental degradation in Osun
Central Agricultural zone of the State;
2 . examine the level of poverty among farmers in the study area;
3. determine the relationship between environmental degradation and the
poverty level of the farmers;
4. find out other predisposing factors to environmental degradation in the
study area; and
5. suggest ways of reducing environmental degradation, so as to avert
poverty in the study area.
Significance of the Study
The benefit accruable from the results of this study are numerous. In more
specific terms, the findings of the study would be useful to the Agricultural

Science students, farmers, curriculum planners, state government, local
government and United Nation World Environmental Development Agency.
The findings of this study would increase the level of awareness of the
students of agricultural science in secondary schools in the state and the farmers
alike. This would allow them to know the implication of their daily activities on
land. Thus inculcating in the students and the farmers the spirit of environmental
protection which will engender sustainable farming in the state. The curriculum
planners will also benefit from the study because the result of environmental
awareness that will prevent bad use of the land and other environmental
resources that have being inculcated in them, if considered and acted upon will
enable them reform the curriculum by including environmental agriculture in the
curriculum of agricultural science in secondary schools. Furthermore, the result of
the findings of this study, if put into use by the government will assist in no small
measure in policy formulation and mapping out of strategies to combat
environmental degradation in the state. Thus increasing the natural asset base of
the rural farmers. Also the result of the finding will assist the United Nation World
Environmental Development Agency in the implementation of the Agenda 21 of
the Earth Summit.
Research Questions
The research study sought to answer the following questions:
1. What was the extent of environmental degradation in Central
Agricultural zone of Osun State?
2. What was the level of poverty among farmer in Osun Central
Agricultural zone?
3. What was the relationship between poverty level and the degree of
environmental degradation among the farmers in Osun Central
Agricultural zone?
4. What were the other predisposing factors to environmental degradation
in the zone?
5. What were the efforts of the government and other stakeholders in
combating environmental degradation in the zone.
Hypotheses
Ho, :
H o ~ :
There would be no significant difference in the mean response among the
Young farmers club, Graduate farmers, Rural Development Programme
(catholic NGO) (RUDEP) farmers and farm settlers on the extent of the
manifestations of environmental degradation in the agricultural zone.
There would be no relationship in the mean responses between poverty
level' of the farmers and manifestations of environmental degradation in
the agricultural zone under study.
Scope of the Study
The study would cover Central Agricultural zone of Osun State, Nigeria.
The area is made up of eight local government areas with the headquarters in
Osogbo town.
The study will assess the impact of human activities (most especially
farmers) on the environmental quality with specific bias to those that are poverty
induced in the study area.

Assumption of the Study
The following assumptions were made for the pursuit of this study.
1. That the selected farmers would be competent enough to give honest and
unbiased responses to the questionnaire items.
2. That the responses to be generated from the questionnaire would be
reliable enough to draw valid conclusion on the study.
3. That the farmers population in the study area would be adequate for the
study.

CHAPTER TWO
REVIEW OF RELATED LITERATURE
In this chapter, literature related to the study was reviewed under these
topical headings:-
(1) Conceptual framework (impact analysis Model)
(2) Poverty Concepts:
Absolute & Relative Poverty
Objectives & Subjective perspective
Physiological & sociological deprivation.
(3) Assessment of Poverty:
(a) Methodological Approach - qualitative & quantitative.
(b) Participatory Poverty Assessment (PPA)
(4) Poverty lndicators
(5) ~nvironmental degradation lndicators and measures for reducing
degradation.
(6) Review of Related empirical Studies.
(7) Summary of Related literature.
Conceptual Framework
Records have shown how human life-style and needs have changed over
the millennia. In particular we looked at the changing impact of human population
(farmers inclusive), how human have become a major molding force in the
environment and how increasing technological development in order to avert
poverty and increasing population size have affected the environment (Daniel,

Osinem (2005) explained that, in their quest for survival and development,
human beings have had a radical impact on the environment the physical and
biological system within which they and other organisms live. By increasing the
out-put of food, fibre, fuel and other useful products, these changes have often
been crucial to the growth, security and quality of life of Our species. But human
activities have also damaged the environment.
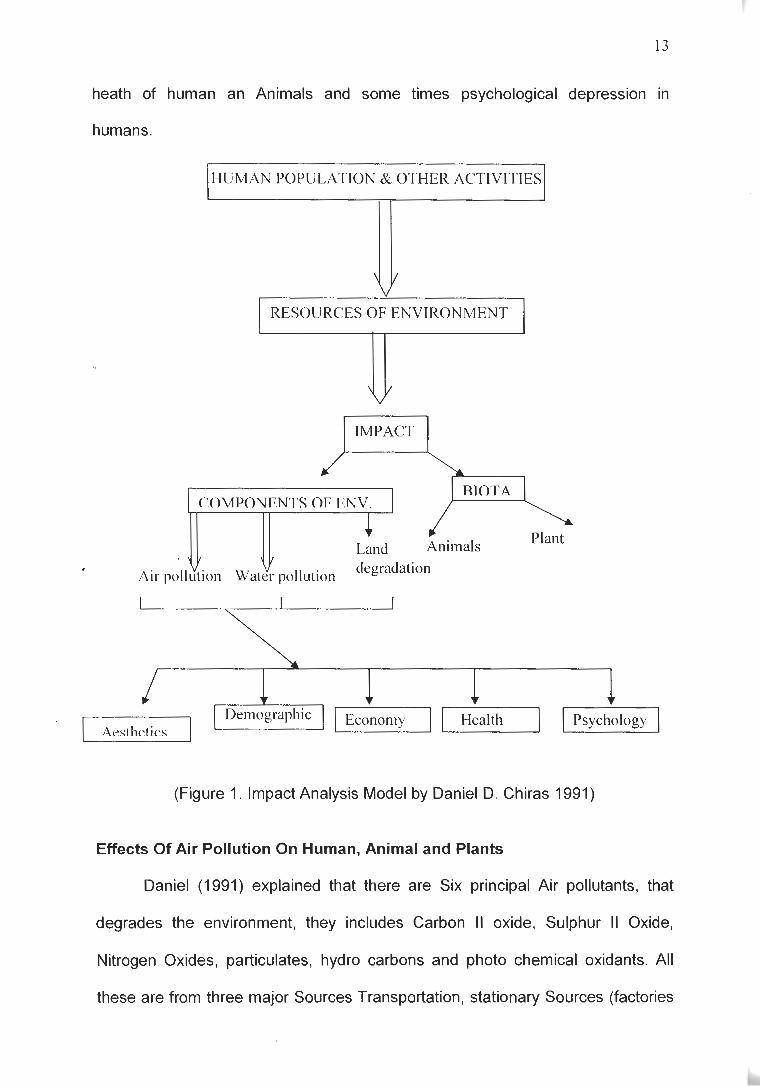
To develop an understanding of human impact, the model illustrated in
figure 1 called simplified impact Analysis model will be used. It shows that the
poor people with their increased population and activities put a lot of pressure on
the limited resources of the environment and their impact causes a lot of crisis or
pollution both in the Air, water and on land. These impacts are felt by other
humans, animals and plants (the Biota) living in such environment and
neighbourhood. More over, its indirect effects deface and damage the aesthetic
beauty of the nature and Art works. Thus resulted to a reduced economy, poor
health and human beings may even be psychologically depressed.
Therefore, in the context of this study, the poor human population (most
especially farmers) and their yearly increase cum their various activities put a lot
. of pressure on the limited resource of Osun state, (environment) in general and
the study area in particular, thus causing a lot of pollution both in the Air, water
and on land. These pollutions has shown in figure 1 have serious impact on
humans, Animals, plants and other biota in the study area and their
neighbourhood. These also extend, inform of indirect effects by defacing and
damaging of the aesthetic nature and various Art works in the Towns and cities in
Osun State. Thus resulting to a reduced economy (loss due to damaged
environment and Art work) in the State. In addition pollutions that resulted to poor
heath of human an Animals and some times psychological depression in
humans.
1-IUMAN POPULATION & OTHER ACTIVITIES
I RESOURCES OF ENVIRONMENT I
IMPACT
RlOTA COMPONENTS OF ENV
Animals Plant
degradation
(Figure 1. Impact Analysis Model by Daniel D. Chiras 1991)
Effects Of Air Pollution On Human, Animal and Plants
Daniel (1991) explained that there are Six principal Air pollutants, that
degrades the environment, they includes Carbon II oxide, Sulphur II Oxide,
Nitrogen Oxides, particulates, hydro carbons and photo chemical oxidants. All
these are from three major Sources Transportation, stationary Sources (factories

and Power Plants) and industrial process. Air pollu!ants are released from
vaporization (or Evaporation) attrition (or frictions) and Combustion. Combustion
is by far the major producers of pollutants.
Coal, oil, natural gas and their refined products, such as gasoline, are
organic fuel which comes from either plant or animal remains buried by
Sediments millions of years ago. For this reason they are called fossil fuels.
Fossil fuels consist primarily of carbon and hydrogen atoms linked by covalent
bounds. When these organic matters are ignited, the initial heat breaks some of
the covalent bounds. This releases energy in two forms - light and heat. The heat
release in the process, break other bonds, permitting the burning to occur until
the fuel runs out. Oxygen react with the carbon and hydrogen. Complete
combustion, which rarely occur produces carbon IV oxide (C02) and Water
(H20). In complete Combustion produces carbon II oxide (CO) gas and unburned
hydro carbons which are pollutant.
NEST (1991) on its own classified the sources of Air pollution into four (4)
they are (1) Dust pollution & Vehicle emission (2) Biomas burning (3) Fuel
combustive and (4) Steel Plant Emission.
Dust Pollution: Dust particles, which are the most evident air pollutants, have
many Sources in the Country these include Vehicular movements, wind, bush
burning, and industry. Vehicular traffic is an important source. The emission rate
of dust per vehicles/kilometer for paved and unpaved roads in all parts of Nigeria
are reported to be rather high when compared with O.lg per Vehicle - Kilometer
for roads in London & England. It was estimated that the annual amount of dust
Kicked up in the air by the country's motor - vehicles were 612, 000 tonnes and
187,000 tonnes for unpaved and paved roads repetitively (NEST 1999).
15
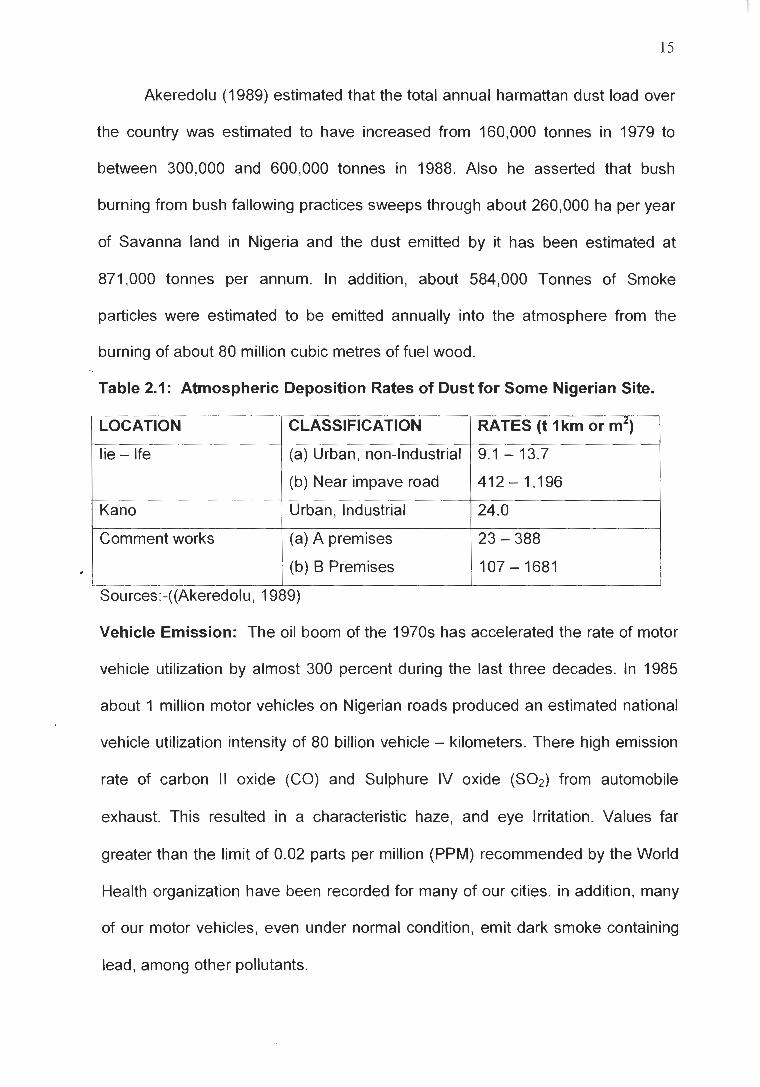
Akeredolu (1989) estimated that the total annual harmattan dust load over
the country was estimated to have increased from 160,000 tonnes in 1979 to
between 300,000 and 600,000 tonnes in 1988. Also he asserted that bush
burning from bush fallowing practices sweeps through about 260,000 ha per year
of Savanna land in Nigeria and the dust emitted by it has been estimated at
871,000 tonnes per annum. In addition, about 584,000 Tonnes of Smoke
particles were estimated to be emitted annually into the atmosphere from the
burning of about 80 million cubic metres of fuel wood.
Table 2.1: Atmospheric Deposition Rates of Dust for Some Nigerian Site.
I LOCATION / CLASSIFICATION
/ Kano / Urban, Industrial
lie - Ife
I Comment works / (a) A premises
(a) Urban, non-Industrial
(b) Near impave road
- I I (b) B Premises
RATES (t I km or m2)
Vehicle Emission: The oil boom of the 1970s has accelerated the rate of motor
vehicle utilization by almost 300 percent during the last three decades. In 1985
about 1 million motor vehicles on Nigerian roads produced an estimated national
vehicle utilization intensity of 80 billion vehicle - kilometers. There high emission
rate of carbon II oxide (CO) and Sulphure IV oxide (SO2) from automobile
exhaust. This resulted in a characteristic haze, and eye Irritation. Values far
greater than the limit of 0.02 parts per million (PPM) recommended by the World
Health organization have been recorded for many of our cities. in addition, many
of our motor vehicles, even under normal condition, emit dark smoke containing
lead, among other pollutants.
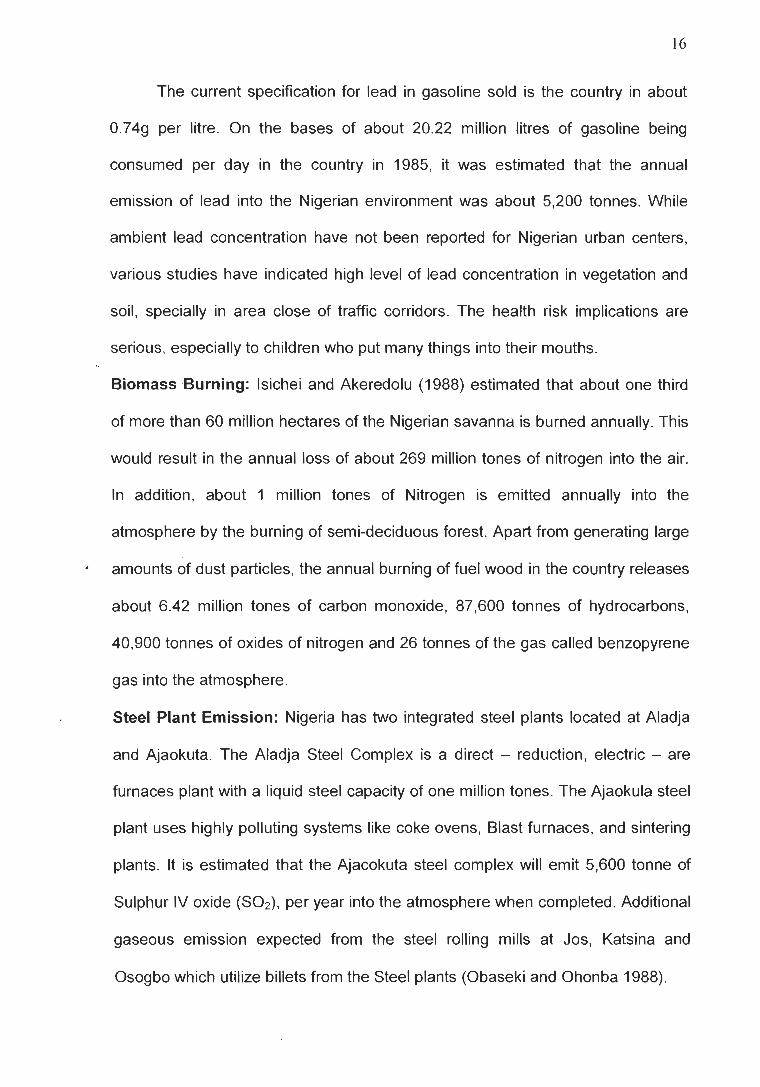
The current specification for lead in gasoline sold is the country in about
0.74g per litre. On the bases of about 20.22 million litres of gasoline being
consumed per day in the country in 1985, it was estimated that the annual
emission of lead into the Nigerian environment was about 5,200 tonnes. While
ambient lead concentration have not been reported for Nigerian urban centers,
various studies have indicated high level of lead concentration in vegetation and
soil, specially in area close of traffic corridors. The health risk implications are
serious, especially to children who put many things into their mouths.
Biomass Burning: lsichei and Akeredolu (1988) estimated that about one third
of more than 60 million hectares of the Nigerian savanna is burned annually. This
would result in the annual loss of about 269 million tones of nitrogen into the air.
In addition, about 1 million tones of Nitrogen is emitted annually into the
atmosphere by the burning of semi-deciduous forest. Apart from generating large
amounts of dust particles, the annual burning of fuel wood in the country releases
about 6.42 million tones of carbon monoxide, 87,600 tonnes of hydrocarbons,
40,900 tonnes of oxides of nitrogen and 26 tonnes of the gas called benzopyrene
gas into the atmosphere.
Steel Plant Emission: Nigeria has two integrated steel plants located at Aladja
and Ajaokuta. The Aladja Steel Complex is a direct - reduction, electric - are
furnaces plant with a liquid steel capacity of one million tones. The Ajaokula steel
plant uses highly polluting systems like coke ovens, Blast furnaces, and sintering
plants. It is estimated that the Ajacokuta steel complex will emit 5,600 tonne of
Sulphur IV oxide (SO2), per year into the atmosphere when completed. Additional
gaseous emission expected from the steel rolling mills at Jos, Katsina and
Osogbo which utilize billets from the Steel plants (Obaseki and Ohonba 1988).
Elegbede, Odubona and Egeonu (1988) stressed that there is undoubtedly
a good indication that in an attempt to improve the quality of life of citizens
through industrialization, Nigeria is releasing increasing amounts of pollutants
into the atmosphere. The hydro carbons of petroleum refineries, the dust and
fumes of metal smelting and Cement works, the Odorous gases of chemical and
allied industries, the carbon monoxide and oxides of sulphur and nitrogen of
internal combustion engines, the charred particulate and sulphur dioxide
emissions of pulp and paper industries, for instance, are all pollutants which are
increasing the acidification potential of Nigerian environment.
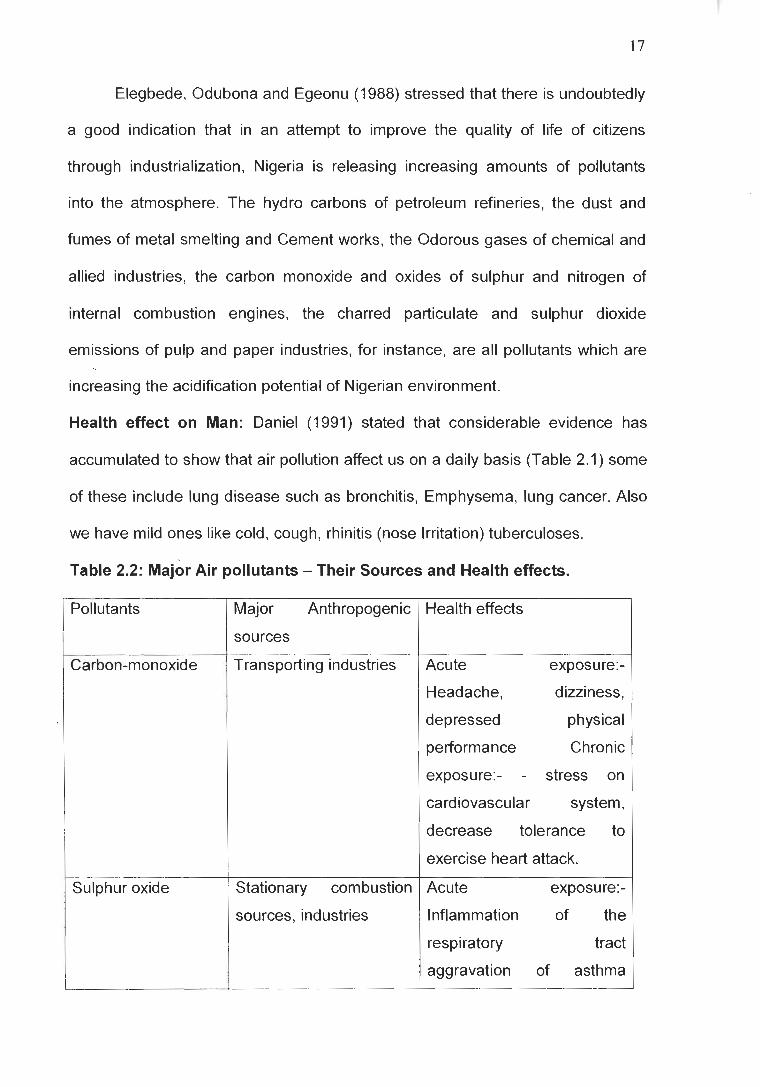
Health effect on Man: Daniel (1991) stated that considerable evidence has
accumulated to show that air pollution affect us on a daily basis (Table 2.1) some
of these include lung disease such as bronchitis, Emphysema, lung cancer. Also
we have mild ones like cold, cough, rhinitis (nose Irritation) tuberculoses.
Table 2.2: ~ a j o r Air pollutants - Their Sources and Health effects.
Pollutants
Sulphur oxide
Major Anthropogenic
sources
Transporting industries
Stationary combustion
sources, industries
Health effects
Acute exposure:-
Headache, dizziness,
depressed physical
performance Chronic
exposure:- - stress on
cardiovascular system,
decrease tolerance to
exercise heart attack.
Acute exposure:-
Inflammation of the
respiratory tract
aggravation of asthma
I
I
1 I stationary combustion ( Irritation Chronic:-
chronic exposure:-
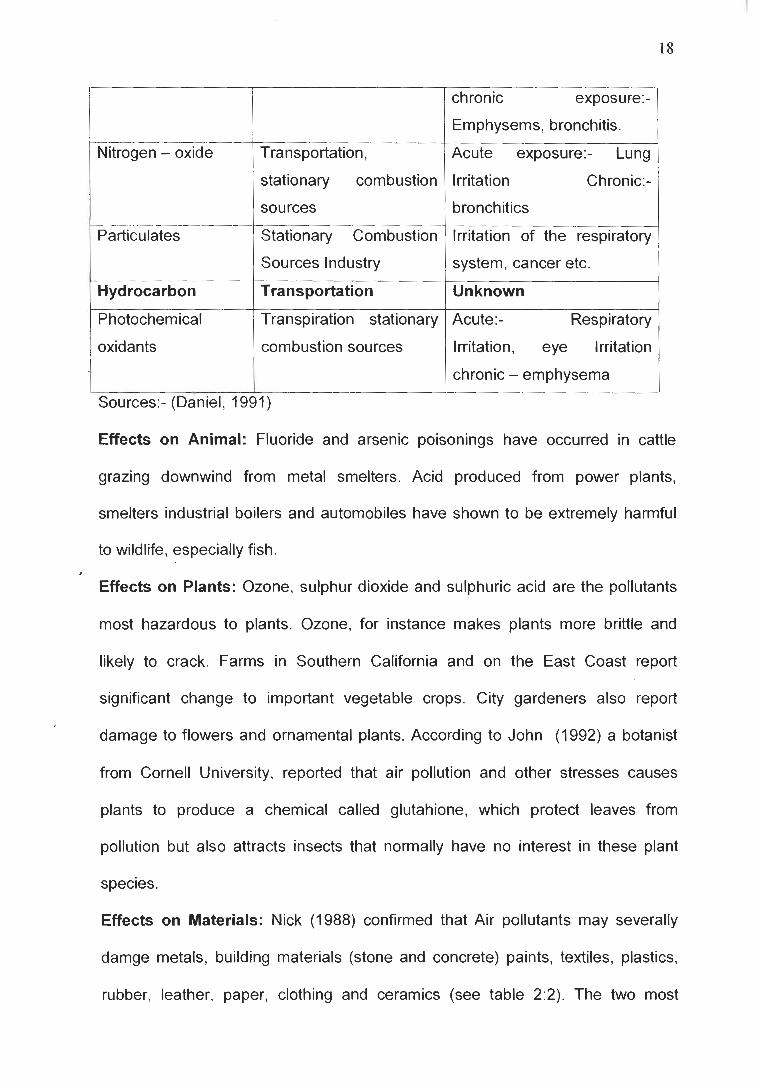
Nitrogen - oxide
1 I Sources Industry I system, cancer etc.
Transportation,
sources
Stationary Combustion
I I
Hydrocarbon I Transportation 1 Unknown
Emphysems, bronchitis.
Acute exposure:- Lung
bronchitics
lrritation of the respiratory
] oxidants 1 combustion sources ( Irritation, eye Irritation
Photochemical
I I I
Sources:- (Daniel, 1991)
Transpiration stationary
i Effects on Animal: Fluoride and arsenic poisonings have occurred in cattle
Acute:- Respiratory
/ chronic - emphysema
grazing downwind from metal smelters. Acid produced from power plants,
smelters industrial boilers and automobiles have shown to be extremely harmful
to wildlife, especially fish.
Effects on Plants: Ozone, sulphur dioxide and sulphuric acid are the pollutants
most hazardous to plants. Ozone, for instance makes plants more brittle and
likely to crack. Farms in Southern California and on the East Coast report
significant change to important vegetable crops. City gardeners also report
damage to flowers and ornamental plants. According to John (1992) a botanist
from Cornell University, reported that air pollution and other stresses causes
plants to produce a chemical called glutahione, which protect leaves from
pollution but also attracts insects that normally have no interest in these plant
species.
Effects on Materials: Nick (1988) confirmed that Air pollutants may severally
damge metals, building materials (stone and concrete) paints, textiles, plastics,
rubber, leather, paper, clothing and ceramics (see table 2:2). The two most
corrosive and therefore harmful pollutants are sulphure dioxide and sulphuric acid
(Tetraoxo sulphate VI acid). The damage to human materials is both costly and
tragic, for many of the structures attacked by air pollutants are Irreplaceable
works of Art. The stone in patethinon in Athens the status of liberty, which has
now been restored had been pitted by sulphuric acid and nitric acids. The Taj
Mahal in India and in the Nether lands the Bell that had been ringing true for
three or four centuring have in recent years gone out because of Air pollutions.
The economic damage caused by air pollution is immense. Society pays
for cleaning sooty buildings, repainting pitted houses and automobiles and
replacing damaged rubber products and clothing. The economic damage to
statues and other work of Arts cannot be calculated.
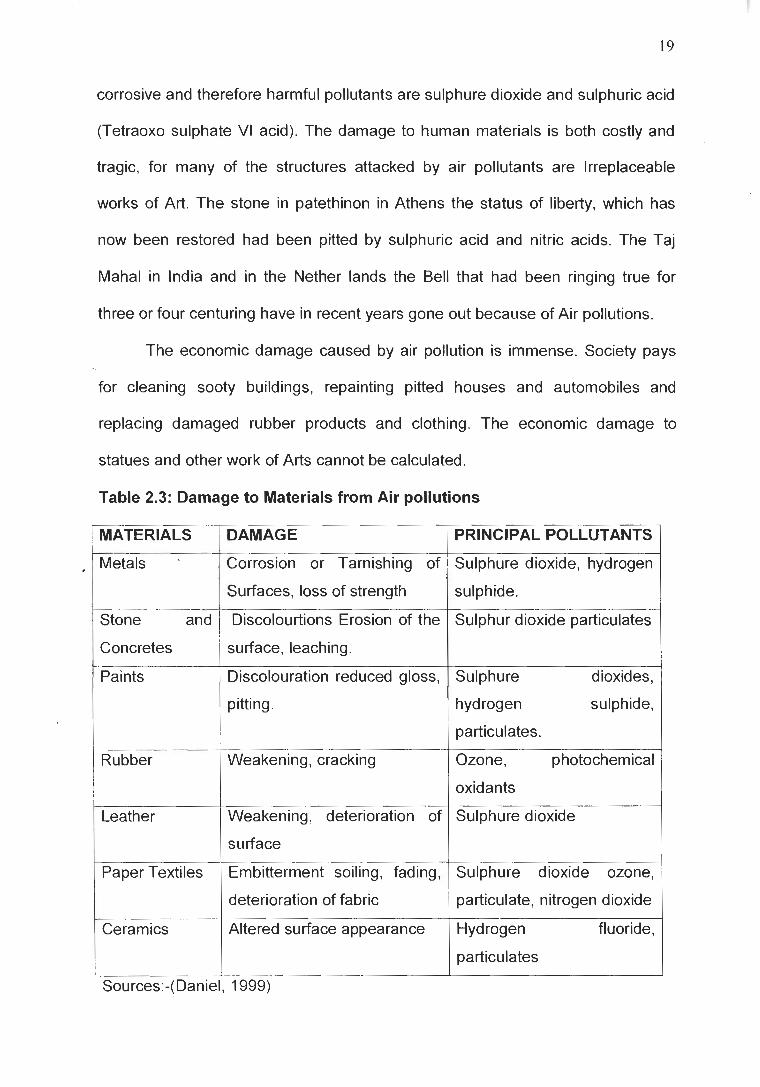
Table 2.3: Damage to Materials from Air pollutions
MATERIALS / DAMAGE PRINCIPAL POLLUTANTS - Metals * Corrosion or Tarnishing of Sulphure dioxide, hydrogen
Surfaces, loss of strength sulphide.
Stone and Discolourtions Erosion of the Sulphur dioxide particulates
Concretes surface, leaching.
Paints I Discolouration reduced gloss, Sulphure I dioxides,
pitting. hydrogen sulphide,
particulates.
Rubber Weakening, cracking Ozone, photochemical
oxidants
Leather Weakening, deterioration of Sulphure dioxide
surface
Paper Textiles Embitterment soiling, fading, Sulphure dioxide ozone,
deterioration of fabric particulate, nitrogen dioxide
Ceramics I Altered surface appearance I Hydrogen fluoride,
particulates
Sources:-(Daniel, 1 999)

Effects of Water Pollution on Man, Animal and Plants
Water pollution is any physical or chemical changes in water that may
adversely affect organisms. It is global in scope, but the types of pollution. Vary
according to a country's level of development (Daniel 1999). In the poorer nations
water pollution is predominantly caused by human and animal wastes,
pathogenic organisms from this waste, and sediment from unsound farming and
timbering practices. The rich nations suffer from these problem, but with their
more extravagant life-styles and wide spread industries that create an additional
assortment of potentially hazardous pollutants: Heat, toxic metal, acids,
pesticides and organic chemicals.
Like air pollutants, water pollutants come form numerous naturals and
anthropogenic sources. Because water respects no boundaries, pollutants
produced in one country often end-up in another's drinking or bathing water.
There is also what is called cross-media contamination, that is the movement
of a pollutant from one medium (air) to another (water). Pesticides sprayed on
crops can drift to nearby lakes and from there, flow to the ocean. Toxic organics
dumped in evaporating ponds ascend to the clouds only to rain down on land and
lakes.
Sources of Water Pollution: When we talk about water pollution, we generally
think of factories, power plants and sewage treatment plants that pour tons of
Sometimes toxic chemicals into sewers and lakes and rivers. This is called point
sources because they are in discrete locations and are relatively easy to control.
But they are only half the problem. The other half include sources we rarely think
about, the non-point sources, this is less discrete sites like farm, forests, lawns
and Urban street.

Types of Water Pollution
(a) Nutrient Pollution and Eutrophication: River streams and lakes contain
many organic and in-organic nutrients needed by the plants and animals. That
live in them in higher than normal concentrations, then become pollutants.
- Organic Nutrients: Feed lots, sewage treatment plants, and some
industries such as paper mills and meat-packing plants may release large
qualities of organic pollutants. These substance stimulate bacterial growth.
Bacteria in turn, consume the organic, helping to purify the water. During the
degradation of organic pollutants bacteria consume dissolved oxygen and as
oxygen level drop, fish and other aquatic organism perish.
The organic nutrient concentration in the stream is measured by
determining the rate of which oxygen is depleted from a test sample. Polluted
water is saturated with oxygen and kept in a closed battle for five days, during
this period 'bacterial degrade the organic matter and consume the oxygen. The
amount of oxygen remaining after five days gives a measurement of the organic
matter present; the more polluted a sample, the less oxygen left. This standard
measurement is called BOD (Biochemical Oxygen demand).
- Inorganic Plant Nutrients: Where as organic nutrients nourish bacteria,
certain inorganic nutrients stimulate the growth of aquatic plants. These plant
foods include nitrogen, phosphorous, Iron, sulphure, Sodium and Peltasium.
lnorganic fertilizer from crop lands is the major anthropogenic sources of
plant nutrients in fresh waters. When highly soluble fertilizer are used in excess, a
much as 25% may be washed into streams and lakes by the rain. More careful
use could greatly reduce this problem.
Laundry detergents are the second most important anthropogenic source
of in organic nutrient pollution in this country. Many of the detergents contain
synthetic phosphates, called Tripolyphosphates (TPPs). These chemicals cling to
dirt particles and grease, keeping them in suspension until the wash water is
flushed out of the washing machine. Unfortunately, the phosphates stimulate the
growth of aquatic algae, causing sudden spurts in growth called blooms.
(b) Infections Agents: Water may be polluted by pathogenic (disease - causing)
bacteria, viruses, and protozoan. Water borne infections diseases are a problem
of immense proportions in the less developed nations of Africa, Asia, and Latin
America.
The major Sources of infections agents are (1) untreated or improperly
treated sewage (2) animal wastes in fields and feedlots beside water ways; (3)
meat - packing an tanning plants that release untreated animal wastes into
water: and (4) some wildlife species, which transmit water borne diseases. The
major infections diseases include viral hepatitis, polis (viral), typhoid - fever
(bacterial), Amoebic dysentery (protozoan), cholera (bacterial) schistomiasis
(parasitic worm) and salmonellosis (bacteria).
Daniel (1991) Explained that measuring the level of each pathogenic
organism will cost money and time. But this is determined by water quality
personnel by measuring the coliform count.
(c) Toxic Organic Water Pollutants: It has been documented by Allen (1993)
that over 10,000 synthetic organic Compound are in use today. Many of these
find their ways into our water, creating what may be our most important water
pollution problem.
The reasons for concern over these pollutants are several: (1) Many toxic
organic compounds are non-biodegradable or are degraded slowly, so they
persist in the ecosystem. (2) Some are magnified in the food web. (3) Some may
cause cancer in humans; others are converted into carcinogens when they react
with the chlorine used to disinfect water. (4) Some kill fish and other aquatic
organisms. (5) Some are nuisances giving water and fish an offensives taste or
odour.
(d) Toxic Inorganic Water Pollutants: In organic water pollutant as
documented by Daniel (1991) encompass a wide range of chemicals, including
metals, acids, and salts. Most states reported that Toxic metals such as mercury /
and lead are a major water pollutions problem. Metals come form industrial
discharge, urban run-off, mining, sewage effluents, air pollution fall out and some
natural sources.
- - ~ercury i This is a bye-product of manufacturing the plastic vinylchloride. It is
also emitted in aqueous wastes of the chemical industry and incinerators. Power
plants, laboratories, and even hospitals. World wide, about 10,000 metric tone of
mercury are released into the air and water each year
In streams and lakes inorganic mercury is converted by bacteria into two
organic forms: one of them, diethyl mercury, evaporates quickly from the water.
But the other methyl mercury remains in the bottom sediments and is slowly
released into the water, where it enter organisms in the food chain and is
biologically magnified. In 1950s an outbreak of mercury poisonings in Japan
raised awareness of the hazard. This happen in a town called Minamata, though
the name minamata disease. The 'geafood frotkminamata Bay was contaminated
with methyl mercury.

- Nitrates and Nitrites: Nitrates and Nitrites are common in organic pollutants of
water. Nitrates come from septic tanks, barnyards, heavily fertilized crops and
sewage treatment plants: they are converted to toxic nitrites in the intestine of
humans.
Nitrites combine with the hemoglobine in red blood corpuscles and formed
methemoghobin, which has a reduced oxygen-carrying capacity. Nitrites can be
fatal to infants.
- Chlorine: Chlorine is a highly reactive in organic chemical commonly used to
(1) kill bacteria in drinking water (2) destroy potentially harmful organisms in
treated waste water released from sewage treatment plants into stream and (3)
kill algae, bacteria, fungi and other organism that grow inside and clog the pipes
of the cooling systems of power plants. Chlorine and some of the products it
forms in water are highly toxic to fish and other organisms.
chlorine reacts with organic compounds to form chlorinated organics.
These chemicals may show up in drinking water down stream from sewage
treatment plants and other sources. Many of them are known carinogens and
teratogen.
(e) Thermal Pollution: Daniel (1991) confirmed that, thermal pollution lowers the
dissolved oxygen content of water, at the same time increasing the metabolic rate
of aquatic organisms. Since metabolism requires oxygen, some species may be
eliminated entirely if the water temperature rises to looc (18'~). He also explain
further that, at savannah River nuclear power plant, the number of rooted plant
species and turtles was at least 75% lower in ponds receiving hot water than in
ponds at normal temperature.
Ground water Pollution: Allen (1 993) explained that some experts believe that
groundwater pollution is a minor problem. They estimate that 1% to 2% of United
State ground water is polluted. However, an environmental protection Agency
(EPA) study completed in 1981 showed that ground water contamination is 28%
of 954 cities with populations over 10,000. He went further to say the most
common chemical pollutant are chlorides, nitrate, heavy metals and various toxic
organics like pesticides and degrading agents. While the problems associated
with it, include miscarriage, low birth weight, birth defects and premature infant
death, Adult and children suffer skin rashes, eye irritation and host of neurological
problems, including dizziness, headaches, seizures and fainting spells.
It should be noted that groundwater moves at a rate of 5cm - 64cm a day
and since groundwater moves so slowly it may take years for water polluted in
one location to appear in another. Additionally once an aquifer is contaminated, it
may take several hundred years for it to cleanse itself.
(f) Ocean Pollution: Daniel (1991) confirmed that, about 3.2 million metric tons
of Oil enters the world's seas every year. About half of the oil that contaminates
the ocean from natural seepage from offshore deposits. One fifth comes from
well blowouts, breaks in pipelines and tanker spills. The rest quite surprisingly
come from oil disposed of in land and carried to the ocean in rivers.
The harmful effects of oil spills are many. Oil kills plants and animals in the
estuarine zone. Especially hard hit are the barnacles, mussels, crabs and rock
weeds. Oil endangers fish hatcheries in coastal waters and can contaminate the
flesh of commercially valuable fish.
(g) Medical Waste and Sewage Sludge: Daniel (1991) reported that in the
summer of 1988, many Americans were shocked to learn that medical wastes

were being illegally dumped into the ocean. Bloody bandages, sutures, vital of
AIDS infected blood, and used syringes washed up onto the eastern shores of
the United States as well as the shores of lake Eric. Because there was no way
to track the wastes to their source, the United State Congress passed the
Medical Waste Tracking Act (1988) into law. In the same year also Ocean
Dumping Ban Act, which prohibited the dumping of sewage sludge in the ocean
was passed into law.
According to the Natural Resources Defense Council, 8.9trillion litres of
liquids waste generated from sewage treatment plants is also dumped directly
into the ocean with little or no treatment before it is discharged. Much of it is
industrial waste containing toxic organic chemicals and toxic metals.
Effect Of Land Pollution I Degradation On Human, Animal And Plants
Webster's Encyclopedic Unabridged Dictionary of English Language
(1994) defined Degradation as physical or geological. The wearing down of the
land by the action of water, wind or ices. Beinroth et al. (1994) says land
degradation is one of the consequences of mismanagement of land and results
frequently from a mismatch between land quality and land use. Land degradation,
due to the large area and number of people affected by it, is clearly human
induced. The linkage between land degradation and climate change is yet to be
established but there is increasing evidence that land degradation is a driver of
climate change. The other causes of land degradation include drought,
population pressure, poverty, failure to implement appropriate technologies,
constraints imposed by recent international trading agreements and the local
agricultural and land use polices (Virmani et al., 1994).

2 7
Land degradation can take the forms of Flood, erosion, Drought,
Desertification and Biodiversity loss among many others.
Floods: A flood is a body of water which rises to over flow land which is not
normally submerged (Osinem, 2005). Floods are environmental hazards that
occur regularly every year in different parts of the country and are repeatedly in
the headlines of local and national news (NEST, 1991).
Akeredolu (1989) explained that flooding as an environmental hazard is
however, not entirely a physical phenomenon. In the real sense, flood only
become a hazard when they impinge unfavourably upon human activity, as they
frequently do because of the affinity which human being tend to have for flood
plains and coastal locations. Folds result from a number of basic causes of which
the most important are climatologically in nature (NEST 1991). The most
common universal cause of floods is rainfall which is heavy, excessively
- prolonged or both. However, a smaller amount of rainfall may also produce
flooding on ground that is already saturated with water. Other types of flooding in
the country in which climatologically factors are only partly or indirectly
responsible include:-
Ponding back of stream flow by rising tides, particularly during spring tide
conditions.
Rivers and tributaries carrying water flows very much in excess of their
transporting capacities due to concentration of runoff.
Main river backing up the water in their tributaries.
Peak floods occurring at the same time in a main river and its tributaries.
Heavy rainfall synchronizing with spills of rivers.

Inadequate and inefficient drainage of low-lying and flat areas to the out
flow and.
Flooding of low-lying coasts by excessively high tides associated with
storm - surge effects.
NEST (1991) stressed that attempts by man to harness available water
resources have resulted in the construction of dams and other water control
structures. The failure of these structures, infrequent as they may be, have
resulted in floods, a typical example being the collapse of the Bagauda Dam near
Kano in August 1988. Other flood disasters in Nigeria included:- llorin flood
disaster of 1973, 1976 and 1979, the Lagos flood of 14'~ June 1985 in areas like
Agege, lsolo Oworonsoki, LUTH etc.
Natural concord of 1 gth August (1988) reported that flood disasters are not
limited to the extreme Southern part of the country. Kano State in the semi arid
Sudan savanna environment was affected by floods in August 1988. A rain storm
that described as one of the heaviest in an 80-year instrumental record, persisted
over Kano for a few days generating flood in various part of the state. This
caused the Bagauda Dam near Kano, with a storage capacity of 22 million cubic
. litres before it collapsed on August 17, 1988. The loss recorded included 146
lives, 18,000 houses, washed away of 14,000 farms, displacement of 200,000
people and damage to residences and infrastructure worth about 650 million
naria.
Sunday Times, August 21, 1988 reported that the most catastrophic and
most publicized flood to hit lbadan occurred on August 31, 1980. It was caused
by a twelve hour downpour from the night of August 30 through the morning of
August 31. By the time the rain stopped, over 300 lives had been lost, 5,000

rendered homeless and properties worth over 81300 million destroyed. More other
floods in lbandan are those of 1982, 1984, April 1986 and June 1987.
Soil Erosion: Aknibami, Akniwuni, & Salani (1996) Define erosion as a
geomorphological process, in which the surface layer of weathering rock is
loosened and carried away by wind or running water, and where by a lower
horizon in the soil is exposed. Soil erosion is a national problem although the
intensity and type varies with the ecological conditions in the country. Soil erosion
is one of the most striking features of the land surface in South-eastern Nigeria.
In fact out of a total land surface of 78612km2 about 55028km2 (representing
70%) of South-eastern Nigeria in affected by various forms of soil erosion.
Even though, it is suggested that the most important factors causing soil
erosion in South-eastern Nigeria are not related to human interference in South-
area, but an already existing phenomenon, enhanced by human activities. This
implies that 'the inherent physical characteristics of the environment in the region
naturally predispose it to the evolution of gully - type erosion (Ofomata, 1981).
The greatest impart of erosion lies in its outright volumetric removal of top
soil and the consequent decreases in the nutrient capacity, moisture retention,
organic matter content and depth of the soil. Soil erosion is unleashing untold
hardships on crop and livestock production in the country. In addition, permanent
or temporary deposits of eroded soil else where on land or in water bodies have
buried previously fertile, or able land as well as crops and pastures. There
deposits have also clogged up irrigation channels, there by enduring access to
agricultural fields difficult or costly, resulting in a decline in agricultural production
in Nigeria. Gully erosion has also had devastating effects on rural Communities in
Several states and in some communities the main sources of livelihood has been
ruined. In general from an economic perspective, soil degradation and loss are
considered to be the most serious environmental problem facing Nigeria. If affect
about 50 million people and a conservation estimate of its long term economic
impact is in excess of US$ 5.3 billion every year, if no remedial action is Taken
(World Bank, 1990). This estimate reflect only the lost of food replacement
required through net imparts. It does not reflect costs associated with general
health determination if national food loses arise not replaced by imports.
Drought & Desertification: Osinem (2005) Define Desertification as a natural and
artificial process whereby land is left waterless, treeless and barren.
Dregne (1977) also define Desertification as the impoverishment of terrestrial
ecosystem under the impact of man. It is a process of deterioration in the
ecosystem that can be unmeasured by reduced productivity of desirable plants,
undesirable alteration's in the biomass and the diversity of the micro and macro
flora and fauna, accelerated soil deterioration and increased hazards for human
occupancy. As national and global databases improved, the atrophic roles
become more evident and accelerated nature of the process resulted in the call
for combating actions.
The formal definition of desertification adopted by the United Nations
Intergovernmental convention to Combat Desertification is "land degradation in
arid, Semi-arid and dry sub-humid area resulting from various factors, including
climates variations and human activities". Excluded in the definition are areas that
have a "very cold (boreal), hyper arid or a humid" climate.
Nigerian Environmental Study /Action Team (1999) believed that,
desertification is basically a physical process by which, first, the plant cover,
species diversity and primary productivity of arid or semi arid eco-system are
drastically reduced. Reduction in the vegetation cover increasingly exposes bare
soil to large microclimatic changes which alter the soil surface, making it more
vulnerable to wind and water erosion. Because the perennial plant species are
reduced in density, deflation is no longer compensated for by sand deposition
and wind erosion may accelerate, removing all movable fine and looses particles
and leavening the land surface covered by pebbles or stones.
Desertification, in its most widespread form, is generally represented as a
function of the interaction between people and the environment. It is the result of
three major factors: (a) inherent extreme variability of climate as manifested in
droughts: (b) disruption in the ecological system caused by a long period of
improper land use by man and the ever increasing demand being made upon the
available land resources by socio economic systems of the affected area; and (c)
failure by people to develop appropriate conservations matures.
Mortimore (1989) emphasized that drought and desertification is an
inevitable part of the climate of the arid and semi - arid area of Nigeria. However,
overgrazing, over cultivation, deforestation, bush burning, and general
environmental misuse which have helped to create desert - like conditions in
some part of northern Nigeria are by no means inevitable. A reporter has
described the extent of environmental degradation in Bade Local Government
Area of Borno State in 1978 in these words: "Trees and grasses, when ever one
finds them, are recumbent not with age but atrocious desert winds. For
Kilometers there is no shelter belt, and man - made Oases are, not surprisingly,
few. The entire sight brings tears to the on lookers eyes".
According to the Desertification Map of the world compiled by the FAO,
WMO and UNESCO in 1977, about 15 percent (or about 140,000 ~ m * ) of Nigeria

is prone to desertification. It includes arid and semi - arid areas where the
following manifestations of severe desertification are on an extensive scale:- (i)
forbs and shrubs have largely replaced grasses or have spread to such an extent
that they dominate the flora; or (ii) sheet, wind and water erosion have largely
denuded the land of vegetation and large gullies are pursuit; or (iii) salinity has
reduced crop yields may be by more than 50% or (iv) all of the above conditions
are combine.
Biodiversity loss: Allen (1993) beliefs that as deforestation proceeds
biodiversity shrinks. Destruction of the entire forest, of course, destroys the
ecosystems sheltered under its canopy. But some researchers fear to that
destruction of an individual species may remove a vital link in a whole system
and begin a spiral of environmental deterioration. In tropical rain forest where
many habitat coexist within a small area elimination of even a patch may cause
many specks to die.
Poverty Concepts
Renata Lok - Dessallien (2002) explain that poverty is a multidimensional
phenomenon and it is defined and measured in a multitude of ways. Given the
complexity of the issues, the best introduction to poverty measurement is through
the multifaceted nature of the phenomenon and the different concepts of it. The
following paragraph describe different concepts of poverty. From the perspective
of indicators, these distinctions are important since poverty measurement and
subsequent policylprogramme implications depend on what facets or angles of
poverty are being addressed. For example, if a national poverty reduction
strategy is supposed to address both temporary and chronic poverty, two distinct

sets of polices and programmes would be required, along with two sets of
indicators for establishing base lines and monitoring progress.
i. Absolute and Relative Poverty: Poverty can be viewed in absolute and
relative term. Absolute poverty refers to subsistence below minimum, socially
acceptable living conditions usually established based on nutritional requirements
and other essential goods. Relative poverty compares the lowest segments of a
population with upper segments, usually measured in income quintiles or deciles.
Absolute and relative poverty trends may move in opposite direction. For
example, relative poverty may decline while absolute poverty increases if the gap
between upper and lower strata of a population is reduced by a decline in well
being of the former at the same time that additional households fall beneath the
absolute poverty line.
Even within so called absolute poverty countries often distinguish between
indigence or primary poverty and secondary poverty (sometimes referred to as
extreme and over all poverty). Indigence usually refers to those who do not have
access to the basic necessities for human survivals, while other forms of poverty
refer to degrees of deprivation above that relative aspects of poverty pertains to
changes in circumstances. For example, if prices rise faster than incomes the
well being of some households classified as relatively poor may decline to level
formally associated with absolute poverty, with out a corresponding change in
status since the living standards of the absolute poor have also declined
proportionally.
ii. Objective and Subjective perspectives: Poverty can be
approached from objective or subjective perspectives. Tne objective perspectives
(sometimes referred to as the welfare approach) involves normative judgments
as to what constitutes poverty and what is required to move people out of their
impoverished stated. The subjective approach places a premium on people's
preferences, on how much they value goods and services (hence the emphasis
on individual utility).
Economics have traditionally based their work on the objective approach,
mainly because of the obstacles encountered when trying to aggregate multiple
individual utilities across a population. Advocates of this approach use the
argument that individuals are not always the best judge of what is best for then.
For example, most poverty measurement systems focus on nutritional attendants.
Although all individuals value food consumption, some may place higher value on
certain food types or food quantities that are not best for their physiological well
being. It is conceivable that the subjective approach could both undervalue or
over value food consumption when compared to the welfare approach, leading to
conflicting assessments as to who is poor.
iii. Physiological and Sociological Deprivations: Several poverty concepts
are derived from perceived caused of poverty. They can be divided into two of
types of deprivations - physiological and sociological. Regarding the former, the
line of thinking is as follows. People are poor because the lack incomes, food
clothing and shelter. Both the income and basic needs concepts of poverty stem
from physiological deprivations (although some advocates of the basic needs
concept set the parameters beyond physiological needs). Strategies to reduce
poverty emerging from these approaches focus on increasing the
income/consumption of the poor and their attainment of "Satisfiers" of basic
needs, such as health and education.

The concepts of poverty emerging from the perspective of sociological
deprivation are rooted in underlying structural in equities and inherent
disadvantages. They are based on observations that even when resources are
flowing into sectors dominated by the poor, the latter, may not be able to take full
advantage of them because of structural impediments. These constrains hamper
access by the poor to "external" assets, such as credit, land, infrastructure and
common property (i.e., the natural environment), and "internal assets, such as
health, nutrition and education. The fundamental casual factor lie in power
structures and governance issues, as well as in the inequities imbedded in macro
policy frame works and distributional systems.
Assessment of Poverty
Siddiqur (2003) explained that poverty assessment is concerned with two
main tasks. Identifying the poor and assessing the magnitude and depth of
poverty. some empirical poverty assessment exercises go one step further to
include analysis of the causation of poverty. Methodologically, this is a very
different exercise from the two tasks mentioned above and the present
discussion is confined to those two only.
The methodology of poverty assessed would obviously depend on the
concept of poverty one employs. Until recently, poverty was conceived primarily
as a matter, of inadequate income and methodological debates centered
naturally around what was perceived to be the best method identifying and
measuring the inadequacy of income. An enormous literature on this issue has
grown up in the past few decades, focusing on the concept of poverty - line
income as the standard against which to judge the adequacy of income
(Ravalhon, 1994, 1 998, Lipton and Ravalhon, 1995).

While many issues still remain unresolved in this on going debate, a whole
new literature has been developing over the last decade or so on the
methodologies that are appropriate for the newly emerging conception of poverty
that is no longer tied to the single metric of income. There is now a fairly general
agreement that poverty ought to be seen as a multidimensional phenomenon.
Much of the discussion that has been taking place on this issue can be organized
around two interrelated themes:- debate on quantitative versus qualitative
methods of assessment, and the role of PPA (Participatory Poverty Assessment).
(i) Quantitative versus Qualitative Methods of Assessment: The methodology
of assessing the magnitude of income-based poverty is primarily quantitative in
nature. It typically employs random sample surveys and structured interviews to
collect mainly quantifiable data and analyses then using statistical methods. As
long as poverty is measured by income alone, this method is reasonably
satisfactory,' despite many potential pitfalls.
But the emergence of a partly objective, partly subjective multi-
dimensional view of poverty has raised serious questions about the adequacy of
this method. For example can the varied experiences of poverty as preceded by
people be captured through an impersonal structured interview? Are the
statistical techniques that deal primarily with numerical data appropriate for
analyzing subjective experiences? Will the standard methods suffice to form an
integrated (holistic) view of poverty that takes into consideration people's
experiences along a multiplicity of dimensions? Questions such as these have
raised doubts over the adequacy of the standard quantitative methods and have
given rise to a new generation of mythologies that has come to be known as the
qualitative method of poverty assessment. This method has been define as one
"that typically uses purposive sampling and semi-structured or interactive
interviews to collect data - mainly, data relating to people's judgments, attitudes,
preferences, priorities, andlor perceptions about a subject and analyzes it
through sociological or anthropological research techniques (Carvalho and White,
1 997).
The main advantage of the quantitative method is that it can be used on a
large scale, thereby ensuring better representation of the sample and rendering it
possible to make generalizations, which is especially important for the purpose of
national level policy making. Furthermore, with this method it is easier to maintain
comparability while collecting data for different groups and locations. This is
important for setting priorities among alternative uses of scarce resources,
because it is only on the basis of comparable information that one can decide
where the greatest needs lie.
The main advantage of the qualitative method is that is enables one to
explore any given phenomenon much more deeply through an interactive
process. This may be especially useful not only for eliciting reliable subjective
information but also for generating hypotheses about casual relationship even
among quantifiable objective variables. Furthermore, this method open up the
opportunity for the poor to participate actively in the assessment and analysis of
poverty. In view of the fact that both methods have their own strengths and
weaknesses, it would seem sensible to use them in tandem to complement each
other instead of viewing them as mutually exclusion alternatives.
(ii) Participatory Poverty Assessment: PPA is a special class of qualitative
methods of poverty assessment. It was develop in the early 1990s with the aim of
not just understanding the prevalence and nature of poverty but also of

increasing the participation of the poor in the formulation and implementation of
policies for poverty reduction. A leading authority on the theory and practice of
this method defines it as follows: "PPA is an iterative, participatory research
process that seeks to understand poverty from the perspective of a range of
stakeholders, and to involve them directly in planning follow-up action. The most
important stakeholders involved in the research process are poor men and poor
women. PPAs also include decision makers from all level of government, civil
society and the local elite thereby uncovering different interest and perspectives
and increasing local capacity and commitment to follow-up action (Narayan,
2000, p.15).
Poverty Indicators
The following depicts common indicators identified by local people in Asia
and Africa to describe lack of well-being. They represent a subjective
perspective, but mix both quantitative and qualitative indicators.
Disabled (i.e. blind, crippled, mentally impaired Chronically sick).
Widened
Lacking land, livestock, farm equipment, a grinding mill.
Cannot decently bury their dead.
Cannot send their children to school.
Having more mouths to - feed, fever hands to - help
Lacking able - bodied members who can fend for their families in crisis.
Bad housing
Having vices
Being poor in people; lacking social support1Solidarity.
Having to put children in employment.

Single parents.
Having to accept demeaning work or low status work.
Having food security for only a few months each year.
Being depends on common property resources.
(Source: Chamber. R. "Poverty and livelihood: Whose reality Counts?" 105
Discussion Paper 347, 1995. As found in Renata L.K, 2002).
The income and basic needs concepts of poverty are characterized
predominantly by quantitative indicator (although qualitative indicators may be
employed to ascertain people's perception of, for example, the quality of services
or the quality of life). The human capability poverty approach utilizes both types
of indicators, but may incorporate more basic needs approaches. Qualitative
indicators dominate the participatory an empowerment approaches to poverty
reduction.
The main families of indicators that emerge from the different conceptual
approaches to poverty are as follows: income, basic needs, capabilities and a
mixed group of indicators relating to the enabling environment (access to assets,
equity and governance). "Means" indicators dominate the income, basic needs
are access families, while "ends" indicators constitute the capability family.
Income
Poverty measurement has been dominated by the so-called income
approach. From a conceptual perspective the term "money - metric" is more
appropriate since some of the so-called income indicators can, in fact be based
on expenditure or consumption data. Regardless of how this set of indicators is
derived, it is expressed in money metric terms. This approach to poverty
measurement assumes that individuals and house holds are poor if their income
or consumption falls below a certain threshold, usually defined as a minimum,
socially acceptable level of well being by a population group (Renate, 2002). The
emphasis is place on material well-being, and income, a "means" indicator is
employed as a proxy for poverty.
Renata (2002) also emphasized that the most widely utilized income
poverty indicators are the headcount index and per capital G.N.P. The headcount
index is based on a poverty line (or set of lines) that are established by goods for
basic human survival, using income, consumption or expenditure data of non
poor households. The incidence of poverty is then calculated as the percentage
of the population whose incomes fall below that threshold. Income indicators can
also be used to measure the depth and severity of poverty. The poverty gap
index measurers the degrees to which the mean income of the poor differs from
the established poverty line (depth of poverty).
shaker (1998) said that income indicators can also be used to measure
the depth and severity of poverty. The poverty gap index measures the degrees
to which the mean income of the poor differs from the established poverty line
(depth of poverty). Some of the attractions of income poverty indicators are that
they are aggregates of multiple inputs; they are expressed in units that are of
immediate and widespread relevance, and they are theoretically objective i.e.
they weight inputs to well being according to how the real world values them. The
limitations associated with income indicators of poverty have been extensively
documented. In short, the drawbacks pertain to price and commodity differentials,
the exclusion of non-cash and "free" items (such as publicly provided goods and
services), and the commission of other factors such as time required to obtain a
commodity.

Basic Needs
Renata (2002) agreed that the basic needs concept of poverty takes the
income approach one step further. It defines poverty as the deprivation of
requirements, mainly material for meeting basic human needs. The approach
attempts to address some of the limitations of the income indicator family by
distinguishing between private income, publicly provided services and different
forms of non-monetary "income". The basic needs approach to poverty
measurement includes access to such necessities as food, shelter, schooling,
health services, portable water and sanitation facilities, employment opportunities
and even touches on opportunities for community participation. Basic needs
indicators are often classified in the "means" category. However, since they are
one step closer to outcomes than income measures, they are something placed
in a category of their own - "indirect ends".
~ a s i c needs indicators add a wide range of dimension to income
measures. The big advantage of the former over the later is that they measures
goods and services directly in terms of human welfare. For example, a rise in
housing or essential transport costs would be counted as a decline in well being
using basic needs indicators, while per capital GNP would record this as an
increase. Some difficulties associated with basic needs indicators are that there
is no way of aggregating them meaningfully for purposes of in-country analysis
and they are usually expressed in terms that do not :rigger the same kind of
familiarity as monetary ones.
Human Capability
The human capability approach to poverty measurement attempts to
measure poverty in terms of outcomes or "ends". This approach defines the
phenomenon as the absence of basic human capacities to function at a minimally
acceptable level within a society. An emphasis is placed on people's abilities and
opportunities to enjoy long, healthy lives, to be literate and to participate freely in
their society. Most capability poverty indicators are straightforward: life
expectancy, literacy rates, malnutrition, etc. however, one set, those associated
with participation, is more tricky. Participation by the poor in their society is not an
area that lends itself readily to quantification. It is much easier to quality
participation as a measure of equity, rather than of poverty. For example, the
level of political participation by marginalized groups can be measured by their
representation in political bodies. However, measurement of participation by the
poor is a more difficult task. Qualitative indicators of participation by the poor are
more enlightening in terms of the information conveyed, but they tend to only
exist for small sample sizes, which limits their usefulness from a broad policy
perspective.
The biggest advantage of capability indicators, as a whole is that they
measure well being in terms of final outcomes rather than as proxies for those
outcomes. In addition, many of them are considered mainstream in terms of
national statistics, so data is often available. The main disadvantages are similar
to those of the basic needs group. There are no prefer aggregates for this family
of indicators and they are expressed in terms with varying degrees of familiarity.
In addition, some capability indicators are group measure and can not be used to
gauge hour - hold or individual well being (i.e. life expectancy). Furthermore,
some of the capability change slowly over time, thus limiting their usefulness for
short and medium-term poverty monitoring.
Other Groups of Poverty Related Indicators:
A range of other poverty-related indicators exists that do not fully and
neatly fixed into a single family. Many of them have emerged relatively recently
and are related to the concepts of enabling and empowerment. Of them, three
main groups emerge as particularly relevant to poverty measurement: access by
the poor to assets, inequity and governance. lndicators measuring access by the
poor to assets can be classified into four types:- access to productive assets (i.e.,
land capital); access to social and physical infrastructure; access to housing and
other consumer durables; and access to common property (i.e., certain aspects
of the natural environment)
Indicator of inequity are also highly relevant to poverty measurement. This
is partly because one of the purposes of poverty measurement is to identify who
are the poor. lndicators of inequity help to do just that, and the relationship
- between -poverty and inequity is such that the latter can be used for making
educated guesses about the formers in the absence of poverty data. There are
three main data sources for measuring inequity: income distribution,
desegregation of other indicators by subgroups and time-use studies.
Disaggregating poverty indicators can provide valuable information for
determining specific groups of poor and how they fare over time. Desegregation
may be based on numerous criteria, but the most germane from a poverty
perspective are: gender, ages, ethnicity and location. Disaggregated data can
also shed light on intra-household inequity.
Governance indicators span a wide range of issues, most of that have not
traditionally been either measured or associated with poverty. Those areas of
greatest relevance to poverty measurement are: information circulation,
institutional regulations and decentralization. Participation, usually considered a
governance issue, has been described above under the capability poverty family
of indicators.
Renata (2002) stressed that this set of indicators corresponds to opportunities for
empowerment of the general population not the poor per-se. As such, they need
to be interpreted in conjunction with the poverty people and the particular
characteristics of the poor in each country context. Indictors of information
circulation (i.e., the number of newspaper11,OOO people and the number of
radio11,OOO) provide crude measured of the general availability of information to
the public, but do not reflect its quality (or people's ability to access it). For
example, a country may have wide newspaper coverage, but a single political
party may tightly control the information they contain. Institutional indicators such
as the number of registered civil society organizations and advocacy groups, can
provide a rough gauge of freedom to associate, but they must be carefully
interpreted from a poverty perspective since they may be immensely correlated
with a government's commitment to poverty reduction. Indicators of
decentralization (i.e. the percentage of national revenue allocated to local
governments) must also be carefully interpreted. In some instances,
decentralization indicators may reflect empowerment at the grassroots level,
while in other cases it may simply mask multiple levels of administrative
inefficiency.
Environmental Degradation Indictors and Measures for Reducing
Degradation
Akinbami, Akinwumi and Salami (1996) define environmental degradation
as the damages done to parts of the Earth by natural agents such as Ice, water

or wind and or anthropogenic factors. These can be manifested by one or
combinations of the following indices:
- Soil erosion
- Poor vegetation growth
- Soillland degradation
- Pollutions
- Poor water quality
- Loss of wild life& biodiversity.
Akmbami et al. (1996) stated that an estimated 28 percent of land
degradation has been caused by incorrect cultivation of hillsides, which causes
water erosion. When field are allowed to lie fallow without protective ground
cover, wind erosion increased. The modern machinery designed to lighten the
farmers burden is too heavy for fragile soils. When soil is compacted by heavy
weight, the structure of the soil itself may change. As the soil is compressed, it
becomes less porous which discourages not growth and encourages water run-
off and erosion Allen (1 993).
Allen (1993) also stressed further that, improper use- including over-use of
chemical fertilizers, pesticides, and herbicides also degrade the soil. While over
grazing is responsible for 35 percent of global soil degradation. When farmers
crop their pastures too low, new growth is inhibited, grasses and legumes do not
reseed, and the nutrient -rich top soil is exposed to wind erosion.
Reich, Nurubem, Almaraz and Eswaran (2001) advocated that to stem soil
erosion and land degradation efforts of promoting the widespread adoption by
farmers of resource management techniques that increase yields and
simultaneously maintain the long term productivity of land resources must be
made. Experience throughout the world has shown that successful strategies for
preventing land degradation requires:-
- An effective, affordable and socially acceptable technology.
- Appropriate incentives, including security of tenure and adequate financial
returns, which favour the intensification of farming and conservation.
- The direct and committed involvement of actual land users- the farmers
and rural communities in planning and implementing the needed actions.
Also Akinbami et al. (1996) suggested a long term solution of adoption by
the farmers of agropforestry farming systems which combine rooted trees with
agricultural crops and penned livestock enterprises. Such systems allow the
recycling of deep nutrients and the maintenance of organic matter content of the
soil by mulching. In addition to that they suggested extensive education of the i
farmers and legislative needs.
Poor vegetation growth is one of the direct effect of soil erosion and land
degradation, when the nutrient is the soil has been washed away and leached
beyond the root zone of the plant, the resultant effect is that the vegetation and
the crop plant will have stunted growth and poor vegetative cover. There may
also be symptom of nutrient deficiency.
Nigeria environmental studylAction Team (1 9990 define Desertification as
a physical process by which, first, the plant cover, species diversity, and primary
productivity of arid or semi-arid ecosystems are drastically reduced. While
Dregne (1977) define Desertification as the impoverishment of terrestrial
ecosystems under the impact of man. It is the a process of deterioration in these
ecosystems that can be measured by reduced productivity of desirable plants.

According to the Desertification map of the world compiled by FAO, WMO,
and UNESCO in 1977, about 15% (or about 140, 000km2) of Nigeria is prone to
desertification it includes arid and semi-arid areas where the following
manifestation of severe desertification are apparent on an extensive scale:
I. Forbs and shrubs have largely replaced grasses or have spread to
such an extent that they dominate the flora or
ii. Salinity has reduced crop yields may be more than 50% or
. . . 1 1 1 . All of the above conditions are combined.
NEST (1991) recorded that human activities like overgrazing, over
cultivation, deforestation bush-burning and general environmental misuse have
helped to create desert- like conditions in some part of Nigeria.
Measures Of Reducing Environmental Degradation
The following measures are used to reduce environmental degradation
based on the causation agents. These include, among many others:- 1. Good
aforestation programme; (2) Prevention or Reduction in re-disposing
Agentslfactors; (3) National Settlement and land policy which will rationalize the
distribution of population; (4) Land capability studies; (5) Reduction in fuel wood
consumption. Through more efficient fuel wood use and the use of alternative
and renewable sources of energy, such as wind and solar energy; (6) Declaration
of international Biodiversity decade from 1994 to 2003; (7) A system should be
established to coordinate global efforts to preserved species diversity with
national policies worldwide.
Review of Related Empirical Studies
Nkata (2006) Studied, Environmental Degradation and Farm Management
practices of farmers in Delta and River State of Niger Delta area, with the
following specific purposes:-
1. To ascertain the extent to which human activities have contributed to
the environmental degradation.
2. Determine the extent to which farmers level of awareness of
environmental degradation have affected agricultural production in the
Niger Delta area.
3. Determine the soil/crop management practices employed by farmers to
combat environmental degradation.
4. Find out the awareness of the farmers to the adoption of new
conservation practices.
A totel population of 60. 166 farmers from forty-eight (48) local government
areas were involved in the study. Twenty five (25) L.G.A come from Delta state,
while the vest twenty three (23) L.G.A. was from River State. A descriptive survey
research design was used for the study. The major finding of the study were;
1. That environmental degradation is very high in the area, which has
resulted to pollution of land, Fishery and Forestry, choking urban pollution
& poverty among people.
2. The responses shows that the level of awareness of the farmers was high
as regard the adverse effects of environmental degradation on Agricultural
production.
3. Farmers asserted that the items on soil/ crop management practices were
actually conservation measures, which are not fully used in the study area.
4. The terrain of the area does not favour much livestock production, but
farmers shows a high participatory efforts in the production of low classed
animals such as Grass-cutter, Goat, sheep Rabbit, fishery, pigs as well as
poultry.
5. The rapid growth in emerging rural community of Delta and River States
can not sustained the face of environmental degradation, poverty and
resource depletion. But the oil company has embarked upon well-
articulated measure for handling agricultural related environmental
problems.
Scheer (2000) in his study- Research evidence on the relationship
between poverty and land degradation in Rajasthan province, India. The specific
purpose of the study include:-
1. Identification of level of education of the farmer, in understanding causes
of sdl degradation.
2. Determination of the extent of soil degradation in Rajasthan province.
3. Find out the threatened land and agricultural productivity.
4. Determine biological diversity and water quality and its availability in the
province.
5. Formulate policies and measures to address the issues and problems.
The research was carried out in fifty (50) villages that make-up Rajasthan in
India, with a population of one thousand (1000) registered farmers. Survey
research design was used with a well-structured questionnaire and an interview
schedule. The following findings were made:
-3 The literate level of the farmers is low and this was
responsible for the low awareness and care-free attitude to
safe the land from degradation:
*:* The poor soil terrain predisposes the land to degradation,
which has led to the impoverishment among the farmers in
the study area.
*:* There is evidence of biodiversity loss and poor water
quality in the area.
*:* The respondents agreed that there are policies and laws to
take care of the problems, but the enforcement
methodology is poor.
Uvashi, Shreekant and Klaas (2005) studied Poverty and Environment:-
Exploring the Relationship between Household incomes, Private asset and
Natural assets. The purpose of the study was to:-
1. Find out the correlation between household incomes of farmers and the
use of environmental resources in the study area.
2. Investigate the amount of private assets possessed by the farmers and his
uses of the environment.
3. Find out amount of natural assets the poor and the rich are accessible to
in the environmental in the study area.
The study collected survey data from 527 house hold in 60 different
villages of the Jhabua districts of India. The research uses interview schedule on
rural household in the study area. The study came out with these complex
relationship:-

1. for the sustainable house hold that used positive amount of resources,
we find out that dependence on natural resources follow a u-shaped
relationship with income, Declining at first but then later increasing.
2. the probability of being in the sub-sample of common -pool resources
users follows an inverse U-shaped relationship with income; the poorest
and the richest household are less likely to collect resources than those
with intermediate incomes. Resource used by the rich is therefore
bimodal; either very high or for very richest house hold zero.
3. it was found that resource dependence increase in the level of common-
pool biomass availability. The combination of these quality of natural
resources matters to a larger share of the rural population than had
been previously believed
4. the natural resources or the common- pool resources are seriously
damaged by the poor because of their desperate way of looking for
means of lively hood.
The similarity got from the reviewed empirical studies shows that there are
lots of damages done to the environment or its components by unsustainable and
unfriendly exploitation of the environment or its resources. Also the effects of
population pressure on the resources of the environment is a negative one. But it
can be noticed that much has not been done on the CAUSE and EFFECT of
poverty on the environment. By CAUSE it means the negative impacts that poor
people have on the environment, like all forms of environmental degradation that
are poverty related or driven. While the "effect" is the aftermath of environmental
degradation on the house hold income of people or farmers. For example when
there is oil spillage the vegetation, soil, aquatic plants and animal are destroyed,

which have a counter effects on the income of those who depend on these
environmental resources for their livelihood.
Summary Of Related Literature
Evidences have shown that the activities of man (Agricultural practices
inclusive) had impacted positively and negatively on the environment. The
negative impact has caused Air pollution in the Air, water pollution in water, and
land degradation on the land.
Six principal air pollutants from 3 different sources are isolated in this
work, study and there are fund to have resulted to the emission of dangerous
gases like carbondioxide, carbon monoxide, Nitrogen oxide, Nitrogen dioxide,
chlorofluorocarbon etc into the atmosphere, there by causing Acid Rain and other
air pollution in the environment. But Nigeria Environment study/ action Team
(1999) classified Air pollution into four namely: Dust pollution, vehicle emission,
Biomass burning, fuel combustion & steel plant / industrial emission. All these
have put man, animals and plants into serious danger.
Water pollution is said to have been caused by Human & Animal waste
duppings, pathogenic organisms, fall out of agro-chemical used and agricultural
practices, sewage and effluence from industries and the like. The following are
said to be the types of water pollution:- Eutroplication, infectious agents, Toxic
organic water pollutions, Toxic inorganic water pollutants, thermal pollution;
Ocean pollution and medical waste & sewage sludge.
Land degradation is said to be caused by drought, population pressure,
poverty, failure to implement appropriate technologies, constrains imposed by
recent international trading agreements and local agricultural and land use

policies. The degradation takes the forms of flood, soil erosion, drought, and
desertification and Biodiversity loss among many others.
While poverty is said to be a multidimensional one and can be measured
in so many ways. Thus poverty can be said to be Absolute when it is below the
minimum socially acceptable level of living conditions. This is usually established
based on nutritional requirements and other essential goods. While relative
poverty is comparing the lowest segment of a population with upper segment.
This is usually measured in quintiles or deciles. Poverty can also be approached
from objective and subjective perspectives. The objective is a welfare approach
while the subjective approach places premium on people's preferences i.e. On
how much they value goods and services. Moreover poverty can be viewed from
physiological and sociological derivations.
The physiological approach is from basic needs of view while sociological
derivation is rooted in underlying structural in equities and inherent
disadvantages.
Poverty assessment in this work takes two forms: (1) Qualitative &
Quantitative and (2) Participatory Poverty Assessment (PPA). There are lots of
indicators to show or measure poverty but they are categorized into groups called
family indicators, which include; Income, Basic needs, Human Capability and
other groups of poverty related indicators. More-over environmental degradation
indicators are explained with various measures for reducing environmental
degradation.
It is identified based on the review of these related literature that much has
not be done on the assessment of poverty level of the farmers and manifestation
of environmental degradation, therefore the study is sought to fill that gap.

CHAPTER THREE
METHODOLOGY
The focus of this chapter is on the following: Design of the study, Area of
the study, Population of the study, Sample of the study, Instrument for data
collection, Validation of the instruments, Reliability of the instruments, Method of
data collection and Data analysis technique.
Design of the Study
The study employed survey research design with the use of structured
questionnaire. A survey research is one which involves the assessment of people
opinion using questionnaire, population and sampling methods Wolman in (Ezeji,
2004). Also the description of the survey research by Osuala (2003) fits into this
study because the respondents are of different characteristics in terms of their
educational background or qualifications and also the assessment of the farmers
opinion on the level of their poverty and environmental degradation in their area.
Area of the Study
This study was carried out in central agricultural zone of Osun State,
Nigeria. This zone is made up of nine local government area, they are: Osogbo
L.G.A., Olorunda L.G.A, lfelodum L.G.A, Boripe L.G.A Odo - 0 t h L.G.A Ila -
Orangun L.G.A, Boluwaduro L.G.A, Ife day0 L.G.A. and Orolu L.G.A.
Population of the Study
The population of the study was made up of one thousand two hundred
and twenty (1220) registered farmers in the zone which comprises of the
following groups: Young farmers club members - Four hundred (400) catholic
NGO called Rural Development programme of the catholic Dioceses of Osun

(RUDEP) Two hundred (200)' Graduate Farmer Association members- One
hundred and Ten (1 1 O), and farm settler's Association members- five hundred
and ten (51 0).
Sample of the Study
Purposive sampling techniques was used to select four categories of
farmers from the zones and random sampling technique was used to draw One
hundred and fifty (150) respondents from the selected groups of farmers. They
are as follows: Young farmers club - forty seven (47), RUDEP - Farmers Twenty
Six (26)' Graduate farmers society - Twenty (20) and farm settler association -
fifty seven (57).
Instrument for Data Collection
Structured questionnaire consisted of fifty two items (52) was developed
by the researcher through extensive literature review based on the research
questions. The questionnaire was grouped into five (5) sections, each with
general information I instruction. Section A deals with personal data of the
respondents. Section B sought information's on the extent of environmental
degradation in the study area. Section C focused on the level of poverty among
farmers in the study area. Section D requested information on the predisposing
factors to environmental degradation in the zone. Lastly, Section E centered on
the efforts of the government and other stakeholders in combating environmental
degradation in the zone. Please note that the research question number three
(3), would be determined by comparing the relationship between the responses in
research question number one and two using correlational instrument (Pearson
Product Moment Correlation Coefficient).
The items in Section B, C, & E were structured on 4-point scale with
numerical values assigned to each options as follows: Strongly Agreed (SA) 4
points, Agreed (A) 3 points, Disagreed (D) 2 points, Strongly Disagreed (SD) 1
point. While items in Section D are also structured on four point scale as follows:
High Extent (HE) 4 points, Moderate Extent (ME) 3 points, Low Extent (LE) 2
points, and Very Low Extent (VLE) 1 points.
Validation of Instruments
The research instrument was face validated by three lecturers from the
Department of Vocational Teacher Education (VTE), University of Nigeria,
Nsukka. Each of the validators was given a copy of the instrument, the purpose
of the study and research questions. They were required to identify items that are
not required and add relevant others that have been omitted by the researcher.
They were. also expected to correct any uncleared statement in the questionnaire.
Their suggestions was used to improve the production of the final questionnaire.
Reliability of the lnstrument
Cronbach Alpha Reliability Coefficient was used to test the reliability of the
questionnaire items. In this case the instrument was administered to 16 farmers,
four each from each group of farmers in the Agricultural zone. The data obtained
from it were analysed using Cronbach alpha reliability coefficient. The value
obtained were: section B = 0.91, section C = 0.90, Sect~on D = 0.88 and Section
E = 0.96.
Administration of the lnstrument I Methods of Data Collection
The instrument was administered and collected by the researcher by hand
with the help of two research assistants. The questionnaire was taken to the

young farmer club members (Students) on Thursdays afternoon, which was the
official schedule time for all extra-curricular and club activities for secondary
school students in Osun State. The farm settlers were given their own by
traveling to various farm settlement centres in the zone. The RUDEP farmers
were to be located in their various farms sites and residential houses across the
zone. While the graduate farmers Association members were given their own in
their two centrestsite located at lragbiji farm site and Ila - orangun farm site.
The two research assistants hired are given an inductionlad hoc training
on the handling and administration of questionnaire. They assisted the
researcher in the administration and collection of questionnaire. Out of 150
copies of the instrument that were completed, collected and used for analyses.
This gave a percentage return of 80 percent (see table 1 for the distribution and
return of the questionnaire).
Table 1: Distribution and Return of Questionnaire
Grouped Farmers Number of Number of questionnaire questionnaire
. administered returned - 1 Young farmers club 47 30
2 Farm settlers association 57 45
3 RVDEP farmers 26 25
4 Graduate farmers 20 20
Total 1 50 120
Methods of Data Analysis
Mean and standard deviation was used to answer the research questions.
Pearson Product Moment correlation was used to determine the extent of the
relationship between poverty level of the farmers and the degree of
environmental degradation in the study area. While correlational tool together
with t-transformation was used to test the second hypothesis, ANOVA was used
to test the first hypothesis at 0.05 level of significance.
Use of the Mean:
All the items in section B, C, D, and E of the questionnaire were analysed
using mean score points. Nominal values were assigned to the different scaling
items as follows:
Strongly Agreed (SA) = 4 points
Agreed (A) = 3 points
Disagreed (D) = 2 points
Strongly Disagreed (SD) = 1 point 10
For section D;
High Extent (HE) - - 4 points
Moderate Extent (ME) = 3 points
Low Extent (LE) - - 2 points
Very Low Extent - - 1 point 10
The mean of each items was calculated by multiplying the frequency of the
responses under each response with the nominal value of the response category,
and the sum of the product obtained was divided by the number of respondents
who responded to the items concerned
Determination of the cut-off Point
An interval scale of 0.05 was added to the mean of 2.55 to give 2.55,
which gives the cut off point. This is the upper limit and this discriminates better.
Decision Rule 1: For items in sections B and D of the instrument, any item with a
mean value of 2.55 and above is accepted as agreed and its capable of causing
environmental degradation. In section C, items with a mean value of 2.55 and
above was accepted as agreed and its capable of causing poverty in the study
area. While in section E any item with a mean value of 2.55 and above is
accepted as agreed and has been adopted as strategies or policies for combating
environmental degradation in the area.
Decision Rule 2: To test the hypotheses, the researcher chose 0.05 level of
significance. Correlational tool (Pearson Product Moment Coefficient) together
with t-transformation was used to determine the association between the mean
ratings of two variables i.e. poverty (X) and environmental degradation (Y). While
Analysis of Variance (ANOVA) was used to compare the mean difference of
responses of the four groups of farmer as regard the manifestation of
environmental degradation in the area.
The decision rule for using Pearson Product Moment Correlation was that
if the value of r-calculated is greater or equal to the r-tablelcritical r the alternative
hypothesis would be accepted and the null hypothesis would be rejected. Or if
the t-transformation is done, and the value of t-calculated is greater or equal to t-
table the alternative hypothesis would be accepted and null hypothesis rejected.
For the ANOVA, when the calculated F-ratio would be greater than or
equal to the table F-ratio at 0.05 level of significance at a degree of freedom 3
and 116, the null hypothesis (Ho) would be rejected and the alternative
hypothesis (HA) would be accepted. Otherwise the reverse would be the case.

CHAPTER FOUR
PRESENTATION AND ANALYSIS OF DATA
This chapter presents the data collected and analysed for the research.
The data were used to answer the research questions and to test the
hypotheses. The findings were also presented based on the research questions
and hypotheses tested.
Research Question 1
What was the extent of environmental degradation in Central Agricultural
zone of Osun state?
The data for answering research question 1 are presented in table 2.
Table 2
Mean Ratings of responses of farmers on the Extent of environmental degradation in Central Agricultural zone of Osun state
n = I 2 0 -
-- X SD Remark ~ a 6 r a l forest resources in the area were not protected 3.33 0.89 Agreed Tree felling activities in the area is rampant The soil nutrients in the area is inadequate for cultivated crops to perform well Farmers need chemical fertilizers before the crops can yield well Heavy machines that causes soil compaction and damage the soil structure were in use Disappearance of certain spp. of plants & Animal that are previously present in the area. There is manifestation of gully erosion There is manifestation of sheet erosion There is manifestation of rill erosion Rivers overflow their banks Growth of water-weeds in the Rivers and water ways Agro-chemicals used on the farm do cause damages or ill- health to farm animals Dumping of industrial wastes is common in the area Air pollution by industrial effluence affect plants and Animals life Untreated toxic sewage poured on the land have serious effects on the soil properties 1.83 1.04 D
Note: Cut off point for Agreed = 2.55
Data presented in table 2 above revealed that farmers identified 11 out of
the 15 activities as regard the extent to which environment have been damaged
in the study area. The activities identified and agreed upon had mean range of
2.61-3.33 which are above the cut off point of 2.55 and a standard deviation
range of 0.70 - 1.13. This shows that the natural forest resources in the area was
not protected, tree felling activities in the area was rampant, the soil nutrients in
the area can not support cultivated crops and that farmers needs chemical
fertilizers before their crop could yield well. Also heavy machines destroyed the
soil structure, there were biodiversity loss, high manifestations of erosion,
flooding and poor water quality in the area. The four activities disagreed upon by
the farmers had mean ranging from 1.83 - 2.28 and standard deviation of 1.04 -
1.13. This shows that Agro-chemicals used on the farm do not cause any
damages or ill-health to farm animals, dumping of industrial wastes were not
common, air pollution by industrial effluence do not affect plants and animals life
and that untreated toxic sewage poured on the land had no serious effects on the
soil properties in the area.
Hypothesis 1
There was' no significant difference in the mean ratings of the responses
among the groups of farmer i.e. Young farmers club, graduate farmers society,
RUDEP farmers and farm settlers Association on the extent of the manifestations
of environmental degradation in the agricultural zone.
Data required for testing the above hypothesis were presented in table 3.

Table 3 Summary of ANOVA for testing the mean difference of the responses of 4 categories of farmers on the extent of environmental degradation in the study area
Source of Sums of Df Mean F - cal F - tab Remark variation - . -. squares squares Between groups 2.01 3 0.67
Within groups 10 1 16 0.086 7.79 2.68 S
Total 12.01 119
- - -
S = significant at P = 05
The result in table 3 shows that calculated f-value of 7.79 was greater than
the table f-value of 2.68 at 0.05 level of significance at 3 and 116 degrees of
freedom. This shows that there was a significant difference in the mean ratings of
the responses of the four groups of farmers namely - young farmers club,
graduate farmers society, RUDEP farmers, and farm settlers Association as
regards the extent of environmental degradation in central agricultural zone of
Osun state. Thus the null hypothesis (Ho) was rejected and the alternative
hypothesis (HA) accepted. It can then be inferred that environment in the area
was highly degraded
Research Question 2
What was the level of poverty among farmers in central Agricultural zone
of Osun state?
Data for answering the research question are presented in table 4

Table 4 Mean rating of responses of farmers on their level of poverty.
n = 120
X SD Remark ~ a m i l ~ used kerosene and on few occasions 3.29 0.75 Agreed
used fuel-woods for cooking
Never use Gas & Electric cooker
Have no access to a large acres of land for
farming
The food from the farm can only sustained the
family for few months
The returns (in monetary terms) from your farm
is insufficient to pay your children school fees
and family up - keeps.
You have much to save
Your children attends public schools
Is your family size large (i.e. no of children &
wives)
Have a few helping hands on the farm
Do not owned a personal building
Do not live in a house constructed with cement
blocks
Data in table 4 shows that the farmers identified and agreed on 10 out of
11 indices of poverty isolated by the researcher to categories farmers as been
poor. Those indices identified by the farmers had mean values ranging between
3.29 - 3.31, which were above the cut off point of 2.55. While the range of
standard deviation was between 0.72 -1.04. This shows that farmers in the area
relied majority on the use of kerosene as a source of fuel, do not have access to
large acres of farm land, have little income, can only sent their children to public
schools where taken fees or no fees are paid, also they have few helping hands
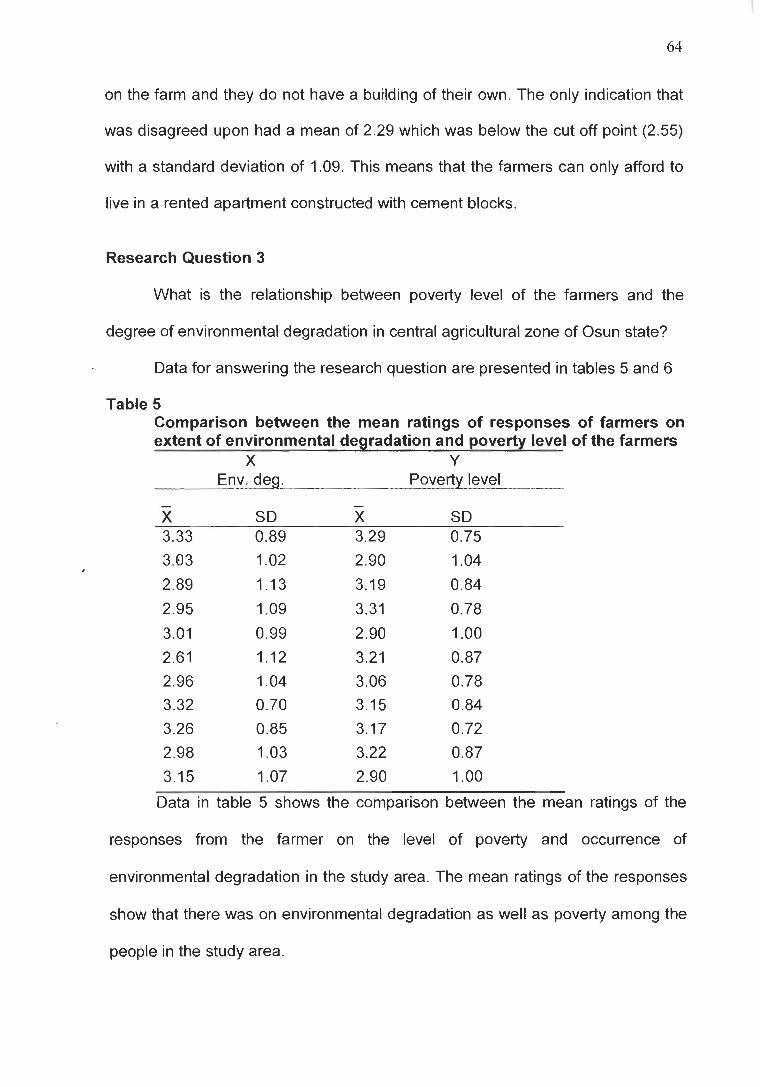
on the farm and they do not have a building of their own. The only indication that
was disagreed upon had a mean of 2.29 which was below the cut off point (2.55)
with a standard deviation of 1.09. This means that the farmers can only afford to
live in a rented apartment constructed with cement blocks.
Research Question 3
What is the relationship between poverty level of the farmers and the
degree of environmental degradation in central agricultural zone of Osun state?
Data for answering the research question are presented in tables 5 and 6
Table 5 Comparison between the mean ratings of responses of farmers on extent of environmental degradation and poverty level of the farmers
X Y Env. d e ~ Poverty level
2.95 1.09 3.31 0.78
3.01 0.99 2.90 1 .OO
2.61 1.12 3.21 0.87
2.96 1 .04 3.06 0.78
3.32 0.70 3.15 0.84
3.26 0.85 3.17 0.72
2.98 1.03 3.22 0.87
3.15 1.07 2.90 1 .OO
Data in table 5 shows the comparison between the mean ratings of the
responses from the farmer on the level of poverty and occurrence of
environmental degradation in the study area. The mean ratings of the responses
show that there was on environmental degradation as well as poverty among the
people in the study area.
The identified mean ratings of the responses of the farmers on the
occurrence of environmental degradation ranges between2.61 - 3.33, which is
above the cut off point of 2.55. While that of the poverty level was between 2.90 -
3.31. The standard deviation of environmental degradation ranges between 0.70
- 1.3 and that of poverty level was between 0.75 - 1.4. Thus the data revealed
that the farmers are poor and the environment was degraded.
Hypothesis 2
There is no significant relationship in the mean ratings of the responses of
the farmers on the occurrence of environmental degradation and poverty level
among farmers in the agricultural zone under study.
Data and correlational tools required for testing the above hypothesis were
presented in table 6.
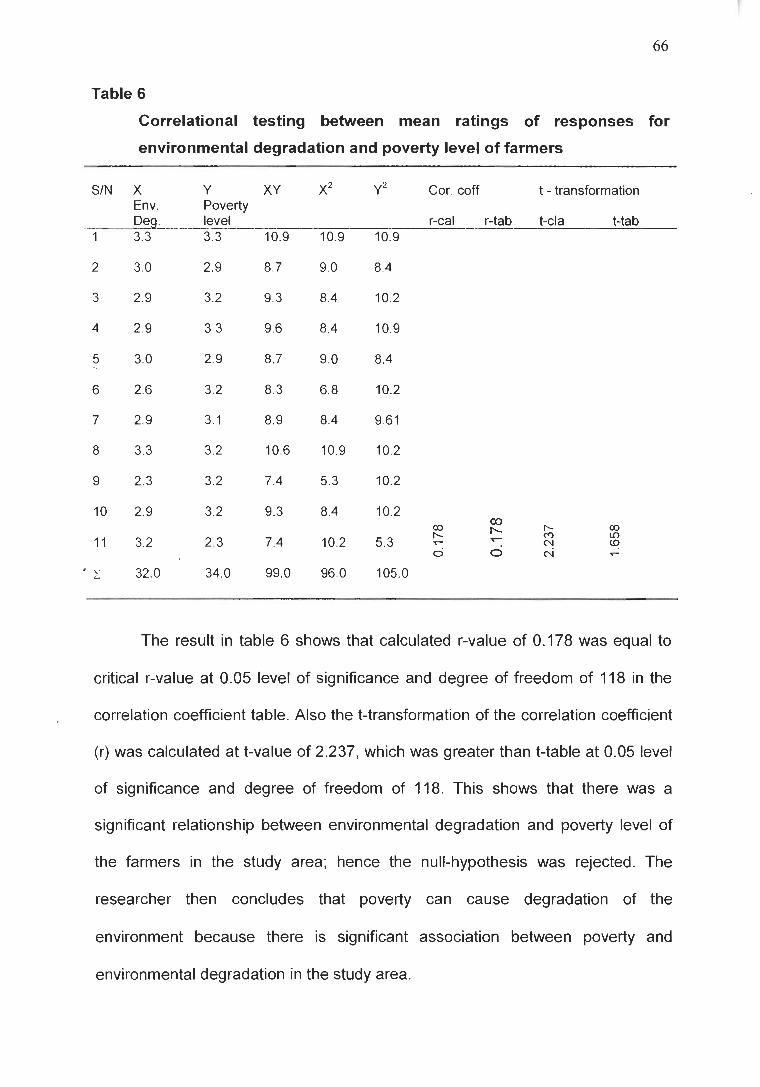
Table 6
Correlational testing between mean ratings of responses for
environmental degradation and poverty level of farmers
SIN X Y XY x2 y2 Cor. coff t - transformation Env. Poverty DB. level r-cal r-tab t-cla . . . . . .-- t-tab 3.3 3.3 10.9 10.9 10.9
The result in table 6 shows that calculated r-value of 0.178 was equal to
critical r-value at 0.05 level of significance and degree of freedom of 118 in the
correlation coefficient table. Also the t-transformation of the correlation coefficient
(r) was calculated at t-value of 2.237, which was greater than t-table at 0.05 level
of significance and degree of freedom of 118. This shows that there was a
significant relationship between environmental degradation and poverty level of
the farmers in the study area; hence the null-hypothesis was rejected. The
researcher then concludes that poverty can cause degradation of the
environment because there is significant association between poverty and
environmental degradation in the study area.

Research Question 4
What were the other predisposing factors to environmental degradation in
the zone?
Data for answering the research question are presented in table 7.
Table 7
Mean ratings of responses of farmers on other pre-disposing factors
to environmental degradation in the zone
n = 120
Exploration and exploitation of forest
resources in your area
Illegal killing and removal of wild life from the
forest (poaching).
Continuous and indiscriminate felling of trees
Wild bush fire
Emission of effluence to the air by industries
The use of explosive during quarry work
The use of fertilizer above the recommended
dosage
In correct method of fertilizer application
Prolong use of herbicides and pesticides
The use of heavy machine for tillage
operations
Disposal of untreated toxic industrial sewage
Note: Cut-off point for High Extent is 2.55 -
The data on table 7 revealed that farmers identified 6 out of I 1 pre-
disposing factors to environmental degradation as those that exposed the
environment to agents of degradation. The pre-disposing factors had mean range
of 2.54 - 2.97 which were above the cut off point of 2. 50 and range of standard

deviation of 1.05 - 1.19. They include the exploration and exploitation of forest
resources, poaching in discriminate felling of trees, bush fire, the use explosive
for quarry work and the use of heavy tillage machines for farming operations. The
factors found to be low in extent in pre-disposing the environment to degradation
had mean range of between 1.93 - 2.39 which were below the cut off point of
2.55 and the range of standard deviation of 0.80 - 1.19. These factors were
emission of effluence to the air by industries, over-dose and incorrect method of
fertilizer application and disposal of untreated toxic sewage.
Research Question 5
What are the efforts of government and other stakeholders in combating
environmental degradation in the zone?
Data for answering research question 5 are presented in table 8.
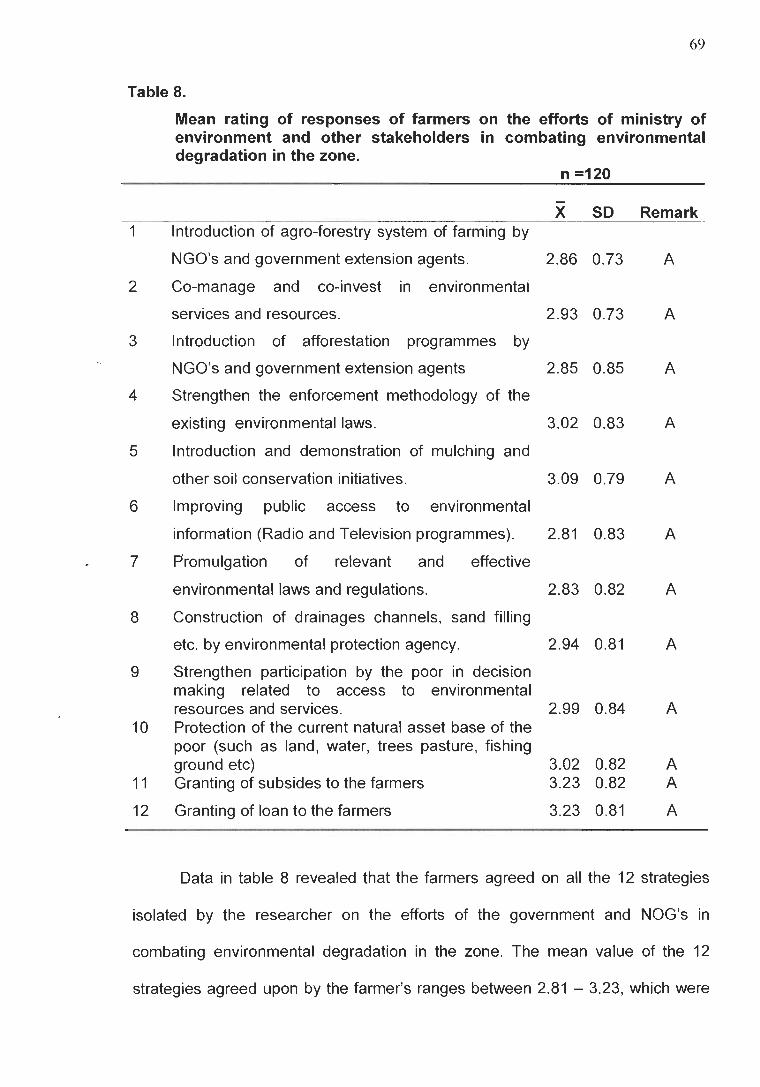
Table 8.
Mean rating of responses of farmers on the efforts of ministry of environment and other stakeholders in combating environmental degradation in the zone.
n =I20 - X SD Remark
lntroduction of agro-forestry system of farming by
NGO's and government extension agents. 2.86 0.73 A
Co-manage and co-invest in environmental
services and resources. 2.93 0.73 A
lntroduction of afforestation programmes by
NGO's and government extension agents 2.85 0.85 A
Strengthen the enforcement methodology of the
existing environmental laws. 3.02 0.83 A
lntroduction and demonstration of mulching and
other soil conservation initiatives. 3.09 0.79 A
Improving public access to environmental
information (Radio and Television programmes). 2.81 0.83 A
Promulgation of relevant and effective
environmental laws and regulations. 2.83 0.82 A
Construction of drainages channels, sand filling
etc. by environmental protection agency. 2.94 0.81 A
Strengthen participation by the poor in decision making related to access to environmental resources and services. 2.99 0.84 A Protection of the current natural asset base of the poor (such as land, water, trees pasture, fishing ground etc) 3.02 0.82 A Granting of subsides to the farmers 3.23 0.82 A
Granting of loan to the farmers 3.23 0.81 A
Data in table 8 revealed that the farmers agreed on all the 12 strategies
isolated by the researcher on the efforts of the government and NOG's in
combating environmental degradation in the zone. The mean value of the 12
strategies agreed upon by the farmer's ranges between 2.81 - 3.23, which were

above the cut of point of 2.55. The range of the standard deviation was 0.73 -
0.85. This shows that introduction of Agro-forestry system of farming, co-
investment and co-management in environmental services and resources,
afforestation programmes, enforcement of environmental laws improving public
access to environmental information and construction of drainage channels and
sand filling are government and NGO interventions in reducing environmental
degradation. Also strengthening the participation of the poor in decision making,
protection of the current natural asset base of the poor, granting of loan and
subsides to the farmers goes a long way to stimulate them not to degrade the
environment.
Findings
Based on the data collected and analysed, the study made the following
findings:
1. Environmental degradation manifested to higher extent in Central
Agricultural Zone of the State such as disturbing the natural forest
resources, tree felling activities, heavy duty machines damaged the soil
structures, biodiversity loss and erosion of different types were
physically manifested and the water quality was poor.
2. Level of poverty among farmers in Central Agricultural zone of Osun
State is high, such that most family of the farmers used Kerosene as
their main sources of fuel, cultivate small and fragile land, food
produced from the farm can not sustained them for the whole year, the
return they got from the farm can not adequately financed the whole
family, have little or no saving, could only afford to send their children
to public day schools where token fees are paid, have a large family
size that depend on them but fewer helping hands to assist them, and
can not afford to build their personal house but lived in a rented
apartments.
3. There was an association or close relationship between poverty and
environmental degradation in the zone.
4. Other predisposing factors to environmental degradation in the zone
include: forest exploration exploitation, poaching, bush fire, use of
explosive during Quarry work and the use of heavy machines for tillage
operations.
5. The efforts of the Government and other stake holders in combating
Environmental degradation in the zone include:- the introduction of
Agro-forestry system of farming by NGO1s and extension agents, co-
management and co-investment in environmental services and
r&ources, introduction of afforestation programme, government should
strengthen the enforcement methodology of the existing environmental
laws and edicts, introduction and demonstration of mulching and other
soil conservation techniques,, improving public access to
environmental information, Promulgation of relevant and effective
environmental laws and regulation, construction of drainage channels
and sand filling by environmental protection agency, strengthen
participation by the poor in decision making related to access to
environmental resources and services, protecting the current natural
asset base of the poor, granting loan and subsides to the farmers.
Discussion of the Findings
The discussion of the findings of the study was organized based on the 5
research questions and the two hypotheses formulated for the study:
1. The extent of environmental degradation in central Agricultural zone
of Osun State
The findings of the study shows that environmental degradation
manifested to higher extent in the zone, the natural forest resources was high
disturbed by deforestation as a result of heavy logging activities in the area. The
finding agreed with the view of Allen, (1993) that deforestation degrades the soil
more intensively than any other activity, that an estimated 40 percent of soil
degradation in Asia and 41 percent in South America is the result of
deforestation, including both careless logging practices and land clearing for
agriculture. This finding also corroborate the opinion of Cleaver and Schreiber
(2000) that iogging play a catalytic role in tropical deforestation, a situation where
original forest area turned into Savanna land. In the same vein, the finding of
biodiversity loss and deforestation agrees with the findings of Angelika Wilcke
(2006) that as deforestation proceeds, biodiversity shrinks and that the
. destruction of an entire forest of course destroys the ecosystem sheltered under
its canopy. She emphasized further than about 15 percent of the carbon dioxide
released to the atmosphere comes from carbon released when forests are
cleared. Thus, environmentalists worry that further deforestation will contribute to
global warming, which in turn may lead to further extinction of many species as
temperatures, habitats, and condition change.
The rejection of the remaining 4 activities out of the 15 isolated for the
study may have been due to the fact that the area under study had few industries

and the discharges and effluence from the factories do not have serious impact
on the environment. Also the volume of Agro-chemicals used in the area may be
very low and does not have effects on the health of farm animals in the zone.
2. The level of poverty among farmers in Central Agricultural zone of
Osun State
The study revealed that 10 out 11 indices of poverty isolated for the study
shows that the level of poverty among farmers in the zone was high. The findings
were in line with some of the findings of Champer in Renata (2002) in which he
highlighted the criteria used by local people in Asia and Sub-Saharan Africa for
lack of well being. Also the findings that revealed that the financial return that
farmer got from their farm can not adequately financed the whole family and that
they have little or no savings are in lien with the views of Sen (1984), Adesanya
(1998) and Okorodudu-Fibura (2000). When Sen pointed out that a family is poor,
#if her total earning are in sufficient to obtain the minimum necessities for the
maintenance of a merely physical efficiency. Adesanya (1998) opined that
poverty is a state of living with less than the smallest income to provide the
minimum standard of living. While Okorodudu-Fibura said to be poor literally
. means having a little money with which to buy ones basic needs.
3. The relationship between poverty level and environmental
degradation
The study also revealed that there was a close association between
poverty and environmental degradation in the area. The relationship was
statistically significant. This is in line with the findings of Cleaver and Schreiber
(2000) who discovered that poverty is an important agent of environmental
damage because poor farmers may resort to cultivating steeply sloped erosion

prone hill sides or clearing tropical forest, and their inability to afford other fuel
sources may make them cut down trees at unsustainable rates. The findings are
also is in line with that of Sara (2000) when he confirmed that the poor play a
significant role in unsustainable agricultural intensification and expansion of
farming into marginal lands and vegetative over-exploitation.
4. Other pre-disposing factors to environmental degradation
The finding of this study revealed that 6 out of 11 pre-disposing factors
were identified by the farmers and were in line with the view of Allen (1993) that
poor agricultural practices, overgrazing and deforestation all contributes to land
degradation. He further said that heavy logging machinery or bulldozer destroy
soil structure. The findings of the use of wild bush fire is also in line with the
findings of Reich, Numbem, Almaraz and Eswaran (2001) that land clearing
method by the farmers are traditional with slash- and -burn as an integral way to
remove vegetation, which exposes the land to degradation agents and destroy
valuable microbes in the soil.
The rejection of the remaining 4 pre-disposing factors out of 11 isolated for
the study may have been due to the fact that, the emission of effluence to the air
by factories and the disposal of untreated toxic industrial sewage in the area was
not much to warrant its appreciable effect on the environment, because there are
few industries in the area under study. But the finding of unidentified incorrect
methods of fertilizer application and prolonged use of herbicides differs from the
views and findings of Virman et al. (1994) and Allen (1993) that improper use of
in-puts include -over use of chemical fertilizers, pesticides and herbicides also
degrade the soil.

5. Effort of ministry of environment and other stakeholders in
combating environmental degradation.
The findings of the study revealed that all the 12 strategies which are
made up of government and NGO's initiatives and policies isolated for the study
were identified and agreed upon by the respondents as good strategies that help
in combating environmental degradation. These are in line with the findings of
Onokerhoraye (2004) when he said we can therefore conclude this paper by
reviewing a number of practical actions and or initiatives that the Delta state
Government in partnership with other stakeholders in the state can take to
implement policies and programmes, which aim to both, eliminate poverty and
improve the environment. These are co-manage and co-invest in environmental
services and resources, introduce agro-forestry system of farming, strengthen the
enforcement methodology of the existing environmental laws, introduction of soil
conservation, initiatives, promulgation of relevant and effective environmental
laws and regulation among other things. Also the findings to strengthen
participation by the poor in decision making related to access to environmental
resources and services and the protection of the current natural asset base of the
poor such as land, water, trees pasture, fishing ground etc. are in line with the
view of Allen (1993) when he said that in early 1992 the world conservation
union, the United Nations Environment Programme, and the World Resources
Institute suggested that poor people should be empowered in taken part in the
decisions that are related to access to common natural environmental resources
and their present natural asset base should be well protected. While the granting
of loan to the farmers is in line with the findings of Renata (2002) and Reardan
and Vosti (1995) who in their individual studies highlighted poor people's limited
capacity to mobilize critical cash, labour and other resources for the conservation
and protection of their environment.
CHAPTER FIVE
SUMMARY, CONCLUSION AND RECOMMENDATIONS
This chapter presents the summary of the study.
Re-Statement of the Problem
Most of the rural small-scale farmers and the young farmers club in our
various secondary schools are not fully aware of the impact of their various
farming practices on the environment. Thus, Osinem (2005) stressed that the
.main goal of the national policy on environment is sustainable development,
providing this nation and its citizenry with a sense of environmental direction.
Among the guidelines and strategies for achieving the goal is the raising of public
awareness and promoting understanding of the essential linkage between
environment and development.
Obaseki (1999) submitted in his report that ecological situation in Osun
state needs an urgent and drastic solution by the state environmental protection
agency and other stakeholders in order to avert national disaster in the state.
Cleaver and Schreiber (2000) maintained that, the poor are also thought to be
important agents of environmental damage. He explained further that, with little
land available to them, poor farmers may result to cultivating steeply shopped
erosion prone hill-sides or to clearing tropical forest.
Moreover, environmental degradation is as a result of the dynamic
interplay of socio-economic institutional and Technological activities. Poverty still
remain a problem of the root of several environmental degradation. Also
Akinbami, Akinwumi and Salami (1996) maintained that environmental
degradation has resulted into dislocation in many of the environmental process
that support life and sustained development. It also has a serious impact on the

sustainable Net National Product (SNNP) per annum of the nation. All these
points to the magnitude, the evil effect and economic loss resulting from
environmental degradation in Osun state. This study was therefore undertaken
specifically to:
1. find out the extent of the manifestations of environmental degradation
in central Agricultural zone of Osun State;
2. examine out the level of poverty among the farmers in the area;
3. determine the relationship between poverty and environmental
degradation in the study area;
4. find out other pre-disposing factors to environmental degradation in the
area, and
5. suggest ways of reducing environmental degradation, so as to avert
poverty in the study area.
Summary of the Procedure Used
Relevant literature was reviewed on major concepts of the topic. Five
research questions and 2 hypotheses guided the study. A total population of one
thousand two hundred and twenty (1,220) registered farmers with a sample size
of one hundred and twenty (120) were used for the study. Structured
questionnaire was developed, validated by three experts was used to elicit
responses from the farmers in Central Agricultural zone of Osun state. One
hundred and fifty copies of the questionnaire were distributed while one hundred
and twenty copies were completed and returned comprising 30 young farmers
club members from various secondary schools in the zone, 20 Graduate farmers
Association members, 25 Rudep farmers and 45 farm settlers Association
members. The data obtained were analysed using mean and standard deviation

to answer the research questions while Pearson Product Moment Correlation
(together with t-transformation) and Analysis of variance (ANOVA) were used to
test the hypotheses at .05 level of significance.
Principal Findings of the Study
From the data collected and analysed the principal findings of the study
were as follows:
1. Environmental degradation manifested to high extent in the agricultural
zone such as serious disturbance of natural forest, tree felling
activities, poor soil nutrients status, heavy duty machine that damage
the soil structure, there was biodiversity loss of plants and Animal spps,
erosion was rampant and water quality was poor.
2. Level of poverty among the farmers was high such that majority of the
family uses kerosene and fuel woods for cooking, farmers cultivate
small and fragile lands, food produced from the farm can only
sustained the family for few months, the sale got from the farm can not
adequately finance the whole family, farmers can not save money,
could only afford to send their children to public day schools, farmers
rear a large family size that depend on them but fewer helping hands to
assist, they don't have personal owned building, but they lived in rented
apartments.
3. Poverty among the farmers was found to be positively and significantly
correlated with environmental degradation.
4. Pre-disposing factors to environmental degradation in the area are:
forest exploration and exploitation, poaching, bush fire, the use of
explosive during Quarry work and the use of heavy tillage machines.

5. State Agency and other stakeholders strategies for reducing
environmental degradation in the area include: Introduction of agro-
forestry system of farming, co-management and co-investment in
environmental services and resources, introduction of afforestation
programmes, strengthen the enforcement methodology of the existing
environmental laws, introduction of different soil conservation
techniques, improving public access to environmental information,
promulgation of relevant and effective environmental laws and
regulations, construction of drainage channels and sand filling,
strengthen participation by the poor in decision making related to
access to environmental resources and services, Protecting the current
natural asset base of the poor, granting of loan and subsides to the
farmers.
Conclusions
The following conclusions were drawn based on the findings of the study:
There was high manifestation of environmental degradation in the study
area. Poverty was rampant among farmers in the study area.
There was close association and positive relationship between poverty
and environmental degradation in the area.
Factors that predisposes environment to degradation in the area include,
poaching, bad methods of exploration and exploitation of forest resources, bush
fire,use of heavy tillage machines etc. Also strategies, initiatives and policies &e
highlighted for the Federal and State Ministry of Environment, Environmental
Protection Agency and other stakeholders for use in order to reduce

environmental degradation and avert poverty in the Central Agricultural Zone of
Osun state.
Implications of the Study
The findings of this study have positive implications for all the resource
users, students teachers and the government in the three tiers of governance in
the following ways: (a) Bring about effective environmental management
practices, (b) raise awareness of people on environmental matters, (c) help the
farmer to adopt sustainable farming system, (d) help in poverty reduction
strategies and programme (PRSPs).
Brings about effective environmental management practices
Effective environmental management has to do with the improvement in
the indicator of environmental quality. Management will involve the training of
resource users in Nigeria in which emphasis will be placed on the understanding
of the vital role of agriculture to man's welfare and the importance of maintaining
environmental quality, which the findings of this study will be of use. Because
previous approaches to resources exploitation have all along been viewed only in
economic terms. It is how ever not too late, in order to avoid the problems
inherent in such approaches, to realize that man's welfare can be advanced with
proper, rational use and management of environment and its resources. In order
to prevent deforestation, knowledge of the limits of the carrying capacities of the
rural resources under specific farming and grazing condition must be highlighted.
And since local diversities exist in soil and climate, the availability of land use
capabilities maps should serve as a basis for zoning and land use legislation (i.e.
on the part of government). Such that measures will be instituted to prevent
misuse of cropland, misuse of agricultural inputs and care less disposal of
wastes.
Raising Awareness of People on Environmental matters
Raising the awareness of the people has to do with environmental
education which will create awareness in people on the impact of their various
farming methods and activities on the environment. Environmental education will
include the knowledge of farming practices and their impact on land, water and
Air in the immediate and remote environment. It will also include the knowledge
of existing environmental laws, edicts and regulations in the country and how it
should guide the use of environment. The findings of this study, therefore will
raise the awareness of all the resource users - students, teachers and farmers of
the impact of their daily activities and farming practices on the environment.
Help the farmers to adopt sustainable farming system
Sustainable farming system has to do with a system of farming that
reduces environmental degradation, conserve resources and provide an
adequate and dependable farm income through reducing poverty and associated
problems. The farmers and other resources users will embark on farming system
that are environment friendly and at the same time bring steady supply of income
for family use. Sustainable farming will bring about the food security which the
nation is clamouring for, because food will be available, accessible and avoidable
for the people in the state and country in general.
Help in Poverty Reduction Strategies and Programme (PRSPs)
The United Nation General Assembly's millennium Declaration and the
millennium Development Goals is aiming to eradicate poverty and hunger among
member nations. Thus the World Bank uses the initiative to give debt relief to
developing nations. In order to qualify, however the country has to produce a
comprehensive Poverty Reduction Strategy Paper (PRSP) which in addition to
analyzing the situation as it currently exists, describes measures aimed at
reducing poverty at the national level with the involvement of civil society. The
findings of this study therefore will be of good use in preparing PRSP. Because it
is well known that 70 percent of poor and hungry people lie in rural areas of
developing countries, this crucial aspect has been largely ignored in formulation
of poverty reduction strategies. Government prefer to ignore it and donors do not
exert sufficient influence to give greater weight to measures aimed at supporting
farmers, whether it be by promoting the processing and marketing of local
agricultural produce or by facilitating access to non-agricultural sources of
income.
Recommendations
From the findings of this research, it is recommended that:
1. Faculties of education in universities and other institutions involved in
teacher preparation should incorporate environmental agriculture into
their training programmes in order to equip would-be teachers with the
knowledge and skills of environmental agriculture for onward transfer of
the knowledge to their students after graduation.
2. The officials of the ministry of education should use the findings of this
research to make a reform of the secondary school agricultural
curriculum to include elementary environmental agriculture. And also to
organize workshops and seminars for the retraining of the teachers in
the field.
3. The state and the local government can equally use the findings of this
research to organize a Radio talk, workshops and seminars for the
farmers in their various local government areas.
Suggestion for further Research
A study should be conducted on population, poverty and Environmental
degradation in Osun state, Nigeria.
REFERENCES
Adesanya E. R., (1 998). Rural Women and Poverty: which way out by the year 2000: JOWICE, Vol. 2 (87).
Akeredelu F., (1989). Atmospheric environmental Problems in Nigeria: an over view. Atmospheric Environment, 23 (4), 783-792.
Akinbami, J.F.K., Akinwumi, 1.0 & Salami, A.T. (1996). Implication of Environmental Degradation in Nigeria. National Resources Forum, 50 (I), 31 9.
Allen H., (1993). Environmental Almanac. Houghton Mifflin Company Boston & New York.
Anagbogu, A.U., (2000). Poverty Alleviation: lmplication for the Youth Development. Paper Presented at Workshop at Abuja.
Angelica, W.,. (2006). A~riculture and Rural Development CTA and DLG- Verlags-GmbH, Frankfurt, Germany.
Beinroth, F.H., Aswaran, H., Reich P. F. and Van Den Berg, E. (1994). Land related stresses in Agro ecosystem. In: Stressed Ecosystems and Sustainable agricultural, eds. S.M. and I.P, Abrol New Delhi, India. Oxford and IBH.
Cleaven. K.M and Schreiber, G.A (2000). Poverty and the Environment: pieces of the puzzle. http://www. poverty & environment.com.
Daniel D. C., (1991). Environmental Science. Action for sustainable future. The Bayamind Cumminas Publishing Company, New York.
David Y., (1 994). Webster's Encyclopedic Unbridge Dictionary of English Language. Gramercy Books: New York.
Dregne, H .E. (1 977). Desertification of Arid Lands Economic Geography, 5,3,329.
Elegbede, K, Odubona S. and Egeonu (1988). "As We Grow in Industrialization, How Safe are We?" Sunday Time, February 14, pp 9 and 18.
Ezeji S. C. O.A. (2004). Basic principle of research in education. C heston Agency Ltd. Enugu.
1' ? - * John, B. and Jeffrey G. (1999). Human. Resources Management, Theory and
Practice (2nd ed.). Macmillan Press Ltd. London.
Malik, S.J. (1999). Rural Poverty and Land degradation: What does available literature suggest for priority settings for the consultative group on Int. Agric. Research? Report prepared by the technical Advisory Committees of the CGIAR, Vienna, Virginia.

Mortimore: M (1989). Adopting to Drought: Farmers Famine and Desertification in West Africa. Cambridge University Press, p 299.
National Concord, August 19, (1988). Disaster: Bagauda Dani Gires way to follow Pressure.
New Book of Knowledge (2003). Vol. 5 Crolier Publishing Company. Inc. Danbury Connuctiout.
Nick Middleton (1988). Atlas of the Environmental Issues. Oxford University Press, London.
Nigerian Environmental study / action Team (NEST)(1991). "Nigeria's Threatened Environment: Atmosphere". NEST, lntech Printers Ltd. Ibadan.
Nkata (2006). Environmental degradation and farm management practices of farmers in Delta and River States of Niger Delta area. Unpublished Ph.D Thesis.
Obaseki (1999). Extent and Implication of Environmental degradation in Osun State: A Report on Ecological problems in Osun State.
Obaseki, S.0 and Ohonba, E. A. (1988). Environmental Impact of Steel Production in Environmental Issues and Management in Nigeria Development. Evans Brothers And Ibadan, pp 182-1 95.
Ofomata, G.'E.K. (1981). The hard resources of South-eastern Nigeria: A need for conservation. In land use and conservation in Nigeria. Ed. U.M. Igbozurike, University of Nigeria Press, Nsukka.
Okorodudu, Fubara (2000). Focus on Gender lssue on Povert Alleviation. A cK Paper Presented at the National Workshop Abuja 25th - 26 July.
On-line (2006). The Underline Causes of Environment Degradation. http://www.causes of environment deqradation.com.
Onokerhoraye A. G. (2004). Toward Effective Environmental and Town Planning Policies for Delta State. http://www.toward effective env. & town planing.com
Osinem (2005). Environmental Education in Agriculture. Cheston Ltd. Enugu Nigeria.
Osuala, E.C (2001 ). Introduction to Research Methodology (3d edition). African Rep. Published Itd. Onitsha.
Pinstrup, A.P., Pandya. E.R. and Roseegrant, M. (1997). The World food Situation: recent developments emerging lssue and Long-term prospects. 2020 Vision Food Policy Report, International Food Policy Research Institute, Washington.
Reardon, T. Vosti, S. A. (1995). Links Between Rural Poverty and the Environment in Developing Countries: Asset Categories and Investment Poverty. World Bank Development 23 p9.
Reich, Numbem, Almaraz and Eswaram, (2001) Land Resource Stresses and Desertification in Africa. Agro - Science Vol. 2 Number 3 ppl - 10
Renata Lok-Dessallien (2002). Review of Poverty Concepts and Indication http://www. review of povertv concept .corn.
Sara J. S., (2000) A Downward Spiral? Research Evidence on the Relationship Between Poverty and Natural Resources Degradation. http://www.elservier.com/locate/foodpol.
Salvia, J. and Ysieldyke, J. E. (1988). Assessment in special and remedial education. Houghton Miffin Company, Beston, USA, p. 58.
Sen A., (1984). Poor Relatively Speaking in Resources, Values and Development. Oxford London: Clarendon Press.
Siddiqur R. O., (2003). Evolving Views on Poverty: Concepts, Assessment, and strategy. http://www. povertvand social development. com.
Sunday Times August 2lSt p10 (1988). "lbadan Floods: The Case of Man-made Disaster".
Titilola, S.T. (2000). Environmental and Sustainable Agricultural Development in Nigeria. http://www.sustainable development and Aqric.Com.
Ukwu, I.U. (1988). Enunu State Poverty Report. Enunu: Institute for Development Studies UNDP.
United Nations (1 996). First International Decade for the Eradication of Poverty 1997-2006 UN, New York.
Virmani, S.M, Latyal, J.C, Eswaran, H. and Abrol .I. (1994). Stressed Agro Ecosystems Sustainable Agriculture. New Del hi: Oxford and I BH.
World
World
Bank (1990). Toward the Development of Environmental Action Plan for Nigeria. Report No. 9002. UN World Bank, Washington DC.
Bank (1994). Nigeria Poverty in the Midst of Plenty: The chaHen~e of Growth and Poverty Assessment. Washington D.C.
APPENDIX I
Department of Vocational Teacher Education, Agric. Education Section, University of Nigeria, Nsukka, Date
Dear Sir,
Request For Face -Validation of Research Instrument.
I am a Post -graduate student in the Department of Vocational
Education, Agric, Education Section. University of Nigeria, Nsukka. I am
Teacher
currently
Undertaking a research project title - Assessment of Poverty and Environmental
degradation Among farmers in central Agricultural zone of Osun State, Nigeria.
Attached is a draft copy of the questionnaire for the study. You are please
requested to read through the items and Vet their clarity, relevance and total
courage of 'the Assessment of poverty and Environmental degradation among
farmers in the central Agricultural zone of the State (or the relationship between
Poverty and Environmental degradation among farmers in the study area).
Blank spaces have been provided for your comments and suggestions.
Yours, Sincerely,
Adejobi A.O. PGIM. ED1041391 55
Dr. E.C OSINEM (Supervisor)
APPENDIX II
Department of vocational Teacher education. University of Nigeria, Nsukka. Date
Dear Respondents,
Request For Respond to Questionnaire
I am a postgraduate student in the Department of Vocational Teacher
Education, University of Nigeria, Nsukka. Am Currently undertaking a research
project titled Assessment of Poverty and Environmental degradation in the central
Agricultural zone of Osun State Nigeria.
The attached questionnaire schedule is to elicit the necessary information
for the said project. You are please requested to respond to the items as
objectively as possible. Every information supplied will he treated as confidential
and will be used strictly for this research.
Thanks.
Yours Faithfully,
Adejobi A.O. PG/M.ED/04/39155.
Dr. E.C OSINEM (Supervisor)
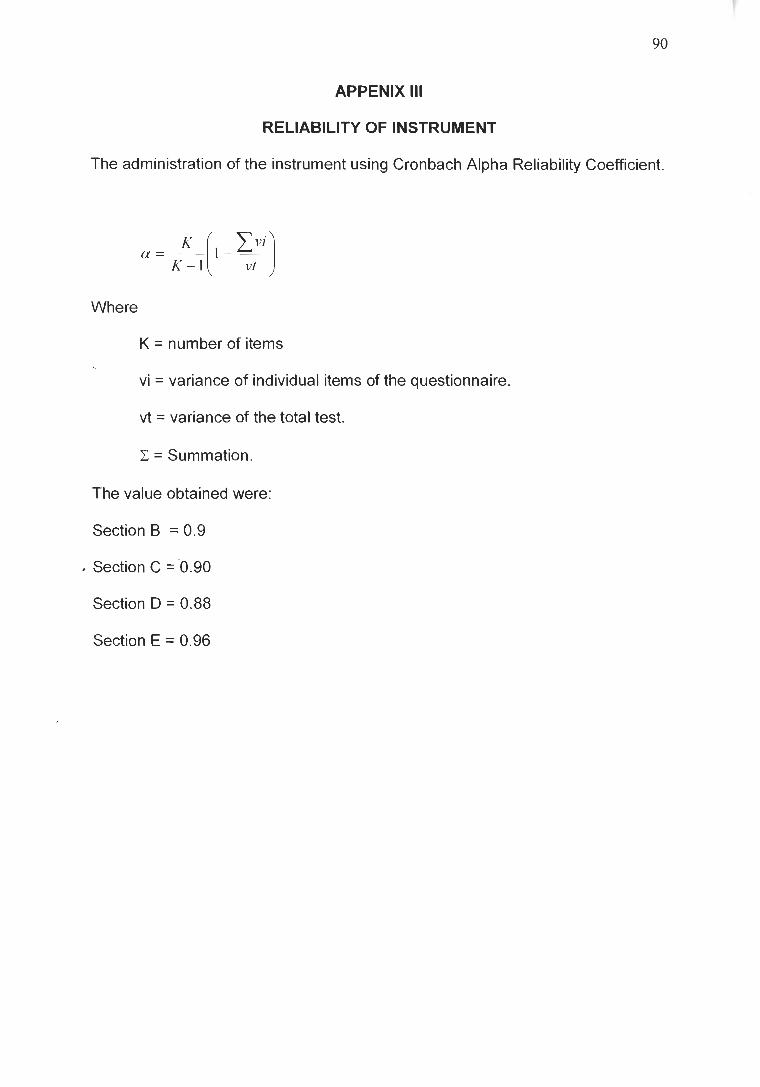
APPENIX Ill
RELIABILITY OF INSTRUMENT
The administration of the instrument using Cronbach Alpha Reliability Coefficient.
Where
K = number of items
vi = variance of individual items of the questionnaire.
vt = variance of the total test.
C = Summation.
The value obtained were:
Section B = 0.9
. Section C = '0.90
Section D = 0.88
Section E = 0.96

APPENDIX IV
FORMULAR FOR ANALYSIS OF VARIANCE USED FOR TESTING
HYPOTHESIS 1
Total sum of square (TSS) C x~~ = x X - - [xNXr --
Sum of square between group (SSB)
sum of square within group (SSw)
Therefore SSw = X1 + X2 -t X3 + X4
df between groups = (G -1) = (4-1)
df within groups = (nl - 1) -t (n2 - 1) + (n3 -1) + (n4 - 1)
Between groups mean square
Within group means square
1MSh F - ratio - n4s,,;

APPENDIX V
a. Formular for calculating correlation using Pearson product
moment correlation coefficient (Raw score method)
r = correlation coefficient
N = No of question items
X = X variable (responds on environmental degradation)
Y = Y variable (responds on poverty level)
C = summation sign.
b. Formular for t - transformation (i.e. changing rho or p to t- statistic)
where t = t - statistics
r = rho (i.e p) correlation coefficient
N = Number of cases (sample size)
N -2 = degree of freedom
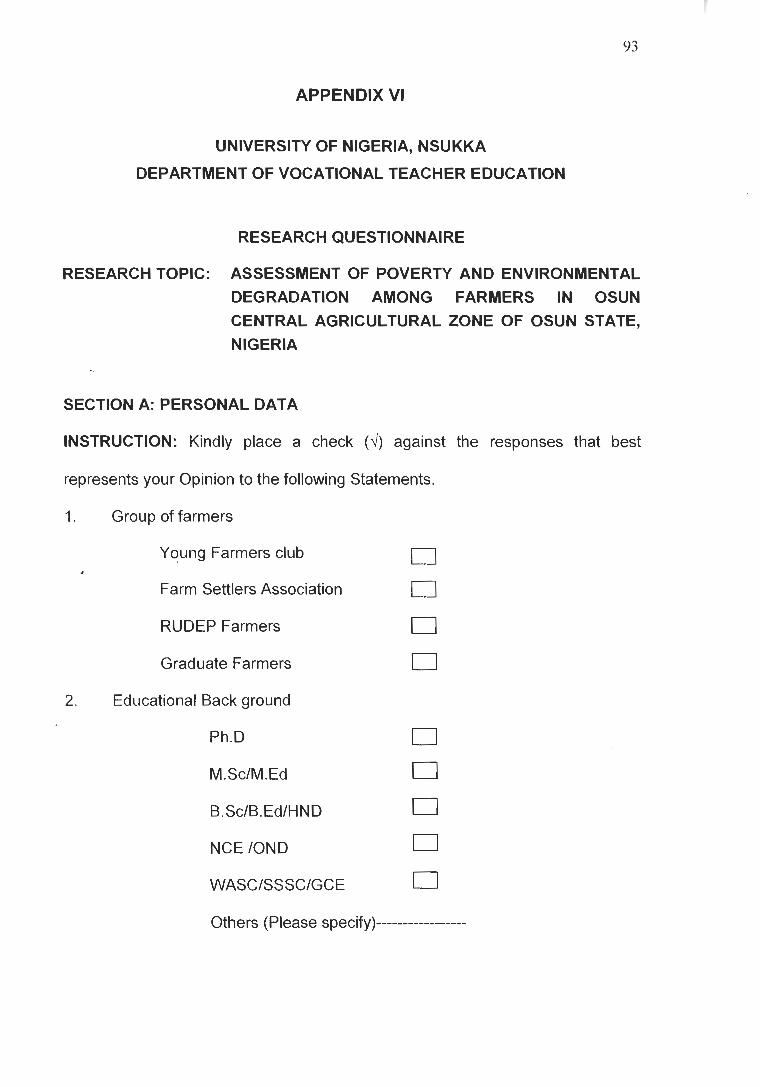
APPENDIX VI
UNIVERSITY OF NIGERIA, NSUKKA
DEPARTMENT OF VOCATIONAL TEACHER EDUCATION
RESEARCH QUESTIONNAIRE
RESEARCH TOPIC: ASSESSMENT OF POVERTY AND ENVIRONMENTAL DEGRADATION AMONG FARMERS IN OSUN CENTRAL AGRICULTURAL ZONE OF OSUN STATE, NIGERIA
SECTION A: PERSONAL DATA
INSTRUCTION: Kindly place a check (4) against the responses that best
represents your Opinion to the following Statements.
Group of farmers
Young Farmers club
Farm Settlers Association
RUDEP Farmers
Graduate Farmers
Educational Back ground
Ph.D
M.Sc1M.Ed
B.Sc/B.Ed/HND
NCE IOND
WASCISSSCIGCE
Others (Please specify)-----------------

3. Sex of the respondent
Male
Female
4. No. of years of farming
1 - 3yrs
4 - 6yrs
7 - I Oyrs
10 yrs and Above
SECTION 6:
What is the extent of Environmental degradation in Osun Central
Agricultural zone? Please, check (d) in the column provided the extent of your
agreement with the following activities.
Key: SA - Strongly Agreed
A - Agreed
D - Disagreed
SD - Strongly Disagreed
Natural forest resources in the area were not
protected I I I I
Tree felling activities in the area is rampant
The soil nutrients in the area is inadequate for
cultivated crops to perform well I I Farmers need chemical fertilizers before the
crops can yield well

ieavy machines that causes soil compaction
3nd damage the soil structure were in use
Iisappearance of certain spp. of plants &
4nimal that are previously present in the area.
There is manifestation of gully erosion
There is manifestation of sheet erosion
rhere is manifestation of rill erosion
Rivers overflow their banks 1 Growth of water-weeds in the Rivers and water
ways
Agro-chemicals used on the farm do cause
damages or ill-health to farm animals 1 Dumping of industrial wastes is common in the
area
Air pollution by industrial effluence affect plants
and Animals life
Untreated toxic sewage poured on the land
have serious effects on the soil properties

SECTION C:
What is the level of poverty among the farmers in Osun Central
Agricultural zone?
Direction: Please check (4) in the column provided the extent of your agreement
with the following statement
SD Statement
',
6 1 You have much to save I I 1 I
3
4
5
SA
1
2
Have no access to a large acres of land for
farming
The food from the farm can only sustained the
family for few months
The returns (in monetary terms) from your farm
is insufficient to pay your children school fees
and'family up - keeps.
SECTION D:
Family used kerosene and on few occasions
used fuel-woods for cooking
Never use Gas & Electric cooker
7
8
9
10
11
What are the other pre-disposing factors to Environmental degradation in
A
Your children attends public schools
Is your family size large (i.e. no of children &
wives)
Have a few helping hands on the farm
Do not owned a personal building
Do not live in a house constructed with cement
blocks
your area?
D
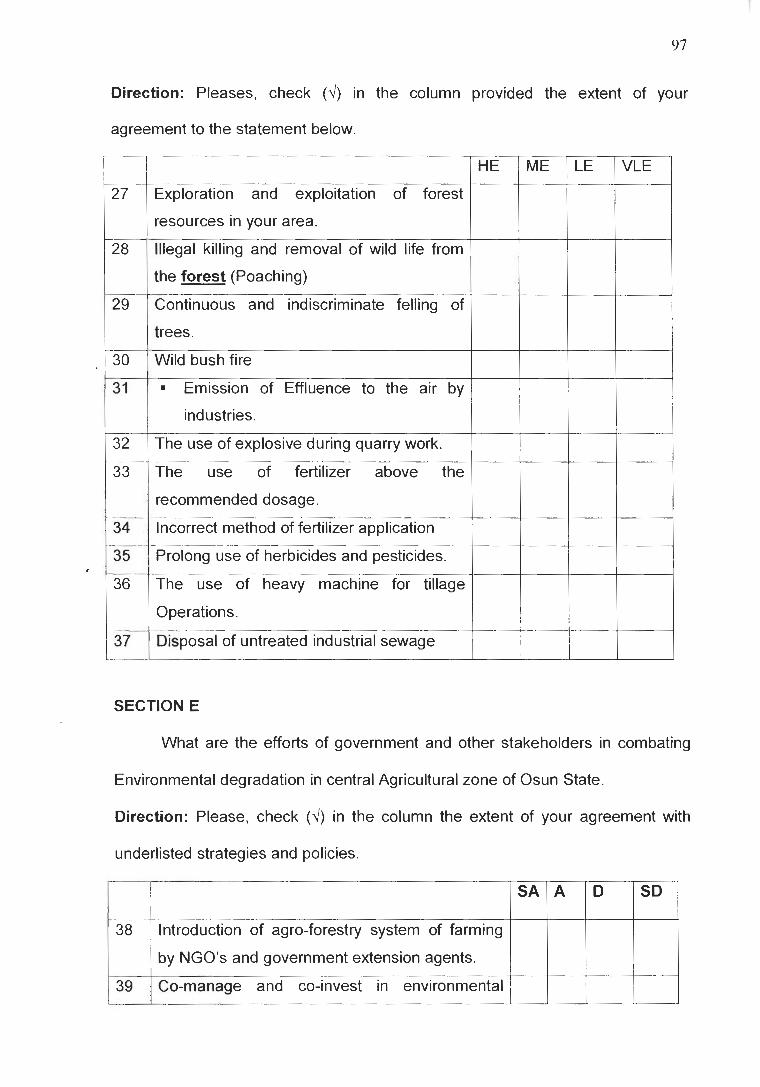
Direction: Pleases, check (4) in the column provided the extent of your
agreement to the statement below.
/ resources in your area.
27 Exploration and exploitation of forest
1 the forest (Poaching) 1 1 / I I L I I I I
28 Illegal killing and removal of wild life from 1
29 Continuous and indiscriminate felling of
30
/ industries.
trees.
Wild bush fire
31
32 / The use of explosive during quarry work. 1 1 / 1 I
Emission of Effluence to the air by
34 1 Incorrect method of fertilizer application 1 I 1 I
33
I I I I -
35 1 Prolong use of herbicides and pesticides.
The use of fertilizer above the
recommended dosage.
I I 1 I I
37 ( Disposal of untreated industrial sewage
36
SECTION E
The use of heavy machine for tillage
Operations.
What are the efforts of government and other stakeholders in combating
Environmental degradation in central Agricultural zone of Osun State.
Direction: Please, check (4) in the column the extent of your agreement with
underlisted strategies and policies
38
39 .
Introduction of agro-forestry system of farming
by NGO's and government extension agents.
Co-manage and co-invest in environmental
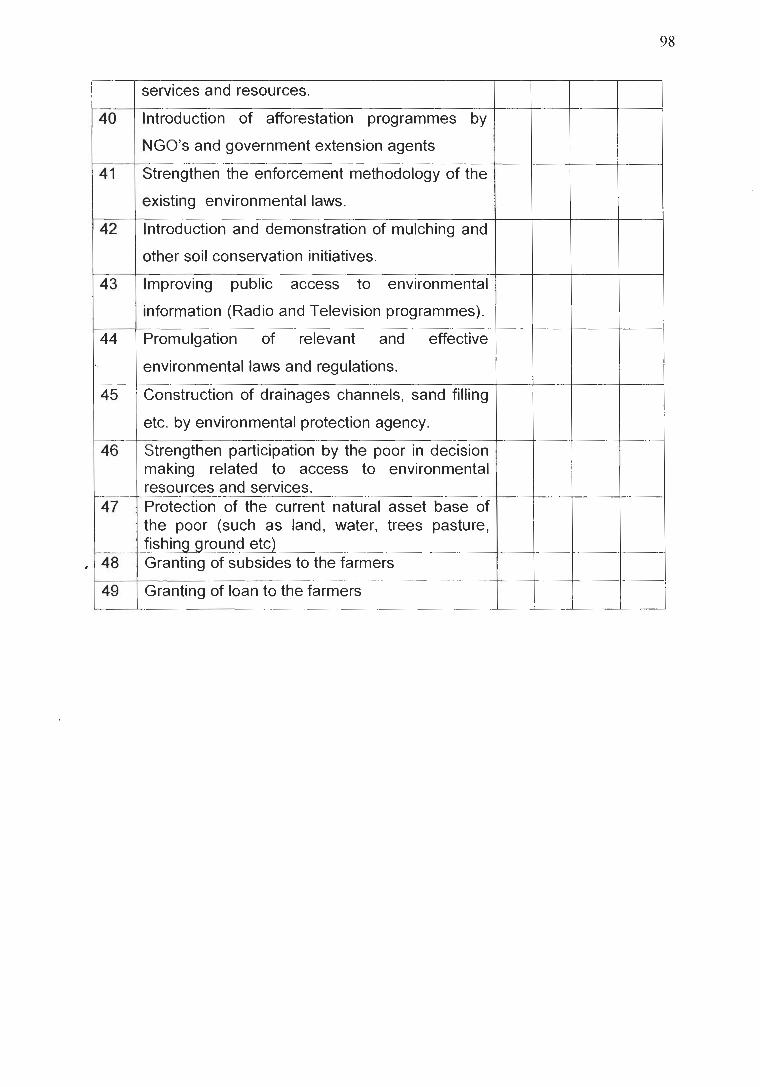
services and resources.
lntroduction of afforestation programmes by
NGO's and government extension agents
Strengthen the enforcement methodology of the
existing environmental laws.
lntroduction and demonstration of mulching and
other soil conservation initiatives.
Improving public access to environmental
information (Radio and Television programmes).
Promulgation of relevant and effective
environmental laws and regulations.
Construction of drainages channels, sand filling
etc. by environmental protection agency.
Strengthen participation by the poor in decision making related to access to environmental resources and services. Protection of the current natural asset base of the poor (such as land, water, trees pasture, fishing ground etc) Granting of subsides to the farmers
Granting of loan to the farmers