university of são paulo “luiz de queiroz” college of ... · 1 university of são paulo “luiz...
TRANSCRIPT

1
University of São Paulo “Luiz de Queiroz” College of Agriculture
Use of different street trees species and their effect on human
thermal comfort
Mariana Dias Baptista
Dissertation presented to obtain the degree of Master in Science, Area: Forest Resources. Option in: Conservation of Forest Ecosystems
Piracicaba 2014

2
Mariana Dias Baptista Forest Engineer
Use of different street trees species and their effect on human thermal comfort
versão revisada de acordo com a resolução CoPGr 6018 de 2011
Advisor: Prof. Dr. DEMÓSTENES FERREIRA DA SILVA FILHO
Dissertation presented to obtain the degree of Master in Science, Area: Forest Resources. Option in: Conservation of Forest Ecosystems
Piracicaba 2014

Dados Internacionais de Catalogação na Publicação
DIVISÃO DE BIBLIOTECA - DIBD/ESALQ/USP
Baptista, Mariana Dias Use of different street trees species and their effect on human thermal
comfort / Mariana Dias Baptista. - - versão revisada de acordo com a resolução CoPGr 6018 de 2011. - - Piracicaba, 2014.
95 p: il.
Dissertação (Mestrado) - - Escola Superior de Agricultura “Luiz de Queiroz”, 2014.
1. Planejamento urbano 2. Arborização de ruas 3. Clima urbano 3. Imagens termais I. Título
CDD 715.2 B222u
“Permitida a cópia total ou parcial deste documento, desde que citada a fonte -O autor”

3
DEDICATION
I dedicate my dissertation work to my family.
To my parents, Emanuel and Maria Luiza,
who have always loved me unconditionally and
whose good examples have taught me to work hard
for the things that I aspire to achieve.
To my brother Lucas,
who has never left my side and is very special.

4

5
ACKNOWLEDGEMENTS
First and foremost, I would like to thank God. I could never have done this
without the faith I have in you, my Lord.
I would like to thank my advisor Prof. Demóstenes, for his trust in my research
and willingness to share the fruits of his experience.
I also want to thank to the CNPq Foundation for their financial support for my
research.
Furthermore, I am thankful to the Canadian Bureau of International Education,
for having graciously supported me and for allowing me to pursue my research in
Canada.
I would like to thank Professor James Voogt for his contributions to this
research and warm hospitality during my stay in Canada.
I would like to thank Jefferson for his readiness to help during all stages of this
work
I thank all my fellow labmates in the Center of Quantitative Methods,
especially to those who helped me during the stages of fieldwork and analysis: Léa,
Helena, Camila, Diorny, Dalton, Cella and Déa.
I would also like to thank Vulevu, Lãparina, Flamboiã, Xaulim and Farofa. The
friendship born during the period of our undergraduate studies sustained me during
the academic battlefield of graduate studies.
A special thank you to my second family in Piracicaba: Jãgada, Pag´, Aufred,
Matusa e Borça. This project would not have been entirely possible without their
friendship and support.
Thanks to my friends, Marcela, Renata, Matheus and Paulinho, for their
friendship that has withstood the test of time and distance.

6
Thanks to my fellow brothers and sisters in Christ from TLC, for their prayers
and encouragement throughout these years.
I also want to thank my friends, Giulia, Juliana, Jéssica, Caroline, Letícia and
Natália, with whom I navigated the trials and tribulations of my First Canadian Winter.
Last but not least, I would like to thank my entire family, especially my parents
Maria Luiza and Emanuel for their ongoing love, dedication and support and my
brother Lucas, for being my first best friend.
7
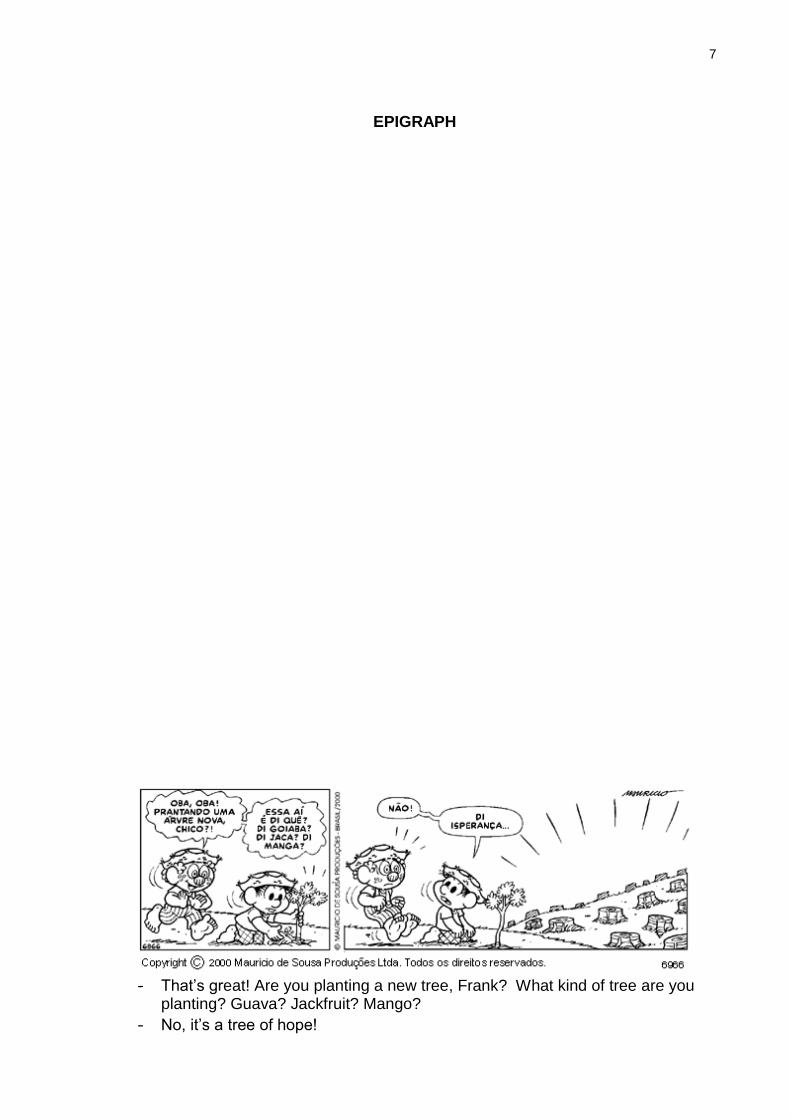
EPIGRAPH
- That’s great! Are you planting a new tree, Frank? What kind of tree are you
planting? Guava? Jackfruit? Mango?
- No, it’s a tree of hope!

8

9
CONTENTS
RESUMO................................................................................................................... 11
ABSTRACT ............................................................................................................... 13
LIST OF FIGURES .................................................................................................... 15
LIST OF TABLES ...................................................................................................... 19
1 INTRODUCTION .................................................................................................... 21
1.1 Background ......................................................................................................... 22
2 OBJECTIVES ......................................................................................................... 23
3 LITERATURE REVIEW .......................................................................................... 25
3.1 Climate ................................................................................................................ 25
3.1.1 Urban climate ................................................................................................... 26
3.1.2 Urban Forestry and climate .............................................................................. 27
3.2 Selection of trees ................................................................................................. 28
3.3 Thermal comfort and index .................................................................................. 30
3.4 Thermal images ................................................................................................... 32
3.5 ENVI-met ............................................................................................................. 33
4 MATERIALS AND METHODS………………………………………………………….35
4.1 Area of study ....................................................................................................... 35
4.2 Climate measurements........................................................................................ 37
4.2.1 Statistics ........................................................................................................... 39
4.3 UTCI Index .......................................................................................................... 39
4.4 ENVI-met ............................................................................................................. 40
4.5 Species characterizations .................................................................................... 40
4.5.1 Poincianella pluviosa var. peltophoroides (Sibipiruna) ..................................... 40
4.5.2 Tipuana tipu (Tipuana) ..................................................................................... 41
4.5.3 Handroanthus pentaphyllus (Ipê-de-El-Salvador) ............................................. 42
4.6 Surveys ............................................................................................................... 42
5 RESULTS ............................................................................................................... 45
5.1 Microclimate data ................................................................................................ 45
5.1.1 Temperature ..................................................................................................... 45
5.1.2 Relative humidity .............................................................................................. 51

10
5.1.3 Wind speed ...................................................................................................... 54
5.2 Surface temperature using thermal images ........................................................ 56
5.3 Survey analysis ................................................................................................... 65
5.3.1 General characterization .................................................................................. 65
5.3.2 Thermal sensation ........................................................................................... 67
5.3.3 Perception questions ....................................................................................... 69
6 CONCLUSIONS .................................................................................................... 73
REFERENCES ......................................................................................................... 75
REFERENCES CONSULTED .................................................................................. 80
APPENDIX ................................................................................................................ 82
ANNEX ..................................................................................................................... 90

11
RESUMO
O uso de diferentes espécies na arborização de ruas e seu efeito para o
conforto térmico humano
As contínuas transformações nas áreas urbanas têm trazido muitos problemas relacionados à perda da qualidade ambiental, como por exemplo, a falta de árvores nas ruas. Podemos dizer que a arborização urbana influencia diretamente no conforto térmico das cidades, e as pessoas podem realmente sentir na pele a diferença nas condições ambientais entre uma rua arborizada e outra sem árvores. Por isso, um melhor manejo destas árvores pode beneficiar a qualidade do ambiente local, e consequentemente, a qualidade de vida da população. Um dos primeiros passos nesse manejo é a escolha de espécies, porém poucos estudos abordam o real efeito desta escolha para as condições ambientais futuras do local. O presente trabalho tem como objetivo investigar o efeito do uso de diferentes espécies na arborização urbana para o conforto térmico na cidade de Piracicaba-SP. Para isso, foi medida a temperatura do ar, umidade relativa, velocidade do vento, e temperatura de globo. Os equipamentos foram distribuídos ao longo de três ruas diferentes onde uma das espécies escolhida prevalecia. Sibipiruna, Ipê-de-El-Salvador e Tipuana foram as espécies escolhidas dentre as árvores mais utilizadas nas ruas de Piracicaba. Imagens termais dos pontos de medição e questionários voltados à população local foram utilizados para auxiliar na interpretação. Todos os dados coletados foram aplicados no cálculo do Índice de Conforto Térmico Universal (UTCI). A presença de árvores influenciou diretamente nas variáveis climáticas estudadas. As três áreas apresentaram diferença significativa entre os pontos arborizados e não arborizados, tanto no período seco quanto no chuvoso. As ruas arborizadas apresentaram menor temperatura, maior umidade relativa e menor velocidade do vento (exceto na área 3). Os resultados podem ajudar na tomada de decisões baseando-se no papel das árvores dentro do ambiente urbano, como a melhoria do conforto térmico para a população.
Palavras-chave: Planejamento urbano; Arborização de ruas; Clima urbano; Imagens
termais

12

13
ABSTRACT
Use of different street trees species and their effect on human thermal comfort
The continuous transformation in urban areas has brought many problems related to the loss of environmental quality, such as the lack of trees in the streets. It is commonly understood that urban forestry influences directly on thermal comfort in urban areas, and people can actually feel the different environmental conditions between a street with and without trees in a city. That is why better management of the trees can benefit local environmental quality, and, consequently, the quality of life of its population. One of the first steps of this management is the choice of species, but few studies approach the real effect of this choice for future local environmental conditions. The present work aims at investigating the effect of using different species in urban forestry for thermal comfort in Piracicaba - Sao Paulo. In order to do so, instruments were used to measure the air temperature, relative humidity, wind speed, and globe temperature. These equipments were distributed along three different streets where a single species is planted. Sibipiruna, Ipê-de-El-Salvador and Tipuana were the chosen species of trees commonly used in the streets of Piracicaba. Thermal images of the measuring points and questionnaires aimed at the local people will be used to help interpreter different arrangements. All this data was applied for calculate the Universal Thermal Comfort Index (UTCI). The presence of trees influenced the climatic variables. The three areas showed significant differences between streets with and without trees, both in the dry and rainy period. The streets with trees presented lower temperature, higher humidity and lower wind speed (except in Area 3). In all cases, the trees species had positive effects on human thermal comfort index.The results can help to take choices based on the role that trees should play in a city, such as improve thermal comfort for the population.
Keywords: Urban planning; Street trees; Urban climate; Thermal images
-=

14

15
LIST OF FIGURES
Figure 1 - The urban atmosphere showing the urban boundary layer and urban
canopy layer ........................................................................................... 26
Figure 2 - Scheme of the daytime energy exchanges between an isolated tree and its
street canyon environment (Tl: Leaf temperature ans Ta: Air temperature).
.................................................................................................................. 28
Figure 3 - Elements of the operational procedure and concept of UTCI. ................... 31
Figure 4 - Location of Piracicaba ............................................................................... 35
Figure 5 - a) Street view of area 1; b) Satellite view .................................................. 36
Figure 6 - a) Street view of area 2; b) Satellite view .................................................. 36
Figure 7 - a) Street view of area 3; b) Satellite view .................................................. 37
Figure 8 - Weather station ......................................................................................... 38
Figure 9 - Comparison between comfort indexes ...................................................... 39
Figure 10 - Sibipiruna tree on the street .................................................................... 41
Figure 11 - Tipuana tree on the street ....................................................................... 42
Figure 12 - Ipê tree on the street ............................................................................... 42
Figure 13 - Hourly average of air temperature in area 1 during the dry season ........ 46
Figure 14 - Hourly average of air temperature in area 1 during the rainy season ..... 46
Figure 15 - Hourly average of air temperature in area 2 during the dry season ........ 47
Figure 16 - Hourly average of air temperature in area 2 during the rainy season ..... 48
Figure 17 - Hourly average of air temperature in area 3 during the dry season ........ 49
Figure 18 - Hourly average of air temperature in area 3 during the rainy season ..... 49
Figure 19 - Distribution of air temperature within each area ...................................... 50
Figure 20 - Air temperature in University station and experiment station in the same
day ....................................................................................................... 51
Figure 21 - Hourly average of relative humidity in area 1 during rainy season .......... 52
Figure 22 - Hourly average of relative humidity in area 1 during dry season ............. 52
Figure 23 - Hourly average of relative humidity in area 2 during the rainy season .... 53
Figure 24 - Hourly average of relative humidity in area 2 during the dry season……53
Figure 25 - Hourly average of relative humidity in area 3 during the rainy season…53
Figure 26 - Hourly average of relative humidity in area 3 during the dry season ....... 54
Figure 27 - Hourly average of wind speed in area 1 .................................................. 55
Figure 28 - Hourly average of wind speed in area 2 .................................................. 55

16
Figure 29 - Hourly average of wind speed in area 3 ................................................. 55
Figure 30 - Thermal images in the dry season: Area 1. (a) 9:00 AM; (b) 12:00 PM.
Date: 17/07/2013. Direction: Southeast. ................................................ 56
Figure 31 - Average of asphalt’s surface temperature in area 1 during dry season. . 56
Figure 32 - Average of asphalt’s surface temperature in area 2 during dry season. . 58
Figure 33 - Thermal images in the dry season: Area 2. (a), (c) and (e) beneath
canopies at 9:00 AM, 12:00 PM, and 03:00 PM, respectively (Direction:
Southeast). (b), (d) and (f) outside canopies at 9:00 AM, 12:00 PM, and
03:00 PM (Direction: Northwest), respectively. Date: 18/07/2013. ...... 57
Figure 34 - Average of asphalt’s surface temperature in area 3 during dry season. . 59
Figure 35 - Thermal images in the dry season: Area 3. (a) and (c) outside canopies at
9:00 AM and 12:00 PM, respectively. (b) and (d) beneath canopies at
9:00 AM and 12:00 PM, respectively. Directions: Southeast. Date:
19/07/2013. ............................................................................................ 58
Figure 36 - Average of asphalt’s surface temperature in area 1 during rainy season.
............................................................................................................... 60
Figure 37 - Thermal images in the rainy season: Area 1. (a) and (c) beneath canopies
at 12:00 PM, and 03:00 PM, respectively. Directions: Southeast. (b) and
(d) outside canopies at 12:00 PM, and 03:00 PM, respectively.
Directions: Northwest. Date: 01/04/2013. .............................................. 59
Figure 38 - Average of asphalt’s surface temperature in area 2 during rainy season.
............................................................................................................... 61
Figure 39 - Thermal images in the rainy season: Area 2. (a) and (c) beneath canopies
at 09:00 PM, and 03:00 PM, respectively. Direction: Northwest. (b) and
(d) outside canopies at 09:00 PM, and 03:00 PM, respectively. Direction:
Southeast. Date: 25/03/2013. ................................................................ 60
Figure 40 - Thermal images in the rainy season: Area 3. (a), (c) and (e) beneath
canopies at 09:00 PM, 12:00 PM and 03:00 PM, respectively. (b), (d)
and (f) outside canopies at 09:00 PM, 12:00 PM and 03:00 PM,
respectively. Directions: Southeast. Date: 26/03/2013. ........................ 62
Figure 41 - Average of asphalt’s surface temperature in area 3 during rainy season.
............................................................................................................... 63
Figure 42 - Comparision of air temperature measured and predicted by Envi-met in
area 1. ................................................................................................... 63
17
Figure 43 - Comparison of air temperature measured and predicted by Envi-met in
area 2. ................................................................................................... 64
Figure 44 - Comparison of air temperature measured and predicted by Envi-met in
area 3. ................................................................................................... 64
Figure 45 - Distribution of gender among respondents ............................................. 65
Figure 46 - Classes of age of respondents ................................................................ 66
Figure 47 - Classes of height of respondents (in meters) .......................................... 66
Figure 48 - Classes of weight of respondents in kilograms ....................................... 67
Figure 49 - Thermal sensation reported by pedestrians ............................................ 67
Figure 50 - Preference related to the current thermal sensation. .............................. 68
Figure 51 - Grades based on their preferences. ........................................................ 68
Figure 52 - Correlation Survey x UTCI ...................................................................... 69
Figure 53 - Satisfaction with the urban trees in the city of Piracicaba ....................... 70
Figure 54 - The best size of tree ................................................................................ 70

18

19
LIST OF TABLES Table 1 - Input configuration data applied in the ENVI-met simulations .................... 40
Table 2 – Results of statistical analysis ..................................................................... 45
Table 3 - Percentage of people with tree in their properties ...................................... 71

20

21
1 INTRODUCTION
Due to rural exodus that occurred largely between sixties and eighties, over
80% of the Brazilian population lives in urban areas (IBGE, 2010). People migrated
from rural areas to cities looking for a better quality of life, however in many cases
this long awaited quality has not been found.
In developing countries like Brazil, the urbanization process happens at a fast
pace and an inefficient urban planning worsens the consequences of the high rate of
population growth. The high density of buildings and impervious areas, intensive use
of motor vehicles, lack of suitable land use criteria, and neglect of urban trees have
led to the increase in urban temperatures, causing thermal discomfort of the
population living there (PAULA, 2004; BUENO, 1998; SETTLER, 1992).
Many studies have evaluated the contribution of urban vegetation to mitigate
problems related to thermal comfort, and it is known that besides reducing the
variation of air temperature at a microclimate level, it also increases the relative
humidity of the air and slows wind speed (GEORGI; ZAFIRIADIS, 2006).
Therefore, planting of trees in urban areas is recommended in environmental
projects with the objective of minimizing energy consumption, easing conditions of
urban climate and helping maintain thermal comfort for human beings (GEORGI;
ZAFIRIADIS, 2006; LIMA; NUNES; SOARES, 2009). According Schuch (2006),
street trees are essential in the composition of urban green and play an important
role in cities’ environmental quality, influencing positively the microclimatic conditions.
As thermal comfort is directly influenced by the characteristics of the
immediate surroundings, each tree species’ features, such as its size, age, how it is
affected by seasonal changes and its location in urban space can also influence the
urban microclimate (ABREU; LABAKI, 2010). In their study, Spangenberg et al.
(2008) found that leaf area index and density of leaf area of the canopy of a tree has
a significant influence on the level of thermal comfort in regions of hot and humid
weather. This may be evident especially during the hottest times of the day, where
shadowing effect reduces incidence of solar radiation. In the same study, it was
shown that the layout of each individual tree may also influence the sensation of
thermal comfort, as isolated trees have less impact on the decrease of air
temperature compared to alignments.
22
Vegetation has become an indispensable element in an urban environment,
and therefore, the impact of trees must be studied and better understood
(SPANGENBERG et al., 2008).
Hence, the aim of this research was to study the effects of using different tree
species in the streets of Piracicaba for thermal comfort of the population, based on
the following question:
- How does the choice of tree species affect human thermal comfort in
streets in Piracicaba?
1.1 Background
It is proven that urban forestry has a positive influence on local environmental
conditions, which is an important factor for quality of life. Therefore, knowing the
consequences of the choice of species and management used for street trees in
Piracicaba will bring a better understanding of the actual effect of these variables to
microclimate, and thus for the environmental comfort of the local population and may
encourage better management of urban trees.

23
2 OBJECTIVES
This project aims to study the effects of using three different street tree
species planted in Piracicaba to urban microclimate and consequently human
thermal comfort. Meteorological variables, such as wind speed, air temperature and
relative humidity, were measured to help understand how it is influenced by the
choice of species. Thermal images of the measuring points and questionnaires aimed
at the local people were used to help interpret different arrangements

24

25
3 LITERATURE REVIEW
3.1 Climate
Firstly, it is important to explain the difference between “weather” and
“climate”. We can consider weather as the state of atmosphere at a given time and
point in space, whereas, climate is the “mean” state of an atmosphere-hydrosphere-
land surface system over given time and space scales.
In climate studies it is important to identify the scale that will be analyzed.
According to Oke (2006), three horizontal scales can be defined:
Microscale: It extends from less than one meter to hundreds of meters,
where surface temperature and air temperature can be influenced in very short
distances by the dimensions of individual buildings, trees, roads, streets, courtyards,
gardens, etc.
Local scale: It can extend from one to several kilometers. It excludes
microscale effects, and includes landscape features such as topography. On this
scale, it can relate the climate of neighborhoods with similar types of urban design
(surface cover, size and spacing of buildings, activity).
Mesoscale: a city influences weather and climate at the scale of the whole
city, typically tens of kilometres in extent. A single station is not able to represent this
scale.
Oke (2006) also found that the air currents arriving from the rural areas to the
city find a different and stratified atmosphere with its own characteristics. Thus, he
proposed to divide the urban atmosphere in two layers, which is widely accepted as
vertical scales:
Urban canopy layer (UCL): represents the air layer below the level of the
roofs. It is produced by microscale processes at street level, between buildings, etc.
The active nature of this surface produces considerable complexity of factors acting
on the atmosphere.
Urban boundary layer (UBL): it extends above the level of the roofs. It is
more representative of the entire city, with features produced by the nature of the
urban surface, whose roughness provided by the presence of relatively tall buildings,
causes a particular aerodynamics. The wind speed is reduced, but there is an
increased turbulence and drag produced by air friction.

26
Figure 1 - The urban atmosphere showing the urban boundary layer and urban canopy layer Source: Oke (1981)
3.1.1 Urban climate
The cities and their populations play a fundamental role in the dynamics of
global climate change. The large and continuously growing fraction of the world
population living in cities uses a disproportionate share of available resources and
produces the great part of air pollutants that alter the climate (GRIMMOND et al.,
2010) .
All natural climatic variables are influenced by the diverse composition of
cities. In general, the temperature of the urban environment tends to be 1 to 3
degrees Celsius higher than in the surrounding areas degrees. The degree of warmth
varies according to the type of structure and the nature of materials used in urban
areas. Materials such as asphalt, brick and concrete provide a high thermal capacity
compared to natural elements. A large amount of energy is stored during the day and
released at night when conditions are more stable (ENVIRONMENTAL
PROTECTION AGENCY - EPA, 2008; LOMBARDO, 1985).
According to Assis (2005), descriptive studies of urban climate have shown, in
both tropical areas as in temperate ones, that climate changes are associated with
effects of energy transformation in urban areas due to their morphology, thermal
properties of superficial materials and anthropogenic heat production. This leads to a
reduction of evaporative and convective cooling, because of soil impermeability,
decrease of vegetation cover, and reduction of wind speed due to increase of
superficial roughness.

27
3.1.2 Urban Forestry and climate
The expression “urban forest” was used for the first time in 1965, in North
America, to emphasize the concept of including an integrative perspective, due to the
participation of professionals with different backgrounds, such as foresters,
landscape architects, agronomists (KONIJNENDIJK, 2003).
Today, the most accepted and commonly used term “urban forestry” was
defined by Miller (1997) as: "‘the art, science and technology of managing trees and
forest resources in and around urban community ecosystems for the physiological,
sociological, economic and aesthetic benefits trees provide society".
According to Oke (1989) urban trees can be present in a large variety of
habitats, from a single tree competing in the urban environment to extensive remnant
or planted forest stands. The urban climate mosaic can be influenced in a micro to
local scale by every kind of composition. These influences have a direct relation to
the “radiative, aerodynamic, thermal, and moisture properties of trees that so clearly
set them apart from other urban materials and surfaces in terms of their exchanges of
heat, mass and momentum with the atmosphere”. These characteristics result in
capacity to promote “shade, coolness, shelter, moisture, and air filtration”, which
makes them flexible tools for environmental design.
Heat gain by the tree is particularly large because of three processes.
First, the tree may receive large amounts of reflected short-wave
radiation from the canyon walls and floor. Albedo values of urban
material are larger than many anticipate (brick 0.20-0.40, stone 020-
0.35, concrete 0.10-0.35, asphalt 0.05-0.20 (Oke, 1987)). Second, the
long-wave radiant energy input is greatly boosted. This is because of
the screening out of part of the cold sky and its replacement by the
considerably warmer surfaces of the buildings, plus the fact that all
built surfaces are very much hotter than the tree. This more than
compensates for the slightly lower emissivity of built materials. Third,
although not always the case, it is possible for the air temperature in
a street canyon to exceed the leaf temperature of the tree, subjecting
it to the advection of sensible heat. This is micro-oasis-type advection
and is likely to be most prevalent when the tree is well watered and
able to keep leaf temperature moderate via transpiration (OKE,
1989).

28
Figure 2 - Scheme of the daytime energy exchanges between an isolated tree and its street canyon
environment (Tl: Leaf temperature and Ta: Air temperature) Source: Oke (1989)
Also according to Oke (1989), the benefits provided by the trees at the
microscale are important for the comfort and safety of pedestrians, dispersion of air
pollution and energy conservation. However, the site and species selection may
cause problems, if it is not done properly.
Therefore, Oke (1989) also emphasized the importance of carefully
considering each application. For tropical climates, large trees with open canopies
above the trunk provide conditions of comfort, while trees with a denser canopy and
lower branches can protect against blowing sand. We can reduce heat loss by cold
winds planting shrub clusters around a building, but to protect against strong winds
larger trees are needed. Nevertheless, a solution can cause other problems, such as
planting an avenue to bring in shade may cause a worsening in the quality of the air
circulation is hindered by trees. For this reason, the selection of trees to urban
purposes should be very carefully planned.
3.2 Selection of trees
Trees in the urban environment are exposed to a number of stresses which
are very different from those suffered by trees in typical rural conditions. Therefore, a
successful urban forestry depends on the plants functioning as planned, even under
stressful environments. Thereby, the first important step to success is the selection
and use of appropriate tree species and genotypes, because it improves quality and

29
decreases costs in the establishment and management of urban green areas
(SÆBØ; BENEDIKZ; RANDRUP, 2003).
Thus, planning is indispensable to ensure the establishment of an urban forest
and street trees. The technical manual of urban forestry, realized by the city of São
Paulo (2005), considers that an urban forestry project should respect cultural,
environmental and historical aspects of the city. Moreover, planning must consider
the urban forest potential to provide comfort for houses, "shading", shelter and food
to fauna, biodiversity, decrease pollution, soil permeability conditions and landscape,
which all contribute to improve urban conditions.
The selection of tree species is the first step in urban forestry planning, and
consequently, some recommendations should be followed. The key features to
consider by the City of São Paulo (2005) are: development, size, canopy (shape,
density and habit), flowering, fruiting, roots, resistance to pests, diseases and
pollution, no toxic principles, adaptability, survival and development at the planting
site (due to soil characteristics, for example), as well as maintenance requirement.
Furthermore, the restrictions of use should be evaluated by the three-dimensional
physical space available at the planting site. It is also important to know about
regional vegetation, within and around the city, looking for select species that are
recommended for urban forestry and show satisfactory growth and vigor in the area.
According to the manual produced by Comitê de Trabalho Interinstitucional
para Análise dos Planos Municipais de Arborização Urbana no Estado do Paraná
(Interagency Working Committee for Analysis of Municipal Plans for Urban Forestry
in the State of Paraná) (2012), a series of recommendations concerning the
composition of species should be used for urban planting:
a) A single species for each street must be chosen for the composition, or one
to each side of the street or a certain number of blocks, according to its extension.
Thus, the monitoring of its development and maintenance of these trees will be
facilitated, like pruning when necessary, to maximize the aesthetic benefits.
b) A single species should not exceed the limit of 10 to 15% of the total
amount of existing trees in the same neighborhood or region. In general, it is
recommended that a minimum number between 10 and 20 species is used in an
urban forestry plan.
c) The species’ composition should seek the balance between native and
exotic species. Preference should be given to seedlings of native species occurring in
30
the bioclimatic region where the municipality is located, as they are adapted to the
local ecosystem, thereby promoting their conservation, as well as the recovery and
reintroduction of native fauna.
d) For native species with potential use in streets planting, but for which there
is no information of its behavior in the urban environment, it is suggested
experimental plantings (a block or part of a street) for monitoring these species to
future widespread use.
e) Depending on the location to be wooded (cities with cold climates) , the
choice of deciduous species (lose their leaves in a season) is extremely important for
the utilization of solar heat on cold days, while in other cities with warm weather,
evergreen species are more appropriate.
f) The shape and size of the canopy must be compatible with the three-
dimensional physical space available, allowing free transit of vehicles and
pedestrians, avoiding damage to facades and conflict with lighting and signposts.
g) In sidewalks, planting should be restricted to species with pivoting roots
system, roots must have a deep habit to prevent the destruction and removal of
sidewalks, asphalt, walls of deep foundations. It is noteworthy that in urban areas,
even trees with pivoting roots, may have shallow roots due to soil conditions or area
free of insufficient growth.
h) Prefer species that do not have very large flowers or fruits.
i) Select species that are rustic and resistant to pests and diseases species,
since the use of fungicides and insecticides in urban areas is not allowed.
j) Species with resistant ramification must be selected to prevent the fall of
branches.
3.3 Thermal comfort and index
The American Society of Heating, Refrigerating and Air-conditioning
Engineers (ASHRAE) Standard 55-2013 (2013), defined thermal comfort for a person
as 'that condition of mind which expresses satisfaction with the thermal environment'.
Thermal comfort is closely related to the thermal balance of human body.
The human being is a homoeothermic animal that maintains, within certain limits, the
body core temperature relatively constant independent of ambient temperature
(RUAS, 1999). Therefore, it is required to maintain the heat balance between body
31
and environment, when the heat lost to the environment is equal to the heat
produced by the body. Humans possess the most effective physiological
mechanisms for keeping a heat balance: “the sensible heat loss can be altered by a
variation of the cutaneous blood flow and thus of the skin temperature, latent heat
loss can be increased by sweat secretion, and internal heat production can be
increased by shivering or muscle tension” (FANGER, 1973).
Also according to Fanger (1973), the comfort conditions are expressed in
controllable factors, namely the following four main physical parameters which
constitute the thermal environment: air temperature; mean radiant temperature; wind
speed and vapor pressure in ambient air. Besides the environmental factors, human
comfort is also influenced by the activity level (internal heat production in the body)
and thermal resistance of clothing.
The assessment of the thermal environment is one of the main issues in
bioclimatic research, and more than 100 simple bioclimatic indices have thus far
been developed to facilitate it. (BŁAŻEJCZYK et al., 2013)
One of these indices is the Universal Thermal Comfort Index (UTCI). The aim
of the UTCI has been to make available a method to measure the outdoor thermal
environment combining the interaction of air temperature, wind speed, humidity and
radiation fluxes on the human thermo-physiological state in terms of equivalent
temperature (BRÖDE; KRÜGER; FIALA, 2013). The reference environmental
features are 50% relative humidity (RH), with a vapor pressure not exceeding 2 kPa
(kilopascals); air temperature (Ta) equal to the mean radiant temperature (Trm) and;
speed wind of 0.5 m/s, measured at 10m high (BRÖDE et al., 2010).
Figure 3 - Elements of the operational procedure and concept of UTCI Source: Bröde (2013)

32
3.4 Thermal images
According to Voogt and Oke (1997), surface temperature data are important in
studies of urban atmospheric conditions. It directly influences the air temperature in
the lower layers of the urban environment. It is also an important factor in energy
balance of the surfaces, and helps determine the climate indoors. Finally, it promotes
exchanges of energy that affect the comfort of the urban population (VOOGT; OKE,
2003).
However, it is a difficult measurement since urban structures present a
complex interaction with atmosphere. Furthermore, there is a great variation in
microscale due to changes in incoming radiant load depending on steepness,
shading and properties of each material. Directional variation of thermal emittance
may cause another problem in the interpretation of aerial or satellite thermal images.
This effect is called effective anisotropy (VOOGT; OKE, 1997).
Thermal images that provide information on surface temperature can be taken
from three different levels. Satellite images can cover an extensive area. However,
resolution may be limited, as well as the temporal coverage. The images are
impacted by weather and atmosphere conditions. On the other hand, airborne
images have a high resolution and can show more details of urban features.
However, it is more expensive and the coverage is irregular. Ground-based
measurements are another method used when we want to provide a unique
perspective of some urban features. It provides a higher temporal resolution and it
can avoid corrections due to atmospheric influence (VOOGT, 2003).
In the case of plants, many aspects can influence the surface temperature of
leaves. It may be anatomical characteristics, like leaf mass, size, shape, angle,
reflectance properties; physical aspects, as incoming radiative energy, air
temperature, wind; and biological phenomena, like transpiration, which is regulated
by stomatal conductance (MONTEITH; UNSWORTH, 2013). According to Leuzinger,
Vogt and Körner (2010) all these variations can occur in an interval of weeks as well
as in seconds. The foliage temperature has important consequences for the plant
itself, but also for the environment surrounding the plant. It is particularly important for
the local to global climate, because the foliage temperature has a significant
connection with atmospheric conditions.

33
Meier and Scherer (2012) found in their results that “canopy temperature of
urban trees depends on species-specific properties and the location of the tree”. In
their study it was observed that mature trees stay relatively cool in contrast to
impervious surfaces, even in a hot and dry situation. For this reason, the knowledge
of species-specific canopy temperature and the impacts of urban structures on the
energy and water balance of trees is essential to optimise urban climates. However,
any recommendation for urban planning objectives should be based on climatological
impacts that are desired or that are to be avoided.. The full range of climatological
effects should be take into account in an evaluation and optimisation of benefits from
urban trees. These include the alteration of “surface temperature underneath trees,
air quality, human thermal comfort, the ventilation of street canyons and the energy
consumption of buildings” (MEIER; SCHERER, 2012).
3.5 ENVI-met
According Bruse and Fleer (1998), ENVI-met is a three-dimensional
microclimate model designed to simulate interactions between urban surfaces,
vegetation and atmosphere. It allows analysis of the effects of small scale changes in
urban design. For example, it can be applied in urban climatology, architecture,
building design or environmental planning.
ENVI-met is a freeware program based on different scientific research
projects and is therefore under constant development. The model is based on the
fundamental laws of fluid dynamics and thermo- dynamics (Bruse, 2004). It includes
the simulation of:
Flow around and between buildings
Exchange processes of heat and vapour at the ground surface and at
walls
Turbulence
Exchange at vegetation and vegetation parameters
Bioclimatology
Pollutant dispersion
According to Assis et al (2013), firstly, the model must be calibrated to local
conditions considering that it is a three-dimensional model in its main module, with a

34
one-dimensional "environment" composed, in the horizontal plane, by the area of
nesting and a vertical profile of mesoscale, which goes to the altitude of 2500m
above sea level. The model does not assimilate data, there is just a single input
information which describe the initial conditions in their various layers: soil (three sub-
layers to a depth of 1.75 m), surface (including profiles paving, building and
vegetation) and atmosphere;
Initialization’ model assumes neutral atmosphere conditions (in terms of
static stability), where the potential temperature can be considered constant over
the height of the mixing air layer (STULL, 1988 Apud ASSIS et al, 2013).
Therefore, it is recommended to start the simulation in the evening, after sunset or
before sunrise.
The typical spatial resolution goes from 0.5m to 10m, and temporal
resolution is 10 seconds. Thus, the appropriate urban scale application of the
model is the design or urban design, in other words, fractions of districts or
neighborhoods (ASSIS et al, 2013).

35
4 MATERIALS AND METHODS
4.1 Area of study
Piracicaba is a city sited in southeastern of Brazil at an altitude of 546 m and
located approximately 160 km from São Paulo city, the capital of the State (Figure 4).
It has 364,571 inhabitants, mostly living in the urban area (INSTITUTO BRASILEIRO
DE GEOGRAFIA E ESTATÍSTICA - IBGE, 2010).
Figure 4 - Location of Piracicaba. Source: http://noticias.uol.com.br
According to Souza (2004), the region of Piracicaba is placed at a critical point
of transition from currents of general circulation, which causes two distinct periods:
one hotter and rainy, and another less hot and drier. Although having this
particularity, Piracicaba can be classified according to Koeppen-Geiger’s Climate
Classification System as “Cwa”, which corresponds to a humid sub-tropical climate
with dry winters and hot summers, with average temperatures of 24.7°C in the hotter
months and 17.7°C in the coldest one. The average precipitation is 1253 mm/year,
and it has a monthly average insolation of 201.5 hours.
The field measurements were carried out at 3 different sites, where there is a
prevalence of at least 50m continuous of a single tree species planted on the street.
In each site, two points of measurement was select: one under the canopy (point A)
and another outside (point B).

36
The selected streets have the same orientation (NW-SE) but different
configurations. The first one is located in a high density residential area, with a
height/width equal to 0.85, while the second and third ones are in less dense
suburban residential areas and their ratios (h/w) are 0.5 and 0.75, respectively. This
ratio height/width is an important urban design element that helps create the
experience of being in a city and in a place that is comfortable for pedestrians.
The site 1 is located at Caetano Romano Lane, between the geographical
coordinates of 22.73° S (latitude) and 47.64° W (longitude), and 544m of altitude.
The width of the street is 5m and the distance between measurement points is
approximately 25 m (Figure 5).
Figure 5 - a) Street view of area 1; b) Satellite view
The site 2 is located at Armando Cesare Dedini Street, between the
geographical coordinates 22.72° S (lat) and 47.66° N (long), and 508m of altitude.
The width of the street is 8m and the distance between measurement points is
approximately 50m (Figure 6).
Figure 6 - a) Street view of area 2; b) Satellite view
NN
aa)) bb))
NN
aa)) bb))

37
Finally, the third site is located at Beija-flores Street, between the
geographical coordinates 22.71° S and 47.67° W, and 477m of altitude. The width of
the street is 6m and the distance between measurement points is approximately 75m
(Figure 7).
a) b)
Figure 7 - a) Street view of area 3; b) Satellite view
4.2 Climate measurements
The weather stations consist of a register of air temperature and relative
humidity (Therma Data, Figure 8) that was properly sheltered from direct radiation.
On the outside, a thermo-anemometer (Testo Hot Bulb, Figure 8) and a globe
thermometer (Testo 175 T2, Figure 8) were mounted (Conformity and Accuracy tests
in Annexe A and B). The equipment was set to record and store data every 15
minutes over a three day period between 9:00 AM and 4:00 PM, during rainy
(March/April) and dry (July) seasons. These are seasons when the population suffers
more discomfort.

38
Figure 8 - Weather station
Thermal images were taken from a ground-based view aiming to analyze the
surfaces temperatures. An infrared camera, model Flir SC660, was used to capture
the pictures, which were taken at three different hours, 09:00 AM, 12:00 PM and
03:00 PM. The images were processed in FLIR Quick Report software, version 1.2.
Asphalt’s surface temperature was used as a parameter to contrast areas outside
and beneath trees canopies.
Globe termometer
Thermal anemometer
Thermo
hygrometer

39
4.2.1 Statistics Statistical analyzes were performed using SAS program. To match the data
processing was required. Thus, the results were raised to the power of 1.5.
Subsequently, we applied the f test to verify if the variances were homogeneous, and
finally, the Tukey-Kramer method as a significance test at 5% of probability. This is a
single-step multiple comparison procedure and statistical test. It is used in
conjunction with an ANOVA to find means that are significantly different from each
other.
4.3 UTCI Index
The software BioKlima (version 2.6) was used to calculate the UTCI index. It
employed the weather station’s data, such as air temperature, relative humidity, and
wind speed.
For the analyses, the calculated values for UTCI were compared in the same
level of the Predicted Mean Vote (PMV) proposed by (Fanger, 1973). The extremes
levels for cold (Extremely cold; Very cold; and Cold) were considered Very cold, as
well as high levels of warmth (Extremely hot; and Very hot) were considered Very
hot. The values were not calibrated for Piracicaba condition.
Figure 9 - Comparison between comfort indexes
<-40 Extremely cold
-40 a -27 Very cold
-27 a -13 Cold
-13 a 0 Cool
0 a 9 Slightly Cool
9 a 26 Comfortable
26 a 32 Warm
32 a 38 Hot
30 a 46 Very hot
>46 Extremely hot
UTCI
-3 Very cold
-2 Cold
-1 Slightly cold
0 Comfortable
1 Slightly hot
2 Hot
3 Very hot
Fanger

40
4.4 ENVI-met
Because of logistical problems and safety, the instruments were not exposed
during the night and for a very long period of days. For this reason, the model ENVI-
met was used in order to simulate some data.
The input data for the simulations in each area are shown in Table 1. The for
specific humidity at 2500m was obtained from local airport soundings at Campo de
Marte, available from the homepage of University of Wyoming (UWYO, 2013). A
scenario was made for each area, including trees, streets and buildings. Input area
files are shown in Appendix A, B and C.
Table 1 - Input configuration data applied in the ENVI-met simulations for every area.
Format/ Unit Area 1 Area 2 Area 3
Start Simulation at Day DD.MM.YYYY 01.04.2013 12.03.2013 15.03.2013
Start Simulation at Time HH:MM:SS 6:00:00 6:00:00 6:00:00
Total Simulation Time hours 48 48 48
Save Model State each min 30 min 30 min 30 min
Wind Speed in 10 m ab. Ground [m/s] 1.3 1.3 1.3
Wind Direction (0:N..90:E..180:S..270:W) 73 58 58
Roughness Length z0 at Reference Point [m] 0.1 0.1 0.1
Initial Temperature Atmosphere [K] 293 295 295
Specific Humidity in 2500 m [g Water/kg air] 3* 3* 3*
Relative Humidity in 2m [%] 75 100 100
*Source: http://weather.uwyo.edu/upperair/sounding.html
4.5 Species characterizations
Species were chosen based on their size, similar ages, and the frequency
with which they are employed at streets on Piracicaba that was verified from data
gathered by the Department of Forest Science at ESALQ.
The three chosen species were: Handroanthus pentaphyllus (Ipê-de-El-
Salvador); Tipuana tipu (Tipuana); and Poincianella pluviosa var. peltophoroides
(Sibipiruna). These species descriptions were available in Lorenzi (2002).
4.5.1 Poincianella pluviosa var. peltophoroides (Sibipiruna)
This species is a native of the Brazilian Atlantic Forest, which at maturity can
have a height ranging from 8 to 25 m, and a Diameter at Breast Height (DBH)

41
ranging from 30 to 40 cm. It has bipinnate leaves with 20 to 25 cm of length (Figure
10).
It flowers from the end of August until mid-November. The inflorescence is
conic and the yellow flowers open gradually from the base to apex. Their fruits ripen
from late July until mid-September.
It is one of the most employed trees in urban forestry in South-central Brazil,
and despite the large and fast development, it does not produce aggressive roots
and it should be a good option for urban forestry, in the ornamentation of public
roads, squares and even on sidewalks. By having a medium to fast growth, it is also
recommended for mixed plantations in degraded land
Figure 10 – (a) Sibipiruna tree on the street; and (b) Flower’ details.
4.5.2 Tipuana tipu (Tipuana)
This species is originally from Bolivia and northern Argentina; it is a semi-
deciduous to deciduous tree that can reach 15m in height. It presents vigorous
ascending dense branches, forming a rounded leafy canopy (Figure 11).
It has odds pinnate leaves with 8-10 leaflets and one at the tip, and small
axillary inflorescences, yellow colored, that appear between September and
December.
It is frequently employed in parks and used as an urban street tree in the
south and southeast of the country. It has a remarkable ornamental effect during
flowering. This tree provides great shade and can be included in the landscape
composition of large gardens and planting in large avenues. It has a fast growth and
good tolerance to adverse conditions.
a) b)

42
Figure 11 – (a) Tipuana tree on the street; and (b) Flower’ details.
4.5.3 Handroanthus pentaphyllus (Ipê-de-El-Salvador)
This species is originally from Central America; trees can reach 35m in height
and a trunk diameter of 150 cm, and the canopy often reaches 30m in diameter. They
present pinkish flowers between the end of winter and beginning of spring
(September-October). Their canopies have a high leaf density, with semi-deciduous
to deciduous foliage (Figure 12).
Largely employed in Brazilian urban forestry, they should preferably be
planted in large squares and parks because of their large size.
Figure 12 – (a) Ipê tree on the street; and (b) Flower’ details.
4.6 Surveys
The pedestrians’ perception of thermal comfort was assessed by a
questionnaire, which was applied at the same time as quantitative measurements
a) b)
a)
b) a)

43
were gathered, trying to find a relationship between the values obtained in the data
analyses and responses in the survey.
Data for characterization of the interviewed population, such as gender, age,
weight, height, type of clothing and performed activity were collected, as well as data
for validation of comfort indices, such as the thermal sensation at the time of the
interview and thermal preference, and these questions were based on the Predicted
Mean Vote (PMV) suggested in Fanger (1994).
Moreover, some additional questions about pedestrians’ perception of urban
trees were asked. They were divided in dichotomous questions (yes or no), multiple
choice, and open-ended questions. (Appendix D)

44
45
5 RESULTS
5.1 Microclimate data
As expected, there are differences in microclimatic conditions between
streets with and without trees. If we observe all three areas, generally, we can note
that temperature and wind speed values were lower for streets with trees, and the
relative humidity had higher values for these locations.
5.1.1 Air temperature
Air temperature is the easiest weather parameter to relate with human
comfort. It is directly influenced by radiation and consequently, by the kind of surface
in surrounding areas.
In table 2, it is shown the results of mean and standard deviation for each
area in different seasons (dry/rainy) and conditions (sun/shadow).
Table 2 – Results of statistical analysis
Area
Species Season Condition N Mean Std Dev
1 Sibipiruna Rainy shadow 87 27.7 11.4
1 Sibipiruna Rainy sun 87 28.9 16.1
1 Sibipiruna dry shadow 87 21.7 20.1
1 Sibipiruna dry sun 87 24 25.8
2 Tipuana Rainy shadow 86 27 20.8
2 Tipuana Rainy sun 86 29.2 26.7
2 Tipuana dry shadow 87 23.9 25.4
2 Tipuana dry sun 87 25.4 27.5
3 Ipê Rainy shadow 87 27.6 16.4
3 Ipê Rainy sun 87 29.7 18.5
3 Ipê dry shadow 77 21.1 22.9
3 Ipê dry sun 77 22.4 25.8
In Area 1, we can observe the difference between air temperature in street
without trees and with Sibipiruna, both in the dry and rainy periods (Figures 13 and
14). The average air temperature was 21.7°C at point A (shade), while at point B
(sun) it was 24.0°C during the dry season, with a significant difference of 3.3°C, in a
level of 5% of significance (p value < 0.0001). For the rainy period, the average air
46
temperature at point A was 27.7°C, and 28.9°C at point B, presenting a significant
difference of 1.2 °C (p value < 0.0001).
15.0
17.0
19.0
21.0
23.0
25.0
27.0
29.0
31.0
33.0
09
:00
:00
09
:15
:00
09
:30
:00
09
:45
:00
10
:00
:00
10
:15
:00
10
:30
:00
10
:45
:00
11
:00
:00
11
:15
:00
11
:30
:00
11
:45
:00
12
:00
:00
12
:15
:00
12
:30
:00
12
:45
:00
13
:00
:00
13
:15
:00
13
:30
:00
13
:45
:00
14
:00
:00
14
:15
:00
14
:30
:00
14
:45
:00
15
:00
:00
15
:15
:00
15
:30
:00
15
:45
:00
16
:00
:00
Air
te
mp
era
tue
(C
°)
A
B
Figure 13 - Hourly average of air temperature in area 1 during the dry season
15.0
17.0
19.0
21.0
23.0
25.0
27.0
29.0
31.0
33.0
09
:00
:00
09
:15
:00
09
:30
:00
09
:45
:00
10
:00
:00
10
:15
:00
10
:30
:00
10
:45
:00
11
:00
:00
11
:15
:00
11
:30
:00
11
:45
:00
12
:00
:00
12
:15
:00
12
:30
:00
12
:45
:00
13
:00
:00
13
:15
:00
13
:30
:00
13
:45
:00
14
:00
:00
14
:15
:00
14
:30
:00
14
:45
:00
15
:00
:00
15
:15
:00
15
:30
:00
15
:45
:00
16
:00
:00
Air
te
mp
era
ture
(C
°)
A
B
Figure 14 - Hourly average of air temperature in area 1 during the rainy season
During the dry season the temperature range reached 12.2°C in a period of 5
hours and 30 minutes (elapsed time between the recording of minimum and
maximum temperature) in the street without trees, while in the street with trees the
difference between the maximum and the minimum temperature was 8.7 °C, which
happened after 6 hours and 30 min. In the rainy season, the temperature range
47
reached 6.6°C in the street without tree, and 4.5°C in the path with trees, in a period
of 4h30min and 4h50min, respectively.
These data illustrate the effect of trees in urban environment, as they protect
from solar radiation, the temperature range in the shaded area is not so large and the
increase of air temperature is more gradual, in other words, it occurs over a longer
period of time.
In Area 2, we can also observe the difference between air temperature in
street without and with Tipuana trees, in both periods (Figure 15 and 16). The
average air temperature at point A was 23.9°C and it was 25.4°C at point B in the dry
season, with a significant difference of 1.5°C (p value< 0.0001). For rainy season, the
average temperature was 27.0°C at point A and 29.2°C at point B, with a difference
of 2.2°C (p value< 0.0001).
15.0
17.0
19.0
21.0
23.0
25.0
27.0
29.0
31.0
33.0
Air
te
mp
era
ture
(C
°)
A
B
Figure 15 - Hourly average of air temperature in area 2 during the dry season

48
15.0
17.0
19.0
21.0
23.0
25.0
27.0
29.0
31.0
33.0
Air
te
mp
era
ture
(C
°)
A
B
Figure 16 - Hourly average of air temperature in area 2 during the rainy season
During the dry season the temperature range reached 10.7°C in the street
without tree, while in the path with trees the difference between the maximum and the
minimum temperature was 10.3 °C. While in the rainy season, the temperature range
reached 6.9°C in the street without tree, and 6.0 °C in the path with trees.
Finally, in Area 3, the difference between air temperature in street without
trees and with Ipês is shown in Figure 17 and 18, in the dry and rainy periods
respectively. The average temperature 21.1°C at point A and 22.4°C at point B
during the dry season, with a difference of 1.3°C. In rainy season, the temperature
was 27.6°C at point A and 29.7 at point B, with a difference of 2.1°C between these
sites.

49
15.0
17.0
19.0
21.0
23.0
25.0
27.0
29.0
31.0
33.0A
ir t
em
pe
ratu
re (
C°)
A
B
Figure 17 - Hourly average of air temperature in area 3 during the dry season
15.0
17.0
19.0
21.0
23.0
25.0
27.0
29.0
31.0
33.0
Air
te
mp
era
ture
(C
°)
A
B
Figure 18 - Hourly average of air temperature in area 3 during the rainy season
During the dry season the temperature range reached 10.1°C in the street
without tree, while in the path with trees the difference between the maximum and the
minimum temperature was 8.7 °C. In the rainy season, the temperature range
reached 6.7°C in the street without tree, and 6.5 °C in the path with trees.
When each area is compared, it can be noticed the influence that trees has
on this variable (Figure 19). Observing the results for the dry period, the area planted

50
with Tipuana presented a higher average temperature equal to 23.7 °C, which could
be explained by the loss of some leafs during this period, because it is a semi
deciduous species. The Sibipiruna’s area showed 21.6°C and the street with Ipês
21.2°C, but the differences between averages temperatures were not significant for
any area.
For rainy season, a significant difference between average temperatures of
Tipuana’s area and the other areas was found. In area 1 (Sibipiruna) the temperature
reached 27.7°C. In area 2 (Tipuana), it was 26.8°C, and 27.5 in area 3 (Ipês).
Figure 19 – Distribution of air temperature within each area
Despite the statistical results show significant between certain points, areas
can not be compared to each other, since the data were collected on different days.
The figure 20 shows the behavior of the curves of the measurements taken by the
university meteorological station and the data collected in the experiment station. We
can notice the similarity in behavior which evidence that the behavior it was not
influenced by species, but by the day of collection.

51
14
16
18
20
22
24
26
28
30
32
Air
te
mp
era
ture
(°C
)
University station
Ta 1
Ta 2
Ta 3
14
16
18
20
22
24
26
28
30
32
Air
te
mp
era
ture
(°C
)
Ta 1
Ta 2
Ta 3
14
16
18
20
22
24
26
28
30
32
Experiment stations
Area 1
Area 2
Area 3
14
16
18
20
22
24
26
28
30
32
Area 1
Area 2
Area 3
Figure 20 - Air temperature in University station and experiment station in the same day.
5.1.2 Relative humidity
The relative humidity has an important influence on human thermal comfort. It
is also affected by the presence of plants, and generally, areas with trees present
higher values of relative humidity. The difference is showed in the following graphics.
For area 1 during the rainy period (Figure 21), the average of relative humidity
for the measurement point under the trees (A) was 67.9%, while for the point that
received direct radiation (B) the result was 63.8%. For dry season (Figure 22), the
values presented were 63.9% and 56.2%, for point A and B, respectively.

52
40.0
45.0
50.0
55.0
60.0
65.0
70.0
75.0
80.0
85.0
Re
lati
ve h
um
idit
y (%
)
A
B
Figure 21 - Hourly average of relative humidity in area 1 during rainy season
40.0
45.0
50.0
55.0
60.0
65.0
70.0
75.0
80.0
85.0
Rel
ativ
e H
um
idit
y (%
)
A
B
Figure 22 - Hourly average of relative humidity in area 1 during dry season
During the rainy period in area 2 (Figure 23), the average of relative humidity
for the measurement point under the trees (A) was 69.4%, while for the point that
received direct radiation (B) the result was 62.3 %. For dry season (Figure 24), the
values presented were 60.7% and 54.5%, for point A and B, respectively.

53
40.0
45.0
50.0
55.0
60.0
65.0
70.0
75.0
80.0
85.0R
elat
ive
hu
mid
ity
(%)
A
B
Figure 23 - Hourly average of relative humidity in area 2 during the rainy season
40.0
45.0
50.0
55.0
60.0
65.0
70.0
75.0
80.0
85.0
Rel
ativ
e h
um
idit
y (%
)
A
B
Figure 24 - Hourly average of relative humidity in area 2 during the dry season
Finally, during the rainy period in area 3 (Figure 25), the average of relative
humidity for the measurement point under the trees (A) was 69.7%, while for the
point that received direct radiation (B) the result was 63.6 %. For dry season (Figure
26), the presented values were 67.1% and 60.2%, for point A and B, respectively.
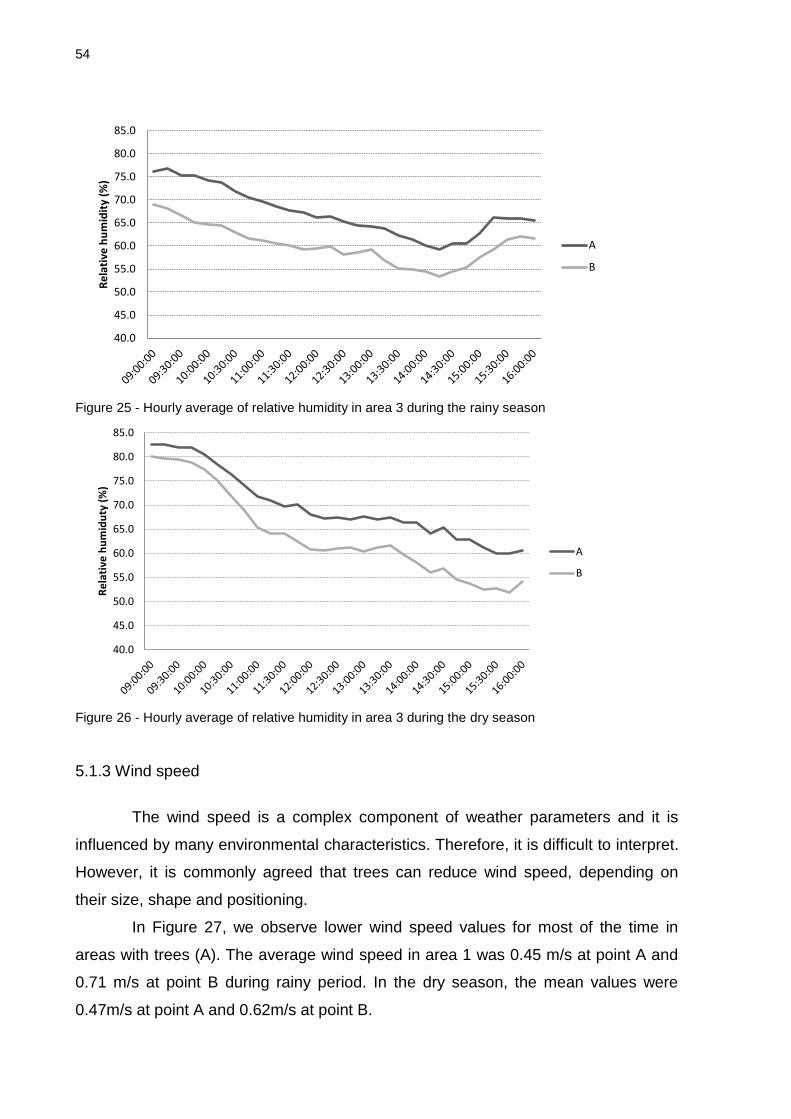
54
40.0
45.0
50.0
55.0
60.0
65.0
70.0
75.0
80.0
85.0
Re
lati
ve h
um
idit
y (%
)
A
B
Figure 25 - Hourly average of relative humidity in area 3 during the rainy season
40.0
45.0
50.0
55.0
60.0
65.0
70.0
75.0
80.0
85.0
Re
lati
ve h
um
idu
ty (
%)
A
B
Figure 26 - Hourly average of relative humidity in area 3 during the dry season
5.1.3 Wind speed
The wind speed is a complex component of weather parameters and it is
influenced by many environmental characteristics. Therefore, it is difficult to interpret.
However, it is commonly agreed that trees can reduce wind speed, depending on
their size, shape and positioning.
In Figure 27, we observe lower wind speed values for most of the time in
areas with trees (A). The average wind speed in area 1 was 0.45 m/s at point A and
0.71 m/s at point B during rainy period. In the dry season, the mean values were
0.47m/s at point A and 0.62m/s at point B.

55
0.0
0.2
0.4
0.6
0.8
1.0
1.2
1.4
1.6
1.8
Dry
0.0
0.2
0.4
0.6
0.8
1.0
1.2
1.4
1.6
1.8
win
d s
pe
ed
(m
/s)
Rainy
A
B
0.0
0.2
0.4
0.6
0.8
1.0
1.2
1.4
1.6
1.8
Dry
0.0
0.2
0.4
0.6
0.8
1.0
1.2
1.4
1.6
1.8
win
d s
pe
ed
(m
/s)
Rainy
A
B
0.0
0.2
0.4
0.6
0.8
1.0
1.2
1.4
1.6
1.8
Dry
0.0
0.2
0.4
0.6
0.8
1.0
1.2
1.4
1.6
1.8
win
d s
pe
ed
(m
/s)
Rainy
A
B
Figure 27 - Hourly average of wind speed in area 1
During the rainy period in area 2, the average wind speed was 0.45 m/s at
point A and 0.57m/s at point B. While in the dry season, it was 0.46 m/s at point A
and 0.65m/s at point B. These observations confirm the statement that trees have a
positive influence in relation to wind speed (Figure 28).
Figure 28 - Hourly average of wind speed in area 2
Nevertheless, the wind speed in the area 3 showed a difference of behavior
despite having the presence of trees (Figure 29), point A was located in an area with
lots of land not built, which favored the passage of air currents. Therefore, the
average values for wind speed were 0.85 m/s at point A and 0.64 at point B, during
the dry period; and for rainy season, 0.76m/s at point A and 0.67 at point B.
Figure 29 - Hourly average of wind speed in area 3

56
5.2 Surface temperature using thermal images
The surface temperature is an important factor that influences directly the
microclimate characteristics, and consequently human thermal comfort. The asphalt
surface temperature was analyzed for both periods at three different times.
The images processed in FLIR Quick Report software showed the difference
between the asphalt surface temperature outside and beneath trees canopies.
During the dry season, it can be noted that the highest difference between the
surface temperatures of asphalt occurs at 12:00PM, due to the high level of radiation
incident to that surface. The Figure 30 illustrates this effect, where we can see more
red and white in the image (b) than in the image (a). The mean difference in surface
temperature between measurements at point A (shadow) and point B (sun) was
15.2°C (Figure 31).
(a) (b)(a) (b)
Figure 30 - Thermal images in the dry season: Area 1. (a) 9:00 AM; (b) 12:00 PM. Date: 17/07/2013.
Direction: Southeast
Figure 31 - Average of asphalt’s surface temperature in area 1 during dry season

57
The same fact can be noted in data collected in area 2 during the dry season
and observed in Figure 32.
(a) (b)
(c) (d)
(e) (f)
(a) (b)
(c) (d)
(e) (f)
Figure 32 - Thermal images in the dry season: Area 2. (a), (c) and (e) beneath canopies at 9:00 AM, 12:00 PM, and 03:00 PM, respectively (Direction: Southeast). (b), (d) and (f) outside canopies at 9:00 AM, 12:00 PM, and 03:00 PM (Direction: Northwest), respectively. Date: 18/07/2013

58
The highest value for surface temperature was detected at 12:00PM (44.5°C),
and the average difference between point A and B was 10.8°C (Figure 33).
Figure 33 - Average of asphalt’s surface temperature in area 2 during dry season
The thermal images in area 3 show the differences between surface
temperatures at 09:00 AM and 12:00 PM in each measuring points (Figure 34).
(a) (b)
(c) (d)
(e) (f)
(a) (b)
(c) (d)
(e) (f)
Figure 34 - Thermal images in the dry season: Area 3. (a) and (c) outside canopies at 9:00 AM and 12:00 PM, respectively. (b) and (d) beneath canopies at 9:00 AM and 12:00 PM, respectively. Directions: Southeast. Date: 19/07/2013

59
In area 3, the highest temperature was also reached at 12:00PM, it was
39.7°C (Figure 35). At 2:00 PM, it started to rain and that was the explanation for the
low values of the surface asphalt temperature at this time
Figure 35 - Average of asphalt’s surface temperature in area 3 during dry season
When we observe the Figure 36, it can be noted that the highest difference
between the surface temperatures of asphalt occurs at 12:00PM, due to the high
level of radiation incident to that surface, where we can see the different color
between (b) and (d).
(a) (b)
(c) (d)
(a) (b)
(c) (d)
Figure 36 - Thermal images in the rainy season: Area 1. (a) and (c) beneath canopies at 12:00 PM, and 03:00 PM, respectively. Directions: Southeast. (b) and (d) outside canopies at 12:00 PM, and 03:00 PM, respectively. Directions: Northwest. Date: 01/04/2013

60
This effect is confirmed in Figure 37. The mean difference in surface
temperature between measurements at point A (shadow) and point B (sun) was
13.0°C.
Figure 37 - Average of asphalt’s surface temperature in area 1 during rainy season
The same fact can be observed in area 2 (Figure 38).
(a) (b)
(c) (d)
Figure 38 - Thermal images in the rainy season: Area 2. (a) and (c) beneath canopies at 09:00 PM, and 03:00 PM, respectively. Direction: Northwest. (b) and (d) outside canopies at 09:00 PM, and 03:00 PM, respectively. Direction: Southeast. Date: 25/03/2013
29.733.7 33.5
43.9
50.3
41.8
0
10
20
30
40
50
60
9:00 AM 12:00 PM 3:00 PM
A
B

61
The highest value for surface temperature was detected at 12:00PM
(51.4°C), and the average difference between point A and point B was 13.3°C
(Figure 39).
38.3
51.4 51.3
28.5
36.2 36.3
0
10
20
30
40
50
60
9:00 AM 12:00 PM 3:00 PM
Surf
ace
te
mp
era
ture
(°C
)
A
B
Figure 39 - Average of asphalt’s surface temperature in area 2 during rainy season
For area 3, the surface temperature varied differently as the presence of
empty lots increased the input radiation in the afternoon and caused a greater
heating of the asphalt at 3:00 PM (Figure 40), which reached 49.3°C at this time. The
average difference between point A and B was 11.4°C (Figure 41).

62
Figure 40 - Thermal images in the rainy season: Area 3. (a), (c) and (e) beneath canopies at 09:00 PM, 12:00 PM and 03:00 PM, respectively. (b), (d) and (f) outside canopies at 09:00 PM, 12:00 PM and 03:00 PM, respectively. Directions: Southeast. Date: 26/03/2013

63
34.4
4749.3
27
34.1 35.3
0
10
20
30
40
50
60
9:00 AM 12:00 PM 3:00 PM
Surf
ace
te
mp
era
ture
(°C
)A
B
Figure 41 - Average of asphalt’s surface temperature in area 3 during rainy season.
5.3 Envi-met results
When predicted data is compared with gathered data in area 1, we notice
similar behavior between temperature curves. However, the simulated temperature is
underestimated in relation to collected data (Figure 42).
Figure 42 - Comparison of air temperature measured and predicted by Envi-met in area 1

64
This correlation is weaker in area 2 and 3 (figures 43 and 44), because there
is a greater complexity in this scenario. Also, it can be noted a greater difference
between the data of point B (sun).
Figure 43 - Comparison of air temperature measured and predicted by Envi-met in area 2
Figure 44 - Comparison of air temperature measured and predicted by Envi-met in area 3

65
The Envi-met software presented interesting results, but they were not
suitable for a more complexe analysis at this moment. The next steps are improving
the correlation between measured and predicted data, and recalculate the
predictions for each scenario.
5.4 Survey analysis
The data collected by survey was used to characterize the people
interviewed and it helped in the analyses of thermal comfort.
5.4.1 General characterization
Three hundred people were interviewed, among them 166 women and 134
men. In Figure 45, the percentage of each gender is shown.
45%
55%
Men
Women
Figure 45 - Distribution of gender among respondents
We tried to select people of all ages, because this factor directly influences
the level of thermal comfort. However, we avoided choosing people younger than 18
years and older than 70. The classes of ages, height and weight are shown in Figure
46, 47 and 48.

66
Figure 46 - Classes of age of respondents
It is important to emphasize that the selection of respondents was random,
and height and weight was not used as a choice factor.
5%
25%
23%
30%
13%
4%
Less than 1.54
1.54 to 1.60
1.61 to 1.68
1.69 to 1.75
1.76 to 1.82
More than 1.83
Figure 47 - Classes of height of respondents (in meters)

67
0.3%
23.0%
52.3%
19.7%
4.0% 0.7%
less than 40
40 to 59
60 to 79
80 to 99
100 to 119
120 and more
Figure 48 - Classes of weight of respondents in kilograms
5.4.2 Thermal sensation
The thermal sensation data was analyzed for each different time and area.
The Figure 49 shows the thermal sensation reported by pedestrians during the rainy
(R) and dry (D) seasons, in each area (1, 2 or 3), and under tree canopy (a) or
outside (b).
0%
10%
20%
30%
40%
50%
60%
70%
80%
90%
100%
R 1a R 1b R 2a R 2b R 3a R 3b D 1a D 1b D 2a D 2b D 3a D 3b
Survey Sensation
Very hot
Hot
Warm
Comfortable
Cool
Cold
Very cold
Figure 49 - Thermal sensation reported by pedestrians
At different seasons, the percentage of people unsatisfied is higher in areas
without trees, regardless of planted species. In area 3 (planted with Ipês), we can
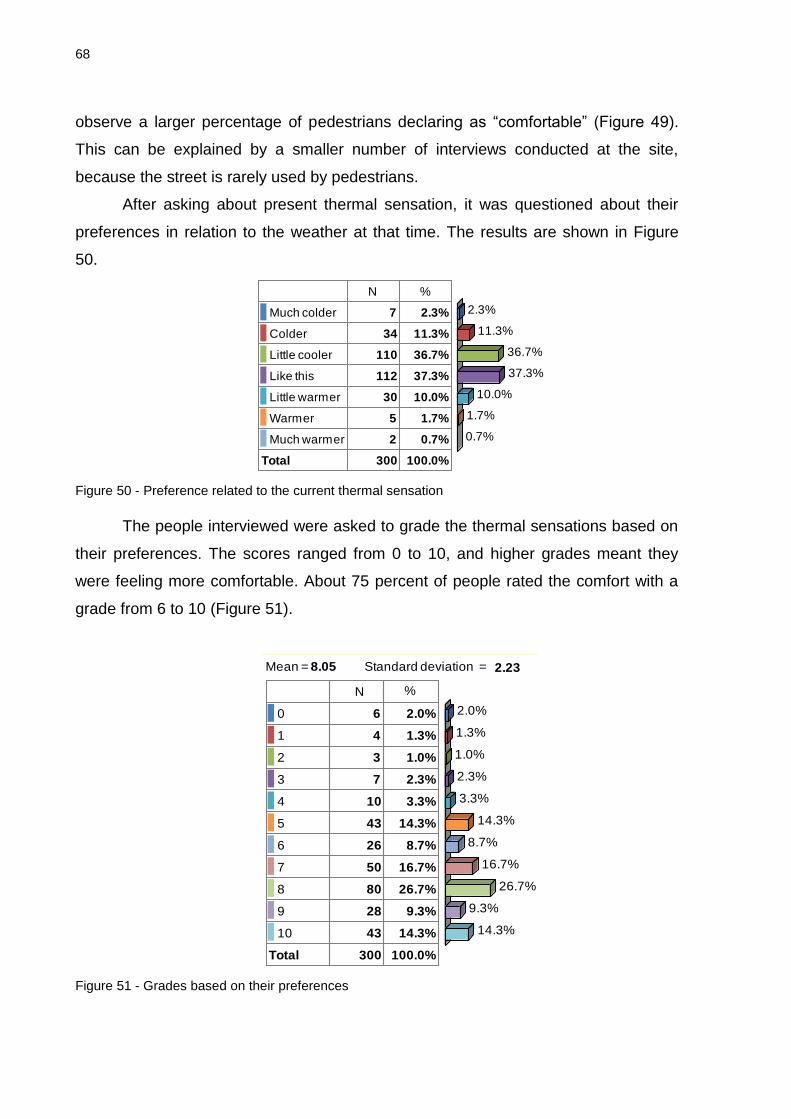
68
observe a larger percentage of pedestrians declaring as “comfortable” (Figure 49).
This can be explained by a smaller number of interviews conducted at the site,
because the street is rarely used by pedestrians.
After asking about present thermal sensation, it was questioned about their
preferences in relation to the weather at that time. The results are shown in Figure
50. Preference
N %
Much colder 7 2.3%
Colder 34 11.3%
Little cooler 110 36.7%
Like this 112 37.3%
Little warmer 30 10.0%
Warmer 5 1.7%
Much warmer 2 0.7%
Total 300 100.0%
2.3%
11.3%
36.7%
37.3%
10.0%
1.7%
0.7%
Figure 50 - Preference related to the current thermal sensation
The people interviewed were asked to grade the thermal sensations based on
their preferences. The scores ranged from 0 to 10, and higher grades meant they
were feeling more comfortable. About 75 percent of people rated the comfort with a
grade from 6 to 10 (Figure 51).
Grade
Mean = 8.05 Standard deviation = 2.23
N %
0 6 2.0%
1 4 1.3%
2 3 1.0%
3 7 2.3%
4 10 3.3%
5 43 14.3%
6 26 8.7%
7 50 16.7%
8 80 26.7%
9 28 9.3%
10 43 14.3%
Total 300 100.0%
2.0%
1.3%
1.0%
2.3%
3.3%
14.3%
8.7%
16.7%
26.7%
9.3%
14.3%
Figure 51 - Grades based on their preferences

69
The sensation described by pedestrian was transformed in the Predicted
Mean Vote (PMV), and the values were compared with the results for UTCI index. In
Figure 52, the correlation coefficient between them is shown (R2= 0.4095), as well as
the equation. In Martini (2013), the correlation coefficient was equal to 0.43,
evidencing an underestimation of the comfort’s data, and overestimated data for
discomfort to the heat.
y = 0.1717x - 3.912R² = 0.4095
-3
-2
-1
0
1
2
3
0 10 20 30 40 50
PM
V
UTCI (°C)
Figure 52 - Correlation Survey x UTCI
5.4.3 Perception questions
The survey presented a qualitative part, with dichotomous and opened
questions. Firstly, it was asked: “Are trees important for cities?” and 98.7% answered
“Yes”. The second question was open and asked them to mention the positive and
negative aspects of having trees in the city. Air purification, shade, and thermal
comfort were the most cited positive aspects, while, leaf fall (dirt), contact with power
lines and lifting sidewalks by root, appeared as negative consequences.

70
34.0%
50.4%
13.2%
2.4%
Yes
No
It depends
I do not know
Figure 53 - Satisfaction with the urban trees in the city of Piracicaba
The survey also questioned their satisfaction concerning urban trees in the city
of Piracicaba. 50.3 percent of respondents said they were not satisfied with the
condition of trees, whereas 34.0 percent said they were satisfied. Moreover, 13.2
percent of them answered “it depends”, because they believe in a difference of
management between neighborhoods. The remainder did not answer (Figure 53).
The next question asked about the size of tree that they thought it would be
the best to plant in the streets, and 40.4 percent answered that small trees are the
best, because they do not reach the electric wires or lift sidewalks due to their roots.
On the other hand, 28.6 percent said it would be better to plant large trees, because
they offer greater benefits than smaller ones (Figure 54).
28.6%
11.1%
40.4%
18.5%
1.0% 0.3%
Large
Medium
Small
It depends
I don't know
None
Figure 54 - The best size of tree

71
The last two questions inquired about the presence of any tree at the property
of the respondents, and in case of an affirmative answer, they would say if they know
what species it is. Within the 72.2 percent who said they have a tree at home, 55.1
percent said they knew the species planted.
After, we asked if they had a tree planted in their property: 72.2 percent
answered “yes”. For these people, we also inquired if they knew which species are
planted and 55.4 percent said they knew it. The majority of plants cited were fruit
trees. These data are shown in Table 3.
Table 3 - Percentage of people with tree in their properties
Do you have a tree in your property? Do you know what species is planted?
Yes 72.2 55.1
No 27.4 44.9

72

73
6 CONCLUSIONS
The presence of street trees is an important factor when we are dealing with
the human thermal comfort. This could be proved by the differences shown in the
analysis of each microclimatic variable and responses in the survey.
The areas with trees presented lower air temperature average and higher
values of relative humidity when compared with areas without trees. The influence in
wind speed was noted in our analysis; however, this variable should be studied for
each particular situation, since the recommendation will depend on the site’s use
purpose.
For all these reasons, the choice of suitable species should be fundamental
step in the planning of urban forestry.
Comparing the trees studied, we conclude that the three species presented
satisfactory results for employment on the streets in order to minimize thermal
discomfort in urban environments, because in all three cases the presence of trees
showed a positive and significant response for human thermal comfort.
It is possible some changes in climate between sites might be due to
differences in the canyon geometry, or materials or other factors but there is not
enough information to assess this. That is the reason why we can not affirm that
differences in microclimate variables are just due to species characteristics.
The thermal images helped in data interpretation and showed the role of
trees in cooling the asphalt, which is very important to improve the conditions of
thermal comfort.
The UTCI index showed some correlation with the respondents' answers, but
despite the calibration based on Fanger scale, it has not produced satisfactory
results. A new calibration and analysis should be made in order to implement
Bioklima program in our region.
The Envi-met proved to be an interesting tool for urban planning in order to
predict future scenarios. However, it should be further investigated, as it presents a
complexity with respect to input data, which may be interfering in the correlation of
simulated results and collected data.

74

75
REFERENCES
ABREU, L.V.; LABAKI, L.C. Conforto térmico propiciado por algumas espécies arbóreas: avaliação do raio de influência através de diferentes índices de conforto. Ambiente Construído, Porto Alegre, v. 10, n. 4, p. 103-117, out./dez. 2010.
AMERICAN SOCIETY OF HEATING, REFRIGERATING AND AIR-CONDITIONING ENGINEERS. Thermal environmental conditions for human occupancy: ASHRAE standard 55-2013. New York, 2013. 54 p.
ASSIS, E.S. A abordagem do clima urbano e aplicações no planejamento da cidade: reflexões sobre uma trajetória. In: ENCONTRO NACIONAL SOBRE CONFORTO NO AMBIENTE CONSTRUÍDO, 8.; ENCONTRO LATINO-AMERICANO SOBRE CONFORTO NO AMBIENTE CONSTRUÍDO, 4., 2005, Maceió. Anais... p. 92-101. Disponível em: <http://www.fau.usp.br/aut5823/Assis_2005_reflexoes_trajetoria.pdf>. Acesso em: 07 jan. 2014.
BRUSE, M.; FLEER, H. Simulating surface–plant–air interactions inside urban environments with a three dimensional numerical model. Environmental Modelling & Software, Canberra, v.13, n.3/4, p. 373-384, 1998. Disponível em: <http://www.sciencedirect.com/science/article/pii/S1364815298000425>. Acesso em: 24 fev 2014
BRÖDE, P.; KRÜGER, E.L.; FIALA, D. UTCI: validation and practical application to the assessment of urban outdoor thermal comfort. Geographia Polonica, Warsaw v. 86, n. 1, p. 11-20, 2013. Disponível em: <http://www.scopus.com/inward/record.url?eid=2-s2.0-84879145133&partnerID=40&md5=db0367489a89a241fe9a9dadef335fc6>. Acesso em: 24 fev 2014.
BUENO, C.L. Estudo da atenuação da radiação solar incidente por diferentes espécies arbóreas. 1998. 177 p. Dissertação (Mestrado em Engenharia Civil) – Faculdade de Engenharia Civil, Universidade Estadual de Campinas, Campinas, 1998.
Comitê de Trabalho Interinstitucional para Análise dos Planos Municipais de Arborização Urbana No Estado Do Paraná. Manual para elaboração do plano municipal de arborização urbana. Paraná.18p. Mai. 2012
DWYER, J.F.; MCPHERSON, E.G.; SCHROEDER, H.W.; ROWNTREE, R.A. Assessing the benefits and costs of the urban forest. Journal of Arboriculture, Champaign, v.18, p. 227-234, Sept. 1992.
Environmental Protection Agency. Reducing urban heat islands: compendium of strategies. Washington, 2008. 19 p. Disponível em: <http://www.epa.gov/heatisland/resources/pdf/BasicsCompendium.pdf>. Acesso em: 06 maio 2014.

76
FANGER, P.O. Assessment of man's thermal comfort in practice. British Journal of Industrial Medicine, London, v. 30, n. 4, p. 313-324, 1973. Disponível em: <http://oem.bmj.com/content/30/4/313.abstract>. Acesso em: 10 fev. 2013.
GEORGI, N.J.; ZAFIRIADIS, K. The impact of park trees on microclimate in urban areas. Urban Ecosystem, Duluth, v. 9, n. 3, p.195–209, September 2006.
GONÇALVES, A; RIBEIRO, A.C.; RODRIGUES, E.; CORTEZ, P.; NUNES. L.; FELICIANO, M. Avaliação da influência dos espaços verdes no conforto térmico urbano In: CONFERÊNCIA NACIONAL DO AMBIENTE, 9., 2007, Aveiro. Anais... Aveiro: Universidade de Aveiro, 2007. p. 1357–1361. Disponível em: <http://bibliotecadigital.ipb.pt/bitstream/10198/5711/3/CNA4.pdf>. Acesso em: 01 ago. 2011.
GRIMMOND, C.S.B.; ROTH, M.; OKE, T.R.; AU, Y.C.; BEST, M.; BETTS, R.; CARMICHAEL, G.; CLEUGH, H.; DABBERDT, W.; EMMANUEL, R.; FREITAS, E.; FORTUNIAK, K.; HANNA, S.; KLEIN, P.; KALKSTEIN, L. S.; LIU, C. H.; NICKSON, A.; PEARLMUTTER, D.; SAILOR, D.; VOOGT, J. Climate and more sustainable cities: climate information for improved planning and management of cities (producers/capabilities perspective). Procedia Environmental Sciences, Philadelphia,v. 1, p. 247-274, 2010. Disponível em: <http://www.sciencedirect.com/science/article/pii/S1878029610000174>. Acesso em: 10 fev. 2013. IBGE. Censo demográfico 2010. Disponível em: <http://ibge.gov.br/en/vamos-conhecer-o-brasil/nosso-povo/caracteristicas-da-populacao>. Acesso em: 08 set 14
KONIJNENDIJK, C.C. A decade of urban forestry in Europe. Forest Policy and Economics, New Haven, v. 5, n. 2, p. 173-186, 2003. Disponível em: <http://www.sciencedirect.com/science/article/pii/S1389934103000236>. Acesso em: 14 nov. 2012.
LEUZINGER, S.; VOGT, R.; KÖRNER, C. Tree surface temperature in an urban environment. Agricultural and Forest Meteorology, New Haven, v. 150, n. 1, p. 56-62, 2010. Disponível em: <http://www.sciencedirect.com/science/article/pii/S0168192309001993>. Acesso em: 14 nov. 2012.
LIMA, D.C.R.; NUNES, L.A.; SOARES, P.F. Avaliação da influência da vegetação no conforto térmico em espaços livres. In: SIMPÓSIO DE PÓS-GRADUAÇÃO EM ENGENHARIA URBANA, 2, 2009, Maringá. Resumos… Disponível em: <http://www.dec.uem.br/simpgeu/pdf/137.pdf>. Acesso em: 09 ago. 2011.
LOMBARDO, M.A. Ilhas de calor nas metrópoles: o exemplo de São Paulo. São Paulo: Hucitec,1985. 244 p.
LOMBARDO, M.A. Atmosfera urbana. São Paulo, 2011. 24 diapositivos: color. Disponível em:

77
<http://www.ambiente.sp.gov.br/cea/files/2011/12/Magda_Lombardo.pdf>. Acesso em: 06 maio 2014.
LORENZI, H. Árvores brasileiras: manual de identificação e cultivo de plantas arbóreas do Brasil. 4. ed. Nova Odessa: Instituto Plantarum, 2002. 2 v.
MEIER, F.; SCHERER, D. Spatial and temporal variability of urban tree canopy temperature during summer 2010 in Berlin, Germany. Theoretical and Applied Climatology, Vienna, v. 110, n. 3, p. 1-12, 2012. Disponível em: <http://dx.doi.org/10.1007/s00704-012-0631-0>. Acesso em: 14 fev. 2014.
MONTEIRO, L.M.; ALUCCI, M.P. Questões teóricas de conforto térmico em espaços abertos: consideração histórica, discussão do estado da arte e proposição de classificação de modelos. Ambiente Construído, Porto Alegre, v. 7, n. 3, p. 43-58, jul./set. 2007.
OKE, T.R. The micrometeorology of the urban forest. Philosophical Transactions - Royal Society of London. Series B, London, v. 324, n. 1223, p. 335-349, 1989. Disponível em: < http://www.scopus.com/inward/record.url?eid=2-s2.0-0024923709&partnerID=40&md5=efa1ca430b02b050691826bb780d8869>. Acesso em: 14 nov. 2012.
______. Initial guidance to obtain representative meteorological observations at urban sites: Instruments and Observing Methods (IOM). Geneva: World Meteorological Organization, 2006. 51 p. (Report, 81).
PAULA, R.Z.R. Influência da vegetação no conforto térmico do ambiente construído. 2004. 110 p. Dissertação (Mestrado em Engenharia Civil) - Faculdade de Engenharia Civil, Arquitetura e Urbanismo, Universidade Estadual de Campinas, Campinas, 2004.
SÆBØ, A.; BENEDIKZ, T.; RANDRUP, T.B. Selection of trees for urban forestry in the Nordic countries. Urban Forestry & Urban Greening, Alnarp, v. 2, n. 2, p. 101-114, 2003. Disponível em: <http://www.sciencedirect.com/science/article/pii/S1618866704700278>. Acesso em: 14 nov. 2012.
SCHUCH, M.I.S. Arborização urbana: uma contribuição à qualidade de vida com uso de geotecnologias. 2006. 102 p. Dissertação (Mestrado em Geomática) - Universidade Federal de Santa Maria, Santa Maria, 2006.
SPANGENBERG, J.; SHINZATO, P.; JOHANSSON, E.; DUARTE, D. Simulation of the influence of vegetation on microclimate and thermal comfort in the city of São Paulo. Revista da Sociedade Brasileira de Arborização Urbana, Piracicaba, v. 3, n. 2, p. 1-19, jun. 2008.
VOOGT, J.A. How researchers measure urban heat islands. London, 2003. 34 diapositivos: color. Disponível em: <http://www.epa.gov/heatislands/resources/pdf/EPA_How_to_measure_a_UHI.pdf >. Acesso em: 06 maio 2014.

78
VOOGT, J.A.; OKE, T.R. Complete urban surface temperatures. Journal of Applied Meteorology, Washington, v. 36, n. 9, p. 1117-1132, 1997. Disponível em: <http://dx.doi.org/10.1175/1520-0450(1997)036<1117:CUST>2.0.CO>. Acesso em: 14 nov. 2012.
______. Thermal remote sensing of urban climates. Remote Sensing of Environment, Saint Paul, v. 86, n. 3, p. 370-384, 2003. Disponível em: <http://www.sciencedirect.com/science/article/pii/S0034425703000798>. Acesso em: 14 nov. 2012.

79

80
BIBLIOGRAFIA CONSULTADA
MARTINI, A. Microclima e conforto térmico proporcionado pelas árvores de rua na cidade de Curitiba, PR. 2013. 129 p. Dissertação (Mestrado em Engenharia Florestal) - Universidade Federal do Paraná, Curitiba, 2013.
SILVA, I.M. Efeito do uso do solo sobre o conforto higrotérmico. 2012.170 p. Dissertação (Mestrado em Recursos Florestais) – Escola Superior de Agricultura “Luiz de Queiroz”, Universidade de São Paulo, Piracicaba, 2012.

81

82
APPENDIX

83

84
APPENDIX A – Scenario A

85
PPENDIX B – Scenario 2

86
APPENDIX C – Scenario 3

87
APPENDIX D - Questionnaire
Local: Data: Hora:
Local da entrevista: Sombra Sol
Condição do céu: Limpo Parcialmente coberto Nublado
No momento você está se sentindo com:
Muito frio Frio Pouco de frio Neutro Pouco de calor Calor Muito calor
Em uma escala de 0 a 10, como você está se sentindo confortável em relação
ao clima de hoje (0 = “nada confortável” e 10 = “muito confortável”).
0 1 2 3 4 5 6 7 8 9 10
Você se sentiria melhor se hoje estivesse:
Muito + frio + Frio Pouco + frio Como está Pouco + calor +Calor Muito + calor
Você acha que é importante ter árvores na cidade?
( )Sim ( )Não ( )Não sei
Quais são os pontos positivos? E negativos?
Ar Sombra Temperatura Estética Fauna Outro: ___________
Sujeira Segurança Calçada Outro: ___________
Em sua opinião, é melhor plantar árvores maiores ou menores na calçada? Por quê?
Você está satisfeito com a quantidade de árvores na cidade de Piracicaba?
( )Sim ( )Não ( )Não sei
Você tem uma árvore plantada em sua residência?
( ) Sim ( )Não ( ) Não informou
Se sim, onde ela está plantada? Você sabe qual é a espécie?
( ) Calçada ( )Quintal ( )Sim ( )Não Se souber, nome da
espécie:______________
Mora há quanto tempo em Piracicaba? __________ De onde veio?____________
Idade: ____ Altura: _____ Peso:_____ Sexo: ( )M ( )F
Vestimenta: ________________________________
Atividade:__________________________

88
APPENDIX E – Statistical analysis

89

90
ANNEX

91

92
ANNEX A – Certificate of conformity
93
ANNEX B – Accuracy hot bulb probe
94