university of são paulo “luiz de queiroz” college of ... › teses › disponiveis › 11 ›...
TRANSCRIPT

University of São Paulo “Luiz de Queiroz” College of Agriculture
Rice performance, water and nitrogen efficiency in different irrigation regimes in tropical lowland
André Fróes de Borja Reis
Thesis presented to obtain the degree of Doctor in Science. Area: Crop Science
Piracicaba 2017

1
André Fróes de Borja Reis
Agronomist
Rice performance, water and nitrogen efficiency in different irrigation regimes in tropical lowland
versão revisada de acordo com a resolução CoPGr 6018 de 2011
Advisor: Prof. Dr. JOSÉ LAÉRCIO FAVARIN
Thesis presented to obtain the degree of Doctor in Science. Area: Crop Science
Piracicaba 2017

2
Dados Internacionais de Catalogação na Publicação
DIVISÃO DE BIBLIOTECA – DIBD/ESALQ/USP
Reis, André Fróes de Borja
Rice performance, water and nitrogen efficiency in different irrigation regimes in tropical lowland / André Fróes de Borja Reis. - - versão revisada de acordo com a resolução CoPGr 6018 de 2011. - - Piracicaba, 2017.
77 p.
Tese (Doutorado) - - USP / Escola Superior de Agricultura “Luiz de Queiroz”
1. Oryza sativa L. 2. Eficiência isotópica de nitrogênio 3. Evapotranspiração 4. Arroz aeróbico 5. Molhamento e secagem alternados. 6. Plintossolo I. Título

3
DEDICATION
For agronomists, technicians, growers, researchers or
whoever spends the day thinking about rational agriculture and
environmental conservation as me. I hope the ideas here set out
will help you to answer your questions

4
ACKNOWLEDGMENTS
This PhD thesis is result of efforts and collaboration of many people, and in order to avoid the mistake
of forgetting someone I prefer express my gratitude for the institutions which each person was involved rather
than individually.
I am grateful to “Luiz de Queiroz” College of Agriculture for the bachelor’s degree of agronomic
engineer I got here back in 2007 and the opportunity to proceed my doctoral degree 6 years later. Agronomic
engineer is how I define myself and its being in the core of my actions since then.
My sincere thanks for Two Rivers Farms who believed in this research idea since very beginning and
hosted the field experiment, granted partially the research funds and let me use their impressive production
apparatus as a field laboratory.
I recognize the importance of following public funding agencies: CNPq for granted the scholarship
(140193/2013-8), FAPESP for funding the infra-structure of Laboratório Multiusuário em Produção Vegetal,
and CAPES for Programa de Doutorado Sanduíche no Exterior – PDSE (10810/14-5). The public investment
in research is a worthwhile step for this country development.
For Crop Science graduate program, thanks for the commitment and kindly help every time I needed.
I also would like to thank Embrapa - Tocantins to help me with pre-processing samples and support
equipment for field measurements.
In Lagoa da Confusão city, I cannot forget the helpful support of Foliar Aviação Agrícola, Impar
consultoria, Plantar representações, Cultivar repesentações, Evidência agrícola, SINDIATO and Brazeiro
Sementes. My sincere respect for the pioneers.
All the folks from Laboratório Multiusuário em Produção Vegetal, GEA Grupo de Experimentação
Agrícola, Laboratório de Isótopos Estáveis CENA / USP, Laboratório de Química Analítica – LCE. Thanks for
the help, you guys were awesome.
I also appreciate all the help from Agroecosystems lab from UC Davis that gave meu thoughtful
suggestion to clarify the manuscript and English review.
And the most important gratitude is for my family. Without their support and love I never would have
made it.
Thank you all

5
CONTENT
RESUMO ........................................................................................................................... 7
ABSTRACT ........................................................................................................................ 9
FIGURE LIST ..................................................................................................................... 11
TABLE LIST ....................................................................................................................... 14
1. INTRODUCTION ........................................................................................................... 15
References ...................................................................................................................... 17
2. Non-flooding regime improves rice yield and water use efficiency in lowland tropical environment ................................................................................................................... 21
Abstract .......................................................................................................................... 21
2.1. Introduction ............................................................................................................. 21
2.2. Material and Methods .............................................................................................. 22
2.2.1. Site Description ...................................................................................................... 22
2.2.2. Field Experiment .................................................................................................... 23
2.2.3. Crop Performance .................................................................................................. 24
2.2.4. Isotopic Nitrogen Use Efficiency ............................................................................. 24
2.2.5. Nitrogen Use Efficiency Indexes .............................................................................. 25
2.2.6. Evapotranspiration and water measurements ........................................................ 26
2.2.7. Statistical Analysis ................................................................................................. 27
2.3. Results ...................................................................................................................... 27
2.3.1. Weather data ......................................................................................................... 27
2.3.2. Soil Water Potential in Root Zone ........................................................................... 27
2.3.3. Crop Performance .................................................................................................. 28
2.3.4. Isotopic Nitrogen Efficiency .................................................................................... 31
2.3.5. Nitrogen Indices ..................................................................................................... 31
2.3.1. Evapotranspiration and water measurements ........................................................ 32
2.4. Discussion ................................................................................................................. 35
2.4.1. Soil Water Potential in Root Zone ........................................................................... 35
2.4.2. Crop Performance .................................................................................................. 37
2.4.3. The Isotopic Efficiency ............................................................................................ 37
2.4.4. N Efficiency Indexes ............................................................................................... 38
2.4.5. The Water use efficiency ........................................................................................ 39
6
2.5. Conclusion ................................................................................................................ 40
References ...................................................................................................................... 41
3. Relationship of nitrogen and crop components in aerobic rice and continuous flooding irrigation in weathered tropical lowland .......................................................................... 47
Abstract .......................................................................................................................... 47
3.1. Introduction ............................................................................................................. 47
3.2. Material and Methods .............................................................................................. 49
3.2.1. Site Description ..................................................................................................... 49
3.2.2. Field Experiment .................................................................................................... 49
3.2.3. Crop performance along seasons’ development ..................................................... 50
3.2.4. Crop performance at harvest .................................................................................. 50
3.2.5. Evapotranspiration and water filled porous............................................................ 50
3.2.6. Exchangeable nitrogen content in soil .................................................................... 51
3.2.7. Statistical Analysis: ................................................................................................ 51
3.3. Results ..................................................................................................................... 52
3.3.1. Crop performance along seasons’ development ..................................................... 52
3.3.2. Crop performance at harvest .................................................................................. 59
3.4. Discussion ................................................................................................................. 68
3.4.1. Crop performance along seasons’ development ...................................................... 68
3.4.2. Crop performance at harvest .................................................................................. 69
3.5. Conclusion ................................................................................................................ 70
References ...................................................................................................................... 71
4. Final considerations ..................................................................................................... 77
7
RESUMO
Performance do arroz, eficiência de água e nitrogênio em diferentes regimes de irrigação
em planícies de inundação tropical
A cultura do arroz (Oryza sativa L.) tem importante papel em fornecer alimento à crescente população mundial, e o incremento da produção virá não só do ganho de eficiência de áreas em uso, mas também da incorporação de novas áreas. As planícies tropicais do norte do Brasil já estão sendo convertidas para cultivo de arroz, apesar da falta de conhecimento científico e práticas agrícolas apropriadas às condições locais. Essa região apresenta solos c o m m i n e r a i s d e a r g i l a intemperizados e propriedades distintas daqueles de regiões tradicionais de cultivo, e a transferência das práticas agrícolas desenvolvidas para outros agroecossistemas têm resultado em produtividades variáveis e uso inadequado de insumos. A água é principal recurso no cultivo do arroz, e a irrigação com inundação constante é largamente disseminada pelo mundo. Regimes alternativos de irrigação a fim de economizar agua tem sido propostos em razão da ameaça de escassez de água, e resultados promissores estimulam a disseminação dessa técnica, apesar de prejuízos à produtividade em razão do estresse por seca e/ou menor disponibilidade de nitrogênio (N) do solo. A umidade do solo e a quantidade de oxigênio interferem na dinâmica de N e podem favorecer processos de perdas e alterar a resposta do cultivo à adubação nitrogenada. Nas planícies tropicais do Brasil a disponibilidade de água e N são limitadas, e a inundação contínua não é sustentável em razão da quantidade de agua requerida associada a baixa produtividade da cultura. Portanto, esta pesquisa foi realizada com o objetivo de estudar de forma integrada o regime de irrigação e o uso de N, e performance da cultura em várzea tropical. O experimento foi realizado durante três anos em Plintossolo no estado do Tocantins. Na primeira etapa da pesquisa procurou-se identificar o regime de irrigação que proporciona maior eficiência de uso da água (WUE), eficiência de uso de nitrogênio (NUE) e performance de cultivo com N nativo do solo e quando aplicado N fertilizante. Na segunda fase comparou-se o regime de irrigação que proporcionou melhores índices de eficiência de água e N ao regime de lâmina contínua com a hipótese que a relação entre aplicação de fertilizante N e componentes de produção seriam diferentes entre os regimes. Na primeira fase adotou-se delineamento de parcela subdividida com 5 regimes de irrigação (IR): lâmina alternada de inundação e drenagem em ciclo curto (AWDS); lâmina alternada de inundação e drenagem em ciclo longo (AWDL); lâmina contínua (CF); sem formação de lâmina e solo aeróbico (NF); e sem formação de lâmina e solo saturado (SS). Nas subparcelas avaliou-se as doses de N fertilizante: 0 e 150 kg ha-1. A performance de cultivo foi afetada pelo IR e dose de N. Na média dos 3 anos, o acúmulo de nitrogênio na parte aérea (NU) foi 32% maior em NF do que em todos os outros regimes de irrigação. A produtividade de grãos média entre as duas doses de N foi 7,2, 8,8 e 7,5 Mg ha-1 em NF e 5,6, 8,2, 6,9 Mg ha-1 in CF, respectivamente em 2014, 2015 e 2016. A NUE foi de 81,5% de recuperação de 15N em NF e 62, 61, 56 e 26% em SS, AWDS, AWDL e CF, respectivamente. A média de WUE em relação a água aplicada foi 0,7 kg grão m-3 em NF e 0,47, 0,40, 0,35, 0,32 kg grão m-3 água em SS, AWDS, AWDL e CF, respectivamente. Na segunda fase adotou-se o delineamento experimental de parcelas subdivididas com inundação contínua (CF) e sem formação de lâmina e solo aeróbico (NF) na parcela principal e aplicação de N fertilizante (0, 50, 150, 250 kg ha-1) nas safras 2014, 2015, 2016. Biomassa (AGB) acúmulo de nitrogênio (NU) e índice de área foliar (LAI) foram avaliados ao longo do desenvolvimento da cultura nas doses de 0 e 150 kg ha-1 nas safras de 2015 e 2016. Assim como a relação entre AGB, NU densidade de panícula (PD), número de espiguetas (NS) e produtividade de grãos (GY) na maturidade fisiológica A condição aeróbica proporcionou maior NU ao longo do desenvolvimento e LAI maior ou igual a CF. Na colheita, NU e PD tiveram diferentes repostas ao nitrogênio fertilizante quando em NF ou CF, mostrando NU 18% maior em NF assim como PD 27%maior em NF do que em CF na média de anos e dose de N. A resposta da GY ao nitrogênio fertilizante também foi diferente quando em NF ou CF, e na médias de dose de N fertilizante, NF proporcionou produtividade 20% e 12% maior do que CF em 2014 e 2015, respectivamente. Conclui-se nessa pesquisa que nesse agroecossistema, desde de que que não ocorra estresse por seca, o arroz cultivado em sistema de irrigação sem formação de lâmina e solo aeróbico é mais eficiente no uso de água e nitrogênio. E ainda, com melhor desempenho de produtividade e menor

8
dependência de N fertilizante em comparação ao cultivado em lâmina contínua ou qualquer outro regime alternativo que economize água.
Palavras-chave: Oryza sativa L.; Eficiência isotópica de nitrogênio; Evapotranspiração; Arroz aeróbico; Molhamento e secagem alternados; Plintossol
9
ABSTRACT
Rice performance, water and nitrogen efficiency in different irrigation regimes in tropical
lowland
Rice (Oryza sativa L.) crop has an important role to attend the food demand of a growing world population, and the production increment will come not just from increasing efficiency in the current cropland, but also from expansion to new areas. The tropical lowland plains of northern Brazil are already being converted to rice production, although the lack of scientific knowledge and agricultural practices suited local conditions. This region presents soils with weathered clays with distinct properties from those grown in traditional rice regions, and deploying agricultural practices developed to others agroecosystem lead to instable crop yield inadequate uses of agricultural inputs. Water is the greatest resource that rice crop relies on, and worldwide continuous flooding is broadly used. Alternative irrigations regimes with purpose to save water have been proposed due the threatens of water scarcity, and promising results stimulate this approach, despite grain yield penalties due drought stress and/or decrease of soil N availability. The soil moisture and oxygen amount interfere on nitrogen dynamics, thus can enhance loss process and change crop response to N fertilizer. In tropical lowland region of Brazil water and nitrogen are limited and continuous flooding irrigation is not sustainable due huge water amount used associated to low grain yields. Therefore, this research was performed aiming an integrated assessment of irrigation regimes, nitrogen use and crop performance in rice crop in Brazilian tropical lowland. The field experiment was done during three years in a Plinthaquults soil at Tocantins. The first stage was aimed to identify the irrigation regime which provides the best water use efficiency (WUE), nitrogen use efficiency (NUE) and crop performance with indigenous N soil supply and nitrogen fertilizer. The second stage compared the best observed irrigation regime to continuous flooding, and the nitrogen relationship to crop components along their development and harvest. The first experiment was a split-plot design with 5 irrigation regime (IR) in main plot: alternate wet and dry in short cycle (AWDS); alternate wet and dry in long cycle (AWDL); Continuous flooding (CF); Non-flooding aerobic (NF); saturated soil without ponding water (SS). And subplot was N fertilizer rate: 0 and 150 kg ha-1 of N. Crop performance was affected by IR and N level. In the average of three years nitrogen uptake (NU) was 32% higher in NF than any other irrigation regime. Grain yield across N level was 7.2, 8.8 and 7.5 Mg ha-1 in NF and in CF were 5.6, 8.2 and 6.9 Mg ha-1, respectively in 2014, 2015 and 2016. The isotopic NUE showed total recovery of 81.5 % of 15N in NF and 62, 61, 56, 56% in SS, AWDS, AWDL, CF respectively. The average WUE of delivered water was 0.7 kg grain m-3 in NF, and 0.47, 0.40, 0.35, 0.32 kg grain m-3 water in SS, AWDS, AWDL and CF, respectively. The second experiment was a split-plot design with: continuous flooding (CF) and non- flooding aerobic (NF) in the main plot and fertilizer nitrogen (0, 50, 150 and 250 kg ha-1) in the subplot during the 2014, 2015 and 2016. Biomass (AGB) nitrogen uptake (NU) and leaf area index (LAI) were observed along crop development in the 0 and 150 subplots in 2015 and 2016 growing seasons. As was the relationship between AGB, NU, panicle density (PD), spikelet number (NS) and grain yield (GY) at physiological maturity. The aerobic rice provided higher NU throughout rice development and LAI equal or superior to CF. At harvesting, NU and PD had different relationships to N rates among CF and NF, with NF showing 18% higher NU as 27% PD higher than CF across years and N rate. The grain GY relationship to N rates was also distinct in 2014 and 2015, and GY across N rates in NF was 20% and 12% higher than CF for 2014 and 2015, respectively. This research concludes for such agroecosystem, as long there is no drought stress, rice crop in non-flooding aerobic irrigation regime performs higher efficiency of water and N use, and moreover presents better overall crop performance with less need to nitrogen fertilizer than traditional continuous flooding or any other water saving irrigation regime.

10
Keywords: Oryza sativa L.; Nitrogen isotopic efficiency; Evapotranspiration; Aerobic rice; Alternate wet and dry; Ultisol
11
FIGURE LIST
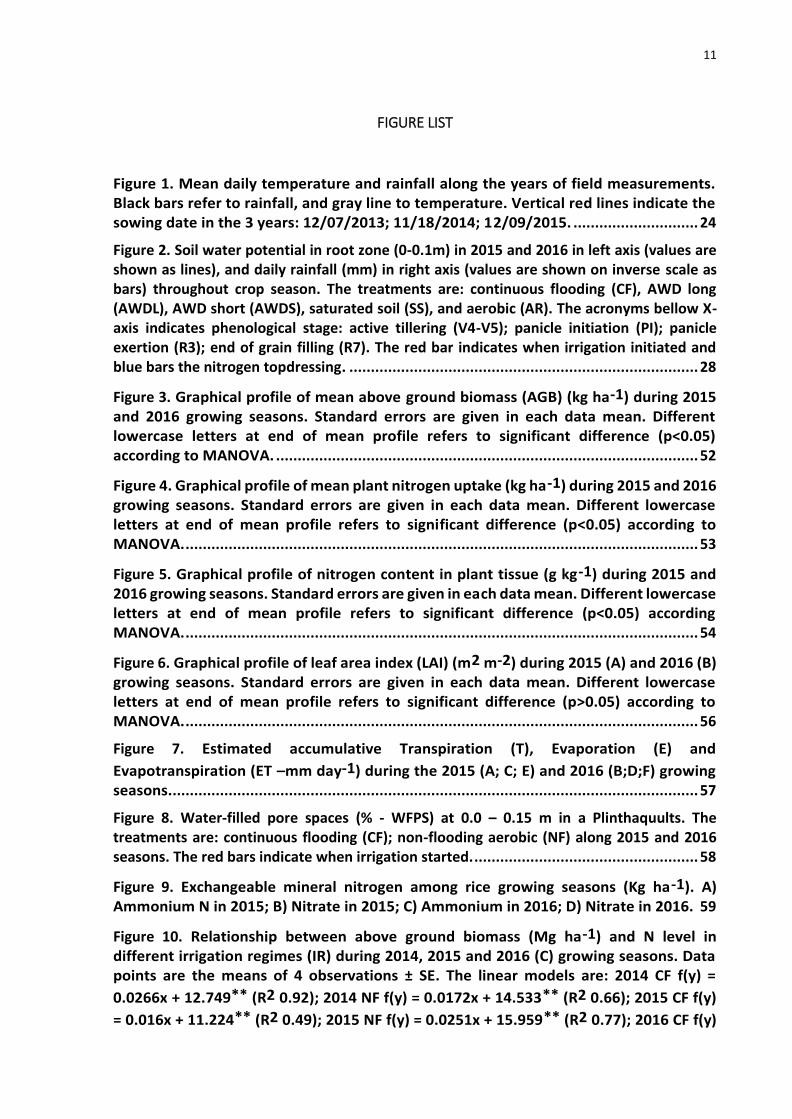
Figure 1. Mean daily temperature and rainfall along the years of field measurements. Black bars refer to rainfall, and gray line to temperature. Vertical red lines indicate the sowing date in the 3 years: 12/07/2013; 11/18/2014; 12/09/2015. ............................. 24
Figure 2. Soil water potential in root zone (0-0.1m) in 2015 and 2016 in left axis (values are shown as lines), and daily rainfall (mm) in right axis (values are shown on inverse scale as bars) throughout crop season. The treatments are: continuous flooding (CF), AWD long (AWDL), AWD short (AWDS), saturated soil (SS), and aerobic (AR). The acronyms bellow X-axis indicates phenological stage: active tillering (V4-V5); panicle initiation (PI); panicle exertion (R3); end of grain filling (R7). The red bar indicates when irrigation initiated and blue bars the nitrogen topdressing. ................................................................................. 28
Figure 3. Graphical profile of mean above ground biomass (AGB) (kg ha-1) during 2015 and 2016 growing seasons. Standard errors are given in each data mean. Different lowercase letters at end of mean profile refers to significant difference (p<0.05) according to MANOVA. .................................................................................................. 52
Figure 4. Graphical profile of mean plant nitrogen uptake (kg ha-1) during 2015 and 2016 growing seasons. Standard errors are given in each data mean. Different lowercase letters at end of mean profile refers to significant difference (p<0.05) according to MANOVA. ....................................................................................................................... 53
Figure 5. Graphical profile of nitrogen content in plant tissue (g kg-1) during 2015 and 2016 growing seasons. Standard errors are given in each data mean. Different lowercase letters at end of mean profile refers to significant difference (p<0.05) according MANOVA. ....................................................................................................................... 54
Figure 6. Graphical profile of leaf area index (LAI) (m2 m-2) during 2015 (A) and 2016 (B) growing seasons. Standard errors are given in each data mean. Different lowercase letters at end of mean profile refers to significant difference (p>0.05) according to MANOVA. ....................................................................................................................... 56
Figure 7. Estimated accumulative Transpiration (T), Evaporation (E) and
Evapotranspiration (ET –mm day-1) during the 2015 (A; C; E) and 2016 (B;D;F) growing seasons........................................................................................................................... 57
Figure 8. Water-filled pore spaces (% - WFPS) at 0.0 – 0.15 m in a Plinthaquults. The treatments are: continuous flooding (CF); non-flooding aerobic (NF) along 2015 and 2016 seasons. The red bars indicate when irrigation started. .................................................... 58
Figure 9. Exchangeable mineral nitrogen among rice growing seasons (Kg ha-1). A) Ammonium N in 2015; B) Nitrate in 2015; C) Ammonium in 2016; D) Nitrate in 2016. 59
Figure 10. Relationship between above ground biomass (Mg ha-1) and N level in different irrigation regimes (IR) during 2014, 2015 and 2016 (C) growing seasons. Data points are the means of 4 observations ± SE. The linear models are: 2014 CF f(y) =
0.0266x + 12.749** (R2 0.92); 2014 NF f(y) = 0.0172x + 14.533** (R2 0.66); 2015 CF f(y)
= 0.016x + 11.224** (R2 0.49); 2015 NF f(y) = 0.0251x + 15.959** (R2 0.77); 2016 CF f(y)

12
= 0.0029x + 13.662ns (R2 0.12); 2016 NF f(y) = 0.0015x + 14.6ns (R2 0.01) Ns: not
significant; * Significant at p ≤ 0.05; ** Significant at p ≤ 0.01 by ANOVA F test. ......... 61
Figure 11. Relationship between nitrogen uptake (NU) and N level in different irrigation regimes (IR) during 2014, 2015 and 2016 growing seasons. Data points are the means of
4 observations ± SE. The linear models are: 2014 CF f(y) = 0.2053x + 86.67** (R2 0.82);
2014 NF f(y) = 0.4401x + 124.23** (R2 0.99); 2015 CF f(y)= 0.5267x + 83.504** (R2 0.99);
2015 NF f(y) = 0.5577x + 115.78** (R2 0.99); 2016 CF f(y) = 0.2671x + 99.126** (R2 0.97);
2016 NF f(y) = 0.337x + 125.88** (R2 0.88). Ns: not significant; * Significant at p ≤ 0.05; ** Significant at p ≤ 0.01 by ANOVA F test .................................................................... 62
Figure 12. Relationship between nitrogen content in above ground biomass (NC) and N level in different irrigation regimes (IR) during 2014, 2015 and 2016 growing seasons. Data points are the means of 4 observations ± SE. The linear models are: 2014 CF f(y) =
0.0055x + 7.7467** (R2 0.75); 2014 NF f(y) = 0.0146x + 7.9517 ** (R2 0.75); 2015 CF
f(y)= 0.0178x + 6.7479** (R2 0.99); 2015 NF f(y) = 0.0244x + 7.6258** (R2 0.96); 2016
CF f(y) = 0.0189x + 7.5903 (R2 0.89**); 2016 NF f(y) = 0. 0.0219x + 9.3432*s (R2 0.86).
Ns: not significant; * Significant at p ≤ 0.05; ** Significant at p ≤ 0.01 by ANOVA F test. ....................................................................................................................................... 63
Figure 13. Relationship between number of spikelet (NS) and N level in different irrigation regimes (IR) during 2014, 2015 and 2016 growing seasons. Data points are the
means of 4 observations ± SE. The linear models are: 2014 CF f(y) = 0.0878x + 74.28* (R2
0.91); 2014 NF f(y) = 0.0136x + 98.76ns (R2 0.03); 2015 CF f(y)= 0.069x + 104.37* (R2
0.88); 2015 NF f(y) = 0.069x + 104.37ns (R2 0.58); 2016 CF f(y) = 0.0913x + 88.053* (R2
0.98); 2016 NF f(y) = 0.0357x + 99.584ns (R2 0.41).Ns: not significant; * Significant at p
≤ 0.05; ** Significant at p ≤ 0.01 by ANOVA F test. ....................................................... 64
Figure 14. Relationship between panicle density (PD) and N level in different irrigation regimes (IR) during 2014, 2015 and 2016 growing seasons. Data points are the means of
4 observations ± SE. The linear models are: 2014 CF f(y) = 0.0037x2 + 1.1309x + 194.79*
(R2 0.99); 2014 NF f(y) = 0.0308x + 310.22ns (R2 0.03); 2015 CF f(y)= -0.0039x2 + 1.3705x
+ 220.56* (R2 0.61); 2015 NF f(y) = 0.0576x + 373.56ns (R2 0.13); 2016 CF f(y) = 0.2873x
+ 199.43** (R2 0.96); 2016 NF f(y) = 0.1051x + 271.91ns (R2 0.24). Ns: not significant; *
Significant at p ≤ 0.05; ** Significant at p ≤ 0.01 by ANOVA F test. .............................. 65
Figure 15. Relationship between grain yield (GY) and N level for continuous flooding (CF) and non-flooding (NF) in 2014, 2015 and 2016 growing seasons. Data points are the
means of 4 observations ± SE. The linear models are:2014 CF f(y) = -0.00005x2 + 0.0282x
+ 4.0124* (R2 0.99); 2014 NF f(y) = -0.00008x2 + 0.026x + 5.975** (R2 0.94); 2015 CF f(y)=
- 0.00014x2 + 0.0498x + 5.5673** (R2 0.92); 2015 NF f(y) -0.00016x2 + 0.0481x +
7.3772** (R2 0.92); 2016 CF f(y) = -0.00006x2 + 0.0272x + 5.3467* (R2 0.99); 2016 NF
f(y) = -0.00004x2 + 0.0201x + 6.3315* (R2 0.98). Ns: not significant; *Significant at p ≤
0.05; ** Significant at p ≤ 0.01 by ANOVA f test. ........................................................... 67

13
Figure 16. Relationship between nitrogen uptake in aboveground biomass (NU) at crop maturity and grain yield (GY) in 2014, 2015 and 2016 growing seasons. The linear
models are: CF f(y) = 0.0294x + 3.4012 ** (R2 = 0.51); NF f(y) = 0.0111x +6.115 ** (R2
= 0.17). Ns: not significant; * Significant at p ≤ 0.05; ** Significant at p ≤ 0.01 by ANOVA f test ............................................................................................................................... 68

14
TABLE LIST
Table 1. Chemical and physical properties of field experiment soil, Plinthaquults. Values describes 0-15 cm depth ................................................................................................ 22
Table 2. Rainfall and temperature per growing season during rice development in 2014, 2015 and 2016. ........................................................................................................................ 27
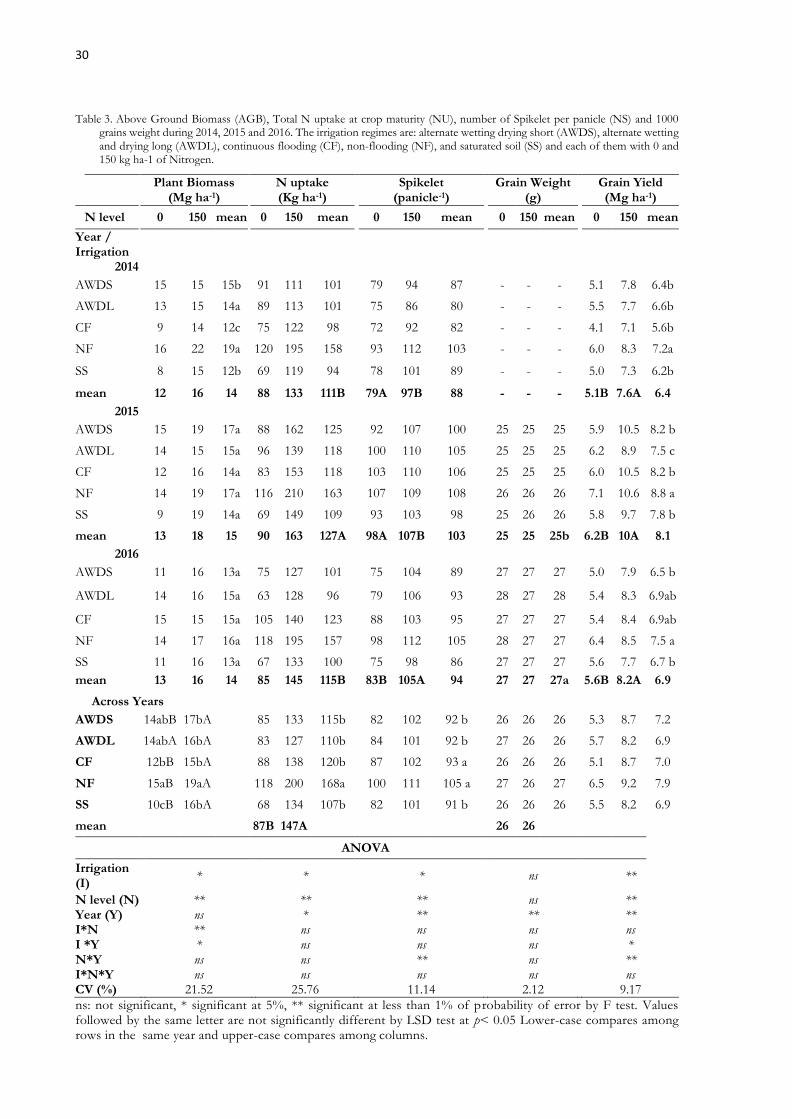
Table 3. Above Ground Biomass (AGB), Total N uptake at crop maturity (NU), number of Spikelet per panicle (NS) and 1000 grains weight during 2014, 2015 and 2016. The irrigation regimes are: alternate wetting drying short (AWDS), alternate wetting and drying long (AWDL), continuous flooding (CF), non flooding (NF), and saturated soil (SS) and each of them with 0 and 150 kg ha-1 of Nitrogen. ........................................................................ 30
Table 4. alternate wetting drying short (AWDS), alternate wetting and drying long (AWDL), continuous flooding (CF), non-flooding (NF), and saturated soil (SS) in 2015 e 2016. The N rate was 150 kg ha-1. ...................................................................................................... 32
Table 5. Apparent Nitrogen Use Efficiency (ANUE), Nitrogen Recovery Efficiency (ANR) e Partial Factor of Productivity (PFP). The irrigation regimes ares: alternate wetting drying short (AWDS), alternate wetting and drying long (AWDL), continuous flooding (CF), non-flooding (NF), and saturated soil (SS) in 2014, 2015 and 2016. ..................... 34
Table 6. Total water input (WI), crop evapotranspiration (ETc) segmented in its evaporation (E) and transpiration (T), and infiltration loss accumulated during growing season of 2015 and 2016. The irrigation regimes are: alternate wetting drying short (AWDS), alternate wetting and drying long (AWDL), continuous flooding (CF), non-flooding (NF), and saturated soil (SS) in 2015 e 2016 .................................................................................................... 35
Table 7. ET Water use efficiency (WUEET - kg grain m-3), water input use efficiency (WUEIn - kg grain m-3) and application efficiency (EA- %) in 2015 and 2016. The irrigations regimes are: alternate wetting drying short (AWDS), alternate wetting and drying long (AWDL), continuous flooding (CF), non-flooding (NF), and saturated soil (SS). ................................ 36
Table 8. Analysis of Variance probability for above ground biomass, N uptake and N content in above ground biomass, number of spikelets per panicle, panicle density (panicle m-2) and grain yield of rice. The fixed effects are irrigation regimes (continuous flooding and non-flooding); nitrogen levels (0, 50, 150 and 250 kg ha-1) and growing seasons (2014, 2015 and 2016). ............................................................................................................................. 59

15
1. INTRODUCTION
The world produces 700 million tons of rice grain per year, and rice crop (Oryza sativa L.) occupies 160
million hectares (Sharkey et al., 2016). Most of this production occurs in a flooded irrigation system that consumes
35-45% of all water intended for crop irrigation, which in turn consumes 70% of all the water used by all human
activity (Bouman, 2016). This extraordinary consumption is not in vain, and rice production worldwide provides
the daily carbohydrate requirement to 3 billion people (Maclean et al., 2013). In Brazil, rice is the sixth crop in
planted area, with annual production of 10.6 million tons (IBGE, 2017) and average water consumption of 6,000
m3 ha-1 (Machado et al., 2006).
Despite impressive numbers, production needs to grow. It is estimated that in 2050, the demand for
this cereal will be 830 million tons (20% increase) (Thomson, 2003). For this, the productive processes in the
areas currently in use need to have their efficiency increased, in addition to the incorporation of new areas into
the production system. In Brazil, there are approximately 15 million hectares of tropical lowlands suitable for the
production of rice not yet used in the sedimentation plains of the north and northeast regions (Coelho et al.,
2006).
These potential areas have soil and climate properties different from the traditional production areas
in southern Brazil or even Asia, and lack information on crop performance and agronomic practices suited to
local conditions. In traditional cropping regions, irrigation management with continuous flooding is widely
disseminated and recommended (Bouman et al., 2007), although since the beginning of the 2000s, the global
threat of water scarcity has stimulated the development of alternative irrigation management that proposes water
saving (Tuong et al., 2005). Among the proposed alternatives that are still under discussion, none of them is
widely adequate for the Brazilian tropical lowland, due to its different characteristics, mainly regarding soil.
In Brazil, floodplains show predominance of hydromorphic soils, of the Gleisol and Ultisol orders,
with shallow subsurface horizon or temporary elevation of the water table (Stone, 2005). Although they were
young soils, they have developed from alluvial deposition of highly weathered sediments from Oxisols coming
from older geomorphological surfaces of the Cerrado (Sanchez, 1976). The clay fraction of these sediments
contains weathered clays of the 1: 1 type (kaolinite and Fe and Al oxides) that form stable microstructure of the
size of sand fraction (Tomasella et al., 2000), and which do not easily disperse even after tillage. In addition, the
saturation of Al in CEC provides behavior of flocculation rather than dispersion making inefficient puddling
(Sharma and De Datta, 1985; Stone, 2005). The results are soils with saturated hydraulic conductivity (Ksat) above
1m d-1 (Martins, 2004), and potential loss of water by percolation (Aimrun et al., 2004).
And how much does this percolation loss represent in the demand for water by the rice crop?
Evapotranspiration (ET) of the crop is 400 to 800 mm water per crop cycle (Bouman et al., 2005; Guerra et al.,
1998; Linquist et al., 2015) and the efficiency of conversion of ET water into grain is strongly related to genetic
factors, although agricultural management also influences (Foulkes et al., 2009; Tuong et al., 2005). To meet the
demand for ET, there are water losses in the irrigation process, with the most important being percolation, runoff
and direct evaporation from the pounding water. These losses cause the total water supplied to the crop to be up
to 2.5 times higher than the demand for ET (Wickham and Singh, 1978).
The volume of water used unrelated to ET is the main target of research that proposes water saving at
field basis, and innovative rice production system such alternate wetting and drying cycles, saturated soil culture,
aerobic rice and sprinkler irrigation are the most important approaches (Tuong et al., 2005). Some of these

16
techniques are promising with increments of 5-30% in water use efficiency (WUE) (Cabangon et al., 2004; de
Vries et al., 2010; Lu et al., 2000; Patel et al., 2010). However, the penalization in crop productivity is also reported,
and depreciation between 0% and 38% leads adoption to proceed with caution and require site-specific
adaptation. The lower productivity is attributed to the direct consequence of inadequate water supply to meet ET
(Belder et al., 2005a; Kato et al., 2009; Patel et al., 2010; Singh et al., 2001), to genotypes not adapted to soil water
tension around field capacity (Yao et al., 2012), or the indirect influence of irrigation on the lower availability of
nitrogen in the soil (Dong et al., 2012; Kadiyala et al., 2015; Zhou et al., 2011).
The dynamics of N in the soil is controlled by soil moisture (Van Cleemput et al., 2007) and by the
presence of oxygen (Bouldin, 1986). The substitution of oxygen by water in the soil pores establishes an anaerobic
environment, with reduction of the redox potential up to +200 mV (Fageria et al., 2003; Ponnamperuma, 1972).
In this reducing condition, N coming from the mineralization of the organic matter or applied in the form of
ammonia fertilizers remains in its form of maximum reduction (NH4+) presenting NOX -3. Nitrogen in this
form is retained in soil CEC, immobilized by microbial activity or by plant uptake (Reddy et al., 1984). Loss
pathways such as leaching, volatilization and denitrification are disadvantaged (Borin et al., 2016). And as a result,
the efficiency of N use by the plant is high (Pan et al., 2017; Wang et al., 2016). Therefore, research centers and
rice manuals recommend continuous flooding in order to obtain high productivity due to better use of nitrogen
(Maclean et al., 2013; SOSBAI, 2014).
On the other hand, in alternative irrigation regimes, as the ponding water is withdrawn and the soil is
drained, the soil pores are filled with air again. Aerobic condition is established and the redox potential reaches
values above + 400 mV (Ponnamperuma, 1972). Ammonium (N-NH4+) is oxidized to nitrate (N-NO3
-) by
respiration of chemoautotrophic bacteria of the genera Nitrosomonas and Nitrobacter, which use the N-H bonds of
ammonia as energy source (Mosier et al., 1996; Subbarao et al., 2006). The result is that nitrogen is taken to its
maximum oxidation and has the NOX of +5. Once in the form of nitrate, N can be lost by leaching if the soil
properties are favorable, because nitrate is an anion and is not retained in the CEC (Akkal-Corfini et al., 2010;
Powlson, 1993). Moreover, as nitrate, nitrogen can be denitrified, which is the most important process of nitrogen
loss in flooded soils (Bouman et al., 2007). According to Stevens and Laughlin (1998), the loss of N through N2
in soils may reach 125 kg ha-1, and N2O up to 8 kg ha-1. The potential loss of N due to alternative irrigation
regimes can lead to reduction in rice performance (Belder et al., 2005b; Pan et al., 2017; Wang et al., 2016).
Nitrogen is the nutrient most demanded by irrigated rice crops and the availability to plant uptake
during development is one of the most limiting factors of productivity (Fageria and Baligar, 2005). Nitrogen is
related to tillering, leaf area index (LAI), number of spikelet, panicle sterility and grain weight (Fageria and Baligar ,
2001; Wang et al., 2016; Yao et al., 2012; Ye et al., 2013), which are the parameters that compose crop
productivity. Moreover, nitrogen interferes with plant height, LAI and biomass and they are related to
evapotranspiration and water use (Alberto et al., 2011; Cabangon et al., 2004; Tan et al., 2015). Therefore, water
management, nitrogen use efficiency and rice productivity are related issues that should be addressed in an
integrated manner.
The pioneer growers on the agricultural frontier of the Cerrado irrigation plains already are aware of
this. Nitrogen fertilizer consumption rarely meet the crop planning, and additional N topdressing is required
throughout the growing season. The continuous ponding water reduces its productive capacity and increases the
pumping time in the rivers, which does not always have enough water. The result is variable productivities and
economic instability. The management of irrigation and nitrogen is made in trial and error, harvest af ter harvest,

17
and the extension agronomist does not have the answer as well. The solution of how to produce rice in this
productive environment with rational use of water and nitrogen fertilizer is 10 years behind. The goal of this
work was to propose at a field basis, the irrigation regime that provides the highest water use efficiency, nitrogen
use efficiency, and support the highest productivity in weathered tropical lowlands.
References
Aimrun, W., Amin, M.S.M., Eltaib, S.M., 2004. Effective porosity of paddy soils as an estimation of its saturated
hydraulic conductivity. Geoderma 121, 197–203. doi:10.1016/j.geoderma.2003.11.010
Akkal-Corfini, N., Morvan, T., Menasseri-Aubry, S., Bissuel-Bélaygue, C., Poulain, D., Orsini, F., Leterme, P., 2010.
Nitrogen mineralization, plant uptake and nitrate leaching following the incorporation of (15N)-labeled cauliflower
crop residues (Brassica oleracea) into the soil: a 3-year lysimeter study. Plant Soil 328, 17–26. doi:10.1007/s11104-
009-0104-0
Alberto, M.C.R., Wassmann, R., Hirano, T., Miyata, A., Hatano, R., Kumar, A., Padre, A., Amante, M., 2011.
Comparisons of energy balance and evapotranspiration between flooded and aerobic rice fields in the Philippines.
Agric. Water Manag. 98, 1417–1430. doi:10.1016/j.agwat.2011.04.011
Belder, P., Bouman, B.A.M., Spiertz, J.H.J., Peng, S., Castañeda, A.R., Visperas, R.M., 2005a. Crop performance,
nitrogen and water use in flooded and aerobic rice. Plant Soil 273, 167–182. doi:10.1007/s11104-004-7401-4
Belder, P., Spiertz, J.H.J., Bouman, B.A.M., Lu, G., Tuong, T.P., 2005b. Nitrogen economy and water productivity of
lowland rice under water-saving irrigation. F. Crop. Res. 93, 169–185. doi:10.1016/j.fcr.2004.09.022
Borin, J.B.M., Carmona, F. de C., Anghinoni, I., Martins, A.P., Jaeger, I.R., Marcolin, E., Hernandes, G.C., Camargo,
E.S., 2016. Soil solution chemical attributes, rice response and water use efficiency under different flood irrigation
management methods. Agric. Water Manag. 176, 9–17. doi:10.1016/j.agwat.2016.05.021
Bouldin, D., 1986. 1. The chemistry and biology of flooded soils in relation to the nitrogen economy in rice fields.
Fertil. Res. 9, 1–14. doi:10.1007/BF01048693
Bouman, B.A.M., 2016. Does rice really use too much water? [WWW Document]. Bas Bouman’s blog - Glob. Rice
Sci. Partnersh. URL http://irri.org/blogs/bas-bouman-s-blog-global-rice-science-partnership/does-rice-really-
use-too-much-water (accessed 1.1.16).
Bouman, B.A.M., Humphreys, E., Tuong, T.P., Barker, R., 2007. Rice and Water, in: Advances in Agronomy. pp.187–
237. doi:10.1016/S0065-2113(04)92004-4
Bouman, B.A.M., Peng, S., Castañeda, A.R., Visperas, R.M., 2005. Yield and water use of irrigated tropical aerobic rice
systems. Agric. Water Manag. 74, 87–105. doi:10.1016/j.agwat.2004.11.007
Cabangon, R.J., Tuong, T.P., Castillo, E.G., Bao, L.X., Lu, G., Wang, G., Cui, Y., Bouman, B.A.M., Li, Y., Chen, C.,
Wang, J., 2004. Effect of irrigation method and N-fertilizer management on rice yield, water productivity and
nutrient-use efficiencies in typical lowland rice conditions in China. Paddy Water Environ. 2, 195–206.
doi:10.1007/s10333-004-0062-3
Coelho, M.R., Santos, H.G., Oliveira, R.P., Moraes, J.F. V, 2006. Solos, in: Santos, A.B., Stone, L.F., Vieira, N.R.A.
(Eds.), A Cultura Do Arroz No Brasil. Embrapa Arroz e Feijão, Santo Antônio de Goiás, Brazil, p. 161–208.
De Vries, M.E., Rodenburg, J., Bado, B. V., Sow, A., Leffelaar, P.A., Giller, K.E., 2010. Rice production with less
irrigation water is possible in a Sahelian environment. F. Crop. Res. 116, 154–164. doi:10.1016/j.fcr.2009.12.006

18
Dong, N.M., Brandt, K.K., Sørensen, J., Hung, N.N., Hach, C. Van, Tan, P.S., Dalsgaard, T., 2012. Effects of
alternating wetting and drying versus continuous flooding on fertilizer nitrogen fate in rice fields in the Mekong
Delta, Vietnam. Soil Biol. Biochem. 47, 166–174. doi:10.1016/j.soilbio.2011.12.028
Fageria, N.K., Baligar, V.C., 2005. Enhancing Nitrogen Use Efficiency in Crop Plants. Adv. Agron. 88, 97–185.
doi:10.1016/S0065-2113(05)88004-6
Fageria, N.K., Baligar, V.C., 2001. Lowland rice response to nitrogen fertilization. Commun. Soil Sci. Plant Anal. 32,
1405–1429. doi:10.1081/CSS-100104202
Fageria, N.K., Stone, L.F., Santos, A.B., 2003. Manejo da fertilidade do solo para o arroz irrigado. Embrapa - Rice and
Beans Research Center, Santo Antonio de Goias, Brazil.
Foulkes, M.J., Reynolds, M.P., Sylvester-Bradley, R., 2009. Genetic Improvement of Grain Crops, in: Crop Physiology.
Elsevier, pp. 355–385. doi:10.1016/B978-0-12-374431-9.00015-3
Guerra, L.C., Bhuiyan, S.I., Tuong, T.P., Barker, R., 1998. Producing more rice with less water from irrigated systems.
Swim Pap. 5.
IBGE, 2017. Indicadores IBGE - Estatística da Produção Agrícola. The Brazilian Institute of Geography and Statistics.
Kadiyala, M.D.M., Jones, J.W., Mylavarapu, R.S., Li, Y.C., Reddy, M.D., 2015. Identifying irrigation and nitrogen best
management practices for aerobic rice–maize cropping system for semi-arid tropics using CERES-rice and maize
models. Agric. Water Manag. 149, 23–32. doi:10.1016/j.agwat.2014.10.019
Kato, Y., Okami, M., Katsura, K., 2009. Yield potential and water use efficiency of aerobic rice (Oryza sativa L.) in
Japan. F. Crop. Res. 113, 328–334. doi:10.1016/j.fcr.2009.06.010
Linquist, B., Snyder, R., Anderson, F., Espino, L., Inglese, G., Marras, S., Moratiel, R., Mutters, R., Nicolosi, P.,
Rejmanek, H., Russo, A., Shapland, T., Song, Z., Swelam, A., Tindula, G., Hill, J., 2015. Water balances and
evapotranspiration in water- and dry-seeded rice systems. Irrig. Sci. 33, 375–385. doi:10.1007/s00271-015-0474-4
Lu, J., Ookawa, T., Hirasawa, T., 2000. The effects of irrigation regimes on the water use, dry matter production and
physiological responses of paddy rice. Plant Soil 223, 209–218. doi:10.1023/A:1004898504550
Machado, S.L.D.O., Marchezan, E., Righes, A.A., Carlesso, R., Villa, S.C.C., Camargo, E.R., 2006. Consumo de água
e perdas de nutrientes e de sedimentos na água de drenagem inicial do arroz irrigado. Ciência Rural 36, 65–71.
doi:10.1590/S0103-84782006000100010
Maclean, J., Hardy, B., Hettel, G., 2013. Rice Almanac: Source Book for One of the Most Important Economic
Activities on Earth, 4th ed. IRRI, Los Baños, Phillipines.
Martins, A.K.E., 2004. Ipucas in the Araguaia plains, Tocantins state: physical aspects, soil classification and land use
(in portuguese). Viçosa Federal University.
Mosier, A.R., Duxbury, J.M., Freney, J.R., Heinemeyer, O., Minami, K., 1996. Nitrous oxide emissions from agricultural
fields: Assessment, measurement and mitigation. Plant Soil 181, 95–108. doi:10.1007/BF00011296
Pan, J., Liu, Y., Zhong, X., Lampayan, R.M., Singleton, G.R., Huang, N., Liang, K., Peng, B., Tian, K., 2017. Grain
yield, water productivity and nitrogen use efficiency of rice under different water management and fertilizer-N
inputs in South China. Agric. Water Manag. 184, 191–200. doi:10.1016/j.agwat.2017.01.013
Patel, D.P., Das, A., Munda, G.C., Ghosh, P.K., Bordoloi, J.S., Kumar, M., 2010. Evaluation of yield and physiological
attributes of high-yielding rice varieties under aerobic and flood-irrigated management practices in mid-hills
ecosystem. Agric. Water Manag. 97, 1269–1276. doi:10.1016/j.agwat.2010.02.018
Ponnamperuma, F.N., 1972. The Chemistry of Submerged Soils, in: Advances in Agronomy. pp. 29–96.
doi:10.1016/S0065-2113(08)60633-1

19
Powlson, D.S., 1993. Understanding the soil nitrogen cycle. Soil Use Manag. 9, 86–93. doi:10.1111/j.1475-
2743.1993.tb00935.x
Reddy, K.R., Patrick, W.H., Broadbent, F.E., 1984. Nitrogen transformations and loss in flooded soils and sediments.
C R C Crit. Rev. Environ. Control 13, 273–309. doi:10.1080/10643388409381709
Sanchez, P.A., 1976. Properties and Management of Soils in the Tropics, 1st ed. John Wiley & Sons, Inc., Ames, USA.
Sharkey, M., Meierotto, S., FAO, 2016. Rice Market Monitor. Trade Mark. Div. 19, 523–525. doi:10.1002/wsb.724
Sharma, P.K., De Datta, S.K., 1985. Effects of Puddling on Soil Physical Properties and Processes, in: Tout, E.A.
(Ed.), Soil Physics and Rice. International Rice Research Institute, Los Baños, Phillipines, pp. 217–233.
Singh, K.B., Gajri, P.R., Arora, V.K., 2001. Modelling the effects of soil and water management practices on the water
balance and performance of rice. Agric. Water Manag. 49, 77–95. doi:10.1016/S0378-3774(00)00144-X
SOSBAI, 2014. Arroz irrigado: recomendacões técnicas da pesquisa para o Sul do Brasil, in: XXX Reuniao Tecnica da
Cultura Do Arroz Irrigado. Sociedade Sul Brasileira de Arroz Irrigado, Santa Maria, RS, Brazil, p. 192.
Stevens, R.J., Laughlin, R.J., 1998. Measurement of nitrous oxide and di-nitrogen emissions from agricultural soils.
Nutr. Cycl. Agroecosystems 52, 131–139. doi:10.1023/A:1009715807023
Stone, L.F., 2005. Eficiência do uso da água na cultura do arroz irrigado, 1a ed. Brazilian Agricultural Research
Corporation - Embrapa, Santo Antônio de Goiás.
Subbarao, G. V, Ito, O., Sahrawat, K.L., Berry, W.L., Nakahara, K., Ishikawa, T., Watanabe, T., Suenaga, K., Rondon,
M., Rao, I.M., 2006. Scope and Strategies for Regulation of Nitrification in Agricultural Systems— Challenges and
Opportunities. CRC. Crit. Rev. Plant Sci. 25, 303–335. doi:10.1080/07352680600794232
Tan, X., Shao, D., Gu, W., Liu, H., 2015. Field analysis of water and nitrogen fate in lowland paddy fields under
different water managements using HYDRUS-1D. Agric. Water Manag. 150, 67–80.
doi:10.1016/j.agwat.2014.12.005
Thomson, K.J., 2003. World agriculture: towards 2015/2030: an FAO perspective. Land use policy 20, 375.
doi:10.1016/S0264-8377(03)00047-4
Tomasella, J., Hodnett, M.G., Rossato, L., 2000. Pedotransfer Functions for the Estimation of Soil Water Retention
in Brazilian Soils. Soil Sci. Soc. Am. J. 64, 327. doi:10.2136/sssaj2000.641327x
Tuong, P., Bouman, B. a. M., Mortimer, M., 2005. More Rice, Less Water—Integrated Approaches for Increasing
Water Productivity in Irrigated Rice-Based Systems in Asia. Plant Prod. Sci. 8, 231–241. doi:10.1626/pps.8.231
Van Cleemput, O., Boeckx, P., Lindgren, P.E., Tonderski, K., 2007. Denitrification in Wetlands, Biology of the
Nitrogen Cycle. Elsevier B.V. doi:10.1016/B978-044452857-5.50024-2
Wang, Z., Zhang, W., Beebout, S.S., Zhang, H., Liu, L., Yang, J., Zhang, J., 2016. Grain yield, water and nitrogen use
efficiencies of rice as influenced by irrigation regimes and their interaction with nitrogen rates. F. Crop. Res. 193,
54–69. doi:10.1016/j.fcr.2016.03.006
Wickham, T.H., Singh, V.P., 1978. Water movement through wet soils, in: IRRI (Ed.), Soils & Rice. International Rice
Research Institute (IRRI), Los Baños, Phillipines, pp. 337–358.
Yao, F., Huang, J., Cui, K., Nie, L., Xiang, J., Liu, X., Wu, W., Chen, M., Peng, S., 2012. Agronomic performance of
high-yielding rice variety grown under alternate wetting and drying irrigation. F. Crop. Res. 126, 16–22.
doi:10.1016/j.fcr.2011.09.018
Ye, Y., Liang, X., Chen, Y., Liu, J., Gu, J., Guo, R., Li, L., 2013. Alternate wetting and drying irrigation and controlled-
release nitrogen fertilizer in late-season rice. Effects on dry matter accumulation, yield, water and nitrogen use. F.
Crop. Res. 144, 212–224. doi:10.1016/j.fcr.2012.12.003

20
Zhou, S., Sugawara, S., Riya, S., Sagehashi, M., Toyota, K., Terada, A., Hosomi, M., 2011. Effect of infiltration rate on
nitrogen dynamics in paddy soil after high-load nitrogen application containing 15N tracer. Ecol. Eng. 37, 685–
692. doi:10.1016/j.ecoleng.2010.04.03

21
2. NON-FLOODING REGIME IMPROVES RICE YIELD AND WATER USE EFFICIENCY
IN LOWLAND TROPICAL ENVIRONMENT
Abstract
World rice production is facing the challenge of produce more grains with less water input. Due that water saving irrigation regimes are being proposed along different regions. However, a promising new agroecosystem in tropical weathered lowland, which has fare distinct soil properties from those in traditional grown regions, still have the most adequate irrigation regimes (IR) and Nitrogen management unknown. A three-year field experiment was done in a lowland Plinthaquults in order to investigate crop performance, water use efficiency (WUE) and nitrogen efficiency in 5 IR: alternate wet and dry in short cycle (AWDS); alternate wet and dry in long cycle (AWDL); Continuous flooding (CF); Non-flooding aerobic (NF); saturated soil without ponding water (SS). The experimental design was split-plot with IR in main plot and nitrogen fertilizer (0 and 150 kg ha-1 of N) in subplot. Crop performance was affected by IR and N level. In the average of three years Nitrogen uptake (NU) at 150 kg ha-1 of N fertilizer was 32% higher in NF than any other IR. Grain yield (GY) across N level was 7.2, 8.8 and 7.5 Mg ha-1 in NF and in CF were 5.6, 8.2 and 6.9 Mg ha-1 respectively in 2014, 2015 and 2016. The isotopic efficiency of N fertilizer showed total recovery of 81.5 % of 15N in NF and 62, 61, 56, 56% in SS, AWDS, AWDL, CF respectively. The WUE of water input was three-fold lower than WUE of evapotranspiration. WUE of input water was 0.7 grain m-3 in NF, and 0.47, 0.40, 0.35 and 0.32 grain m-3 in SS, CF, AWDS, AWDL and CF. This research shows for such environment, as long there is no drought stress, rice performs better and has higher efficiency of water and N use when cultivated in non-flooding irrigation regime
Keywords: Nitrogen; Isotopic recovery; Apparent use efficiency; Evapotranspiration; Ultisol
2.1. Introduction
Rice (Oryza sativa) has an important role to provide affordable carbohydrate for a fast-growing world
population in the coming decades (Maclean et al., 2013). By 2050 rice production is expected to increase by 20%
to meet the world demand, as well as avoid price spikes and social negative impacts (Sharkey et al., 2016;
Thomson, 2003).
To meet such a high demand, productivity must increase in the current cropland, as well as expand to
new areas suitable to grow rice. Despite the potential for rice growth in under developed regions such as South
America and West Africa (Balasubramanian et al., 2007; Coelho et al., 2006; Guerra et al., 1998), lack of irrigation
water is often the primary limitation in these places. Yet, even in regions where water is available there is
increasing pressure to demonstrate efficient use of water resources, thus highlighting the need to continually
develop new agronomic practices to improve crop production in an increasingly resource limited world.
One approach for water saving is to develop alternative irrigation strategies that can reduce water use,
but maintain minimal effect on crop yield (Bouman et al., 2007). Some alternative irrigation strategies for rice
production in tropical regions include: a) aerobic rice in which fields are not flooded and soil is kept unsaturated
throughout most of the season, usually being rain fed or sprinkler-irrigated (Alberto et al., 2011; Belder et al.,
2005a; Bouman et al., 2005; M. D. M. Kadiyala et al., 2015; Lampayan et al., 2010); b) alternate wetting and drying,
in which the crop is subjected to intermittent periods of flooding and drying (Awio et al., 2015; Belder et al.,
2005b; de Vries et al., 2010; Dong et al., 2012); and c) saturated soil systems where soil pores are kept

22
saturated, but without ponding water (Bouman et al., 2007; Bouman and Tuong, 2001; Lu et al., 2000). All these
strategies resulted in increased water use efficiency (WUE), but yields were often impaired. Therefore, to achieve
maximum rice yields in the diversity of tropical environments, onsite soil properties must be understood to
propose an efficient water management strategy that maintains crop performance.
In Brazil, one of the most promising regions for rice cropland to expand is mostly settled on alluvial
soils with high hydraulic conductivity, very stable micro-structure, clay fraction rich in Fe-Al oxides and kaolinite,
low CEC and pH, and highs contents of Al. (Buol et al., 2011; Sanchez, 1976). The upper horizons of these soils
have a very stable micro-structure that does not disperse when subjected to tillage, and due to the lack of 2:1
clays, is relatively ineffective for puddling (Balasubramanian et al., 2007; Sharma and De Datta, 1985; Stone,
2005). Such features evidence the stark contrast of these soils relative to common expected characteristics for
rice production. According to Bouldin (1986), an ideal lowland soil for rice production presents a high-density
layer at a depth of few centimeters that restricts the percolation of water. Additionally, there is homogenous soil
bulk for uniform root development and nitrogen stabilization in the form of ammonium.
Nitrogen is the most essential nutrient in rice production, and irrigation management directly affects
its availability for rice uptake and loss pathways (Fageria and Baligar, 2005). Under continuous flooding the soil
remains in a reduced anaerobic state and ammonium nitrification is restricted to a few oxidation sites, thus
becoming negligible (Reddy et al., 1984; Van Cleemput et al., 2007). However, varying water regimes or high
percolation rates can trigger nitrification and expose N to loss pathways such denitrification and leaching (Aulakh
and Bijay-Singh, 1996; Bouldin, 1986). Therefore, any water management strategy in lowland rice must take in to
account N loss pathways in soil to avoid decreased availability for crop uptake and increased losses to
environment. This study evaluated grain yield, crop growth, water use efficiency, and nitrogen use efficiency of
lowland rice subjected to varying irrigation and nitrogen regimes in a tropical weathered plain of central Brazil.
2.2. Material and Methods
2.2.1. Site Description
On farm experiments were established the region of Lagoa da Confusão, State of Tocantins, in
Northern Brazil (10°46'39.80"S; 49°55'20.94"W and 190 m ASL) during the rainy summer seasons of 2014, 2015
and 2016. The local climate is classified as Awi – Tropical wet and dry climate (Koeppen) - with average rainfall
of 1800 mm, mostly from September to May and average temperature of 26.7. Figure 1 shows rainfall and daily
temperature for the three-year period of this study.
The soil is classified as a Plinthaquults (US Taxonomy) with a Plinthic horizon within 60 cm of depth
which has limited water percolation, without an impermeable layer. The physiochemical properties are shown in
Table 1. The saturated theta (s) at 0-0.1m depth was 0.606 and 0.639 cm3 cm-3, in 2015 and 2014/2016 sites,
respectively. And s to B plinthic (0.6 m and bellow) was 0.485 and 0.458, in 2015 and 2014/2016, respectively.
The macro, meso and micro porous size distribution for A horizon are 45%, 15%, 39% and in B plinthic are:
31.9%, 4.5%, 63.6%, respectively.
Table 1. Chemical and physical properties of field experiment soil, Plinthaquults. Values describes 0-15 cm depth
23
pH Organic Matter
P S K Ca Mg Al H CEC Clay Silt Sand Ki1 Bulk
Density
Year g dm-3 -mg dm-3- ---------mmolc dm-3--------- ---- (%) ----- g cm-3
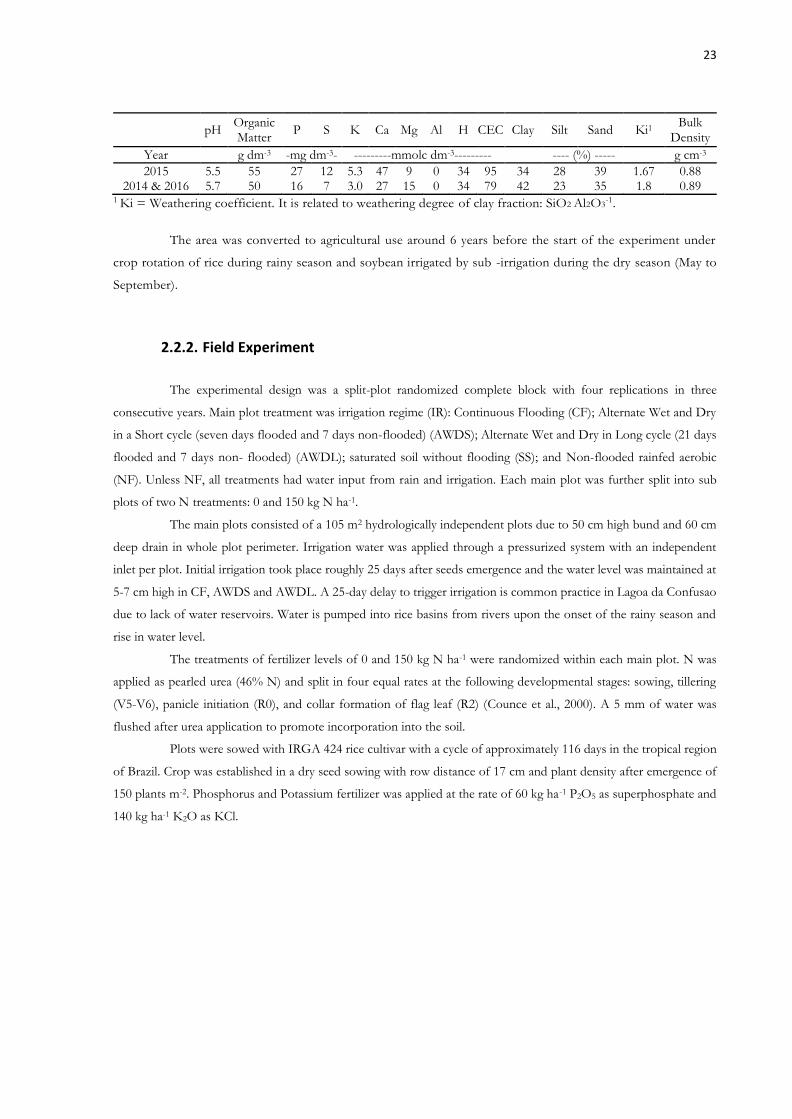
2015 5.5 55 27 12 5.3 47 9 0 34 95 34 28 39 1.67 0.88 2014 & 2016 5.7 50 16 7 3.0 27 15 0 34 79 42 23 35 1.8 0.89
1 Ki = Weathering coefficient. It is related to weathering degree of clay fraction: SiO2 Al2O3-1.
The area was converted to agricultural use around 6 years before the start of the experiment under
crop rotation of rice during rainy season and soybean irrigated by sub -irrigation during the dry season (May to
September).
2.2.2. Field Experiment
The experimental design was a split-plot randomized complete block with four replications in three
consecutive years. Main plot treatment was irrigation regime (IR): Continuous Flooding (CF); Alternate Wet and Dry
in a Short cycle (seven days flooded and 7 days non-flooded) (AWDS); Alternate Wet and Dry in Long cycle (21 days
flooded and 7 days non- flooded) (AWDL); saturated soil without flooding (SS); and Non-flooded rainfed aerobic
(NF). Unless NF, all treatments had water input from rain and irrigation. Each main plot was further split into sub
plots of two N treatments: 0 and 150 kg N ha-1.
The main plots consisted of a 105 m2 hydrologically independent plots due to 50 cm high bund and 60 cm
deep drain in whole plot perimeter. Irrigation water was applied through a pressurized system with an independent
inlet per plot. Initial irrigation took place roughly 25 days after seeds emergence and the water level was maintained at
5-7 cm high in CF, AWDS and AWDL. A 25-day delay to trigger irrigation is common practice in Lagoa da Confusao
due to lack of water reservoirs. Water is pumped into rice basins from rivers upon the onset of the rainy season and
rise in water level.
The treatments of fertilizer levels of 0 and 150 kg N ha-1 were randomized within each main plot. N was
applied as pearled urea (46% N) and split in four equal rates at the following developmental stages: sowing, tillering
(V5-V6), panicle initiation (R0), and collar formation of flag leaf (R2) (Counce et al., 2000). A 5 mm of water was
flushed after urea application to promote incorporation into the soil.
Plots were sowed with IRGA 424 rice cultivar with a cycle of approximately 116 days in the tropical region
of Brazil. Crop was established in a dry seed sowing with row distance of 17 cm and plant density after emergence of
150 plants m-2. Phosphorus and Potassium fertilizer was applied at the rate of 60 kg ha-1 P2O5 as superphosphate and
140 kg ha-1 K2O as KCl.

24
Figure 1. Mean daily temperature and rainfall along the years of field measurements. Black bars refer to rainfall, and gray line to temperature. Vertical red lines indicate the sowing date in the 3 years: 12/07/2013; 11/18/2014; 12/09/2015.
2.2.3. Crop Performance
Crop above ground biomass (AGB) and nitrogen content were determined by destructively sampling
rice plants from 0.5 m2 at physiological maturity. Plants were cut at stem base and chopped green. A representative
subsample was dried to constant weight in 65 C oven and water content was extrapolated for the entire sample.
Nitrogen concentration was determined by Kjeldahl method after acid digestion and total nitrogen uptake (NU)
was calculated as the product of N content (g kg-1) and plant biomass (g m-2).
Also at physiological maturity, five plants per plot were randomly sampled to determine spikelet
number (NS) and thousand grain weight. Grains were manually detached, from rachis and weighed. Filled and
unfilled grains were separated by air blowing, counted and reweighed. Grain yield (GY) was determined by
collecting 3 m2 of rice plants at 19-23% of field moisture and grains were separated from plants using an
experimental mechanical thresher (SB Maquinas, Cambé, PR). Impurities were separated in a sample cleaner
(Mediza, Panambi, RS) and moisture corrected to 13% in unhusked grains.
2.2.4. Isotopic Nitrogen Use Efficiency
The Isotopic efficiency was performed only in 2015 and 2016 years. Labeled 15N nitrogen was applied
to microplots settled inside the 150 kg ha-1 N subplot following this same equivalent dose and topdress splitting
performed on the subplot. Microplots were 0.245 m2 and comprised of 4 sowing rows. Nitrogen was applied as
0
20
40
60
80
100
120
140
20
22
24
26
28
30
32
34
6/1/13 9/1/13 12/1/13 3/1/14 6/1/14 9/1/14 12/1/14 3/1/15 6/1/15 9/1/15 12/1/15 3/1/16
Rain
fall
(m
m)
Ava
reg
e D
ail
y T
em
pera
ture
(∘C
)
3rd year2nd year1st year
25
urea with abundance of 3.04 % 15N. Microplots were isolated by a metal frame with bottom and top free, 12 cm
above and 18 cm deep into the soil. 15N-enriched fertilizer was diluted in 2.5 l of water and immediately applied
uniformly onto the microplots with a sprinkling can. Water regime inside microplots was the same for each main
plot and had an independent water inlet to avoid 14N/ 15N contamination. Topdressing was applied on dry soil
and flooded shortly thereafter, thus allowing urea incorporation in the soil and making the volatilization losses
negligible.
At physiological maturity, 0.68 m2 of above ground biomass was sampled from two central rows of
each microplot. Each plant was cut at the stem and separated in to two groups: vegetative (leaves and stems) and
reproductive (panicle). Roots were sampled from a cube of soil measuring 0.34 x 0.2 x 0.2 m, and root separation
from soil was made by water sieving. Biomass material was dried at 65 C oven to constant weight.
A soil core of 0.05 m diameter was sampled using a Dutch auger for remaining nitrogen analysis in soil
from 0 to 1 m depth, and divided in sections of 20 cm representing the soil layers. Soil samples were oven dried
at 40C to constant weight.
The total amount of N and 15N abundance (% 15N atoms) was performed in an automated mass
spectrometer coupled to an ANCA-GSL N analyzer (Sercon Co., UK). The total N concentrations and 15N/14N
isotope ratio were calculated according to Barrie and Prosser (1996) and dilution calculation adapted from
Cabrera and Kissel (1989).
𝑁𝐷𝐹𝐹 = (15Np − 15Nn)
(15Nf − 15Nn) 𝑥 𝑁𝑢 eq. (1)
where NDFF is the amount of N in the plant derived from the fertilizer (kg ha−1), 15 Np is the amount
of 15N in plants (% atoms), 15Nn is the natural 15N abundance (% atoms), 15Nf is the quantity of 15N in the
fertilizer (3.04 % atoms) and Nu is the N uptake from the plant (kg ha−1). The Isotope Nitrogen Use efficiency
was calculated using equation 2:
𝐼𝑁𝑈𝐸 = 𝑁𝐷𝐹𝐹
𝑁 𝑟𝑎𝑡𝑒 𝑥 100 eq. (2)
where INUE is the ratio of N recovery by the plant from the fertilizer. And N rate is nitrogen applied
as urea to the crop (150 kg ha-1).
2.2.5. Nitrogen Use Efficiency Indexes
The Apparent Nitrogen Use Efficiency (ANUE, kg of grain kg N applied−1) is the unit of yield
increasing due unit of N fertilizer applied. It is calculated as the yield difference divided by nitrogen rate applied
as fertilizer (Cassman et al., 1996).
𝐴𝑁𝑈𝐸 = (𝐺𝑌 𝑓𝑒𝑟𝑡 −𝐺𝑌 𝑢𝑛𝑓𝑒𝑟𝑡)
𝑁 𝑎𝑝𝑝𝑙𝑖𝑒𝑑 eq. (3)
The N partial factor productivity (PPF, kg kg−1) was also used because it describes in an integrate way
the efficiency of fertilizer input and indigenous soil nutrient (Cassman et al., 1996; Ciampitti and Vyn, 2012). It
is the ratio between grain yield in fertilizer plot (GY fert) divided by nitrogen rate applied as fertilizer
𝑃𝐹𝑃 = 𝐺𝑌 𝑓𝑒𝑟𝑡
𝑁 𝑎𝑝𝑝𝑙𝑖𝑒𝑑 eq. (4)
The last N efficiency parameter used was the apparent N fertilizer recovery efficiency (ANR, kg of N
uptake kg N applied−1), which is defined as the difference of N uptake in plant biomass among fertilized and
unfertilized plots divided by N applied (Ciampitti and Vyn, 2012).
26
𝐴𝑁𝑅 = (𝑁 𝑢𝑝𝑡𝑎𝑘𝑒 𝑓𝑒𝑟𝑡− 𝑁 𝑢𝑝𝑡𝑎𝑘𝑒 𝑢𝑛𝑓𝑒𝑟𝑡)
𝑁 𝑎𝑝𝑝𝑙𝑖𝑒𝑑 eq. (5)
For all indexes, the grain yield is in 13% moisture basis, N uptake is the amount of N in above ground
biomass at physiological maturity and N applied is 150 kg ha-1 of Nitrogen.
2.2.6. Evapotranspiration and water measurements
Rainfall, radiation, air humidity and temperature data was measured hourly by a weather station (Davis
Vantage Pro2, Davis, Inc., USA). Amount of irrigation water input (WI) was monitored by flow hydrometer installed
in all water inlets. Fields were not drained, unless by percolation into soil profile. The soil volumetric water content
was measured by dielectric conductivity probe (GS1 - Decagon, WA, USA) in a 3-15 cm depth and recorded every 30
minutes for two replicate blocks.
To express soil water content as water tension, a soil water retention curve was built from undisturbed
samples collected from 0-0.1 m from 2015 and 2016/2014 experimental sites. Samples were submitted to pressures of
-2, -4, -6, -8, -10, -30, -50, -70, -100 and -1500 kPa using the Richards pressure plate extractors. A soil water retention
curve was established by fitting the pressure and theta values to van Genuchten model and parameters were estimated
using RETC software (Van Genuchten et al., 1991). The RETC also estimated Ksat of top (0-10) and in the less
impermeable layer (60-80) being 1.35 and 0.16 m d-1, respectively.
The leaf area index (LAI) and the light extinction coefficient was indirectly determined with optical
hemisphere sensor (LI-cor 2200, Li-cor, Inc., USA). Measurements began 15 days after emergence and were repeated
every 15 days, thereafter LAI was sampled on 7 dates each season. All data collection occurred at approximately 09:00
am hours or on cloudy days. One reading was taken over the canopy and 5 readings at soil (or water) surface. Crop
height was measured at time of LAI sampling as distance from soil surface to last opened leaf.
Evapotranspiration (ETC) was estimated by the Penman–Monteith equation, using the measured crop
parameters. Zero plane displacement (d) and roughness length for momentum (Zom) and vapor (Zoh) were estimated
based on crop height (Allen, 1998). Crop surface resistance (rs) was assumed as 80 sm-1of (rl) (Dingkuhn et al., 1999;
Turner et al., 1986). The partioning of transpiration and evaporation was done according to Bouguer-Lambert law,
which partitions radiation intercepted by crop canopy or soil surface (Van Laar et al., 1997):
𝑇 = 𝐸𝑇𝐶 (1 − 𝑒(−𝑘𝐿𝐴𝐼)) eq. (6)
𝐸 = 𝐸𝑇𝐶 𝑒(−𝐾𝐿𝐴𝐼) eq. (7)
where k is extinction coefficient (assumed as 0.5 based on average of measured data). For CF, SS, and
AWDS, AWDL during flooding time there was no water shortage, thus ET actual always met the ETC. For NF and
AWDS, AWDL during non-flooding periods and no-rainy days, the actual soil evaporation was assumed to drop
proportionally to square root of drying time as predicted by Ritchie (1972).
Water use efficiency was calculated in relation to ET (WUEET) and water input (WUEIn) as the ratio of dry
grain mass per unit of water evapotranspiration (WUEET, kg m-3), and yield divided by irrigation (I) + rainfall (R)
(WUEIn, kg m-3), respectively. The water application efficiency (EA) (Bouman et al., 2005) is
𝐸𝐴 = 100 𝑥 Σ(𝑇+𝐸)
Σ(𝐼+𝑅) eq. (8)

27
2.2.7. Statistical Analysis
The dataset was submitted to statistical procedures using Statistical Analysis System, version 9.2 (SAS
Institute, 2009). The assumptions of homogeneity of variance and error normality were tested by PROC
TRANSREG Boxcox statement. If assumptions were violated, the variable was transformed by convenient
lambda. ANOVA was performed by PROC GLM based on irrigation, N level, and year as well as its interactions
as fixed effect model. Replicates were considered random effects to main plot and (replicate x main plot) as the
random effect for subplot. When F probability was <0,05 the means were separated by Least Significance
Difference (LSD).
2.3. Results
2.3.1. Weather data
Rainfall patterns varied significantly across growing seasons. Rainfall during the rice growing season
was 886, 1262, and 1064 mm during the 2014, 2015 and 2016 season, respectively (Table 2) . Mean temperatures
across all seasons was 25.8C and only varied 1.3C between 2014 and 2016. In 2016, mean temperature was 1.4
and 1.5 C warmer at panicle initiation and grain filling compared to 2015.
Table 2. Rainfall and temperature per growing season during rice development in 2014, 2015 and 2016.
Rainfall (mm) Average Temperature (C)
Year Vegetative R0-R4 R5-R9 Total Vegetative R0-R4 R5-R9 Total
2014 354 358 174 886 24.8 25.1 25.9 25.3 2015 513 230 519 1262 25.8 25.3 25.4 25.5 2016 823 75 166 1064 25.8 27.2 26.8 26.6
2.3.2. Soil Water Potential in Root Zone
Differences in root zone soil water potential were observed due to differences in rainfall patterns
between 2015 and 2016 (Figure 2). In 2015, rains began in November and were greater in volume thus providing
adequate water replenishment to the soil before crop sowing. However, in 2016, there was a lack of water
accumulation and the rice was established with lower water availability in soil. Thus, in 2015 the crop was
submitted to a minimum water tension of only -70 kPa in the soil before onset of irrigation (22 DAE). However,
in 2016, the tension reached approximately -950 kPa around 15-20 DAE. As a result, leaf curling occurred and
crop development was delayed.
After the initiation of the irrigation treatments, soil water potential in CF remained zero kPa and in SS
at zero or slightly below that (at least 96% of the maximum theta or -5kPa of tension). As expected, no restrictions
were placed on rice development by these irrigation regimes. The AWDS and AWDL had a greater amplitude of
water potential, beginning at zero in the flooding cycles and reaching a minimum of -21kPa and -34kPa in the
drying cycles of 2015 and 2016 respectively. The lowest soil water potential was achieved by NF short after PI
in 2015 (-35kPa) and flowering in 2016 (-58kPa). These negative thresholds were maintained at most for three
28
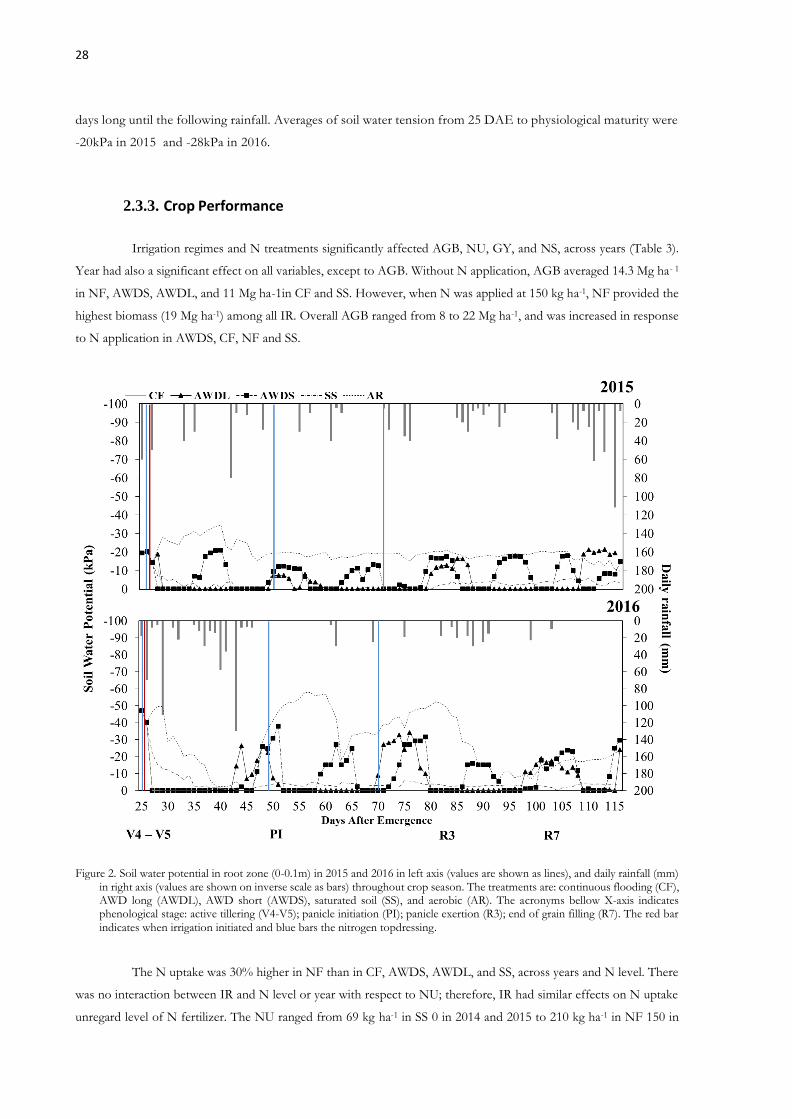
days long until the following rainfall. Averages of soil water tension from 25 DAE to physiological maturity were
-20kPa in 2015 and -28kPa in 2016.
2.3.3. Crop Performance
Irrigation regimes and N treatments significantly affected AGB, NU, GY, and NS, across years (Table 3).
Year had also a significant effect on all variables, except to AGB. Without N application, AGB averaged 14.3 Mg ha- 1
in NF, AWDS, AWDL, and 11 Mg ha-1in CF and SS. However, when N was applied at 150 kg ha-1, NF provided the
highest biomass (19 Mg ha-1) among all IR. Overall AGB ranged from 8 to 22 Mg ha-1, and was increased in response
to N application in AWDS, CF, NF and SS.
Figure 2. Soil water potential in root zone (0-0.1m) in 2015 and 2016 in left axis (values are shown as lines), and daily rainfall (mm) in right axis (values are shown on inverse scale as bars) throughout crop season. The treatments are: continuous flooding (CF), AWD long (AWDL), AWD short (AWDS), saturated soil (SS), and aerobic (AR). The acronyms bellow X-axis indicates phenological stage: active tillering (V4-V5); panicle initiation (PI); panicle exertion (R3); end of grain filling (R7). The red bar
indicates when irrigation initiated and blue bars the nitrogen topdressing.
The N uptake was 30% higher in NF than in CF, AWDS, AWDL, and SS, across years and N level. There
was no interaction between IR and N level or year with respect to NU; therefore, IR had similar effects on N uptake
unregard level of N fertilizer. The NU ranged from 69 kg ha-1 in SS 0 in 2014 and 2015 to 210 kg ha-1 in NF 150 in

29
2015. The N application increased N uptake by 60 kg ha-1 across IR and years, and N uptake was higher in 2015 than
in 2014 and 2016.
The NS per panicle followed the same trend as that for N uptake. NF had 11% higher NS per panicle than
any other IR, averaging across years and N levels 105 spikelets. The N fertilizer applying resulted in an increase of 16%
in NS, and the corresponding value was higher in 2015 than in 2014 and 2016. The interaction between N level and
year significantly affected the spikelet number per panicle, which was 46% higher in 2016 than in 2014 and 2015. Grain
weight was only significantly affected by year, being 1.92 g heavier in 2016 than in 2015, being unaffected by IR and
N level.
30
Table 3. Above Ground Biomass (AGB), Total N uptake at crop maturity (NU), number of Spikelet per panicle (NS) and 1000 grains weight during 2014, 2015 and 2016. The irrigation regimes are: alternate wetting drying short (AWDS), alternate wetting and drying long (AWDL), continuous flooding (CF), non-flooding (NF), and saturated soil (SS) and each of them with 0 and 150 kg ha-1 of Nitrogen.
Plant Biomass (Mg ha-1)
N uptake (Kg ha-1)
Spikelet (panicle-1)
Grain Weight (g)
Grain Yield (Mg ha-1)
N level 0 150 mean 0 150 mean 0 150 mean 0 150 mean 0 150 mean
Year / Irrigation
2014
AWDS 15 15 15b 91 111 101 79 94 87 - - - 5.1 7.8 6.4b
AWDL 13 15 14a 89 113 101 75 86 80 - - - 5.5 7.7 6.6b
CF 9 14 12c 75 122 98 72 92 82 - - - 4.1 7.1 5.6b
NF 16 22 19a 120 195 158 93 112 103 - - - 6.0 8.3 7.2a
SS 8 15 12b 69 119 94 78 101 89 - - - 5.0 7.3 6.2b
mean 12 16 14 88 133 111B 79A 97B 88 - - - 5.1B 7.6A 6.4
2015
AWDS 15 19 17a 88 162 125 92 107 100 25 25 25 5.9 10.5 8.2 b
AWDL 14 15 15a 96 139 118 100 110 105 25 25 25 6.2 8.9 7.5 c
CF 12 16 14a 83 153 118 103 110 106 25 25 25 6.0 10.5 8.2 b
NF 14 19 17a 116 210 163 107 109 108 26 26 26 7.1 10.6 8.8 a
SS 9 19 14a 69 149 109 93 103 98 25 26 26 5.8 9.7 7.8 b
mean 13 18 15 90 163 127A 98A 107B 103 25 25 25b 6.2B 10A 8.1
2016
AWDS 11 16 13a 75 127 101 75 104 89 27 27 27 5.0 7.9 6.5 b
AWDL 14 16 15a 63 128 96 79 106 93 28 27 28 5.4 8.3 6.9ab
CF 15 15 15a 105 140 123 88 103 95 27 27 27 5.4 8.4 6.9ab
NF 14 17 16a 118 195 157 98 112 105 28 27 27 6.4 8.5 7.5 a
SS 11 16 13a 67 133 100 75 98 86 27 27 27 5.6 7.7 6.7 b
mean 13 16 14 85 145 115B 83B 105A 94 27 27 27a 5.6B 8.2A 6.9
Across Years
AWDS 14abB 17bA 85 133 115b 82 102 92 b 26 26 26 5.3 8.7 7.2
AWDL 14abA 16bA 83 127 110b 84 101 92 b 27 26 26 5.7 8.2 6.9
CF 12bB 15bA 88 138 120b 87 102 93 a 26 26 26 5.1 8.7 7.0
NF 15aB 19aA 118 200 168a 100 111 105 a 27 26 27 6.5 9.2 7.9
SS 10cB 16bA 68 134 107b 82 101 91 b 26 26 26 5.5 8.2 6.9
mean 87B 147A 26 26
ANOVA
Irrigation (I)
* * * ns **
N level (N) ** ** ** ns ** Year (Y) ns * ** ** ** I*N ** ns ns ns ns I *Y * ns ns ns * N*Y ns ns ** ns ** I*N*Y ns ns ns ns ns CV (%) 21.52 25.76 11.14 2.12 9.17
ns: not significant, * significant at 5%, ** significant at less than 1% of probability of error by F test. Values followed by the same letter are not significantly different by LSD test at p< 0.05 Lower-case compares among rows in the same year and upper-case compares among columns.
31
The grain yield ranged from 4.1 to 10.6 Mg ha-1 and was affected by IR, N level, and year. NF showed
the highest grain yield across unfertilized and fertilized plots in 2014 (7.2 Mg ha -1) and 2015 (8.8 Mg ha-1). In
2016, although NF presented the highest yield (7.5 Mg ha -1), it was not significantly higher than the yield in
AWDL (6.9 Mg ha-1) and CF (6.9 Mg ha-1). N application showed the same effect on crop yield regardless of
irrigation regime. An interaction between year and N level was observed because in 2015, yield increment due
to N application was on average 34% higher than in 2014 and 2016.
2.3.4. Isotopic Nitrogen Efficiency
The total plant recovery of isotopic 15N ranged from 37.8 to 65.1% across IR and year (Table 4). NF had
the highest N-fertilizer uptake (64.7%), followed by that in AWDS, AWDL, CF, and SS, which averaged 47.3%.
With respect to plant partitioning, IR did not affect grain and root recovery. However, shoot recovery was
significantly higher in NF than others (average value decreased in the order: CF >AWDS > AWDL). SS had the
lowest shoot recovery across years. Grain, shoot, and root recovery, plant biomass, 0-20 cm soil layer recovery, and
total soil recovery were affected by year; however, no interaction between year and irrigation was observed.
The 15N recovery from the 0-20 cm soil layer was 15.9% in NF and 13.7% in SS across years, followed
by the values in AWDS, AWDL, and CF. It was 45% higher in NF than in AWDL and CF. The 15N recovery
from the 20-40 and 40-60 cm soil layers was not affected by irrigation, and 1.54% and 0.47% labeled fertilizer
was detected in the 20-40 and 40-60 cm layers, respectively, across years. Because the 15N content in the 40-60
cm layer was close to the detection threshold of the method used, deeper layers were assumed to contain
negligible amounts of 15N.
For total recovery, which is the sum of recovery from all plant parts and soil layers, NF showed the
highest value with 81.5% of labeled N. The results indicate that a 19% N-fertilizer loss occurred in NF via
unidentified means, whereas an average loss of 41% occurred in AWDS, AWDL, CF, and SS. There was no
difference in total labeled fertilizer recovery between 2015 and 2016 because N recovery in plant was
complementary to N recovery in soil. That is, in 2015 the plant recovery was high and less 15N was left in the
soil. In 2016, as the crop development was limited due climatic conditions 15N recovery in plant biomass and
higher amount of 15N was left into the soil, therefore an equivalent proportion of N was not recovered in both
years.
2.3.5. Nitrogen Indices
Apparent N recovery (ANR), agronomic N use efficiency (ANUE), and partial factor productivity
(PFP) were affected by IR and year (Table 5). The year 2015 provided better climatic conditions for rice
development and showed higher ANUE and PFP than did 2014 and 2016. ANR in 2015 was higher than that in
2014 but equal to that in 2016. ANUE ranged from 14 to 30 kg kg-1 N and its average across years in CF and
AWDS (23.6 kg kg-1 N) was higher than that in AWDL, SS, and NF. The ANR ranged from 0.19 to 0.61 kg kg -1
N and its average across years in NF and SS was 0.57 and 0.44 kg kg-1, respectively. AWDL, AWDS, CF and SS
averaged 0.35 kg kg-1. The PFP was higher in NF (61 kg kg-1 N) than in AWDL and SS (55.4 and 54.9 kg kg-1 N,
respectively), CF and AWDS were equivalent to all IR across years. Notably, the average ANR and ANUE in NF

32
and SS were higher and lower, respectively, than in other irrigation regimes, whereas the ANR and ANUE values
in CF showed the opposite trend.
Table 4. Alternate wetting drying short (AWDS), alternate wetting and drying long (AWDL), continuous flooding (CF), non-flooding (NF), and saturated soil (SS) in 2015 e 2016. The N rate was 150 kg ha-1.
Plant Recovery Soil Recovery Total
Recovery Grain Shoot Root Total Plant 0-20 cm 20-40 cm 40-60 cm Total soil
(%) (%) (%) (%) (%) (%) (%) (%) (%)
Year / Irrigation
2015
AWDS 35.9 13.7 0.41 50.0 8.5 1.7 na 10.3 60.3
AWDL 41.7 13.5 0.30 55.5 2.7 0.2 na 2.9 58.4
CF 37.0 14.0 0.30 51.3 7.3 0.7 na 7.9 58.0
NF 39.1 24.8 0.35 64.3 11.5 1.1 na 12.6 76.8
SS 38.6 9.7 0.26 48.6 12.6 0.4 na 12.6 61.2
mean 38.5 a 15.2 b 0.32 b 53.8 a 8.91 b 0.81 - 9.3 b 63.0
2016
AWDS 28.5 17.3 0.85 46.7 14.6 1.6 0.46 16.9 61.3
AWDL 20.5 16.4 0.88 37.8 14.6 0.7 0.18 15.4 53.2
CF 21.4 20.8 0.86 43.0 9.9 1.2 0.50 11.7 54.7
NF 32.6 31.3 1.17 65.1 20.4 1.0 0.63 22.0 87.1
SS 28.2 15.7 0.92 44.8 14.8 2.3 0.55 17.7 62.5
mean 26.2 b 20.3 a 0.94 a 47.5 b 14.91 a 1.54 0.46 17.9 a 65.0
Across Years
AWDS 32.2 15.5 bc 0.63 48.3 b 11.1 bc 1.7 0.46 13.1 ab 60.7 b
AWDL 31.1 14.9 bc 0.59 46.6 b 8.6 c 0.4 0.18 9.2 c 55.8 b
CF 29.2 17.4 b 0.58 47.1 b 8.8 c 0.9 0.50 10.3 bc 56.3 b
NF 35.9 28.0 a 0.76 64.7 a 15.9 a 1.52 0.63 16.8 a 81.5 a
SS 33.4 12.7 c 0.59 46.7 b 13.7 ab 1.3 0.60 15.6 a 62.0 b
ANOVA
irrigation (I) ns ** ns ** * ns ns * ** Year (Y) ** ** ** * ** ns - * ns I *Y ns ns ns ns ns ns - ns ns CV (%) 17.4 18.9 42.3 15.9 29.3 80.0 58.2 26.0 15.6
ns: not significant, * significant at 5%, ** significant at less than 1% of probability of error by F test. Values followed by the same letter are not significantly different by LSD test at p < 0.05. na: data not available.
2.3.1. Evapotranspiration and water measurements
ET among IR and N rates varied from 496 to 566 mm in 2015 and 491 to 549 mm in 2016 (Table 6). On
average, fertilized plots had 12% and 11% higher ET than unfertilized plots, respectively, in both years. With respect
to irrigation method, a major difference of 32 mm was observed between CF and AWDL and between CF to NF, in
2015 and 2016, respectively. Although differences in ET among IR do not correspond to the consistent differences
observed in crop performance, the isolated values of T and E showed consistency. Across irrigation regimes, 2015 had
15% higher transpiration and 16% lower evaporation than did 2016, i.e., 2015 had the best overall yield and used higher

33
amounts of water towards the yield (T water). The same was observed for irrigation regime; NF showed the highest
values for T and the lowest values for E for both N levels and years.
The water loss through infiltration ranged from 540 to 1927 mm. Even NF, the irrigation regime with the
lowest water input (738 and 569 mm in 2015 and 2016, respectively), showed a relatively high percolation rate. The
mean infiltration loss in CF (which had the longest time of water pumping) was 3.5-fold higher than the corresponding
mean ET in 2015 and 2016.

34
Table 5. Apparent Nitrogen Use Efficiency (ANUE), Nitrogen Recovery Efficiency (ANR) e Partial Factor of Product ivity (PFP). The irrigation regimes are: alternate wetting drying short (AWDS), alternate wetting and drying long (AWDL),
continuous flooding (CF), non-flooding (NF), and saturated soil (SS) in 2014, 2015 and 2016.
ns: not significant, * significant at 5%, ** significant at less than 1% of probability of error by F test. Values followed by the same letter are not significantly different by LSD test at p < 0.05.
ANUE ANR PFP (kg kg-1 of N)
Year / Irrigation
2014
AWDS 20.5 0.19 51.7
AWDL 15.1 0.12 51.5
CF 20.1 0.31 47.2
NF 15.0 0.50 55.7
SS 15.3 0.34 48.8
mean 17.1 B 0.32 B 51.0 B
2015
AWDS 31.3 0.49 70.3
AWDL 25.3 0.31 59.2
CF 30.3 0.47 70.1
NF 20.8 0.63 70.5
SS 25.7 0.53 64.6
mean 24.9 A 0.49 A 66.9 A
2016
AWDS 19.0 0.35 52.6
AWDL 20.0 0.33 55.3
CF 20.5 0.25 56.1
NF 14.7 0.61 56.9
SS 14.0 0.44 51.4
mean 18 B 0.46 AB 55 B
Across Years
AWDS 23.6 a 0.37 b 58.2 ab
AWDL 17.9 b 0.24 b 55.4 b
CF 23.6 a 0.35 b 57.8 ab
NF 16.0 b 0.57 a 61.0 a
SS 18.3 b 0.44 ab 54.9 b
ANOVA
irrigation (I) * * *
Year (Y) * * * I *Y ns ns ns CV (%) 28.17 33.90 7.64

35
Table 6. Total water input (WI), crop evapotranspiration (ETc) segmented in its evaporation (E) and transpiration (T), and infiltration loss accumulated during growing season of 2015 and 2016. The irrigation regimes are: alternate wetting drying short (AWDS), alternate wetting and drying long (AWDL), continuous flooding (CF), non-flooding (NF), and saturated soil (SS) in 2015 e 2016
WI
(mm) Evaporation (mm)
Transpiration (mm)
ET (mm)
Infiltration Loss (mm)
N level
0 150 mean
0 150 mean
0 150 mean
0 150 mean
Year / Irrigation
2015
AWDS
1895
162 110 136 334 445 390
496 555 526
1399 1340 1370
AWDL
2228
141 107 124 357 420 389
498 527 513
1730 1701 1716
CF
2459
184 119 152 348 439 394
532 558 545
1927 1901 1914
NF
1262
103 81 92 407 466 437
510 547 529
752 715 734
SS
1625
153 120 137 365 446 406
518 566 542
1107 1059 1083
2016
AWDS
1748
168 138 153 335 390 363
503 528 516
1245 1220 1233
AWDL
2082
170 144 157 354 394 374
524 538 531
1558 1544 1551
CF
2401
188 151 170 346 394 370
534 545 540
1867 1856 1862
NF
1064
124 111 118 367 413 390
491 524 508
573 540 557
SS
1460
163 161 162 352 388 370
515 549 532
945 911 928
WI (water input = Rainfall + irrigation); ET (estimated evapotranspiration); Infiltration loss = WI – ET.
The ET water use efficiency (WUEET), total water input use efficiency (WUEIn), and application
efficiency (EA) are given in Table 7. WUEET ranged from 1.15 to 1.85 kg grain m-3 water across years and, on
average, increased by 31% when N was applied. WUEET in NF was the highest (1.64 kg grain m-3 water) across
years, whereas that in SS was the lowest (1.32 kg grain m -3 water) across years. WUEIn follow the same trend of
WI, due the variation of WI among IR is much greater than grain yield variation. NF showed the highest WUEIn
(0.7 kg grain m-3 water) across years and N levels, followed by SS and AWDS. The CF and AWDL had the
lowest efficiency of 0.35 and 0.32 kg grain m-3 water. N application increased the WUEIn by 33% and 27% in
2015 and 2016, respectively. WUEET and WUEIn were higher in 2015 than in 2016. The EA ranged from 20 to
47% and was higher for irrigation regimes that used less amount of water. The EA for unfertilized and fertilized
plots in NF was 40 and 42%, respectively, in 2015, and 43 and 47%, respectively, in 2016. EA in AWDL was
equal to that in CF in 2015 for both N levels and in 2016 for N level 0.
2.4. Discussion
2.4.1. Soil Water Potential in Root Zone
The main difficulty with alternative irrigation strategies is fulfilling the crop’s water requirement so not
to incur a loss of grain yield. According to Wopereis et al. (1996), rice transpiration rates remain nearly unchanged
as soil water potential goes from zero to -100 kPa, with leaf curling occurring below -200kPa. The effects of
drought stress in rice are related to genotype, the crop age and duration of drought stress and it starts from -
10kPa to -30kpa (Bouman and Tuong, 2001). In a broad meta-analysis of alternate wet and dry irrigation, Carrijo

36
et al. (2017) concluded there is no significant effect on rice yield when the soil water potential does drop below -
20kPa during the drying cycle, and Kato et al. (2009) observed aerobic conditions did not decrease rice yield even
with soil potential frequently reaching -60kpa. For modelling purpose, the Oryza2000 crop model (Bouman et
al., 2001) considers the relation described by Wopereis et al. (1996). Thus, based on the observed soil water
potential during the length of this study, it is reasonable to accept that ET met crop requirements as soil water
potential was within the range of 0 to -28kPa in all irrigation regimes after the onset of irrigation (Figure. 2).
Table 7. ET Water use efficiency (WUEET - kg grain m-3), water input use efficiency (WUEIn - kg grain m-3) and application efficiency (EA- %) in 2015 and 2016. The irrigations regimes are: alternate wetting drying short (AWDS), alternate wetting and drying long (AWDL), continuous flooding (CF), non-flooding (NF), and saturated soil (SS).
WUEET WUEIn EA
N level 0 150 mean 0 150 mean 0 150 mean
Year / Irrigation
2015
AWDS 1.27 1.99 1.63 0.31 0.56 0.43 24 c 28 c 26
AWDL 1.29 1.90 1.59 0.29 0.45 0.37 22 d 24 d 23
CF 1.21 1.98 1.59 0.25 0.43 0.34 20 d 22 d 21
NF 1.47 2.02 1.74 0.56 0.84 0.70 40 a 42 a 40
SS 1.20 1.80 1.50 0.36 0.60 0.48 30 b 33 b 32
mean 1.29 B 1.94 A 0.35 B 0.57 A
2016
AWDS 1.07 1.59 1.33 0.29 0.45 0.37 27 c 28 d 28
AWDL 1.11 1.64 1.38 0.26 0.40 0.33 24 d 24 d 24
CF 1.09 1.64 1.37 0.23 0.36 0.29 21 d 22 c 21
NF 1.38 1.68 1.53 0.60 0.78 0.69 43 a 47 a 45
SS 1.16 1.49 1.32 0.38 0.53 0.46 33 b 36 b 34
mean 1.16 B 1.61 A 0.35 B 0.50 A
Across Years
AWDS 1.17 1.79 1.48 bc 0.30 0.50 0.40 c 26 28 27
AWDL 1.20 1.77 1.48 bc 0.28 0.42 0.35 d 23 24 24
CF 1.15 1.81 1.52 b 0.24 0.39 0.32 d 21 22 21
NF 1.43 1.85 1.64 a 0.58 0.81 0.70 a 41 44 42
SS 1.18 1.64 1.41 c 0.37 0.56 0.47 b 32 34 323
mean 1.23 1.77
ANOVA
irrigation (I) ** ** ** N level (N) ** ** ** Year (Y) ** ** ** I*N ns ns ** I *Y ns ns ** N*Y ** ** ** I*N*Y ns ns ns CV (%) 9.27 9.38 2.59
ns: not significant, * significant at 5%, ** significant at less than 1% of probability of error by F test. Values followed by the same letter are not significantly different by LSD test at p < 0.05. Lower-case compares among rows in the same year and upper-case compares among columns.

37
2.4.2. Crop Performance
The grain yield was positively affected by irrigation regimes which used less water, particularly NF
which obtained the highest yields in 2014 and 2015. Spikelet number and tillering (which biomass is indirectly
linked to) are yield components and there is a positive correlation between them, as also reported by Clerget et
al. (2016). AGB, NS and GY are related to nitrogen uptake (Fageria and Baligar, 2005, 2001; Lampayan et al.,
2010), and this relationship was observed in this study (Table 3). The greatest N uptake in zero and 150 kg ha -1
for NF condition indicates irrigation regime is also interfering in N availability in soil, and it could be addressing
the differences in crop performance. Aerobic soil condition is related to higher rates of indigenous N
mineralization than anaerobic (Aulakh et al., 2000; Dong et al., 2012; Kader et al., 2013; Updegraff et al., 1995).
Also, the increase of net mineralization can deliver a higher amount of N to the rice (Dong et al., 2012). There
are few results in literature that presents yield improving under aerobic conditions. Kato et al., (2009) found
similar conclusion in temperate rice in Japan, and there is not such result in tropical environment. Regarding
AWD strategy, result reporting best crop performance in AWD than CF are recently becoming common (LaHue
et al., 2016; Wang et al., 2016), although the majority of them conclude inferior results (Belder et al., 2005a;
Bouman et al., 2005; M. D. M. Kadiyala et al., 2015; Patel et al., 2010; Peng et al., 2006), or no difference among
irrigations regime (Rose et al., 2016; Sánchez-Llerena et al., 2016; Yao et al., 2012). The greater N uptake for the
crop under NF (168 kg ha-1 of N at 150 kg ha-1) is a possible consequence of non-limiting N availability coupled
with reduction of N loss. The improve in N uptake drove the better crop performance in NF.
2.4.3. The Isotopic Efficiency
Based on its consistently high isotopic efficiency, NF appear as the most adequate irrigation regime in
tropical Plinthaquults. NF provided the most efficient fertilizer use by the crop and high amount of fertilizer N
was remained in the soil. The all other irrigations treatments were inferior to NF (Table 4). The common fate of
N losses from agroecosystem were not completely measured in this study, but some of them are unlikely to have
occurred either because methodology or site characteristics.
Seepage was prevented due the metal frame of microplots, and ammonia volatilization directly from
urea is negligible when fertilizer is incorporated into the soil right after application (Black et al., 1987; Li et al.,
2008). The ammonia volatilization from soil, which is a different process from ammonium volatilization directly
from urea, is a pH dependent process which turns insignificant in pH lower than 7.5 (Reddy et al., 1984). The
site Plinthaquults presented an initial pH of 5.5 – 5.7 (Table 1), and even the reduction process would be able to
raise soils pH due to the increase of net OH- (Ponnamperuma, 1972), an acid Ultisol did not raise its pH over
6.8 after 50 days of submergence (Borin et al., 2016). Thus, ammonia volatilization unlikely was the fate of
unaccounted 15N.
The N leaching is also excluded for being the fate of unaccounted N because labeled N was negligible
below 40 cm for all irrigations regime (Table 4). Previous reports had no consensus if N loss potential would
increase in CF or any other alternative method. When CF is adopted, N-NH4+ rather than N-NO3
- is the mineral
predominant form in the soil and it is less susceptible to leaching (Devkota et al., 2013; Patrick Jr and Reddy,
1978). In aerobic irrigation, nitrification is enhanced, and N-NO3- would become more likely to leach into the
ground water. However, this is compensated by less water percolation carrying N downwards (Tan et al., 2015;

38
Zhou et al., 2011). Irrespective to IR and mineral N, leaching is able to occur when there is a discrepancy between
soil supply and crop requirement (Cassman et al., 1996). The NU across years ranged from 137 to 200 kg ha -1
among IR and N fertilizer applied was always 150 kg ha-1, therefore the roughly concordance between NU and
fertilizer rate leaded to N leaching was not noticeable in the present research.
Nitrification-denitrification may provide the best explanation of the observed results. In previous
studies of the fate of 15N fate applied to lowland rice, CF is largely reported as the irrigation regime which provides
superior isotopic nitrogen efficiency in relation to alternative methods (Belder et al., 2005a; Dong et al., 2012;
Fillery and Vlek, 1982; M. D. M. Kadiyala et al., 2015b; Rose et al., 2016; Zhou et al., 2012, 2011). The common
factor between these studies was they took place on Alfisols and/or puddled soils. In such type of soil, the water
percolation rate is usually limited (Belder et al., 2007; Singh et al., 2001), and its submergence results in oxidizing
zones just restricted to water/air interface and rhizosphere (Atulba et al., 2015; Bouldin, 1986). The majority part
of soil bulk remains anoxic, and nitrification process is disadvantaged. As consequence, the majority of mineral
N remains in the reduced form as N-NH3- and losses through nitrification-denitrification are prevented (Dong
et al., 2012; Reddy et al., 1984; Zhou et al., 2011). Conversely, soils with elevated infiltration rate, like the one
described in this study (Ksat 1.35 m d-1) suggests a constant downwards flux of water into the soil profile. This
flux is illustrated by high volume of water percolation losses (Table 6). As a result, the N-NO3- formed in oxidizing
zones are spread into soil profile (Aulakh and Bijay-Singh, 1996; Bouldin, 1986) and it triggers denitrification
processes due to nitrate movement into anaerobic sites (Van Cleemput et al., 2007; Zhou et al., 2011). CF, SS,
AWDL, AWDS might have low 15N recovery compared to NF explained by it. NF had its top 10 cm constantly
aerobic and it may have transformed the labeled N to nitrate. As it should have fewer anoxic zones, the
denitrification wasn’t pronounced. Further studies must be done to explain if this process really occurs, however
the present data showed 81.5 % recovery of applied fertilizer in NF irrigation method, while all other IR had an
average of 58.7%. For such rice production environment, the method that most prevented N loss is the one that
kept soil aerobic.
The results are concisely even in different weather among years (Table 2). In 2015 the weather
conditions for crop development were more favorable and either in main plot and microplot the crop yielded
more. The consequence is higher labeled fertilizer in plant and less remaining in the 0-20 cm soil. In 2016, the
crop yielded less due unfavorable weather, and higher amount of 15N was left over in the soil. The balance
between soil and plant compensates each other and the total recovery (soil + plant) was equal in both years.
2.4.4. N Efficiency Indexes
Data demonstrated differences in yield and N recoveries, which aligns with suggestions that irrigation
regimes drive different N dynamics in the soil. The ANUE was higher in CF and AWDS in 2014, 2015 and 2016
(Table 5), thus implying these irrigation treatments had better use of N fertilizer. But as observed earlier, CF and
AWDS did not provide higher yields and N Uptake, rather they were equivalent to AWDL and SS and inferior
to NF. At 0 kg ha-1 of N rate, NF provided the highest GY (6.5 across years) causing a lower increment than CF
and AWDS in response to N fertilizer. At 150 kg ha-1 of N rate, the NF provided an available amount of N which
exceeded the optimum rate for this genotype and local, and other factors became limiting. Blast disease
(Magnaporthae oryzae Cav.) increases with N-NO3- availability (Osuna-Canizalez et al., 1991) and it was observed
39
in all irrigation regime used, although the severity NF was worst. The N rate dependence to optimum ANUE is
widely reported (Cassman et al., 2002; Fageria and Baligar, 2003), and poor ANUE are commonly related to
pronounced N loss (Belder et al., 2005a; M. D. M. Kadiyala et al., 2015). But for the particular case of NF in this
study it can be interpreted as higher N soil surplus and thin relationship between rice crop and to N fertilizer.
Therefore, if adopted NF the fertilizer rate must decrease to attend the optimum rate.
The assumption of irrigation regime interference with N dynamics in the soil also relies on the
differences observed in ANR, and among the regimes NF supported higher recovery. The apparent recovery of
0.57 kg kg-1 standards the ANR in NF as high as upland crops. ANR is broadly reported between 0.3 to 0.45 kg
kg-1 to lowland rice (Cassman et al., 2002), what is similar to the average 0.35 kg kg -1 across AWDS, AWDL, CF
and SS of this study. The lower ANR in lowland rice is due the intensive loss processes of volatilization and
nitrification- denitrification (Ladha et al., 2005) and the lower unaccounted labeled found in isotopic technique
to NF corroborates results of higher ANR in NF.
The ANR compared to isotopic recovery in plant has on average 23% lower recovery, and difference
among recovery techniques has been previously reported (Belder et al., 2005a; Bouldin, 1986; Bronson et al.,
2000; Schnier, 1994). The discussions usually describe “priming effect” (Hauck and Bremner, 1976) and “pool
substitution” (Jenkinson et al., 1985) as being responsible for interference in plant recovery in isotopic technique.
However, for unaccounted N the isotopic recovery remains valid because these does not affect leaching, ammonia
volatilization and denitrification losses (Bronson et al., 2000). These studies also report isotopic recovery is lower
than ANR although in our study we have observed the opposite. One explanation may be microplot metal frame
disturbed plant development inside them. Thus, the lack of biomass development raised the 15N content in plant.
However, the differences among irrigation treatments remained similar in both techniques, as well as the
conclusion: NF had the higher recovery efficiency in both techniques and all other irrigation regimes are inferior
to NF and equal between them. In our study PFP for NF, CF and AWDS was 61, 57.8 and 52.8, kg grain kg -1
N respectively, across years and they were statistically equal (Table 5). A high PFP implies the need to N
application to production system, and PFP is interpreted as an integration of ANUE and ANR. (Cassman et al.,
2003). A reference worldwide rice PFP is 61 kg grain kg-1 N (Cassman et al., 1996; Ladha et al., 2005). Thus,
taking in to account yield and response to N fertilizer, SS and AWDL are less recommended irrigation regimes
in such agroecosystem.
2.4.5. The Water use efficiency
The IR provided major differences in WUEin as grain yield ranged 15% in 2015 and 8% in 2016 among
irrigation regime (Table 7) while water input ranged 105% in 2015 and 80% in 2016 (Table 6). This can be linked to
the large amount of irrigation water necessary to flood the fields. At 150 kg ha-1 N rate, CF and AWDL (the IR that
used more water volume) presented a WUEin of 0.39 and 0.42 kg grain kg water-1, respectively. It is considerably lower
efficiency compared to 0.5-1.1 kg grain kg water-1 reported in similar standards of yield and N rate (Belder et al., 2005a;
Borin et al., 2016; M.D.M. Kadiyala et al., 2015; Sánchez-Llerena et al., 2016; Wang et al., 2016; Yao et al., 2012). While
at fertilized plot, NF had 0.81 WUEin, and it was very similar to Kato et al. (2009) which also observed higher yield to
aerobic condition. The zero N fertilizer rate had inferior WUEin for irrigations regime due lower grains yields as well.
This was previously reported by Belder et al. (2005a) and Ye et al. (2013) and led us to conclude that inadequate N rate
and poor field practices indirectly represent a waste of water. In the present study SS had less water demand than CF,

40
AWDL, AWDS, but as it had a lower grain yield, the WUEET was 0.47. Thus, highlights the pursuit of water saving
cannot occur at grain yield detriment. WUEin is sensitive to field practices, nitrogen management and genotype once
grain yield is affected by them. Moreover, the soil and hydrological characteristics dictate the water dynamics in the
field, and for the present results it represented a stronger demand of irrigation volume.
The WUEET ranged from 1.8 to 1.56 kg of grain kg water-1 irrigation regime at fertilized plots and 1.34 to
1.09 at unfertilized. It was a shorter interval when compared to WUEin, because the estimate ET just ranged 5.9% and
2.8% in 2015 and 2016, respectively. The WUEET is lower than WUEin due to the infiltration loss not being accounted
for. The WUEET are similar for those found by Belder et al. (2005b) and Bouman et al. (2005) with similar methodology
of ET estimation. In fertilized plots, the WUEET increased in relation to unfertilized primarily because to grain yield
increment, but also due to increase in LAI as well. Other studies describe the relation of LAI and nitrogen applying
(Belder et al., 2005a; Wang et al., 2016). The LAI expansion also raises the transpiration in ET (Alberto et al., 2014;
Bouman et al., 2005) and that also has an important contribution for improving WUEin. In regard to irrigation regimes,
NF had 1.64 kg of grain kg water-1, across N levels, and had higher total transpiration. On a field scale, for a given
genotype and climate conditions, good agricultural practices which favor water use through transpiration rather
evaporation improve water use efficiency.
Application efficiency (EA) is an index to define irrigation systems or methods more suitable from the
aspect of water use. On a macroscale, it depends on soil physical properties and is related to the amount of water
needed to meet crop development, on a field scale it is sensitive to N levels and agronomic practices which ET is
dependent on. The experimental site of this study has a fairly high saturated hydraulic conductivity (ksat = 1.35 and
0.16 m d-1 in A and B plinthic horizons, respectively), compared to others lowland rice production areas. Usually it is
in a range from 0.8 to 0.0003 m d-1 in Philippines, India, China, California and Uzbekistan (Devkota et al., 2013; Liang
et al., 2014; Singh et al., 2001; Tan et al., 2015; Wopereis et al., 1994). The micro-structure of this soil has a coarse sand
size and it provides low bulk density and prominent macroporosity, resulting in a high hydraulic conductivity (Ks)
(Buol and Eswaran, 1999). Within 0.6 to 1 m, the B textural horizon presents a clay increment content and it slows
down the water infiltration causing the water table to rise during the rainy season (Fageria et al., 2002) The
macroporosity is the physical soil attribute closest correlated to hydraulic conductivity (Ankeny et al., 1990) and its soil
site macroporosity of 45% stands this soil way over the average of 0.24 % observed in a wide characterization of soil
macroporosity in Asia (Aimrun et al., 2004). To summarize the results showed that NF has at least twice more efficiency
in EA than CF, AWDS, AWDL, thus appointing to NF as the irrigation regime that lost least amount of applied water
and is the most suitable irrigation regime for this system.
2.5. Conclusion
The irrigation regime and nitrogen fertilizing interferes in N uptake and grain yield of rice crop. Non-
flooding regime provides higher yield and overall crop performance in zero and 150 kg N ha-1. The isotopic
efficiency showed less unrecovered N from fertilizer in NF irrigation and apparent nitrogen recovery (ANR) was
higher for NF as well. Apparent nitrogen efficiency was higher for Continuous flooding and Alternate wetting
and drying short, as these irrigation regimes showed lower yields at 0 N fertilizer rate. Partial Factor Productivity
demonstrated that NF, CF and AWDS are more adequate to N fertilization.
Water use efficiency was higher for non-flooding condition, in both terms of total water input and
water ET, compared to all other irrigation regimes. The integrated view of crop performance, water and nitrogen

41
efficiency, as long there is no water shortage, the non-flooding is the more suitable irrigation regime for such
agroecosystem. Further studies are necessary to understand N dynamics and loss processes in such environment.
References
Aimrun, W., Amin, M.S.M., Eltaib, S.M., 2004. Effective porosity of paddy soils as an estimation of its saturated
hydraulic conductivity. Geoderma 121, 197–203. doi:10.1016/j.geoderma.2003.11.010
Alberto, M.C.R., Quilty, J.R., Buresh, R.J., Wassmann, R., Haidar, S., Correa, T.Q., Sandro, J.M., 2014. Actual
evapotranspiration and dual crop coefficients for dry-seeded rice and hybrid maize grown with overhead
sprinkler irrigation. Agric. Water Manag. 136, 1–12. doi:10.1016/j.agwat.2014.01.005
Alberto, M.C.R., Wassmann, R., Hirano, T., Miyata, A., Hatano, R., Kumar, A., Padre, A., Amante, M., 2011.
Comparisons of energy balance and evapotranspiration between flooded and aerobic rice fields in the
Philippines. Agric. Water Manag. 98, 1417–1430. doi:10.1016/j.agwat.2011.04.011
Allen, R.G., 1998. FAO Irrigation and Drainage Paper Crop by. Irrig. Drain. 300, 300.
doi:10.1016/j.eja.2010.12.001 Ankeny, M.D., Kaspar, T.C., Horton, R., 1990. Characterization of Tillage and
Traffic Effects on Unconfined Infiltration Measurements. Soil Sci. Soc. Am. J. 54, 837.
doi:10.2136/sssaj1990.03615995005400030037x
Atulba, S.L., Gutierrez, J., Kim, G.W., Kim, S.Y., Khan, M.I., Lee, Y.B., Kim, P.J., 2015. Evaluation of rice root
oxidizing potential using digital image analysis. J. Korean Soc. Appl. Biol. Chem. 58, 463–471.
doi:10.1007/s13765-015-0042-x
Aulakh, M.S., Bijay-Singh, 1996. Nitrogen losses and fertilizer N use efficiency in irrigated porous soils. Nutr.
Cycl. Agroecosystems 47, 197–212. doi:10.1007/BF01986275
Aulakh, M.S., Khera, T.S., Doran, J.W., 2000. Mineralization and denitrification in upland, nearly saturated and
flooded subtropical soil. Biol. Fertil. Soils 31, 162–167. doi:10.1007/s003740050640
Awio, T., Bua, B., Karungi, J., 2015. Assessing the Effects of Water Management Regimes and Rice Residue on
Growth and Yield of Rice in Uganda. Am. J. Exp. Agric. 7, 141–149. doi:10.9734/AJEA/2015/15631
Balasubramanian, V., Sie, M., Hijmans, R.J., Otsuka, K., 2007. Increasing Rice Production in Sub-Saharan Africa:
Challenges and Opportunities, in: Advances in Agronomy. pp. 55–133. doi:10.1016/S0065-2113(06)94002-
4
Barrie, A., Prosser, S.J., 1996. Automated analysis of light-element stable isotopes by isotope ratio mass
spectrometry, in: Thomas, B., Yamasaki, S. (Eds.), Mass Spectrometry of Soils. Marcel Dekker, New York,
pp. 1–46.
Belder, P., Bouman, B.A.M., Spiertz, J.H.J., 2007. Exploring options for water savings in lowland rice using a
modelling approach. Agric. Syst. 92, 91–114. doi:10.1016/j.agsy.2006.03.001
Belder, P., Bouman, B.A.M., Spiertz, J.H.J., Peng, S., Castañeda, A.R., Visperas, R.M., 2005a. Crop performance,
nitrogen and water use in flooded and aerobic rice. Plant Soil 273, 167–182. doi:10.1007/s11104-004-7401-
4
Belder, P., Spiertz, J.H.J., Bouman, B.A.M., Lu, G., Tuong, T.P., 2005b. Nitrogen economy and water
productivity of lowland rice under water-saving irrigation. F. Crop. Res. 93, 169–185.
doi:10.1016/j.fcr.2004.09.022

42
Black, A.S., Sherlock, R.R., Smith, N.P., 1987. Effect of timing of simulated rainfall on ammonia volatilization
from urea, applied to soil of varyingmoisture content. J. Soil Sci. 38, 679–687. doi:10.1111/j.1365-
2389.1987.tb02165.x
Borin, J.B.M., Carmona, F. de C., Anghinoni, I., Martins, A.P., Jaeger, I.R., Marcolin, E., Hernandes, G.C.,
Camargo, E.S., 2016. Soil solution chemical attributes, rice response and water use efficiency under different
flood irrigation management methods. Agric. Water Manag. 176, 9–17. doi:10.1016/j.agwat.2016.05.021
Bouldin, D., 1986. 1. The chemistry and biology of flooded soils in relation to the nitrogen economy in rice fields.
Fertil. Res. 9, 1–14. doi:10.1007/BF01048693
Bouman, B.A.M., Humphreys, E., Tuong, T.P., Barker, R., 2007. Rice and Water, in: Advances in Agronomy.
pp.187–237. doi:10.1016/S0065-2113(04)92004-4
Bouman, B.A.M., Kropff, M.J., Tuong, T.P., Wopereis, M.C.S., ten Berge, H.F.M., Laar, H.H. Van, 2001.
ORYZA2000: modeling lowland rice. IRRI, Los Baños, Phillipines / Wageningen, The Netherlands.
Bouman, B.A.M., Peng, S., Castañeda, A.R., Visperas, R.M., 2005. Yield and water use of irrigated tropical aerobic
rice systems. Agric. Water Manag. 74, 87–105. doi:10.1016/j.agwat.2004.11.007
Bouman, B.A.M., Tuong, T.P., 2001. Field water mangement to save water and increase its productivity in
irrigated lowland rice. Agric. Water Manag. 1615, 1–20. doi:10.1016/S0378-3774(00)00128-1
Bronson, K.F., Hussain, F., Pasuquin, E., Ladha, J.K., 2000. Use of N-Labeled Soil in Measuring Nitrogen
Fertilizer Recovery Efficiency in Transplanted Rice. Soil Sci. Soc. Am. J. 64, 235.
doi:10.2136/sssaj2000.641235x
Buol, S.W., Eswaran, H., 1999. Oxisols, in: Advances in Agronomy. pp. 151–195. doi:10.1016/S0065-
2113(08)60845-7
Buol, S.W., Southard, R.J., Graham, R.C., Mcdaniel, P.A., 2011. Soil Genesis and Classification, 6th ed. John
Wiley & Sons, Inc., Ames, USA.
Cabrera, M.L., Kissel, D.E., 1989. Review and simplification of calculations in 15N tracer studies. Fertil. Res. 20,
11– 15. doi:10.1007/BF01055396
Carrijo, D.R., Lundy, M.E., Linquist, B.A., 2017. Rice yields and water use under alternate wetting and drying
irrigation: A meta-analysis. F. Crop. Res. 203, 173–180. doi:10.1016/j.fcr.2016.12.002
Cassman, K.G., Dobermann, A., Walters, D.T., 2002. Agroecosystems, Nitrogen-use Efficiency, and Nitrogen
Management. AMBIO A J. Hum. Environ. 31, 132–140. doi:10.1579/0044-7447-31.2.132
Cassman, K.G., Dobermann, A., Walters, D.T., Yang, H., 2003. Meeting cereal demand while protecting natural
resources and improving environmental quality. Annu. Rev. Environ. Resour. 28, 315–358.
doi:10.1146/annu.rev.energy.28.040202.122858
Cassman, K.G., Gines, G.C., Dizon, M.A., Samson, M.I., Alcantara, J.M., 1996. Nitrogen-use efficiency in tropical
lowland rice systems: contributions from indigenous and applied nitrogen. F. Crop. Res. 47, 1–12.
doi:10.1016/0378-4290(95)00101-8
Ciampitti, I.A., Vyn, T.J., 2012. Physiological perspectives of changes over time in maize yield dependency on
nitrogen uptake and associated nitrogen efficiencies: A review. F. Crop. Res. 133, 48–67.
doi:10.1016/j.fcr.2012.03.008
Clerget, B., Bueno, C., Domingo, A.J., Layaoen, H.L., Vial, L., 2016. Leaf emergence, tillering, plant growth, and
yield in response to plant density in a high-yielding aerobic rice crop. F. Crop. Res. 199, 52–64.
doi:10.1016/j.fcr.2016.09.018

43
Coelho, M.R., Santos, H.G., Oliveira, R.P., Moraes, J.F. V, 2006. Solos, in: Santos, A.B., Stone, L.F., Vieira,
N.R.A. (Eds.), A Cultura Do Arroz No Brasil. Embrapa Arroz e Feijão, Santo Antônio de Goiás, Brazil, p.
161–208.
Counce, P.A., Keisling, T.C., Mitchell, A.J., 2000. A Uniform, Objective, and Adaptive System for Expressing
Rice Development. Crop Sci. 40, 436. doi:10.2135/cropsci2000.402436x
De Vries, M.E., Rodenburg, J., Bado, B. V., Sow, A., Leffelaar, P.A., Giller, K.E., 2010. Rice production with less
irrigation water is possible in a Sahelian environment. F. Crop. Res. 116, 154–164.
doi:10.1016/j.fcr.2009.12.006
Devkota, K.P., Manschadi, A., Lamers, J.P.A., Devkota, M., Vlek, P.L.G., 2013. Mineral nitrogen dynamics in
irrigated rice–wheat system under different irrigation and establishment methods and residue levels in arid
drylands of Central Asia. Eur. J. Agron. 47, 65–76. doi:10.1016/j.eja.2013.01.009
Dingkuhn, M., Audebert, A.., Jones, M.., Etienne, K., Sow, A., 1999. Control of stomatal conductance and leaf
rolling in O. sativa and O. glaberrima upland rice. F. Crop. Res. 61, 223–236. doi:10.1016/S0378-
4290(98)00165-8
Dong, N.M., Brandt, K.K., Sørensen, J., Hung, N.N., Hach, C. Van, Tan, P.S., Dalsgaard, T., 2012. Effects of
alternating wetting and drying versus continuous flooding on fertilizer nitrogen fate in rice fields in the
Mekong Delta, Vietnam. Soil Biol. Biochem. 47, 166–174. doi:10.1016/j.soilbio.2011.12.028
Fageria, N.K., Aidar, H., Barbosa Filho, M.P., 2002. The Lowland Soils, in: Aidar, H., Kluthcouski, J., Stone, L.F.
(Eds.), The Common Beans Production in Tropical Lowland. Embrapa - Rice and Beans Research Center,
Santo Antônio de Goias, Brazil.
Fageria, N.K., Baligar, V.C., 2005. Enhancing Nitrogen Use Efficiency in Crop Plants. Adv. Agron. 88, 97–185.
doi:10.1016/S0065-2113(05)88004-6
Fageria, N.K., Baligar, V.C., 2003. Methodology for Evaluation of Lowland Rice Genotypes for Nitrogen Use
Efficiency. J. Plant Nutr. 26, 1315–1333. doi:10.1081/PLN-120020373
Fageria, N.K., Baligar, V.C., 2001. Lowland rice response to nitrogen fertilization. Commun. Soil Sci. Plant Anal.
32, 1405–1429. doi:10.1081/CSS-100104202
Fillery, I.R.P., Vlek, P.L.G., 1982. The significance of denitrification of applied nitrogen in fallow and cropped
rice soils under different flooding regimes I. Greenhouse experimènts. Plant Soil 65, 153–169.
doi:10.1007/BF02374647
Guerra, L.C., Bhuiyan, S.I., Tuong, T.P., Barker, R., 1998. Producing more rice with less water from irrigated
systems. Swim Pap. 5.
Hauck, R.D., Bremner, J.M., 1976. Use of tracers for soil and fertilizer nitrogen research. In: Advances in
Agronomy. pp. 219–266. doi:10.1016/S0065-2113(08)60556-8
Jenkinson, D.S., Fox, R.H., Rayner, J.H., 1985. Interactions between fertilizer nitrogen and soil nitrogen-the so-
called “priming” effect. J. Soil Sci. 36, 425–444. doi:10.1111/j.1365-2389.1985.tb00348.x
Kader, M.A., Sleutel, S., Begum, S.A., Moslehuddin, A.Z.M., De Neve, S., 2013. Nitrogen mineralization in sub-
tropical paddy soils in relation to soil mineralogy, management, pH, carbon, nitrogen and iron contents. Eur.
J. Soil Sci. 64, 47–57. doi:10.1111/ejss.12005
Kadiyala, M.D.M., Jones, J.W., Mylavarapu, R.S., Li, Y.C., Reddy, M.D., 2015a. Identifying irrigation and nitrogen
best management practices for aerobic rice–maize cropping system for semi-arid tropics using CERES-rice
and maize models. Agric. Water Manag. 149, 23–32. doi:10.1016/j.agwat.2014.10.019

44
Kadiyala, M.D.M., Mylavarapu, R.S., Li, Y.C., Reddy, G.B., Reddy, K.R., Reddy, M.D., 2015b. Uptake efficiency
of 15N-urea in flooded and aerobic rice fields under semi-arid conditions. Paddy Water Environ. 13, 545–
556. doi:10.1007/s10333-014-0473-8
Kato, Y., Okami, M., Katsura, K., 2009. Yield potential and water use efficiency of aerobic rice (Oryza sativa L.)
in Japan. F. Crop. Res. 113, 328–334. doi:10.1016/j.fcr.2009.06.010
Ladha, J.K., Pathak, H., J. Krupnik, T., Six, J., van Kessel, C., 2005. Efficiency of Fertilizer Nitrogen in Cereal
Production: Retrospects and Prospects, in: Advances in Agronomy. pp. 85–156. doi:10.1016/S0065-
2113(05)87003-8
LaHue, G.T., Chaney, R.L., Adviento-Borbe, M.A., Linquist, B.A., 2016. Alternate wetting and drying in high
yielding direct-seeded rice systems accomplishes multiple environmental and agronomic objectives. Agric.
Ecosyst. Environ. 229, 30–39. doi:10.1016/j.agee.2016.05.020
Lampayan, R.M., Bouman, B.A.M., de Dios, J.L., Espiritu, A.J., Soriano, J.B., Lactaoen, A.T., Faronilo, J.E.,
Thant, K.M., 2010. Yield of aerobic rice in rainfed lowlands of the Philippines as affected by nitrogen
management and row spacing. F. Crop. Res. 116, 165–174. doi:10.1016/j.fcr.2009.12.007
Li, H., Liang, X., Chen, Y., Tian, G., Zhang, Z., 2008. Ammonia volatilization from urea in rice fields with zero-
drainage water management. Agric. Water Manag. 95, 887–894. doi:10.1016/j.agwat.2007.05.016
Liang, X.Q., Harter, T., Porta, L., van Kessel, C., Linquist, B.A., 2014. Nitrate Leaching in Californian Rice Fields:
A Field- and Regional-Scale Assessment. J. Environ. Qual. 43, 881. doi:10.2134/jeq2013.10.0402
Lu, J., Ookawa, T., Hirasawa, T., 2000. The effects of irrigation regimes on the water use, dry matter production
and physiological responses of paddy rice. Plant Soil 223, 209–218. doi:10.1023/A:1004898504550
Maclean, J., Hardy, B., Hettel, G., 2013. Rice Almanac: Source Book for One of the Most Important Economic
Activities on Earth, 4th ed. IRRI, Los Baños, Phillipines.
Osuna-Canizalez, F.J., De Datta, S.K., Bonman, J.M., 1991. Nitrogen form and silicon nutrition effects on
resistance to blast disease of rice. Plant Soil 135, 223–231. doi:10.1007/BF00010910
Patel, D.P., Das, A., Munda, G.C., Ghosh, P.K., Bordoloi, J.S., Kumar, M., 2010. Evaluation of yield and
physiological attributes of high-yielding rice varieties under aerobic and flood-irrigated management practices
in mid-hills ecosystem. Agric. Water Manag. 97, 1269–1276. doi:10.1016/j.agwat.2010.02.018
Patrick Jr, W.H., Reddy, C.N., 1978. Chemical changes in rice soils. Soils rice 361–379.
Peng, S., Bouman, B., Visperas, R.M., Castañeda, A., Nie, L., Park, H.-K., 2006. Comparison between aerobic
and flooded rice in the tropics: Agronomic performance in an eight-season experiment. F. Crop. Res. 96,
252–259. doi:10.1016/j.fcr.2005.07.007
Ponnamperuma, F.N., 1972. The Chemistry of Submerged Soils, in: Advances in Agronomy. pp. 29–96.
doi:10.1016/S0065-2113(08)60633-1
Reddy, K.R., Patrick, W.H., Broadbent, F.E., 1984. Nitrogen transformations and loss in flooded soils and
sediments. C R C Crit. Rev. Environ. Control 13, 273–309. doi:10.1080/10643388409381709
Ritchie, J.T., 1972. Model for predicting evaporation from a row crop with incomplete cover. Water Resour. Res.
8, 1204–1213. doi:10.1029/WR008i005p01204
Rose, T.J., Erler, D. V., Farzana, T., Van Zwieten, L., 2016. Delayed permanent water rice production systems
do not improve the recovery of 15N-urea compared to continuously flooded systems. Eur. J. Agron. 81, 46–
51. doi:10.1016/j.eja.2016.08.009

45
Sánchez-Llerena, J., López-Piñeiro, A., Albarrán, Á., Peña, D., Becerra, D., Rato-Nunes, J.M., 2016. Short and
long- term effects of different irrigation and tillage systems on soil properties and rice productivity under
Mediterranean conditions. Eur. J. Agron. 77, 101–110. doi:10.1016/j.eja.2016.04.005
Sanchez, P.A., 1976. Properties and Management of Soils in the Tropics, 1st ed. John Wiley & Sons, Inc., Ames,
USA.
Schnier, H.F., 1994. Nitrogen-15 recovery fraction in flooded tropical rice as affected by Added Nitrogen
Interaction. Eur. J. Agron. 3, 161–167. doi:10.1016/S1161-0301(14)80122-6
Sharkey, M., Meierotto, S., FAO, 2016. Rice Market Monitor. Trade Mark. Div. 19, 523–525.
doi:10.1002/wsb.724 Sharma, P.K., De Datta, S.K., 1985. Effects of Puddling on Soil Physical Properties
and Processes, in: Tout, E.A. (Ed.), Soil Physics and Rice. International Rice Research Institute, Los Baños,
Phillipines, pp. 217–233.
Singh, K.B., Gajri, P.R., Arora, V.K., 2001. Modelling the effects of soil and water management practices on the
water balance and performance of rice. Agric. Water Manag. 49, 77–95. doi:10.1016/S0378-3774(00)00144-
X
Stone, L.F., 2005. Eficiência do uso da água na cultura do arroz irrigado, 1a ed. Brazilian Agricultural Research
Corporation - Embrapa, Santo Antônio de Goiás.
Tan, X., Shao, D., Gu, W., Liu, H., 2015. Field analysis of water and nitrogen fate in lowland paddy fields under
different water managements using HYDRUS-1D. Agric. Water Manag. 150, 67–80.
doi:10.1016/j.agwat.2014.12.005
Thomson, K.J., 2003. World agriculture: towards 2015/2030: an FAO perspective. Land use policy 20, 375.
doi:10.1016/S0264-8377(03)00047-4
Turner, N.C., O’Toole, J.C., Cruz, R.T., Yambao, E.B., Ahmad, S., Namuco, O.S., Dingkuhn, M., 1986.
Responses of seven diverse rice cultivars to water deficits II. Osmotic adjustment, leaf elasticity, leaf
extension, leaf death, stomatal conductance and photosynthesis. F. Crop. Res. 13, 273–286.
doi:10.1016/0378-4290(86)90028-6
Updegraff, K., Pastor, J., Bridgham, S.D., Johnston, C.A., 1995. Environmental and Substrate Controls over
Carbon and Nitrogen Mineralization in Northern Wetlands. Ecol. Appl. 5, 151–163. doi:10.2307/1942060
Van Cleemput, O., Boeckx, P., Lindgren, P.E., Tonderski, K., 2007. Denitrification in Wetlands, Biology of the
Nitrogen Cycle. Elsevier B.V. doi:10.1016/B978-044452857-5.50024-2
Van Genuchten, M.T., Leij, F.J., Yates, S.R., 1991. The RETC code for quantifying the hydraulic functions of
unsaturated soils. Environmental Research Laboratory, Oklahoma.
Van Laar, H.H., Goudriaan, J., Van Keulen, H., 1997. SUCROS97: Simulation of crop growth for potential and
water-limited production situations, Quantitative approaches in systems analysis.
Wang, Z., Zhang, W., Beebout, S.S., Zhang, H., Liu, L., Yang, J., Zhang, J., 2016. Grain yield, water and nitrogen
use efficiencies of rice as influenced by irrigation regimes and their interaction with nitrogen rates. F. Crop.
Res. 193, 54–69. doi:10.1016/j.fcr.2016.03.006
Wopereis, M.C.S., Bouman, B.A.M., Kropff, M.J., ten Berge, H.F.M., Maligaya, A.R., 1994. Water use efficiency
of flooded rice fields I. Validation of the soil-water balance model SAWAH. Agric. Water Manag. 26, 277–
289. doi:10.1016/0378-3774(94)90014-0
Wopereis, M.C.S., Kropff, M.J., Maligaya, A.R., Tuong, T.P., 1996. Drought-stress responses of two lowland rice
cultivars to soil water status. F. Crop. Res. 46, 21–39. doi:10.1016/0378-4290(95)00084-4
46
Yao, F., Huang, J., Cui, K., Nie, L., Xiang, J., Liu, X., Wu, W., Chen, M., Peng, S., 2012. Agronomic performance
of high-yielding rice variety grown under alternate wetting and drying irrigation. F. Crop. Res. 126, 16–22.
doi:10.1016/j.fcr.2011.09.018
Ye, Y., Liang, X., Chen, Y., Liu, J., Gu, J., Guo, R., Li, L., 2013. Alternate wetting and drying irrigation and
controlled-release nitrogen fertilizer in late-season rice. Effects on dry matter accumulation, yield, water and
nitrogen use. F. Crop. Res. 144, 212–224. doi:10.1016/j.fcr.2012.12.003
Zhou, S., Sakiyama, Y., Riya, S., Song, X., Terada, A., Hosomi, M., 2012. Assessing nitrification and denitrification
in a paddy soil with different water dynamics and applied liquid cattle waste using the 15N isotopic technique.
Sci. Total Environ. 430, 93–100. doi:10.1016/j.scitotenv.2012.04.056
Zhou, S., Sugawara, S., Riya, S., Sagehashi, M., Toyota, K., Terada, A., Hosomi, M., 2011. Effect of infiltration
rate on nitrogen dynamics in paddy soil after high-load nitrogen application containing 15N tracer. Ecol.
Eng. 37, 685–692. doi:10.1016/j.ecoleng.2010.04.032

47
3. RELATIONSHIP OF NITROGEN AND CROP COMPONENTS IN AEROBIC RICE
AND CONTINUOUS FLOODING IRRIGATION IN WEATHERED TROPICAL
LOWLAND
Abstract
Aerobic rice is a promising rice production system which enables rice to grow in water- constrained environments and provides an alternative to continuous flooding irrigation. Although significant water savings are reported in aerobic systems in different lowland regions, a negative impact in crop performance prevents its wide deployment. The main reasons for grain yield decreases are given to be genotype and inappropriate water supply. However, agronomic practices such nitrogen management can interfere in overall crop performance of rice due to the influence of soil moisture on N availability to crop uptake. The goal of this research was to establish a relationship between nitrogen use and crop performance by comparing flooding conditions to aerobic rice in a tropical environmental with adequate water supply. A field experiment was carried out from 2014 to 2016 with an experimental design of split plot with irrigation regime (IR) in the main plot: continuous flooding (CF) and non-flooding aerobic (NF), and in the subplot fertilizer nitrogen rates: (0, 50, 150 and 250 kg ha-1). Biomass (AGB) nitrogen uptake (NU) and leaf area index (LAI) were quantified during crop development only in the 0 and 150 kg ha -1 subplots, as was the relationship between AGB, NU, grain yield and its components and all nitrogen rates at harvest. The aerobic rice provided higher NU throughout rice development and LAI equal or superior to CF. At harvesting, NU and panicle density (PD) had different relationships to N rates among CF and NF, with NF showing 18% higher NU as 27% PD across years and N rate. The grain yield (GY) relationship to N rates was also distinct in 2014 and 2015, and GY across N rates in NF was 20% and 12% higher than CF for 2014 and 2015, respectively. We conclude that lowland rice managed through aerobic system improves nitrogen uptake by plants as long the water filled space remains around 60%.
Keywords: Oryza sativa; Plinthaquults; Grain yield; Water saving, Evapotranspiration
3.1. Introduction
Aerobic rice is an evolving production system which uses less water than a traditional continuous
flooding irrigation regime (Tuong et al., 2005). Aerobic rice is not submitted to ponding water, and the soil
remains unsaturated. The crop can be either rainfed or irrigated, and therefore upland rice is sometimes included
in the definition of aerobic rice (Kato et al., 2009). However, aerobic rice more accurately refers to lowland rice
production where flooding irrigation is suitable and aerobic production serves as an alternative to save water
while still reaching similar grain yield (Peng et al., 2006). The gain in water economy i s due to the absence of
puddling tillage and therefore water ponding. Eliminating evaporation directly from water surface allows for 29-
40% less water input (Bouman et al., 2005; Jabran et al., 2015; Sharma et al., 2016). In spite of the relevant benefit
of less water consumption, crop performance and grain yield are usually considered inferior to continuous
flooding (Belder et al., 2005b; Peng et al., 2006; Zhou et al., 2011), although a few studies have observed equal
or slightly higher yields in aerobic conditions (Kato et al., 2009; Sánchez-Llerena et al., 2016). Thus, it is unclear

48
if this field gap is intrinsic to the differences in the irrigation regime or if aerobic rice just does not have well -
established genotypes and agronomic practices such as nitrogen management.
Nitrogen (N) is the most required and limiting nutrient to rice production in lowland environments,
and it currently consumes 16% of mineral N fertilizer produced in the world (Ladha et al., 2016). In order to
meet the rice demand of a fast-growing population, the N fertilizer production will need to reach 23 million tons
by 2030 (Daberkow et al., 2000). The global average of N use in rice is around 120 kg ha -1 year-1 (Ladha and
Chakraborty, 2016) although this rate can widely vary across production environments, such as aerobic system.
The world leader in rice production is China, and their N rate can reach 300-400 kg ha-1 (Zhao et al., 2012). The
Philippines and Vietnam use 100 kg ha-1 of N (Deb et al., 2016; Silva et al., 2017), and in Brazil it is 50 kg ha-1
across lowland and upland rice systems (FAO, 2004).
One of the reasons for such distinctions in N rates is its interdependence to other agroecosystem
factors (Fageria and Baligar, 2005). The nitrogen relationships with water management and indigenous N pools
are the most relevant issues causing different responses to N fertilizer applications (Somaweera et al., 2016; Tan
et al., 2015; Wang et al., 2016; Zhou et al., 2012). An integrated assessment of N and crop interaction is the
nitrogen use efficiency index (NUE) (Cassman et al., 2002; Ciampitti and Vyn, 2012; Dobermann et al., 2000).
A poor NUE negatively impacts the environment due to risk of nitrate leaching or runoff, air pollution and
greenhouse gas emissions – N2O derived from nitrification-denitrification processes (Cassman et al., 2003).
Traditionally, continuous flooding is described as the most suitable to provide a high NUE (Reddy and Patrick,
1976), although recent research has showed alternate wet and dry with moderate drying periods is able to deliver
the same NUE as CF (Pan et al., 2017; Sun et al., 2012; Wang et al., 2016; Ye et al., 2013). However, aerobic
irrigation regimes retain a stigma of providing low nitrogen use in rice crops (Belder et al., 2005a; Bouman et al.,
2005; Sharma et al., 2016; Somaweera et al., 2016; Zhou et al., 2012).
Grain yield is the ultimate crop parameter which responds to N fertilizer, although each yield
component has its own relationship to N availability. Above ground biomass (AGB) has a wide variable response
to site genotype among N management (Fageria and Santos, 2013; García et al., 2003; Somaweera et al., 2016).
Leaf area index (LAI) and N uptake are closely related to N site specificity (Ao et al., 2010; Murchie et al., 2002;
Zhong et al., 2003), although LAI is better set throughout genotype breeding (Fageria and Baligar, 2005; Long et
al., 2006). Number of spikelets, spikelet sterility and grain weight also respond to N (Kato et al., 2009; Lampayan
et al., 2010; Yao et al., 2012), although they seem to indirectly depend on N and crop attributes as plant density
and row spacing affect them strongly. Therefore, to propose an N strategy in aerobic rice, one must take into
account the integrated effect in all yield components.
Therefore, this research intends to integrate water and nitrogen factors to address the following
questions: (i) Do aerobic condition and continuous flooding influence differently crop response to N applied as
fertilizer, especially in a site condition where an aerobic regime seems be more suitable?(ii) What is the impact on
grain yield, given that not all yield components will interact in fertilizer nitrogen and irrigation regimes? iii) In
different irrigation regimes, where both supply water properly, the crop will performance be affected just by N
availability or could the aerobic condition itself influence plant development?

49
3.2. Material and Methods
3.2.1. Site Description
On farm experiments were established in the region of Lagoa da Confusão, State of Tocantins, in
Northern Brazil (10°46'39.80"S; 49°55'20.94"W and 190 m ASL) during the rainy season in the summers of 2014,
2015 and 2016. The local climate is classified as Aw – tropical wet and dry climate (Koeppen) - with average
rainfall of 1800 mm, mostly from September to May, and with an average temperature of 26.7°C. Figure 1
(chapter 1) shows rainfall and daily temperature for the three-year period of this study.
The soil is classified as a Plinthaquults (US Taxonomy) with a Plinthic horizon within 60 cm of depth
which has limited water percolation, without an impermeable layer. The physiochemical properties are shown in
Table 1 (chapter 1) The saturated theta (s) at 0-0.1m depth is 0.606 and 0.639 cm3 cm-3 in the 2015 and 2014/2016
sites, respectively. s to B plinthic (0.6 m and bellow) is 0.485 and 0.458, in 2015 and 2014/2016, respectively.
The macro, meso and micro porous size distribution for A horizon are 45%, 15% and 39% and in B plinthic are
31.9%, 4.5% and 63.6%, respectively.
The area was converted to agricultural use around 6 years before the start of the experiment under
crop rotation of rice during rainy season and soybean irrigated by sub-irrigation during the dry season (May to
September).
3.2.2. Field Experiment
The experimental design was a split-plot randomized complete block design with four replications
during 2014, 2015 and 2016 crop seasons. The main plot treatments were irrigation regime (IR): continuous
flooding (CF) and non-flooded rainfed aerobic (NF). CF had water input from rain and irrigation and NF just
from rain. Each main plot was further split into sub plots of four N fertilizer levels: 0, 50, 150 and 250 kg N ha-
1.
The main plots consisted of 105 m2 hydrologically independent plots with 50 cm high bunds and a 60
cm deep drain in the whole plot perimeter. Irrigation water was applied through a pressurized system with an
independent inlet for each plot. Initial irrigation took place roughly 25 days after seed emergence, and the water
level was maintained at 5-7 cm high in CF. A 25-day delay to trigger irrigation is common practice in Lagoa da
Confusao due to lack of water reservoirs. Water is pumped into rice basins from rivers at the onset of the rainy
season and rise in water level.
Nitrogen subplot treatments were randomized within each main plot. N was applied as pearled urea
(46% N) and split in four equal rates at the following developmental stages: sowing, tillering (V5-V6), panicle
initiation (R0) and collar formation of flag leaf (R2) (Counce et al. (2000). 5 mm of water was flushed after urea
application to promote incorporation into the soil.
Plots were sowed with IRGA 424 rice cultivar with a cycle of approximately 116 days in the tropical
region of Brazil. The crop was established in a dry seed sowing with row distance of 17 cm and plant density

50
after emergence of 150 plants m-2. Phosphorus and Potassium fertilizer was applied at the rate of 60 kg ha-1 P2O5
(as superphosphate) and 140 kg ha-1 K2O (as KCl).
3.2.3. Crop performance along seasons’ development
In the subplots of 0 and 150 kg N ha-1 in both irrigation regimes, measurements began 15 days after
emergence and were repeated every 15 days thereafter, completing 7 samplings each season. Plant above ground
biomass (AGB) and nitrogen content (NC) were determined by destructively sampling rice plants from 0.5 m2
collected in roughly 15-day intervals. Plants were cut at the stem base and chopped green. A representative
subsample was dried to constant weight in a 65C oven, and water content was extrapolated for the entire sample.
Nitrogen concentration was determined by the Kjeldahl method after acid digestion and total nitrogen uptake
(NU) was calculated as the product of N content (g kg-1) and plant biomass (g m-2).
The leaf area index (LAI) and the light extinction coefficient were indirectly determined with an optical
hemisphere sensor (LI-cor 2200, Li-cor, Inc., USA). All data collection occurred at approximately 09:00 am or
on cloudy days. One reading was taken over the canopy and 5 readings at the soil (or water) surface. Crop height
was measured at time of LAI sampling as the distance from soil surface to the last opened leaf.
3.2.4. Crop performance at harvest
At maturity, five plants per plot were randomly sampled to determine the number of spikelets per
panicle. Grains were manually detached from the rachis and weighed. Filled and unfilled grains were separated
by air blowing, counted and reweighed. Panicle density was counted inside a 0.5 m2 quadrat randomly settled
inside the subplot. AGB, NC and NU were determined the same as described during crop development. Grain
yield was determined by collecting 3 m2 of rice plants at 19-23% field moisture, and grains were separated from
plants using an experimental mechanical thresher (SB Maquinas, Cambé, PR). Impurities were separated in a
sample cleaner (Mediza, Panambi, RS) and moisture corrected to 13% in unhusked grains.
3.2.5. Evapotranspiration and water filled porous
Rainfall, radiation, air humidity and temperature data were measured hourly by a weather station (Davis
Vantage Pro2, Davis, Inc., USA). Irrigation water input (WI) was monitored by a flow hydrometer installed in all water
inlets. Fields were not drained, unless by percolation into the soil profile. Evapotranspiration (ETC) was estimated by
the Penman–Monteith equation, using the measured LAI and crop height. Zero plane displacement (d) and roughness
length for momentum (Zom) and vapor (Zoh) were estimated based on crop height (Allen, 1998). Crop surface
resistance (rs) was assumed as 80 sm-1of (rl) (Dingkuhn et al., 1999; Turner et al., 1986). The proportion of transpiration
and evaporation was determined according to the Bouguer-Lambert law, which measures radiation intercepted by the
crop canopy or soil surface (van Laar et al., 1997):
𝑇 = 𝐸𝑇𝐶 (1 − 𝑒(−𝑘𝐿𝐴𝐼)) eq. (6)
𝐸 = 𝐸𝑇𝐶 𝑒(−𝐾𝐿𝐴𝐼) eq. (7)
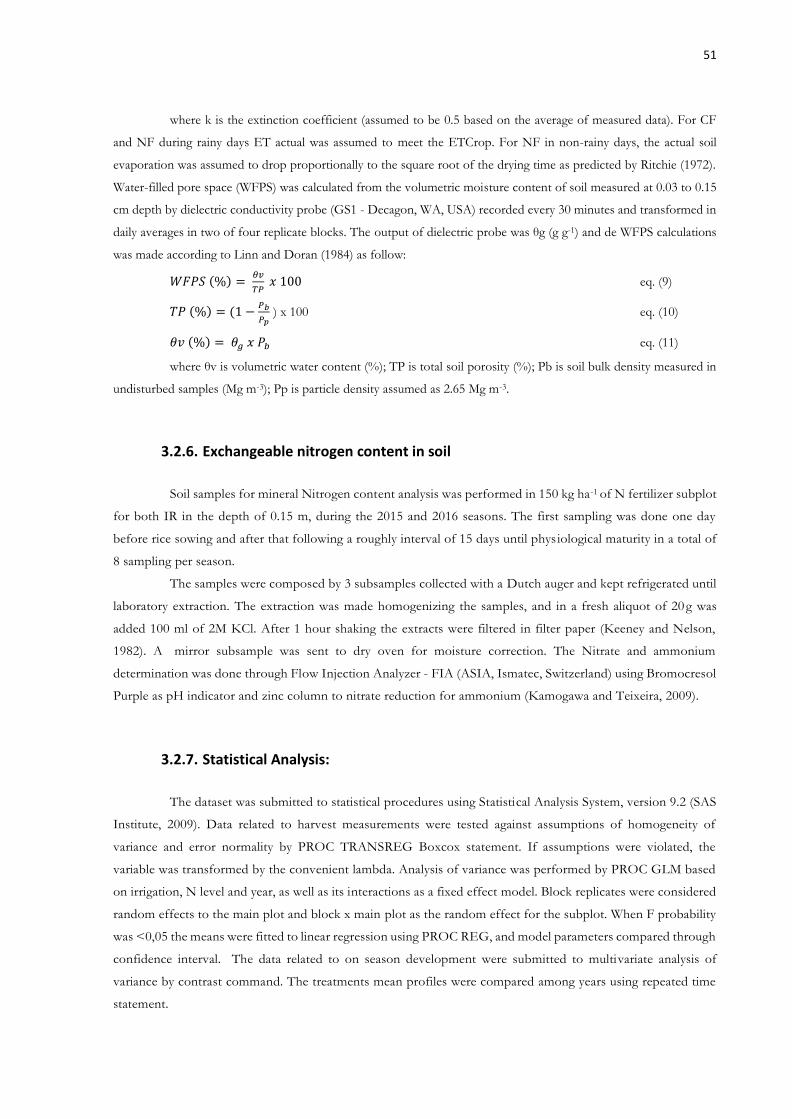
51
where k is the extinction coefficient (assumed to be 0.5 based on the average of measured data). For CF
and NF during rainy days ET actual was assumed to meet the ETCrop. For NF in non-rainy days, the actual soil
evaporation was assumed to drop proportionally to the square root of the drying time as predicted by Ritchie (1972).
Water-filled pore space (WFPS) was calculated from the volumetric moisture content of soil measured at 0.03 to 0.15
cm depth by dielectric conductivity probe (GS1 - Decagon, WA, USA) recorded every 30 minutes and transformed in
daily averages in two of four replicate blocks. The output of dielectric probe was θg (g g-1) and de WFPS calculations
was made according to Linn and Doran (1984) as follow:
𝑊𝐹𝑃𝑆 (%) = 𝜃𝑣
𝑇𝑃 𝑥 100 eq. (9)
𝑇𝑃 (%) = (1 −𝑃𝑏
𝑃𝑝 ) x 100 eq. (10)
𝜃𝑣 (%) = 𝜃𝑔 𝑥 𝑃𝑏 eq. (11)
where θv is volumetric water content (%); TP is total soil porosity (%); Pb is soil bulk density measured in
undisturbed samples (Mg m-3); Pp is particle density assumed as 2.65 Mg m-3.
3.2.6. Exchangeable nitrogen content in soil
Soil samples for mineral Nitrogen content analysis was performed in 150 kg ha-1 of N fertilizer subplot
for both IR in the depth of 0.15 m, during the 2015 and 2016 seasons. The first sampling was done one day
before rice sowing and after that following a roughly interval of 15 days until physiological maturity in a total of
8 sampling per season.
The samples were composed by 3 subsamples collected with a Dutch auger and kept refrigerated until
laboratory extraction. The extraction was made homogenizing the samples, and in a fresh aliquot of 20g was
added 100 ml of 2M KCl. After 1 hour shaking the extracts were filtered in filter paper (Keeney and Nelson,
1982). A mirror subsample was sent to dry oven for moisture correction. The Nitrate and ammonium
determination was done through Flow Injection Analyzer - FIA (ASIA, Ismatec, Switzerland) using Bromocresol
Purple as pH indicator and zinc column to nitrate reduction for ammonium (Kamogawa and Teixeira, 2009).
3.2.7. Statistical Analysis:
The dataset was submitted to statistical procedures using Statistical Analysis System, version 9.2 (SAS
Institute, 2009). Data related to harvest measurements were tested against assumptions of homogeneity of
variance and error normality by PROC TRANSREG Boxcox statement. If assumptions were violated, the
variable was transformed by the convenient lambda. Analysis of variance was performed by PROC GLM based
on irrigation, N level and year, as well as its interactions as a fixed effect model. Block replicates were considered
random effects to the main plot and block x main plot as the random effect for the subplot. When F probability
was <0,05 the means were fitted to linear regression using PROC REG, and model parameters compared through
confidence interval. The data related to on season development were submitted to multivariate analysis of
variance by contrast command. The treatments mean profiles were compared among years using repeated time
statement.

52
3.3. Results
3.3.1. Crop performance along seasons’ development
Mauchly’s Test of Sphericity for repeated measurements in time was performed to validate the
assumptions of multivariate normality and homogeneity of variance for aboveground biomass (AGB), nitrogen
uptake (NU), and nitrogen content (NC). The p-value was <0.05 for all three observed variables, therefore profile
analyses were performed.
Figure 3. Graphical profile of mean above ground biomass (AGB) (kg ha-1) during 2015 and 2016 growing seasons. Standard errors are given in each data mean. Different lowercase letters at end of mean profile refers to significant difference (p<0.05) according to MANOVA.
In 2015 and 2016 the mean profile of AGB among treatments CF 150, NF 150, CF 0 and NF 0 were
not significantly different (Figure 3) This indicates that the biomass and its increments among the growing seasons
of 2015 and 2016 were not affected by different IR and N levels. If biomass is taken into account just at
physiological maturity, in 2015 and 2016 the F test shows significance (p<0.05). It is reasonable to observe the
0
5
10
15
20
25
17 32 48 63 76 90 103
AG
B (
Mg
ha
-1)
2015
NF 150 NF 0
CF 150 CF 0
aaaa
0
5
10
15
20
25
17 35 45 59 73 91 108
AG
B (
Mg
ha
-1)
Days after emergence
2016
aaaa

53
difference only in final AGB due to grain yield participation on it. The mean AGB along the growing season was
0.3, 1.4, 4.4, 5.6, 9.3, 12.3 and 15.4 Mg ha-1 in 2015 and 0.2, 1.4, 3.8, 7.4, 9.6, 12.8 and 14.8 Mg ha -1 in 2016.
Figure 4. Graphical profile of mean plant nitrogen uptake (kg ha-1) during 2015 and 2016 growing seasons. Standard errors are given in each data mean. Different lowercase letters at end of mean profile refers to significant difference (p<0.05) according to MANOVA.
In 2015 the profile analysis of NU showed that NF 150 kg ha-1 had a higher overall uptake than CF
150, NF 0, and CF 0 across all sampling dates, and there was no significant difference between CF 150, NF 0,
and CF 0 (Figure 4). At floral differentiation occurred at 48 DAE (panicle initiation -R0) where NF 150 had
accumulated in its above ground biomass 127 kg ha-1 of N, while CF 0, CF 150 and NF 0 had, on mean, 78 kg
ha-1. At 90 DAE rice blast disease (Magnaporthae oryzae) impacted all experiment treatments, although NF 150 and
CF 150 were most affected. This caused NU reduction. At crop maturity, the total NU was 210 kg ha-1 for NF
150 kg-1 of N, followed by 153, 116 and 83 kg ha-1 for CF 150, NF 0 and CF 0, respectively.
Similarly, in 2016, the NF 150 treatment had a higher overall uptake than CF 150, CF 0 and NF 0
across all sampling dates (p<0.05) (Figure 4). Also like 2015, the N uptake distinction among IR and N levels
0
50
100
150
200
250
17 32 48 63 76 90 103
NU
(k
g h
a-1)
2015NF 150 NF 0
CF 150 CF 0a
b
b
b
0
50
100
150
200
250
17 35 45 59 73 91 108
NU
(k
g h
a-1)
Days after emergence
2016
a
bcc

54
occurred roughly in panicle initiation (45 DAE). However, a difference from 2015 was that CF 150 had the next
highest N uptake, and was significantly higher than CF 0 and NF 0. In 59, 91 and 108 DAE the NF 150 remained
with a NU higher than all other treatments, although at 73 DAE there was no difference among IR and N levels.
In 2016 the rice blast hit the crop later than 2015, causing loss of biomass mainly in NF 150 and CF 150
and leading to the absence of a difference in NU at 73 DAE. The final N uptake was 190, 140, 118 and 105 kg
ha-1 in NF 150, CF 150, NF 0 and CF 0 respectively.
Figure 5. Graphical profile of nitrogen content in plant tissue (g kg-1) during 2015 and 2016 growing seasons. Standard errors are given in each data mean. Different lowercase letters at end of mean profile refers to significant difference (p<0.05) according MANOVA.
Regarding N content (NC) in above ground biomass, the standard error showed a smaller interval than
those observed in NU and AGB. Therefore, profile analysis could better differentiate NC among treatments
(Figure 5). In 2015, the NC profile was the same between NF 150 and CF 150 being superior to CF 0. The
differentiation among profiles occurred at 32 DAE, and similar to NU, NF 150 had the highest NC from that
stage onward. At panicle initiation, NC was 27.8 g kg-1 in NF 150, 21.2 g kg-1 in CF 150 and 13 g kg-1 in CF 0 and
0
10
20
30
40
50
17 32 48 63 76 90 103
NC
(g
kg-1)
2015
NF 150 NF 0
CF 150 CF 0
aabbcc
0
10
20
30
40
50
17 35 45 59 73 91 108
NC
(g
kg
-1)
Days after emergence
2016
abbcc

55
NF 0. At crop maturity, NC was 11, 9.5, 8.2 and 6.8 g kg-1 for NF 150, CF 150, NF 0 and CF 0, respectively. In
2016, the mean NC profile of NF 150 was the highest over the growing season, followed by CF 150 and NF 0,
however CF 150, NF 0 and CF 0 were all the same. The differentiation among profiles occurred at 59 DAE,
which is 27 days later than 2015, and just between 0 and 150 N levels. At panicle initiation, mean NC for all
treatments was 25.3 g kg-1. At physiological maturity mean NC was 9.7, 7.9, 6.9 and 5.8 g kg-1 for NF 150, CF
150, NF 0 and CF 0, respectively. In both years, leaf tissue NC decreased as crop development progressed.
LAI also was affected by N level and IR. The mean profile of LAI throughout the 2015 growing season
was highest for NF 150, followed by CF 150, NF 0 and CF 150 (figure 6). At panicle initiation NF LAI was 5.2
m2 m-2 and was higher than all other treatments, which had a mean of 4.4 (m2 m-2) without distinction among
them. In the sampling dates after PI, CF 150, NF 0 and CF 150 became significantly different, with this trend
continuing until harvest. The final LAI was 8.3, 7.4, 5.1 and 3.8 m2 m-2 in NF 150, CF 150, NF 0 and CF 0,
respectively. In 2016, the differences between mean profiles was less pronounced than 2015. At panicle initiation,
all treatments had an equivalent LAI of 3.05 m2 m-2. The distinction occurred at 73 DAE and just among N levels.
NF 150 and CF 150 were 4.8, and NF 0 and CF 0 were 3.8 m2 m-2, on average. At harvest the LAI in NF 150
was 6.1 m2 m-2, and it was statistically similar to CF 150, which had a mean of 5.43 m2 m-2. NF 0 and CF 0 had
an LAI of 4.3 and 3.6 m2 m-2 respectively. At 73 DAE the decrease of LAI was related to blast disease, as well as
NU. In 2015 the effects of the fungus were not visible in the profile due to fewer sampling dates.

56
Figure 6. Graphical profile of leaf area index (LAI) (m2 m-2) during 2015 (A) and 2016 (B) growing seasons. Standard errors are given in each data mean. Different lowercase letters at end of mean profile refers to significant difference (p>0.05) according to MANOVA.
0
3
5
8
10
17 32 48 63 76 90
LA
I (m
2m
-2)
2015NF150 NF0
CF150 CF0 ab
c
d
0
3
5
8
10
17 35 45 59 73 91 108
LA
I (m
2m
-2)
Days After Emergence
2016
aabbcc

57
Figure 7. Estimated accumulative Transpiration (T), Evaporation (E) and Evapotranspiration (ET –mm day-1) during the 2015 (A; C; E) and 2016 (B; D; F) growing seasons.
The accumulative transpiration and evaporation rates began to differentiate among treatments shortly
after irrigation treatments started (figure 7). This differentiation was around 31 DAE in 2015 and 39 DAE in
2016. The main crop attribute that was affected by IR and nitrogen level was LAI (Figure 6) which is one
parameter of ET estimation. In 2015, the daily mean T was 3.6, 3.8, 2.7 and 3.3 mm day-1 for CF 150, NF 150,
CF 0 and NF 0, respectively. In 2016 T was 3.2, 3.4, 2.8 and 3.0 mm day-1 for CF 150, NF 150, CF 0 and NF 0
respectively. Water evaporation was also affected by IR and N levels, with the highest estimated E in CF 0 in
both years, with a mean of 1.5 mm day-1. CF 150 was next highest with 1.0 and 1.2 mm day-1 in 2015 and 2016,
respectively. Evaporation in NF 0 and NF 150 was 0.8 and 1.0 mm day-1 in 2015 and 1.0 and 0.9 mm day-1 in
2016. Despite having a higher IAF than NF 0 (figure 7), the higher evaporation in CF 150 was due to the influence
of ponding water in the ET estimation model. The consolidation of T and E in ET shows a daily mean ET of
0
100
200
300
400
500
1 20 39 58 77 96 115
T (
mm
)A
NF 150 NF 0
CF 150 CF 0
0
100
200
300
400
500
1 20 39 58 77 96 115
B
0
100
200
1 20 39 58 77 96 115
E (
mm
)
C
0
100
200
1 20 39 58 77 96 115
D
0
100
200
300
400
500
600
1 20 39 58 77 96 115
ET
(m
m)
Days after emergence
E
0
100
200
300
400
500
600
1 20 39 58 77 96 115
Days after emergence
F

58
4.4, 4.5, 4.1 and 4.2 respectively to NF 150, CF 150, NF 0 and CF 0 in 2015 and 4.2, 4.3, 4.2 and 3.9 to NF 150,
CF 150, NF 0 and CF 0 in 2016.
The WFP ranged from 24 to 100% across IR and growing seasons. The lowest values of WFP were
observed in 2015 before the CF irrigation started in an uncommonly long rainfall interval. Both IR were equally
exposed to it and crop showed signs of drought stress. In 2015 after IR started the WFP in CF remained at 100%
as expected, while NF ranged from 58 to 65%, averaging 62%. In 2016 the rainfall was poorly distributed and
the WFP was widely ranged in NF, from 43 to71%, averaging 59% from beginning of irrigation in CF to harvest.
Figure 8. Water-filled pore spaces (% - WFPS) at 0.0 – 0.15 m in a Plinthaquults. The treatments are: continuous flooding (CF);
non-flooding aerobic (NF) along 2015 and 2016 seasons. The red bars indicate when irrigation started.
There were differences among IR in availability of N exchangeable in soil (0-0.15 depth) only at 45/46
DAE. In 2015, there was 48 kg ha-1 of ammonium in NF while in CF it was 34 kg ha-1. In 2016, there was 46 kg ha-1
of ammonium 1 in NF and CF 36 kg ha-1. The same trend was observed for nitrate. In 2015, it was also higher in NF
(26 kg ha-1) than CF (16 kg ha-1) whereas in 2016 for NF was 39kg ha-1 and CF 24 kg ha-1. After 59 DAE onwards the
0.0
0.1
0.2
0.3
0.4
0.5
0.6
0.7
0.8
0.9
1.0
5 15 25 35 45 55 65 75 85 95 105 115
WF
PS
(%
)
2015
NF CF
0.1
0.2
0.3
0.4
0.5
0.6
0.7
0.8
0.9
1.0
0 10 20 30 40 50 60 70 80 90 100 110
WF
PS
(%
)
Days After Emergence
2016

59
ammonium and nitrate content ranged from 2-5 kg ha-1 and were not different among them. In 2015 nitrate and
ammonium presented similar values in soil before the experiment was installed, roughly 10 kg-1 for both of them, and
in 2016 nitrate was 23 kg ha-1 and ammonium 10 kg ha-1.
Figure 9. Exchangeable mineral nitrogen among rice growing seasons (Kg ha-1). A) Ammonium N in 2015; B) Nitrate in
2015; C) Ammonium in 2016; D) Nitrate in 2016.
3.3.2. Crop performance at harvest
Table 8. Analysis of Variance probability for above ground biomass, N uptake and N content in above ground biomass, number of spikelets per panicle, panicle density (panicle m-2) and grain yield of rice. The fixed effects are irrigation regimes (continuous
flooding and non-flooding); nitrogen levels (0, 50, 150 and 250 kg ha-1) and growing seasons (2014, 2015 and 2016).
Source of variation Biomass N uptake N content Spikelet Panicle Grain Yield
Irrigation regime (I) 0.04* <0.01** 0.03* 0.23 ns <0.01** 0.03*
Nitrogen level (N) <0.01** <0.01** <0.01** <0.01** <0.01** <0.01**
Year (Y) <0.01** 0.05* <0.01** <0.01** <0.01** <0.01**
I x N 0.04* 0.26 ns 0.12 ns 0.22 ns 0.03* <0.01**
Y x I <0.01** 0.12 ns 0.45 ns 0.02* 0.13 ns 0.03*
Y x N 0.04* 0.09 ns <0.01** 0.71 ns 0.66 ns <0.01**
Y x I x N 0.46ns 0.78 ns 0.56 ns 0.61 ns 0.66 ns 0.32ns
ns: not significant; * Significant at p ≤ 0.05; ** Significant at p ≤ 0.01 by ANOVA F test.
0
10
20
30
40
50
60
0 21 34 45 59 73 91 101
N-N
H4+
(kg
ha-1
)
ACF NF
0
10
20
30
40
50
60
70
0 21 34 45 59 73 91 101
N-N
O3-(K
g h
a-1)
B
0
10
20
30
40
50
60
70
0 12 30 46 59 74 89 103
N-N
H4+
(kg
ha-1
)
Days after emergence
C
0
20
40
60
0 12 30 46 59 74 89 103
N-N
O3-(k
g h
a-1)
Days after emergence
D
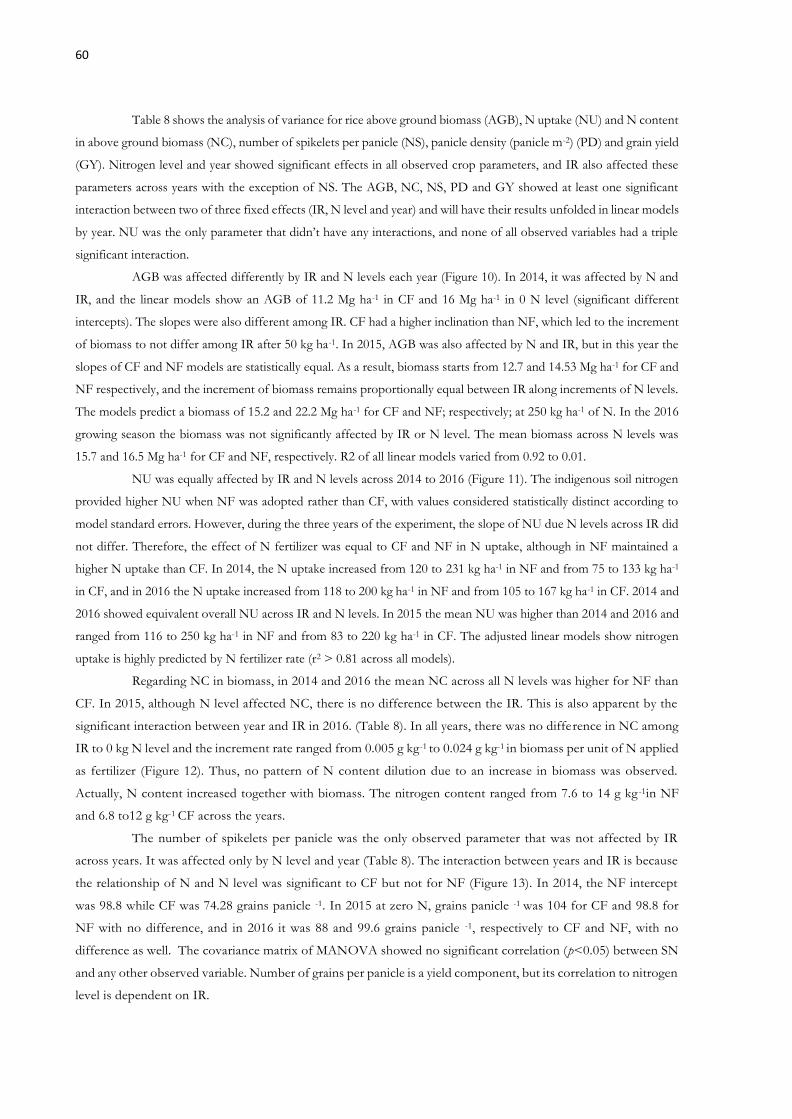
60
Table 8 shows the analysis of variance for rice above ground biomass (AGB), N uptake (NU) and N content
in above ground biomass (NC), number of spikelets per panicle (NS), panicle density (panicle m-2) (PD) and grain yield
(GY). Nitrogen level and year showed significant effects in all observed crop parameters, and IR also affected these
parameters across years with the exception of NS. The AGB, NC, NS, PD and GY showed at least one significant
interaction between two of three fixed effects (IR, N level and year) and will have their results unfolded in linear models
by year. NU was the only parameter that didn’t have any interactions, and none of all observed variables had a triple
significant interaction.
AGB was affected differently by IR and N levels each year (Figure 10). In 2014, it was affected by N and
IR, and the linear models show an AGB of 11.2 Mg ha-1 in CF and 16 Mg ha-1 in 0 N level (significant different
intercepts). The slopes were also different among IR. CF had a higher inclination than NF, which led to the increment
of biomass to not differ among IR after 50 kg ha-1. In 2015, AGB was also affected by N and IR, but in this year the
slopes of CF and NF models are statistically equal. As a result, biomass starts from 12.7 and 14.53 Mg ha-1 for CF and
NF respectively, and the increment of biomass remains proportionally equal between IR along increments of N levels.
The models predict a biomass of 15.2 and 22.2 Mg ha-1 for CF and NF; respectively; at 250 kg ha-1 of N. In the 2016
growing season the biomass was not significantly affected by IR or N level. The mean biomass across N levels was
15.7 and 16.5 Mg ha-1 for CF and NF, respectively. R2 of all linear models varied from 0.92 to 0.01.
NU was equally affected by IR and N levels across 2014 to 2016 (Figure 11). The indigenous soil nitrogen
provided higher NU when NF was adopted rather than CF, with values considered statistically distinct according to
model standard errors. However, during the three years of the experiment, the slope of NU due N levels across IR did
not differ. Therefore, the effect of N fertilizer was equal to CF and NF in N uptake, although in NF maintained a
higher N uptake than CF. In 2014, the N uptake increased from 120 to 231 kg ha-1 in NF and from 75 to 133 kg ha-1
in CF, and in 2016 the N uptake increased from 118 to 200 kg ha-1 in NF and from 105 to 167 kg ha-1 in CF. 2014 and
2016 showed equivalent overall NU across IR and N levels. In 2015 the mean NU was higher than 2014 and 2016 and
ranged from 116 to 250 kg ha-1 in NF and from 83 to 220 kg ha-1 in CF. The adjusted linear models show nitrogen
uptake is highly predicted by N fertilizer rate (r2 > 0.81 across all models).
Regarding NC in biomass, in 2014 and 2016 the mean NC across all N levels was higher for NF than
CF. In 2015, although N level affected NC, there is no difference between the IR. This is also apparent by the
significant interaction between year and IR in 2016. (Table 8). In all years, there was no difference in NC among
IR to 0 kg N level and the increment rate ranged from 0.005 g kg-1 to 0.024 g kg-1 in biomass per unit of N applied
as fertilizer (Figure 12). Thus, no pattern of N content dilution due to an increase in biomass was observed.
Actually, N content increased together with biomass. The nitrogen content ranged from 7.6 to 14 g kg -1in NF
and 6.8 to12 g kg-1 CF across the years.
The number of spikelets per panicle was the only observed parameter that was not affected by IR
across years. It was affected only by N level and year (Table 8). The interaction between years and IR is because
the relationship of N and N level was significant to CF but not for NF (Figure 13). In 2014, the NF intercept
was 98.8 while CF was 74.28 grains panicle -1. In 2015 at zero N, grains panicle -1 was 104 for CF and 98.8 for
NF with no difference, and in 2016 it was 88 and 99.6 grains panicle -1, respectively to CF and NF, with no
difference as well. The covariance matrix of MANOVA showed no significant correlation (p<0.05) between SN
and any other observed variable. Number of grains per panicle is a yield component, but its correlation to nitrogen
level is dependent on IR.
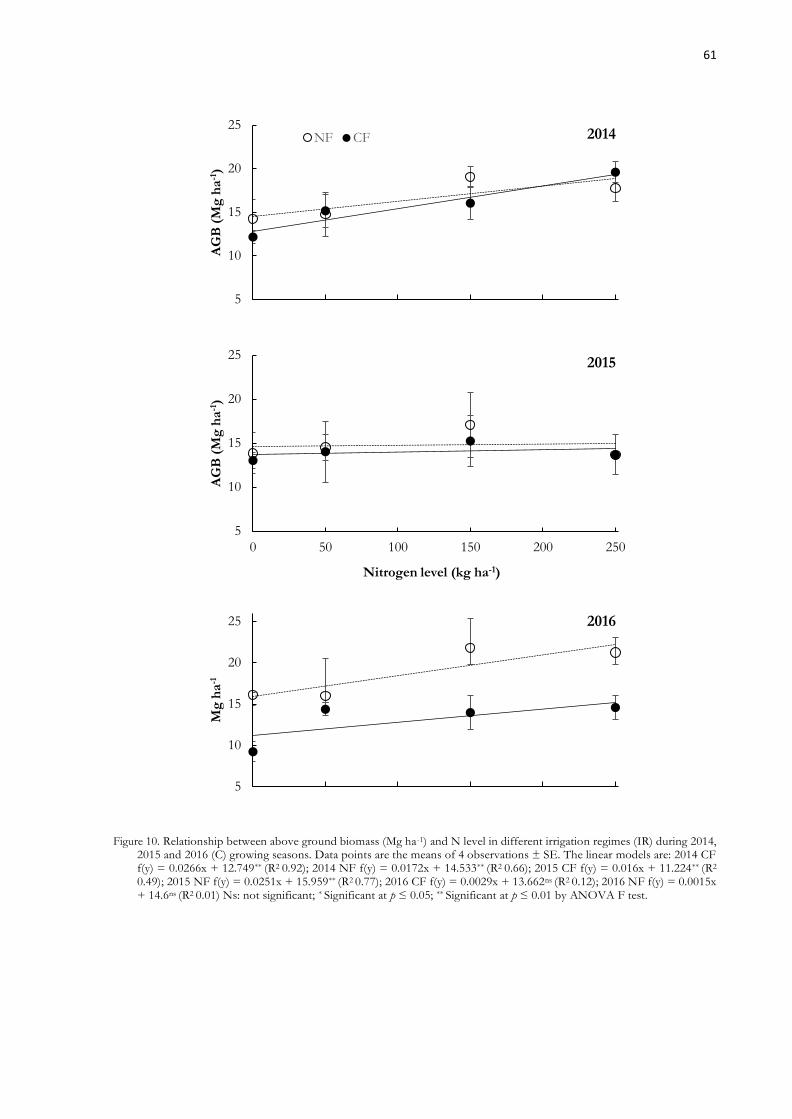
61
Figure 10. Relationship between above ground biomass (Mg ha-1) and N level in different irrigation regimes (IR) during 2014, 2015 and 2016 (C) growing seasons. Data points are the means of 4 observations ± SE. The linear models are: 2014 CF f(y) = 0.0266x + 12.749** (R2 0.92); 2014 NF f(y) = 0.0172x + 14.533** (R2 0.66); 2015 CF f(y) = 0.016x + 11.224** (R2
0.49); 2015 NF f(y) = 0.0251x + 15.959** (R2 0.77); 2016 CF f(y) = 0.0029x + 13.662ns (R2 0.12); 2016 NF f(y) = 0.0015x + 14.6ns (R2 0.01) Ns: not significant; * Significant at p ≤ 0.05; ** Significant at p ≤ 0.01 by ANOVA F test.
5
10
15
20
25
0 50 100 150 200 250
AG
B (
Mg
ha
-1)
2014NF CF
5
10
15
20
25
0 50 100 150 200 250
AG
B (
Mg
ha
-1)
Nitrogen level (kg ha-1)
2015
5
10
15
20
25
0 50 100 150 200 250
Mg
ha
-1
2016

62
Figure 11. Relationship between nitrogen uptake (NU) and N level in different irrigation regimes (IR) during 2014, 2015 and 2016 growing seasons. Data points are the means of 4 observations ± SE. The linear models are: 2014 CF f(y) = 0.2053x + 86.67** (R2 0.82); 2014 NF f(y) = 0.4401x + 124.23** (R2 0.99); 2015 CF f(y)= 0.5267x + 83.504** (R2 0.99); 2015 NF f(y) = 0.5577x + 115.78** (R2 0.99); 2016 CF f(y) = 0.2671x + 99.126** (R2 0.97); 2016 NF f(y) = 0.337x + 125.88** (R2
0.88). Ns: not significant; * Significant at p ≤ 0.05; ** Significant at p ≤ 0.01 by ANOVA F test
50
100
150
200
250
0 100 200
NU
(k
g h
a-1)
2014
NF CF
50
100
150
200
250
0 50 100 150 200 250
NU
(k
g h
a-1)
2015
50
100
150
200
250
0 50 100 150 200 250
NU
(k
g h
a-1)
Nitrogen level (kg ha-1)
2016

63
Figure 12. Relationship between nitrogen content in above ground biomass (NC) and N level in different irrigat ion regimes (IR) during 2014, 2015 and 2016 growing seasons. Data points are the means of 4 observations ± SE. The linear models are: 2014 CF f(y) = 0.0055x + 7.7467** (R2 0.75); 2014 NF f(y) = 0.0146x + 7.9517 ** (R2 0.75); 2015 CF f(y)= 0.0178x + 6.7479** (R2 0.99); 2015 NF f(y) = 0.0244x + 7.6258** (R2 0.96); 2016 CF f(y) = 0.0189x + 7.5903 (R2 0.89**); 2016 NF f(y) = 0. 0.0219x + 9.3432*s (R2 0.86). Ns: not significant; * Significant at p ≤ 0.05; ** Significant at p ≤ 0.01 by ANOVA F test.
5
10
15
0 50 100 150 200 250
NC
(g
kg
-1)
2014NF CF
5
10
15
0 50 100 150 200 250
NC
(g
kg
-1)
2015
5
10
15
0 50 100 150 200 250
NC
(g
kg
-1)
Nitrogen level (kg ha-1)
2016

64
Figure 13. Relationship between number of spikelet (NS) and N level in different irrigation regimes (IR) during 2014, 2015 and 2016 growing seasons. Data points are the means of 4 observations ± SE. The linear models are: 2014 CF f(y) = 0.0878x + 74.28* (R2 0.91); 2014 NF f(y) = 0.0136x + 98.76ns (R2 0.03); 2015 CF f(y)= 0.069x + 104.37* (R2 0.88); 2015 NF f(y) = 0.069x + 104.37ns (R2 0.58); 2016 CF f(y) = 0.0913x + 88.053* (R2 0.98); 2016 NF f(y) = 0.0357x + 99.584ns
(R2 0.41). Ns: not significant; * Significant at p ≤ 0.05; ** Significant at p ≤ 0.01 by ANOVA F test.
The panicle density of CF was significantly affected by N level across all years (Figure 14), and no
influence was observed for NF in any year, although the mean PD was higher in NF than CF across N levels and
years. At 0 kg N level, panicle density was 310 panicles m -2 in NF and 218 panicles m-2 in CF for 2014, 373
panicles m-2 in NF and 245 panicles m-2 in CF for 2015, and 272 panicles m-2 in NF and 199 panicles m-2 in CF
for 2016. The model which best adjusted to PD as a function of N level was quadratic in 2014 and 2015. The
50
75
100
125
150
0 50 100 150 200 250
Nu
mb
er
of
Sp
ikele
t
2014NF CF
50
75
100
125
150
0 50 100 150 200 250
Nu
mb
er
of
Sp
ikele
t
2015
50
75
100
125
150
0 50 100 150 200 250
Nu
mb
er
of
spik
ele
t
Nitrogen level (kg ha-1)
2016

65
highest predicted PDs were 281 and 340 panicles m-2 at N levels of 153 and 175 kg ha-1, respectively for 2014
and 2015. For 2016, the data was best fit by a first order linear model with a panicle increment rate in CF irrigation
of 0.29 panicle kg-1 of N.
Figure 14. Relationship between panicle density (PD) and N level in different irrigation regimes (IR) during 2014, 2015 and 2016 growing seasons. Data points are the means of 4 observations ± SE. The linear models are: 2014 CF f(y) = 0.0037x2
+ 1.1309x + 194.79* (R2 0.99); 2014 NF f(y) = 0.0308x + 310.22ns (R2 0.03); 2015 CF f(y)= -0.0039x2 + 1.3705x + 220.56*
(R2 0.61); 2015 NF f(y) = 0.0576x + 373.56ns (R2 0.13); 2016 CF f(y) = 0.2873x + 199.43** (R2 0.96); 2016 NF f(y) = 0.1051x + 271.91ns (R2 0.24). Ns: not significant; * Significant at p ≤ 0.05; ** Significant at p ≤ 0.01 by ANOVA F test.
150
200
250
300
350
400
450
0 50 100 150 200 250
Pan
icu
le m
-2
2014NF CF
150
200
250
300
350
400
450
0 50 100 150 200 250
Pan
icu
le m
-2
2015
150
200
250
300
350
400
450
0 50 100 150 200 250
Pan
icu
le m
-2
Nitrogen rate (kg ha-1)
2016

66
Grain yield was affected by IR and N level in all years (Figure 15). In 2014, the polynomial models
showed a GY of 4.0 Mg ha-1 in CF and 5.8 Mg ha-1 in NF at 0 kg ha-1 N. The slopes and intercepts were
significantly different among IR according to model confidence intervals. The maximum point of GY occurred
earlier in NF than in CF with 8.1 Mg ha-1 at N level of 162 kg ha-1 and 8.0 Mg ha-1 at N level of 282 kg ha-1. In
2015, at zero N level GY was 7.4 Mg ha-1 in NF and 5.6 Mg ha-1 in CF. At 50 kg ha-1 of N level the GY in NF
was still higher to NF than CF, but in 150 and 250 kg ha-1 CF and NF showed the same GY. In 2016, mean GY
across N rates was higher in NF than CF, but there was no difference in the model parameters among IR.

67
Figure 15. Relationship between grain yield (GY) and N level for continuous flooding (CF) and non-flooding (NF) in 2014, 2015 and 2016 growing seasons. Data points are the means of 4 observations ± SE. The linear models are:2014 CF f(y) = -0.00005x2 + 0.0282x + 4.0124* (R2 0.99); 2014 NF f(y) = -0.00008x2 + 0.026x + 5.975** (R2 0.94); 2015 CF f(y)= - 0.00014x2 + 0.0498x + 5.5673** (R2 0.92); 2015 NF f(y) -0.00016x2 + 0.0481x + 7.3772** (R2 0.92); 2016 CF f(y) = -0.00006x2 + 0.0272x + 5.3467* (R2 0.99); 2016 NF f(y) = -0.00004x2 + 0.0201x + 6.3315* (R2 0.98). Ns: not significant; *Significant at p ≤ 0.05; ** Significant at p ≤ 0.01 by ANOVA f test.
3
6
8
11
13
0 50 100 150 200 250
GY
(M
g h
a-1)
2014CF NF
3
6
8
11
13
0 50 100 150 200 250
GY
(M
g h
a-1)
2015
3
6
8
11
13
0 50 100 150 200 250
GY
(M
g h
a-1)
Nitrogen Rate (kg ha-1)
2016
CF NF

68
The GY was highly predicted by N level in the observed interval. R2 of all models ranged from 0.92 to
0.99. The MANOVA covariance matrix showed significant correlation (p<0.05) between GR and PD.
The relationship between NU and GY showed two statically different linear models in each IR (CF
and NF) across all fertilizer nitrogen levels in 2014, 2015 and 2016 (figure 16). For CF data, the model starts with
a lower intercept than NF data (6.1 in NF versus 3.4 in CF) but has a higher slope (0.03 in CF versus 0.01 in NF).
The R2 in CF is 0.5 indicating a fair predicted relation while in NF R2 is only 0.17. Both models show a trend of
increasing GY over the increment of accumulate NU, but with a different gain rate.
Figure 16. Relationship between nitrogen uptake in aboveground biomass (NU) at crop maturity and grain yield (GY) in 2014, 2015 and 2016 growing seasons. The linear models are: CF f(y) = 0.0294x + 3.4012 ** (R2 = 0.51); NF f(y) = 0.0111x +6.115 ** (R2 = 0.17). Ns: not significant; * Significant at p ≤ 0.05; ** Significant at p ≤ 0.01 by ANOVA f test
3.4. Discussion
3.4.1. Crop performance along seasons’ development
Crop components were differently affected by IR and N levels throughout the growing seasons. The
lack of influence among NF, CF and N rates in AGB mean profile is because none of them limited crop
development (Figure 3). Although biomass and grain yield are closely related in different genotypes (Zhang et al.,
2004), for a given variety, rice GY is more closely related to post heading biomass relative to panicle and spikelet
mass (Ao et al., 2010; Ye et al., 2013). As the profile analysis considers the whole cycle means, the differences
during grain filling and crop maturity were not enough to drive significance to the analyses, and this is confirmed
by the non-significant correlation between AGB and any other crop parameter in the MANOVA matrix. During
the vegetative stages NU and LAI were the crop components significantly affected by IR and N (Figure 4 and
6).
Throughout the crop development in 2015 and 2016, the nitrogen accumulative uptake was higher in
NF 150 than CF 150, and it concisely occurred after ponding water started in the CF treatment (Figure 4). N
uptake is impaired in alternative irrigation methods compared to CF (Belder et al., 2005a; Peng et al., 2006; Rose
et al., 2016; Tan et al., 2015; Yao et al., 2012). Poorer crop performance is related to water absence or nitrate
leaching and denitrification (Devkota et al., 2013; Zhou et al., 2011). However, our results point in the opposite
3
6
8
11
13
50 100 150 200 250 300
GY
(M
g h
a-1)
kg ha-1
69
direction. NU increased even with AGB remaining unaffected by IR and N levels. Some studies have recently
presented data on the pattern of greater N accumulation in rice plants grown under aerobic conditions (Pan et al.,
2017; Sun et al., 2012; Ye et al., 2013). The NC throughout 2015 and 2016 was affected by IR and N levels, and
NF provided statistically higher NC than CF in both years at 150 to 0 kg ha-1 (Figure 5). As a result, NC lead to
the observed differences in NU. The increasing accumulative N uptake until crop maturity (despite the punctual
N decrease due to blast strike) shows the importance in IR/N management, providing N availability to crop
uptake until later stages of development as also seem in Fageria and Santos (2013); Somaweera et al. (2016).
Aerobic soil condition is related to higher rates of indigenous N mineralization than anaerobic (Aulakh et al.,
2000; Kader et al., 2013; Updegraff et al., 1995), and keeping soil in aerobic conditions the entire cycle contributes
to the greatest NU in NF.
In our study, LAI was affected by IR and N levels, and it explains the differences estimated in
transpiration and evaporation. LAI is largely reported as dependent of IR and N levels (Alberto et al., 2011;
Belder et al., 2005a; Bouman and van Laar, 2006; Pan et al., 2017; Wang et al., 2016), although when crop water
requirements are fully met, due to adequate supplies in IRs, (actual ET is equal to potential crop ET) there is no
differences in LAI (Pan et al., 2017). The leaf blade represents an important N sink during vegetative development
until grain filling (Murchie et al., 2002; Somaweera et al., 2016), therefore LAI is affected by indigenous N and
fertilizer (Figure 6). The more transpiration impacts the ET, the higher the water use efficiency and crop
performance will be in a given site and genotype (Bouman et al., 2007; Bouman and Tuong, 2001), since
evaporated water from soil or pond water has no effect in carbon assimilation. Figure 7 showed the accumulative
transpiration across years. Transpiration was 8% higher in NF than CF while evaporation was 34% lower. The
higher transpiration in NF compared to CF is lined up to the overall better performance of NF in crop
performance at maturity.
The WFPS in 20015 and 2016 averaged around the optimum air / water balance of 60% (62% in 2015
and 59% in 2016) which is related as maximum aerobic activity in the soil. At this WFPS soil provided no limiting
oxygen and water supply for microorganism development (Linn and Doran, 1984). Around 60% of WFPS the
nitrification, ammonification and organic matter decomposition are in the maximum rate, while denitrification is
not pronounced until 70% to 100% of WFPS (Bouwman, 1998). Exchangeable nitrogen was higher in either
ammonium and nitrate around 45 DAE in both years (Figure 09), and higher N availability in aerobic rice was
also reported by Cai et al., (2001) and Devkota et al. (2013). High aerobic activity in NF leaded to the higher NU
and the associated benefit to crop development than CF. The increasing of N availability close to crop panicle
initiation, which is the phenological stage related to grain yield express its potential, was also contributed even
more to the best overall crop performance in NF.
3.4.2. Crop performance at harvest
At crop maturity AGB showed a poor relationship to N level among years, and most of the variation
was not explained by irrigation or N applied as fertilizer. In addition, the lack of covariance to any other yield
component led us to conclude the AGB in a given site, year and genotype is useless to predict GY among different
IR. Differently, NU is highly related to N rate, and also highly affected by IR. However, the linear response and
statistically equally slopes in NF and CF does not show optimum N rate to be applied within 0 to 250 kg ha -1 of

70
N intervals. The higher the N fertilizer, the higher NU will be in both IRs. Therefore, to use these relationships
to propose a N fertilizer rate aimed to best NU under an agronomic point of view is also meaningless.
PD was the yield component more elucidative to explain the effects of IR in GY, and not just because
of their positive covariance. The lack of N rate effecting PD in NF but having an effect in CF shows the first
crop parameter behaving concisely differently among IRs. PD is directly related to tillering in a fixed sowing
density. The active tillering period in rice comprises from the 5 th leaf till just before panicle differentiation (20 to
45 DAE) (Moldenhauer et al., 2015). This is stimulated by incident radiation in the axillary bud (Hanada, 1993),
and it is closely related to N content in AGB (Ahmed et al., 2016; Tanaka and Garcia, 1965; Wang et al., 2016;
Zhong et al., 2003). In our study, the absence of ponding water in NF might have increased tillering due the
radiation issue, but the non- response to N fertilizer is because NF provided enough N from indigenous soil
sources to express tillering potential.
However, CF depended on applied fertilizer to provide PD increases. The maximum PD was
supported by 153 and 175 Kg ha-1 of N in 2015 and 2016, respectively. The NU had a positive correlation with
PD, and PD in turn, had a positive correlation to GY in the covariance matrix of MANOVA.
The different relationship between NU and GY at crop maturity in NF and CF (Figure 16) shows us
the irrigation regime can create a substantial alteration in nitrogen use by rice. Although for both IRs GY is
positively related to NU, in CF the GY is better predicted by NU (R2 0.5) than NF (R2 0.17). This indicates that
IR is not just ruling the availability of N in soil, leading to different NU, but it is also interfering in crop
development in an indirect manner. The aerobic soil increases nitrification (Devkota et al., 2013; Dong et al.,
2012; Zhou et al., 2012) and absorbing N as nitrate (N-NO3-) is a signal for plant growth (Crawford, 1995). The
NF might have raised the N- NO3- fraction in NU, and this stimulated the plant to a higher development.
Increasing N-NO3- content in nitrogen supplies increases rice dry weight cultivated in nutrient solution
(Holzschuh et al., 2009; Ying-Hua et al., 2007). Our data supports this assumption because the intercept of the
NF model is higher than CF, which means in the lower NU threshold NF provided greater GY than CF. On the
other hand, excess of N-NO3- in plant tissue turns rice more susceptible to blast disease (Osuna-Canizalez et al.,
1991) and indeed blast occurred in a higher severity in NF than in CF at 150-250 kg ha-1 of fertilizer N, partially
compromising GY.
The GY and N fertilizer relationship among IRs were very tidy (Figure 13), and their statically different
model parameters in 2014 and 2015 confirm our hypothesis that fertilizer management must be adjusted for
particularly IRs. The recommended fertilizer N rate commonly practiced in this region of Brazil ranges from 90
to 120 kg ha-1 of N (Santos and Santiago, 2014), although growers rarely go over 100 kg ha -1 as part of integrated
blast management. Our data showed a GY 17%, 11% and 5% higher in NF than CF at simulated 120 kg ha -1 N
fertilizer in 2014, 2015 and 2016, respectively. If lower rates than 120 kg ha-1 were used, greater differences
between IRs would be expected.
3.5. Conclusion
The hypothesis that the irrigation regime is able to influence the nitrogen uptake by rice and therefore
crop performance was confirmed. Throughout the growing season, the nitrogen uptake, nitrogen content in
above ground biomass and leaf area index were affected by the irrigation regime and nitrogen fertilizer in 2015

71
and 2016. The mean profile of nitrogen uptake was highest in non-flooding at 150 kg ha-1in 2015 and 2016, and
the mean profile of leaf area index and nitrogen content were higher in non-flooding 150 or equivalent to
continuous flooding 150 among 2015 and 2016. The differences among crop parameters began shortly after
ponding water was imposed in continuous flooding, and its negative impact continued until crop maturity. The
estimated ET showed 34% higher daily evaporation in continuous flooding and 8% higher daily transpiration in
NF.
In crop maturity, the nitrogen uptake, panicle density and grain yield were higher in non-flooding
conditions than continuous flooding across nitrogen fertilizer rates in all years. Significant interaction among
irrigation regimes and N fertilizer were observed for panicle density in all years, and for grain yield in 2014 and
2015, showing grain yield and its most related crop component has a distinct response to N fertilizer in non-
flooding and continuous flooding irrigation. In general terms, as long as non-flooding aerobic rice does not suffer
drought stress, this production system is able to provide better overall crop performance and grain yield than
continuous flooding.
References Ahmed, S., Humphreys, E., Salim, M., Chauhan, B.S., 2016. Growth, yield and nitrogen use efficiency of dry-
seeded rice as influenced by nitrogen and seed rates in Bangladesh. F. Crop. Res. 186, 18–31.
doi:10.1016/j.fcr.2015.11.001
Alberto, M.C.R., Wassmann, R., Hirano, T., Miyata, A., Hatano, R., Kumar, A., Padre, A., Amante, M., 2011.
Comparisons of energy balance and evapotranspiration between flooded and aerobic rice fields in the
Philippines. Agric. Water Manag. 98, 1417–1430. doi:10.1016/j.agwat.2011.04.011
Ao, H., Peng, S., Zou, Y., Tang, Q., Visperas, R.M., 2010. Reduction of unproductive tillers did not increase the
grain yield of irrigated rice. F. Crop. Res. 116, 108–115. doi:10.1016/j.fcr.2009.11.020
Aulakh, M.S., Khera, T.S., Doran, J.W., 2000. Mineralization and denitrification in upland, nearly saturated and
flooded subtropical soil. Biol. Fertil. Soils 31, 162–167. doi:10.1007/s003740050640
Belder, P., Bouman, B.A.M., Spiertz, J.H.J., Peng, S., Castañeda, A.R., Visperas, R.M., 2005a. Crop performance,
nitrogen and water use in flooded and aerobic rice. Plant Soil 273, 167–182. doi:10.1007/s11104-004-7401-
4
Belder, P., Spiertz, J.H.J., Bouman, B.A.M., Lu, G., Tuong, T.P., 2005b. Nitrogen economy and water
productivity of lowland rice under water-saving irrigation. F. Crop. Res. 93, 169–185.
doi:10.1016/j.fcr.2004.09.022
Bouman, B.A.M., Humphreys, E., Tuong, T.P., Barker, R., 2007. Rice and Water. Adv. Agron. 92, 187–237.
doi:10.1016/S0065-2113(04)92004-4
Bouman, B.A.M., Peng, S., Castañeda, A.R., Visperas, R.M., 2005. Yield and water use of irrigated tropical aerobic
rice systems. Agric. Water Manag. 74, 87–105. doi:10.1016/j.agwat.2004.11.007
Bouman, B.A.M., Tuong, T.P.P., 2001. Field water management to save water and increase its productivity in
irrigated lowland rice. Agric. Water Manag. 49, 11–30. doi:10.1016/S0378-3774(00)00128-1
Bouman, B.A.M., van Laar, H.H., 2006. Description and evaluation of the rice growth model ORYZA2000 under
nitrogen-limited conditions. Agric. Syst. 87, 249–273. doi:10.1016/j.agsy.2004.09.011
Bouwman, A.F., 1998. Nitrogen oxides and tropical agriculture. Nature 392, 866–867. doi:10.1038/31809

72
Cai, Z., Laughlin, R.J., Stevens, R.J., 2001. Nitrous oxide and dinitrogen emissions from soil under different water
regimes and straw amendment. Chemosphere 42, 113–121. doi:10.1016/S0045-6535(00)00116-8
Cassman, K.G., Dobermann, A., Walters, D.T., 2002. Agroecosystems, Nitrogen-use Efficiency, and Nitrogen
Management. AMBIO A J. Hum. Environ. 31, 132–140. doi:10.1579/0044-7447-31.2.132
Cassman, K.G., Dobermann, A., Walters, D.T., Yang, H., 2003. Meeting cereal demand while protecting natural
resources and improving environmental quality. Annu. Rev. Environ. Resour. 28, 315–358.
doi:10.1146/annurev.energy.28.040202.122858
Ciampitti, I.A., Vyn, T.J., 2012. Physiological perspectives of changes over time in maize yield dependency on
nitrogen uptake and associated nitrogen efficiencies: A review. F. Crop. Res. 133, 48–67.
doi:10.1016/j.fcr.2012.03.008
Crawford, N.M., 1995. Nitrate: Nutrient and Signal for Plant Growth. plant cell online 7, 859–868.
doi:10.1105/tpc.7.7.859
Daberkow, S., Isherwood, K., Poulisse, J., Vroomen, H., 2000. Fertilizer Requirements in 2015 and 2030. Food
and Agriculture Organization of United Nations, Rome
Deb, P., Tran, D.A., Udmale, P.D., 2016. Assessment of the impacts of climate change and brackish irrigation
water on rice productivity and evaluation of adaptation measures in Ca Mau province, Vietnam. Theor. Appl.
Climatol. 125, 641–656. doi:10.1007/s00704-015-1525-8
Devkota, K.P., Manschadi, A., Lamers, J.P.A., Devkota, M., Vlek, P.L.G., 2013. Mineral ni trogen dynamics in
irrigated rice–wheat system under different irrigation and establishment methods and residue levels in arid
drylands of Central Asia. Eur. J. Agron. 47, 65–76. doi:10.1016/j.eja.2013.01.009
Dobermann, A., Dawe, D., Roetter, R.P., Cassman, K.G., 2000. Reversal of Rice Yield Decline in a Long-Term
Continuous Cropping Experiment. Agron. J. 92, 633. doi:10.2134/agronj2000.924633x
Dong, N.M., Brandt, K.K., Sørensen, J., Hung, N.N., Hach, C. Van, Tan, P.S., Dalsgaard, T., 2012. Effects of
alternating wetting and drying versus continuous flooding on fertilizer nitrogen fate in rice fields in the
Mekong Delta, Vietnam. Soil Biol. Biochem. 47, 166–174. doi:10.1016/j.soilbio.2011.12.028
Fageria, N.K., Baligar, V.C., 2005. Enhancing Nitrogen Use Efficiency in Crop Plants. Adv. Agron. 88, 97–185.
doi:10.1016/S0065-2113(05)88004-6
Fageria, N.K., Santos, A.B., 2013. Lowland rice growth and development and nutrient uptake during growth
cycle. J. Plant Nutr. 36, 1841–1852. doi:10.1080/01904167.2013.816727
FAO, 2004. Fertilizer use by crop in Brazil. Rome.
García, A.G., Dourado-Neto, D., Basanta, M. V, Ovejero, R.F.L., Favarin, J.L., 2003. Logistic rice model for dry
matter and nutrient uptake. Sci. Agric. 60, 481–488. doi:10.1590/S0103-90162003000300011
Hanada, K., 1993. Morphology, in: Hoshikawa, K., Matsuo, T. (Eds.), Science of the Rice Plan, Vol. 1. Food and
Agricultural Policy Center, Tokyo, pp. 222–258.
Holzschuh, M.J., Bohnen, H., Anghinoni, I., Meurer, E.J., Carmona, F. de C., Costa, S.E.V.G. de A., 2009.
Resposta do arroz irrigado ao suprimento de amônio e nitrato. Rev. Bras. Ciência do Solo 33, 1323–1331.
doi:10.1590/S0100-06832009000500025
Jabran, K., Ullah, E., Hussain, M., Farooq, M., Haider, N., Chauhan, B.S., 2015. Water saving, water productivity
and yield outputs of fine-grain rice cultivars under conventional and water-saving rice production systems.
Exp. Agric. 51, 567–581. doi:10.1017/S0014479714000477
73
Kader, M.A., Sleutel, S., Begum, S.A., Moslehuddin, A.Z.M., De neve, S., 2013. Nitrogen mineralization in sub-
tropical paddy soils in relation to soil mineralogy, management, pH, carbon, nitrogen and iron contents. Eur.
J. Soil Sci. 64, 47–57. doi:10.1111/ejss.12005
Kamogawa, M.Y., Teixeira, M.A., 2009. Autoamostrador de baixo custo para análise por injeção em fluxo. Quim.
Nova 32, 1644–1646. doi:10.1590/S0100-40422009000600048
Kato, Y., Okami, M., Katsura, K., 2009. Yield potential and water use efficiency of aerobic rice (Oryza sativa L.)
in Japan. F. Crop. Res. 113, 328–334. doi:10.1016/j.fcr.2009.06.010
Keeney, D.R., Nelson, D.W., 1982. Nitrogen—Inorganic forms., in: Page, A.L., Miller, R.H., Keeney, D.R. (Eds.),
Methods of Soil Analysis Pt. 2. American Society of Agronomy, Madison, WI, pp. 643–698.
Ladha, J.K., Chakraborty, D., 2016. Nitrogen and cereal production : Opportunities for enhanced efficiency and
reduced N losses, in: International Nitrogen Initiative Conference, “Solutions to Improve Nitrogen Use
Efficiency for the World.” INI 2016, Melbourne.
Ladha, J.K., Tirol-Padre, A., Reddy, C.K., Cassman, K.G., Verma, S., Powlson, D.S., van Kessel, C., de B. Richter,
D., Chakraborty, D., Pathak, H., 2016. Global nitrogen budgets in cereals: A 50-year assessment for maize,
rice, and wheat production systems. Sci. Rep. 6, 19355. doi:10.1038/srep19355
Lampayan, R.M., Bouman, B.A.M., de Dios, J.L., Espiritu, A.J., Soriano, J.B., Lactaoen, A.T., Faronilo, J.E.,
Thant, K.M., 2010. Yield of aerobic rice in rainfed lowlands of the Philippines as affected by nitrogen
management and row spacing. F. Crop. Res. 116, 165–174. doi:10.1016/j.fcr.2009.12.007
Linn, D.M., Doran, J.W., 1984. Effect of Water-Filled Pore Space on Carbon Dioxide and Nitrous Oxide
Production in Tilled and Nontilled Soils. Soil Sci. Soc. Am. J. 48, 1267.
doi:10.2136/sssaj1984.03615995004800060013x
Long, S.P., Zhu, X.-G., Naidu, S.L., Ort, D.R., 2006. Can improvement in photosynthesis increase crop yields?
Plant, Cell Environ. 29, 315–330. doi:10.1111/j.1365-3040.2005.01493.x
Moldenhauer, K., Wilson, C.E., Counce, P., Hardke, J., 2015. Rice growth and development, in: Hardke, J.T.
(Ed.), Rice Production Handbook. Arkansas State Cooperative Extension, pp. 7–14.
Murchie, E.H., Yang, J., Hubbart, S., Horton, R., Peng, S., 2002. Are there associations between grain-filling rate
and photosynthesis in the flag leaves of field-grown rice? J. Exp. Bot. 53, 2217–2224. doi:10.1093/jxb/erf064
Osuna-Canizalez, F.J., De Datta, S.K., Bonman, J.M., 1991. Nitrogen form and silicon nutrition effects on
resistance to blast disease of rice. Plant Soil 135, 223–231. doi:10.1007/BF00010910
Pan, J., Liu, Y., Zhong, X., Lampayan, R.M., Singleton, G.R., Huang, N., Liang, K., Peng, B., Tian, K., 2017.
Grain yield, water productivity and nitrogen use efficiency of rice under different water management and
fertilizer-N inputs in South China. Agric. Water Manag. 184, 191–200. doi:10.1016/j.agwat.2017.01.013
Peng, S., Bouman, B., Visperas, R.M., Castañeda, A., Nie, L., Park, H.-K., 2006. Comparison between aerobic
and flooded rice in the tropics: Agronomic performance in an eight-season experiment. F. Crop. Res. 96,
252–259. doi:10.1016/j.fcr.2005.07.007
Reddy, K.R., Patrick, W.H., 1976. Effect of frequent changes in aerobic and anaerobic conditions on redox
potential and nitrogen loss in a flooded soil. Soil Biol. Biochem. 8, 491–495. doi:10.1016/0038-
0717(76)90091-2
Rose, T.J., Erler, D. V., Farzana, T., Van Zwieten, L., 2016. Delayed permanent water rice production systems
do not improve the recovery of 15N-urea compared to continuously flooded systems. Eur. J. Agron. 81, 46–
51. doi:10.1016/j.eja.2016.08.009

74
Sánchez-Llerena, J., López-Piñeiro, A., Albarrán, Á., Peña, D., Becerra, D., Rato-Nunes, J.M., 2016. Short and
long- term effects of different irrigation and tillage systems on soil properties and rice productivity under
Mediterranean conditions. Eur. J. Agron. 77, 101–110. doi:10.1016/j.eja.2016.04.005
Santos, A.B. dos, Santiago, C.M., 2014. Informac ões técnicas para a cultura do arroz irrigado nas regiões Norte
e Nordeste do Brasil, 1st ed. Embrapa - Rice and Beans Research Center, Santo Antonio de Goias, Brazil.
Sharma, S.K., Singh, Y. V., Tyagi, S., Bhatia, A., 2016. Influence of rice varieties, nitrogen management and
planting methods on methane emission and water productivity. Paddy Water Environ. 14, 325–333.
doi:10.1007/s10333- 015-0502-2
Silva, J. V, Reidsma, P., Laborte, A.G., Van Ittersum, M.K., 2017. Explaining rice yields and yield gaps in Central
Luzon, Philippines: An application of stochastic frontier analysis and crop modelling. Eur. J. Agron. 82, 223–
241. doi:10.1016/j.eja.2016.06.017
Somaweera, K.A.T.N., Suriyagoda, L.D.B., Sirisena, D.N., De Costa, W.A.J.M., 2016. Accumulation and
partitioning of biomass, nitrogen, phosphorus and potassium among different tissues during the life cycle of
rice grown under different water management regimes. Plant Soil 401, 169–183. doi:10.1007/s11104-015-
2541-2
Sun, Y., Ma, J., Sun, Y., Xu, H., Yang, Z., Liu, S., Jia, X., Zheng, H., 2012. The effects of different water and
nitrogen managements on yield and nitrogen use efficiency in hybrid rice of China. F. Crop. Res. 127, 85–
98. doi:10.1016/j.fcr.2011.11.015
Tan, X., Shao, D., Gu, W., Liu, H., 2015. Field analysis of water and nitrogen fate in lowland paddy fields under
different water managements using HYDRUS-1D. Agric. Water Manag. 150, 67–80.
doi:10.1016/j.agwat.2014.12.005
Tanaka, A., Garcia, C.V., 1965. Studies of the relationship between tillering and nitrogen uptake of the rice plant.
Soil Sci. Plant Nutr. 11, 31–37. doi:10.1080/00380768.1965.10431161
Tuong, P., Bouman, B. a. M., Mortimer, M., 2005. More Rice, Less Water—Integrated Approaches for Increasing
Water Productivity in Irrigated Rice-Based Systems in Asia. Plant Prod. Sci. 8, 231–241.
doi:10.1626/pps.8.231
Updegraff, K., Pastor, J., Bridgham, S.D., Johnston, C.A., 1995. Environmental and Substrate Controls over
Carbon and Nitrogen Mineralization in Northern Wetlands. Ecol. Appl. 5, 151–163. doi:10.2307/1942060
Wang, Z., Zhang, W., Beebout, S.S., Zhang, H., Liu, L., Yang, J., Zhang, J., 2016. Grain yield, water and nitrogen
use efficiencies of rice as influenced by irrigation regimes and their interaction with nitrogen rates. F. Crop.
Res. 193, 54–69. doi:10.1016/j.fcr.2016.03.006
Yao, F., Huang, J., Cui, K., Nie, L., Xiang, J., Liu, X., Wu, W., Chen, M., Peng, S., 2012. Agronomic performance
of high-yielding rice variety grown under alternate wetting and drying irrigation. F. Crop. Res. 126, 16–22.
doi:10.1016/j.fcr.2011.09.018
Ye, Y., Liang, X., Chen, Y., Liu, J., Gu, J., Guo, R., Li, L., 2013. Alternate wetting and drying irrigation and
controlled-release nitrogen fertilizer in late-season rice. Effects on dry matter accumulation, yield, water and
nitrogen use. F. Crop. Res. 144, 212–224. doi:10.1016/j.fcr.2012.12.003
Ying-Hua, D., Xiao-Ming, Y., Ya-Li, Z., Qi-Rong, S., 2007. Mechanisms of Enhanced Rice Growth and Nitrogen.
Pedosphere 17, 697–705. doi:10.1016/S1002-0160(07)60084-8

75
Zhang, Z.-H., Li, P., Wang, L.-X., Hu, Z.-L., Zhu, L.-H., Zhu, Y.-G., 2004. Genetic dissection of the relationships
of biomass production and partitioning with yield and yield related traits in rice. Plant Sci. 167, 1–8.
doi:10.1016/j.plantsci.2004.01.007
Zhao, X., Zhou, Y., Wang, S., Xing, G., Shi, W., Xu, R., Zhu, Z., 2012. Nitrogen Balance in a Highly Fertilized
Rice– Wheat Double-Cropping System in Southern China. Soil Sci. Soc. Am. J. 76, 1068.
doi:10.2136/sssaj2011.0236
Zhong, X.H., Peng, S.B., Sanico, a L., Liu, H.X., 2003. Quantifying the interactive effect of leaf nitrogen and leaf
area on tillering of rice. J. Plant Nutr. 26, 1203–1222. doi:10.1081/pln-120020365
Zhou, S., Sakiyama, Y., Riya, S., Song, X., Terada, A., Hosomi, M., 2012. Assessing nitrification and denitrification
in a paddy soil with different water dynamics and applied liquid cattle waste using the 15N isotopic technique.
Sci. Total Environ. 430, 93–100. doi:10.1016/j.scitotenv.2012.04.056
Zhou, S., Sugawara, S., Riya, S., Sagehashi, M., Toyota, K., Terada, A., Hosomi, M., 2011. Effect of infiltration
rate on nitrogen dynamics in paddy soil after high-load nitrogen application containing 15N tracer. Ecol.
Eng. 37, 685–692. doi:10.1016/j.ecoleng.2010.04.032

76

77
4. Final considerations
This thesis concisely concluded non-flooding aerobic rice in tropical lowland in Brazil provides better
efficiency of water and nitrogen use, as well as crop performance and grain yield. This information already has been
disseminated during ongoing field experiments during 2015 and 2016 to extension professional, researchers and
growers throughout field days and technical seminars in Tocantins. However, the application of non-flooding irrigation
regime must be aware of these fundamental aspects: (i) non-flooding aerobic does not mean water absence. The aerobic
condition must meet an appropriate ET for crop development. (ii) the decreasing of N fertilizer and crop performance
relationship will depend of organic matter and soil nitrogen pool characteristics. (iii) The rice genotype must be
observed concerning drought and Blast tolerance.
Therefore, for a wide dissemination of such irrigation regime and fulfill the environmental gain of water
and nitrogen savings, it is suggested that the following topics should be addressed by further researches:
Understand the nitrogen transformation in soil, mainly nitrification-denitrification process. Assess the
emissions of N2O and N2 caused by irrigation shifts. Modelling the long-term impact in soil nitrogen pool and carbon.
Quantify the relationship between physical soil properties as porosity, texture, matric potential to water
availability. There are different soil proprieties in tropical lowland and create a soil classification survey for irrigation
regime would be important for regional water management.
Incorporate in regional rice breeding program the genotypes suitable for non-flooding irrigation regime and
improve drought tolerance to rice tropical varieties.