university of szczecin - uniwersytet szczeciński
TRANSCRIPT


UNIVERSITY OF SZCZECIN
FACULTY OF ECONOMICS AND MANAGEMENT
COMMUNICATION. RELATIONS.
MANAGEMENT
Szczecin 2018

Scientific EditorsSandra Misiak-Kwit
Małgorzata Wiścicka-Fernando
Rewievers Edyta Rudawska
Ulf Leusmann
Renuka Herath
Shihan Fernando
TypesettingPaweł Hładoń
Cover designGrzegorz Grzywacz
Szczecin 2018
ISBN
978-83-7867-790-1
Printing house & publishingVolumina.pl Daniel Krzanowskiul. Ks. Witolda 7–971-063 Szczecin
Tel./fax: 91 812 09 08

3
TABLE OF CONTENT
Introduction . . . . . . . . . . . . . . . . . . . . . . . . . . . . . . . . . . . . 5
Chapter 1
Are women faculty at Luleå University of Technology happy at work? Review of a job satisfaction survey from 2013 and 2015 (Maria Udén, Ylva Fältholm) . . . . . . . . . . . . . . . . . . . . 7
Chapter 2
Empathic Listening in Organizational Communication: Putting oneself in the other person’s shoe (Prabhashini Wijewantha) . . . . . . 31
Chapter 3
Women in business: establishment opportunities (Ilona Kiausiene, Vaidilute Kaminskiene) . . . . . . . . . . . . . . . . . . 39
Chapter 4
Fitness market – current situation and customer needs (Karolina Kubiak) . . . 71
Chapter 5
A study on the issues in solid waste management. Special reference to selected sub-urban areas in Sri Lanka (K.K. Tharindu Udayanga) . . . . . . . . . . . . . . . . . . . 85
Chapter 6
Analysis of private vehicle ownership decisions in big cities of Indonesia (Sabilah Margirizki) . . . . . . . . . . . . . . . . . . . . . . 103
Chapter 7
The key relationships between the marketing massages and the cultural environment of society (Vlada Ivanova) . . . . . . . . . 115


5
INTRODUCTION
The “COMMUNICATION. RELATIONS. MANAGEMENT” monograph, issued in English, is a joint publication of authors from Sweden, Lithuania, Indonesia, Sri Lanka and Poland. Into the hands of readers, we are placing this edition which is a collection of works devoted to the concept of communication, rela-
tions and management.This monograph consist of seven chapters. In the first chapter authors seek
an answer to the question: Are women faculty at Luleå University of Technology happy at work? In chapter two the author describes the role of Empathic Lis-
tening in Organizational Communication. Chapter three presents establishment opportunities for women. In chapter four there is investigated fitness market. The fifth chapter raises the problem of solid waste management in Sri Lanka. Chapter six present the analysis of private vehicle ownership decisions in big cities of Indonesia. Chapter seven contains the analyses of the relationship be-
tween employee engagement and customer satisfaction. The last chapter – seven explores the problem of key relationships between the marketing massages and the cultural environment of society.
We are honoured to express words of gratitude to all co-authors and review-
ers for their effort and contribution towards this joint international monograph.
Sandra Misiak-Kwit
Małgorzata Wiścicka-Fernando


7
2018 Communication. Relations. Management
Maria UdénLuleå University of Technology
Ylva FältholmUniversity of Gävle
CHAPTER 1
ARE WOMEN FACULTY AT LULEÅ UNIVERSITY
OF TECHNOLOGY HAPPY AT WORK?
REVIEW OF A JOB SATISFACTION SURVEY
FROM 2013 AND 2015
1.1. IntroductionThis chapter reviews the results of two consecutive, biannual job satisfaction
surveys conducted at Luleå University of Technology, Sweden (LTU). The purpose is to connect the results to theoretical discussions concerning gender and job satisfaction as expressed in surveys.
In Sweden, as in many nations today, the times are past when women’s access to higher education was an issue. The gender patterns that can be observed in Swedish higher education statistics are in line with the general trend in the OECD countries (UKÄ, 2016). At LTU this is reflected in student admissions, including for advanced levels. The share of women and men approximately keep within the 40/60 proportion, with women’s share being higher among beginners and the opposite in PhD training.
Yet, as is the case also in Sweden in general, as in many other nations, if looking at faculty positions, the picture is less convincing. Where equality between women and men is judged intrinsic with sustainable development, this situation is considered problematic. For instance, the situation stands out in a negative way, where mobilizing all talent is understood as a requirement for a stable knowledge economy.

8
Communication. Relations. Management 2018
The time-lag thesis – the belief that it is only a matter of time before the gender gap in academia will disappear, has gradually been replaced by the realization that interventions are needed (Dahlerup, 2010; Husu, 2010). The insights have been op-
erationalized, for instance, through the funding for gender mainstreaming Coordina-
tion Actions that has been offered in the European Commisson’s Horizon 2020 pro-
gramme and the preceding Framework programmes. Internationally, a number of methods for accelerating the process towards equality have been suggested. Many methods target universities’ internal strategies, policies and routines. The toolboxes suggested can include, but are not limited to, affirmative action for women.
The concerns are nevertheless consistent. The Swedish Higher Education Authority notes that “disconcerting signs of differences in men’s favour, have occurred regarding the transition between doctoral degrees and employment for qualification (postdoc positions)” (UKÄ, 2016, p. 11, our translation). This comes on top of long known career issues.
1.2. Background
Swedish higher education is state owned. Luleå University of Technology (LTU), situated in Luleå, Sweden, was founded through a Government decision in 1971. Initially, the research and education was entirely focused on engineering. The spectrum has widened since, including through the incorporation of a college of music and two additional higher education institutions, for respectively teach-
er and healthcare education. Technology continues to be a core in the university profile, not least in terms of research volume.
From 2011 to 2015 a job satisfaction survey was biannually distributed to all LTU employees. The aim was to measure whether the vision, strategy and goals regarding the climate and culture of the university were fulfilled. The idea was that management initiatives should be designed to measure up to indications from the surveys. Through procurement a third party was commissioned for do-
ing the surveys. The third party owns the data repository and no data have been made available for the LTU management or individual employees, other than at aggregate levels. The results presented by the third party were segregated only with respect to women’s and men’s responses.
From 2013 to 2016 LTU participated in the project GENOVATE - Transforming Or-ganisational Culture for Gender Equality in Research and Innovation, funded by EU FP7 under the Science in Society programme. One of the tasks that all universities involved were to carry out, was a gender climate assessment, specifically with “working envi-ronments and cultures for female academic researchers” in mind (GENOVATE, 2012).

9
2018 Communication. Relations. Management
At LTU it was decided to utilize, as one part of the assessment, the biannual job satisfaction surveys.1 For specified purposes it was possible to order more detailed results from the third party, while still keeping individual responses con-
cealed. For the 2013 and 2015 surveys, reports were ordered that presented the results of the teacher category separately from that of the other respondents. The first survey served as baseline and the second as an indication regarding the progress that GENOVATE was aimed at.2 These data sets constitute the material for this chapter. While GENOVATE was an action project, the purpose here is to develop a theoretically based analysis. Thereby, the discussion is transferred from an internal performance evaluation platform, to a wider, research based debate.
1.3. Job satisfaction surveys and genderJob satisfaction survey research results that are published in scholarly jour-
nals tend to be based on national populations and comparison between coun-
tries or, make a point of national job market characteristics. Often, questions about the basis of people’s judgements appear. ”Job satisfaction” as such has sometimes been understood as an affective matter. This notion was criticized by Weiss (2002) for being simplistic. As an alternative, Weiss identified three dimensions of job satisfaction statements: evaluative judgements, affective expe-
riences and beliefs about jobs. On those grounds, a question is, if it is altogether satisfactory to discuss job satisfaction in academia in national contexts. After all, recruitment and job seeking practices are becoming increasingly international in their scope. Nonetheless, employment conditions and provisions of child care and similar factors that can be expected to affect the gendering of working life and career development are nationally specific.
Clark (1997) investigated the so-called job satisfaction paradox, namely the debated, recurring tendency in surveys, that women report higher job satisfac-
tion scores than men. The paradox consists, as put by Clark, in that objectively women’s pay is worse, and so are their employment conditions (hiring and fir-ing, job content, promotion opportunities and additional factors such as sexual harassment). Using data from the British Household Panel Survey (BHPS) to test different hypotheses, Clark concluded that women’s higher job satisfaction scores
1 GENOVATE was not a research project but a coordination action. Thereby, the respective assess-
ments were based on the routines of each participating university. Thus, comparable data were not produced by the GENOVATE Consortium overall.
2 The reports 2014 and 2016 to the GENOVATE Consortium were edited by Ylva Fältholm, who was also the main author. A brief summary is appended in Genovate (2016).
10
Communication. Relations. Management 2018
reflect their lower expectations. He suggested the cause of the comparatively low expectations being that women’s work conditions used to be even poorer. This causality was not tested but Clark showed that, within the range he applied, the gender differential disappears for young workers, highly educated, profes-
sionals and workers in male-dominated workplaces. He predicted that, when women’s work conditions become the same as men’s, their job satisfaction scores will also be the same as men’s.
In a comparison based on the 1997 International Social Survey Program (ISSP), Sousa-Poza & Sousa-Poza (2000) found that job satisfaction differentials in women’s favour occurred in eight of 21 countries only, and in no case reached above ten per cent. In Sweden, men were slightly more satisfied than women. In Spain, the gender job satisfaction difference reached more than ten per cent in men’s favour. A few years later and in a smaller and more specific sample consist-ing of recent university graduates in Catalonia, also Mora and Ferrer-i-Carbonell (2009), found that the women were less satisfied than were the men. In the light of the employment situations offered, the authors judged this reasonable. Nev-
ertheless, analysing another batch of BHPS data Sousa-Poza & Sousa-Poza (2003) confirmed Clark’s prediction (1997) that the gender differential in UK surveys would decrease. In a decade it had decreased with fifty per cent.
Two decades after Clark’s study, and using the results from the European Social Survey, Haureth & Williams (2017) investigated wether the gender paradox remains in job satisfaction data. Their study includes fourteen countries, selected so that they represent cultural and industrial variation. The authors arrive to the conclusion that “females continue to report higher levels of job satisfaction than do men in some countries, and the difference remains even after controlling for a wide range of personal and job characteristics and working conditions” (p. 203). Still, in the European material studied, the work itself – its forms and conditions – is the most credible factor for explaining gender differences in the job satisfaction evaluations. As a conclusive hypothesis Haureth & Williams argue that “only with the further convergence of sociodemographic, occupational, and workplace characteristics will the gender differential in job satisfaction be eliminated” (p. 223). Nevertheless, referring to the Nordic countries in their sample, with their relatively low-cost child-
care as the prime example, Haureth and Williams conclude that: “With working conditions relatively more similar, more weight is placed on gender differences in the values of working conditions, compared with other national groupings” (p. 222). This is a contradictory interpretation, even a competing hypotheses to their overall conclusion – unfortunately something that the authors do not highlight or discuss.

11
2018 Communication. Relations. Management
In the literature on job satisfaction surveys, the difficulties of generalization and identifying comparable data, and the possible validity threats built into con-
flating populations into larger statistical groupings have been debated. Virtually all works on job satisfaction surveys that we refer to in this chapter, contribute in some manner to that debate.
1.4. Job market signalling Together with the subject specific discussions and associated hypotheses on
job satisfaction reporting, it appears interesting to bring a more general theory to the table. Mike Spence’s (1973) theory on job market signalling is applicable for such as “admissions procedures, promotion in organizations, loans and consumer credit.” (p. 356) The situation is one of asymmetric information. Spence explains his theory in terms of an employment situation. Beliefs are necessarily involved in the decisions made by the employer as well as the (prospective) employee. The employer cannot directly observe the marginal product prior to hiring. Only ”a plethora of personal data” can be observed, and these must ultimately deter-mine the employer’s assessment (p. 357). Spence distinguishes signals: some-
thing that the individual can invest in, such as education, and indices: observable, unalterable attributes as sex, race. In our case – as we discuss internal decisions and signals, Spence’s hiring situation, can be understood as promotion or, in other ways, providing personal benefits or access to resources that supports the employee’s range of opportunities.
Spence’s theory presupposes conditional beliefs only, and does not handle ideologically motivated discrimination. To acquire a signal, a person needs to make investments, for instance in terms of time and money, and there may be social and emotional costs, and other factors to consider. In the modell case, as presented by Spence, at first only men hold certain positions and, the indices sex is integrated in the beliefs about performance. Women correctly come to expect that the costs for acquiring the due signals, for instance for promotion, are too high in relation to the dividends that can be expected – if any. Spence identifies “the logical possibility that men and women will settle into different stable signaling equilibria in the market and stay there” (p. 370). A system can be in a continual state of flux but, it “will be stationary if the employer starts out with conditional probabilistic beliefs that after one round are not disconfirmed by the incoming data they generated” (p. 358).

12
Communication. Relations. Management 2018
1.5. The careers of women faculty at LTU As described above, LTU has an Engineering profile complemented with
education, health, and social sciences, a music college and a theatre academy. When it comes to academic careers, the patterns are overall gendered as in Swedish academia in general (as shortly discussed above, with reference to UKÄ, 2016). In the Swedish academic career system, professor is the highest rank. Among the LTU students more than 50% at undergraduate and gradu-
ate levels are women. Also among the lecturers, more than 50% are women. The share of women associate professors is somewhat lower. At about the time that the surveys presented in this chapter were first made, the share among professors was 17% (LTU, 2013). Even the mere 17% denoted a considerable change in the organization. In 1993 there was no woman professor at LTU. In 2014 a record was noted when seven women were installed as professors, out of totally twenty that year. In the years that followed, the share of women among the full professors rose to 22% in 2016, which was also a rise in actual numbers. The increase was not located to female dominated subject areas alone. This indicates something about the atmosphere during the time covered by the two surveys.
The gender bias is substantial in some disciplines, for instance the male dom-
inated Computer Science. However, in areas such as Construction, Mining and Mineral Processing that once were as male dominated, there are today a number of women professors, as well as up-and-coming associate professors. We can mention, for instance, that there are women professors in Applied Geochemistry and Ore Geology and, associate professors in Mining and Rock Engineering and in Construction Management and Building Technology.
In line with Swedish and international trends, in subjects where many wom-
en and few if any men are employed for undergraduate teaching, the massive female dominance does not quite stretch to the highest ranks. Among the professors the male share is conspicuously higher. For instance, this is the case, and has long been, in subjects associated to nursing and other health care professions.

13
2018 Communication. Relations. Management
1.6. Interventions and concerns3
A series of gender mainstreaming interventions into university culture, paired with affirmative action for women, was initiated in the mid 1990’s. The first activ-
ities included a PhD school for women, where the admitted women postgraduate students and their tutors were supported to, alongside their research studies, ad-
dress issues associated to being a woman at a technical university and generally of belonging to the under represented sex (Trojer, 1999, Trojer & Gulbrandsen, 1996). Possibly, the better state for women’s career options at LTU can in part be a result of that. At least, it is a point of view expressed among present and previous faculty leaders, that these activities have profoundly influenced the organization (Udén, 2015). A question is how to continue in efficient and meaningful ways.
Approaching 2020 an issue is that where power dynamics and distribution of resources are at stake in unpredictable ways, there is a tendency that male dominance is reinstated or, perhaps that an otherwise concealed male domi-nance comes to expression. One example was the restructuring of departments in 2010 where research units were merged to larger units. When the process had settled, it turned out that the Heads of the new, larger divisions appointed in the Department of Business Administration, Technology and Social Sciences all were men. In the light of the subjects organized within the department, this was remarkable. The reason is that the faculty gender mix is the most balanced among the university’s departments.
Another process that came to be questioned was when at approximately the time of the department merges, also the university’s overall profile research areas were re-examined. At LTU it has been a strategy for many years, to in one way or another identify strategic themes or topics that should be particularly supported and highlighted. To realize the university’s vision for 2020, nine stra-
tegic areas of Excellence in Research and Innovation were appointed. Explicitly, they were to serve for mobilizing interdisciplinary forces. They were: Intelligent Industrial Processes, Effective Innovation and Organization, Sustainable Trans-
portation, and so forth. When scientific directors were assigned for the nine areas, only men were selected. This caused debate, including in management bodies. To counter the bias, assistant director positions were created, in effect to accommodate also women in the leadership.
3 This section is based on the authors’ knowledge from faculty and managerial positions, supported by documentation of LTU decision-making, internal working documents, and official communica-
tion to the public and the press.

14
Communication. Relations. Management 2018
1.7. The surveysThe research material presented in this chapter consists of the results for the
teacher category from LTU’s job satisfaction surveys 2013 and 2015. This catego-
ry includes approximately the faculty categories assistant lecturers, post-docs, lecturers, associate and full professors including chaired professors.4 The original survey includes also administrative and service staff, librarians and other special-ists, and postgraduate students employed at the university.
The surveys contained about 70 questions, if all follow-up alternatives are counted. The form that was used starts with background questions on gender, questions on department, length of employment, type of employment, and sim-
ilar. The thematic questions section covers the social climate and physical work environment, the respondent’s view on leadership and of being an employee at LTU, and on the university’s objectives and visions.
The surveys were electronically distributed to LTU employees as links. The responses were entered on-line and are kept at a repository managed by the contractor. The survey data are not accessible from LTU’s servers. All responses are anonymised by the contracted third party, and made available as summarized results only. Thus, individuals’ responses cannot be tracked. To get access to ag-
gregated data an LTU representative can put an order to the contractor. The con-
tractor follows the international rules for studies and consulting engagements es-
tablished by SAMCA and by Sweden’s Ethical Council for Market Research (ERM). The survey links were sent to persons employed at least 50% of full time
at LTU. Totally 647 men and 556 women responded in 2013, and 684 men and 595 women in 2015.5 The overall response rate was 83% in 2013 and 81% in 2015. Data is not available for us, regarding the exact response rate for the teach-
er cathegory. However, our estimates indicate that the rates for this group were in the same range as the overall. Probably it was somewhat higher.
In a case like this, it is likely that some specific factors have contributed to that some employees did not take the survey. As a consequence, we do not assume that the employees who took the survey make a random population. This makes, for instance, that common measures for evaluating surveys, such as significance, lacks relevance. Instead, we argue that the response frequency is good and that the material is big enough to be considered as an expression of experiences within the university in question. We adjust our method to the
4 Vocabulary for faculty (academic) positions are somewhat problematic to translate. The taxonomy here applied corresponds approximately to terms as used in UK/ USA.
5 These totals are given the contractor’s reports for respective year.

15
2018 Communication. Relations. Management
situation through focusing overarching trends and patterns that appear from junctures within the material, more than discrete scores.
At the time of the surveys about a third of the teacher category were wom-
en and two thirds were men. The responses from the teacher category corre-
spond to that distribution. Out of pure coincidence, the women teachers also made a third of the women employee total (counting in annual work units, AWU, as well as employee numbers). The men in the teacher category, were half of the men employed at LTU, counted in numbers as well as AWU.
An initial assessment of the background questions on type and years of em-
ployment in the 2013 survey indicated that differences in employment between women and men are small. Most of those who answered (79% of the women and 74% of the men) stated that they were employed on a permanent basis, 49% of the women, and 56% of the men stated that they had been so for over ten years. We assume that the situation was comparable in 2015.
To the 2015 survey there were fewer responses from the teacher category than 2013. The reason has not been investigated. The decrease was small but more prominent among women. For 2015 compared to 2013, the total annu-
al working time for the teacher category had increased with corresponding to 10 AWU for women and 17 AWU for men.
Table 1.1. Questionnaire responses, the teacher category 2013 and 2015
Sub categoryResponses
2013Share 2013
Responses 2015
Share 2015
Loss*
Women 182 36% 177 35% - 2,7%Men 329 64% 328 65% - 0,3%Total 511 100% 505 100% - 1,2%
* As share of reponses 2013 Source: Own compilation from LTU surveys 2013 and 2015.
The next sections present four sets of survey results. The topics selected re-
late to questions about organizational culture and gender, in a way that converses with the theoretical themes discussed above, regarding job satisfaction surveys. Are women happy at LTU? Is it contrary to ”objective” conditions? We have left questions without consideration that concern information flows, authority is-
sues, details of leadership and, also engagement in the organization’s visions and similar. The rationale of this choice is that the information value of these themes

16
Communication. Relations. Management 2018
ultimately refer to specific management theories that, to be handled correctly, would require their own discussions and state-of-the-art reviews.
In the on-line questionnaire form, most of what in every-day language can be called ”questions” were put as statements. The survey respondent was to answer by indicating level of agreement on a 6-graded scale, ranging from 1-Completely disagree to 6-Completely agree. The actual questions put was thus if the re-
spondents agreed or not. For respondents that did not want to express an opin-
ion, an alternative that in English would be something like “no concept” was also available.6 Additionally, there were multiple choice questions and open ended questions where the survey respondent was invited to use his or her own words.
In the following, tables are designed so that the original survey results are presented. In most cases it means agreement ratings between one and six count-ed as per cent of the total responses for each category (men, women). To the one to six ratings, we have added two cumulative levels in the tables: high and low end. The purpose is to make it simpler to get an overview of the data. Num-
bers (results) are in most cases given as presented in the report from the survey company. In some instances, as result of roundings, sums do not add up to 100%. Statements and questions from the surveys are translated for this chapter to English by us.
1.8. Overall really good to work at LTURegarding the extent to which the survey respondents feel that LTU, on the
whole, is a good workplace, there are small but yet differences, between wom-
en’s and men’s assessments. The 2015 results are more positive than they were for 2013 and, the tendency is that the change is even more positive among women than among men.
A topic of importance for an academic workplace is the extent to which it stimulates creativity. Also regarding this topic, the 2015 survey indicated im-
provements and, moreover, at least as much or more so, according to women faculty’s ratings than men’s.
6 In Swedish: “Kan ej ta ställning.” The term covers all from vague insecurity to a concrete notion of not having access to information upon which an assessment can be based.

17
2018 Communication. Relations. Management
Table 1.2. The question if LTU overall is a good workplace7
Statement: I experience that LTU, generally speaking, is a good workplaceDegree
of agreement, 6 means
completely agree
Women 2013%
Women 2015%
Men 2013 %
Men 2015 %
6 16 28 12 25
5 38 39 44 40
4 27 20 28 21
Cumulative high end 81 87 84 86
3 10 6 9 7
2 5 3 6 3
1 2 3 1 2
Cumulative low end 17 12 16 12
No concept 0 1 1 1
Source: Own compilation from LTU surveys 2013 and 2015.
Table 1.3. Respect for creativity and competence
Statement: I experience LTU as a workplace where we show respect for each co-worker’s creativity and competence
Degree of agreement,
6 means completely agree
Women 2013 %
Women 2015 %
Men 2013 %
Men 2015 %
6 8 19 7 24
5 29 33 37 35
4 32 28 29 22
Cumulative high end 69 80 73 81
3 15 9 14 6
2 11 6 9 5
1 4 2 3 3
Cumulative low end 30 17 26 14
No concept 2 4 1 5
Source: Own compilation from LTU surveys 2013 and 2015.
7 To support transparency this and the following table headings are kept as close as possible to the statement formulations in the surveys, without getting too long and complicated to serve effectively as headings.

18
Communication. Relations. Management 2018
The statement “At LTU we have a climate that stimulates innovation and cre-
ativity” received a similar response, only a slight step less positive: respectively 67% and 74% on the cumulative high end from the women faculty, and 63% and 72% from the men.
1.9. Women’s ratings lower for some key factorsDespite the encouraging impression from the results presented above, wom-
en scholars seem less confident than their male colleagues, about the state of equality in the organization. Nevertheless, both women’s and men’s assessments were overall more positive 2015 than in 2013.
Table 1.4. Perceived equal treatment
Statement: I experience that everyone at LTU is treated equally. That is, no discrimination occurs due to gender, gender identity or expression, age,
religion (or other beliefs), ethnicity, sexual orientation or disability.Degree
of agreement, 6 means
completely agree
Women 2013 %
Women 2015 %
Men 2013 %
Men 2015 %
6 20 25 32 37
5 24 29 30 34
4 18 18 12 12
Cumulative high end 62 72 74 83
3 12 6 8 5
2 8 5 6 3
1 7 6 5 3
Cumulative low end 27 17 19 11
No concept 11 12 8 6
Source: Own compilation from LTU surveys 2013 and 2015.
The degree to which survey respondents are willing to answer a question about equality is of interest. As can be expected there is a consistent pattern in both surveys where the first questions receive most answers. The responses regard-
ing equality follow this pattern and, the loss is small, a matter of one to two per cent. To the requests for specifications of perceived grounds for discrimination, there were fewer responses, however. This is somewhat expected for follow-up

19
2018 Communication. Relations. Management
questions. Nonetheless, in both surveys men were less likely to answer the detailed follow-up question and, to identify discrimation based on gender is a factor at LTU.
Looking at details, the survey results suggest some experiences that so to speak ”concretely”, should negate why women overall seem to find LTU a better workplace than men do. First and foremost, the statement about risk for ill health due to the work, rendered alarming results in 2013.
Table 1.5. Perceived risk of ill health
Statement: I find that there is a significant risk for me to suffer from ill health because of my work
Women 2013
Women 2015
Men 2013
Men 2015
Agree: Yes 52% 30% 25% 21%Agree: No 48% 70% 75% 79%
Number of answers 177 171 320 320
Respondents to follow-up
specification request92 52 84 67
Source: Own compilation from LTU surveys 2013 and 2015.
In a follow-up section survey respondents were asked to indicate factors that they identify as contributing to the risk for ill health. The response rate was lower to the follow-up question, and even fewer persons specified the reasons in 2015 than in 2013. Yet, the alarming figures and dramatic change in women’s reports call for at least an attempt to an explanation and, one issue is interesting to show-
case. In 2013, 64% of the women who specified reasons for the perceived risks indicated harmful physical environment as one factor. This made it the moste severe factor according to the women’s assessment. Such prevalence of physical risk factors appears extraordinary, coming from staff working in university prem-
ises in a well-off country. The same year, out of the men in the teacher category that specified risk factors, 17% put down the physical environment as a problem.
As the gender distribution is uneven in several of LTU’s departments, it ap-
pears reasonable that this is reflected in the responses. The university campus and certain buildings in particular were under reconstruction during the period of the two surveys. Considerations regarding the physical work environment was one motive – some buildings at the LTU main campus have been renovated more than once because of water damage. Another motive was the accommodation

20
Communication. Relations. Management 2018
of the new organization that was implemented during the period. Different steps in the reconstruction process have definitely affected the physical work environ-
ment. In the 2015 survey 27% of the men as well as the women who specified health risks agreed to that physical environment was a risk factor.
We do not maintain that the conditions of buildings or disturbance from reconstruction would be the explanation with capital E, in this case. Rather, we want to point to the impact of at least seemingly temporal fluctuations in social and physical organization of the university (or a workplace in general). Notably, the temporality does not preclude biased gender dynamics. This can be exam-
plified with a question: Is it even thinkable within the combined confines of the academic world, Swedish working life, and LTU’s organizational culture that 50% of male faculty would find that their work constitutes a risk to their health?
Together with physical conditions, workload is a major aspect of working conditions. Independantly of the health risk assessment, the survey respondents were asked to evaluate if they experience a workload that they were satisfied with. Between 2013 and 2015 women’s assessment of their situation changed in a negative direction while that of men slightly improved.
Table 1.6. Statement: I experience a workload that I am satisfied with
Statement: Usually I find that I have a workload that I am content withDegree of
agreement, 6 means completely agree
Women 2013%
Women 2015%
Men 2013 %
Men 2015 %
6 8 7 8 10
5 25 21 26 29
4 27 26 27 25
Cumulative high end 60 54 61 64
3 17 22 22 20
2 16 15 11 12
1 8 7 6 3
Cumulative low end 41 44 39 35
No concept 0 0 0 1
Source: Own compilation from LTU surveys 2013 and 2015.
Regarding the cause of dissatisfaction, in both surveys the absolute majority of men and women faculty who answered this question chose the option that their workload was too high. The other main cause reported is uneven workload. The workload being described as too low is rare.

21
2018 Communication. Relations. Management
1.10. Leadership assessmentsFor the statement that “In my experience, LTU is a workplace where it is
permitted to question work routines, methods and opinions”, the indication in 2013 was that men had a more positive experience than women. In the 2015 survey, the assesments was overall more positive but, the difference between women’s and men’s answers remained.
Table 1.7. Perceived permittance to question work routines
Statement: I experience LTU as a workplace where it is allowed to question routines, methods and opinions
Degree of agreement, 6 means
completely agree
Women 2013%
Women 2015%
Men 2013 %
Men 2015 %
6 7 8 8 15
5 22 29 20 32
4 29 28 40 27
Cumulative high end 58 65 68 74
3 25 20 20 8
2 13 6 9 9
1 2 3 3 6
Cumulative low end 40 29 32 23
No concept 1 6 1 3
Source: Own compilation from LTU surveys 2013 and 2015.
With the topic of questioning work routines, we have approached the topic of leadership. Regarding confidence in LTU’s top management women were in the 2013 survey more likely than men to choose the top rating. From 2013 to 2015 men’s assessment of the top leadership had gone through a definite, positive change.

22
Communication. Relations. Management 2018
Table 1.8. Confidence in top management
Statement I have confidence in LTU’s top management’s leadershipDegree of
agreement, 6 means completely agree
Women 2013%
Women 2015%
Men 2013 %
Men 2015 %
6 24 25 17 28
5 33 33 32 32
4 20 21 20 19
Cumulative high end 77 79 69 79
3 1 5 12 6
2 5 2 6 2
1 1 1 2 2
Cumulative low end 7 8 20 10
No concept 15 13 11 10
Source: Own compilation from LTU surveys 2013 and 2015.
To contextualize the development it can be noted that in 2013 LTU had a fairly new Vice-chancellor (in the terminology used in, for instance USA, Vice-chancellor corresponds to President). By 2015 he had had a chance to interact with the staff in his capacity as leader of LTU, and also to bee seen in press and media reports. It is possible that other circumstances played a part, even that they were more decisive. Nonetheless, this factor is reasonable to mention.
When respondents choose the no concept alternative as response to a ques-
tion, as consistently at least ten per cent did in this case, it can be difficult to make a concrete interpretation out of it. For this topic it can be a signal that respondents do not think they have the information necessary to support a con-
clusion. This does not make an interpretation easier: would that be a neutral statement or a signal that the respondent is unhappy with the situation?

23
2018 Communication. Relations. Management
Table 1.9. Confidence in Heads of Departments
Statement: The Head of Department has my confidence to lead department.Degree of
agreement, 6 means completely agree
Women 2013%
Women 2015%
Men 2013 %
Men 2015 %
6 30 39 34 42
5 29 27 30 29
4 18 14 22 16
Cumulative high end 77 80 86 87
3 10 9 5 4
2 3 3 3 2
1 5 2 2 2
Cumulative low end 18 14 10 8
No concept 6 6 4 5
Source: Own compilation from LTU surveys 2013 and 2015.
Regarding confidence in the Head of Department, a function that is closer to everyday decisions affecting university teachers than the top management (in effect Vice Chancellor/President), men were clearly more positive than wom-
en in 2013. The assessments were overall more positive in 2015. The existence of a difference between women’s and men’s ratings remained, however. Also for this confidence statement some survey respondents chose the no concept alternative, though less than regarding top management.
1.11. Using contextual insights to assess a resultCompared to the positive trend in the perception of LTU as a generally good
place to work, women teachers’ responses to the statement “I enjoy my work” were less positive in 2015 than 2013.

24
Communication. Relations. Management 2018
Table 1.10. Enjoying workStatement: I enjoy my work
Degree of agreement, 6 means
completely agree
Women 2013%
Women 2015%
Men 2013 %
Men 2015 %
6 22 23 17 23
5 39 33 34 33
4 22 20 31 27
Cumulative high end 83 76 82 83
3 8 14 11 9
2 5 7 4 7
1 3 3 2 2
Cumulative low end 16 24 17 18
No concept 0 0 1 0
Source: Own compilation from LTU surveys 2013 and 2015.
The ratings continued to be good, but the tendency raises questions, as men’s appreciations somewhat went in the other direction. The slight contra-
diction between women’s general assessment and assessment of their personal situation is exactly the type of nexus that Clark’s explanation solves or, put in other words: what he predicts. Noteworthy here is that, if the divergent trends are to be taken seriously, they would in Clark’s terms imply that the women fac-
ulty’s expectations regarding their work situation have fallen.Within an organization, a complete analysis of its own job satisfaction survey
cannot be carried out.8 Ethical reasons prevent certain access to the collected data, as there is contextual knowledge in the organization that can be misused. However, applied with ethical standards, contextual knowledge can likewise be used productively as a means to evaluate organizational decisions. This was the core purpose of the surveys, of which the respondents were informed.
The faculty employees gave very good, often remarkably good ratings to LTU as workplace in the 2013 and 2015 surveys. The exception would be the perception of health risks among women in 2013. Nonetheless, or even more so because the per-ception of an immediate healh risk thereafter lessened, it is reasonable to wonder how it comes that the responses from women in 2015 appeared more profoundly in the shape of the classic gendered job satisfaction paradox, than it did two years
8 The authors of this article are senior employees of LTU and, one was the Dean of the Faculty of Natural Science and Engineering during the period studied.

25
2018 Communication. Relations. Management
earlier. To approach this question, for reasons due to internal processes at the uni-versity, it is interesting to apply contextual knowledge in a discussion on a specific topic, namely that of cooperation across the organization’s different units.
The rate of agreement is high. Apparently, working across organizational borders is a non-issue at LTU – in the sense that it is a given part of every-day routines. Yet, it is notable that women’s rating decreases 2013-2015, while men’s gets more affirmative.
Table 1.11. Cooperation across organizational boundariesStatement: When it is vital I seek collaboration over organizational
boundaries.Degree of
agreement, 6 means completely agree
Women 2013%
Women 2015%
Men 2013 %
Men 2015 %
6 36 39 37 43
5 31 29 33 33
4 19 15 17 14
Cumulative high end 86 83 87 90
3 5 5 6 5
2 1 1 2 0
1 1 2 1 1
Cumulative low end 7 8 9 6
No concept 7 9 4 4
Source: Own compilation from LTU surveys 2013 and 2015.
It was announced as part of the expectations for the LTU Excellence strategy that it should support collaboration over organizational boundaries. But, what kinds of networks have – in practice – been promoted through the program? The gender bias in the appointment of leadership for the Excellence areas can, within an internal discourse be regarded as a result of rational choices. But, for future strategy development, when wheighing arguments against each other it should perhaps be taken into account that the faculty at LTU is a male dominat-ed category. Dynamics where men establish and maintain contact with other men are therefore likely to occur, and needless to say this may have unwanted side-effects for the women. To the assessment of the diverging trends we would for this case like to add the increased share of women who chose the no concept

26
Communication. Relations. Management 2018
alternative in 2015. In the light of the totality of the Excellence strategy not feel-ing able to answer the question cannot be a positive signal.
A check of the realism in the suspicion that biased dynamics were enabled by the routines and resource strategy put in place, can be done by comparing the results for the academic staff and the overall figures for all employees. Activities concerning excellence in research are likely to affect faculty members in specific ways, as compared to other employees.
For all women employees at LTU the cumulative high end result for the state-
ment was 86% in 2013 and 84% in 2015. The women teachers were a third of the total of employed women both years. For all men the cumulative high-end score was 86% in 2013 as well as 2015. The total number of men who took the survey was twice that of men in the teacher category. It can thus be concluded that male faculty is the only category whose self-reported inclination to collaborate across organizational boundaries increased from 2013 to 2015.
The decrease in the reports from women faculty is not big, and after all, we can only speculate about the reasons for the difference to men’s trend. The point would be that the Excellence strategy, at least seems to have failed to fully coun-
ter other forces, whatever they may be. For instance, in 2015 faculty women reported more issues with their workload than in 2013, while the men in the teacher category indicated less.
1.12. Discussion and final remarks The response rate to the surveys reviewed was above 80%, for the group dis-
cussed in this chapter. We mean that this rate is high enough to give adequate information about gender and job satisfaction at the university where the surveys were distributed. To clarify: we do not claim that it gives full information but, that the information retrieved is relevant. The material catches the situation among the large group of employees in the teacher category that took the survey. In this ca-
pacity, it is sufficient for a theoretically based analysis of job satisfaction and gender.The prediction established by Clark (1997), is that the gender paradox in job
satisfaction survey results will disappear when and where education and other factors are equal. The LTU teacher category should fit into that description – per definition all are well educated. Nevertheless, even though the differences are not big between women’s and men’s job satisfaction assessments, they are con-
sistent and bewildering of the same reasons as Clark identified. Fewer women reach lead positions than they should if compared to their share of student and teacher corps but, at a general level women are at least as happy with LTU as

27
2018 Communication. Relations. Management
a place to work as are the men. Women respondents find, even more than men do, that creativity and innovation is supported, while on the other hand they report risk for ill health and discrimination more frequently than men.
In accordance with Clark’s reason, it can be suggested that even if the pace is not ideal, doors are still opening for women in the teacher category at LTU. According to this logic women are not happy with conditions that men would find unacceptable but, they are content because they note that things are moving in the right direction. As during the period of the surveys, women’s careers were being advanced with more women becoming professors than ever before, this appears a reasonable thought. Under such circumstances, LTU’s women faculty of course find reasons to be happy at work.
In accordance with Spence’s theory, on the other hand, the explanation would be that there are two separate spheres of expectation at LTU. Men and women have settled into different, stable signaling equilibria in the (internal) job and promotion market (Spence, 197, p. 371). The existence of a closed loops system is supported by the apparently unpremeditated, sudden showcases of male dominance in situations of unpredictable resource redistribution.
Spence’s notion can in principle include effects just as Clark suggests. One might think like this: in the female loop hope is kept up by the raised bars through such as increased appointment of women to positions in the formal leadership structure. However, it is worth to emphasize that in cases of gender bias, Spence’s signal theory features (at least) two separate cycles of signals between employees and employer. First and foremost, this draws attention to the expectations among men
as a factor that cannot be taken for granted. Furthermore, Spence argues that the information that employers engage in ther decision-making is generated within the organization itself. This draws attention to employers’ expectations.
1.13. Remaining questions If we follow Clark’s (1997) logic, it appears as the self-given point of deliber-
ation is whether women’s responses to surveys ultimately will become the same as men’s – when they, so to speak, get to where men already are. This is more consequential than it may in the first instance appear. After all, such a (non-)response would require an essentially inert state of mind among men and, also that both employers and the overall labor market remain unaffected. Are these realistic scenarios?
Questions that we find interesting are: (i) Does increased or, finally, achieved equality between women and men change the experience of work? (ii) If so,
28
Communication. Relations. Management 2018
how might that affect self-reporting in job satisfaction surveys? (iiI) Is it thinkable that men’s assessments adjust to become “the same” as women’s? (and not the other way around) (iv) What about the road that leads towards equality, how will respectively men and women experience the ride? To take a concrete example of relevance for academia: how do men’s expectations and assessments turn out, when competition changes face and also women successfully claim authority over resources and their distribution?
Reassessing the job survey research toolkit for a new age is a mission that remains. Here we simply acknowledge that while Clark (1997) provides effective and thoroughly tested grounds for interpretating the 2013 and 2015 LTU survey results, new types of labor market and work place situations eventually will make theoretical and possibly also methodological renewal necessary.
ReferencesClark, A.E. (1997). Job satisfaction and gender: Why are women so happy at work?,
Labour Economics, Vol. 4, No 4.Dahlerup, D., (2010), Jämställdhet i akademin: En forskningsöversikt. [Gender Equality
in Academia: A Research Review.] Report 2010:1, The Swedish Council for Higher Education, Delegation for Gender Equality, Stockholm.
GENOVATE, (2012), Transforming Organisational Culture for Gender Equality in Research and Innovation, EU FP7 THEME [SiS.2012.2.1.1-1] Grant agreement no: 321378, An-
nex I – Description of Work.GENOVATE, (2016), Continuities and Changes: Gender Culture and Working Climate As-
sessment Report, Grant agreement no: 321378, Deliverable 4.2. www.genovate.eu Husu, L., (2010), Mot mera jämställda universitet: En internationell översikt över strat-
egier och åtgärder. [Towards More Gender Equality in Universities: A Review of In-
ternational Policies and Actions.] Report 2010:6, The Swedish Council for Higher Education, Delegation for Gender Equality, Stockholm.
Mora, T., Ferrer-i-Carbonell, A., (2009), The job satisfaction gender gap among young re-
cent university graduates: Evidence from Catalonia, The Journal of Socio-Economics, Vol. 38, No 4.
Sousa-Poza, A., Sousa-Poza, A.A., (2000), Taking Another Look at the Gender/Job-Satisfaction Paradox, KYKLOS, Vol. 53, No 2.
Sousa-Poza, A., Sousa-Poza, A.A., (2003), Gender differences in job satisfaction in Great Brit-ain, 1991–2000: Permanent or transitory?, Applied Economics Letters, Vol. 10, No 11.
Spence, M., (1973), Job Market Signaling, The Quarterly Journal of Economics, Vol. 87, No 3.Trojer, L., (1999), Kompetens och ledarskap inom forskningsorganisationer: En kvinnlig
forskarskola för förändring vid teknisk fakultet, [Eng: Expertise and Leadership in

29
2018 Communication. Relations. Management
Research Organizations: A Women’s Research School for Change at the Faculty of Engineering], Avdelningen genus och teknik, Luleå tekniska universitet., Luleå.
Trojer, L., Gulbrandsen, E., (1996), Gränsöverskridare och normbärare: Kvinnliga dokto-
rander på teknisk fakultet, [Boundary breakers and norm carriers: Female doctoral students at the technical faculty] Centrum för kvinnoforskning, Luleå tekniska uni-versitet, Luleå.
Udén, M., (2015), Kartläggning och analys av insatser som syftar till att bryta den könssegre-
gerade arbetsmarknaden i Norrbotten. [Mapping and analysis of efforts aimed at ending gender-segregation in the labor market in Norrbotten.] Winnet Norrbotten, Luleå.
UKÄ, (2016), Kvinnor och män i Högskolan. [Eng: Women and Men in Higher Education.] Rapport 2016:16. Universitetskanslerämbetet, Stockholm.
Weiss, H.M., (2002), Deconstructing Job Satisfaction: Separating Evaluations, Beliefs and Affective Experiences, Human Resource Management Review, Vol. 12, No 2.


31
2018 Communication. Relations. Management
Prabhashini WijewanthaDepartment of Human Resource Management, Faculty of Commerce and Manage-ment Studies, University of Kelaniya, Sri Lanka
CHAPTER 2
EMPATHIC LISTENING IN ORGANIZATIONAL
COMMUNICATION: PUTTING ONESELF
IN THE OTHER PERSON’S SHOE
2.1. IntroductionA common cause associated with most of the organizational problems are
linked to listening issues of managers. If leaders or managers actively question and listen to their employees, it encourages dialogue and debate within the organization and thereby the employees will be encouraged to perform (Garvin, Edmondson and Gino, 2008). But what happens within the organizations is, when employees take their problems to the managers, the managers only tend to listen briefly to what is said by the employees, where as they are very quick in proposing their own solutions. But sometimes these solutions proposed do not pertain to the actual problems encountered by the employees, and thereby make the problems worse. This situation in one hand creates the feeling among employees that they are being unheard, and thereby the managers lose their influential capacity over the subordinates.
By creating situations similar to what is explained above, most of the manag-
ers in today’s organizations lose the trust of their employees. Similar problems are also observed among certain medical doctors and counsellors, where, they tend to prescribe medicine or advice, before carefully diagnosing the problem and its root causes (Ha et al., 2010). All these problems are related to deficien-
cies in communication skills of these individuals. Even though, this weakness is widely observed among doctors, managers, and counsellors, what is less known and therefore unaddressed is the fact that each and every individual, have this problem in varying degrees (Stowell and Cook, 2003). This situation often results due to the human tendency to rush at things. This rush makes people fail to

32
Communication. Relations. Management 2018
spend sufficient time to diagnose issues. The importance of time allocation for diagnosis, is that it enables one to deeply understand the problem. This deep understanding enhances the quality of communication (Street et al., 2009) and interpersonal relations among the parties involved.
Given this situation, the scholars in the field of organizational communication as well as the trainers and corporate consultants have deeply engaged in investi-
gating these real-world organizational problems in communication in pursuit of learning how to create the required deep understanding between the parties in an organization. Accordingly, it has been recognized that the single most impor-tant principle in the field of interpersonal relations is ‘seeking first to understand, and then to be understood’ (Covey, 1989). It is widely known that it requires to listen to another person to understand him/her. Accordingly, this review article focuses on the concept of ‘listening to understand’, which is widely known as ‘empathic listening’. As such the main objective/aim of this paper is to highlight the significance of practicing empathic listening by every individual with special reference to managers in the corporate world. The review begins by providing a brief overview of communication and then moves on to emphasize on empathic communication and empathic listening.
2.2. What is Communication?Communication is the process of generating meaning by sending and re-
ceiving verbal and nonverbal symbols and signs that are influenced by multi-
ple contexts. Communication in the organizational context serves four major functions – control, motivation, emotional expression, and information. Munter (2012) highlights that the communication process within the corporate context is different from others. In business or managerial communication, success of the communication process is evaluated not by the straight-line communication from the sender to the receiver, but by the ability to achieve the desired audience response. Thus, the communication process comprises of mainly two compo-
nents – imparting meaning and the meaning being understood. This has been referred to as the transflabor market outcomes since 1980 er and understanding of meaning (Robbins and Judge, 2013).
The communication process is associated with the four basic and essential language skills, namely – reading, writing, speaking, and listening. These are also identified as the four basic types of communication (Covey, 1989; Robbins and Judge, 2013). All these are enriched by the non-verbal cues communicated by the sender of the message to the recipient. Irrespective of where a person is,

33
2018 Communication. Relations. Management
he/she engages in one of the above forms of communication, most of the time except during sleep. According to Robbins and Judge (2013), individuals spend nearly 70% of their awake hours engaged in communication. Hence, communica-
tion skills have been identified largely as a fundamental competency that every individual needs to develop (Deming, 2017; Parks, 2015), for the achievement of career success. Covey (2004), too confirms this where he states that out of all the skills that needs to be developed by a person, communication skills is the most important for life. Lot of employers identify communication skills as one of the top-ranking skills demanded from potential employees. Effective com-
munication enables a person to be both effective and efficient in their day to day activities and thereby increase both their individual as well as workplace productivity (Cheney, 2007).
Due to the significance of communication skills for the life of an individual, there are several training programmes and courses that teach communication skills for individuals. Majority of these programmes train people on speech and writing, while some focus also on reading. What about listening? It is the most under-rated communication skill in these programmes (Alexandra, 2018). A simple survey undertaken by the author on the effectiveness of training programmes on communication skills indicate that, only 3% of the corporate training programmes have covered listening skills, while writing skills have been covered in 68% of the programmes and speaking and presentation skills have been covered in 73%. This further confirms that there are many employees in the corporate community who have not undergone a training in listening. This information further validates that the focus in the society had been only on a single part of communication, which is ‘imparting meaning’. Majority of people in the corporate community and the society have ignored the component of ‘understanding the meaning’.
With the gradual increase of interest in the society to engage in effective interpersonal communication which produces the desired responses from the audience, the attention has been now largely directed towards the interactional skill of ‘empathic communication’. Accordingly, the next section provides a brief overview of empathic communication.
2.3. What is Empathic Communication?Empathic communication is based mainly on the empathic listening skill and
the character qualities of openness and trust, of the parties involved in the com-
munication interaction. Engaging in empathic communication enables handling conflicts in the organizational setting as well as engaging in deep connections with

34
Communication. Relations. Management 2018
others and hence, identified as crucial. The foundation for empathic communica-
tion is mainly the emotional perspective in understanding the thoughts, emotions, attitudes, and values of the other person in the communication process.
Tayal, Michelson, and Tayal (2017), state that empathy is not a character trait and therefore it can be developed by every individual as it is only a momentary decision. Parks (2015) states that social support literature demonstrate empathy manifested in the form of empathic listening as a behaviour that is most help-
ful in times of distress and difficulty. Empathy in communication includes the involvement of feelings, expression of interest, understanding of meaning, and observing behaviour of parties involved in the communication process. Hence, the enactment of empathic communication requires the use of both the right and the left brains. It involves the exchange of accurate data and information between the parties as it enables to express the reality inside one person’s heart instead of using assumptions.
2.4. Empathic ListeningIt has been identified that listening skills are the most important in authentic
understanding of another person. However, a majority in the society are poor listeners (Robbins and Coulter, 2002). Listening enables the recipient of the mes-
sage to perceive exactly the same mental picture as the sender. Though many people prefer to be influential over the lives of other people, they rarely know what the most important skill for that purpose is. It is commonly believed that speech is the most fundamental skill for influencing others, could it be at work or in personal life. This is further confirmed by Parks (2015), where she states that in the communication context listening is often overshadowed by speaking. But people fail to understand that influence can be made through speech, only by understanding the other party, which is likely only through listening.
Listening has been defined in communication literature as a multi-dimensional construct comprising of cognitive processes, affective processes, and behaviour-al processes (Janusik, 2007). Listening function takes place at one of five levels -ignoring, pretending, selective listening, attentive listening, and empathic listen-
ing (Mow, 2012). Ignoring is, not really listening at all. In pretending, a person pretends he or she is listening, even though is not actually listening. The listen-
er’s mind and thoughts are elsewhere in this instance. In here, the careful obser-vation of body language expressions demonstrated by the listener would indicate this pretending behaviour very clearly. Next stage is, selective listening, where the listener listens only to a selected part of information out of what is spoken.

35
2018 Communication. Relations. Management
In this occasion, listener processes only the selected pieces of information and then respond only to those fragments, which would be different from the in-
tegrated message. The fourth stage of listening – attentive listening, refers to paying attention and focusing energy on the words that are being said, rather than paying attention beyond the words. However, the highest level of listening is the fifth level, which includes active-empathic listening. Empathic listening involves listening with your ears, as well as the eyes and the heart (Covey, 1989). This listening enactment creates a positive psychological climate within the con-
versation and it is the most fundamental requirement to make the other people open to oneself. Thus, the recipient of the message should actively engage in the communication process by listening to the speaker, without simply hearing the message. Hearing is a passive act where as listening is an active task (Robbins and Coulter, 2002). The focus of the listener or the receiver of the message in this in-
stance should be to understand the message attempted to be communicated by the sender, rather than simply hearing it or attempting to respond to the words expressed by the speaker. Thus, this process is identified as active-empathic lis-
tening. As the name implies, empathic listening begins with empathy. The concept of empathy is completely distinct from the notion of sympathy.
Empathy involves deep and complete understanding of a person both emotion-
ally as well as intellectually. Aring and Cincinnati (1958) highlights the difference of empathy from other concepts by defining it as a reflective commitment to an-
other person’s problem while maintaining his/her own identity. Empathy opens up a person to be a better communicater because empathy is being able to take the perspective of another and think, feel, and act as if you are them.
While Covey (1989) identifies this as an essential skill to be developed by every individual, Gearhart and Bodie (2011) states that it is very much important for the success of close relationships and in supportive and caregiving episodes (e.g., doc-
tors, nurses, counsellors). Enactment of active empathic listening creates a safe space to the speaker to open up in front of the listener (Limacher and Wright, 2003) which is very important in the situations related to above interactions. Bodie (2011) also confirms the idea of Covey, where, he states that the importance of being an active empathic listener is lauded throughout interpersonal scholarship. Neverthe-
less, this concept of active empathic listening originally came into discussion in the field of sales and marketing and was later identified as important across all avenues of life of individuals. Accordingly, sales people had been extensively trained initially on this skill (Drollinger, Comer, and Warrington, 2006). It has been conceptualized by Drollinger et al. (2006) as a three-stage activity: sensing, processing, and responding.

36
Communication. Relations. Management 2018
Following have been identified as the steps that one could practice in engag-
ing in empathic listening (Tayal et al., 2017).1. Decide to connect with empathy.2. Use subtle cues to convey that you are listening intently and honor the first
‘golden moments.’3. Listen for underlying feelings.4. Listen for underlying needs or values.5. Remain present when you are listening to the speaker.6. Consider responding verbally.7. Look for cues that the speaker has finished expressing him/herself.8. Reflect on your experience and rejuvenate yourself for the next time you
offer empathy.
Active-Empathic Listening (AEL), has been empirically found to be highly relat-ed with a number of general social skills such as emotional sensitivity, emotional expression, emotional control, social expression, and social control (Gearhart and Bodie, 2011). These empirical studies have been undertaken in the current and the previous decade as a response to the call for studies focussing on listening in the organizational context. It enables the listener to understand the uniqueness of the speaker and thereby provide feedback, comments, or advice which are particularly relevant to the speaker, rather than giving general advice. Though people believe that engaging in active empathic listening is a time consuming process, as it requires the listener to be fully present for the other person’s experiences, Tayal et al. (2017), state that it actually saves time and produces effective outcomes. Empathic listening has been empirically proven to be highly useful in managing conflict, promoting inti-
macy, succeeding as a leader, and creating a client-centered business model (Bodie, 2011). In addition, empathic listening is found to help employees in organizations for better job performance and upward career mobility (Sypher, Bostrom and Seibert, 1989). Apart from these individual employee level consequences, Brownell (2008) has identified the organizational level positive consequences of empathic listening such as improved organizational communication, performance, and development.
Covey (1989) states that, engaging in empathic listening and empathic commu-
nication creates a paradigm shift within an individual, from the typical interest to ‘seek to be understood’ towards ‘seeking to understand’. This paradigm shift creates a huge change in the individual, where the person who previously listened only to respond what the other person says will now tend to listen to understand. The people who listen to respond, do not listen to what the other person says, as while the other person talks they are busy responding or preparing to speak (Lozzi, 2000).

37
2018 Communication. Relations. Management
2.5. ConclusionIrrespective of the position held by a person, it is important to develop em-
pathic listening skills as it reinforces one’s care towards the other person, which is a very important component in interpersonal communication and relationships. This has now been identified as a highly required competency among corporate managers and leaders. Given this significance, it is highly recommended to incor-porate training sessions on empathic listening to the corporate training portfolios developed by both organizations themselves as well as by the trainers. Apart from that, scholars are encouraged to escalate and engage in ground breaking scholarly work in the area of empathic listening to continue the growing theo-
retical and empirical discussion on the area.
ReferencesAlexandra, K. (2018) Why Listening May Be Today’s Most Underrated Skill. Available
at: https://www.skillsyouneed.com/rhubarb/listening-most-underrated-skill.html (Accessed: 4 October 2018).
Aring, C.D. and Cincinnati, M.D. (1958) ‘Sympathy and Empathy’, Journal of the American Medical Association, 167(04), pp. 448–452. Available at: https://www.ihsinfo.org/IhsV2/Convention2012/seminar/6 Slides-Barrier-Breaking Communication Skills.pdf.
Bodie, G.D. (2011a) ‘The active-empathic listening scale (AELS): Conceptualization and evidence of validity within the interpersonal domain’, Communication Quarterly,
59(3), pp. 277–295. doi: 10.1080/01463373.2011.583495.Bodie, G.D. (2011b) ‘The Understudied Nature of Listening in Interpersonal Communi-
cation: Introduction to a Special Issue’, International Journal of Listening, 25(1–2), pp. 1–9. doi: 10.1080/10904018.2011.536462.
Brownell, J. (2008) ‘Exploring the strategic ground for listening and organizational effec-
tiveness’, Scandinavian Journal of Hospitality and Tourism, 08(03), pp. 211–229. doi: https://doi.org/10.1080/15022250802305295.
Cheney, G. (2007) ‘Organizational communication comes out’, Management Communi-cation Quarterly, 21(1), pp. 80–91. doi: 10.1177/089331890730263999.
Covey, S.R. (1989) THE SEVEN HABITS OF HIGHLY EFFECTIVE PEOPLE. New York: Free Press.
Deming, D. (2017) ‘The Growing Importance of Social Skills in the Labor Market’, The Quarterly Journal of Economics, 132(04), pp. 1593–1640. doi: 10.3386/w21473.
Drollinger, T., Comer, L.B. and Warrington, P.T. (2006) ‘Development and validation of the active empathetic listening scale’, Psychology & Marketing, 23(02), pp. 161–180. doi: https://doi.org/10.1002/mar.20105.

38
Communication. Relations. Management 2018
Garvin, D.A., Edmondson, A.C. and Gino, F. (2008) ‘Is yours a learning organization’, Hard-
vard Business Review, 86(3), pp. 109–116. doi: 10.1037/e413842008-018.Gearhart, C.C. and Bodie, G.D. (2011) ‘Active-Empathic Listening as a General Social Skill:
Evidence from Bivariate and Canonical Correlations’, Communication Reports, 24(2), pp. 86–98. doi: 10.1080/08934215.2011.610731.
Ha, J.F. et al. (2010) ‘Doctor-Patient Communication : A Review’, the Ochsner Journal, 10(August 2017), pp. 38–43. doi: 10.1043/toj-09-0040.1.
Janusik, L.A. (2007) ‘Building Listening Theory: The Validation of the Conver-
sational Listening Span’, Communication Studies, 58(2), pp. 139–156. doi: 10.1080/10510970701341089.
Limacher, L.H. and Wright, L.M. (2003) ‘Journal of Family Nursing’, Journal of Family Nursing, 9(2), pp. 130–150. doi: 10.1177/1074840703251968.
Lozzi, A. (2000) The Sales Sucess Handbook:Your Personal Guide to the Systems and Strategies of Highly Sucessful people. Lincoln: Authors Choice Press. Available at: https://books.google.lk/books?hl=en&lr=lang_en&id=7Is11sqbwiIC&oi=fnd&p-
g=PR5&dq=%22listen+to+understand+not+to+reply%22&ots=hCk2EJzwrj&sig=zp-
cUmpAp9IGSFFP8SP59_hklIyM&redir_esc=y#v=onepage&q=%22listen to under-stand not to reply%22&f=false.
Mow, B.E. (2012) ‘BARRIER BREAKING COMMUNICATION SKILLS’. Available at: https://www.ihsinfo.org/IhsV2/Convention2012/seminar/6 Slides-Barrier-Breaking Com-
munication Skills.pdf.Parks, E.S. (2015) ‘Listening with empathy in organizational communication’, Organiza-
tional development Journal, 33(3), pp. 9–22. Available at: https://search.proquest.com/openview/87aeacdea89731c2ed54d92e29d1b77b/1?pq-origsite=gscholar&c-
bl=36482.Robbins, S.P. and Coulter, M. (2002) Management. PrenticeHall.Robbins, S.P. and Judge, T.A. (2013) Organizational Behaviour. 15th edn. New Jersey:
Pearson.Stowell, J. and Cook, R. (2003) Developing listening skills featuring Jessica Stowell. Edu-
cational Video Group. Available at: http://www.uwispace.sta.uwi.edu/dspace/han-
dle/2139/43268 (Accessed: 4 October 2018).Street, R.L. et al. (2009) ‘How does communication heal? Pathways linking clinician-patient
communication to health outcomes’, Patient Education and Counseling, 74(3), pp. 295–301. doi: 10.1016/j.pec.2008.11.015.
Sypher, B.D., Bostrom, R.N. and Seibert, J.H. (1989) ‘Listening, Communication Abilities, and Sucess at Work’, The Journal of Business Communication, 26(04), pp. 293–304. doi: 10.1177/002194368902600401.
Tayal, S.C., Michelson, K. and Tayal, N.H. (2017) Listening with empathy. Available at: https://www.stepsforward.org/Static/images/modules/41/downloadable/listen-
ing_with_empathy.pdf.

39
2018 Communication. Relations. Management
Ilona Kiausiene, Vaidilute KaminskieneVilnius University
CHAPTER 3
WOMEN IN BUSINESS:
ESTABLISHMENT OPPORTUNITIES
3.1. IntroductionMore women tend to find self-determination, use their skills, seek knowl-
edge and reveal their strengths in order to achieve economic independence. The number of women that are educated, more actively participating in the labour market, creating their business is increasing. However, in many countries, the number of women entrepreneurs is significantly lower in comparison to men entrepreneurs, even though business becomes an important source of employ-
ment and is one of the ways to reduce unemployment. Women entrepreneurs, compared to men entrepreneurs, still face certain social inequality that deter-mines their level of business activity, profitability of managed business, market access and business success.
It is acknowledged that business, which is established and managed by wom-
en, play an important role in society and economy, and this encourages scientists to focus on this phenomenon. In the scientific literature, a lot of attention is paid to explaining the concept of entrepreneurship (Low and MacMillan (1988), Bučienė and Ulvidienė (2011), Jucevičius (1998), Lukaševičius (2005), Kuratko (2013), Ambrish (2014), Gеgiесkiеnė and Grikšiеnė (2009), and other), describ-
ing the determinants of entrepreneurship (Stripeikis and Žukauskas (2011)). Other scientists (Kirkwood (2009), Grilo and Thurik (2005), Rakauskienė (2014), Miles (2013), Zapała and Zięba (2014), Zhouqiaoqin, Xie Ying Ying, Zhang Lu, Suresh Kumah (2013), Rani and Menezes (2016), Thébaud (2015), Langowitz and Minniti (2007), Jamali (2009), Naser, Mohammed, Nuseibeh (2009), Roomi (2009), Huarng, Mas-Tur, Hui-Kuang Yu (2012), McGowan, Redekera, Cooperb and Greenana (2012), Mahmood and Hanafi (2013), Mitchelmore and Rowley (2013), Ahl and Nelson (2015), Hodges, Watchravesringkan, Yurchisin, Karpova,

40
Communication. Relations. Management 2018
Marcketti, Hegland, Yan Childs (2015), Toledo-Lopez et al. (2012), Hung et al.
(2011), Diržytė et al. (2012)) name the motives encouraging the entrepreneurial activities, devote more attention to women entrepreneurship, research the dis-
tribution of women entrepreneurs, according to the areas of activities, discuss the main obstacles for developing women entrepreneurship, define business success factors etc.
Despite the attention of scientists, the potential of women entrepreneurship is only beginning to be realised; thus, it is important to determine what are wom-
en’s opportunities to establish in business.The goal of the research: after reviewing the ways and factors of involvement
in entrepreneurial activities, to determine the opportunities for the establish-
ment of women in business.The following tasks were set in order to reach the goal of the research:
1. Analyse ways and factors of involvement in entrepreneurial activities.2. Name reasons encouraging women to establish and develop business.3. Identify obstacles that women face when establishing a business.4. Evaluate internal and external factors that affect women’s position in
business.
Reserach methodology: scientific literature analysis, synthesis, comparison and summary, interview. The structure of this paper is as follows. First, the liter-ature review examines the ways and factors of involvement in entrepreneurial activities. Next, the methodology for this research is outlined, including the ques-
tionnaire design, respondent profile, and results of the empirical study. Finally, in conclusions section, the summary of the results of this paper is provided.
3.2. Ways and factors of involvement in entrepreneurial activities Entrepreneurship or establishment of a new business forms economic strat-
ification and is the driving force of social mobility (Keister, 2005). The concept of entrepreneurship is vast. Some scholars relate entrepreneurship with the estab-
lishment of a new company (Low and MacMillan, 1988), the process of creating new value (Jucevičius, 1998), reviving the existing business and thus creating new value, new work places, new products and services (Ambrish, 2014). Oth-
ers (Kuratko (2013), Gеgiесkiеnė and Grikšiеnė (2009), Bučienė and Ulvidienė (2011), Lukaševičius et al. (2005)) stress the importance of personal qualities and initiative of an entrepreneur in the process of entrepreneurship. The con-
cept of entrepreneurship encompasses the whole process from the development

41
2018 Communication. Relations. Management
of an idea to its implementation, creation of a team, organisation of activities, achievement of the aim. Entrepreneurship is characterised as initiative, activity, ability to organise, plan time, use resources and take risks, independence, inno-
vative financial insight, negotiation skills in personal life and business. Entrepre-
neurship is related to motivation and achievement of the set aims, it is a way of thinking about the person, ability to use acquired knowledge in everyday life, providing the opportunity to establish and develop personal business, compete in the business environment. The inherited and acquired qualities are creative and innovative attitude, strong inner motivation, ability to notice and use new opportunities, take risks and responsibilities.
In scientific literature (Stripeikis and Žukauskas, 2011) there are named two ways how to involve in entrepreneurship: necessity business start-up and oppor-tunity business start-up. There are more chances to become a necessity business start-up, because of negative circumstances (for example: job loss). However, this causes entrepreneur to encounter certain problems in the future, because of not evaluated personal competences and opportunities in the business environment. Whereas, the becoming an opportunity business start-up includes several stages: recognition of personal capacities, perception of business opportunities, evalua-
tion of “price” of being in business (Stripeikis and Žukauskas, 2011).The circumstances of business establishment can be caused by both posi-
tive and negative factors. Verheul et al. (2010) relate necessity business start-up and opportunity business start-up with “push” and “pull” factors when creating a business. According to the mentioned authors, “pull” motives are related to the need of achievement and independence, and “push” motives relate to risk of unemployment, family pressure and dissatisfaction with the present situation, when the establishment of business becomes the best, but not necessarily the most preferred activity.
Grilo and Thurik (2005) divide motives into two broad categories: factors affect-ing demand and factors affecting supply. According to the authors demand factors are influenced by the structure of industry and consumers’ taste, a variety of technol-ogies, development, globalisation and the standard of living. Supply factors affect the chance of becoming an entrepreneur. Supply factors are influenced by the growth of population, urbanisation, age, women’s participation in the labour market, income level and unemployment. Even though the supply and demand sides are oriented towards the macro level, the system is as well related to the decision-making process that explains how and why persons choose to become self-employed in comparison to the risks and benefits of other working opportunities.
42
Communication. Relations. Management 2018
According to Stripeikis and Žukauskas (2011), the entrepreneurship demand is characterised by the external factors that create circumstances (both positive and negative) for the involvement in the entrepreneurial activities. The entrepre-
neurship supply is characterised by the group of internal factors: personal qual-ities, abilities and skills, knowledge, personal experience, i.e., entrepreneurship competence. The authors state that “the result of entrepreneurship demand is the opportunity of involvement in business, and the result of entrepreneur-ship supply is a potential entrepreneur that has entrepreneurship competence” (Stripeikis, Žukauskas, 2011, p. 128).
Thus, these authors distinguish two wide groups of factors that influence entrepreneurship: external and internal factors. The method of involvement in entrepreneurial activities depends on the factors that are affecting entrepre-
neurship. Both groups of factors can influence the process of entrepreneurship differently. The factors that are influencing entrepreneurship can act as a driving force and entrepreneurship obstacles.
Women as well as men get involved in the entrepreneurship activities due to various reasons: independence, profit, desire of achievement, work satisfaction, under favourable circumstances, personal qualities, aiming at self-realisation etc. (Miles, 2013). However, women are motivated by a wider system of factors in comparison to men (Sullivan, Meek, 2012). A large number of women, contrary to men, choose to start a business in order to combine work and family respon-
sibilities (McGowan et al., 2012). Women aim at the harmonious environment of the organisation, workers and users’ satisfaction, combining work and family responsibilities (children care, housework), caring for the environment and its preservation. Women apply more integrated, based on cooperation manage-
ment style, and before making decisions, they trust other professionals and their experience. Whereas men in business tend to make strict, non-flexible, some-
times even aggressive-policy decisions (Jakštytė, 2014, p. 396).Scientists name different factors how to become a successful entrepreneur.
Toledo-Lopez et al. (2012) refer that the key to successful business is to sur-vive as long as possible. Stripeikis (2008) identify business success with manag-
er’s competence to notice, evaluate and implement the existing opportunities in a business environment. Ahmad and Ramayah (2012) measure business suc-
cess by the satisfaction with result from financial and non-financial activities, comparison of results with competitors. Hung et al. (2011) refer that six key success factors are networking, product, ability to focus on the market, custom-
er, supportive management team and strong leadership. Diržytė et al. (2012)

43
2018 Communication. Relations. Management
relate business success with strong inner motivation, overcoming disappoint-ment and helplessness.
Scientists Zapała and Zięba (2014) notice that enterprises that are estab-
lished by women differ from their colleague men in many aspects: size, num-
ber of employees, and women’s income from the business is smaller than men. Women-managed enterprises are usually oriented towards households as the main users; women tend to establish “traditionally” female businesses; their usual clients are women. Whereas men enterprises tend to work longer than those managed by women; studies have proved that on average women tend to spend less time for business than men (Miles, 2013).
Despite the equal opportunities policy, the path towards successful business requires more time and efforts of women rather than men (Fabińska, 2016). In the labour market as well as in business, women encounter with such barriers as less accessible financial resources, sceptical society’s attitude towards female entrepreneur, compatibility of business and household responsibilities, lesser experience and learning opportunities. One of the main obstacles for women who are creating business is financial support for business start-up. For many women, it is more difficult to obtain bank loans, because their creditworthiness is smaller than men; thus, women have to ask help from their friends and family members to fund their business plans (Zapała, Zięba, 2014). Investors and banks usually do not want to invest in women- established enterprises, because they contain certain risks (Ramadani, 2015). Due to the lack of funding, women tend to involve in sectors that require smaller financial capital (Zapała, Zięba, 2014), apply less risky strategies in business (Popović Pantić, 2014). These factors de-
termine that women tend to develop business in family, small and medium-sized enterprises; women-managed enterprises are less oriented toward growth (Hal-berstadt, Kraus, 2016). The stereotype of a successful entrepreneur is usually linked to male domination in culture, where the main indicators are the size, growth and profitability of enterprises (Watson, Newby, 2005), and the success of business is usually related to economic indicators (growth of enterprise, increas-
ing employment) (Powell, Eddleston, 2012). These provisions should determine that the enterprises established by women entrepreneurs are less successful than men entrepreneurs.
According to Filculescu (2016), in order to understand the opportunities of women- established successful businesses, the challenges that women entre-
preneurs face should be evaluated. There is a significant relation between family support and women’s success when creating a business. The main motive for

44
Communication. Relations. Management 2018
women to involve in entrepreneurial activities is the ability to combine family and work responsibilities. According to Kiškienė (2016), due to this reason, busi-ness impresses women more than men. Many women-managed enterprises are businesses based on family relations, where family members, relatives and close friends are a part of the workgroup (Ahmad, 2011). Thus, scientists distinguish family support, financial as well as emotional, importance for the development of successful business that is established by women (Zhouqiaoqin, Xie ying ying, Zhang Lu, Suresh Kumah, 2013). Women tend to start a business that is based on personal hobbies, beliefs, creative industries (Kiškienė (2016); Rani, Menez-
es (2016)). Women- established enterprises focus on the service sector, retail sphere. Many women gain experience from their entrepreneurship activities, but not beforehand (Zapała, Zięba, 2014).
Scientists stress the importance of innovations for enterprises that aim to differentiate products and services, distinguish from competitors and create ad-
ditional or new value for clients (Osman, Ngan, 2016). However, stereotypes still prevail in the society; thus, women entrepreneurs are less linked with innova-
tions than men (Zapała, Zięba, 2014). Nonetheless, a woman who is proposing an innovative business idea is evaluated as a more reliable and competent entre-
preneur that is more linked with opportunities (Thébaud, 2015). The innovations that are installed in business by women differ from men, not because men and women differ, but their companies differ in aims, size, organisational culture, number of employees etc. (Zapała, Zięba, 2014). Thus, women entrepreneurs tend to create innovative products and services in sectors that are related to the care of children, family members, household and domestic life (Walker, Brown, 2004). Women use their inherited and acquired qualities and roles that are pro-
vided by the society, what they have learned as wives or mothers. Women feel directly related to these areas and created products that can influence their lives, facilitate everyday tasks, effectively combine work and family responsibilities (Zapała, Zięba, 2014).
According to Huysentruyt (2014), women are leading innovators what con-
cern the social innovations. Women stress social aims more than economic when implementing entrepreneurial activities. The author states that women tend to open new markets by presenting products or services that have never been pre-
sented before. This might be related to specific sensitivity of women towards social needs (Huysentruyt, 2014).
Scientists have studied gender differences in entrepreneurship (Langowitz, Minniti (2007), Kirkwood (2009)) women’s motives to develop entrepreneurship

45
2018 Communication. Relations. Management
(Ramadani, (2015), Rakauskiene et al. (2014), Akehurst, Simarro Mas-Tur (2012), Huarng, Mas-Tur, Hui-Kuang Yu (2012), Naser, Mohammed, Nuseibeh (2009)) obstacles that hinder women to establish and manage a business (Jamali (2009), Roomi et al. (2009), Ahl, Nelson (2015), Hodges et al. (2015)) and criteria that characterise women’s success in business (Mitchelmore, Rowley (2013), Zhou-
qiaoqin, Xie ying ying, Zhang Lu, Suresh Kumah (2013), Mahmood, Hanafi (2013), McGowan et al. (2012)). It is clear from the researchers’ studies that women as well as men are motivated by a similar system of factors, i.e., not only economic goals. The main motive that depends on gender is the compatibility of respon-
sibilities to family with time spent for business. It is important to mention that family motive when creating a business is important for men as well as women, but women aim at better balance between family responsibilities and business, whereas men aim at simple family support when creating a business.
The main factors determining the success of business that is established by women are family support, strong inner motivation, skills and abilities, choice of the suitable area, feedback from customers, installed innovations. The factors of a successful business established by women affect one another. Women tend to communicate with customers, and their participation encourages the creation of innovations, and new products or services attract new clients, determine the development of enterprise, higher financial indicators.
3.3. Research methodology of women’s position in business Research of women’s position in business allows determining the main fac-
tors and reasons that encourage women to establish business and find the main obstacles that women face when trying to integrate into the world of business.
In order to conduct the research, interview, i.e., the method “during which a conversation on a certain topic is ongoing with the analysed person”, has been chosen (Kardelis, 2016, p. 256). According to Kardelis (2016, p. 256), during the interview the interviewer can get profound knowledge about the other person, can control the process of the interview, has the possibility to change the ques-
tions, analyse the perceived answers. The content analysis helps to distinguish certain frequencies in the obtained information, classify them into categories and subcategories; thus, a researcher can analyse, systematise and summarise the obtained text information (Tidikis, 2003, p. 498).
Aiming to analyse the opportunities of women establishment in business, the method of half-structured interview has been chosen to gather informa-
tion. The qualitative research was conducted by following in advance prepared

46
Communication. Relations. Management 2018
questionnaire. The questionnaire of half-structured interview was composed of 20 questions. Part of the questions were composed to formulate free answers, another part of questions provides possibility for the respondents to choose the most suitable variant from the provided possible answers. The questions were composed regarding the analysis of literature sources, studies conducted by the other scientists, aim, objectives of the research. The interview questionnaire is composed of 6 categories (Table 3.3.1.).
Table 3.3.1. Interview Questionnaire
Category Interview Questions Aim of Interview Question
Social demography
characteristics of respondents
• What was your occupation before creating a business?
• Do you still have another job?
• What is the size of your company?
• What is your entrepreneurial activities?
• Your age.• Your education.
The aim of the questions was to find out social demography characteristics of respondents: education, age, marital status,
entrepreneurial activities, size of the company.
Characteristics of an entrepreneur
and the
concept of entrepreneurship
• What character traits describe entrepreneur best?
• What, according to you, is Entrepreneurship?
The aim of the questions was to find out the attitude
of respondents towards entrepreneurship, to determine
factors affecting entrepreneurship and characteristics of an entrepreneur.
Motives for business
establishment
• There are many reasons why people start business. Which factors were the most important for you?
The aim of the questions was to evaluate motives and
opportunities that encouraged women to establish a business.
Barriers to business
establishment
• What barriers did you face during business start-up? How did you avoid them?
The aim of the questions was to identify the obstacles that
women entrepreneurs tend to face and opportunities to avoid them.

47
2018 Communication. Relations. Management
Women’s position in business
• Evaluate internal factors that affect women’s position in business
• Evaluate external factors that affect women’s position in business
• For whom, according to you, it is easier to establish in the world of business: men or women?
• Evaluate women’s position in business in the country where you live.
The aim of the questions was to find out how women evaluate
their opportunities for the establishment in business, what
are conditions for women to establish and develop business?
Promotion of women’s
entrepreneurship
• What means, according to you, could encourage women entrepreneurship?
The aim of the questions was to find out the importance
of women’s entrepreneurship education and promotion.
Source: own compilation.
The interview was conducted from 1 December 2016 to 20 April 2017. As the re-
spondents were women developing their business abroad as well, the half-structured interview was conducted by directly communicating with respondents and via inter-net using Skype chat site. The interview was in Lithuanian. The respondents were informed about the aim of the qualitative research and where the use of results. By the request of the women that participated in the research, their true names are not mentioned. According to Bitinas et al. (2008, p. 117), this is one of the most ef-fective ways to ensure confidentiality when solving ethical problems in the qualitative researches. The time and place of the research were coordinated with respondents personally during their preferred time. The interview lasted from 30 to 50 minutes.
According to Žydžiūnaitė (2011), when conducting qualitative research, what matter is not the number of the respondents but their selection criteria. Respondents were selected according to the following criteria:
1. Occupation before creating a business.2. Size of the enterprises that were established by women.3. Area in which women usually tend to develop business.

48
Communication. Relations. Management 2018
Snowball sampling has been chosen for this research as the best way to deter-mine statistical population. According Bitinas et al. (2008, p. 101), this sampling is convenient, because “every respondent that has been participating in the research can offer other research units for the researcher, introduce and involve other re-
spondents into the study”. Thus, the researcher can base study on the obtained and other respondents’ introduced resources (Bitinas et al., 2008). The sample size of the research was determined according to the informativeness of the gathered data, i.e., new respondents were being included in the research, until the infor-mativeness of the data that were gathered during the research started to decline.
3.4. Research results of women’s position in business Twelve women entrepreneurs have decided to share their experiences. Four
of them are now living and developing business in Lithuania: three are Lithua-
nian entrepreneurs, one of which is married to a foreigner, and one is Estonian who started a family in Lithuania. Eight Lithuanian entrepreneurs develop their business abroad in the United Kingdom, Ireland, Norway and Italy. Eight out of all respondents that participated in the research live in marriage, two are divorced, two single, eight raise children under 18 years. The characteristics of social de-
mography of respondents are provided in Table 3.4.1.
Table 3.4.1. The characteristics of social demography of respondents
RespondentsEntrepreneurial
activitiesThe size of
the companyEducational attainment
Age Country
R1 Crafts
Very small
company (less than 10
employees)
Higher 35–44 years old
United
Kingdom
R2 Services
Very small
company (less than 10
employees)
Higher 35–44 years old Italy
R3 Services
Very small
company (less than 10
employees)
Higher 25–34 years old Lithuania

49
2018 Communication. Relations. Management
R4 Services
Very small
company (less than 10
employees)
Higher 35–44 years old
United
Kingdom
R5 AgricultureSmall company
(10–49 employees)
Higher 25–34 years old Lithuania
R6 Commerce
Very small
company (less than 10
employees)
Higher 25–34 years old
United
Kingdom
R7 ServicesSmall company
(10–49 employees)
Upper secondary
15–24 years old Ireland
R8 Commerce
Very small
company (less than 10
employees)
Higher 45–54 years old Lithuania
R9 Services
Very small
company (less than 10
employees)
Higher 35–44 years old Lithuania
R10 Services
Very small
company (less than 10
employees)
Higher 45–54 years old Ireland
R11 Services
Very small
company (less than 10
employees)
Higher 35–44 years old Norway
R12 Crafts
Very small
company (less than 10
employees)
Higher 35–44 years old Lithuania
Source: own compilation.
The results of the research revealed that most of the women perform their en-
trepreneurial activities in such small and medium business (SMB) areas like services (6 interviewed women manage their business in the area of services). Another two

50
Communication. Relations. Management 2018
popular areas of activities are commerce and crafts: 4 women have established their business in these areas. Ten women have established very small companies (less than 10 employees), two women have small companies (10–49 employees) (Table 3.4.1.). To sum up, it could be stated that women tend to start from smaller, local businesses, creating a workplace for themselves, according to their possibilities and hobbies.
The research was aimed to find out what character traits, according to the respondents, describe entrepreneur best (Table 3.4.2.).
Table 3.4.2. Traits that characterise an entrepreneur
Category Subcategory Illustrative statementsFrequency
of recurrence
Character
traits
describing entrepreneur
Self-confidence
“<...>self-confident <...>” (R1)“<...>self-confidence <...>” (R2)“Only self-confident person can achieve the set goals <...>” (R3)
“<...>as well as self-confidence” (R4)“<...>self-confidence <...>” (R5)
“<...>trust yourself enough <...>” (R6)“<...>self-confidence <...>” (R7)“<...> self-confidence <...>” (R8)“<...>self-confident, <...>” (R9)
“<..>believe in what you do <...>” (R11)
10
Responsible
“<...>responsible for family welfare <...>” (R6)
“<...>feel the responsibility not only for yourself, but also for your
employees <...>” (R8)“<...>responsibility <...>” (R9)
“<...>taking responsibility for own actions” (R10)
“<...>responsible <...>” (R11)
5
Initiative “Initiative” <...> (R11) 1
Creativity
“<...>creative <...>” (R1)“<...>creativity <...>” (R5)“<...>creativity <...>” (R9)“<...>creative <...>” (R11)
4

51
2018 Communication. Relations. Management
Innovativeness “<...>innovative use <...>” (R11) 2
Organised
“<...>ability to organize <...>” (R4)“<...>able to plan <…>” (R10)
“<...>able to organize and plan <...>” (R11)“<...>organizational skills <...>”(R12)
4
Quick decision-making
“<...> and the decision has to be made here and now <...>” (R11) 1
Ability to control
situation
“<...>under stressful situations and have the ability to control them” (R7)
“<...>quickly responding to the situation <...>” (R11)
2
Ability to control
emotions
“<...>have to keep calm under stressful situations <...>” (R7)
“<...> not sharing anxiety with employees” (R11)
2
Ability to take risks
“<...>risk-taking <...>” (R1)“<...> at risk <...>” (R2)
“<...>liking to take risks <...>” (R3)“<...>don’t afraid to take a risk <...>” (R10)
“<...>take the risk <...>” (R11)
5
Goal-orientation
“<...>goal-oriented <...>” (R2)“<...>entrepreneur without
goal-orientation should expect no results” (R3)
“<...>and the most important of all is to achieve the set goals” (R4)
“Only a goal-oriented person can expect the best results” (R5)
“<...> and when having set the goal, it is easier to overcome the appearing
obstacles” (R6)“<...>have a clear goal <...>” (R8)
“<...>„The future entrepreneur should clearly define own goals <...>” (R11)
“The entrepreneur should have a concrete goal <...>” (R12)
8
Source: own compilation.

52
Communication. Relations. Management 2018
The respondents that participated in the research named quite a lot of traits that characterise an entrepreneur (Table 3.4.2.). The main qualities characterising an entrepreneur that were distinguished by the respondents are self-confidence, goal-orientation. According to the respondents, an entrepreneur should be able to manage situation, control emotions, be innovative. Such qualities that are peculiar to the entrepreneur as quick decision-making, initiative were stressed
less. To conclude, it could be said that women, who participated in the research, relate entrepreneur with a self-confident, goal-oriented, taking risks person that is responsible, creative and organised.
The second question of the interview aimed to find out how respondents define the concept of an entrepreneurship (Table 3.4.3.).
As is can be seen in Table 3.4.3., respondents define entrepreneurship as in-
herited and acquired skills, the ability to notice opportunity, realise idea, organise business, manage it when aiming at profit. According to the answers, it could be stated that women tend to look at the entrepreneurship as a goal to realize personal opportunities.
When conducting the research, it was relevant to find out the motives that encouraged women to establish a business. The main motives of respondents to establish a business is the opportunity to implement own ideas, opportunity to earn more, the need for self-realisation. No less important for women were opportunity to create own work place, flexible working hours, the opportunity to become independent. Women are least motivated to establish a business by discrimination at work, not suitable working conditions and public recognition. This allows to state that business attracts women due to the opportunity to re-
veal, implement personal goals as well as opportunity to earn money and balance family life with work requirements.
Table 3.4.4. display “push” and “pull” motives that encourage women to establish business.

53
2018 Communication. Relations. Management
Table 3.4.3. The concept of an entrepreneurship according to the respondents
Category Subcategory Illustrative statementsFrequency
of recurrence
The concept of an entrepreneurship
Creating of the company
“Creating business companies, new products, services” (R1) 1
Ability to organize business, risking
assets and seeking to profit
“Entrepreneurship – personal ability to create profitable
workplace by risking assets” (R2)“Entrepreneurship – ability to
organize and manage a profitable business” (R3)
“Entrepreneurship – personal ability to take risks for profit” (R6)
3
Management and organizational
abilities
“Entrepreneurship – entrepreneur’s ability to organize
and manage business” (R5)1
Ability to notice opportunity,
transform it into the idea
by creating added value
“Entrepreneurship – ability to implement the idea when
seeking to profit” (R8)“Entrepreneurship – ability
to assess personal opportunities in business” (R9)
“Entrepreneurship – personal qualities that allow implementing the possessed ideas and gaining
profit” (R10)“Entrepreneurship –ability to turn
an idea into profit” (R12)
4
Inherited and
acquired personal qualities that allow to act
actively and risky in all real life
situations
“Entrepreneurship – ability to establish business by applying
obtained knowledge and personal characteristics” (R4)
“Entrepreneurship – personal characteristics of the entrepreneur that help to manage and organize
business successfully.” (R7)“Entrepreneurship is inherited personal ability that is related
to active work, achieving goals, taking risks” (R11)
3
Source: own compilation.

54
Communication. Relations. Management 2018
Table 3.4.4. Evaluation of “push” and “pull” motives that encourage women to establish business
Category Subcategory Illustrative statementsFrequency
of recurrence
“Push” motives
Lack of other employment opportunities
“Employment difficulties <...>” (R1)“<...> lack of employment opportunities <...>” (R3)
“<...> desire to work in better conditions<...>” (R4)
“Unemployment <...>” (R11)“Having trouble finding a job
<...>” (R7)“Low opportunity to find a suitable job <...>” (R8)
6
Discrimination in the labour
market
“<...>women are paid less for the same job <...>” (R7)
“It is more difficult to find a job for a woman <...>” (R9)
2
Non-flexible working hours
“Inability to spend a sufficient amount of time with a child” (R2)
“Established working hours <...>” (R3)“No opportunity to manage time
flexibly <...>” (R4)„Established working hours“ (R6)
“<...> full-time job” (R7)“<...> fixed working time <...>” (R8)“<...> not provided flexible working
hours” (R9)“No opportunity to work while raising minor children” (R12)
8
Fewer career
opportunities
“<...> no opportunity for professional development” (R1)
“<...> not wanting to work as unskilled worker” (R3)
“<...> no perspectives at work place” (R4)
“Fewer career opportunities” (R5)“No opportunity to pursue
a career” (R6)“<...> work without perspective” (R8)“<...> restricted career opportunities
<...>” (R9)“<...> work without perspective” (R11)
8
24

55
2018 Communication. Relations. Management
“Pull” motives
Independence
“Desire to be independent <...>” (R1)“<...>independence <...>” (R2)
“Feeling of independence <...>” (R3)“<...>independence” (R4)
“<...> feel independent” (R5)“Independence <...>” (R6)
6
Self-realisation
“opportunity to express yourself <...>” (R1)
“Self-expression <...>” (R2)“<...>Self-realisation <...>” (R3)“<...>realize yourself <...>” (R4)“<...>realize yourself <...>” (R5)
“Self-realisation <...>” (R7)“Striving for self-expression <...>” (R8)
“<...>realize yourself” (R9)“<...>realize yourself <...>” (R10)
“Self-expression <...>” (R11)“<...>self-realisation <...>” (R12)
11
Implementation of ideas
“<...> and implement ideas” (R1)“<...>realization of ideas” (R2)
“<...>possessed ideas” (R3)“<...>opportunity to implement your
ideas” <...> (R4)“<...>to implement my ideas <...>” (R5)“<...>implementation of ideas” (R7)
“<...>implementation of ideas <...>” (R8)
“<...>to implement my ideas <...>” (R9)“Opportunity to turn ideas into
earnings <...>” (R10)“<...> implementation of ideas” (R11)
“<…> available ideas <...>” (R11)
11

56
Communication. Relations. Management 2018
Category Subcategory Illustrative statementsFrequency
of recurrence
Desire to test yourself in business
“Intent to test yourself in business <...>” (R4)
“Opportunity to test yourself in business <...>” (R5)
“<...>Desire to test yourself in business” (R6)
“<...>to test yourself in business” (R8)
“Desire to try self-employnment <...>”(R9)
“<...> realize yourself in business <...>” (R10)
“<...> willingness to test yourself in business” (R12)
8
36Source: own compilation.
As it can be seen in Table 3.4.4., the respondents distinguished more “pull” motives for the establishment of business. It could be stated that women entre-
preneurs that participated in the research value self-realisation, independence and opportunity to implement their ideas more than the opportunity to earn more money and have flexible working hours. Thus, women that participated in the research searched for an alternative professional occupation which was de-
termined by such factors like the lack of employment opportunities, discrimina-
tion in the labour market, non-flexible working hours, fewer career opportunities, but their decision to choose business was influenced more by the “pull” motives: independence, self-realisation, implementation of ideas, noticed opportunity.
Another interview question was aimed to find out the opinions of respond-
ents about the internal factors that are influencing women’s position in business, stressing which of these factors had the biggest influence on their decision to es-
tablish business. All respondents named the importance of self-confidence when
establishing a business. Other important factors are the want to show personal abilities, determination, responsibility, persistence, activeness, diligence, busyness, receptivity for information, want to implement personal ideas, need to see concrete results of personal activities, joy to create, skills to use obtained resources wisely.

57
2018 Communication. Relations. Management
Women entrepreneurs named the urge to dominate as less important when estab-
lishing a business. Knowledge and accessibility of the newest information were not highly influential in the respondents’ decision to establish a business.
From the external factors affecting women’s position in business, the respond-
ents distinguished social factors and economic factors. Political and technological factors were evaluated as less influential for women-managed business by the respondents. Overall, it could be stated that personal business for women is usually a suitable opportunity of self-realisation and assurance of financial independence.
During the interview, a question was asked to find out the opinion of re-
spondents about which factors, internal or external, according to them, have more influence on the decision to establish a business. The opinions of most of the respondents coincided: women tend to establish business encouraged by the external factors; however, internal factors become more important when trying to establish in the world of business.
The sixth question of the interview aimed to reveal the opinion of respond-
ents for whom it is easier to establish in the world of business: men or women. Nine women entrepreneurs tended to think it is easier for men to establish in the world of business. R3 stated that stereotypes about women still exist in the society “<...> it is harder for women to establish in the labour market, pol-itics and business as well <...> women business initiatives are usually valued sneering”. R1 “<...> women entrepreneurship specifics simply differ from men established businesses; thus, it is sometimes considered as unimportant activities, not valued seriously, thus destroying the initiatives”. According to the opinion of three respondents, gender does not influence the establishment in the world of business: “<...> we see examples of both men and women developing successful business, the establishment in the world of business depends more on the person-
al persistence, want, ideas rather than gender” (R7). “<...> the most important is not gender but the choice of suitable business area; the best evidence is women who are successfully managing business” (R10), “The future entrepreneur should clearly define own goals, believe in what he/she does, gender has nothing to do with it”. “In the world, men do more business than women, but I think it is caused by other reasons rather than the gender of the entrepreneur” (R11). None of the respondents thought that the conditions for business establishment are more favourable for women rather than men. Thus, it could be stated that women entrepreneurs that participated in the research tend to think that it is difficult for women to establish in the world of business.

58
Communication. Relations. Management 2018
The seventh question of the interview aimed to find out if it was difficult for women to start a business. Four respondents stressed that it was difficult for them to establish a business. “I am raising a minor child; thus, I spend less time for the development of business” (R11), “<...> after the establishing of the company, I realised that I lack skills” (R1), “<...> I did not have even basic en-
trepreneurship skills” (R2) “not only the lack of entrepreneurship skills but also foreign language gaps <...>” (R6), “I worked as an employee for half of the day to invest in business start-up”. The answers of seven respondents differed, but none of them stated that it was easy to start and develop business. “<...> the
most difficult was time managing” (R12), “<...> after establishing a company, I realised that I lack skills, but the determination, creativity and satisfaction with what I do won” (R1).
With the seventh question, the respondents confirmed that obstacles were not avoided when creating a business; thus, the eight question aimed to reveal with what obstacles did women entrepreneurs encountered. Table 3.4.5. shows how women evaluate barriers/obstacles that hinder the establishment of business.

59
2018 Communication. Relations. Management
Table 3.4.5. Evaluation of barriers/obstacles that hinder the establishment of business
Category Subcategory Illustrative statementsFrequency
of recurrence
Barriers / obstacles
Capital shortfall
“The closest relatives loaned money to start a business <...>” (R1)
“I had some savings for business start-up, but it was not enough, I asked relatives for
help” (R9)“it was hard to get a bank loan” (R4)
“<...> from personal savings (R5)”“because of capital shortfall” <....> (R6)
“I worked as an employee for half of the day to invest in business start-up” (R7)
“I did not meet the criteria for getting a loan” (R8)
<...> “lack of money to start business” <...> (R10)“Lack of initial capital <...>” (R11)
10
Stereotypes
“<...> women business initiatives are usually valued sneering” (R3)
“<...>women’s entrepreneurship specifics simply differ from men established
businesses, thus, it is sometimes considered as unimportant activities, not valued
seriously, thus destroying the initiatives” (R1)“<...>simply, women activities seem not
serious” <...> (R8)“<...>skeptical attitude towards woman
entrepreneur” <...> (R9)
4
Compatibility of professional
occupation and family
interests
“<...>I was unable to reconcile between family and work life” (R10)
“I am raising a minor child; thus, I spend less time for the development of business” (R11)
“<...>the most difficult was time managing”(R12)
3

60
Communication. Relations. Management 2018
Category Subcategory Illustrative statementsFrequency
of recurrence
Barriers / obstacles
Knowledge
“<...>I was lacking business ideas” (R10)“<...>after establishing a company, I realised
that I lack skills” (R1)“<...>I did not have even basic entrepreneurship skills” (R2)
“not only the lack of entrepreneurship skills but also foreign language
gaps <...>” (R6)
4
Other
“Lack of information about business development opportunities” (R3)
“<...>the administrative procedures <...>” (R1)“Lack of information <...>” (R2)
“Lack of information on entrepreneurship” (R6)“Time-consuming administration
procedures” (R7)“Lack of information on business
establishment issues” (R8)
6
Source: own compilation.
During the interview, the respondents stressed that they encountered obsta-
cles when creating a business; thus, the question was how they avoided obsta-
cles. “The closest relatives loaned money to start a business, it was barely enough to buy necessary means, rent small premises” (R1), “<...> I asked relatives for help” (R9), “An idea and dwellings should have been enough to start a business” (R10), “<...> I used dwellings for commerce” (R6), “I worked as an employee for half of the day to invest in business start-up” (R7), “I searched for the informa-
tion on business development opportunities, looked for women entrepreneurs in social sites, we shared our experiences <...>” (R12). The results of the conducted research confirmed that the biggest obstacle for women to establish a business is lack of financial support.
Thus, the analysis of literature sources as well as empirical researches con-
ducted by the scientists proved that the biggest obstacle for women to establish a business is the accessibility of financial support. However, women’s oppor-tunities to establish in business are still limited by the gender-related stereo-
types; women entrepreneurs are sometimes valued sceptically. One of the main

61
2018 Communication. Relations. Management
motives that inspire women to establish business is the compatibility of profes-
sional occupation and family interests. Flexible working hours allow managing time more freely, but if the opportunities are underestimated, it can become an important obstacle for business management.
The ninth question aimed to evaluate women’s position in business in the country where they live at that moment (Table 3.4.6.).
Table 3.4.6. Evaluation of the situation of women in business
Category Subcategory Illustrative statementsFrequency
of recurrence
Women’s position
in
business
Women can successfully
lead
businesses
“Women can use their obtained knowledge and abilities to develop business” (R1)
“There are successfully working women in the world of business <...>” (R2)
“<...> we see examples of both men and women developing successful business,
the establishment in the world of business depends more on the personal persistence,
want, ideas rather than gender” (R7)“<...> the most important is not gender but
the choice of suitable business area; the best evidence is women who are successfully
managing business” (R10)“The future entrepreneur should clearly
define own goals, believe in what he/she does, gender has nothing to do with it”. “In the world, men do more business
than women, but I think it is caused by the other reasons rather than the gender of the
entrepreneur” (R11)
12

62
Communication. Relations. Management 2018
Category Subcategory Illustrative statementsFrequency
of recurrence
Women’s position
in
business
Women are discriminated
in business
“<...> women’s entrepreneurship specifics simply differ from men established
businesses, thus, it is sometimes considered as unimportant activities, not valued
seriously, thus destroying the initiatives” (R1)“Women are valued based on the established stereotypes <...>” (R2)
“Business that is established by women is usually valued not seriously <...>” (R7)
4
Business provides
opportunities for women
“<...>opportunity to earn money and maintain family” (R1)
“<...> flexible working hours helps to manage time” (R2)
“The establishment of business for women is a opportunity to use personal creative
potential” (R3)“<...> opportunity to do something
you like <...>” (R4)“<...> I have the opportunity to do what
I love” (R5)“<...> provides a opportunity to combine
family and professional activity matters” (R6)
12
Source: own compilation.
As it can be seen in Table 3.4.6., when evaluating barriers/obstacles that hinder the establishment of business, four respondents stressed that women are discriminated in business. However, all women that participated in the research agreed that business provides an opportunity to earn money, maintain family, implement personal ideas, dreams, express creativity. All twelve respondents positively evaluated women opportunities to manage a business company suc-
cessfully. The results of the research reveal that, regardless of the country where they live now, women that participated in the research positively evaluated their opportunities in business.
Tenth question intends to find out entrepreneurs’ opinion on what means, according to them, could encourage women entrepreneurship. The respondents named such business support means as “<...> development of entrepreneurship

63
2018 Communication. Relations. Management
in education establishments” (R2), “<...> organised courses, retraining <...>” (R4), support for business start-up, accessible information on business relevant topics, “<...> equal opportunities should be ensured <...>” (R3), “<...> support from busi-ness information centres and business incubators <...>” (R5), “<...> cooperation and mutual assistance in business development <...>” (R7), “Sharing good experiences among the women entrepreneurs” (R10).
Overall, it could be stated that women tend to start a personal business when encouraged by the external factors: unemployment, discrimination in the labour market, pay gap, lack of work prospects, responsibilities for the household. However, when establishing in the world of business, internal factors become more important. Obstacles that women entrepreneurs face when creating a business: limited financial resources, lack of knowledge, compatibility of family and work interest, result in that women usually tend to develop business with small companies, they involve in areas that are related to their hobbies, everyday activities, personal characteristics. Such type of business does not require large initial capital, specific knowledge.
3.5. A model for women’s establishment opportunities in businessSummarising the results of the research, a model for women’s establishment
opportunities in business is provided in Figure 3.4.4. Two groups of factors that affect women’s decision to start a business have been distinguished in the model: external and internal factors (Figure 3.4.4.). Internal factors affecting entrepre-
neurship are related to the formation of entrepreneurial personality. Women seek education, professional development, have strong inner motivation: they seek self-expression, implementation of personal ideas, independence, better future perspectives for themselves and children. Entrepreneurial personality of a woman is formed by the personal characteristics: persistence, diligence, goal-orientation, responsibility, taking risks.
External factors encouraging entrepreneurship tend to condition gender dif-ferences in business and do not depend on the personality of the entrepreneur. External factors encouraging entrepreneurship are related to women’s position in the labour market: unemployment, pay gaps, discrimination in the labour market. Women entrepreneurship is influenced by such external factors as the state of the country’s economy, legal framework, measures to promote and regulate business that are applied by the state. Especially influential for women entrepreneurship are social and cultural factors, i.e., the status of women in society, historically formed traditions of a country. The activities of women entrepreneurship are determined by the demographic factors as well: age, education, work experience etc.

64
Communication. Relations. Management 2018
Figure 3.4.4. A model for women’s establishment opportunities in business
Source: own compilation.
External and internal factors encouraging entrepreneurship are interrelated: the environment where business is established develop qualities of the future entrepreneurs, their decision to establish a business, influence the success of managed business; whereas the entrepreneurs change the business environment with the variety of their established businesses.
The women’s position in business is determined by both motives that en-
courage them to involve into a business and obstacles, which they have to face. Therefore, women’s motives to establish a business have been distinguished in the model. “Push” motives are related to the external factors that are encourag-
ing entrepreneurship. The following “push” motives that encourage women’s en-
trepreneurship activities have been distinguished: unemployment, discrimina-
tion at the labour market, men and women pay gaps and the aim to balance responsibilities for occupation and household flexibly. Women’s “pull” motives to establish business are related to her personality and motivation. Encouraged by the “pull” motives, women tend to relate business with a noticed opportunity: aim to be independent, need for self-realisation, implementation of ideas, want to work favourite job, use the obtained knowledge and abilities suitably, see the results of own work. Both “push” and “pull” motives influence women decision to establish a business.
Women entrepreneurship is influenced by the obstacles as well that women tend to face when creating and managing personal business. One of the most im-
portant obstacles is the capital shortfall. The pay gaps between men and women,

65
2018 Communication. Relations. Management
segregation in the labour market, partial women’s occupation condition lower wages for women; thus, lenders evaluate them as more risky than men when asking for a loan. The socio-cultural status of a woman and the established stere-
otypes result in that the most important responsibility of a woman in the society is considered the responsibility for family and household. Actually, many women relate business with the ability to flexibly combine professional and family inter-ests; however, the underestimated opportunities can become an obstacle in the establishment and development of business.
Measures that encourage women entrepreneurship create a more busi- ness-friendly environment. The need to encourage women entrepreneurship is determined by business obstacles. Measures that encourage entrepreneur-ship influence business establishment motives and conditions women’s po-
sition in business.
ConclusionsThe concept of entrepreneurship encompasses the whole process from the
development of an idea to its implementation: motivation, creative and inno-
vative attitude, ability to use opportunities, creation of a team, planning and organisation of activities, achievement of the aim, taking risks and responsibil-ities. Entrepreneurship is important for a person, organisation as well as the country’s economy. The process of entrepreneurship is influenced by two wide groups of factors, i.e., internal and external. After the identification of factor that cause entrepreneurship, the environment where business is implemented can be controlled.
Business that is established by women is usually a small business, because women tend to establish less business than men. However, the strong women entrepreneur qualities are social and interpersonal skills; thus, their managed businesses distinguish with particular qualities: long-lasting, harmonious envi-ronment, mutual trust based on relations. Women entrepreneurs apply man-
agement style that is based on cooperation, seek employee and customer sat-isfaction, feedback. Thus, the success of a company that is managed by woman mainly depends on the owner’s personal qualities, abilities, acquired knowledge, experience, competences, evaluation of perspectives.
The main reasons that encourage women to start a business is the opportuni-ty to implement personal ideas, need for self-realisation, ability to work accord-
ing to convenient working hours and combine responsibilities to family and work etc. The least motivating for women to start their business are discrimination at

66
Communication. Relations. Management 2018
work, not suitable working conditions, opportunity to be recognised by the socie-
ty. This allows to state that women aim to reveal their creativity, realise personal professional expectations, and a very important factor when starting a business is inner motivation and belief in personal strengths.
Women that have participated in the research stated that independence, higher income, self-realisation, flexible working hours are those motives that encourage starting personal business. However, women entrepreneurs as well stressed that when creating a business, they have encountered various threats; therefore, they evaluate their personal abilities to start a business lower than men. One of the main obstacles that impedes successful establishment in the world of business is the capital shortfall for business start-up. However, other problems exist as well that usually appear when starting personal business: wom-
en still lack knowledge, courage, opportunities.
ReferencesAhl, H., Nelson, T., (2015), How policy positions women entrepreneurs: A comparative
analysis of state discourse in Sweden and the United States. Journal of Business Venturing, Vol. 30(2).
Ahmad, N., H., Ramayah, T., (2012), Does the Notion of ‘Doing Well by Doing Good’ Pre-
vail Among Entrepreneurial Ventures in a Developing Nation? Journal of Business Ethics, Vol. 106, Issue 4.
Akehurst, G., Simarro, E., Mas-Tur A., (2012), Women entrepreneurship in small service firms: motivations, barriers and performance. The service Industries Journal Volume 32, 2012 – Issue.
Ambrish, D.R., (2014), Entrepreneurship development: An approach to economic em-
powerment of women, International Journal of Multidisciplinary Approach and Stud-
ies, Vol. 1, No. 6.Bitinas, B., Rupšienė, L., Žydžiūnaitė, (2008), Kokybinių tyrimų metodologija. Klaipėda:
S. Jokužio leidykla-spaustuvė.Bučienė, R., Ulvidienė, E., (2011), Verslumo sampratos teorinės ir praktinės dermės in-
terpretacija, Respublikinės mokslinės-praktinės konferencijos, įvykusios Alytaus ko-
legijoje 2011 m. balandžio 15 d., pranešimų medžiaga.Diržytė, A., Sondaitė, J., Norvilė, N., Česnienė, I., Justickis, V., Raižienė, S., Mažeikienė, A.,
Valickas, A., Pilkauskaitė-Valickienė, R., (2012), Verslo psichologija, Vilnius: Mykolo Romerio universitetas.
Filculescu, A., (2016), The heterogeneous landscape of innovation in female led-businesses – cross-country comparisons Management & Marketing. Challenges for the Knowledge Society Vol. 11, No. 4.
Gegieckienė, l., Grikšienė, A., (2009), Verslumas. Vilnius: Ciklonas.

67
2018 Communication. Relations. Management
Grilo, I., Thurik, R., (2005), Entrepreneurial Engagement Levels in the European Union. International Journal of Entrepreneurship Education 3(2).
Halberstadt, J., Kraus, S., (2016), Social entrepreneurship: the foundation of tomor-
row’s commercial business models? International Journal of Entrepreneurial Ven-
turing, Vol. 8, Issue 3.Hodges, N., Watchravesringkan, K., Yurchisin, J., K., Karpova, E., Marcketti, E., Hegland, S.,
Ruoh-nan J.Y., Childs, M., (2015), Women and apparel entrepreneurship: An explo-
ration of small business challenges and strategies in three countries. International Journal of Gender and Entrepreneurship, Vol. 7(2).
Huarng K-H., Mas-Tur, A., Hui-Kuang Yu, T., (2012), Factors affecting the success of women entrepreneurs. International Entrepreneurship and Management Journal Vol. 8(4).
Hung, D.K.M., Effendi, A.A., Talib, L.S.A., Rani, N.A.A., (2011), A preliminary study of top SMEs in Malaysia: Key success factor vs government support program, Journal of Global Business and Economics, No 2.
Huysentruyt, M., (2014), Women’s Social Entrepreneurship and Innovation. OECD Local Economic and Employment Development (LEED) Working Papers. No. 1.
Jakštytė, K., (2014), Sėkminga moterų veikla žaliajame versle, Tiltas į ateitį, Nr. 1(8).Jamali, D., (2009), Constraints and opportunities facing women entrepreneursin devel-
oping countries. Gender in Management: AnInternational Journal. Vol. 24 No. 4.Jucevičius, R., (1998), Strateginis organizacijų vystymas. Kaunas: Technologija.Kardelis, K., (2016), Mokslinių tyrimų metodologija ir metodai. Edukologija ir kiti mokslai.
Vilnius: Mokslo ir enciklopedijų leidybos centras.Keister, L., A., (2005), Entrepreneurship. Elsevier Ltd.Kirkwood, J., (2009), Motivational factors in a push-pull theory of entrepreneurship.
Gender in management: An intrnational journal. Vol. 24 No. 5.Kiškienė, A., (2016), Lietuvos moterys versle: nori nuosavo verslo, bet bijo. Lietuvos ry-
tas. Available at: <https://verslas.lrytas.lt/izvalgos-ir-nuomones/2016/03/07/news/lietuvos-moterys-versle-nori-nuosavo-verslo-bet-bijo-838600/>
Kuratko, D.F., (2013), Entrepreneurship: theory, process, practice, Mason, Ohio: South-Western Cengage learning, 9th ed.
Langowitz, N., Minniti, M., (2007), The entrepreneurial propensity of women. Entrepre-
neurship Theory and Practice 31(3).Low, M.B., MacMillan, I.C., (1988), Entrepreneurship: Past research and future challeng-
es, Journal of Management, Vol 14, No 2.Lukaševičius, K., Martinkus, B., Piktys, R., (2005), Verslo ekonomika. Kaunas: Technologija.Mahmood, R.; Hanafi, N., (2013), Entrepreneurial Orientation and Business Performance
of Women-Owned Small and Medium Enterprises in Malaysia: Competitive Advan-
tage as a Mediator. International Journal of Business and Social Science Vol. 4 No. 1.

68
Communication. Relations. Management 2018
McGowan, P., Redekera, C.L., Cooperb, S.Y., Greenana, K., (2012), Female entrepreneur-ship and the management of business and domestic roles: Motivations, expectations and realities. Entrepreneurship & Regional Development Vol. 24.
Miles, D.A., (2013), Are Female-Owned Business Ventures Riskier Than Male-Owned Busi-ness Ventures? A Comparative Study of Gender Influences on Economics and Entrepre-
neurial Risk Patterns. International Journal of Advanced Research, Volume 1, Issue 10.Mitchelmore, S., Rowley, J., (2013), Entrepreneurial competencies of women entrepre-
neurs pursuing business growth, Journal of Small Business and Enterprise Develop-
ment, Vol. 20 Iss: 1.Naser, K., Mohammed, W.R., Nuseibeh, R., (2009), Factors that affect women entrepre-
neurs: evidence from an emerging economy. International Journal of Organizational Analysis, Vol. 17 Iss 3.
Osman, C.A., Ngan, R., (2016), Assessing Sustainable Competitive Advantage in Re-
lation with Intellectual Capital, Knowledge Management and Innovativeness in Women-Owned SMEs in Malaysia. Journal of International Business, Economics and Entrepreneurship, Volume 1.
Popović Pantić, S., (2014), An analysis of female entrepreneurship and innovation in Ser-bia in the context of eu competitiveness. ECONOMIC ANNALS, Volume LIX, No. 200.
Powell, G.N., Eddleston, K., A., (2012), Nurturing Entrepreneurs’ Work–Family Balance: A Gendered Perspective. Entrepreneurship Theory and Practice. Vol. 36.
Rakauskienė, O.G., Štreimikienė, D., Žalėnienė, I., Kiaušienė, I., Servetkienė, V.& Krinick-
ienė, E., (2014), Lyčių ekonomika, Vilnius: Baltijos kopija.Ramadani, M., (2015), The Woman Entrepreneur in Albania: An Exploratory Study on Motiva-
tion, Problems and Success Factors. Journal of Balkan and Near Eastern Studies, Vol. 17.Rani M.R., U., Menezes C., (2016), Hidden Drivers of Success Among Women Entrepre-
neurs. Adarsh Journal of Management Research, Vol. 9 (2).Roomi, M.A., Harrison, P., Beaumont-Kerridge, P., (2009), Women-owned small and medi-
um enterprises in England. Analysis of factors influencing the growth process. Journal of Small Business and Enterprise Development, Vol. 16 No. 2.
Stripeikis, O., (2008), Antrepreneriškumo formavimas Lietuvos smulkaus ir vidutinio verslo įmonėse, Vadybos mokslas ir studijos – kaimo verslų ir jų infrastruktūros plėtrai, Nr. 15 (4).
Stripeikis, O., Žukauskas, P., (2011), Veiksniai, lemiantys asmens apsisprendimą pradėti verslą, Organizacijų vadyba: sisteminiai tyrimai, Nr. 57.
Thébaud, S., (2015), Gender and Entrepreneurship as a Career Choice: Do Self-assessments of Ability Matter? Social Psychology Quarterly Vol. 73, No. 3.
Thébaud, S., (2015), Status Beliefs and the Spirit of Capitalism: Accounting for Gender Biases in Entrepreneurship and Innovation. Social Forces 94(1).
Tidikis, R., (2003), Socialinių mokslų tyrimų metodologija. Vilnius: Lietuvos teisės uni-versiteto leidybos centras.

69
2018 Communication. Relations. Management
Toledo-Lopez, A., Diaz-Pichardo, R., Jimenez-Castaneda, J.C., Sanchez-Medina, P.S., (2012), Defining success in subsistence businesses, Journal of Business Research, Vol. 65.
Verheul, I., Thurik, R., Hessels, J., van der Zwan, P., (2010), Factors Influencing the Entre-
preneurial Engagement of Opportunity and Necessity Entrepreneurs. EIM Research Reports, H201011, March 2010, 1-24.
Walker, E., Brown, A., (2004), What Success Factors are Important to Small Business Owners? International Small Business Journal, Vol 22(6).
Watson, J., Newby, R., (2005), Biological sex, stereotypical sex-roles, and SME owner char-acteristics. International Journal of Entrepreneurial Behavior & Research. Vol. 11.
Zapała, A., Zięba, K., (2014), Gendered Entrepreneurship and Its Impact on Firm Innova-
tiveness: A Literature Review. Research on Enterprise in Modern Economy – theory and practice No 4.
Zhouqiaoqin Ying, X.Y., Lu, Z., Kumah, S., (2013), Factors that influence the success of women entrepreneur in China: a survey of women entrepreneurs in Beijing. Journal Of Humanities And Social Science Volume 18, Issue 3.


71
2018 Communication. Relations. Management
Karolina KubiakUniversity of SzczecinFaculty of Economics and Management
CHAPTER 4
FITNESS MARKET – CURRENT SITUATION AND CUSTOMERS NEEDS
IntroductionA gym starts to be a part of life for more and more people. Fitness market
situation changes all the time, A force which has so big influence on that mar-ket is in customers` hands, and everything depends on their needs. This article explains how fitness market looks in Poland and what place it has on European market, which types of strategy are used and which one is currently the most profitable, possible types of clients and a short market research, based on which it is possible to build a model of current client of fitness clubs.
4.1. Fitness market in PolandA popularity of sport grows year by year, and more and more people start to
be ‘fit’ and lead active lifestyle. That trend of being active and eat healthily devel-oped a fitness market which currently has 2,600 fitness clubs on Polish market.1
By words “fitness club” it is necessary to understand a room which is dedicated to do sport, has sport equipment such as for endurance training (gym), circuit training (ergometer, bikes, etc.) and to build physical condition (treadmill). It is optional that club has machines, which include sensors to check heart rate during exercises. This type of place is open for everybody and gives possibility to visit as a regular member after monthly payment or it is possible to buy one-day entry.2
In Poland almost 3 million people are members of fitness clubs, what is an equivalent of 7.7% of the total Polish population, where a significant majority of
1 Deloitte, (2018), „European Health & Fitness Market Report, Warszawa.2 Ibidem.

72
Communication. Relations. Management 2018
clubs are independently owned.3 This keen demand is a result of low price for gym membership card and because membership fee is start to be cheaper in comparison with last years. Thanks to that phenomenon, one fitness club is able to accrue over 1,000 members, where profit from one member is about 100 PLN, with member fee it gives about 120 PLN. The number of fitness clubs and clients who are interested in membership is still increasing.
Table 4.1. Top 10 European fitness markets by revenue in million EUR and share of the European market (2017)
Country Revenue in million EURGermany 5,200 mln
The United Kingdom 5,084 mln
France 2,513 mln
Italy 2,245 mln
Spain 2,235 mln
Netherlands 1,346 mln
Poland 872 mln
Switzerland 866 mln
Sweden 853 mln
Russia 848 mln
23 others 4,532 mln
Source: EuropeActive, Deloitte, (2018), European Health & Fitness Market Report 2018, https://www2.deloitte.com/content/dam/Deloitte/pl/Documents/Reports/
pl_kluby_fitness_EuropeActive_Deloitte_EHFMR_2018_PL.PDF [08.05.2018]
Based on the Table 4.1. it is possible to see that Poland is on the seventh position in the first ten countries with revenue in million EUR and share on the European fitness market. The big influence for that situation has monthly reve-
nue from fitness clubs from all companies in Poland and that revenue is almost 4 million PLN (excluding VAT). It takes into account such data as total number of members and profit for person without membership fee which is paid for a fitness club. Even though it is 872 million EUR (that is 3,710 million PLN), it is just 3% of total revenue from European market. Leaders which consist togeth-
er 65% of the market revenue are Germany (20%), the United Kingdom (19%),
3 Deloitte, (2018), European Health & Fitness Market Report 2018, https://www2.deloitte.com/content/dam/Deloitte/pl/Documents/Reports/pl_kluby_fitness_EuropeActive_Deloitte_EHF-
MR_2018_PL.PDF [08.05.2018].

73
2018 Communication. Relations. Management
France (9%), Italy (8%) and Spain (8%).4 The gap between them and Poland is still huge, but Polish fitness market is still growing and year by year generate bigger and bigger revenue. It is just a matter of time for Poland to be more recognizable on the fitness market.
Figure 4.1. Leading regular operators by number of clubs for the end of 2017
Source: Deloitte, (2018), European Health & Fitness Market Report 2018, https://www2.deloitte.com/content/dam/Deloitte/pl/Documents/Reports/pl_kluby_
fitness_EuropeActive_Deloitte_EHFMR_2018_PL.PDF [08.05.2018]
4 Ibidem.

74
Communication. Relations. Management 2018
A figure 4.1. prepared by Deloitte shows the number of how many locations one exemplary fitness club has. A leader is Calypso Fitness Club, which is still developing, and at the end of 2017 it had 37 clubs, furthermore Calypso is still buying new places. On 9th of May of current year Calypso Fitness Club opened the 50th club in Wrocław, that was announced on its main Instagram account.5
In Warsaw it has the biggest number of locations, exactly 22 clubs.6 On the sec-
ond place is Jatomi Pure with 37 clubs, but this company closes club by club be-
cause of its inappropriate business model. It started to back-out of Polish market with a beginning of year 2018. And on the third position is Fabryka Formy with 20 clubs in Poland. The rest of clubs have less than 20 locations. Such companies like Calypso Fitness Club or Fabryka Formy are franchise partly or globally.
Based on research made by Deloitte it is important to mention that in 20157
the leader on Polish fitness market was Pure Jatomi, but with the end of 20178 it
collapsed. Trevor Brennan, who is a CEO of Jatomi Fitness Group, admitted that business model which was created nine years ago and which was used by this club in not useful and profitable in case of present-day clients. Currently a strate-
gy based on selling personal trainings is like a relict. Clients show that they prefer to go to the gym and do exercises, or just go because other people do this, which suggests that it is a new trend on the market.
4.2. Types of business modelsIn general, fitness clubs used from one to three selling strategies to keep
their clients in their club and meet their expectations. However, not all of that strategies are profitable and do accommodate to needs of current client.9 Fitness
market distinguish such strategies as: strategy based on selling gym membership cards, strategy based on selling personal trainings and strategy called “open club”.
The most famous and profitable is strategy based on selling gym membership cards, which are the main source of income. In this strategy a personal training
5 Instagram, (2018), calypsopolska, https://www.instagram.com/p/BijgwScANhK/?hl=pl [12.05.2018].6 Calypso, Calypso Fitness - największa polska sieć klubów fitness, https://www.calypso.com.pl/
[09.05.2018].7 Deloitte, (2016), Branża fitness nadal szlifuje formę “European Health & Fitness Market Report
2016”, Warszawa [12.05.2018].8 BusinessInsider Polska, (2018), To koniec Jatomi w Polsce. Wielka sieć siłowni zostanie zam-
knięta, https://businessinsider.com.pl/wiadomosci/zamkniecie-jatomi-fitness-w-polsce/s67rkt2 [12.05.2018].
9 Osterwalder A., (2010), Business Model Generation: A Handbook for Visionaries, Game Changers, and Challengers, Wiley, Canada.

75
2018 Communication. Relations. Management
is just a benefit. Usually, client has possibility to go for a consultation to personal trainer for free but only once a month. For the rest of personal trainings client needs to pay additionally. Sometimes, depends on clubs it is possible that they give a permission to do private trainings for external personal trainer, known also as freelancer. The most common conditions for this situation are facts that external personal trainers need to have their own clients and that they need to pay monthly something like a “rent”, because they are guests at gym. In addition, a very impor-tant condition of it is that external trainers cannot offer their help to members of given club, because it could be considered as an aggressive marketing. Such personal trainer can be banished from a club without possibility to come back. The fitness club which based on this business model is Calypso Fitness Club.
The second possible strategy, but nowadays not as good as in the past is sell-ing personal trainings. Fitness club concentrates on selling the biggest possible amount of personal trainings. Each of the personal trainers need to do monthly as many trainings as club requires from them. Unfortunately, it carries numerous disadvantages such as bad opinion about club. A reason of that bad image is a fact that personal trainers are representatives of club, but bigger number of trainings equals worse service, and worse service comes from a relatively shorter time for one client. Members of club with this strategy could feel neglected by personal trainers. The fitness club which represented that strategy was Pure Jatomi.
The last strategy which is used but rarely is “open club”. It means that if somebody wants to be a member of given club he or she just needs to pay for a membership card but also it means that club is open for external personal trainers because they do not have their own. In this strategy personal trainers do not pay club for their private personal trainings. As clients if they want to have an access to club they need to buy gym membership card or individual entry. A good example of that strategy was McFit, but they are starting to change the business model of their clubs, because current one is not as profitable as selling a gym membership card with possibility to buy personal trainings in club.
4.3. Types of clientsClients are a pulling power for fitness clubs. But who they are? They are custom-
ers who receive a service. They are also creators of a market, because everything revolves around their needs and expectations.10 The good example of club which
10 Peter J. Paul, Olson Jerry C., (2004), Consumer Behavior and Marketing Strategy, McGraw-Hill/Irwin, USA.

76
Communication. Relations. Management 2018
cares about clients needs is Calypso Fitness Club, and thanks to that they have the biggest number of locations in Poland. Calypso has a special survey of clients` needs which asks about an aim, if client wants a help from personal trainer, or if client wants to take part in group classes. Thanks to this clients feel esteemed, but this is just “porch” of the club, the most important are personal trainers because with them clients have the biggest contact. Calypso Fitness Club creates for its members a possibility to meet with personal trainer once a month for free. Thanks to this, clients have opportunity to check how personal training looks like and what could they have from those meetings. Personal trainers as representatives of the club are responsible for motivated clients to stay in the given club.
Fitness world distinguishes three main types of clients who personal trainers need to handle. It could be a visualizer, an audile or a kinesthetic leaner, who is divided by motivation into two types: external or internal. In addition, they make a distinction of two subtypes which are called “mister director” and “buddy”.11
Visualizers are very energetic, talkative persons with a big problem to focus on one thing. They talk really fast and use a lot of examples which are easy to realize, because anything what they say relate to vision. Personal trainers mostly need to ask short questions and listen with patience and to note the most im-
portant things from their monologue. After conversation it is necessary to make a summary with them to confirm everything what they said.
Audiles are persons who want to listen rather than talk. Normally they are quiet and excessive noise could irritate them. When they speak is it noticeable that they relate to hearing, for example that “they heard something”. They have really good memory that is why personal trainers need to be careful during conversations with that type of client and do not promise if they are not sure about an effect.
Kinesthetic leaners are the most quiet and calm persons in conversation. Extreme kinesthetic learners could seat and with mysterious face look at personal trainers, because they expect a support from them. Mostly they are thoughtful and talk about their feelings. This type is really complex and is divided by mo-
tivation into two types: external and internal. For external kinesthetic learner a motivation could derive from spouse and they do training for another person, but for internal everything derives from them, because they have “hunch” and they need to check it. It is necessary to warrant them that their or third-party beneficiary had absolutely right and good feeling about something.
11 Wojciechowski A., (2010), Spotkanie z klientem. Jak skutecznie rozmawiać z klientem, tak aby spotkanie zakończyło się sukcesem sprzedażowym?, Złote Myśli, Polska.

77
2018 Communication. Relations. Management
Foregoing types of clients are divided into two subtypes, which are really easy to recognize. “Mister director” is a person with a big distance to talking and does not want to fraternize with personal trainer. It could be possible but after some time, when atmosphere will be enough good for him and he will be feel freewheelingly, it is highly possible that he becomes a “buddy”. Mostly this subtype is represented by audiles and kinesthetic leaners. The second subtype is “buddy”, and this subtype is a friendly and outgoing person. It is easy to make a contact with this type of client, and he treats trainings as a part of his social life. Obviously this subtype is represented by visualizers. Moreover, it is highly impossible that this type of person will become a “mister director”.12
4.4. Market research based on the Internet surveyThe survey is being conducted in form of the Internet poll, which was com-
pleted by random people in age above 17 years old, who are users of Facebook. Users had one week to complete the poll. objective of this research is to assess which type of service is more interesting for current clients. Specifically, ques-
tions are concerned with how much money they would like to spend for gym membership card and personal trainings, separately and for both. The survey also seeks to explore if personal trainings are important for them, if they are interested in this type of service, or even use it and how much additional money they are able to spend for one individual personal training. In the end, to online survey responded 150 Internet users.
Table 4.1., Table 4.2. and Table 4.3. which are below show data on which is possible to build a simple model of a current client who leads an active life. As a summary of those three tables it is easy to notice that current client of fitness club is more often woman than a man. Respondents are between 22-25 years old, who live in a city with number of inhabitants bigger than 350,000 people. It is not a big surprise, because it is easier to find clients in bigger cities than in villages. In addition, it is easier to keep woman as client in club than man. Mostly, woman, more often than man, care about their appearance and want to look good like celebrities or eat and be healthy. In addition, personal trainers know how to find a connection between them and that model of client, because it is easier to appeal to woman vanity.
12 Wywialowski Elizabeth F., (2004), Managing Client Care, Mosby, USA.

78
Communication. Relations. Management 2018
Table 4.1. Split of clients according to their gender
Gender % of intervieweeMan 16%
Woman 84%Source: own compilation, based on an online survey.
Table 4.2. Split of clients according to their age
Age % of interviewee18-21 32%22-25 44%26-29 14%30-33 3.3%34-37 4%38-41 0.7%>42 2%
Source: own compilation, based on an online survey.
Table 4.3. Split of clients according to population size
Age % of intervieweeBelow 50,000 28%
50,000 – 150,000 13.3%150,000 – 250,000 7.3%250,000 – 350,000 5.3%
Over 350,000 46%Source: own compilation, based on an online survey.
As was stated before, currently, the most profitable form of business model for fitness clubs is the one which is based on selling the biggest amount of gym membership cards during a month. Table 4.4. shows that more than 80% of respondents agreed with that, because they are this type of client for which the most preferred form of service is above-mentioned selling strategy. Only 14% of respondents favoured personal trainings as better service, which is selling in fitness clubs. Possible reasons of that difference will be explained in few moments based on more detailed question for that research. Moreover, this difference could explain why Pure Jatomi worked with financial loss during last few years.

79
2018 Communication. Relations. Management
Table 4.4. The most preferred form of service in fitness club
Service % of intervieweePersonal training 14%
Gym membership card 86%Source: own compilation, based on an online survey.
A barrier which mostly makes a problem for clients is a price of gym mem-
bership card, but with time the amount of money which they need to spend for membership decreased. For example, in 2014 the average cost for month membership was around 29.4 EUR,13 but in 2017 it was just 27.9 EUR,14 that is
almost 2 EUR less. What is more interesting, keeping in mind this little drop in prices with just noticeable difference it is possible to observe growth of clients from 2.73 million of people in 201415 to 2.91 million of people in 2017.16
In table 4.5. is presented data collected from the survey which shows that typical client is able to spend from 50 to 100 PLN/monthly for gym membership card. Unfortunately, only 16.7% of customers feel that they are able to spend the average price, and 7.3% of respondents are ready to spend even more.
Table 4.5. Amount of money which client affords to pay for gym membership card (monthly)
Amount of money % of interviewee<50 PLN 14%
50 – 100 PLN 62%100 – 150 PLN 16.7%
>150 PLN 7.3%Source: own compilation, based on an online survey.
13 Deloitte, (2016), Branża fitness nadal szlifuje formę “European Health & Fitness Market Report 2016”, Warszawa [12.05.2018].
14 Deloitte, (2018), European Health & Fitness Market Report 2018, https://www2.deloitte.com/content/dam/Deloitte/pl/Documents/Reports/pl_kluby_fitness_EuropeActive_Deloitte_EHF-
MR_2018_PL.PDF [08.05.2018].15 Deloitte, (2016), Branża fitness nadal szlifuje formę “European Health & Fitness Market Report
2016”, Warszawa [12.05.2018].16 Deloitte, (2018), European Health & Fitness Market Report 2018, https://www2.deloitte.com/
content/dam/Deloitte/pl/Documents/Reports/pl_kluby_fitness_EuropeActive_Deloitte_EHF-
MR_2018_PL.PDF [08.05.2018].

80
Communication. Relations. Management 2018
The second service without which fitness club will not exist is personal train-
ings. Respondents were asked how much money they are able to spend for one training. Table 4.6. shows that almost 30% of interviewee answered that the biggest amount which they afford to pay is equal 50 PLN. A little bit less, 26.6% of interviewee responded that price below 50 PLN is in their opinion also afforda-
ble for them. Unfortunately, less than 10% of people mention that they do not want to pay for this service, because in their opinion it should be included in gym membership card or it is just wasting money on this type of service. Significant minority, just 1/3 of respondents are able to pay more than 50 PLN. The most regular price mentioned by those respondents was 100 PLN for one personal training. That big difference could be caused by not good wages, low awareness about job which personal trainers do, or even that significant majority of personal trainers have not enough competences.
Table 4.6. Amount of money which clients affords to pay for one personal training
Price which was propose by interviewee
% of interviewee
0 PLN 9.3%1 – 49 PLN 26.6%
50 PLN 28.7%51 – 99 PLN 8.7%
100 PLN 14.7%>100 PLN 12%Source: own compilation, based on an online survey.
In the survey respondents were asked about amount of money which they spent for gym membership card monthly. As table 4.7. shows, most of them, 59.3% of interviewees, buy their cards for more or less the average price. As was stated in table 4.5., prices between 50-150 PLN for membership are affordable to pay by clients. But 20.6% of clients pay less than 50 PLN. It could be possible thanks to special membership cards offers by employers or to buy individually but with some conditions, it could be for example MultiSport, FitSport, MyLife and so on.17
17 Forbes, (2018), Fitness daje benefity. Nie tylko zdrowotne, https://www.forbes.pl/biznes/rynek-fitness-w-polsce-i-sukces-benefit-systems/tqb1kq9

81
2018 Communication. Relations. Management
Table 4.7. Amount of money which clients really spend for gym membership card excluding personal training (monthly)
Price of gym membership card % of interviewees<50 PLN 20.6%
50 – 150 PLN 59.3%150 – 250 PLN 8%250 – 350 PLN 1.3%
>350 PLN 2%Do not buy 8.8%Source: own compilation, based on an online survey.
Table 4.8. shows how many people are interested in help from personal trainer. Significant majority, exactly 66.7%, of clients is interested, and they have confidence that it could help them achieve results which they want in shorter time than they would do it by training alone. Unfortunately, 31.3% of respondents are not interested about that help, because they consider that this is a waste of time, waste of money. Some clients are not interested because of high price of that service. Others have that service on their own. Something what also was mentioned by respondents that personal trainers could have not enough competence to do personal trainings.
Table 4.8. Level of attention about help from personal trainer
Possible answer for interviewees (in short) % of interviewees
Yes 66.7%No 31.3%
No opinion 2%Source: own compilation, based on an online survey.
In contrast with table 4.8., table 4.9. shows that personal trainings are not as desirable service as gym membership card. Just 6.6% of respondents answered that they buy gym membership card with personal trainings, and the same num-
ber of respondents stated that they buy only personal trainings. The most inter-esting service is gym membership card. This difference could come from differ-ential pricing thanks to Benefit Systems, which offers significantly lower price for membership cards than fitness clubs. Unfortunately, personal trainings are not included in the offer of Benefit Systems, what could generate the next reason why personal trainings are not as desirable as gym membership card.

82
Communication. Relations. Management 2018
Table 4.9. Actual level of attention about services in fitness clubs
Kind of service % of intervieweesGym membership card + personal trainings 6.6%
Gym membership card 86.8%Personal trainings 6.6%
Source: own compilation, based on an online survey.
ConclusionsBased on the online survey the model of current client is so obvious. Woman
more often than man are clients of fitness clubs, but this information is just a con-
clusion from the survey, because 86% of respondents were women. The influence of those results could have facts that men prefer to go to crossfit clubs or that women more often than men use social media. Next one is the age range which is between 22-25 years old, and a size of city in which most of respondents live amount to over 350,000 of people. Moreover, the significant majority chose a gym membership card as a more desirable service in fitness clubs for which they want to spend from 50 to 100 PLN, and in reality they spend from 50 PLN to 150 PLN what is not as big difference from their expectations.
In addition, clients are interested in help from personal trainer but mostly they do not want pay more than 50 PLN for one training. The price is one of few reasons why people do not use that form of service often. Another rea-
son could be a fact that a job of personal trainer is not regularize and because of that significant majority of trainers have inappropriate competence. This is not obvious information, but training officers from a few schools which conduct personal trainer course, confirmed that fact. In addition, respondents mention this problem as a reason why they do not want to use personal trainer service. The competence of personal trainers should be checked in the future on some grounds, especially their knowledge about job which they do.
Based on statistical data, it is possible to assume that clients of fitness clubs create selling strategies in fitness clubs and their politics. If clubs want to be visible on the market they need to care about their image, think about clients` needs and try to meet with their expectations. The success of fitness clubs is not just an idea of how to sell their services, but also awareness what types of clients they could expect and an ability to encourage them to stay in a given club. Fitness clubs should be first not on a market but in clients` minds. What could be helpful to achieve this target is appropriate competence of personal trainers, convenient

83
2018 Communication. Relations. Management
conditions, even for disabled, and understanding of clients could be like a gold-
en mean. Thanks to those actions and trend of being fit, fitness market will still develop. The result of that phenomenon could be lower price in the future that brings more attention of clients and with time can result in bigger revenue and better position on the European fitness market. Nevertheless, it should be mon-
itored and researched in foreseeable future because Poland has potential to be more recognizable on the fitness market.
References:BusinessInsider Polska, (2018), To koniec Jatomi w Polsce. Wielka sieć siłowni zostanie
zamknięta, https://businessinsider.com.pl/wiadomosci/zamkniecie-jatomi-fitness-w-polsce/s67rkt2 [12.05.2018].
Calypso, Calypso Fitness - największa polska sieć klubów fitness, https://www.calypso.com.pl/ [09.05.2018].
Deloitte, (2016), Branża fitness nadal szlifuje formę “European Health & Fitness Market Report 2016”, Warszawa [12.05.2018].
Deloitte, (2018), „European Health & Fitness Market Report, Warszawa.Deloitte, (2018), European Health & Fitness Market Report 2018, https://www2.deloitte.
com/content/dam/Deloitte/pl/Documents/Reports/pl_kluby_fitness_EuropeActive_Deloitte_EHFMR_2018_PL.PDF [08.05.2018].
Forbes, (2018), Fitness daje benefity. Nie tylko zdrowotne, https://www.forbes.pl/biznes/rynek-fitness-w-polsce-i-sukces-benefit-systems/tqb1kq9
Instagram, (2018), calypsopolska, https://www.instagram.com/p/BijgwScANhK/?hl=pl [12.05.2018].
Osterwalder A., (2010), Business Model Generation: A Handbook for Visionaries, Game Changers, and Challengers, Wiley, Canada.
Peter J. Paul, Olson Jerry C., (2004), Consumer Behavior and Marketing Strategy, McGraw-Hill/Irwin, USA.
Wojciechowski A., (2010), Spotkanie z klientem. Jak skutecznie rozmawiać z klientem, tak aby spotkanie zakończyło się sukcesem sprzedażowym?, Złote Myśli, Polska.
Wywialowski Elizabeth F., (2004), Managing Client Care, Mosby, USA.


85
2018 Communication. Relations. Management
K.K. Tharindu Udayanga Department of Economics University of Kelaniya Sri Lanka
Chapter 5
A STUDY ON THE ISSUES IN SOLID WASTE
MANAGEMENT. SPECIAL REFERENCE TO
SELECTED SUB-URBAN AREAS IN SRI LANKA
5.1. IntroductionIn developing countries, the high density of population, industrialization,
urbanization and economic growth contribute significantly to increasing solid waste generation. Sri Lanka, as the highest per capita waste generated country in South Asia faces serious difficulties, particularly in waste recycling. Strengths and capa-
bilities of local authorities are inadequate to make a sustainable process for solid waste management. 100 households and 30 private waste recycling companies have been selected as the sample and this research examined the competency of promoting private sector participation as an alternative supporting service for local authorities. And, this research attempted to identify the impact of households’ waste management related practices on current waste issue in the country. Basi-cally, three indicators were designed and finally it was found that there is 85% high competency for promoting private sector participation according to social aspect while there is 100% competency according to institutional aspect.
The term solid waste means, material such as household garbage, food wastes, yard wastes and demolition or construction debris. It also includes dis-
carded items like household appliances, furniture, scrap metal, machinery, car parts and abandoned or junk vehicles (htt). In a solid waste management process, it is expected to manage waste in an environmentally friendly manner. Solid waste management is a service which is provided by the local governments in many south Asian countries. Basically, solid waste management can be defined as a public good and it provides public cleanliness and the safe disposal of waste
86
Communication. Relations. Management 2018
that are essential to public health and environmental protection (Dhokhikah & Tr-ihadiningrum, 2012). Promoting private sector participation means, reduction of government activity within a given service or industry (Cointreau-Levine, 1994). Yet, this research paper focuses on promoting private sector participation in solid waste management in sub-urban areas of Sri Lanka as a supporting service for local authorities. It does not necessarily address the reduction of government ownership for waste management.
With the rapid increment of population, industrialization, urbanization and economic growth in developing countries, solid waste (SW) generation has been increased. As an example, in India solid waste generation was between 0.2kg/capita/day and 0.5kg/capita/day with 217 million people (K. Ahmad, 2008). When considering most of solid waste composition of developing coun-
tries we can see biodegradable organics. For examples, it was 65% in Jakarta and 72.41% in Surabaya. Whereas, in the Asian developed countries, such as in Japan, Singapore, Taiwan, and South Korea, these values were generally less than 45% (Dhokhikah & Trihadiningrum, 2012). World Bank classified countries in the world based on Gross National Income (GNI) per capita. The classification of countries was high income country (GNI of $12,276 or more); upper mid-
dle income (GNI of $3,976 – $12,275); lower middle income (GNI of $1,006 – $3,975); low income (GNI of $1,005 or less). Some Asian developing countries like, Sri Lanka, India, Bangladesh, Pakistan, Afghanistan, Thailand, Malaysia, Nepal are commonly in the range of low income to lower middle income coun-
tries. According to the JICA (Japan International Cooperation Agency) report “Solid waste management guideline for local governments”, municipal solid waste generation of developing countries is 0.3 – 1.0 kg/person per day while it is 1.0 – 2.5 kg/ person per day in developed countries. When considering the developing countries in Asia, the solid waste generation was high, because of the population and the main component of solid waste is decomposable or-
ganic. For examples, the decomposable organic was 61.5% in Malaysia (Manaf, Samah, & Zukki), and in Indonesia of 68.12% to 72.41% (Kardono, 2007).
Sri Lanka, as a lower middle-income country in South Asian region is facing serious difficulties regarding solid waste. “Meethotamulla1” incident is the latest disaster that Sri Lankans have faced due to the lack of effective waste management practices. (htt1) The general methodology of Sri Lankan solid waste management is collecting waste from households and other public places by local government and put them out to their selected places. “Blumendal” and “Meethotamulla” waste
1 A waste compound in Colombo Municipal Area.

87
2018 Communication. Relations. Management
yards can be defined as examples. According to the reports of Central Environ-
mental Authority (CEA), “Dompe” waste yard is the sole scientific waste manage-
ment compound in the country. There is a 20 million population in the country, yet unfortunately there is only one scientific waste management compound. Sri Lanka has been facing many problems due to the lack of effective waste management practices and it is a huge challenge when making sustainable cities and towns, with sustainable development goals.
This research aimed main two objectives. Those intentions can be described as follows;
1. Observe the competency of promoting private sector participation as a solution for inefficient waste management.
There is no argument about the statement that waste is economically beneficial material. So that private sector may earn high profits by in-
vesting money on this sector. Yet, before promoting private sector on waste management, it is needed that finding the public view about that and the quality of the contribution that private sector has already given.
2. Identify best practices for the household solid waste management in sub-urban areas of Sri Lanka.
When considering the household waste management practices, some of them divide waste to organic, none organic, liquid, plastic, polythene etc. Yet some are not. Waste management practices of the household affect to the national waste management process.
5.2. MethodologyIn this research, Kelaniya Pradeshiya Sabha Area was considered as the popula-
tion frame. Kelaniya Pradeshiya Sabha area is a major sub-urban area in Sri Lanka and it is a highly urbanized and industrialized region near to Colombo Municipal Area. 100 households were selected from the population using simple random sampling method. Apart from that 30 companies were selected using simple ran-
dom sampling method from the42 major formal and registered private companies of the country that contribute to solid waste management and recycling.
In data collection, both primary data and secondary data were considered. When collecting primary data, questionnaire method was used and it was given to 100 households in the sample. Telephone conversation method was used to collect data from 30 private companies which contribute to solid waste management.

88
Communication. Relations. Management 2018
An indicator was introduced to find the quality of the household waste management practices in the semi urban areas of Sri Lanka. That indicator was designed considering three major components. They were;
• Household waste classification• Usage of compost holdings in households• None organic waste divesting method of households
According to the responses of the respondents in the sample regarding the above components, values were added as follows;
• Household waste classificationIf yes – value 5 was addedIf No – value 0 was added
• Usage of compost holdings in householdsIf yes – value 5 was addedIf No – value 0 was added
• None organic waste divesting method of householdsIf it is given to local governments or private companies – value 5 was addedIf it is burned or divested to land – value 0 was added
If the quality of the household waste management practices is in the high quality, it would be compulsory that classifying waste in households, using compost holdings in households, giving none organic waste to local governments or private companies to recycle. According to that if the total value of indicator is;
0 – Lowest quality Between 0–4 – Lower quality Between 5–14 – High quality 15 – Highest quality
When analysing the competency of promoting private sector participation to solid waste management in semi urban areas of Sri Lanka, major two aspects were used.
1. Social Aspect2. Institutional Aspect
When analysing the competency according to social aspect, indicator was designed. Two components were used for that.
1. Public judgement about promoting private sector participation2. Public satisfaction about the service provided by local government

89
2018 Communication. Relations. Management
According to the public judgement that was given to the questions related to above components, value was added.
If it is highly competent – value 10 was addedIf it is medium competent – value 5 was addedIf it is not competent – value 0 was added
According to the public satisfaction about the service provided by local gov-
ernment, value was added.If they are highly unsatisfied – value 15 was addedIf they are unsatisfied – value 10 was addedIf they are satisfied or highly satisfied – value 5 was addedIf they are highly satisfied – value 0 was added
According to the total value of the indicator, the competency of promoting private sector participation in social aspect was analysed. Therefore, If the total value;
25 – Highest competency 15–24 – High competency 1–14 – Low competency 0 – Lowest competency
When analysing the competency in institutional aspect, an indicator was de-
signed. Main two components were used to do that. They are as follows;1. Excess capacity that the private solid waste recycling companies have2. Satisfaction of those companies about their profit by investing for solid
waste recycling.
According to the answers that private companies gave in the telephone con-
versation, value was added.If they have excess capacity – value 5 was addedIf they have not – value 0 was added
According to the answers about the satisfaction of companies about their profit, value was added.
If they are satisfied – value 5 was addedIf they are not – value 0 was added

90
Communication. Relations. Management 2018
According to the total value of the indicator, competency of promoting pri-vate sector participation in institutional aspect for solid waste management in semi urban areas of Sri Lanka was analysed.
0 – Lowest competency 1–4 – Low Competency 5–9 – High Competency 10 – Highest competency
5.3. Literature ReviewThe research on ‘Solid Waste Management in Asian Developing Countries;
Challenges and Opportunities (Dhokhikah & Trihadiningrum, 2012) reviews the existing management of solid waste and the current problem of collection, trans-
portation and disposal process in Asian Developing Countries. As common prob-
lems in solid waste management no segregation at source, complicated collection process, open dumped landfill and no control of gas emissions and leachate in landfill have been identified. It was found that solid waste management was country specific and decentralization is the most appropriate management ap-
proach. This research examined the informal sectors participation as an alterna-
tive solution, yet has not addressed the competency of taking that.‘Sustainability assessment of municipal solid waste management in Sri Lanka,
problems and prospects (2011) by S.N.M.Menikpura has addressed the necessity of sustainable municipal solid waste management plans. The results obtained quantify the sustainability benefits of the proposed option for solid waste man-
agement and can be useful for justifying policy measures that encourage the replacement of open dumping with sanitary landfills. Yet this paper has not ad-
dressed the alternative method that can be used in solid waste management mainly in the waste recycling concept.
‘Solid Waste Management In Least Developed Asian Countries; A Compara-
tive Analysis by Ulrich Galwe and C.Viswanathan (2005) highlights the present status of municipal solid waste management in these LDACs including legal, social, and financial issues. It is also envisaged to expose on the solid waste generation rate, its composition, collection systems and areas of responsibil-ities (Public/Private Sector), transfer and treatment sites and waste disposal systems used. Furthermore, the necessity of the involvement of NGOs, CBOs, and private sector for the better understanding and the sustainability of the related projects is illustrated. Yet, it does not address the solid waste manage-
ment practices of households.

91
2018 Communication. Relations. Management
The report ‘Private Sector Participation in Municipal Solid Waste Services in Developing Countries’ by the Urban Management and the environment pro-
gramme of the World Bank has discussed the contextual issues of private sector participation in municipal solid waste services and private sector participation methods. But this paper discussed only about the reduction of government activi-ties through increasing private participation. It has not addressed about promoting private sector participation as a supporting service. (Cointreau-Levine, 1994)
5.4. Solid Waste GenerationWaste generation is often expressed in terms of a waste generation rate,
this being the quantity of waste produced per person per day. The waste gener-ation rate is very useful for planning and comparison purposes. Basically, it has revealed that household waste generation increases with income (JICA, 2003). When considering solid waste generation, most of solid waste comes from resi-dential areas, commerce and other sources. Yeny Dhokhikah has presented data of solid waste generation and composition in cities of Asian Developing Coun-
tries. (Dhokhikah & Trihadiningrum, 2012)
Table 5.1. SW generation in cities of Asian Developing Countries.
City (Country) Waste GenerationTons/Day
Surabaya(Indonesia) 2160
Jakarta
(Indonesia) 6000
Allahabad(India) 500
Puducherry
(India) 370
Kathmandu
(Nepal) 523.8
Bangkok(Thailand) 8778
K.Lumpur(Malaysia) 3798.9
Dhaka
(Bangladesh) 5340
Source: (Dhokhikah & Trihadiningrum, 2012).

92
Communication. Relations. Management 2018
Solid waste generation rate in cities of developing countries is complex. In some cities of India, the SW generation rate in Delhi was about 7000 tonnes/day in 2007 and approximately 17000-25000 tons/day by the year 2011 and Kolkata generated that SW of about 2920 tons/day (Dhokhikah & Trihadiningrum, 2012). Taking ac-
curate information on waste generation is needed, since it is necessary to monitor existing management systems and to make regulatory, financial and institutional decisions. Solid waste generation is based on the economic development, density of population, size of the urban habitation and consumption rate of commercial goods (Galwe, Visvanathan, & Alamgir, 2005).
Table 5.2. Municipal Solid Waste Generation (Per Capita) in South Asia
CountryMSW Generation Per Capita
(Kg/Capita/day)Afghanistan Not Calculated
Nepal 0.12
India 0.34
Bangladesh 0.43
Pakistan 0.84
Bhutan 1.46
Maldives 2.48
Sri Lanka 5.10
Source: A Global Review of Solid Waste Management, ‘ WHAT A WASTE’, The World Bank, March 2012.
Through above graph, it is easy to gain a clear comparison about the munic-
ipal solid waste generation in South Asian countries. Sri Lanka has marked the highest rate among other countries. So that waste is a major issue that must be solved when making sustainable cities and towns in Sri Lanka. When considering Sri Lankan solid waste generation of main Urban and Semi Urban areas, in the year 2015, it is 6,435.3 tons per day (Governments, 2015). Solid waste generation of main 25 districts in the year 2015, can be listed as follows.

93
2018 Communication. Relations. Management
Table 5.3. Waste generation of Sri Lanka
No. DistrictWaste Generation
(Tons per day)1 Colombo 1759
2 Gampaha 451
3 Kalutara 185
4 Kandy 368
5 Matale 205
6 Nuwara Eliya 62
7 Anuradhapura 145.58 Polonnaruwa 37
9 Jaffna 175.310 Vavuniya 30.511 Mannar 51
12 Kilinochchi 9
13 Mulathivu 9
14 Kegalle 366
15 Rathnapura 501
16 Trincomalee 328
17 Baticaloa 453
18 Ampara 550
19 Badulla 105
20 Monaragala 56
21 Kurunegala 155
22 Puttalam 75
23 Kegalle 183
24 Matara 122
25 Hambanthota 54
Total 6435.3Source: Ministry of Provincial Councils and Local Government, Sri Lanka.

94
Communication. Relations. Management 2018
5.5. Solid Waste ManagementIn many countries, local governments are responsible for solid waste management
service. The main objective of solid waste management is managing waste in an en-
vironmentally friendly manner to prevent from social, economic and environmental problems. There are several steps in the effective waste management like, collecting waste, recycling waste, promoting waste related productions and finally divesting exceeding waste in a manner with minimum effects. The solid waste management service is nonexclusive, meaning that once it is provided to some portion of a commu-
nity it benefits the overall public welfare, not only the resident that specially receives service. The service is also nonrival, meaning that any resident can enjoy the benefit of the service without diminishing the benefit to anyone else. Beyond this, it is not feasible to exclude from service those who do not pay, because public cleanliness and the safe disposal of waste are essential to public health and environmental protec-
tion (Cointreau-Levine, 1994). Common problems of solid waste management include institutional deficiencies, inadequate legislation and resource constraints. Long and short-term plans are inadequate due to capital and human resource limitations. There is a need for financing equipment for solid waste management, training specialists and capacity building. The government have formulated policies for environmental protection, but they were only implemented in the national capital cities. In rural areas and Semi Urban areas, open dumping is still considered the most popular method of solid waste disposal. It has given many bad effects when making sustainable cities and towns (Galwe, Visvanathan, & Alamgir, 2005). In solid waste management, it is important to practice integrated solid waste management approach such as: Incorpo-
ration of more environmental and economic friendly concepts of source separation; recovery of waste; legitimization of the informal systems; partial privatization and public participation (Galwe, Visvanathan, & Alamgir, 2005).
Components of Intergrated Solid Waste Managemnt (Galwe, Visvanathan, & Alamgir, 2005)
• Waste Generation• Waste Collection.• Waste Transport.• Waste Separation• Waste treatment and Disposal.• Waste Reduction, Reuse and Recycle.• Waste Composition and Characteristics.• Public and Community.• Legal, Economic, Financial and Health Aspects.

95
2018 Communication. Relations. Management
As most developing countries, local authorities in Sri Lanka have failed to deliver the required levels of waste management services. At present, only part of the waste stream is collected by local authorities, due to shortage of efficient vehicles and skilled labour. The remaining fraction is being illegally dumped on road sides, forest areas, river banks and low-lying marshes near to semi urban areas, thereby significantly reducing the aesthetic value of the environment. For the collection process of semi urban areas, house to house solid waste collection is being performed by most of the municipal councils and local governments. Even though some local authorities have shown interest in using small scale composting and biogas production technologies, these treatment options have not been very successful. At present, uncontrolled open dumping is the main disposal method in Sri Lanka, leading to many health problems and environmental issues (Menikpura, 2011). According to the research, “Sustaina-
bility assessment of municipal solid waste management in Sri Lanka; problems and prospects”, local communities as well as decision makers in Sri Lanka, are not well aware of the magnitude and severity of the direct and indirect impacts of open dump-
ing with regards to environmental degradation, economic losses and social burdens. The following problems are seen widely in Sri Lanka.
• Widespread scattering of waste in the towns.• Terrible conditions of landfill sites.• Huge SWM expenditure, approximately 20% to 30% of local authority’s (LA’s)
total budget.• Difficulty in controlling the many waste collection workers, which account
for approximately 30% of all LA employees.• Very high absentee and turnover rate, ranging from 10% to 20%.• Little remaining capacity of existing landfill sites.• Many complaints from citizens.• Lack of public cooperation.
Most of these are not technical issues but institutional ones. Technology alone cannot solve these problems. In other words, much improvement can be made through institutional and managerial capacity building, without spending much money. There are number of causes of these problems and they are as follows.
• Insufficient understanding of the importance of solid waste management works and the low status of the section in charge of solid waste manage-
ment works in Las.• Weak organization due to lack of cost control function, planning function,
public affairs function, • Insufficient utilization of existing materials and equipment.

96
Communication. Relations. Management 2018
• Lack of waste discharge rules.• Lack of future plans.• Lack of utilization of external resources. Most of local governments deal with
most of issues with their own resources such as staff and equipment, with-
out considering the utilization of external resources such as the involvement of citizens. Therefore, they tend to solve problems by increasing the number of employees and or making requests to donor agencies for equipment.
• Insufficient knowledge of solid waste management workers.• Insufficient knowledge of management.• Political Intervention.• Technology oriented approach with lack of considering to important social
and economic aspects.• Lack of Financial sources.
Concerning the solid waste problems in Sri Lanka, the institutional causes are much more important than the technical causes. Therefore, the solid waste man-
agement problems cannot be dealt with by technical improvements alone; insti-
tutional improvements must be executed as well. In other words, the governance quality of LAs is well reflected in the efficiency of solid waste management.
5.6. Promoting Private Sector ParticipationIn this research paper, it is discussed only promoting private sector partici-
pation as a supporting service. It does not address the reduction of government ownership. There are two aims that are based on entirely different perspectives of both local governments and private sector. For the private sector the funda-
mental concern is whether the delivery of service will make money. For govern-
ment one of many considerations is whether it will save money through private sector participation. Moreover, government must consider known public values and address macroeconomics issues. Private sector participation is a possible opportunity. In situations in which existing service delivery is either too costly, private sector participation should be examined as a means of enhancing effi-
ciency and mobilizing private investment. There are some contexts for deciding whether to have private sector participation (Cointreau-Levine, 1994).
• Cost recovery context• Efficiency context• Public accountability context• Management context

97
2018 Communication. Relations. Management
• Finance context• Economies of scale context• Institutions context
Table 5.4. Solid Waste Management-2017
DistrictSolid Waste
Collection per month (M. Tons)
Percentage of Waste Recycling
per month
Amount of unrecycled solid waste (M. Tons)
Per Month
Colombo 41,040 7% 38,320
Gampaha 10,260 10% 9,222
Kaluthara 3,900 23% 3,011
Kandy 6,510 3% 6,320
Matale 1,830 2% 1,787
Nuwaraeliya 1,380 2% 1,351
Anuradhapura 2,317 11% 2,054
Polonnaruwa 735 18% 603
Jaffna 3,600 3% 3,489
Vawniya 690 1% 681
Mannar 1,140 1% 1,126
Kilinochchi 90 1% 89
Mulathivu 210 1% 208
Kegalle 1,860 20% 1,481
Rathnapura 3,600 11% 3,214
Trincomalee 2,490 1% 2,465
Batticoala 3,690 1% 3,650
Ampara 4,320 1% 4,267
Badulla 2,400 9% 2,181
Monaragala 840 7% 782
Kurunegala 3,180 4% 3,048
Puththalam 1,380 4% 1,326
Galle 4,020 7% 3,737
Mathara 3,120 10% 2,794
Habanthota 900 30% 631
Total 105,502 7% 97,835
Source: Ministry of Provincial Councils and Local Government – 2017.

98
Communication. Relations. Management 2018
SL government sector faces lot of inconveniences due to the lack of technol-ogy and economic strength in solid waste management. Local governments have failed specially in the waste recycling part.
According to the above graph, it is clear that local governments are unable to recycled whole solid waste amount that they collect. When the total solid waste amount that they collect is 105,502 Tons per month, they recycled only 7% of waste amount from that. 93% of solid waste amount (97835 tons) is divested to environment without any recycling process. On the other hand, open dumping is still used as the most popular method. This is a huge environmental, social and economic problem. It affects very badly to the sustainability of Sri Lankan cities and towns. As a result of that, there is a huge necessity of providing a supporting service for local authorities to enhance the effectiveness and efficiency of solid waste management process. Therefore, in this research author intended to find the competency of promoting private sector participation as a supporting service for local authorities.
5.7. Household PracticesWaste segregation at household level is the 1st step of solid waste manage-
ment. There are major steps according to the household waste related practices;1. Waste segregation.2. Usage of compost bins.3. None organic waste divesting method.
Household waste related practices play a vital role when deciding the nation-
al level waste management process. So that, in this research author attempted to identify whether there is an impact of household waste related practices on current waste issue in Sri Lanka, by searching the quality level of household solid waste management.
5.8. Results and Discussion
5.8.1. Basic Information
In this research, it was able to comprehend the percentage of male and fe-
male of the population. According to the results of the research, 54.84% are female while 45.16% are male. When considering the age levels of population, 9.67% are in 0-18 age level and 32.25% are in 18-30 age level. There are 46.77% people in the 30-60 age level and the percentage of the 60< age level is 11.29%.

99
2018 Communication. Relations. Management
Therefore, considerable percentage of population is in 30< age level. In this re-
search it was considered about the educational level of the population also. In this part, it was search about how many years have they studied. 45.16% of the population is in the range of 0-11. There are 25.8% of population in the 11-13 range. The range over 13(13<) is 29.03% of the population. According to that it is clear that there is a considerable population who have obtained higher studies. When considering the employment, 32.25% of population are employed while 29.03% are schooling or attending to higher studies.
5.8.2. Solid Waste Segregation of Households
According to the results of the research, 80% of household in the sample, classi-fy the solid waste and 20% are not. However, it is a positive circumstance. The most popular method of solid waste segregation is classifying solid waste in to organic or nonorganic solid waste. 75% of sample classify solid waste by using that method. 25% of sample classify waste in to Plastic, Polythene and organic waste. When considering the method of divesting nonorganic waste, 95% of sample give their waste to local government SW service and 5% of sample burn or divest those solid waste to land. In this research, it was considered about the compost system usage of the semi urban areas of Sri Lanka as well. According to that, 62.3% households use mini compost system in their houses. They use that organic fertiliser to their agricultural needs. This compost amount is enough for 60% of them.
5.8.3. Collecting Solid Waste
Kelaniya Pradeshiya Sabha is responsible for solid waste collection in this population. When enquiring about the days of collecting solid waste from house-
holds by local government, it was revealed that local government collect solid waste from 15% of households once per two days. Solid waste from 65% of households is collected once per week and 20% for once per two weeks. In this analysis, it was concerned about the public satisfaction about the service that local government provides. 55% of population are not satisfied and 30% of pop-
ulation satisfy in medium level. Yet, 15% of them are highly satisfied.
5.8.4. Private Sector Participation
There are 42 registered solid waste recycling companies are operating in Sri Lanka. Yet, only 30% of the population is known about that companies. 70% of sample are not aware about it. In this section, it was expected to find the

100
Communication. Relations. Management 2018
public judgement about promoting private sector participation for solid waste management in semi urban areas of Sri Lanka. 75% of the sample identified it as a sustainable solution to overcome the waste problem and their judgement was that it is a highly successful solution. 25% of sample believed that it is a medium level succeed able solution. In this research, the sample of 30 private solid waste recycling companies was selected from 42 companies by using simple random sampling method and data were collected from that sample. All of those com-
panies have engaged in the industry recently, and gain profit from the industry. 77.78% of them are highly satisfied about their profit and 22.22% of them are satisfied in medium level. Most of these private companies face to a common problem that is lack of enough solid waste. The input solid waste amount that they have is not enough to their capacity. So that they have an excess capacity. On the other hand, they are not satisfied about the government support to en-
hance their production sector.
5.8.5. Quality of the Household Waste Management
In this research, indicator was made to analyse quality of the household waste management process. Main three components were based in this indi-cator. They are household waste segregation, usage of compost bins and the method of divesting nonorganic solid waste. According to the indicator about Sixty percent of sample is in the high-quality range while about thirty five per-cent of sample is in the medium-range and about five percent of sample is in not-quality range.
5.8.6. Competency of Promoting Private Sector Participation
When enquiring the competency of promoting private sector participation for solid waste management in semi urban areas of Sri Lanka, analysis was done through dimensions called social context and institutional context. For the sim-
plicity of analysis two indicators were made. When analysing the competency on social context, two components were concerned ;public judgment of promoting private sector and the public satisfaction about the solid waste management service provided by local government. Finally, it was explained through Social context indicator that promoting private sector participation is in the high com-
petency level by 85%. That indicator has explained that it is in the medium com-
petency range by 15%.

101
2018 Communication. Relations. Management
According to the institutional context, excess capacity of the private compa-
nies and the satisfaction about their profit were considered to make an indicator. The total value of that indicator defined that promoting private sector for solid waste management in semi urban areas is in highly competency level by 100% in institutional context.
5.8.7. Key Points
• Most of private companies that are engaged in solid waste management have excess capacities to recycle waste more.
• The major problem that private companies face is difficulty of collecting waste to recycle.
• Waste recycling and making waste related productions is a profitable emerging industry in Sri Lanka.
• There is no considerable impact of household waste practices on current waste recycling issue in Sri Lanka.
5.8.8. Suggestions
• Private waste recycling companies should be provided friendly tax rate and incentives to invest in waste industry.
• Government can supply waste to private companies for recycling.• People should be informed to give their household waste to private recy-
cling companies too.• Usage of mini compost bins at household levels should be enhanced more. • Public awareness should be enhanced to reduce the usage of Plastic, Pol-
ythene and none organic materials.
5.9. Conclusion
There are two main problems local governments face in solid waste management.
1st issue; The waste amount is rapidly increasing, which means they have to collect
more and more waste.2nd issue;
The standard environmental requirements for landfills are becoming much stricter. Therefore, they cannot simply dump waste any more. They have to improve landfill operation to reduce the environmental impact.

102
Communication. Relations. Management 2018
Both of these issues increase in solid waste management costs. However local governments face many difficulties when making enough budget to solve this problem. Many countries have encountered this conflict needs to be solved. The key to dealing with it is promoting private sector participation for solid waste management.
In developed countries, most towns and cities are generally very clean and sustainable. These towns and cities have appropriate waste discharge rules linked to an efficient waste collection and disposal system. On the other hand, private sector participation is good. It is needed that promoting private sector participa-
tion through effective strategies to make an efficient, productive and profitable solid waste management in sub-urban areas of Sri Lanka.
References(n.d.). Retrieved from http://www.co.mason.wa.us/health/environmental/solid-waste/
what-is-solid-waste.phpCointreau-Levine, S. (1994). Private sector participation in Municipal Solid Waste Services
in Developing Countries. Washington, D.C.: UNDP/UNCHS/World Bank.Dhokhikah, Y., & Trihadiningrum, Y. (2012). Solid waste management in Asian Developing
Countries: challenges and Opportunities. Departement of Environmental Engineer-ing, Sepuluh Nopember Institute of Technology.
Galwe, U., Visvanathan, C., & Alamgir, M. (2005). Solid Waste Management in Least Developed Asian Countries, A comarative Analysis.
Governments, M. o. (2015). Solid Waste Data. JICA. (2003). The study on improvement of solid waste managemnet in secondary cities
in Sri Lanka. K.Ahmad, G. (2008). Municipal solid waste management in Indian Cities.Kardono. (2007). Intergrated Solid Waste Management In Indonesia. Eco Topica Science. Manaf, L., Samah, M., & Zukki, N. (n.d.). Municipal Solid Waste Management in Malaya-
sia; Practices and Challenges.Menikpura, S. (2011). Sustainability assement of municipal solid waste managemnt in Sri
Lanka; problems and prospects.

103
2018 Communication. Relations. Management
Sabilah MargirizkiInstitut Teknologi Sepuluh Nopember
CHAPTER 6
ANALYSIS OF PRIVATE VEHICLE
OWNERSHIP DECISIONS
TO RESPONDENTS AGED 18-23 YEARS IN BIG CITIES OF INDONESIA WITH BINARY
LOGISTIC REGRESSION METHOD
6.1. IntroductionMobility and public transport are two things that cannot be separated espe-
cially if we talk about the big cities in a country. Basically, mobility occurs when people cannot meet their need in a place where they belong. Based on some theories, mobility has so many parts but in this article, author specify is to the mobility focuses people’s daily mobility in the same city or intercity to get their needs, specifically education needs. The possible necessities to motivate people to mobile from one place to another are education and economic needs. A big city oftentimes plays a role of the economic axis for the surrounding cities so by that it increased the desire of people to strive to the big city to get their education or good work to cover their life. The high population and mobility will certainly affect the conditions of transportation on the streets also various aspects. Therefore, in this article author want to analyse the view of urgency of owning private vehicles, as the variable predictor, author used the condition of public transportation in the city where the respondents living in as the variable independent with primary data that is obtained from 72 respondents aged 18 – 23 years old who live in big city in Indonesia. Later, after the results obtained which factors are more influential and can be used as a reference in improving the convenience of public transportation facilities so that in the future people will be much preferred to use public trans-
portation so it can break down the congestion.

104
Communication. Relations. Management 2018
6.2. Sustainability and TransportationSustainable development is a complex concept involving several interrelated
issues. Quoted from Swiss Statistics (2002) Measuring Sustainable Development, Insights into MONET, there are three pillars as the basic definition of sustainabil-ity: social equity, economic efficiency, and environmental responsibility.
In order to carry out one out of 17 Sustainable Development Goals (later will be shortened as SDGs), the eleventh which named Sustainable Cities and Com-
munities, the campaign can be seen as “Bike, walk or use public transportations to keep our cities’ air clean”. A sustainable city does really matter because of to-
day, half of humanity on this earth are living in the city and always still counting, thus the solutions to some issues must be found in the city.
Transportation is the core component of supporting movement humans or goods from one place to another place. Transportation in a big city is an impor-tant thing because of its high demand of human’s activity, thus transportation can be based in economic and community development.
Transportation plays a role in efforts to achieve economic goals and non-economic goals of a country.
1. Economic Goalsa. Increasing national income, accompanied by equitable distribution of
education, business and regional areas.b. Increasing the type and quantity of finished goods and services that
consumers, industries, and governments can produce.c. Develop national industry that can generate foreign exchange and pro-
vide the domestic market. d. Creating and maintaining the level of work for the community.
2. Non-economic Goalsa. To enhance the integrity of the nation. b. To enhance national defence.
6.3. MobilityHuman mobility plays a central role in global and local processes of social, eco-
nomic and political change: it is both moulded by and helps to mould these global transformations. People have agency, and on the individual level, the decision to migrate (or not) and the act of migrating can generally be seen as an expression of hu-
man development. People need a certain minimum of social and economic resources in order to be able to migrate. It is therefore no coincidence that wealthy people and societies tend be generally more mobile than relatively poor people and societies.

105
2018 Communication. Relations. Management
6.4. Indonesia: Overview the transport conditionIndonesia is a developing country in Southeast Asia which has a population
of 261 million by 2016. According to the official website of the President of the Republic of Indonesia, Indonesia now has three special focuses on human devel-opment, infrastructure development, as well as breakthrough studies. In-depth talk on infrastructure development, now Jakarta (Capital of Indonesia) and sur-rounding areas are rampant by the Mass Rapid Transport (MRT) development which hopes to support the mobility of the capital’s mobility life also unravels the existing congestion because it is now known the ratio of vehicle volume and road capacity in Jakarta and its surroundings are close to 1. This means when the ratio is closer to 1, the more roads cannot accommodate the vehicle to move and will increasingly cause congestion. Indonesia’s Central Bureau of Statistics (BPS) recorded that the biggest increase over the last 10 years for all registered vehicles occurred in 2014 for more than 10 million new motor vehicles by the end of 2014. As well as special to private motor vehicles (motorcycles and cars) occurred, the largest increase occurred in the year 2013 which is more than 9.4 million of the new motor vehicles registered.
6.5. DistanceFor the big city, the distance is called as a far if the distance is more than
2 km, to the workplace, health service centre, and shopping malls, shop houses, or stalls, government agencies.
6.6. Formulating the hypothesisIn the language of statistics, the claim or the research hypothesis that
we wish to establish is called the alternative hypothesis. The opposite state-
ment, one that nullifies the research hypothesis, is called the null hypothesis. The word “null” in this context means that the assertion we are seeking to establish is actually void.
In this research, the author assumes null hypothesis as the absence of a re-
lationship between distance, public transport facilities, as well as the need to own a private vehicle. And the opposite statement, to declare an alternative hypothesis is there is an influence between distance, public transport facilities, and the need to own a private vehicle.

106
Communication. Relations. Management 2018
6.7. RegressionLinear regression and correlation are two commonly used methods for examining
the relationship between quantitative variables and for making predictions. Regres-
sion analysis is used to investigate and model the relationship between a response variable and one or more predictors. In the regression, there are several kinds of differ-entiated by type of data used in data processing such as linear regression, polynomial regression, logistic regression, quantile regression, ridge regression, lasso regression, Poisson regression, negative binomial regression, partial least square regression, and ordinal regression. In each type, regression can be subdivided into several parts. For example, binary logistic regression is divided into more than two levels of the depend-
ent variable; outputs with more than two values modelled by multinomial logistic regression, and if multi-category ordered is modelled by ordinal logistic regression
6.8. Binary Logistic RegressionBinary Logistic Regression is an approach to create predictive models with dichot-
omous scale-bound diagrams. The dichotomous scale means the data scale with two categories, for example, yes and no, agree and disagree, good and bad, far and near.
6.8.1. Categorical Variables Codings
In this research with Binary Logistic Regression author processing 72 primary data with binary code where 0 mean respondent agree with the given statement and 1 mean respondent does not agree with the given statement.
There are six statements and one question that the data is used as an independent variable in data processing, the six statements are answered based on public transpor-tation conditions in the city where respondent living in. The six statements are: 1. I feel by using public transport will be faster to arrive at the destination; 2. I feel that using public transport will be free from traffic constraints; 3. I feel that using public transport will save more expenses; 4. I feel public transport in the city I live has easy access to the bus stop and so on; 5. I feel public transport in my city has supported my daily mobility needs; 6. The distance between my residence and my office/ campus. As well as the question of distance is answered using a scale ratio which is then encoded into two categories by the author i.e. code 0 for the close distance (no more than 2000 meters) and 1 for the far distance (more than 2000 meters). As well as a variable response is whether the respondent agrees or not with a given statement that owning a private vehicle is not an urgency be based on the condition of the public vehicle in the city where respondent living in, coded 0 for agreeing to statement, 1 for disagree.

107
2018 Communication. Relations. Management
Table 6.8.1. Categorical Variables Codings
FrequencyParameter
coding(1)
Faster to reach destination (X1)
0 16 .0001 56 1.000
Traffic stuck-free (X2)0 23 .0001 49 1.000
Low cost (X3)0 34 .0001 38 1.000
Has an easy access (X4)0 27 .0001 45 1.000
Support daily needs (X5)0 25 .0001 47 1.000
Distance (X6)0 50 .0001 22 1.000
Beginning Block
Iteration history block 0: In this stage author making sure about the model before independent variables are entered, from this it can be concluded later whether the model is good enough or not.
Table 6.8.2. Iteration History a, b, c
Iteration-2 Log
likelihoodCoefficients
ConstantStep 0 1 59.385 1.444
2 58.040 1.7813 58.024 1.8244 58.024 1.825
a. Constant is included in the model.b. Initial -2 Log Likelihood: 58.024
c. Estimation terminated at iteration number 4 because parameter estimates changed
by less than .001.The calculation obtained initial -2 Log Likelihood value is 58.024. Chi-square table
value with Degree of Freedom (df) 71 and probability 0.05 is 91.669. Calculation-value < table-value mean retain H0 and shows that the model already FIT with the data
before independent variable substitutes.
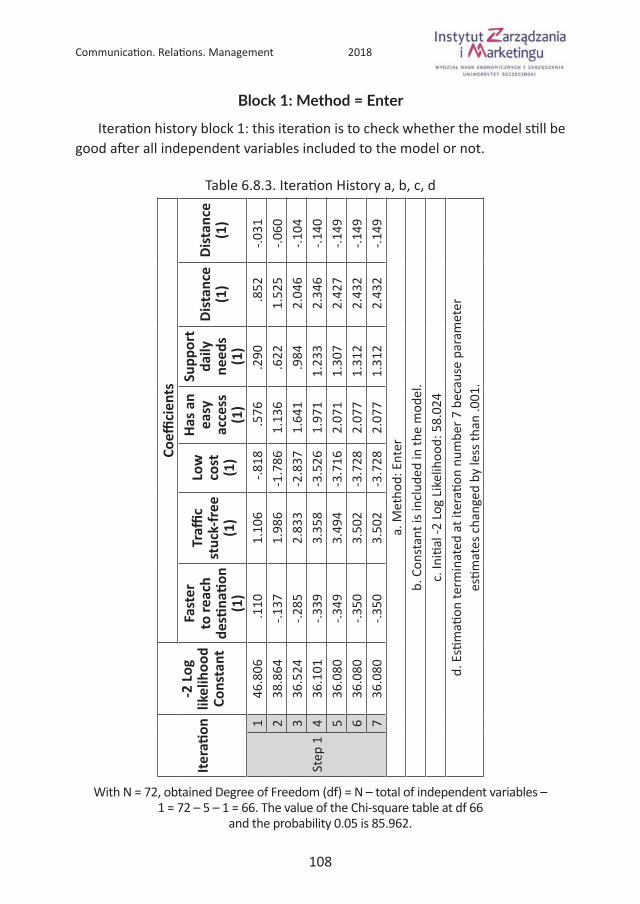
108
Communication. Relations. Management 2018
Block 1: Method = Enter
Iteration history block 1: this iteration is to check whether the model still be good after all independent variables included to the model or not.
Table 6.8.3. Iteration History a, b, c, dIte
ratio
n-2
Log
lik
elih
ood
Cons
tant
Coeffi
cien
tsFa
ster
to
reac
h de
stina
tion
(1)
Traffi
c st
uck-
free
(1
)
Low
co
st
(1)
Has a
n ea
sy
acce
ss
(1)
Supp
ort
daily
ne
eds
(1)
Dist
ance
(1
)Di
stan
ce
(1)
Step
1
146
.806
.110
1.10
6-.8
18.5
76.2
90.8
52-.0
312
38.8
64-.1
371.
986
-1.7
861.
136
.622
1.52
5-.0
603
36.5
24-.2
852.
833
-2.8
371.
641
.984
2.04
6-.1
044
36.1
01-.3
393.
358
-3.5
261.
971
1.23
32.
346
-.140
536
.080
-.349
3.49
4-3
.716
2.07
11.
307
2.42
7-.1
496
36.0
80-.3
503.
502
-3.7
282.
077
1.31
22.
432
-.149
736
.080
-.350
3.50
2-3
.728
2.07
71.
312
2.43
2-.1
49a.
Met
hod:
Ent
erb.
Con
stan
t is i
nclu
ded
in th
e m
odel
.c.
Initi
al -2
Log
Likel
ihoo
d: 5
8.02
4d.
Esti
mati
on te
rmin
ated
at i
tera
tion
num
ber 7
bec
ause
par
amet
er
estim
ates
chan
ged
by le
ss th
an .0
01.
With N = 72, obtained Degree of Freedom (df) = N – total of independent variables – 1 = 72 – 5 – 1 = 66. The value of the Chi-square table at df 66
and the probability 0.05 is 85.962.

109
2018 Communication. Relations. Management
Value of -2 Log Likelihood (36.080) < Chi-square table (85.962) thus fails to reject H0, it define that the model substitutes by those independent variables is fit with the data.
6.8.2. Hosmer and Lemeshow Test
Hosmer and Lemeshow Test: is a Goodness of Fit test, a test to determine if the model is right or not. It is exact if there is no significant difference between the model and its observation value.
Table 6.8.4. Hosmer and Lemeshow
Step Chi-square df Sig.1 1.706 7 .974
H0: the model has been sufficiently able to explain the data / fit.H1: the model is not enough to explain the data.
Reject H0 if the significant value is < 0.05.
The value of Chi-square table for Degree of Freedom (df) 5 (number of inde-
pendent variables - 1) at the 0.05 significance level is 11.07. Because the calculated value of Chi-square Hosmer and Lemeshow 1.706 < value of Chi-square table 11.07 and also the significance value of calculation is 0.974 that lower than 0.05 then the conclusion is failed to reject H0 which means with 95% confidence can be believed that there is no significant difference between model and the observation result so that model can be said fit and sufficiently able to explain the data.
6.9. Model SummaryTable 6.9.1. Model Summary
Step-2 Log
likelihoodCox & Snell
R SquareNagelkerke
R Square1 36.080a .263 .475
a. Estimation terminated at iteration number 7 because parameter estimates changed by less than .001.
Model summary is to see the ability of independent variables in explaining the dependent variable. The value of Nagelkerke R Square is 0.475 and Cox & Snell R Square 0.263, indicating that the ability of independent variables in explaining the dependent variable is 0.475 or 47.5% and there are 100% - 47.5% = 52.5% other factors outside the model that explain the dependent variable.

110
Communication. Relations. Management 2018
Table 6.9.2. Classification Table a
ObservedPredicted
Y Percentage CorrectAgree Disagree
Step 1Y
Agree 5 5 50,0
Disagree 4 58 93,5
Overall Percentage 87,5
a. The cut value is .500
Classification table: the number of respondents who agree 5 + 5 = 10 re-
spondents. Totally agree as many as 5 people and who should agree but do not agree as many as 5 people. Number of disagreeable samples 4 + 58 = 62 people. That totally disagrees 58 people, and who should agree but disagree as much as 4 people. Written in the table, the value of overall percentage is 87.5%, which means the accuracy of this research model is 87.5% can predict the effect of public transportation conditions in the city of people living with the decision of private vehicle ownership.
Table 6.9.3. Variables in the Equation
B S.E. Wald df Sig. Exp(B)95% C.I.for
EXP(B)Lower Upper
Step 1a
Faster to reach destination(X1) 3.502 1.725 4.120 1 .042 33.191 1.128 976.520
Traffic stuck-free(X2) -3.728 1.937 3.703 1 .054 .024 .001 1.071
Low cost(X3) 2.077 1.179 3.105 1 .078 7.983 .792 80.483Has an easy
access(X4) 1.312 1.189 1.217 1 .270 3.712 .361 38.175
Support daily needs(X5) 2.432 1.066 5.202 1 .023 11.377 1.408 91.945
Distance(X6) -.149 .950 .025 1 .875 .861 .134 5.543Constant -.350 .766 .208 1 .648 .705
a. Variable(s) entered on step 1: Faster to reach destination, Traffic stuck-free, Low cost, has an easy access, Support daily needs, Distance.

111
2018 Communication. Relations. Management
Variables in the Equation: in this table shows the results that can be used as a determinant of the Binary Logistic Regression equation and from the value of significance can be concluded independent variable that significantly influence the model and which has no significant influence.
From the table above obtained that there are two variables that have signif-icant value <0.05 ie X1 and X5 so that the conclusion is: the length of travel time to reach destination of using public transportation and its conditions in support of daily mobility needs have a significant influence on people’s perspective of the urgency has a private vehicle,
The results of Exp (B) describe the effect of an independent variable on the re-
sponse variable. Variable X1 (public transport can reach the destination faster) with Odds Ratio / OR 33.191 (category 0 variable independent), has 33,191 times influ-
ence on people’s view that owning a private vehicle is not an urgent matter, rather than a public transportation that does not reach the destination by fast (category 1 variable independent). As well as on the X5 (public transport conditions that have been able to support daily mobility needs) with Odds Ratio / OR 11,377 (category 0 variable independent), has an 11,377 times effect on one’s view of owning a pri-vate vehicle is not an urgent matter, compared with public transportation conditions that cannot support daily mobility needs (category 1 independent variable).
6.10. Box PlotThe box plot is a standardized way of displaying the distribution of data based
on the five number summary: minimum, first quartile, median, third quartile, and maximum. In the simplest box plot the central rectangle spans the first quartile to the third quartile (the interquartile range or IQR).
From the six independent variables are given, the author pursed further dis-
cussion of the respondent’s statement. Because it is found that the most signifi-
cant variable to the model is the variable about time, so this section the author describes the distribution of respondent data against the time statement. Given five related statements of time, that are: 1. For me being on time is a must; 2. I will choose the most efficient way to reach my destination so I will not spend most of my time on the way; 3. I always estimate the travel time to my destina-
tion so I can arrive on time; 4. I would be very unhappy if I am late due to traffic constraints; 5. I feel that my delay will have a negative impact on myself. From the five statements, the respondents was asked to give the number in the range from 1 to 5 with the interpretation that 1 means strongly disagree and 5 means strongly agree, with the conditions that best suit themselves.

112
Communication. Relations. Management 2018
LATE BRIN
GS NEGATIV
ITY
GUILTY O
F BEIN
G LATE
TIM
E ESTIM
ATIO
N
EFFIC
IENCY
BEING O
N TIM
E
5.0
4.5
4.0
3.5
3.0
2.5
2.0
Data
Boxplot
Figure 6.10.1. Boxplot
The interpretation of the boxplot graph above is the point in the middle of the box shows the average value of the data, the upper boundary of the box indicates the upper quartile, the lower limit of the box indicates the lower quar-tile value, as well as the vertical line describes the presence of other incoming data but not in large quantities. The asterisks (*) below illustrate the existence of outlier data so they are not represented by vertical lines.
From the boxplot graph above, obtained the average value for each state-
ment is not less than 4.4 out of 5. Which means the awareness of people against time (including being on-time and time management) is high.
6.11. ConclusionFrom the survey results of 72 respondents with the age limit of 18-23 years
old in big cities in Indonesia, 13.8% of the total respondents agreed that having a private vehicle is not an urgent matter, that means there are still 86.2% who agree that having a public vehicle is an urgent matter. The most influential factor is about the time factor, there are only 22.2% who agree that by using public transport can deliver them faster to the destination. This factor has a 33 times effect on the final decision of private vehicle ownership. This case is reinforced by the acquisition of 34.7% who agreed that the condition of public transportation has already supported the process of daily mobility, which means there are still 65.3% who feel the condition of public transportation has not supported the daily mobility. The overall condition factor of this public transport gives an effect

113
2018 Communication. Relations. Management
of 11 times to the final decision of private vehicle ownership. From this survey and research, we already know that most of the people rather choose private transportation instead of public because of the convenience and effectiveness. Thus, we can conclude that if public transportation maintained to being more convenience, reachable, and effective, it will gain more urge from people to use public transportation more frequent than the private one.
References:Boyes, W. and Melvin, M. (2012). Fundamentals of Economics. 5th Edition. South-Western
Cengange Learning. p. 200.Griffiths, A. (2010). SPSS for dummies. Wiley.Grotenhuis, M. and Matthijssen, A. (2016). Basic SPSS tutorial. Thousand Oaks CAL: SAGE
Publications, Inc.Johnson, R. and Bhattacharyya, G. (2011). Statistics. New York: John Wiley, p. 315.Weiss, N. (2012). Introductory statistics. 9th ed. Boston: Pearson Education, p. 655.Bąk-Grabowska, D. and Jagoda, A. (2012). Atypical Forms of Work Arrangements and
Forms of Employement as A Determinant of Working Time Arrangements. In: Man-
aging Transformation with Creativity.de L’Union Internationale des Transports Public (UITP) Europe (2014). Position Paper of
The International Association of Public Transport. Brussels.Haas, H. (2009). Mobility and Human Development. Research Paper 2009/01 April 2009.
United Nation Development Programme.Kueng, J. (2001). Konsumsi Kayu Bakar Penduduk di Desa Tanah Kecamatan Buya.
Undergraduate. Universitas Mulawarman.Swiss Federal Statistical Office (2002). Measuring Sustainable Development | Insights
into MONET – the Swiss monitoring system. Neuchâtel: SFSO, SAEFL, ARE, p. 5.Data.go.id. (2018). Jumlah Kendaraan Bermotor (Unit) - Portal Data Indonesia - data.go.id.
[online] Available at: https://data.go.id/dataset/jumlah-kendaraan-bermotor-unit [Accessed 19 Apr. 2018].
Ganz, E. (2018). UN forum spotlights cities, where struggle for sustainability ‘will be won or lost’. [online] UN News. Available at: https://news.un.org/en/sto-
ry/2018/07/1014461 [Accessed 17 Sep. 2018].IBM SPSS Statistics 20. (2011). Chicago, Illinois, United States: The International Business
Machines Corporation.IDRE Stats. (n.d.). Logistic Regression | SPSS Annotated Output - IDRE Stats. [online]
Available at: https://stats.idre.ucla.edu/spss/output/logistic-regression/ [Accessed 12 May 2018].
Minitab 16. (2010). Convetry, United Kingdom: Minitab.

114
Communication. Relations. Management 2018
Physics.csbsju.edu. (2018). Box Plot: Display of Distribution. [online] Available at: http://www.physics.csbsju.edu/stats/box2.html [Accessed 20 Jun. 2018].
Presidenri.go.id. (2018). Presiden Republik Indonesia. [online] Available at: http://www.pres-
idenri.go.id/ [Accessed 24 Apr. 2018].R-bloggers. (2018). 15 Types of Regression you should know. [ListenData] Available at:
https://www.r-bloggers.com/15-types-of-regression-you-should-know/ [Accessed 20 Jun. 2018].
Rodrigue, D. (n.d.). Transport and Sustainability. [online] The Geography of Transport Systems. Available at: https://transportgeography.org/?page_id=5725 [Accessed 14 Sep. 2018].
Sustainable Development Goals. (2018). About Sustainable Development Goals. [online] Avail-able at: https://www.un.org/sustainabledevelopment/sustainable-development-goals/ [Accessed 17 Sep. 2018].

115
2018 Communication. Relations. Management
Vlada IvanovaUniversity of SzczecinFaculty of Economics and Management
CHAPTER 7
THE KEY RELATIONSHIPS BETWEEN
THE MARKETING MASSAGES AND THE
CULTURAL ENVIRONMENT OF SOCIETY
7.1. IntroductionAs observers and regulators of human behavior - managers cannot claim that
only the system of social interactions in society and the results of the commercial marketing environment, discussed in this article, affect the cultural life of people to which commercial messages, embedded in the concept of life scenarios, were sent. Because it is the consumer who agrees with the wide use of those or other services, social structures, and material goods.
The purpose of this article is to propose an analytical framework embracing the key relationships between the marketing messages and cultures to which they are directed, and how advertising should correspond to the values and worldview of the group of people to who it is addressed to.
The methodology of the article is the analysis of the principles and proce-
dures of inquiry in a marketing field and the influence of culture on it.Anchored in the configuration theory, the present study aims to explore the
simultaneous roles of social behavior and culture on marketing capabilities to “reach the minds” of customers and to outline the possibility to introduce the philosophy of their product into their customers` culture.
As it known, all members of our society sharing general cultural knowledge includes implicit theories about the world we live in, various interpretations of it, and specific ways of expressing their faith in certain patterns of behavior. The im-
portance of culture in terms of marketing is enormous and therefore it should be considered more thoroughly. The smaller markets all together create the world market, at the time that a smaller economies, that have their own cultures and

116
Communication. Relations. Management 2018
languages, are the drops in the ocean of entire world economy. But there are differences which existing because of differing from each other cultures and cul-tural styles, that can affect business performance. Just as the European economy is distinct from that of American, American market is distinct from the Chinese, and a few things that are acceptable in Japan may not be acceptable in the Mid-
dle East.1 That`s why marketers need to take into account the cultural barrier between the marketing message and the idea embedded in it, and the potential consumers whose perceptions are based on the cultural values of the group to which they refer.
Of course, every advertisement message is faced with such a stone of pre-
diction as the culture of that population and those groups of people to whom it is addressed. For the prediction of this barrier, scientists and other market re-
searchers with non-commercial and commercial purposes, study patterns of be-
havior, reactions to advertising, and the reasons for choosing those or other ser-vices and products of buyers to create the most effective commercial message.
Also, it is necessary to a greater degree of looking on influence of culture on advertising messages,- to better understand the relative importance of the service quality dimensions to customers. Furthermore, it is needed to pay any attention at how is those quality dimensions likely to vary depending on custom-
ers` culture. For this reason, the allocation of resources depends on the impor-tance given to them by customers. Into the bargain, to reach a certain group of buyers, it is essential to emphasize psychographics (“Psychographics - analysis of consumer lifestyles to create a detailed customer profile. Market researchers conduct psychographic research by asking consumers to agree or disagree with activities, interests, and opinions statements. Results of this exercise are com-
bined with geographic (place of work or residence) and demographic (age, edu-
cation, occupation, etc.) characteristics to develop a more “lifelike” portrait of the targeted consumer segment.2”) in understanding service quality, that is, the way people feel, behave, and think. In a multicultural environment, psychographics are strongly dependent on cultural elements.3
Engel and Blackwell (1986) provide a clear pictorial representation of the relationship between culture and subculture and buyer behavior. Marketing in
1 https://www.gsb.stanford.edu/insights/when-does-culture-matter-marketing (11.05.18).2 http://www.businessdictionary.com/definition/psychographics.html (12.05.18).3 https://www.researchgate.net/publication/247745350_The_Relationships_between_Culture_
and_Service_Quality_Perceptions_Basis_for_Cross-Cultural_Market_Segmentation_and_Re-
source_Allocation (12.05.18).

117
2018 Communication. Relations. Management
the entirely, common aggregate of its various communications to the customer, make an effort to influence on the cultural shapes of society and its interactions through the moral values, lifestyles, and personalities of individuals, who became linked together in various degrees in certain psycho types of the groups and sub-
groups of consumers; while also culture influence the presentation of marketing advertising to the “audience” – the members of this cultural groups. In a closed circle of mutually changing parts of the same whole: not only marketing envi-ronment changing, but also culture itself.
Geert Hofstede (1994) claimed culture like a “collective programming of the mind which distinguishes the members of one group or category of people from those of another” (p. 4).
Differences between cultures limiting the abilities of service multinationals to expand their activities internationally (Kogut and Singh 1988). So, what they need is to think about their product not in a frame of restricting by demographics but in a frame of the time and resources to look forward to the new possibilities with an understanding of how markets in different cultures are functioning and how members of its societies perceiving their positioning (“Positioning - a marketing strategy that aims to make a brand occupy a distinct position, relative to com-
peting brands, in the mind of the customer. Companies apply this strategy either by emphasizing the distinguishing features of their brand (what it is, what it does and how, etc.), or they may try to create a suitable image (inexpensive or premi-um, utilitarian or luxurious, entry-level or high-end, etc.) through advertising.4”).
In communicating with international markets, one of the key issues is under-standing of its customer`s behaviour and culture in their social lives. In particular, communication and visual convention are substantial cultural elements, which influence advertising effects in creating new cultural habits for the development of a certain system of consumer`s behavior and “pre-writing” their choices not only for the achievement of interests of the particular firm or market, but also to create a cultural environment for political purposes of countries.
Cultural marketing pays attention to what is going on in the culture. Market-ers need to be careful observers, like a players in a curling game, of the culture around them, so that they can anticipate what issues will be important in the fu-
ture. They need to identify movements that their brand can speak to and listen to conversations in the media and on the Internet to raise awareness of the values that are motivating cultural change in their market environment (Assael 2001).
4 http://www.businessdictionary.com/definition/positioning.html (15.05.18).

118
Communication. Relations. Management 2018
Douglas Holt and Douglas Cameron pointed out in their book “Cultural Strategy”,
using a comprehension of the following disciplines which all have in common an assumption,- the extraordinary influence of engineering, economics, and psychol-ogy on management thinking. Definitively, a complex world that humankind has built in various systems interacting with each other, can be simplified in order to derive from it a certain concept and to develop an approach for the purposes of marketers, but to do that, it’s necessary to filter out cultural context, trends and its changes over time.
Companies that can adapt to changes and have an ability to understand the cultural characteristics of different communities, actually leading markets. It is shown in the relationship between rapid and accelerating growth of the global economy and development of various marketing methods to increase the effec-
tiveness of managers’ goals in an attempt to influence the fields (or segments) of the market.5
As stated by Kotler (1997), “A market segment consists of a large identi-
fiable group within a market” (p. 250). In this scenario, segmentation is the process of partitioning markets into groups of potential customers with sim-
ilar needs and values who are likely to exhibit similar purchase behavior and reactions (Weinstein 1994).
Companies still cling to misconceptions about how to predict behavior of their consumers` of different racial and ethnic backgrounds. Marketing strategies of those companies don`t evolve in the field of the market as they actually plan to evolve, because of some significant missteps. If marketers reaching the multi-
cultural exposure of their strategies, they shouldn`t view consumers mainly via demographics, more reasonable for them is to understand demand.6
The choice of consumers in the purchase of certain services and goods relies on their basic, daily perception of the world and the assessments of their envi-ronment resulting from the analysis of value systems by the very the same values inculcated to them by the culture of the society in which they live. So, before making an assessment of the goods offered by various marketing tools, buyers analyze it through the prism of their cultural values. And of course, a brand that reflects the values of their society and worldview, will be perceived by them as a part of their lives and as something necessary for a deeper identification with their environment.
5 https://www.huffingtonpost.com/jure-klepic/how-cultural-marketing-is_b_5815896.html (17.05.18).6 https://www.gsb.stanford.edu/insights/when-does-culture-matter-marketing (13.05.18).

119
2018 Communication. Relations. Management
To succeed in expanding their capabilities and demographic boundaries, brands should focus not only on their marketing strategy but also on how their marketing company will be evaluated by potential buyers of their services and products from the perspective of the cultural values of the audience they are trying to reach.
Increasing competition in the market has also increased the importance of understanding culture. As brands are now creating new relationships with overseas markets, culture in this scenario plays the role of an instrument that connects their brand with the markets of other cultural layers and population groups.7
Nowadays, when the world explode its previous existed in the minds of hu-
manity boundaries, and people become more aware of the union of the core knowledge that applies to everyone, regardless of ethnicity or whatsoever, man-
agers desperately needed to clearly understand for their further market reviews and plans of resource allocation, that the culture is a choice and not a birth-
right to a greater or lesser extent in different parts of the globe. On top of that, what will the marketing strategy and its advertising messages look like and what temporal-spatial strata of society’s perceived customs or cultural shifts it`ll be based on, depends on the country and its cultural policy in which this strategy is planned to be implemented.
After all, understanding cultural differences lie at the heart of building interna-
tional marketing communications and global brand management strategies. Indeed, the importance of understanding culture in marketing is growing and this is also facilitated by the development of new technologies that allow marketers to reach out to wider audiences across the borders of different countries and continents. Since cultural nuances became very important and how productive advertising will be in this or that country, depends on them, marketers are carrying out more and more researches every year in an attempt to understand subtle cultural differences.
When personal knowledge of the individual is influenced by socio-cultural norms, marketers, in an attempt to clarify the psychology of consumers through cultural contexts, create new types of global marketing efforts that in fact most effectively understand the thinking of consumers and can communicate with them on their “cultural language”.8
One of the best option for the agencies, who have advertisement activ-
ities, to draw conclusions about where their opportunities for growth are –is to analyze how is shifting the marketplace for their products and services,
7 https://www.cheshnotes.com/2017/01/importance-of-culture-in-marketing/ (14.05.18).8 https://www.gsb.stanford.edu/insights/when-does-culture-matter-marketing (19.05.18).

120
Communication. Relations. Management 2018
and when consumer context and assumptions change. But to be able to steward their brand at the highest level to achieve remarkable results, marketers must to transform their mindset about culture and start pay their attention not only to the new trends but also to the deeper, lasting values that change much slower. Perhaps, the greatest challenge for managers will be not forgetting that they also should look beyond demographics. When there appears the bottom line that a demand-based focus is much more profitable than a demographics-based focus of culture,9 comes into view the next question: how to assess the cultural nature of an international market?
Globalization has brought changes into people`s perception of life, several things have become common but culture continues to influence how certain processes are carried out in society, how people think and react on certain pro-
cesses in their environment, and, what is one of the most interesting topic for the marketing managers, what are the reasons for people to shop.
Even in the case of creating repeatable massage that`ll stick in social per-ceptions and needs in the shape of some product embodied in identification with its brand, if this trademark does not work on the cultural side of marketing, it misses a very important part of its marketing strategy. To position the brand as an organization that understands the needs of its customers, marketing strategy should be developed in such a way to respond to the cultural values of its clients. It is why brands, when developing a strategy, not only should consider the market situation, but also the culture of people behind it.
Recently, analysts Jake Sorofman and Andrew Frank wrote in “What Data-Obsessed Marketers Don’t Understand”: “Marketing leaders must remem-
ber that true brand intelligence lives at the intersection of head and heart, where the emotional self meets the analytical self”.10 These words fully confirm the vision that marketing managers need to understand the culture and other intan-
gibles. But how to do so, explains more fully the following paragraph.The Terpstra and Sarathy`s (2000) Cultural Framework helps marketing man-
agers to estimate the cultural nature of an international market. This framework is very forthright, genuine, and uses eight categories in its analysis: values and at-titudes, education, social organizations, technology and material culture, law, and politics, language, aesthetics, and religion. In attempt to explain those categories, there is a table below with a measures of the Terpstra and Sarathy`s cultural framework and its main characteristics.
9 https://www.forbes.com/sites/onmarketing/2014/04/07/culture-as-competitive-advantage-for-marketers/#6e39fee67a13 (21.05.18).
10 https://hbr.org/2014/02/what-data-obsessed-marketers-dont-understand (09.05.18).

121
2018 Communication. Relations. Management
Table 7.1. Measures and the main characteristics of the Terpstra and Sarathy`s Cultural Framework and basic description of its use in an attempt
to introduce a certain advertising on the market
Measures of the Terpstra and Sarathy`s Cultural
Framework
Main characteristics of the Cultural Framework and basic description of their use in an attempt to introduce a certain
advertising on the market
Values and Attitudes
Values and attitudes vary between and within nations. Managers should understand the locality
well before their products or services enter the market. This could mean changing advertising
materials or subtle advertising messages. Also, there may be a problem in managing local employees.
Education
The level and nature of education in each international market will differ. This can affect the
type of message or even the media firms are using. In countries with low literacy rates, advertisers
would avoid writing-dependent commercial messages and would liking for radio advertisements using sound messages, or visual aids, as billboards.
Social Organizations
It refers to how a particular national society is organized and how its social mobility and its
limitations (caste and class systems) may affect the distribution of various goods and services,
depending on the prevalence of one or another class or caste in a certain locality and how
marketing messages should be displayed depending on the prescribed roles in a given society.
Technology and Material Culture
Technology is a term that includes issues such as energy to power the products, a transport
infrastructure for the distribution of the products to consumers, etc.. It is also important to think
about life-philosophy of firm`s potential consumers to predict if they really would buy those material
goods that marketers want to sell to them.

122
Communication. Relations. Management 2018
Law and Politics
As in many aspects of the Cultural Framework of Terpstra and Sarathy`s, a fundamental social
culture will stimulate the political and legal landscape. The political ideology on which
the society is based will influence marketers` decisions promote advertising there.
Aesthetics
Aesthetics is related to the human`s feelings and appreciation of the artistic nature of something, including its smell, taste or atmosphere. It might be related to the marketing massages through
fashionable design of advertisement, and the way of how it`s served (with good taste or not), just as the colors of it, music or some objects and stories stated
in the semantic context of this advertisement, and how deeply it`s associated with a pleasant
experience. Briefly speaking, at this stage of Cultural Framework, it is worth thinking about how
aesthetically attractive everything related to branding.
Language
This concept is related to the balance between verbal and non-verbal communications. With
language, one should consider whether the national culture is predominantly a high context culture or a low context culture (Hall and Hall 1986).
Therefore, with a high context culture, it is necessary to take into account the hidden cultural meaning,
as well as the language of the body.
Religion
Nature and complexity of the various religions, an international marketer may face, is quite
diverse. Organizations need to ensure that their products and services are not offensive,
illegal or unpleasant for the local nation.11
Source: own compilation. 11
11 http://www.marketingteacher.com/international-marketing-and-culture/ (17.05.18).

123
2018 Communication. Relations. Management
When companies are growing and looking for new opportunities, they might find advantages for their growth in new countries. A product, though, can be in-
troduced on a global level with a help of developing a successful marketing strat-egy. To do so, an organization must take into consideration the cultural influences of the society where a new product is about being introduced. For this purpose, marketers should learn about how people make decisions about consumption of a product, based on 4 cultural influences, shown below in Table 7.2.
Table 7.2. Cultural aspects which may influence on how people make decisions about consumption of a product and their explanations
Cultural aspects which may influence on how people
make decisions about consumption of a product
A brief explanation of cultural aspects
Cultural Values
Values of a society dictate what is acceptable and unacceptable behavior, what is important or
unimportant, right or wrong, workable or unworkable, linking together in the generally accepted standards.
Symbols and Symbolism
Symbols in relation to cultural influences refers to language, both spoken and unspoken to signify ideas and qualities. While some foreign influence
may be acceptable, a culture may want to preserve its specific cultural heritage to keep their symbols
and symbolism untouched.
Rituals
Rituals are patterns of behaviors that are learned and repeated. Rituals play an important role in how life events, such as births, marriages, graduations and
funerals, are conducted in different cultures. Rituals play an important role in marketing strategies as they
Focusing on consumers’ everyday interactions and how these interactions will play into the promotion
and selling of a product or service.

124
Communication. Relations. Management 2018
Thought Processes
Thought processes may vary among different cultures. This could affect the way a marketing strategy
is perceived. People who are part of one culture may take in the whole picture in an advertisement and be able to report specific details of what they have seen,
even in the background; those of another culture may only see and identify with the central figure and ignore background items altogether. This would affect
the way a marketer presents his message based on cultural thought processes.12
Source: own compilation.
Next figure shows how described below information work in the real-life managerial processes of creating marketing messages.
Figure 1.1. Cultural aspects influencing on each other in the working model
Source: own compilation.
12 http://smallbusiness.chron.com/cultural-influences-marketing-strategies-26121.html (23.05.18).
• Focusing ads on individuals in in-
dividualistic countries while group advertising works better in countries with collective group values
• Conforming advertising in such a country into language symbols acceptable to the population of
that particular country
• Presenting a mes-
sage based on reports with specific details of what
potential costumers (culture’s rep-
resentatives) have seen in those commercials
• Focusing on con-
sumers everyday interactions and how these interactions will play into the promotion and selling of a product or service

125
2018 Communication. Relations. Management
7.2. Examples of the cases in which marketing strategy did not account the culture of the population to which
it tried to broadcast its advertising contentIn 2005 France’s Catholic Church won a court injunction to ban a clothing
advertisement (by clothing designers Marithe and Francois Girbaud) based upon Leonardo da Vinci’s Christ’s Last Supper.
In China in 2007 (which was the year of the pig) all advertisement, which in-
cluded photos of pigs, was prohibited. This was supposed to maintain harmony with the Muslim population of the country about 2%.13
7.3. Examples of implementation of the planned results by virtue of marketers
In 2008 “Coke” was attempting to penetrate the South Korean market. They de-
cided to use their knowledge about the culture to expand their South Korean market share and revenue. Marketing analysts noticed that 43% of South Korean citizens had an online profile or blog and that 90% of the 20-29 years old demographic logged into social media at least once a day. “Coca-Cola” used their South Korean bloggers to provide them with more cultural information about how to best communicate their message for maximum efficiency within the South Korean population. “Coca Cola” reached out to young mom bloggers in that age bracket to use their web properties to share information, evangelize the brand, and increase loyalty.
Harley-Davidson’s organizational culture is directly linked to the chopper bik-
er culture. This firm has heard the need of the market and has become a symbol of those subcultures whose values now embody.
From its beginnings, “Nike” has succeeded in marketing across borders through the use of emotional advertising and branding with the now world-recognized slogan, “Just do it”. Nike has managed to build a strategy that appeals to a cus-
tomer’s aspirations or emotions to build an attachment to a brand, as opposed to selling the product solely for the product’s sake, rather than selling a product directly. “Nike” routinely relies on the emotions of activity, success, achievement, heroism, and triumph to appeal to customers,- a strategy has been successful re-
gardless of the market. Some of Nike’s emotional branding tactics have included advertisements with phrasing like: “Anticipate greatness” or “Your only limit is you”.
13 http://www.foxnews.com/story/2007/01/25/chinese-tv-network-bans-pig-ads-during-year-pig-celebrations-due-to-muslim.html (05.05.18).

126
Communication. Relations. Management 2018
It goes without saying that human emotions and desire know no boundaries.This knowledge, if applied correctly, taking into account the cultural factors of a population of our planet, can serve as fertile soil for its the future strategy that would work on all of the people around the world.
7.4. ConclusionsWhat does culture mean for a man? The systems of the order of things, laws
and perceptions about the external world, which are connecting groups of peo-
ple who want to form into societies, and inherit, continuing to expand the system of knowledge that represents to them the reality by which they live.
Every advertisement message is faced with such a stone of prediction as the culture of that population and those groups of people to whom it is addressed.
The question of the development of the company or promoting a prod-
uct or services on the local or global market, lies at the heart of market-
er`s knowledge of culture and their ability to predict people`s reactions relying on this information.
The importance of understanding cultural differences and the ways in which it is possible to define and use them to create properly selected content of adver-tising messages is so great, that by how a firm has succeeded in understanding the thinking systems of various social groups and subgroups of the population to which these advertisements are addressed, it is possible to predict whether the firm will succeed in the market and expand its borders not only at the local, but also at the international level, or else it will sink into the abyss of public mis-
understanding and cease to exist.Marketing messages are not just the messages that best describes the idea
behind the supply of those or other goods and services, but also the reflections of the culture of society that will perceive, analyze and do their own conclusions about it. And the most accurate hit of advertising in the system of values and consumer needs will be that which is based on their perceptions of the world and that which can become a part of their lives, as if it was already.
In order to have a more accurate idea of this or that culture, it is necessary to study in detail various aspects of the perception and behavior of its partici-pants. This article has examined various methods and aspects that can help in the related investigations.

127
2018 Communication. Relations. Management
BibliographyJ.F. Engel, R.D. Blackwell, P.W. Miniard. (1984) Consumer behavior, 6th ed., pp. 409–417.G. Hofstede (1994) The Business of International Business is Culture, International Busi-
ness Review Vol. 3, No. 1, pp. 1–14.B. Kogut, H. Singh (1988) The Effect of National Culture on the Choice of Entry Mode,
Journal of International Business Studies, vol. 19, issue 3, pp. 411–421.Assael, H. (2001), Consumer Behavior and Marketing Action, 6th ed., pp. 113–119.Ph. Kotler, P. Hall (1997) Marketing Management: Analysis, Planning, Implementation,
and Control, pp. 250.A. Weinstein (1994) Market Segmentation: Using Demographics, Psychographics,
and Other Niche Marketing Techniques to Predict and Model Customer Behavior, pp. 84–92.
V. Terpstra, R. Sarathy, D. Press (2000) International Marketing, The Dryden Press series in marketing, pp. 210–239.
https://www.gsb.stanford.edu/insights/when-does-culture-matter-marketing (11.05.18.)http://www.businessdictionary.com/definition/psychographics.html (12.05.18)https://www.researchgate.net/publication/247745350_The_Relationships_between_
Culture_and_Service_Quality_Perceptions_Basis_for_Cross-Cultural_Market_Seg-
mentation_and_Resource_Allocation (12.05.18)http://www.businessdictionary.com/definition/positioning.html (15.05.18.)https://www.huffingtonpost.com/jure-klepic/how-cultural-marketing-is_b_5815896.
html (17.05.18)https://www.gsb.stanford.edu/insights/when-does-culture-matter-marketing (13.05.18.)https://www.cheshnotes.com/2017/01/importance-of-culture-in-marketing/ (14.05.18.)https://www.gsb.stanford.edu/insights/when-does-culture-matter-marketing (19.05.18)https://www.forbes.com/sites/onmarketing/2014/04/07/culture-as-competitiv
e-advantage-for-marketers/#6e39fee67a13 (21.05.18.)https://hbr.org/2014/02/what-data-obsessed-marketers-dont-understand (09.05.18.)http://www.marketingteacher.com/international-marketing-and-culture/ (17.05.18.)http://smallbusiness.chron.com/cultural-influences-marketing-strategies-26121.html
(23.05.18.)http://www.foxnews.com/story/2007/01/25/chinese-tv-network-bans-pig-ads-during-
year-pig-celebrations-due-to-muslim.html (05.05.18.)


Winnet Centre of Excellence® (WCE®) is a platform created for the purpose of doing and promoting teaching, policy making and research on Gender, Inno-
vation and Sustainable Development. WCE® operates through the international network of researchers from universities in Lithuania, Poland, Sweden, Finland, Latvia, Sri Lanka, China, Georgia and Armenia. This initiative is possible thanks to the cooperation with the WINNET Sweden. Our activities were financed by the Swedish Institute under the project TP Winnet BSR (Thematic Partnership Winnet Baltic Sea Region, Winnet BSR, Swedish Institute: 2013 - 2016). WCE® has been established in November 2014 at the Faculty of Economics and Manage-
ment, University of Szczecin by a decision of partners of the Thematic Partnership Winnet BSR. WCE® Coordinators are: dr Marta Hozer- Kocmiel and dr Sandra Misiak-Kwit, University of Szczecin.
The concept of the WCE® draws on a Winnet Model which combines the-
ory and practice and is based on cooperation between public administration, policy and decision makers, business, non-governmental organizations and academia in order to improve social and economic situation of women at all levels (Quadruple Helix principle). So far, the Winnet model was implemented through Winnet Women’s Resource Centers (WRCs), a non profit womens movement and institution created in Sweden in the nineties. The WRCs have contributed to increase women`s participation on a broad and not segretat-ed labor market, female entrepreneurship and innovation, incuding in ICT sector, in crossborder co-operation and in rural development. Establishing the WCE® has strengthen Winnet organisations at local, regional, national and European levels providing support through policy oriented research and recommendations.

Joint projects implemented by members of the Winnet Center of Excellence®:• Winnet Eastern Partnership (2016 – 2017), Swedish Institute Baltic Sea Co-
operation. The main objective is the implementation of the Winnet Model in the EAP countries;
• Thematic Partnership Winnet Baltic Sea Region, Winnet BSR, Swedish In-
stitute (2013 - 2016) - One of the aim is to create the BSR Partnership Platform for Gender, Innovation and Sustainable Development;
• Going abroad, South Baltic Programme (2011 - 2012) - Project aimed to strengthen the position of female entrepreneurs with micro-businesses;
• FEM - Female Entrepreneurs Meetings in the Baltic Sea Region, Baltic Sea Region Interreg III B (August 2004 - July 2007) - The aim of FEM was to strengthen the structures that support women’s entrepreneurship through co-operation and the exchange of knowledge and best practices;
• W.IN.NET Europe, Interreg IIIC (2006 - 2008) - The aim was to create WINNET Europe - the European Association of Women Resource Centres;
• Women In Net 8, WINNET8, Interreg IVC (2010 - 2011) - The objective was to contribute to regional growth by improving women’s participation in the labour market, focusing on: the lack of women in innovation and technology, the lack of women in entrepreneurship.
More information about us and our activities can be found on the website: http://www.balticsearegion.org/
If you would like to be a member or an associated partner of WCE® or have any question concerning our activities, please contact us. You can reach us under the addresses given below.
Co-founders and coordinators of Winnet Centre of Excellence®:Marta Hozer-Koćmiel, Department of Statis-
tics, Faculty of Economics and Management, University of Szczecin, [email protected]
Sandra Misiak-Kwit, Department of Human Capital Management, Faculty of Economics and Management, University of Szczecin, [email protected]