university system of marylandcomptroller.marylandtaxes.gov/vendor_services/accounting... · the...
TRANSCRIPT

UNIVERSITY SYSTEM OF MARYLAND
Financial Statements and Supplemental Data Together with Report of Independent Public Accountants
For the Years Ended June 30, 2013 and 2012
Page REPORT OF INDEPENDENT PUBLIC ACCOUNTANTS 1 MANAGEMENT'S DISCUSSION AND ANALYSIS 3 FINANCIAL STATEMENTS FOR THE YEARS ENDED JUNE 30, 2013 AND 2012: Balance Sheet, University System of Maryland 11 Combining Balance Sheet, Component Units 12 Statement of Revenues, Expenses and Changes in Net Position, University System of Maryland 14 Combining Statement of Activities, Component Units 15 Statement of Cash Flows, University System of Maryland 17
Notes to Financial Statements 18 SUPPLEMENTAL DATA: Balance Sheet, Statement of Revenues, Expenses and Changes in Net Position, and Statement of Cash Flows for: University of Maryland, Baltimore 44 University of Maryland, College Park 47 Bowie State University 50 Towson University 53 University of Maryland Eastern Shore 56 Frostburg State University 59 Coppin State University 62 University of Baltimore 65 Salisbury University 68 University of Maryland University College 71 University of Maryland, Baltimore County 74 University of Maryland Center for Environmental Science 77 University System of Maryland Office 80
Combining Balance Sheets, Non-major Component Units 83 Combining Statements of Activities, Non-major Component Units 85
Notes to Supplemental Data 87
200 International Circle Suite 5500 Hunt Valley Maryland 21030 P 410-584-0060 F 410-584-0061
REPORT OF INDEPENDENT PUBLIC ACCOUNTANTS
To the Board of Regents
University System of Maryland
Report on the Financial Statements
We have audited the accompanying financial statements of the University System of Maryland (the
System), and its discretely presented component units, as of and for the years ended June 30, 2013 and
2012, which collectively comprise the System’s basic financial statements as listed in the table of
contents.
Management’s Responsibility for the Financial Statements
The System’s management is responsible for the preparation and fair presentation of these financial
statements in accordance with accounting principles generally accepted in the United States of America;
this includes the design, implementation, and maintenance of internal control relevant to the preparation
and fair presentation of financial statements that are free from material misstatement, whether due to
fraud or error.
Auditor’s Responsibility
Our responsibility is to express an opinion on these financial statements based on our audits. We audited
the component unit financial statements of UMBC Research Park Corporation, Inc. and the Bowie State
University Foundation, Inc. We did not audit the financial statements of the other component units, which
represent 99 percent, 99 percent, and 98 percent, respectively, of the total assets, net assets and
unrestricted revenue of the total component units. Those financial statements were audited by other
auditors whose reports thereon has been furnished to us, and our opinion, insofar as it relates to the
amounts included for those component units, is based on the reports of the other auditors. We conducted
our audits in accordance with auditing standards generally accepted in the United States of America.
Those standards require that we plan and perform the audits to obtain reasonable assurance about whether
the financial statements are free from material misstatement.
An audit involves performing procedures to obtain audit evidence about the amounts and disclosures in
the financial statements. The procedures selected depend on the auditor’s judgment, including the
assessment of the risks of material misstatement of the financial statements, whether due to fraud or error.
In making those risk assessments, the auditor considers internal control relevant to the entity’s preparation
and fair presentation of the financial statements in order to design audit procedures that are appropriate in
the circumstances, but not for the purpose of expressing an opinion on the effectiveness of the entity’s
internal control. Accordingly, we express no such opinion. An audit also includes evaluating the
appropriateness of accounting policies used and the reasonableness of significant accounting estimates
made by management, as well as evaluating the overall presentation of the financial statements.
We believe that the audit evidence we and other auditors have obtained is sufficient and appropriate to
provide a basis for our audit opinion.

2
Opinion
In our opinion, based on our audits and the reports of other auditors, the financial statements referred to
above present fairly, in all material respects, the respective financial position of the System and its
discretely presented component units as of June 30, 2013 and 2012, and the respective changes in
financial position and, as applicable, cash flows thereof for the years then ended in accordance with
accounting principles generally accepted in the United States of America.
Other Matters
Required Supplementary Information
Accounting principles generally accepted in the United States of America require that the Management’s
Discussion and Analysis as listed in the table of contents be presented to supplement the basic financial
statements. Such information, although not a part of the basic financial statements, is required by the
Governmental Accounting Standards Board who considers it to be an essential part of financial reporting
for placing the basic financial statements in an appropriate operational, economic, or historical context.
We have applied certain limited procedures to the required supplementary information in accordance with
auditing standards generally accepted in the United States of America, which consisted of inquiries of
management about the methods of preparing the information and comparing the information for
consistency with management’s responses to our inquiries, the basic financial statements, and other
knowledge we obtained during our audit of the basic financial statements. We do not express an opinion
or provide any assurance on the information because the limited procedures do not provide us with
sufficient evidence to express an opinion or provide any assurance.
Supplementary and Other Information
Our audits were conducted for the purpose of forming an opinion on the financial statements that
collectively comprise the System’s basic financial statements. The supplemental information as listed in
the table of contents is presented for purposes of additional analysis and is not a required part of the basic
financial statements.
The supplemental information is the responsibility of management and was derived from and relates
directly to the underlying accounting and other records used to prepare the basic financial statements.
Such information has been subjected to the auditing procedures applied in the audit of the basic financial
statements and certain additional procedures, including comparing and reconciling such information
directly to the underlying accounting and other records used to prepare the basic financial statements or to
the basic financial statements themselves, and other additional procedures in accordance with auditing
standards generally accepted in the United States of America. In our opinion, the information is fairly
stated, in all material respects, in relation to the basic financial statements as a whole.
Hunt Valley, Maryland
November 15, 2013

3
UNIVERSITY SYSTEM OF MARYLAND MANAGEMENT’S DISCUSSION AND ANALYSIS YEARS ENDED JUNE 30, 2013 AND 2012 The management of the University System of Maryland (the System), provides the readers of the System’s financial statements with this narrative overview and analysis of the financial activities of the System for the years ended June 30, 2013 and 2012. Financial Highlights § Unrestricted net position increased by $122,678,729, for the year ended June 30, 2013 compared to an
increase of $185,192,546 for the year ended June 30, 2012. § State appropriations for the System increased by .7% for the year ended June 30, 2013 to
$1,070,834,339. For the year ended June 30, 2012, State appropriations increased by 1.8% from the amount received in the year ended June 30, 2011.
§ Tuition and fees, after deducting Scholarship Allowances, increased by $21,102,066 or 1.8% for the year
ended June 30, 2013. During the year ended June 30, 2012, net Tuition and fees, increased by $80,672,778, or 7.4%.
§ Investment income on Endowment assets amounted to $13,403,564, an investment return of 7.0%, for the
year ended June 30, 2013. For the year ended June 30, 2012, investment income on Endowment assets was $1,267,272, representing investment returns of .6%.
Overview of the Financial Statements The System's financial statements consist of three basic financial statements and the notes that provide information on the accounting alternatives used, financial statements for discretely presented component units, and explanatory information and detail on certain financial statement elements. The three basic financial statements are the Balance Sheet, the Statement of Revenues, Expenses and Changes in Net Position, and the Statement of Cash Flows. The Balance Sheet presents information on the System's assets, liabilities, deferred inflows of resources, and net position, all as of the end of the reporting period. Net position represent the difference between assets and liabilities plus deferred inflow of resources, and is detailed into classifications that help readers understand the constraints that the System must consider in making decisions on expending assets. Over time, changes in net position can help in understanding whether the financial condition of the System is improving or deteriorating. The Statement of Revenues, Expenses and Changes in Net Position presents information on the changes in net position during the year. All changes in net postion are reported as soon as the underlying event takes place, regardless of the timing of the related cash flows. Thus, revenue and expenses are recorded for some items that will result in cash flows in future fiscal years (for example tuition and fees owed by students, or vacation earned by employees but not used as of the date of the financial statements).

4
UNIVERSITY SYSTEM OF MARYLAND MANAGEMENT’S DISCUSSION AND ANALYSIS YEARS ENDED JUNE 30, 2013 AND 2012 The Statement of Cash Flows presents information on sources and uses of cash during the year. This statement details the changes in cash and cash equivalents from the amounts reported at the end of the preceding year, to the amounts reported in the Balance Sheet as of the end of the current year. Sources and uses are organized into operating activities, noncapital financing activities, capital and related financing activities, and investing activities. The System's financial statements include all accounts and balances of the System (considered the primary government, in accounting terms), as well as 19 legally-separate and distinct entities for which the System is financially accountable, which are considered component units. Of the 19 component units, three are considered major component units due to their significance in terms of size, while the rest are considered non-major component units. The focus of this Management’s Discussion and Analysis is on the System itself. Reference should be made to the separately audited financial statements of the component units for additional information. Financial Analysis As of June 30, 2013, the System's financial health remains strong, with assets exceeding liabilities by $5,423,238,018, shown on the Balance Sheet as total net position. This compares with total net position of $5,058,483,979, as of June 30, 2012. As suggested earlier, when viewed over time, net position may be useful as an indicator of financial health. For the year ended June 30, 2013, total net position increased by $364,754,039. Net investment in capital assets increased by $248,090,907, while unrestricted net position increased by $122,678,729, and restricted net position categories decreased by $6,015,597. Unrestricted net position represent the portion of assets, after taking into account liabilities, which can be used to meet ongoing obligations and fund new initiatives. The $122,678,729 increase in unrestricted net position for the year ended June 30, 2013, is attributable to continuing institutional efforts to limit expenditures, as well as efforts to accumulate resources to provide for future facilities needs and renewal and renovation requirements. As of June 30, 2012, the System's assets exceeded liabilities by $5,058,483,979. This compares with total net position of $4,671,599,419 as of June 30, 2011. For the year ended June 30, 2012, total net position increased by $386,884,560. Net investment in capital assets increased by $200,205,243, while unrestricted net position increased $185,192,546, and restricted net position categories increased by $1,486,771. The $185,192,546 increase in unrestricted net position for the year ended June 30, 2012, is attributable to enrollment increases beyond that budgeted, continuing institutional efforts to limit expenditures, as well as efforts to accumulate resources to provide for future facilities needs and renewal and renovation requirements.

5
UNIVERSITY SYSTEM OF MARYLAND MANAGEMENT’S DISCUSSION AND ANALYSIS YEARS ENDED JUNE 30, 2013 AND 2012 The table below presents summary-level information of the System’s assets, liabilities, and net position as of June 30, 2013, 2012 and 2011.
Condensed Balance Sheet June 30, 2013, 2012 and 2011
2013 2012 2011 Current and other assets $2,425,856,576 $2,316,223,582 $2,108,263,552 Capital assets, net 5,273,348,180 5,013,671,829 4,329,368,105
Total assets $7,699,204,756 $7,329,895,411 $6,437,631,657
Debt and obligations under capital lease agreements
$1,195,778,354
$1,170,358,857
$1,129,222,003
Other liabilities 699,476,706 668,651,521 636,810,235
Total liabilities 1,895,255,060 1,839,010,378 1,766,032,238 Deferred service concession arrangement receipts Net position:
380,711,678
432,401,054
Net investment in capital assets 3,733,261,041 3,485,170,134 3,284,964,891 Restricted 247,865,966 253,881,563 252,394,792 Unrestricted 1,442,111,011 1,319,432,282 1,134,239,736
Total net position 5,423,238,018 5,058,483,979 4,671,599,419
Total liabilities, deferred inflow of resources and net position
$7,699,204,756
$7,329,895,411
$6,437,631,657

6
UNIVERSITY SYSTEM OF MARYLAND
MANAGEMENT’S DISCUSSION AND ANALYSIS
YEARS ENDED JUNE 30, 2013 AND 2012
The table below presents summary-level information on revenues, expenses, and other changes in the System’s net assets for the years ended June 30, 2013, 2012 and 2011.
The System's operating revenues arise from activities associated with its core mission: education, research, and public service. For the years ended June 30, 2013, 2012 and 2011, operating revenues, which under the definitions used by the Governmental Accounting Standards Board (GASB) excludes state appropriations, are detailed below:
2013 2012 2011
$ % $ % $ %
Tuition and fees $1,187,769,356 37.3% $1,166,667,290 37.2% $1,085,994,512 36.0% Contracts and grants 1,097,258,431 34.5% 1,109,702,556 35.3% 1,142,425,581 37.8 Sales and services of educational departments
287,007,719
9.0%
257,697,032
8.2%
243,851,740
8.1
Auxiliary enterprises 551,408,145 17.3% 548,111,213 17.5% 490,116,309 16.2 Other operating 61,658,055 1.9% 57,953,000 1.8% 57,949,617 1.9
Total $3,185,101,706 100.0% $3,140,131,091 100.0% $3,020,337,759 100.0%
Tuition and fees reflect increases in resident undergraduate and graduate student rates, and non-resident rates and other student charges enacted the for years ended 2013, 2012 and 2011. Enrollment declined slightly between 2013 and 2012 compared to a modest increase in enrollment in 2012 and 2011, most notably at the University of Maryland University College. Fee increases for residence halls and dining facilities account for the increase in revenue from auxiliary enterprise activities.
Condensed Statement of Revenues, Expenses and Changes in Net Position
Years ended June 30, 2013, 2012 and 2011
2013 2012 2011
Operating revenues $3,185,101,706) $3,140,131,091) $3,020,337,759)
Operating expenses 4,293,338,895) 4,161,427,083) 3,998,175,888)
Operating loss (1,108,237,189) (1,021,295,992) (977,838,129)
State appropriations 1,070,834,339) 1,063,371,086) 1,044,674,552)
Other nonoperating 212,230,547) 163,051,998) 201,250,448)
Total nonoperating 1,283,064,886) 1,226,423,084) 1,245,925,000)
Income before other revenues
174,827,697)
205,127,092)
268,086,871)
Other revenues 189,926,342) 181,757,468) 198,180,842)
Increase in net position
364,754,039)
386,884,560)
466,267,713)
Net position, beginning of year 5,058,483,979) 4,671,599,419) 4,205,331,706)
Net position, end of year $5,423,238,018)
$5,058,483,979) $4,671,599,419)

7
UNIVERSITY SYSTEM OF MARYLAND
MANAGEMENT’S DISCUSSION AND ANALYSIS
YEARS ENDED JUNE 30, 2013 AND 2012
For the years ended June 30, 2013, 2012 and 2011, operating expenses are detailed below:
Operating expenses are detailed by (1) employee costs, (2) payments to suppliers, contractors and other, and (3) depreciation expense in the notes to the financial statements, in order to provide an alternative presentation of operating expenses. For the year ended June 30, 2013, increases in employee payments of $95,355,996, represent the largest component of the overall increase in operating expenses over the year ended June 30, 2012, with the largest increase associated with employee payments for instruction activities. For the year ended June 30, 2012, increases in employee payments of $133,323,249, represent the largest component of the overall increase in operating expenses over the year ended June 30, 2011, with the largest increase associated with employee payments for instruction activities. For the year ended June 30, 2011, increases in employee payments account for the largest component of the overall increase in operating expenses of $133,450,196, over the year ended June 30, 2010, with the largest increase associated with employee payments for instruction activities.
2013 2012 2011
$ % $ % $ %
Instruction $1,139,913,339 26.5% $1,101,099,773 26.5% $1,034,072,780 25.9% Research 931,958,951 21.7% 922,874,070 22.2% 945,626,792 23.7% Public service 152,996,481 3.6% 157,554,254 3.8% 148,391,096 3.7% Academic support 411,613,583 9.6% 380,187,264 9.1% 349,062,701 8.7% Student services 198,424,948 4.6% 192,285,983 4.6% 178,781,303 4.5% Institutional support 386,575,951 9.0% 364,278,425 8.8% 354,617,377 8.9% Operation & maintenance of plant
298,788,447
7.0%
316,887,436
7.6%
309,762,858
7.7%
Scholarships and fellowships 100,959,500 2.4% 90,510,504 2.2% 91,965,556 2.3% Auxiliary enterprises 498,923,433 11.6% 480,543,544 11.5% 444,579,270 11.1% Hospital 173,184,262 4.0% 155,205,830 3.7% 141,316,155 3.5%
Total $4,293,338,895 100.0% $4,161,427,083 100.0% $3,998,175,888 100.0%

8
UNIVERSITY SYSTEM OF MARYLAND MANAGEMENT’S DISCUSSION AND ANALYSIS YEARS ENDED JUNE 30, 2013 AND 2012 Capital Asset and Debt Administration The System continually makes investments in facilities necessary to achieve long-term objectives resulting from:
• State-wide public policy goals, • System-wide strategic planning, • institutional facilities master planning, • projected enrollment growth, • projected research space needs, and • maintainance and renewal needs for existing facilities.
Funding sources for additions to capital facilities and equipment for the last three fiscal years ended June 30, were funded through:
Funding source 2013 2012 2011 State of Maryland debt proceeds or cash balances $149,231,513 $172,854,822 $176,161,090 System debt proceeds 159,223,347 133,013,284 180,139,550 System cash balances or donations 218,842,585 186,301,220 211,893,224
Total $527,297,445 $492,169,326 $568,193,864 Over the past three fiscal years ended June 30, major projects completed or placed in service are as follows:
Project Institution Cost Year ended June 30, 2013 John and Frances Angelos Law Center University of Baltimore $107,279,000 Towson Center Arena Towson University 73,000,000 Year ended June 30, 2012 Performing Arts and Humanties Facility University of Maryland Baltimore County 81,703,000 College of Liberal Arts Towson University 78,325,000 Performing Arts Center Bowie State University 67,453,000 Year ended June 30, 2011 Pharmacy Hall Addition and Renovation University of Maryland Baltimore 85,789,000 Oakland Hall Residence University of Maryland College Park 81,000,000 Perdue School of Business Salisbury University 50,553,000 Seagull Square Salisbury University 41,000,000
9
UNIVERSITY SYSTEM OF MARYLAND MANAGEMENT’S DISCUSSION AND ANALYSIS YEARS ENDED JUNE 30, 2013 AND 2012 In August 2003, the System issued Revolving Loan Program Bonds to provide a pool of funds to finance the acquisition of personal property on a revolving basis. The Revolving Loan Program Bonds, currently outstanding in the amount of $35,000,000, mature on July 1, 2023. In May 2009, the securities were remarketed at an annual interest rate of 0.55% for the period June 1, 2009 through May 31, 2010. On June 1, 2010, the securities were successfully remarketed on a multi-annual interest rate basis at an interest rate of 1.50%. On June 1, 2013, the System redeemed $15,000,000 of the Revolving Loan Program Bonds. The remaining principal balance of $35,000,000 was remarketed for five years at a multi-annual interest rate of 1.25%. The System has issued revenue bonds to fund the construction, acquisition, and renewal and replacement of facilities, or refinance previously issued revenue bonds to realize lower current interest rates, during the years ended June 30, 2012 and 2013, and since, as follows: Revenue Bond Issuance
Date
Purpose
Total Par
Value Issued
Present Value of Future Debt
Service Savings
2011 Series A and B
10/20/2011
Refinancing, construction and facilities renewal
$153,075,000
$1,357,495
2012 Series A and B 2/9/2012 Refinancing 70,825,000 9,054,411 2012 Series C and D 10/6/2012 Refinancing, construction and
facilities renewal 169,005,000 5,281,851
The System continually pursues opportunities to reduce its overall effective cost of capital financing, and as conditions in the financial markets allow, refinances previously issued debt with new debt at lower interest costs. Economic Factors and Next Year’s Budget and Rates Enrollment demand, availability of funding for contracts and grants, and the State of Maryland support through both operating and capital appropriations are the three most significant drivers of the System’s revenue base. Across all student categories, enrollment is expected to continue to increase over the next ten years, with more than 16% more full-time equivalent students anticipated by the fall 2022. Preliminary fall 2013 enrollment indicates a slight decline in headcount enrollment, reflecting demographic changes in high school graduation numbers, the impact of lack of state financial support for enrollment growth, and a strengthening employment situation. The University of Maryland, College Park, the University of Maryland, Baltimore, and the University of Maryland, Baltimore County each have considerable numbers of faculty that pursue research grants and other sponsored funding arrangements. Indirect cost recoveries associated with contract and grants are an important funding source for institution’s administrative costs. The Federal Budget Control Act places limits on Federal government spending commonly referred to as sequestration. These limits have constrained Federal spending on research activities, will reduce indirect cost recoveries generally, and will continue, unless Congress and the President agree upon and enact legislation that relieves the constraints on governmental spending currently in place.

10
UNIVERSITY SYSTEM OF MARYLAND MANAGEMENT’S DISCUSSION AND ANALYSIS YEARS ENDED JUNE 30, 2013 AND 2012 In February of 2009, as part of the American Recovery and Reinvestment Act, the Federal government established a program where tax-exempt issuers of debt would issue bonds, referred to as Build America Bonds, which would produce interest income that is taxable to those who buy and hold the bonds. Under the terms of the program, which ended December 31, 2010, the Federal government is to reimburse the issuer for 35% of the interest payments made on Build America Bonds. The University System of Maryland has issued and outstanding $206,465,000 of Build America Bonds. The Federal Budget Control Act (or sequestration), also impacts the Federal government subsidy of Build America Bond interest payments, and until the effects of sequestration are relieved or changed, the System expects interest subsidies reduced to be by approximately 8.7%. This reduction in interest subsidies at an 8.7% reduction, will amount to approximately $325,000 per year. The first reduction in Federal interest subsidy happened in September 2013. As a region with a significant Federal government employee population, the potential for significant reductions in Federal spending in all likelihood will have serious implications for state tax revenues, both from income as well as sales taxes. The State government closely monitors revenue receipts and revises projections on a quarterly basis. As an economic engine for the entire state and region, System officials point out the impact that proposed reductions of State funding provided to higher education would have on state-wide economic activity and work-force development. Personnel costs account for more than two-thirds of the System’s noncapital spending. Healthcare costs and the adoption of a state-wide funding strategy for providing for retiree’s healthcare costs are expected to be significant considerations for the System’s future spending levels. Requests for Information This financial report is intended to provide a general overview of the System’s finances. Questions concerning any of the information provided in this report, or requests for additional information should be addressed to the Office of the Vice Chancellor for Administration and Finance and Chief Operating Officer, 3300 Metzerott Road, Adelphi, MD 20783.

UNIVERSITY SYSTEM OF MARYLANDBALANCE SHEET
JUNE 30, 2013 AND 2012
See accompanying notes.
11
June 30, June 30, 2013 2012
ASSETSCurrent assets:
Cash and cash equivalents $1,820,390,529 $1,653,689,625Accounts receivable, net 268,855,816 282,367,444Notes receivable, current portion, net 7,728,081 7,731,196Inventories 10,271,714 11,889,509Prepaid expenses and deferred charges 9,038,098 7,092,331
Total current assets 2,116,284,238 1,962,770,105
Noncurrent assets:Restricted cash and cash equivalents 51,390,989 75,673,619Endowment investments 192,920,622 190,279,721Restricted investments 21,875,318Other investments 6,693,185 5,128,471Notes receivable, net 58,567,542 60,496,348Capital assets, net 5,273,348,180 5,013,671,829
Total noncurrent assets 5,582,920,518 5,367,125,306
Total assets $7,699,204,756 $7,329,895,411
LIABILITIESCurrent liabilities:
Accounts payable and accrued liabilities $310,619,251 $272,522,879Accrued workers' compensation, current portion 4,375,805 4,438,425Accrued vacation costs, current portion 89,344,370 83,198,226Revenue bonds and notes payable, current portion 79,050,151 80,770,694Obligations under capital lease agreements, current portion 1,104,394 296,434Deferred revenue 177,345,393 191,690,521
Total current liabilities 661,839,364 632,917,179
Noncurrent liabilities:Accrued workers' compensation 23,855,195 24,196,575Accrued vacation costs 93,936,692 92,604,895Revenue bonds and notes payable 1,104,318,155 1,075,822,504Obligations under capital lease agreements 11,305,654 13,469,225
Total noncurrent liabilities 1,233,415,696 1,206,093,199
Total liabilities 1,895,255,060 1,839,010,378
DEFERRED INFLOWS OF RESOURCESDeferred service concession arrangement receipts 380,711,678 432,401,054
NET POSITIONUnrestricted 1,442,111,011 1,319,432,282Net investment in capital assets 3,733,261,041 3,485,170,134Restricted:
Nonexpendable:Scholarships and fellowships 15,729,733 13,147,768Research 4,055,554 4,033,185Other 16,518,773 16,517,485
Expendable:Scholarships and fellowships 37,653,479 36,791,120Research 69,959,016 69,334,753Loans 71,207,868 72,533,907Capital projects 5,651,220 15,055,226Other 27,090,323 26,468,119
Total net position 5,423,238,018 5,058,483,979
Total liabilities, deferred inflows of resources and net position $7,699,204,756 $7,329,895,411

See accompanying notes.
12
UNIVERSITY SYSTEM OF MARYLANDCOMBINING BALANCE SHEET, COMPONENT UNITS
JUNE 30, 2013
University University of University System of Maryland Maryland
of Maryland College Park Baltimore Total NonmajorFoundation, Inc. Foundation, Inc. Foundation, Inc. Component Units Total
ASSETSCurrent assetsCash $134,000 $17,426,872 $157,014 $24,903,989 $42,621,875Accounts receivable, net 74,598,000 28,292,348 14,510,723 4,937,729 122,338,800 Other assets 282,000 184,488 534,402 1,000,890
Total current assets 75,014,000 45,903,708 14,667,737 30,376,120 165,961,565
InvestmentsEndowment investments 225,682,000 244,725,820 128,291,957 180,117,272 778,817,049 Other investments 284,021,000 53,369,262 53,533,012 25,493,472 416,416,746
Total investments 509,703,000 298,095,082 181,824,969 205,610,744 1,195,233,795
Other assetsAccounts receivable, net 5,119,000 25,864,477 15,377,755 12,708,083 59,069,315 Capital assets, net 10,382,000 100,000 5,833,980 16,315,980 Other assets 407,000 777,840 5,179,829 4,014,258 10,378,927
Total other assets 15,908,000 26,742,317 20,557,584 22,556,321 85,764,222
Total assets $600,625,000 $370,741,107 $217,050,290 $258,543,185 $1,446,959,582
LIABILITIESCurrent liabilitiesAccounts payable & accrued expenses $71,064,000 $4,880,957 $1,600,761 $5,745,564 $83,291,282Long-term debt, current 1,948,018 1,948,018 Deferred income 2,315,000 2,158,683 7,272,025 11,745,708
Total current liabilities 73,379,000 7,039,640 1,600,761 14,965,607 96,985,008
Other liabilitiesOther payables 46,728,768 3,146,534 1,234,403 3,829,739 54,939,444 Due to primary government 192,797,232 192,797,232 Long-term debt, noncurrent 318,014 318,014
Total other liabilities 239,526,000 3,146,534 1,234,403 4,147,753 248,054,690
Total liabilities 312,905,000 10,186,174 2,835,164 19,113,360 345,039,698
NET ASSETSUnrestricted 62,731,000 10,265,864 20,128,368 33,164,013 126,289,245 Temporarily restricted:
Scholarships & fellowships 19,289,000 37,446,000 7,226,401 21,881,400 85,842,801 Research 11,625,000 9,957,000 8,511,724 627,004 30,720,728 Other 34,422,000 91,724,328 55,277,255 56,540,201 237,963,784
Permanently restricted:Scholarships & fellowships 88,415,000 76,829,000 27,534,841 68,770,894 261,549,735 Research 2,340,000 1,081,000 1,010,474 356,478 4,787,952 Other 68,898,000 133,251,741 94,526,063 58,089,835 354,765,639
Total net assets 287,720,000 360,554,933 214,215,126 239,429,825 1,101,919,884
Total liabilities and net assets $600,625,000 $370,741,107 $217,050,290 $258,543,185 $1,446,959,582
Major Component Units

See accompanying notes.
13
UNIVERSITY SYSTEM OF MARYLANDCOMBINING BALANCE SHEET, COMPONENT UNITS
JUNE 30, 2012
University University of University System of Maryland Maryland
of Maryland College Park Baltimore Total NonmajorFoundation, Inc. Foundation, Inc. Foundation, Inc. Component Units Total
ASSETSCurrent assetsCash $714,000 $22,403,012 $31,320,867 $54,437,879Accounts receivable, net 5,916,000 36,360,828 $13,548,212 9,776,299 65,601,339 Other assets 241,000 102,278 760,458 1,103,736
Total current assets 6,871,000 58,866,118 13,548,212 41,857,624 121,142,954
InvestmentsEndowment investments 214,762,000 222,672,248 113,710,602 164,177,009 715,321,859 Other investments 280,545,000 46,215,332 53,193,380 17,672,634 397,626,346
Total investments 495,307,000 268,887,580 166,903,982 181,849,643 1,112,948,205
Other assetsAccounts receivable, net 2,910,000 32,069,335 12,115,645 7,306,245 54,401,225 Capital assets, net 10,009,000 100,000 5,788,292 15,897,292 Other assets 432,000 1,008,450 5,020,298 8,367,419 14,828,167
Total other assets 13,351,000 33,177,785 17,135,943 21,461,956 85,126,684
Total assets $515,529,000 $360,931,483 $197,588,137 $245,169,223 $1,319,217,843
LIABILITIESCurrent liabilitiesAccounts payable & accrued expenses $2,824,000 $1,834,267 $3,108,741 $2,832,810 $10,599,818Long-term debt, current 1,056,350 1,056,350 Deferred income 1,470,000 755,546 6,552,116 8,777,662
Total current liabilities 4,294,000 2,589,813 3,108,741 10,441,276 20,433,830
Other liabilitiesOther payables 43,993,109 3,314,392 1,002,708 3,716,781 52,026,990 Due to primary government 190,171,891 190,171,891 Long-term debt, noncurrent 2,272,485 2,272,485
Total other liabilities 234,165,000 3,314,392 1,002,708 5,989,266 244,471,366
Total liabilities 238,459,000 5,904,205 4,111,449 16,430,542 264,905,196
NET ASSETSUnrestricted 65,951,000 12,854,849 19,113,761 31,391,289 129,310,899 Temporarily restricted:
Scholarships & fellowships 19,388,000 34,658,000 6,474,949 12,309,934 72,830,883 Research 12,558,000 8,394,000 7,493,869 558,717 29,004,586 Other 31,314,000 95,479,256 47,174,676 64,349,615 238,317,547
Permanently restricted:Scholarships & fellowships 82,177,000 65,623,000 26,071,731 70,416,205 244,287,936 Research 2,291,000 1,055,000 1,003,631 251,323 4,600,954 Other 63,391,000 136,963,173 86,144,071 49,461,598 335,959,842
Total net assets 277,070,000 355,027,278 193,476,688 228,738,681 1,054,312,647
Total liabilities and net assets $515,529,000 $360,931,483 $197,588,137 $245,169,223 $1,319,217,843
Major Component Units

UNIVERSITY SYSTEM OF MARYLANDSTATEMENT OF REVENUES, EXPENSES AND CHANGES IN NET POSITION
YEARS ENDED JUNE 30, 2013 AND 2012
See accompanying notes.
14
Year ended June 30, Year ended June 30, 2013 2012
OPERATING REVENUES:Tuition and fees $1,433,382,221 $1,403,570,031Less: scholarship allowances (245,612,865) $1,187,769,356 (236,902,741) $1,166,667,290Federal grants and contracts 691,994,706 723,008,546 State and local grants and contracts 188,065,280 175,216,123 Nongovernmental grants and contracts 217,198,445 211,477,887 Sales and services of educational departments 287,007,719 257,697,032 Auxiliary enterprises:
Residential facilities 163,147,129 161,811,133 Less: scholarship allowances (13,346,944) 149,800,185 (11,592,037) 150,219,096
Dining facilities 115,694,298 114,536,929 Less: scholarship allowances (8,165,031) 107,529,267 (6,863,867) 107,673,062
Intercollegiate athletics 95,851,126 97,424,482 Less: scholarship allowances (4,603,108) 91,248,018 (4,233,267) 93,191,215
Bookstore 27,778,782 28,816,802 Less: scholarship allowances (1,599,367) 26,179,415 (1,530,243) 27,286,559
Parking facilities 38,875,667 41,176,924
Other auxiliary enterprises revenues 137,815,456 128,602,143 Less: scholarship allowances (39,863) 137,775,593 (37,786) 128,564,357
Other operating revenues 61,658,055 57,953,000
Total operating revenues 3,185,101,706 3,140,131,091
OPERATING EXPENSES:Instruction 1,139,913,339 1,101,099,773 Research 931,958,951 922,874,070 Public service 152,996,481 157,554,254 Academic support 411,613,583 380,187,264 Student services 198,424,948 192,285,983 Institutional support 386,575,951 364,278,425 Operation and maintenance of plant 298,788,447 316,887,436 Scholarships and fellowships 100,959,500 90,510,504 Auxiliary enterprises:
Residential facilities 136,208,180 119,746,524 Dining facilities 105,843,280 104,886,987 Intercollegiate athletics 89,937,185 94,824,576 Bookstore 27,352,051 26,841,606 Parking facilities 25,342,513 25,942,018 Other auxiliary enterprises expenses 114,240,224 108,301,833
Hospital 173,184,262 155,205,830
Total operating expenses 4,293,338,895 4,161,427,083
Operating loss (1,108,237,189) (1,021,295,992)
NONOPERATING REVENUES (EXPENSES):State appropriations 1,070,834,339 1,063,371,086 Pell grants 134,134,086 131,092,951 Gifts 44,631,760 42,770,704 Investment income 33,695,044 22,873,739 Less: Investment expense (703,636) 32,991,408 (734,646) 22,139,093 Interest on indebtedness (45,504,869) (43,587,538) Other revenues, (expenses), gains and (losses) 45,978,162 10,636,788
Total net nonoperating revenues 1,283,064,886 1,226,423,084
Income before other revenues 174,827,697 205,127,092
OTHER REVENUES:Capital appropriations 149,213,513 172,854,822 Capital gifts and grants 38,107,205 6,689,307 Additions to permanent endowments 2,605,624 2,213,339
Total other revenues 189,926,342 181,757,468
Increase in net position 364,754,039 386,884,560
Net position - beginning of year 5,058,483,979 4,671,599,419
Net position - end of year $5,423,238,018 $5,058,483,979

See accompanying notes.
15
UNIVERSITY SYSTEM OF MARYLANDCOMBINING STATEMENT OF NET ACTIVITIES, COMPONENT UNITS
YEAR ENDED JUNE 30, 2013
University University of University System of Maryland Maryland
of Maryland College Park Baltimore Total NonmajorFoundation, Inc. Foundation, Inc. Foundation, Inc. Component Units Total
CHANGES IN UNRESTRICTED NET ASSETSRevenuesContributions & grants $2,263,000 $8,109,072 $3,997,393 $14,369,465Investment income 3,892,000 $4,769,084 556,284 3,441,533 12,658,901 Other income 4,578,000 1,134,081 412,521 7,868,394 13,992,996 Assets released from restrictions 17,162,000 39,146,149 14,648,958 30,703,689 101,660,796
Total revenues 27,895,000 45,049,314 23,726,835 46,011,009 142,682,158
ExpensesProgram 21,252,681 46,345,339 20,184,448 36,907,747 124,690,215 General & administrative 5,052,000 1,107,025 1,595,456 3,492,784 11,247,265 Fundraising 4,792,000 185,935 950,643 1,106,068 7,034,646 Other expense 2,560,534 2,560,534
Total expenses 31,096,681 47,638,299 22,730,547 44,067,133 145,532,660
Transfer per Board resolution (18,319) 18,319
Change in unrestricted net assets (3,220,000) (2,588,985) 1,014,607 1,943,876 (2,850,502)
CHANGES IN TEMPORARILY RESTRICTED NET ASSETSContributions & grants 10,595,000 27,344,817 15,092,229 15,800,348 68,832,394 Investment income (loss) 8,663,000 12,562,037 9,408,615 15,982,887 46,616,539 Other income (loss) (364,965) 1,488,871 1,123,906 Assets released from restrictions (17,162,000) (38,945,817) (14,648,958) (31,439,473) (102,196,248) Transfer per Board resolution (20,000) 20,000
Change in temporarily restricted net assets 2,076,000 596,072 9,871,886 1,832,633 14,376,591
CHANGES IN PERMANENTLY RESTRICTED NET ASSETSContributions & grants 7,762,000 7,629,855 9,851,945 4,737,749 29,981,549 Investment income (loss) 4,032,000 1,425,659 5,457,659 Other income (loss) 91,045 15,443 106,488 Assets released from restrictions (200,332) 735,784 535,452
Change in permanently restricted net assets 11,794,000 7,520,568 9,851,945 6,914,635 36,081,148
Total change in net assets 10,650,000 5,527,655 20,738,438 10,691,144 47,607,237
Net assets - beginning of year 277,070,000 355,027,278 193,476,688 228,738,681 1,054,312,647
Net assets - end of year $287,720,000 $360,554,933 $214,215,126 $239,429,825 $1,101,919,884
Major Component Units

See accompanying notes.
16
UNIVERSITY SYSTEM OF MARYLANDCOMBINING STATEMENT OF NET ACTIVITIES, COMPONENT UNITS
YEAR ENDED JUNE 30, 2012
University University of University System of Maryland Maryland
of Maryland College Park Baltimore Total NonmajorFoundation, Inc. Foundation, Inc. Foundation, Inc. Component Units Total
CHANGES IN UNRESTRICTED NET ASSETSRevenuesContributions & grants $3,945,000 $39,100 $7,044,715 $5,783,247 $16,812,062Investment income 3,210,000 4,829,499 1,836,688 346,300 10,222,487 Other income 5,845,000 2,875,995 579,053 8,097,212 17,397,260 Assets released from restrictions 20,507,000 47,564,240 14,395,731 15,222,535 97,689,506
Total revenues 33,507,000 55,308,834 23,856,187 29,449,294 142,121,315
ExpensesProgram 21,358,499 49,246,012 19,179,192 23,484,690 113,268,393 General & administrative 4,795,000 1,046,455 1,472,371 4,359,261 11,673,087 Fundraising 3,428,000 244,760 579,756 1,163,823 5,416,339 Other expense 5,433,931 1,560,083 6,994,014
Total expenses 29,581,499 55,971,158 21,231,319 30,567,857 137,351,833
Transfer per Board resolution (13,501) 13,501
Change in unrestricted net assets 3,912,000 (662,324) 2,638,369 (1,118,563) 4,769,482
CHANGES IN TEMPORARILY RESTRICTED NET ASSETSContributions & grants 9,153,000 33,051,104 16,679,090 16,539,624 75,422,818 Investment income (loss) 9,608,068 (1,690,988) 243,130 (286,673) 7,873,537 Other income (loss) (332,074) 1,155,070 822,996 Assets released from restrictions (20,507,000) (48,055,862) (14,395,731) (15,627,815) (98,586,408) Transfer per Board resolution (520,068) 471,208 48,860
Change in temporarily restricted net assets (2,266,000) (16,556,612) 2,575,349 1,780,206 (14,467,057)
CHANGES IN PERMANENTLY RESTRICTED NET ASSETSContributions & grants 2,077,000 9,786,721 10,178,016 3,646,171 25,687,908 Investment income (loss) (9,941,000) 94,284 (9,846,716) Other income (loss) 3,000 (152,340) 13,800 (135,540) Assets released from restrictions 491,622 405,280 896,902
Change in permanently restricted net assets (7,861,000) 10,126,003 10,178,016 4,159,535 16,602,554
Total change in net assets (6,215,000) (7,092,933) 15,391,734 4,821,178 6,904,979
Net assets - beginning of year 283,285,000 362,120,211 178,084,954 223,917,503 1,047,407,668
Net assets - end of year $277,070,000 $355,027,278 $193,476,688 $228,738,681 $1,054,312,647
Major Component Units

UNIVERSITY SYSTEM OF MARYLANDSTATEMENT OF CASH FLOWS
YEARS ENDED JUNE 30, 2013 AND 2012
See accompanying notes.
17
Years ended June 30, 2013 2012
CASH FLOWS FROM OPERATING ACTIVITIESTuition and fees $1,187,346,510 $1,162,560,692Research contracts and grants 1,125,325,398 1,118,949,727 Payments to employees (2,809,241,146) (2,714,062,702) Payments to suppliers and contractors (1,175,107,072) (1,161,756,018) Loans issued to students (9,332,750) (12,811,230) Collections of loans to students 10,017,321 10,818,076 Auxiliary enterprises:
Residential facilities 130,380,620 124,951,037 Dining facilities 107,507,187 107,417,002 Intercollegiate athletics 72,164,684 92,146,351 Bookstore 25,998,462 33,473,871 Parking facilities 38,882,727 40,264,930 Other 137,423,886 128,940,543
Other receipts 407,644,252 383,627,098
Net cash used by operating activities (750,989,921) (685,480,623)
CASH FLOWS FROM NONCAPITAL FINANCING ACTIVITIESState appropriations 1,070,834,339 1,063,371,086 Gifts and grants received for other than capital purposes:
Private gifts for endowment purposes 2,605,624 948,423 Pell grants 134,134,086 131,092,951
Net cash provided by noncapital financing activities 1,207,574,049 1,195,412,460
CASH FLOWS FROM CAPITAL AND RELATED FINANCING ACTIVITIESProceeds of capital debt 186,517,107 241,423,290 Capital appropriations 149,213,513 172,231,887 Capital grants and gifts received 23,027,912 5,746,968 Proceeds from sales of capital assets 1,870,459 2,950,976 Purchases of capital assets (516,053,770) (485,775,230) Principal paid on debt and capital leases (156,040,603) (193,727,596) Interest paid on debt and capital leases (53,017,193) (51,011,102)
Net cash used by capital and related financing activities (364,482,575) (308,160,807)
CASH FLOWS FROM INVESTING ACTIVITIESProceeds from sales and maturities of investments 33,218,570 47,602,393 Interest on investments 18,610,882 20,909,372 Investment expense (927,297) (734,646) Purchases of investments (585,434) (23,275,053)
Net cash provided by investing activities 50,316,721 44,502,066
Net increase in cash and cash equivalents 142,418,274 246,273,096
Cash and cash equivalents - beginning of the year 1,729,363,244 1,483,090,148
Cash and cash equivalents - end of the year $1,871,781,518 $1,729,363,244
SUPPLEMENTAL SCHEDULE OF NONCASH INVESTING AND FINANCING ACTIVITIES:Gifts and transfer of capital assets $12,712,643 $685,885Changes in unrealized appreciation on investments 13,383,800 533,226 Capital assets related to service concession arrangements 457,423,762
RECONCILIATION OF OPERATING LOSS TO NET CASH USED BY OPERATING ACTIVITIES:Operating loss ($1,108,237,189) ($1,021,295,992)Adjustments to reconcile operating loss to net cash used by operating activities:Depreciation expense 264,593,814 260,357,159 Amortization of deferred service concession arrangement receipts (51,689,376) (25,022,708) Gifts and other revenues, (expenses), gains, and (losses) 90,609,922 53,407,492 Changes in assets and liabilities:Accounts receivables, net 13,511,628 16,203,449 Inventories 1,617,795 (185,850) Prepaid expenses and deferred charges (1,945,767) 1,114,745 Notes receivable 1,931,921 (882,903) Accounts payable, net and accrued liabilities 45,888,518 26,970,585 Deferred revenue (14,345,128) 2,097,381 Accrued vacation 7,477,941 664,254 Accrued workers' compensation (404,000) 1,091,765
Net cash used by operating activities ($750,989,921) ($685,480,623)

18
UNIVERSITY SYSTEM OF MARYLAND NOTES TO FINANCIAL STATEMENTS YEARS ENDED JUNE 30, 2013 AND 2012 1. ORGANIZATION AND PURPOSE The University System of Maryland (the System) is a component unit of the State of Maryland (the State) and is governed by its Board of Regents (the Board). The System comprises eleven degree-granting institutions, one research entity and an administrative unit. Its degree-granting institutions provide a full range of undergraduate, graduate, professional and continuing education opportunities for students. Its research and public service entities conduct basic and applied research, and transfer new technology to constituencies. The administrative unit includes the System Chancellor and staff who serve as support to the Board. 2. SUMMARY OF SIGNIFICANT ACCOUNTING POLICIES The significant accounting policies followed by the System are summarized below. Reporting Entity - The financial statements of the System include all funds and organizations included in the legal entity encompassed by the System, and other legally separate entities for which the System is financially accountable or which otherwise meet the criteria established by the Governmental Accounting Standards Board (GASB). Amounts held in System accounts on behalf of separately organized entities are included as assets, with a corresponding liability reflected. The System has recognized, as affiliated foundations, nineteen organizations created and operated in support of the interests of the System or any of the institutions that comprise the System. Each of these affiliated foundations are considered to (1) receive or hold economic resources that are to be used for the benefit of the System or its institutions, (2) receive or hold economic resources which the System or its institutions are entitled to or otherwise have the ability to access, and (3) are significant to the financial statements of the System or the institutions with which the foundation is affiliated. As a result, each of the eighteen affiliated foundations meet the criteria for inclusion in the financial reporting entity, and thus each of the affiliated foundations are shown in a discrete presentation. The University System of Maryland Foundation, Inc., the University of Maryland College Park Foundation, Inc., and the University of Maryland Baltimore Foundation, Inc. are considered major component units due to the significance of the financial statement amounts to the System and its financial statements.

19
UNIVERSITY SYSTEM OF MARYLAND NOTES TO FINANCIAL STATEMENTS YEARS ENDED JUNE 30, 2013 AND 2012 The following affiliated foundations are considered nonmajor component units:
Medical Alumni Association of the University of Maryland, Inc. M Club Foundation, University of Maryland, Inc. The Robert H. Smith School of Business Foundation, Inc. Harry R. Hughes Center for Agro-Ecology, Inc. Bowie State University Foundation, Inc. Towson University Foundation, Inc. Frostburg State University Foundation, Inc. Coppin State University Development Foundation, Inc. University of Baltimore Foundation, Inc. and University Properties, Inc. Salisbury University Foundation, Inc. The Ward Foundation, Inc. The Maryland 4-H Foundation, Inc. University Research Corporation International, Inc. The Maryland Center @ Bowie State University, Inc. University of Maryland, Baltimore County Research Park Corporation, Inc. Maryland Hawk Corporation
During the years ended June 30, 2013 and 2012, the foundations distributed approximately $106,696,000 and $96,454,000 respectively, to the System including its institutions for both restricted and unrestricted purposes. All of the System’s component units are nongovernmental entities that prepare financial statements using the principals and accounting standards promulgated by the Financial Accounting Standards Board (FASB). Complete financial statements of the affiliated foundations may be requested from the System’s Office of the Comptroller at 3300 Metzerott Road, Adelphi, MD 20783. The University of Maryland, Baltimore provides services to hospital and critical care facilities under contractual arrangements with the State. The expenditures relating to these activities are reported within the hospital functional category. The revenue derived from these activities are reported primarily as contract and grant revenue.
20
UNIVERSITY SYSTEM OF MARYLAND NOTES TO FINANCIAL STATEMENTS YEARS ENDED JUNE 30, 2013 AND 2012 Measurement Focus and Basis of Accounting - For financial reporting purposes, the System is considered a special-purpose government engaged only in business-type activities. Accordingly, the System’s financial statements have been presented using the economic resources measurement focus and the accrual basis of accounting. Under the accrual basis, revenue is recognized when earned, and expenses are recorded when an obligation has been incurred. Application of Accounting Standards - The System has the option to apply all FASB pronouncements issued after November 30, 1989, except for instances in which a pronouncement of the FASB conflicts with pronouncements of the GASB. The System has elected to not apply FASB pronouncements issued after November 30, 1989. When an expense is incurred that can be paid using either restricted or unrestricted resources, the System’s policy is to first apply the expense toward restricted resources and then toward unrestricted resources.
Operating and Nonoperating Revenue and Expenses - Operating revenue and expenses are generally associated with those activities that relate directly to the core activities of instruction, research and public service that form the essence of the System’s mission. Nonoperating revenue, expenses, gains and losses represent amounts that recur regularly but are not included in operating revenue and expenses. Generally accepted accounting principles defines State appropriations as nonoperating revenue. Cash and Cash Equivalents - Cash and cash equivalents include demand deposits with financial institutions, as well as highly liquid investments that are both readily convertible to known amounts of cash and are so near to their maturity that they present an insignificant risk of changes in value because of changes in interest rates. Only investments with an original maturity of three months or less satisfy the criteria for cash equivalents. Investments – Investments are valued at fair market value. Inventories - Inventories are valued at cost, determined under the first-in, first-out method, which is not in excess of net realizable value.

21
UNIVERSITY SYSTEM OF MARYLAND NOTES TO FINANCIAL STATEMENTS YEARS ENDED JUNE 30, 2013 AND 2012 Capital Assets - Property, plant, equipment, and books and materials which are part of a catalogued library, are stated principally at cost at the date of acquisition, or fair market value at the date of donation in the case of gifts. Personal property with an original cost of more than $5,000 and outlays for real property in excess of $250,000 are considered capital assets. Generally, the cost of all capital assets other than land, certain inexhaustible improvements to land, and collections of works of art are assigned to expense over a set of useful lives specific to the type of asset, using a straight-line method of depreciation. The range of useful lives used for the major categories of capital assets is:
Infrastructure and land improvements 20 - 25 years Buildings and improvements 20 - 40 years Contents 3 - 15 years
Depreciation expense is assigned to program expense based on the nature and use of the capital asset. Deferred Outflows/Inflows of Resources – In adition to assets, the statement of financial position wil sometimes report a separate section for deferred outflows of resources. This separate financial statement element, deferred outflows of resource, represents a consumption of net position that applies to a futher period(s) and will not be recognized as an outflow of resources (expense/expenditure) until then. In addition to liabilities, the statement of financial position will sometimes report a separate section for deferred inflows of resources. This separate financial statement element, deferred inflows of resources, represents an acquisition of net position that applies to a future period(s) and will not be recognized as an inflow of resources (revenue) until that time. Reclassifications – Certain amounts for the year ended June 30, 2012, have been reclassified to conform with the presentation for the year ended June 30, 2013. Pending change in accounting principles - In March 2012, the GASB issued GASB Statement #65, Items Previously Reported as Assets and Liabilities. GASB Statement #65 establishes accounting and financial reporting standards that reclassify, as deferred outflows of resources or deferred inflows of resources, certain items that were previously reported as assets and liabilities and recognizes, as outflows of resources or inflows of resources, certain items that were previously reported as assets and liabilities. The provisions of this Statement are effective for financial periods beginning after December 15, 2012. In March 2012, the GASB also issued GASB Statement #66, Technical Corrections—2012—an amendment of GASB Statements No. 10 and No. 62, which resolves conflicting guidance that resulted from the issuance of two pronouncements, Statements No. 54, Fund Balance Reporting and Governmental Fund Type Definitions, and No. 62, Codification of Accounting and Financial Reporting Guidance Contained in Pre-November 30, 1989 FASB and AICPA Pronouncements.

22
UNIVERSITY SYSTEM OF MARYLAND NOTES TO FINANCIAL STATEMENTS YEARS ENDED JUNE 30, 2013 AND 2012 The provisions of GASB Statement #66 are effective for financial periods beginning after December 15, 2012. In June 2012, GASB Statement #67, Financial Reporting for Pension Plan—an amendment of GASB Statement No. 25 was issued. This Statement establishes accounting and financial reporting requirements related to pensions. The provisions related to this Statement are effective for financial periods beginning after June 15, 2013. In June 2012, GASB Statement #68, Accounting and Financial Reporting for Pensions—an amendment of GASB Statement No. 27 was issued, providing new financial accounting recognition and presentation guidance relating to pension obligations in employer financial statements. The provisions of GASB Statement #68 are effective for financial periods beginning after June 15, 2014 and are expected to have a significant impact on the System’s financial statements. In January 2013, GASB Statement #69, Government Combinations and Disposals of Government Operations was issued. This Statement requires disclosures to be made about government combinantions and disposals of operations. The provisions of this Statement are effective for financial periods beginning after December 15, 2013. In April 2013, GASB Statement #70, Accounting and Financial Reporting for Nonexchange Financial Guarantees was issued. The objective of this Statement is to improve accounting and financial reporting by state and local governments that extend and receive nonexchange financial guarantees. This provisions of this Statement are effective for financial statements for reporting beginning after June 15, 2013. The System is in the process of assessing the impact of these new accounting standards and will present its financial statements for the year ended June 30, 2014, taking into account the requirements of GASB Statement #65, #66, #67 and #70 and will present its financial statements for the year ending June 30, 2015, taking into account the requirements of GASB Statement #68 and #69 . 3. CASH AND INVESTMENTS Cash and cash equivalents As of June 30, unrestricted cash and cash equivalents consisted of the following:
2013 2012 Cash and short-term investments on deposit with the State Treasurer
$1,776,421,823
$1,607,903,103
Demand and time deposits 43,968,706 45,786,522
Total $1,820,390,529 $1,653,689,625 The System does not have a formal policy addressing custodial credit risk.

23
UNIVERSITY SYSTEM OF MARYLAND NOTES TO FINANCIAL STATEMENTS YEARS ENDED JUNE 30, 2013 AND 2012 As of June 30, 2013 and 2012, the carrying amount of the System's demand and time deposits was $43,968,706 and $45,786,522, as compared to bank balances of $48,125,276 and $47,408,129, respectively. The difference is primarily caused by items in-transit. Of the bank balances, $41,580,724 and $41,508,593 was covered by Federal, private or foreign national government depository insurance, or was collateralized by a pledge of United States Treasury obligations held by the System's agents in the name of the System, and $6,544,552 and $5,899,536 was uninsured and uncollateralized as of June 30, 2013 and 2012, respectively. The Annotated Code of Maryland requires the System to maintain its cash balances on deposit with the State Treasurer, except for demand and time deposit accounts established to satisfy urgent cash requirements, assets associated with endowment funds or proceeds of System financing arrangements. The State Treasurer maintains State funds on a pooled basis in accordance with the Annotated Code of Maryland. Money market accounts used for unrestricted cash and cash equivalents are not rated by rating agencies. The System has entered into agreements with trustees for the benefit and security of registered holders of certain debt obligations issued by the System. These agreements permit the System to invest amounts maintained in trust funds in: • United States Treasury and agency obligations.
• Deposits, having a maturity of no more than 365 days, in any bank, savings institution or trust company to
the extent such deposits are fully insured or collateralized. • Commercial paper rated at least A-1 by Standard & Poor’s Corporation (Standard & Poor’s) and P-1 by
Moody’s Investors Service, Inc. (Moody’s) having a maturity of no more than 270 days.
• Repurchase agreements. • Obligations of any state or political subdivision rated by Standard & Poor’s and Moody’s in one of its two
highest rating categories. • Corporate obligations rated AAA by Standard & Poor’s and Aaa by Moody’s. As of June 30, restricted cash and cash equivalents included:
2013 2012 Money market accounts – endowment fund uninvested cash $48,147 $52,280 Money market accounts – unspent proceeds of debt 51,342,842 75,621,339
Total $51,390,989 $75,673,619

24
UNIVERSITY SYSTEM OF MARYLAND NOTES TO FINANCIAL STATEMENTS YEARS ENDED JUNE 30, 2013 AND 2012 Unspent proceeds and other restricted debt-related trust account balances and endowment fund uninvested cash balances are maintained in money market accounts rated AAA or equivalent by rating agencies. Investments In July 2005, the System transferred title to its endowment investments, approximately $197 million in fair market value at the time of the transfer, to the University System of Maryland Foundation, Inc., (USMF) in exchange for an equivalent proportionate interest in the long-term investment portfolio managed by the University System of Maryland Foundation, Inc. In June 2011, the System entered into a new agreement with the USMF. Beginning with fiscal year 2012, the per annum fee to be paid to the USMF for investment management services is to be 0.37% of the beginning of the year market value of managed funds. The agreement is for a term of five years, with renewable two-year extensions at the option of the System, unless notice of intent to terminate the arrangement is provided within 180 days prior to the expiration of the term. In the event of termination of the arrangement, funds invested with individual investment managers that have commitments from the University System of Maryland Foundation, Inc., to maintain investments for certain minimum time periods may not be returned to the System until those constraints have been satisfied. Investments in the University System of Maryland Foundation, Inc. are accounted for as an open-ended mutual fund. Asset values, investment gains and losses, and other portfolio-wide transactions are allocated based on the number of units or shares that each fund has relative to the total number of shares or units. Assets associated with the System’s investments are reported as Endowment Investments on the Balance Sheet of the University System of Maryland, and Investments on the Balance Sheet of the University System of Maryland Foundation, Inc., with a corresponding liability reflecting the fair value of the System’s interest in the investment portfolio. The System discloses investment risks, below. Interest rate risk Interest rate risk is the risk that changes in interest rates will adversely affect the fair value of an investment. The System has no formal investment policy that limits investment maturities as a means of managing its exposure to fair value losses arising from increasing interest rates. Custodial credit risk For an investment, custodial credit risk is the risk that, in the event of the failure of the counterparty, the System would not be able to recover the value of its investments or collateral securities that are

25
UNIVERSITY SYSTEM OF MARYLAND NOTES TO FINANCIAL STATEMENTS YEARS ENDED JUNE 30, 2013 AND 2012 in the possession of an outside party. Investment securities are exposed to custodial risk if the securities are uninsured, are not registered in the name of the System, and are held by either (a) the counterparty or (b) the counterparty’s trust department or agent but not in the System’s name. Endowment investments managed by the University System of Maryland Foundation, Inc. are uninsured and are not registered in the name of the System, as they are a part of a commingled portfolio comprising proportionate interests of several different entities. None of the System’s restricted investments are exposed to custodial credit risk. Credit risk Credit risk is the risk that an issuer or other counterparty to an investment will not fulfill its obligations. The System is exposed to credit risk on its Endowment investments managed by the University System of Maryland Foundation, Inc. As of June 30, 2012, commercial paper included in restricted investments held by the System is rated P-1 by Moody’s and A-1 or better by Standard & Poor’s. As of June 30, 2013, the System does not have restricted investments. Foreign currency risk Foreign currency risk is the risk that changes in exchange rates will adversely affect the fair value of an investment. The System is not exposed to any material amount of foreign currency risk. As of June 30, 2013, the System did not have any restricted investments. As of June 30, 2012, the System had the following investments, which individually represent 5% or more of total investments:
2012
Fair value
Portion of total
Federal Home Loan Bank
$12,310,738
6%

26
UNIVERSITY SYSTEM OF MARYLAND NOTES TO FINANCIAL STATEMENTS YEARS ENDED JUNE 30, 2013 AND 2012 Endowment investments As of June 30, endowment investments consisted of the following, stated at fair value:
2013 2012 Corporate debt $17,625 $17,625 Corporate equities 83,229 68,310 Certificate of deposits 22,536 21,895 Assets invested with University System of Maryland Foundation, Inc.
192,797,232
190,171,891
Total $192,920,622 $190,279,721
As of June 30, the balances of the fund groups making up the Endowment were as follows:
2013 2012 Pure endowments $128,566,255 $124,854,909 Funds functioning as endowments 63,511,672 62,405,123 Term endowments
3,502,470
3,019,689 Total $195,580,397 $190,279,721
Endowment fund balances includes $2,659,775 held with the State Treasurer as of June 30, 2013. Assets associated with endowment funds are invested in accordance with the terms of donor agreements in those instances where such agreements place constraints on allowable investments. A spending rule has been adopted by the Board to ensure that endowment funds retain a consistent level of purchasing power over time. The spending rule provides for a target rate of spending of 4.75% of a rolling twelve-quarter average market value of the endowment fund. The spending rule is reviewed periodically by the Finance Committee of the Board. Net appreciation on investments of the pure endowment funds totaled $92,262,195 and $91,156,471 as of June 30, 2013 and 2012, respectively. Reinvestments of net appreciation are considered to be subject to donor spending restrictions, and accordingly, are reflected as a component of restricted, expendable net assets. The Maryland Uniform Prudent Management of Institutional Funds Act governs the use of net appreciation, both realized and unrealized, of endowment investments. This law allows a governing board to appropriate for expenditure only those amounts in excess of the historic gift amount that are prudent, taking into consideration long and short term needs of the institution in carrying out its educational, religious, charitable, or other eleemosynary purposes, its present and anticipated financial requirements, expected total return on its investments, price level trends, and general economic conditions.

27
UNIVERSITY SYSTEM OF MARYLAND NOTES TO FINANCIAL STATEMENTS YEARS ENDED JUNE 30, 2013 AND 2012 Other investments Other investments include a partnership interest in a real estate partnership formed to facilitate the long-term development of a parcel of land owned by the University of Maryland College Park. The carrying value of other investments is assessed on an annual basis by reference to the reported value of the University’s partnership interest. Restricted investments Restricted investments represent unspent proceeds and other debt-related trust account balances invested in U.S. government and agency obligations. As of June 30, 2013, the System held no restricted investments. As of June 30, 2012, restricted investments consisted of:
Fair value
Investment maturities - less than 1 year
Investment maturities
- 1 year and greater U.S. government and agency obligations $15,875,438 $15,875,438 Commercial Paper 5,999,880 $5,999,880 Total $21,875,318 $5,999,880 $15,875,438 Allocation of investment income Investment income is assigned to the accounting funds, including endowments, in proportions associated with investments held by the various accounting funds. For the years ended June 30, 2013 and 2012, investment income attributed to unrestricted funds and restricted funds was: 2013 2012
Unrestricted funds $23,634,631 $21,850,807 Restricted funds 10,060,413 1,022,932 Total investment income $33,695,044 $22,873,739

28
UNIVERSITY SYSTEM OF MARYLAND NOTES TO FINANCIAL STATEMENTS YEARS ENDED JUNE 30, 2013 AND 2012 Major component units The University System of Maryland Foundation, Inc. invests funds on behalf of the System and several other System component units. The majority of the amounts reported as investments by the University of Maryland College Park Foundation, Inc., and the University of Maryland Baltimore Foundation, Inc. are included in the investments reported by the University System of Maryland Foundation, Inc. As of June 30, 2013 and 2012, major component unit investments, recorded at fair value, were: University System of Maryland Foundation, Inc.
2013 2012 Money market funds and short-term investments $137,069,000) $74,849,000) Corporate and municipal bonds 21,468,000) 40,024,000) Equities and mutual funds 113,637,000) 90,791,000) U.S. treasury notes and bonds 3,579,000) 7,085,000) U.S. agencies 1,313,000) 6,689,000) Collateral mortgage obligations and asset and mortgage-backed securities
8,511,000)
22,483,000)
Absolute return 227,626,000) 212,552,000) Long and short equity hedge funds 237,119,000) 208,686,000) Private capital 99,257,000) 107,827,000) Real estate and energy and natural resources 145,087,000) 170,824,000) Total
994,666,000)
941,810,000)
Due to other foundations (484,963,000) (446,503,000) Total Investments 509,703,000) 495,307,000) Due to primary government (192,797,232) (190,171,891) Total University System of Maryland Foundation Investments
$316,905,768) $305,135,109)

29
UNIVERSITY SYSTEM OF MARYLAND NOTES TO FINANCIAL STATEMENTS YEARS ENDED JUNE 30, 2013 AND 2012 University of Maryland College Park Foundation, Inc.
2013 2012 Short-term investments $16,075,094) $15,793,686) Cash equivalents and short term securities 436,143 493,378 ) Mutual funds Bonds
4,940,282 5,801,000)
4,719,253) 901 0901,000
Maryland Proton Treatment Center, LLC Investments in special strategies - USMF
1,000,000 271,928,394
249,360,6132
Total
300,180,913
271,267,930
Due to other foundations (2,085,831) (2,380,350)
Total Investments $298,095,082) $268,887,580 University of Maryland Baltimore Foundation, Inc.
2013 2012 Cash equivalents and short term securities $6,249,377 $6,783,824 Commonfund Lanx stock
1,901,920 1,630,682
1,588,795 1,490,781
Investments in special strategies - USMF 172,042,990 157,040,582 Total Investments $181,824,969 $166,903,982
4. ACCOUNTS RECEIVABLE, NOTES RECEIVABLE, AND ACCOUNTS PAYABLE AND ACCRUED
LIABILITIES Accounts receivable as of June 30, 2013 and 2012, were comprised of:
2013 2012 Tuition and fees $82,420,092) $75,506,944) Contracts and grants 174,552,565 207,842,789) Other 30,489,588) 26,299,286) Subtotal 287,462,245) 309,649,019) Allowance for doubtful accounts (18,606,429) (27,281,575) Accounts receivable, net $268,855,816) $282,367,444)

30
UNIVERSITY SYSTEM OF MARYLAND NOTES TO FINANCIAL STATEMENTS YEARS ENDED JUNE 30, 2013 AND 2012 Notes receivable as of June 30, 2013 and 2012, were comprised of:
2013 2012 Student loans $72,454,072) $74,167,691) Business development loans 7,282,988) 6,948,847) Subtotal 79,737,060) 81,116,538) Allowance for doubtful notes (13,441,437) (12,888,994) Notes receivable, net $66,295,623) $68,227,544)
Accounts payable and accrued liabilities as of June 30, 2013 and 2012, were comprised of:
2013 2012 Payroll and benefits $139,109,528 $122,652,668 Suppliers and contractors 131,825,184 115,265,145 Accrued interest payable 10,822,665 10,847,516 Other 28,861,874 23,757,550
Accounts payable and accrued liabilities $310,619,251 $272,522,879
Major component units Accounts receivable include unconditional promises of contributions pledged to the affiliated foundations. Promised contributions are recorded at a discounted value that reflects the time value of money. As of June 30, 2013 and 2012, contributions receivable are due as follows: University System of Maryland Foundation, Inc.
Due Discount rates 2013 2012 Within one year Not applicable $3,972,000 $5,091,000) One to five years 3.25% 4,485,000 1,898,000) More than five years 3.25% 4,000 200,000) Subtotal 8,461,000 7,189,000) Pledge discount (502,000) (331,000) Net contributions receivable $7,959,000 $6,858,000)

31
UNIVERSITY SYSTEM OF MARYLAND NOTES TO FINANCIAL STATEMENTS YEARS ENDED JUNE 30, 2013 AND 2012 University of Maryland, College Park Foundation, Inc.
Due Discount rates 2013 2012 Within one year Not applicable $31,069,381) $41,180,868) Two to five years 2.19% 26,982,877) 32,149,724) More than five years 3.25% 4,415,424) 7,371,164) Subtotal 62,467,682 80,701,756) Allowance for doubtful accounts (7,082,876) (8,902,869) Pledge discount (2,231,826) (3,372,575) Net contributions receivable $53,152,980) $68,426,312)
University of Maryland, Baltimore Foundation, Inc.
Due Discount rates 2013 2012 Within one year Not applicable $15,336,117 $12,694,169 Two to five years 1.94% 17,209,797 13,483,280 More than five years 2.59% 64,200 289,054 Subtotal 32,610,114) 26,466,503 Allowance for doubtful accounts (1,332,686) (1,106,397) Pledge discount (1,410,902) (1,361,728) Net contributions receivable $29,866,526) $23,998,378)

32
UNIVERSITY SYSTEM OF MARYLAND
NOTES TO FINANCIAL STATEMENTS
YEARS ENDED JUNE 30, 2013 AND 2012
5. CHANGES IN NET CAPITAL ASSETS
Changes in net capital assets for the years ended June 30, 2013 and 2012:
June 30, 2011 June 30, 2012 June 30, 2013
Balance Additions Decreases Balance Additions Decreases Balance
Capital assets being depreciated:
Infrastructure & Land Improvements $318,881,776 $12,056,846 $330,938,622 $20,785,712 $351,724,334
Buildings & Improvements 4,937,142,980 895,795,711 $11,397,720 5,821,540,971 201,656,419 $1,920,602 6,021,276,788
Contents 1,136,244,493 104,196,112 25,811,450 1,214,629,155 78,091,858 27,689,956 1,265,031,057
Buildings recorded under capital lease agreements 14,629,140 14,629,140 14,629,140
Total capital assets being depreciated 6,406,898,389 1,012,048,669 37,209,170 7,381,737,888 300,533,989 29,610,558 7,652,661,319
Less accumulated depreciation for:
Infrastructure & Land Improvements 151,423,099 13,421,017 164,844,116 13,841,735 178,685,851
Buildings & Improvements 1,816,810,126 164,967,960 8,580,473 1,973,197,613 167,806,191 707,089 2,140,296,715
Contents 792,015,505 81,830,307 23,942,308 849,903,504 81,758,709 25,901,791 905,760,422
Buildings recorded under capital lease agreements 2,895,375 137,875 3,033,250 1,187,179 4,220,429
Total accumulated depreciation 2,763,144,105 260,357,159 32,522,781 2,990,978,483 264,593,814 26,608,880 3,228,963,417
Total capital assets being depreciated, net 3,643,754,284 751,691,510 4,686,389 4,390,759,405 35,940,175 3,001,678 4,423,697,902
Capital assets not being depreciated:
Land 136,295,375 6,704,227 142,999,602 10,142,726 153,142,328
Contents 22,504,959 184,337 22,689,296 2,734,181 25,602 25,397,875
Construction in progress 526,813,487 354,038,439 423,628,400 457,223,526 415,553,707 201,667,158 671,110,075
Total capital assets not being depreciated 685,613,821 360,927,003 423,628,400 622,912,424 428,430,614 201,692,760 849,650,278
Capital assets, net $4,329,368,105 $1,112,618,513 $428,314,789 $5,013,671,829 $464,370,789 $204,694,438 $5,273,348,180
Interest expense of $966,298 and $239,973 associated with projects not yet completed was capitalized and recorded as construction in progress during the years ended June 30, 2013, and 2012 respectively.

33
UNIVERSITY SYSTEM OF MARYLAND
NOTES TO FINANCIAL STATEMENTS
YEARS ENDED JUNE 30, 2013 AND 2012
6. SERVICE CONCESSION ARRANGEMENTS FOR STUDENT HOUSING The System implemented GASB Statement #60 ‘Accounting and Financial Reporting for Service Concession Arrangements’ as of July 1, 2011 and has restated balances for June 30, 2012 as appropriate.
The University System of Maryland has entered into long-term leases of university-owned land, and other
agreements with a quasi-governmental issuer of debt, developer to build, and an operator to manage, student
housing projects at seven of the System’s institutions. These agreements satisfy the criteria established to be
considered service concession arrangements (SCAs).
Under the terms of the ground leases, the System transfers rights to university-owned property for a term of 40
years to the quasi-governmental issuer of debt (the ‘project owner’). The project owner contracts with a
developer to build student housing on the property, as well as an operator that manages the facility on behalf of
the owner. Each student housing project is financed using tax-exempt debt that limits the use of the project to
uses that support the institution. The owner of the project charges and collects rent from the students, and
pays the operating costs and debt service associated with the project. The residual cash flow from the project,
after paying all operating costs and management fees, is paid to the university as the ground lease payment.
The institution has the ability to approve what services the operator is required to provide and the rates that can
be charged.
Upon final payment of the outstanding debt associated with the project, or upon termination of the ground
lease, whichever is sooner, the ownership of the project transfers to the university and the owner’s rights to use
the land reverts to the university.
As of June 30, the following balances associated with service concession agreements are reflected on the
Balance Sheet:
2013 2012
Capital assets, net $389,641,837 $441,994,338 Deferred service concession arrangement receipts 380,711,678 432,401,054

34
UNIVERSITY SYSTEM OF MARYLAND
NOTES TO FINANCIAL STATEMENTS
YEARS ENDED JUNE 30, 2013 AND 2012
7. REVENUE BONDS AND NOTES PAYABLE The System finances the construction, renovation and acquisition of certain facilities and equipment through the issuance of debt obligations. State law limits the aggregate principal amount of debt outstanding and the present value of future minimum lease payments on capital lease obligations for real property to no more than $1,400,000,000. Revenue bonds and notes payable consisted of the following as of June 30, 2013 and 2012: 2013 2012
Revenue Bonds, net $1,108,158,762 $1,061,819,442 Revolving Loan Program Bonds 35,000,000 50,000,000 Certificates of Participation 2,800,000 Other 40,209,544 41,973,756
Revenue bonds and notes payable, net $1,183,368,306 $1,156,593,198
Auxiliary Facility and Tuition Revenue Bonds As of June 30, 2013, Auxiliary Facility and Tuition Revenue Bonds (Revenue Bonds) consisted of the following:
Interest Rates
Maturity Dates
Principal
Outstanding
2003 Series A & B 4.0% - 5.0% 2014-2016 $11,785,000 2004 Series A & B 4.5% - 5.7% 2014-2016 3,165,000 2005 Series A 4.0% - 5.0% 2014-2021 89,535,000 2006 Series A 5.0% 2013-2017 17,780,000
2007 Refunding Series A 4.0% - 5.0% 2013-2023 75,345,000
2008 Series A 4.0% - 5.0% 2014-2028 74,855,000
2008 Refunding Series B 3.5% - 4.0% 2013-2017 11,190,000
2009 Series A & B 4.0% - 6.0% 2014-2029 85,480,000
2009 Refunding Series C 2.5% - 4.0% 2013-2019 18,380,000
2009 Refunding Series D 3.0% - 4.0% 2013-2022 51,510,000
2010 Series A & B 2.5% - 5.4% 2014-2030 106,750,000
2010 Series C 2.0% - 4.0% 2014-2023 44,775,000
2010 Series D & E 3.0% - 5.8% 2014-2030 106,110,000
2011 Series A 3.0% - 5.0% 2014-2031 107,225,000
2011 Refunding Series B 3.0% - 5.0% 2015-2024 38,075,000
2012 Refunding Series A & B 2.0% - 4.0% 2014-2024 59,500,000
2012 Series C & D 2.0% - 5.0% 2014-2032 167,270,000
1,068,730,000
Unamortized discounts, premiums and refunding adjustments 39,428,762
Revenue bonds, net $1,108,158,762

35
UNIVERSITY SYSTEM OF MARYLAND
NOTES TO FINANCIAL STATEMENTS
YEARS ENDED JUNE 30, 2013 AND 2012
Revenue Bonds have been issued pursuant to an Indenture of Trust, an agreement entered into with a trustee for the benefit of holders of Revenue Bonds. Pursuant to the Indenture of Trust, the System has agreed to charge and collect tuition revenues and net auxiliary facility fees in an amount that is not less than 200% of the maximum annual debt service on Revenue Bonds. Revenue Bonds issued during the years ended June 30, 2013 and 2012, including the results of any advance refunding of previously-issued debt, are as follows:
Debt issuance
Date of
issue
Par value of
debt issued
Premium on
issuance
Par value of
debt
refunded
Reduction
in future
debt
service
Deferred
amount on
refunding
Economic
gain or
(loss)
2011 Series A 10/6/2011 $115,000,000 $11,216,462 2011 Refunding Series B 10/6/2011 38,075,000 3,641,915 $38,750,000 $1,631,266 $1,043,816 $1,357,494 2012 Refunding Series A & B 2/9/2012 70,825,000 4,419,184 69,735,000 9,560,388 5,116,958 9,054,411 2012 Series C 10/6/2012 115,000,000 6,582,587 2012 Refunding Series D 10/6/2012 54,005,000 10,820,564 55,420,000 6,335,509 7,471,867 5,281,851
The System has issued series of revenue bonds that qualify for participation in the Build America Bonds program, a provision of the American Recovery and Reinvestment Act of 2009. The provisions of the Build America Bonds provide that the Federal government will reimburse issuers of Build America Bonds an amount equal to 35% of the interest payments made to bondholders. The 2009 Series B, the 2010 Series B, and 2010 Series E bonds have been issued to comply with the requirements of the Build America Bonds program, the System has been receiving the interest payment reimbursements from the Federal government, and the System expects that these bonds will continue to qualify under the program in the future. The interest amounts reflected in the future principal and interest payments schedule on the following page reflect the System’s obligations to bondholders, and have not been reduced for any expectation of interest reimbursement from the Federal government under the Build America Bonds program. As of June 30, 2013, previously issued debt removed from the System’s financial statements through advance refunding transactions still outstanding was $113,880,000. As of June 30, 2013 and 2012, cash and cash equivalents and investments restricted by the terms of the Indenture of Trust totaled $34,925,663 and $65,202,153, respectively.

36
UNIVERSITY SYSTEM OF MARYLAND NOTES TO FINANCIAL STATEMENTS YEARS ENDED JUNE 30, 2013 AND 2012 Revolving Loan Program Bonds Revolving Loan Program Bonds include debt issued pursuant to an Indenture of Trust, an agreement entered into with a trustee for the benefit of holders of the debt, dated April 1, 1995. On August 8, 2003, the System issued $65,000,000 of University System of Maryland Revolving Loan Program Bonds, 2003 Series A. The 2003 Series A Bonds were initially issued as auction rate reset securities, meaning interest is calculated on outstanding Revolving Loan Program Bonds using a rate of interest determined through a weekly auction process. In April, 2008, the System purchased $15,000,000 of the auction rate reset securities in response to failed auctions that were occurring for most issuers of auction rate reset securities as a result of the collapse of the credit insurance market. On June 26, 2008, the 2003 Series A Bonds in a principal amount of $50,000,000 were converted from an auction rate mode to a Multiannual Rate. On June 1, 2009, the 2003 Series A Bonds were remarketed for another one year period on a multi-annual interest rate basis at an interest rate of .55%. On June 1, 2010, the securities were successfully remarketed on a multi-annual interest rate basis at an interest rate of 1.50%. On June 1, 2013 the System redeemed $15,000,000 of the 2003 Series A Bonds. The remaining principal balance of $35,000,000 of the 2003 Series A Bonds was remarketed for five years at a multi-annual interest rate of 1.25%. As of June 30, 2013 and 2012, cash and cash equivalents in the amount of $16,415,499 and $30,145,543, respectively, was held by the trustee as unspent proceeds of the Revolving Loan Program Bonds. Other Other debt and notes payable includes amounts borrowed to finance facilities, equipment acquisitions, a marine research vessel and other improvements designed to enhance energy efficiency savings. The System is subject to Federal arbitrage laws governing the use of proceeds of tax-exempt debt.

37
UNIVERSITY SYSTEM OF MARYLAND NOTES TO FINANCIAL STATEMENTS YEARS ENDED JUNE 30, 2013 AND 2012 Future principal and interest payments as of June 30, 2013, were as follows:
Auxiliary Facility and Tuition Revenue Bonds
Notes Payable and Other Long-term Debt
Total
Years ending June 30, Principal Interest Principal Interest Payments
2014 $72,335,000 $46,607,135 $6,715,151 $1,209,989 $126,867,275 2015 75,880,000 43,638,934 5,565,721 1,109,141 126,193,796 2016 79,595,000 40,273,028 5,061,782 999,926 125,929,736 2017 78,565,000 36,662,184 3,943,791 896,015 120,066,990 2018 77,465,000 33,247,646 2,907,025 1,211,253 114,830,924
2019 – 2023 351,255,000 117,234,330 37,956,517 5,950,110 512,395,957 2024 – 2028 240,640,000 51,999,024 13,059,557 73,445 305,772,026 2029 – 2033 92,995,000 7,511,315 100,506,315
Total $1,068,730,000 $377,173,596 $75,209,544 $11,449,879 $1,532,563,019
8. LEASES Obligations under capital lease agreements The System leases two facilities for the use of the University of Maryland College Park and Towson University under agreements recorded as capital lease obligations. The obligations are recorded at the present value of future minimum lease payments using a discount rate of 6.8% and 3.2%, for the University of Maryland College Park and the Towson University leases, respectively, Future minimum payments on obligations under capital lease agreements as of June 30, 2013, were as follows:
Years ending June 30, Total 2014 $1,602,938)
2015 1,635,667) 2016 1,669,377) 2017 1,704,099) 2018 1,739,862
2019 – 2023 6,571,051)
Total future lease payments 14,922,994) Less: Interest component (2,512,946)
Obligations under capital lease agreements $12,410,048)

38
UNIVERSITY SYSTEM OF MARYLAND NOTES TO FINANCIAL STATEMENTS YEARS ENDED JUNE 30, 2013 AND 2012 Operating leases The System and its constituent units lease facilities and equipment under agreements reported as operating leases. Many of the leases provide for an optional extension of the terms of the agreements and increases in payment amounts based on changes in indices such as the Consumer Price Index. Future minimum payments on operating leases as of June 30, 2013, were as follows:
Year ending June 30,
Minimum Annual Lease Payments
2014 $15,993,779 2015 14,296,123 2016 12,802,735 2017 11,524,076 2018 9,847,538
2019 – 2023 25,935,708 2024 – 2028 7,521,791
Total $97,921,750
Operating lease expenditures for the years ended June 30, 2013 and 2012, were $21,312,289 and $20,548,836, respectively.

UNIVERSITY SYSTEM OF MARYLAND NOTES TO FINANCIAL STATEMENTS YEARS ENDED JUNE 30, 2013 AND 2012 9. CHANGES IN LONG-TERM LIABILITIES Changes in long-term liabilities for the years ended June 30, 2013 and 2012, were as follows:
June 30, 2011 June 30, 2012 June 30, 2013 Due Within Balance Additions Reductions Balance Additions Reductions Balance One Year
Accrued vacation costs $175,138,867 $88,799,014 $88,134,760 $175,803,121 $96,306,968 $88,829,027 $183,281,062 $89,344,370 Accrued workers’ compensation 27,543,235 6,548,800 5,457,035 28,635,000 4,717,821 5,121,821 28,231,000 4,375,805 Revenue bonds and notes payable, net 1,115,178,914 241,422,693 200,008,409 1,156,593,198 193,870,546 167,095,438 1,183,368,306 79,050,151 Obligations under capital lease agreements 14,043,089 277,430 13,765,659 1,355,611 12,410,048 1,104,394
Total long-term liabilities $1,331,904,105 $336,770,507 $293,877,634 $1,374,796,978 $294,895,335 $262,401,897 $1,407,290,416 $173,874,720
10. OPERATING EXPENSES BY OBJECT The System reports operating expenses in the Statement of Revenues, Expenses and Changes in Net Assets by program category. Operating expenses for the years ended June 30, 2013 and 2012, by grouping of object classification were as follows:
2013 2012
Employee Costs
Payments to Suppliers,
Contractors and Others
Depreciation
Total
Employee Costs
Payments to Suppliers,
Contractors and Others
Depreciation
Total Instruction $981,476,896 $117,432,872 $41,003,571 $1,139,913,339 $949,147,627 $110,976,841 $40,975,305 $1,101,099,773 Research 571,677,511 335,315,557 24,965,883 931,958,951 563,727,321 335,594,368 23,552,381 922,874,070 Public service 90,866,256 58,539,149 3,591,076 152,996,481 90,877,000 63,533,565 3,143,689 157,554,254 Academic support 264,425,951 107,041,343 40,146,289 411,613,583 244,320,030 100,362,037 35,505,197 380,187,264 Student services 124,003,082 69,945,387 4,476,479 198,424,948 120,770,559 67,046,782 4,468,642 192,285,983 Institutional support 307,987,872 64,064,896 14,523,183 386,575,951 299,210,371 47,332,550 17,735,504 364,278,425 Operation and maintenance of plant 121,042,648 127,310,105 50,435,694 298,788,447 118,013,481 144,626,701 54,247,254 316,887,436 Scholarships and fellowships 6,258,529 94,700,971 100,959,500 7,114,171 83,396,333 90,510,504 Auxiliary enterprises: Residential facilities 42,962,533 51,832,827 41,412,820 136,208,180 40,972,342 42,435,195 36,338,987 119,746,524 Dining facilities 33,208,173 67,815,519 4,819,588 105,843,280 32,481,671 66,962,570 5,442,746 104,886,987 Intercollegiate athletics 49,074,429 34,045,693 6,817,063 89,937,185 50,352,141 35,635,872 8,836,563 94,824,576 Bookstores 4,646,576 22,620,424 85,051 27,352,051 4,411,332 22,140,895 289,379 26,841,606 Parking facilities 11,145,074 9,010,235 5,187,204 25,342,513 10,736,068 10,277,434 4,928,516 25,942,018 Other auxiliary enterprises 51,069,469 36,058,879 27,111,876 114,240,224 49,990,541 33,434,488 24,876,804 108,301,833 Hospital 171,466,606 1,699,619 18,037 173,184,262 153,830,954 1,358,684 16,192 155,205,830
Total $2,831,311,605 $1,197,433,476 $264,593,814 $4,293,338,895 $2,735,955,609 $1,165,114,315 $260,357,159 $4,161,427,083
39

40
UNIVERSITY SYSTEM OF MARYLAND NOTES TO FINANCIAL STATEMENTS YEARS ENDED JUNE 30, 2013 AND 2012 10. RETIREMENT AND PENSION PLANS Most System employees participate in the State Retirement and Pension System of Maryland (the State System), which is an agent, multiple-employer public employee retirement system. While the State System is an agent, multiple-employer public employee retirement system, the System accounts for the plan as a cost-sharing multiple-employer public employee retirement system, as a separate valuation is not performed for the System, and the only obligation to the plan is its required annual contributions. The State System includes four pension and retirement plans that System employees participate in:
Teachers Retirement Systems Teachers Pension Systems Employees Retirement Systems Employees Pension Systems
The State System prepares a Comprehensive Annual Financial Report, which can be obtained from the State Retirement and Pension System at 120 East Baltimore Street, Suite 1600, Baltimore, MD 21202. System employees may alternatively elect to participate in an optional retirement program. State Systems Plan Description The State System are defined benefit plans with unfunded accrued actuarial liabilities. The State System, which is administered in accordance with the State Personnel and Pensions Article of the Annotated Code of Maryland, is managed by a Board of Trustees, and included in the State of Maryland financial reporting entity.
All plan benefits are specified by the State Personnel and Pensions Article of the Annotated Code of Maryland. Retirement allowances are computed using both the highest three years’ average final salary (AFS) and the actual number of years of accumulated creditable service. Pension allowances are computed using both the highest three consecutive years’ AFS and the actual number of years of accumulated creditable service. Various retirement options are available under each system which ultimately determines how a retiree's benefit allowance will be computed. Some of these options require actuarial reductions based on the retiree’s and/or designated beneficiary’s attained age and similar actuarial factors.

41
UNIVERSITY SYSTEM OF MARYLAND NOTES TO FINANCIAL STATEMENTS YEARS ENDED JUNE 30, 2013 AND 2012 Funding Policy The System’s required contributions are based upon actuarial valuations. Effective July 1, 1980, in accordance with the law governing the State System, all benefits of the State System are funded in advance. The aggregate entry age normal cost method is the actuarial cost method used. Both the System and covered employees are required by State statute to contribute to the State System. The contribution from the employees is 5% for participants in the State System retirement plans (with a 5% limit on the annual cost of living allowance and 7% for those who elect a limit on the cost of living allowance commensurate with the Consumer Price Index); and 2% for participants in the State System pension plans. Contributions are deducted from participant’s salary and wage payments and are remitted to the State System on a regular, periodic basis. The System made its required contributions during the years ended June 30, 2013, 2012, and 2011 of $84,938,801, $73,660,374, and $74,127,461, respectively. Optional Retirement Program Some employees participate in the optional retirement programs, which are defined contribution money purchase plans funded currently each year and invested in specific funds offered by one of three vendors. In defined contribution plans, benefits depend solely on amounts contributed plus investment earnings. Qualified employees are eligible to participate from the date of employment. State legislation provides that the System contribute 7.25% of covered employees' annual salaries each month. The System's contribution along with that of the employee is immediately and fully vested. The contributions for the year ended June 30, 2013 were $133,171,956, which consisted of $66,763,426 from the System and $66,408,530 from employees. The contributions for the year ended June 30, 2012 were $131,559,709, which consisted of $64,287,486 from the System and $67,272,223 from employees. Major component units The University System of Maryland Foundation, Inc. maintains a defined contribution plan for certain personnel provided by TIAA-CREF. The University System of Maryland Foundation, Inc. contributes 7.25% of the employee’s compensation to the plan. In addition, eligible employees are entitled to make voluntary contributions to the plan. Total pension expense for the years ended June 30, 2013 and 2012 was approximately $212,000 and $141,000, respectively.

42
UNIVERSITY SYSTEM OF MARYLAND NOTES TO FINANCIAL STATEMENTS YEARS ENDED JUNE 30, 2013 AND 2012 11. OTHER POSTEMPLOYMENT BENEFITS Members of the State Retirement and Pension System of Maryland (the State System) and their dependents are provided postemployment health care benefits through the State Employee and Retiree Health and Welfare Benefits Program (the Plan). The Plan is a cost sharing defined benefit healthcare plan established by the State Personnel and Pensions Article, Section 2-501 through 2-516 of the Annotated Code of Maryland. The Plan is self-insured to provide medical, hospitalization, prescription drug and dental insurance benefits to eligible state employees, retirees, and their dependents. The State does not distinguish employees by employer/State agency. Instead, the State allocates the postemployment health care costs to all participating employers. Financial information for the Plan is included in the State of Maryland Comprehensive Annual Financial Report, which can be obtained from the Comptroller of Maryland, Louis L. Goldstein Treasury Building, Annapolis, MD 21404. A separate actuarial valuation is not performed by the System. The System’s only obligation to the Plan is its required annual contribution, which it has fully funded during the years ended June 30, 2013 and 2012. The amounts contributed for the years ended June 30, 2013 and 2012, were $75,416,841 and $63,367,379, respectively. 12. CONSTRUCTION COMMITMENTS The estimated costs to complete construction in progress as of June 30, 2013 is $359,034,094, of which $80,800,885 is to be funded from Revenue Bond proceeds, $208,723,571 is to be derived from State appropriations and grants, and $69,509,638 to be provided from System funds. 13. CONTINGENT LIABILITIES The System has entered into future purchase commitments for natural gas and electricity, as a means of hedging its risk against fluctuations in price of an important fuel commodity and electricity supplies. As of June 30, 2013, the System had entered into open contracts for the purchase of $2,201,024, of natural gas to be delivered monthly through June 2015. Future purchase commitments for electricity to be supplied through December 2014 totaled $1,539,480 as of June 30, 2013. The System and its institutions generally take delivery of the natural gas and electricity purchased through future purchase contracts. The System is involved in a number of legal actions that arise in the normal course of its operations. In the opinion of management, based on the advice of the State Attorney General, such actions, as well as any exposure to unasserted claims, will not have a material adverse effect on the System's financial position.

43
UNIVERSITY SYSTEM OF MARYLAND NOTES TO FINANCIAL STATEMENTS YEARS ENDED JUNE 30, 2013 AND 2012 The Atlantic Coast Conference (the ACC), an intercollegiate sports association, has filed a request for a declaratory judgement asserting that the University of Maryland College Park will owe the ACC a withdrawal fee of more than $52 million associated with the University’s announced intention to begin participation in the Big Ten Conference beginning July 1, 2014. The University disputes the claim, and at this point, cannot reasonably conclude that the ACC will prevail in its claim, or estimate any potential liability that might result were the ACC to prevail. 15. RISK MANAGEMENT The System participates in State-wide self-insurance programs for many forms of risk of loss, including general liability, property and casualty, workers' compensation, environmental and anti-trust liabilities, as well as certain employee health benefit programs. The System remits premiums to the State, to cover costs of claims servicing and claims payments. The premiums are based on a percentage of annual payroll or are based on average loss experience, taking into account recent trends in actual claims experience, and providing for catastrophic losses. The System records a liability when it is probable that a loss has been incurred and the amount of that loss can be reasonably estimated. Liabilities recorded include a provision for claims incurred but not reported. Because actual claims liabilities depend on such complex factors such as inflation, changes in legal doctrines, and damage awards, actual claims could differ from estimates. Claims liabilities are re-evaluated periodically to take into consideration recently settled claims, the frequency of claims and other economic and social factors. Liabilities for incurred workers' compensation losses to be settled by fixed or reasonably determinable payments over a long period of time are reported at their present value using a 4% discount rate. The provision for workers' compensation is based upon a separately determined actuarial valuation for the fiscal years ended June 30, 2013 and 2012. Settlement amounts have not exceeded insurance coverage levels for the years ended June 30, 2013, 2012, or 2011. As of June 30, 2013 and 2012, the System has recorded $28,231,000 and $28,635,000 in liabilities associated with workers' compensation, respectively.

UNIVERSITY OF MARYLAND, BALTIMOREBALANCE SHEET
JUNE 30, 2013 AND 2012
44
June 30,2013 2012
Component ComponentInstitution Units Institution Units
ASSETSCurrent assets:
Cash and cash equivalents $263,358,414 $1,308,755 $226,038,387 $593,253Accounts receivable, net 85,106,353 19,443,033 104,402,396 13,611,253Notes receivable, current portion 2,166,928 2,157,281Prepaid expenses, deferred charges and other assets 298,213 135,976 324,529 124,310Inter-institutional balances 3,053,953 563,981
Total current assets 353,983,861 20,887,764 333,486,574 14,328,816
Noncurrent assets:Restricted cash and cash equivalents 1,195,504 1,363,510Accounts receivable, net 15,650,167 12,367,784Endowment investments 75,428,768 150,878,417 74,353,596 131,401,821 Other investments 130,872,920 129,316,080Notes receivable, net 24,916,590 25,568,333Other assets 5,179,829 5,020,298Capital assets, net 709,395,738 714,436,798
Total noncurrent assets 810,936,600 302,581,333 815,722,237 278,105,983
Total assets $1,164,920,461 $323,469,097 $1,149,208,811 $292,434,799
LIABILITIESCurrent liabilities:
Accounts payable and accrued liabilities $54,156,891 $6,477,788 $51,022,422 $3,409,681Accrued workers' compensation, current portion 824,755 952,475Accrued vacation costs, current portion 36,413,857 34,048,710Revenue bonds and notes payable, current portion 8,025,820 9,875,151Deferred revenue 37,609,690 2,500 43,700,123 14,565
Total current liabilities 137,031,013 6,480,288 139,598,881 3,424,246
Noncurrent liabilities:Accrued workers' compensation 4,496,245 5,192,525Accrued vacation costs 33,584,552 32,361,194Endowments invested on behalf of primary government 75,428,768 74,353,596Other payables 1,234,403 1,002,708Revenue bonds and notes payable 118,700,998 124,336,757
Total noncurrent liabilities 156,781,795 76,663,171 161,890,476 75,356,304
Total liabilities 293,812,808 83,143,459 301,489,357 78,780,550
DEFERRED INFLOWS OF RESOURCESDeferred service concession arrangement receipts 35,477,317 37,229,284
NET POSITIONUnrestricted 194,919,694 25,103,909 176,406,595 22,248,696Net investment in capital assets 547,191,603 542,995,606Restricted:
Nonexpendable:Scholarships and fellowships 8,972,927 33,178,009 6,548,051 30,937,415Research 522,543 1,159,827 522,543 1,139,281Other 10,295,892 99,173,541 10,294,734 89,897,440
Expendable:Scholarships and fellowships 24,998,869 8,457,556 24,869,669 7,375,240Research 5,386,618 9,253,710 5,533,176 8,077,005Loans 26,348,729 26,950,536Capital projects 1,195,504 1,363,510Other 15,797,957 63,999,086 15,005,750 53,979,172
Total net position 835,630,336 240,325,638 810,490,170 213,654,249
Total liabilities, deferred inflows of resources, and net position $1,164,920,461 $323,469,097 $1,149,208,811 $292,434,799

UNIVERSITY OF MARYLAND, BALTIMORESTATEMENT OF REVENUES, EXPENSES AND CHANGES IN NET POSITION
YEARS ENDED JUNE 30, 2013 AND 2012
45
Years ended June 30,
Component ComponentUnits Units
OPERATING REVENUES:Tuition and fees $118,983,364 $114,748,076Less: scholarship allowances (18,762,714) $100,220,650 (17,924,712) $96,823,364Federal grants and contracts 247,023,280 264,931,381State and local grants and contracts 65,729,506 59,038,329Nongovernmental grants and contracts 109,320,435 108,427,190Sales and services of educational departments 245,085,479 216,211,856Auxiliary enterprises:
Residential facilities 2,565,186 2,536,870Parking facilities 12,764,907 11,993,486Other auxiliary enterprises revenues 14,509,846 14,441,241
Total operating revenues 797,219,289 774,403,717
OPERATING EXPENSES:Instruction 188,776,832 180,234,676Research 393,649,603 391,828,457Public service 3,429,947 3,480,545Academic support 50,016,557 50,433,089Student services 5,098,226 5,496,943Institutional support 65,973,200 64,573,542Operation and maintenance of plant 79,975,572 80,670,432Scholarships and fellowships 3,632,705 2,517,190Auxiliary enterprises:
Residential facilities 1,875,074 1,944,960Parking facilities 8,410,847 8,117,629Other auxiliary enterprises expenses 12,695,207 13,270,568
Hospital 173,184,262 155,205,830
Total operating expenses 986,718,032 957,773,861
Operating income (loss) (189,498,743) (183,370,144)
NONOPERATING REVENUES (EXPENSES):State appropriations 185,491,671 185,039,951Pell grants 629,858 610,299Gifts 14,273,075 $34,366,418 13,181,490 $35,360,836Investment income 8,510,888 16,267,743 3,856,008 2,362,940Less: Investment expense (275,108) 8,235,780 (286,179) 3,569,829Interest on indebtedness (4,710,660) (5,030,036)Other revenues (expenses), gains and (losses) 892,023 635,728Other affiliated foundation revenues 840,278 865,497Other affiliated foundation expenses (24,803,050) (22,897,696)Transfers (to) from other University System of Maryland institutions (556,095) (1,089,255)
Total nonoperating revenues (expenses) 204,255,652 26,671,389 196,918,006 15,691,577
Income before other revenues 14,756,909 26,671,389 13,547,862 15,691,577
OTHER REVENUES:Capital appropriations 7,717,094 2,734,011Capital gifts and grants 240,128 115,278Additions to permanent endowments 2,426,035 858,594
Total other revenues 10,383,257 3,707,883
Increase in net position 25,140,166 26,671,389 17,255,745 15,691,577
Net position - beginning of year 810,490,170 213,654,249 793,234,425 197,962,672
Net position - end of year $835,630,336 $240,325,638 $810,490,170 $213,654,249
2013 2012
InstitutionInstitution

UNIVERSITY OF MARYLAND, BALTIMORESTATEMENT OF CASH FLOWS
YEARS ENDED JUNE 30, 2013 AND 2012
46
Years ended June 30, 2013 2012
CASH FLOWS FROM OPERATING ACTIVITIES:Tuition and fees $102,864,553 $96,776,022Research contracts and grants 438,859,869 435,043,178Payments to employees (686,505,676) (658,480,487)Payments to suppliers and contractors (239,675,697) (240,812,136)Loans issued to students (3,865,770) (3,399,595)Collections of loans to students 3,859,453 3,855,312Auxiliary enterprises:
Residential facilities 813,220 784,907Parking facilities 12,764,907 11,993,486Other 14,439,855 14,529,685
Other receipts 254,821,055 240,854,679
Net cash provided (used) by operating activities (101,624,231) (98,854,949)
CASH FLOWS FROM NONCAPITAL FINANCING ACTIVITIES:State appropriations 185,491,671 185,039,951Gifts and grants received for other than capital purposes:
Private gifts for endowment purposes 2,426,035 858,594Pell grants 629,858 610,299
Net cash provided by noncapital financing activities 188,547,564 186,508,844
CASH FLOWS FROM CAPITAL AND RELATED FINANCING ACTIVITIES:Proceeds of capital debt 22,097,502 19,688,059Capital appropriations 7,717,094 2,734,011Proceeds from sales of capital assets 208,826 822,961Purchases of capital assets (49,491,255) (39,837,583)Principal paid on debt and capital leases (28,454,152) (27,432,922)Interest paid on debt and capital leases (5,941,773) (6,088,944)Transfers (to) from other University System of Maryland institutions (3,068,162) (2,371,034)
Net cash provided (used) by capital and related financing activities (56,931,920) (52,485,452)
CASH FLOWS FROM INVESTING ACTIVITIES:Proceeds from sales and maturities of investments 4,185,990 4,080,474Interest on investments 3,265,786 3,626,198Investment expense (275,108) (286,179)Purchases of investments (16,060) (858,594)
Net cash provided by investing activities 7,160,608 6,561,899
Net increase in cash and cash equivalents 37,152,021 41,730,342
Cash and cash equivalents - beginning of the year 227,401,897 185,671,555
Cash and cash equivalents - end of the year $264,553,918 $227,401,897

UNIVERSITY OF MARYLAND, COLLEGE PARKBALANCE SHEET
JUNE 30, 2013 AND 2012
47
2013 2012Component Component
Institution Units Institution UnitsASSETS
Current assets:Cash and cash equivalents $608,264,732 $19,846,858 $564,146,527 $24,292,947Accounts receivable, net 96,997,004 58,879,512 86,477,706 37,482,543Notes receivable, current portion 1,544,779 1,514,602Inventories 3,247,070 3,358,732Prepaid expenses, deferred charges and other assets 1,254,590 231,211 1,150,128 379,434Inter-institutional balances (6,665,026) 44,106
Total current assets 704,643,149 78,957,581 656,691,801 62,154,924
Noncurrent assets:Restricted cash and cash equivalents 10,484,001 11,861,551Accounts receivable, net 26,783,971 33,143,115Endowment investments 96,408,857 344,089,095 95,433,606 316,359,209 Other investments 6,693,185 176,501,450 5,128,471 177,282,911Notes receivable, net 8,969,150 9,398,557Other assets 865,912 1,049,850Capital assets, net 1,767,056,212 3,688,398 1,709,440,177 3,596,669
Total noncurrent assets 1,889,611,405 551,928,826 1,831,262,362 531,431,754
Total assets $2,594,254,554 $630,886,407 $2,487,954,163 $593,586,678
LIABILITIESCurrent liabilities:
Accounts payable and accrued liabilities $105,818,169 $36,347,746 $96,851,040 $4,032,510Accrued workers' compensation, current portion 2,032,670 1,992,990Accrued vacation costs, current portion 20,873,442 20,359,751Revenue bonds and notes payable, current portion 29,301,765 31,908,955Deferred revenue 60,318,737 3,901,324 65,682,515 1,836,287Current portion of obligations under capital lease obligations 316,740 296,434
Total current liabilities 218,661,523 40,249,070 217,091,685 5,868,797
Noncurrent liabilities:Accrued workers' compensation 11,081,330 10,865,010Accrued vacation costs 34,272,883 33,890,869Endowments invested on behalf of primary government 96,408,857 95,394,083Other payables 3,146,534 3,867,811Revenue bonds and notes payable 321,449,163 301,170,343Obligations under capital lease agreements 2,659,449 2,976,189
Total noncurrent liabilities 369,462,825 99,555,391 348,902,411 99,261,894
Total liabilities 588,124,348 139,804,461 565,994,096 105,130,691
DEFERRED INFLOWS OF RESOURCESDeferred service concession arrangement receipts 168,175,327 175,885,442
NET POSITIONUnrestricted 487,263,967 45,712,250 441,925,863 63,092,499Net investment in capital assets 1,245,153,768 1,197,202,814Restricted:
Nonexpendable:Scholarships and fellowships 5,542,797 113,193,840 5,385,708 97,173,526Research 3,533,011 2,043,435 3,510,642 1,934,592Other 4,761,426 163,535,187 4,761,296 163,259,048
Expendable:Scholarships and fellowships 9,460,286 45,379,535 9,593,675 42,017,243Research 63,731,676 14,738,344 63,355,729 13,160,731Loans 10,992,200 10,793,359Capital projects 711,675 2,868,191Other 6,804,073 106,479,354 6,677,348 107,818,348
Total net position 1,837,954,879 491,081,946 1,746,074,625 488,455,987
Total liabilities, deferred inflows of resources, and net position $2,594,254,554 $630,886,407 $2,487,954,163 $593,586,678
June 30,
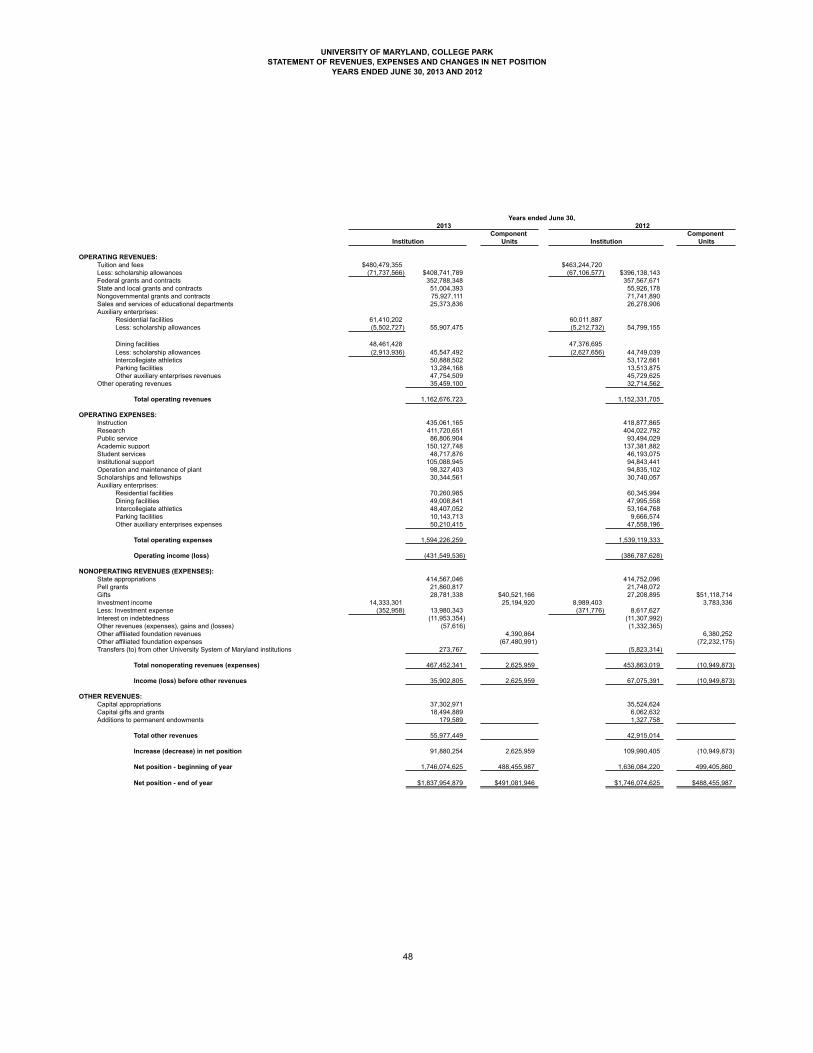
UNIVERSITY OF MARYLAND, COLLEGE PARKSTATEMENT OF REVENUES, EXPENSES AND CHANGES IN NET POSITION
YEARS ENDED JUNE 30, 2013 AND 2012
48
Years ended June 30,
Component Component Units Units
OPERATING REVENUES:Tuition and fees $480,479,355 $463,244,720Less: scholarship allowances (71,737,566) $408,741,789 (67,106,577) $396,138,143Federal grants and contracts 352,788,348 357,567,671State and local grants and contracts 51,004,393 55,926,178Nongovernmental grants and contracts 75,927,111 71,741,890Sales and services of educational departments 25,373,836 26,278,906Auxiliary enterprises:
Residential facilities 61,410,202 60,011,887Less: scholarship allowances (5,502,727) 55,907,475 (5,212,732) 54,799,155
Dining facilities 48,461,428 47,376,695Less: scholarship allowances (2,913,936) 45,547,492 (2,627,656) 44,749,039Intercollegiate athletics 50,888,502 53,172,661Parking facilities 13,284,168 13,513,875Other auxiliary enterprises revenues 47,754,509 45,729,625
Other operating revenues 35,459,100 32,714,562
Total operating revenues 1,162,676,723 1,152,331,705
OPERATING EXPENSES:Instruction 435,061,165 418,877,865Research 411,720,651 404,022,792Public service 86,806,904 93,494,029Academic support 150,127,748 137,381,882Student services 48,717,876 46,193,075Institutional support 105,088,945 94,843,441Operation and maintenance of plant 98,327,403 94,835,102Scholarships and fellowships 30,344,561 30,740,057Auxiliary enterprises:
Residential facilities 70,260,985 60,345,994Dining facilities 49,008,841 47,995,558Intercollegiate athletics 48,407,052 53,164,768Parking facilities 10,143,713 9,666,574Other auxiliary enterprises expenses 50,210,415 47,558,196
Total operating expenses 1,594,226,259 1,539,119,333
Operating income (loss) (431,549,536) (386,787,628)
NONOPERATING REVENUES (EXPENSES):State appropriations 414,567,046 414,752,096Pell grants 21,860,817 21,748,072Gifts 28,781,338 $40,521,166 27,208,895 $51,118,714Investment income 14,333,301 25,194,920 8,989,403 3,783,336 Less: Investment expense (352,958) 13,980,343 (371,776) 8,617,627Interest on indebtedness (11,953,354) (11,307,992)Other revenues (expenses), gains and (losses) (57,616) (1,332,365)Other affiliated foundation revenues 4,390,864 6,380,252Other affiliated foundation expenses (67,480,991) (72,232,175)Transfers (to) from other University System of Maryland institutions 273,767 (5,823,314)
Total nonoperating revenues (expenses) 467,452,341 2,625,959 453,863,019 (10,949,873)
Income (loss) before other revenues 35,902,805 2,625,959 67,075,391 (10,949,873)
OTHER REVENUES:Capital appropriations 37,302,971 35,524,624Capital gifts and grants 18,494,889 6,062,632Additions to permanent endowments 179,589 1,327,758
Total other revenues 55,977,449 42,915,014
Increase (decrease) in net position 91,880,254 2,625,959 109,990,405 (10,949,873)
Net position - beginning of year 1,746,074,625 488,455,987 1,636,084,220 499,405,860
Net position - end of year $1,837,954,879 $491,081,946 $1,746,074,625 $488,455,987
Institution Institution
2013 2012

UNIVERSITY OF MARYLAND, COLLEGE PARKSTATEMENT OF CASH FLOWS
YEARS ENDED JUNE 30, 2013 AND 2012
49
Years ended June 30, 2013 2012
CASH FLOWS FROM OPERATING ACTIVITIES:Tuition and fees $406,724,898 $396,087,820Research contracts and grants 487,763,587 474,520,584Payments to employees (1,065,932,707) (1,031,565,259)Payments to suppliers and contractors (427,927,883) (403,153,488)Loans issued to students (1,281,248) (1,873,545)Collections of loans to students 1,680,478 2,094,447Auxiliary enterprises:
Residential facilities 48,197,360 47,045,714Dining facilities 45,547,492 44,726,599Intercollegiate athletics 31,592,718 58,743,255Parking facilities 13,284,168 13,513,875Other 47,717,689 46,077,062
Other receipts 87,823,760 88,767,735
Net cash provided (used) by operating activities (324,809,688) (265,015,201)
CASH FLOWS FROM NONCAPITAL FINANCING ACTIVITIES:State appropriations 414,567,046 414,752,096Gifts and grants received for other than capital purposes:
Private gifts for endowment purposes 179,589 57,380Pell grants 21,860,817 21,748,072
Net cash provided by noncapital financing activities 436,607,452 436,557,548
CASH FLOWS FROM CAPITAL AND RELATED FINANCING ACTIVITIES:Proceeds of capital debt 34,130,717 67,229,258Capital appropriations 37,302,971 35,524,624Capital grants and gifts received 8,776,129 5,675,137Proceeds from sales of capital assets 432,776 1,319,403Purchases of capital assets (139,332,596) (138,692,839)Principal paid on debt and capital leases (40,301,971) (82,662,287)Interest paid on debt and capital leases (12,931,628) (14,411,243)Transfers (to) from other University System of Maryland institutions 31,426,115 11,073,800
Net cash provided (used) by capital and related financing activities (80,497,487) (114,944,147)
CASH FLOWS FROM INVESTING ACTIVITIES:Proceeds from sales and maturities of investments 6,019,321 5,469,979Interest on investments 6,031,389 7,021,388Investment expense (352,958) (371,776)Purchases of investments (257,374) (141,101)
Net cash provided by investing activities 11,440,378 11,978,490
Net increase in cash and cash equivalents 42,740,655 68,576,690
Cash and cash equivalents - beginning of the year 576,008,078 507,431,388
Cash and cash equivalents - end of the year $618,748,733 $576,008,078
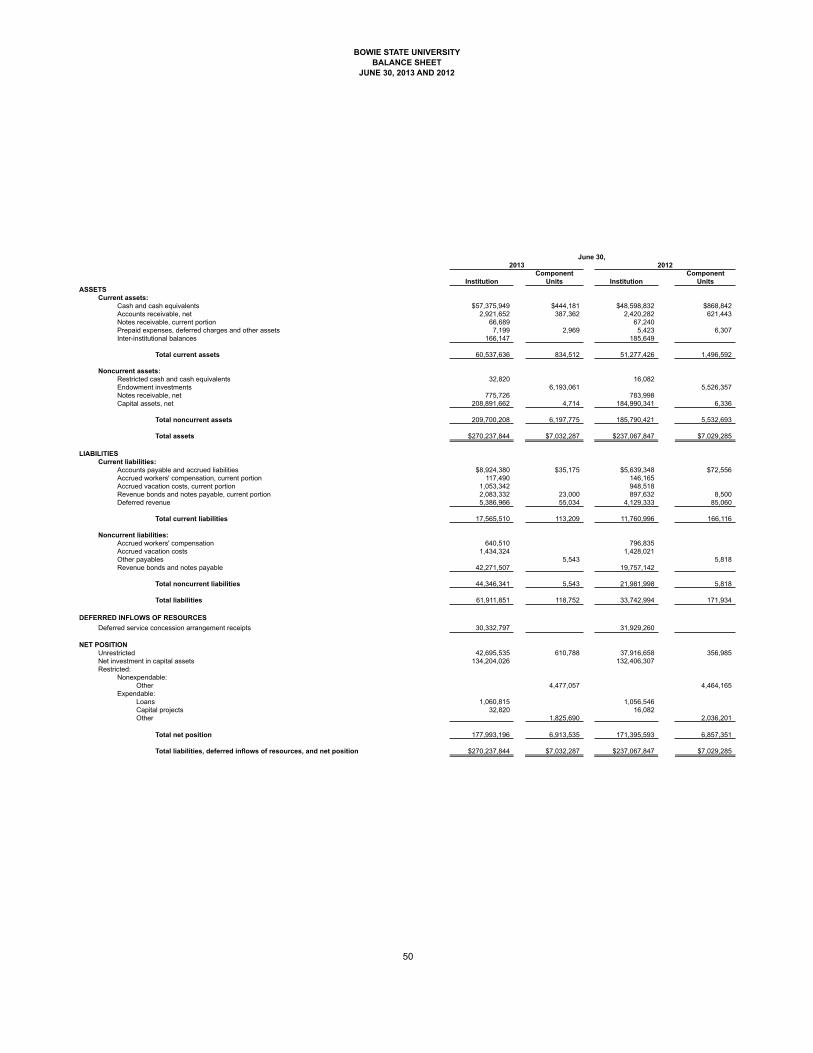
BOWIE STATE UNIVERSITYBALANCE SHEET
JUNE 30, 2013 AND 2012
50
June 30, 2013 2012
Component ComponentInstitution Units Institution Units
ASSETSCurrent assets:
Cash and cash equivalents $57,375,949 $444,181 $48,598,832 $868,842Accounts receivable, net 2,921,652 387,362 2,420,282 621,443Notes receivable, current portion 66,689 67,240Prepaid expenses, deferred charges and other assets 7,199 2,969 5,423 6,307Inter-institutional balances 166,147 185,649
Total current assets 60,537,636 834,512 51,277,426 1,496,592
Noncurrent assets:Restricted cash and cash equivalents 32,820 16,082Endowment investments 6,193,061 5,526,357 Notes receivable, net 775,726 783,998Capital assets, net 208,891,662 4,714 184,990,341 6,336
Total noncurrent assets 209,700,208 6,197,775 185,790,421 5,532,693
Total assets $270,237,844 $7,032,287 $237,067,847 $7,029,285
LIABILITIESCurrent liabilities:
Accounts payable and accrued liabilities $8,924,380 $35,175 $5,639,348 $72,556Accrued workers' compensation, current portion 117,490 146,165Accrued vacation costs, current portion 1,053,342 948,518Revenue bonds and notes payable, current portion 2,083,332 23,000 897,632 8,500Deferred revenue 5,386,966 55,034 4,129,333 85,060
Total current liabilities 17,565,510 113,209 11,760,996 166,116
Noncurrent liabilities:Accrued workers' compensation 640,510 796,835Accrued vacation costs 1,434,324 1,428,021Other payables 5,543 5,818Revenue bonds and notes payable 42,271,507 19,757,142
Total noncurrent liabilities 44,346,341 5,543 21,981,998 5,818
Total liabilities 61,911,851 118,752 33,742,994 171,934
DEFERRED INFLOWS OF RESOURCESDeferred service concession arrangement receipts 30,332,797 31,929,260
NET POSITIONUnrestricted 42,695,535 610,788 37,916,658 356,985Net investment in capital assets 134,204,026 132,406,307Restricted:
Nonexpendable:Other 4,477,057 4,464,165
Expendable:Loans 1,060,815 1,056,546Capital projects 32,820 16,082Other 1,825,690 2,036,201
Total net position 177,993,196 6,913,535 171,395,593 6,857,351
Total liabilities, deferred inflows of resources, and net position $270,237,844 $7,032,287 $237,067,847 $7,029,285

BOWIE STATE UNIVERSITYSTATEMENT OF REVENUES, EXPENSES AND CHANGES IN NET POSITION
YEARS ENDED JUNE 30, 2013 AND 2012
51
Years ended June 30,
Component ComponentUnits Units
OPERATING REVENUES:Tuition and fees $32,383,721 $32,845,995Less: scholarship allowances (11,570,215) $20,813,506 (11,873,636) $20,972,359Federal grants and contracts 7,252,227 6,351,685State and local grants and contracts 1,125,173 1,607,584Nongovernmental grants and contracts 536,038 565,437Sales and services of educational departments 228,634 352,961Auxiliary enterprises:
Residential facilities 5,775,161 5,877,608Less: scholarship allowances (320,357) 5,454,804 (274,858) 5,602,750
Dining facilities 3,941,056 3,768,660Less: scholarship allowances (724,207) 3,216,849 (652,854) 3,115,806
Intercollegiate athletics 3,126,036 3,096,042Less: scholarship allowances (371,855) 2,754,181 (441,443) 2,654,599Parking facilities 279,487 383,097Other auxiliary enterprises revenues 4,398,269 4,116,362
Total operating revenues 46,059,168 45,722,640
OPERATING EXPENSES:Instruction 29,967,350 28,519,319Research 536,756 901,722Public service 918,099 723,427Academic support 14,622,355 11,667,303Student services 6,080,981 6,014,129Institutional support 13,414,125 12,804,141Operation and maintenance of plant 6,688,296 6,561,090Scholarships and fellowships 1,326,168 1,508,149Auxiliary enterprises:
Residential facilities 5,168,638 4,555,123Dining facilities 3,671,300 3,684,027Intercollegiate athletics 3,099,443 3,163,295Other auxiliary enterprises expenses 2,705,690 2,003,342
Total operating expenses 88,199,201 82,105,067
Operating income (loss) (42,140,033) (36,382,427)
NONOPERATING REVENUES (EXPENSES):State appropriations 35,980,840 35,828,720Pell grants 9,200,495 10,073,556Gifts $836,536 $872,446Investment income 534,941 354,838 548,669 12,696Interest on indebtedness (1,205,627) (595,385)Other affiliated foundation revenues 202,917 202,245Other affiliated foundation expenses (1,338,107) (1,418,242)Transfers (to) from other University System of Maryland institutions (990,796) (1,059,945)
Total nonoperating revenues (expenses) 43,519,853 56,184 44,795,615 (330,855)
Income (loss) before other revenue 1,379,820 56,184 8,413,188 (330,855)
OTHER REVENUE:Capital appropriations 5,217,783 11,349,665
Total other revenue 5,217,783 11,349,665
Increase (decrease) in net position 6,597,603 56,184 19,762,853 (330,855)
Net position - beginning of year 171,395,593 6,857,351 151,632,740 7,188,206
Net position - end of year $177,993,196 $6,913,535 $171,395,593 $6,857,351
Institution Institution
2013 2012

BOWIE STATE UNIVERSITYSTATEMENT OF CASH FLOWS
YEARS ENDED JUNE 30, 2013 AND 2012
52
Years ended June 30, 2013 2012
CASH FLOWS FROM OPERATING ACTIVITIES:Tuition and fees $21,055,654 $20,808,139Research contracts and grants 9,527,593 10,094,155Payments to employees (53,954,237) (51,290,138)Payments to suppliers and contractors (23,945,021) (25,678,136)Loans issued to students (71,500) (65,600)Collections of loans to students 77,473 76,988Auxiliary enterprises:
Residential facilities 3,858,344 4,006,287Dining facilities 3,216,849 3,115,806Intercollegiate athletics 2,754,181 2,654,599Parking facilities 279,487 383,097Other 4,398,269 4,116,362
Other receipts (payments) 996,752 (507,247)
Net cash provided (used) by operating activities (31,806,156) (32,285,688)
CASH FLOWS FROM NONCAPITAL FINANCING ACTIVITIES:State appropriations 35,980,840 35,828,720Pell grants 9,200,495 10,073,556
Net cash provided by noncapital financing activities 45,181,335 45,902,276
CASH FLOWS FROM CAPITAL AND RELATED FINANCING ACTIVITIES:Proceeds of capital debt 19,098,905 5,555,463Capital appropriations 5,217,783 11,349,665Purchases of capital assets (32,009,725) (22,376,393)Principal paid on debt and capital leases (1,763,458) (1,483,129)Interest paid on debt and capital leases (1,207,088) (661,546)Transfers (to) from other University System of Maryland institutions 5,547,317 (727,461)
Net cash provided (used) by capital and related financing activities (5,116,266) (8,343,401)
CASH FLOWS FROM INVESTING ACTIVITIES:Interest on investments 534,942 548,669
Net cash provided by investing activities 534,942 548,669
Net increase in cash and cash equivalents 8,793,855 5,821,856
Cash and cash equivalents - beginning of the year 48,614,914 42,793,058
Cash and cash equivalents - end of the year $57,408,769 $48,614,914

TOWSON UNIVERSITYBALANCE SHEET
JUNE 30, 2013 AND 2012
53
June 30, 2013 2012
Component ComponentInstitution Units Institution Units
ASSETSCurrent assets:
Cash and cash equivalents $190,408,836 $5,287,876 $193,769,409 $3,564,722Accounts receivable, net 13,777,212 164,930 17,469,934 179,794Notes receivable, current portion 1,570,730 1,461,521Inventories 3,484,241 3,630,392Prepaid expenses, deferred charges and other assets 2,683,031 128,722 2,373,492 169,942Inter-institutional balances 953,338 378,428
Total current assets 212,877,388 5,581,528 219,083,176 3,914,458
Noncurrent assets:Restricted cash and cash equivalents 48,094 52,227Accounts receivable, net 954,239 522,006Endowment investments 4,242,258 54,516,247 4,182,778 48,666,519 Other investments 4,159,029 4,114,927Notes receivable, net 10,908,047 10,892,833Other assets 1,200,000Capital assets, net 693,664,865 3,502 628,348,338 3,634
Total noncurrent assets 708,863,264 59,633,017 643,476,176 54,507,086
Total assets $921,740,652 $65,214,545 $862,559,352 $58,421,544
LIABILITIESCurrent liabilities:
Accounts payable and accrued liabilities $35,765,436 $482,591 $29,424,970 $266,187Accrued workers' compensation, current portion 263,500 283,960Accrued vacation costs, current portion 5,446,805 3,768,879Revenue bonds and notes payable, current portion 13,772,126 10,073,004 1,000,000Deferred revenue 8,599,619 10,682,133Current portion of obligations under capital lease agreements 787,654
Total current liabilities 64,635,140 482,591 54,232,946 1,266,187
Noncurrent liabilities:Accrued workers' compensation 1,436,500 1,548,040Accrued vacation costs 4,259,827 5,550,525Endowments invested on behalf of primary government 4,159,029 4,114,927Revenue bonds and notes payable 233,082,235 213,182,640Obligations under capital lease agreements 8,646,205 10,493,036
Total noncurrent liabilities 247,424,767 4,159,029 230,774,241 4,114,927
Total liabilities 312,059,907 4,641,620 285,007,187 5,381,114
DEFERRED INFLOWS OF RESOURCESDeferred service concession arrangement receipts 53,492,728 56,059,633
NET POSITIONUnrestricted 155,311,759 2,915,807 166,192,256 2,749,334Net investment in capital assets 383,883,917 338,540,025Restricted:
Nonexpendable:Scholarships and fellowships 265,025 22,591,446 265,025 21,027,428Research 10,203 10,003Other 14,464,990 13,344,540
Expendable:Scholarships and fellowships 7,145 7,799,569 3,600 5,448,293Research 5,050 3,639Loans 14,274,216 14,067,270Other 2,445,955 12,785,860 2,424,356 10,457,193
Total net position 556,188,017 60,572,925 521,492,532 53,040,430
Total liabilities, deferred inflows of resources, and net position $921,740,652 $65,214,545 $862,559,352 $58,421,544

TOWSON UNIVERSITYSTATEMENT OF REVENUES, EXPENSES AND CHANGES IN NET POSITION
YEARS ENDED JUNE 30, 2013 AND 2012
54
Years ended June 30, 2013 2012
Component ComponentUnits Units
OPERATING REVENUES:Tuition and fees $166,480,350 $162,784,079Less: scholarship allowances (38,754,813) $127,725,537 (38,140,985) $124,643,094Federal grants and contracts 2,823,696 3,122,304State and local grants and contracts 9,697,188 7,316,210Nongovernmental grants and contracts 1,671,604 2,093,008Sales and services of educational departments 4,414,901 4,036,249Auxiliary enterprises:
Residential facilities 25,039,964 24,577,733Less: scholarship allowances (1,113,950) 23,926,014 (1,038,997) 23,538,736
Dining facilities 21,183,349 20,650,614Less: scholarship allowances (546,518) 20,636,831 (469,728) 20,180,886
Intercollegiate athletics 17,403,112 17,401,323Less: scholarship allowances (3,037,107) 14,366,005 (2,746,504) 14,654,819
Bookstore 9,029,642 9,346,762Less: scholarship allowances (1,588,233) 7,441,409 (1,501,047) 7,845,715Parking facilities 7,686,333 8,186,508Other auxiliary enterprises revenues 30,266,475 27,867,959
Total operating revenues 250,655,993 243,485,488
OPERATING EXPENSES:Instruction 108,012,970 108,709,031Research 4,897,739 4,379,962Public service 18,294,312 18,129,207Academic support 41,089,796 38,600,899Student services 16,138,605 16,779,877Institutional support 34,413,156 35,176,037Operation and maintenance of plant 14,440,470 34,219,376Scholarships and fellowships 11,850,204 9,823,804Auxiliary enterprises:
Residential facilities 17,709,327 15,489,987Dining facilities 17,434,201 16,924,508Intercollegiate athletics 15,906,472 15,717,525Bookstore 8,604,610 8,344,724Parking facilities 4,069,132 4,621,542Other auxiliary enterprises expenses 16,940,237 15,538,450
Hospital
Total operating expenses 329,801,231 342,454,929
Operating income (loss) (79,145,238) (98,969,441)
NONOPERATING REVENUES (EXPENSES):State appropriations 91,329,197 90,924,480Pell grants 18,755,390 17,797,551Gifts 358,110 $7,009,967 1,070,555 $4,994,656Investment income 2,640,662 5,871,892 2,774,256 1,051,537 Less: Investment expense (15,225) 2,625,437 (15,953) 2,758,303Interest on indebtedness (8,880,283) (7,059,390)Other revenues (expenses), gains and (losses) 11,550,685 11,610,508Other affiliated foundation revenues 820,404 1,527,732Other affiliated foundation expenses (6,169,768) (6,004,994)Transfers (to) from other University System of Maryland institutions (5,733,711) (6,264,461)
Total nonoperating revenues (expenses) 110,004,825 7,532,495 110,837,546 1,568,931
Income before other revenues 30,859,587 7,532,495 11,868,105 1,568,931
OTHER REVENUES:Capital appropriations 1,611,688 11,210,089Capital gifts and grants 2,224,210 44,670Additions to permanent endowments 26,987
Total other revenue 3,835,898 11,281,746
Increase in net position 34,695,485 7,532,495 23,149,851 1,568,931
Net position - beginning of year 521,492,532 53,040,430 498,342,681 51,471,499
Net position - end of year $556,188,017 $60,572,925 $521,492,532 $53,040,430
Institution Institution

TOWSON UNIVERSITYSTATEMENT OF CASH FLOWS
YEARS ENDED JUNE 30, 2013 AND 2012
55
Years ended June 30,2013 2012
CASH FLOWS FROM OPERATING ACTIVITIES:Tuition and fees $126,796,952 $124,702,331Research contracts and grants 16,108,812 10,915,163Payments to employees (207,958,533) (201,661,581)Payments to suppliers and contractors (84,066,043) (108,821,603)Loans issued to students (1,703,427) (1,456,076)Collections of loans to students 1,579,004 2,087,025Auxiliary enterprises:
Residential facilities 23,597,069 21,002,928Dining facilities 20,618,983 20,176,836Intercollegiate athletics 14,552,426 8,235,682Bookstore 7,211,397 14,328,838Parking facilities 7,689,432 7,343,796Other 30,172,876 27,788,933
Other receipts 17,308,193 14,844,657
Net cash provided (used) by operating activities (28,092,859) (60,513,071)
CASH FLOWS FROM NONCAPITAL FINANCING ACTIVITIES:State appropriations 91,329,197 90,924,480Gifts and grants received for other than capital purposes:
Private gifts for endowment purposes 26,987Pell grants 18,755,390 17,797,551
Net cash provided by noncapital financing activities 110,084,587 108,749,018
CASH FLOWS FROM CAPITAL AND RELATED FINANCING ACTIVITIES:Proceeds of capital debt 36,385,072 42,664,494Capital appropriations 1,611,688 11,210,089Purchases of capital assets (95,046,006) (103,384,332)Principal paid on debt and capital leases (29,381,068) (17,416,709)Interest paid on debt and capital leases (11,878,880) (7,526,204)Transfers (to) from other University System of Maryland institutions 10,386,803 30,780,075
Net cash provided (used) by capital and related financing activities (87,922,391) (43,672,587)
CASH FLOWS FROM INVESTING ACTIVITIES:Proceeds from sales and maturities of investments 251,765 234,277Interest on investments 2,334,417 2,758,592Investment expense (15,225) (15,953)Purchases of investments (5,000) (26,987)
Net cash provided by investing activities 2,565,957 2,949,929
Net increase (decrease) in cash and cash equivalents (3,364,706) 7,513,289
Cash and cash equivalents - beginning of the year 193,821,636 186,308,347
Cash and cash equivalents - end of the year $190,456,930 $193,821,636

UNIVERSITY OF MARYLAND EASTERN SHOREBALANCE SHEET
JUNE 30, 2013 AND 2012
56
June 30,2013 2012
Component ComponentInstitution Units Institution Units
ASSETSCurrent assets:
Cash and cash equivalents $17,534,660 $89,520 $17,967,962Accounts receivable, net 5,354,982 6,202,023 5,784,338 $621,848Notes receivable, current portion 1,112,169 1,131,934Prepaid expenses, deferred charges and other assets 167,864 1,316Inter-institutional balances 1,142,608 85,849
Total current assets 25,312,283 6,291,543 24,970,083 623,164
Noncurrent assets:Accounts receivable, net 132,842 140,509Endowment investments 4,255,452 18,695,232 3,725,938 20,488,266 Other investments 4,938,708 4,144,101Notes receivable, net 4,396,026 4,394,486Other assets 535,728Capital assets, net 165,274,913 635,206 165,497,904
Total noncurrent assets 173,926,391 24,937,716 173,618,328 24,772,876
Total assets $199,238,674 $31,229,259 $198,588,411 $25,396,040
LIABILITIESCurrent liabilities:
Accounts payable and accrued liabilities $7,679,522 $5,555,536 $6,141,878 $30,922Accrued workers' compensation, current portion 188,790 153,915Accrued vacation costs, current portion 1,312,644 1,140,637Revenue bonds and notes payable, current portion 3,450,945 3,649,201Deferred revenue 1,242,006 107,960 1,486,757
Total current liabilities 13,873,907 5,663,496 12,572,388 30,922
Noncurrent liabilities:Accrued workers' compensation 1,029,210 839,085Accrued vacation costs 3,025,967 2,943,394Endowments invested on behalf of primary government 4,255,452 3,725,938Revenue bonds and notes payable 40,691,546 44,566,776
Total noncurrent liabilities 44,746,723 4,255,452 48,349,255 3,725,938
Total liabilities 58,620,630 9,918,948 60,921,643 3,756,860
NET POSITIONUnrestricted 9,511,242 5,754,143 10,347,469 1,990,805Net investment in capital assets 121,132,422 117,281,927Restricted:
Nonexpendable:Scholarships and fellowships 28,009 6,109,200 28,009 9,307,395Research 161,687 259,479Other 4,760,636 7,179,686
Expendable:Scholarships and fellowships 2,308,037 1,332,818 2,036,896 889,351Research 803,256 576,051Loans 6,328,434 6,676,875Other 1,309,900 2,388,571 1,295,592 1,436,413
Total net position 140,618,044 21,310,311 137,666,768 21,639,180
Total liabilities and net position $199,238,674 $31,229,259 $198,588,411 $25,396,040

UNIVERSITY OF MARYLAND EASTERN SHORESTATEMENT OF REVENUES, EXPENSES AND CHANGES IN NET POSITION
YEARS ENDED JUNE 30, 2013 AND 2012
57
Years ended June 30,2013 2012
Component ComponentUnits Units
OPERATING REVENUES:Tuition and fees $31,578,523 $29,712,752Less: scholarship allowances (13,220,151) $18,358,372 (13,441,000) $16,271,752Federal grants and contracts 9,615,628 11,797,936State and local grants and contracts 11,429,384 7,967,714Nongovernmental grants and contracts 723,619 972,821Sales and services of educational departments 124,685 121,400Auxiliary enterprises:
Residential facilities 10,683,119 10,689,675Less: scholarship allowances (892,040) 9,791,079 (813,706) 9,875,969
Dining facilities 7,120,906 7,296,744Less: scholarship allowances (1,316,696) 5,804,210 (1,058,200) 6,238,544Intercollegiate athletics 2,599,818 2,561,557Parking facilities 153,745 159,808Other auxiliary enterprises revenues 6,088,561 5,798,695
Other operating revenues 1,506,290 3,562,569
Total operating revenues 66,195,391 65,328,765
OPERATING EXPENSES:Instruction 34,738,926 31,399,566Research 10,342,997 13,049,777Public service 1,690,796 1,032,335Academic support 11,351,171 10,439,063Student services 5,624,346 5,745,508Institutional support 10,186,062 10,035,918Operation and maintenance of plant 11,365,006 11,024,291Scholarships and fellowships 470,315 447,741Auxiliary enterprises:
Residential facilities 7,695,016 8,039,051Dining facilities 5,482,603 5,898,818Intercollegiate athletics 3,608,159 4,108,890Other auxiliary enterprises expenses 6,657,294 6,190,497
Total operating expenses 109,212,691 107,411,455
Operating income (loss) (43,017,300) (42,082,690)
NONOPERATING REVENUES (EXPENSES):State appropriations 32,222,965 32,447,596Pell grants 9,272,682 9,790,688Gifts 307,000 $779,093 366,000 $441,215Investment income (loss) 612,168 (916,388) 453,637 171,442 Less: Investment expense (13,785) 598,383 (12,805) 440,832Interest on indebtedness (1,720,205) (1,798,212)Other revenues (expenses), gains and (losses) 1,071,839 (1,349,676)Other affiliated foundation revenues 1,466,684 (3,665)Other affiliated foundation expenses (1,658,258) (1,060,721)Transfers (to) from other University System of Maryland institutions 62,801 478,523
Total nonoperating revenues (expenses) 41,815,465 (328,869) 40,375,751 (451,729)
Income (loss) before other revenue (1,201,835) (328,869) (1,706,939) (451,729)
OTHER REVENUE:Capital appropriations 4,153,111 1,824,708
Total other revenue 4,153,111 1,824,708
Increase (decrease) in net position 2,951,276 (328,869) 117,769 (451,729)
Net position - beginning of year 137,666,768 21,639,180 137,548,999 22,090,909
Net position - end of year $140,618,044 $21,310,311 $137,666,768 $21,639,180
Institution Institution

UNIVERSITY OF MARYLAND EASTERN SHORESTATEMENT OF CASH FLOWS
YEARS ENDED JUNE 30, 2013 AND 2012
58
Years ended June 30,2013 2012
CASH FLOWS FROM OPERATING ACTIVITIES:Tuition and fees $18,502,769 $16,107,481Research contracts and grants 21,951,080 21,050,211Payments to employees (69,282,736) (68,715,893)Payments to suppliers and contractors (30,035,098) (30,314,595)Loans issued to students (997,500) (2,816,780)Collections of loans to students 1,015,725 989,913Auxiliary enterprises:
Residential facilities 9,791,079 9,875,969Dining facilities 5,804,210 6,238,544Intercollegiate athletics 2,599,818 2,561,557Parking facilities 153,745 159,808Other 5,946,320 5,554,958
Other receipts 3,895,684 4,014,781
Net cash provided (used) by operating activities (30,654,904) (35,294,046)
CASH FLOWS FROM NONCAPITAL FINANCING ACTIVITIES:State appropriations 32,222,965 32,447,596Pell grants 9,272,682 9,790,688
Net cash provided by noncapital financing activities 41,495,647 42,238,284
CASH FLOWS FROM CAPITAL AND RELATED FINANCING ACTIVITIES:Proceeds of capital debt 1,970,381 7,078,707Capital appropriations 4,153,111 1,824,708Purchases of capital assets (8,659,030) (4,341,597)Principal paid on debt and capital leases (5,817,831) (11,341,227)Interest paid on debt and capital leases (2,033,004) (2,309,833)Transfers (to) from other University System of Maryland institutions (956,541) 1,065,409
Net cash provided (used) by capital and related financing activities (11,342,914) (8,023,833)
CASH FLOWS FROM INVESTING ACTIVITIES:Proceeds from sales and maturities of investments 14,426 114,674Interest on investments 375,228 439,818Investment expense (13,785) (12,805)Purchases of investments (307,000) (366,000)
Net cash provided by investing activities 68,869 175,687
Net increase (decrease) in cash and equivalents (433,302) (903,908)
Cash and cash equivalents - beginning of the year 17,967,962 18,871,870
Cash and cash equivalents - end of the year $17,534,660 $17,967,962

FROSTBURG STATE UNIVERSITYBALANCE SHEET
JUNE 30, 2013 AND 2012
59
June 30,2013 2012
Component ComponentInstitution Units Institution Units
ASSETSCurrent assets:
Cash and cash equivalents $26,554,267 $583,354 $28,124,607 $536,425Accounts receivable, net 2,055,028 105,785 2,152,931 850,936Notes receivable, current portion 117,528 114,386Inventories 898,206 882,576Prepaid expenses, deferred charges and other assets 357,925 18,161 699,795 182,498Inter-institutional balances 563,728 195,658
Total current assets 30,546,682 707,300 32,169,953 1,569,859
Noncurrent assets:Restricted cash and cash equivalents 157,338 208,652Accounts receivable, net 497,476Endowment investments 1,135,319 15,385,773 1,066,915 14,464,881 Other investments 2,011,432 1,849,630Notes receivable, net 950,909 925,484Other assets 257,845Capital assets, net 139,926,156 977 115,235,116 1,136
Total noncurrent assets 142,169,722 18,153,503 117,436,167 16,315,647
Total assets $172,716,404 $18,860,803 $149,606,120 $17,885,506
LIABILITIESCurrent liabilities:
Accounts payable and accrued liabilities $8,208,430 $16,129 $7,612,296 $28,031Accrued workers' compensation, current portion 121,675 112,995Accrued vacation costs, current portion 3,362,255 3,079,908Revenue bonds and notes payable, current portion 1,221,064 1,253,838Deferred revenue 1,352,666 32,866 1,281,558 190,410
Total current liabilities 14,266,090 48,995 13,340,595 218,441
Noncurrent liabilities:Accrued workers' compensation 663,325 616,005Endowments invested on behalf of primary government 1,135,319 1,066,915Revenue bonds and notes payable 21,834,016 22,558,993
Total noncurrent liabilities 22,497,341 1,135,319 23,174,998 1,066,915
Total liabilities 36,763,431 1,184,314 36,515,593 1,285,356
DEFERRED INFLOWS OF RESOURCESDeferred service concession arrangement receipts 23,450,360 24,622,878
NET POSITIONUnrestricted 16,311,501 288,003 18,936,502 140,352Net investment in capital assets 93,420,716 66,799,407Restricted:
Nonexpendable:Scholarships and fellowships 10,820,115Research 31,171Other 750,000 4,617,153 750,000
Expendable:Scholarships and fellowships 9,748 100,766 1,625Research 465,882 42,373 427,543Loans 1,132,963 1,109,473Capital projects 157,338 208,652Other 254,465 1,776,908 234,447 16,459,798
Total net position 112,502,613 17,676,489 88,467,649 16,600,150
Total liabilities, deferred inflows of resources, and net position $172,716,404 $18,860,803 $149,606,120 $17,885,506

FROSTBURG STATE UNIVERSITYSTATEMENT OF REVENUES, EXPENSES AND CHANGES IN NET POSITION
YEARS ENDED JUNE 30, 2013 AND 2012
60
Years ended June 30,
Component ComponentUnits Units
OPERATING REVENUES:Tuition and fees $33,496,207 $32,877,215Less: scholarship allowances (7,404,498) $26,091,709 (7,425,763) $25,451,452Federal grants and contracts 1,896,872 2,018,614State and local grants and contracts 1,732,183 2,006,908Nongovernmental grants and contracts 212,269 179,733Sales and services of educational departments 947,968 820,486Auxiliary enterprises:
Residential facilities 6,843,982 7,061,823Less: scholarship allowances (64,808) 6,779,174 (75,363) 6,986,460
Dining facilities 7,193,439 7,422,613Less: scholarship allowances (18,332) 7,175,107 (21,914) 7,400,699
Intercollegiate athletics 3,116,651 3,153,601Less: scholarship allowances (79,426) 3,037,225 (98,777) 3,054,824
Bookstore 2,023,627 2,162,034Less: scholarship allowances (4,728) 2,018,899 (5,673) 2,156,361
Other auxiliary enterprises revenues 4,924,333 4,667,982Less: scholarship allowances (39,478) 4,884,855 (37,606) 4,630,376
Other operating revenues 517,345 586,984
Total operating revenue 55,293,606 55,292,897
OPERATING EXPENSES:Instruction 30,751,905 30,488,048Research 124,456 294,373Public service 3,014,610 3,562,469Academic support 9,341,503 8,912,925Student services 5,046,795 4,678,257Institutional support 12,842,650 12,348,228Operation and maintenance of plant 9,814,450 9,221,798Scholarships and fellowships 6,098,765 5,952,685Auxiliary enterprises:
Residential facilities 4,203,745 4,963,883Dining facilities 4,870,680 5,073,337Intercollegiate athletics 3,485,953 3,263,232Bookstore 2,291,768 2,301,604Other auxiliary enterprises expenses 4,943,741 3,880,747
Total operating expenses 96,831,021 94,941,586
Operating income (loss) (41,537,415) (39,648,689)
NONOPERATING REVENUES (EXPENSES):State appropriations 33,450,191 33,471,091Pell grants 6,933,682 7,014,715Gifts 901,112 $1,376,455 938,302 $1,450,970Investment income 409,578 1,231,354 420,862 234,848 Less: Investment expense (3,948) 405,630 (3,918) 416,944Interest on indebtedness (799,565) (778,732)Other revenues (expenses), gains and (losses) (24,791) (343,089)Other affiliated foundation revenues 492,456 434,416Other affiliated foundation expenses (2,023,926) (2,297,064)Transfers (to) from other University System of Maryland institutions (522,153) 153,328
Total nonoperating revenues (expenses) 40,344,106 1,076,339 40,872,559 (176,830)
Income (loss) before other revenues (1,193,309) 1,076,339 1,223,870 (176,830)
OTHER REVENUES:Capital appropriations 25,206,918 4,540,485Capital gifts and grants 21,355 25,726
Total other revenues 25,228,273 4,566,211
Increase (decrease) in net position 24,034,964 1,076,339 5,790,081 (176,830)
Net position - beginning of year 88,467,649 16,600,150 82,677,568 16,776,980
Net position - end of year $112,502,613 $17,676,489 $88,467,649 $16,600,150
Institution Institution
2013 2012

FROSTBURG STATE UNIVERSITYSTATEMENT OF CASH FLOWS
YEARS ENDED JUNE 30, 2013 AND 2012
61
Years ended June 30,2013 2012
CASH FLOWS FROM OPERATING ACTIVITIES:Tuition and fees $26,359,157 $25,266,572Research contracts and grants 3,849,566 4,234,511Payments to employees (61,740,802) (59,717,836)Payments to suppliers and contractors (27,498,310) (27,641,030)Loans issued to students (175,068) (208,080)Collections of loans to students 146,501 192,912Auxiliary enterprises:
Residential facilities 5,606,655 5,813,943Dining facilities 7,158,933 7,361,019Intercollegiate athletics 3,037,225 3,055,324Bookstore 2,051,215 1,992,941Other 4,850,870 4,632,915
Other receipts 2,420,812 2,250,048
Net cash provided (used) by operating activities (33,933,246) (32,766,761)
CASH FLOWS FROM NONCAPITAL FINANCING ACTIVITIES:State appropriations 33,450,191 33,471,091Pell grants 6,933,682 7,014,715
Net cash provided by noncapital financing activities 40,383,873 40,485,806
CASH FLOWS FROM CAPITAL AND RELATED FINANCING ACTIVITIES:Proceeds of capital debt 1,070,160 1,459,453Capital appropriations 25,206,918 4,540,485Purchases of capital assets (31,161,212) (10,200,972)Principal paid on debt and capital leases (2,085,620) (3,110,502)Interest paid on debt and capital leases (899,765) (989,154)Transfers (to) from other University System of Maryland institutions (539,988) 296,209
Net cash provided (used) by capital and related financing activities (8,409,507) (8,004,481)
CASH FLOWS FROM INVESTING ACTIVITIES:Proceeds from sales and maturities of investments 6,210 2,594Interest on investments 334,964 417,332Investment expense (3,948) (3,918)Purchases of investments (7,053)
Net cash provided by investing activities 337,226 408,955
Net increase (decrease) in cash and cash equivalents (1,621,654) 123,519
Cash and cash equivalents - beginning of the year 28,333,259 28,209,740
Cash and cash equivalents - end of the year $26,711,605 $28,333,259

COPPIN STATE UNIVERSITYBALANCE SHEET
JUNE 30, 2013 AND 2012
62
June 30,2013 2012
Component ComponentInstitution Units Institution Units
ASSETSCurrent assets:
Cash and cash equivalents $1,804,975 $78,575 $2,120,759Accounts receivable, net $4,473,784 367,280 3,234,801 322,050Notes receivable, current portion 56,192 56,192Inventories 108,085Prepaid expenses, deferred charges and other assets 30,080 4,245 200,310 10,483Inter-institutional balances (3,215,572) (5,409,076)
Total current assets 1,344,484 2,176,500 (1,731,113) 2,453,292
Noncurrent assets:Restricted cash and cash equivalents 61,547 169,298Endowment investments 779,586 8,084,447 778,550 7,648,921 Other investments 825,202 778,550Notes receivable, net 1,520,296 1,455,594Other assets 222,107Capital assets, net 280,316,557 278,378,379
Total noncurrent assets 282,677,986 8,909,649 280,781,821 8,649,578
Total assets $284,022,470 $11,086,149 $279,050,708 $11,102,870
LIABILITIESCurrent liabilities:
Accounts payable and accrued liabilities $5,991,349 $170,474 $5,420,211 $144,763Accrued workers' compensation, current portion 164,145 152,210Accrued vacation costs, current portion 1,170,164 778,736Revenue bonds and notes payable, current portion 1,862,615 1,653,163Deferred revenue 2,290,778 1,854,970
Total current liabilities 11,479,051 170,474 9,859,290 144,763
Noncurrent liabilities:Accrued workers' compensation 894,855 829,790Accrued vacation costs 1,720,763 2,765,807Endowments invested on behalf of primary government 779,586 778,550Other payables 5,662 75Revenue bonds and notes payable 27,831,136 28,915,720
Total noncurrent liabilities 30,446,754 785,248 32,511,317 778,625
Total liabilities 41,925,805 955,722 42,370,607 923,388
NET POSITIONUnrestricted (12,692,750) 89,532 (15,088,901) 349,204Net investment in capital assets 250,890,488 247,809,496Restricted:
Nonexpendable:Scholarships and fellowships 413,474 413,474Other 240,125 6,712,337 240,125 6,615,026
Expendable:Scholarships and fellowships 9,301 676,366 15,572Loans 3,174,480 3,121,037Capital projects 61,547 169,298Other 2,652,192 3,215,252
Total net position 242,096,665 10,130,427 236,680,101 10,179,482
Total liabilities and net position $284,022,470 $11,086,149 $279,050,708 $11,102,870

COPPIN STATE UNIVERSITYSTATEMENT OF REVENUES, EXPENSES AND CHANGES IN NET POSITION
YEARS ENDED JUNE 30, 2013 AND 2012
63
Years ended June 30,
Component ComponentUnits Units
OPERATING REVENUES:Tuition and fees $15,997,942 $13,637,933Less: scholarship allowances (12,091,181) $3,906,761 (12,526,084) $1,111,849Federal grants and contracts 6,718,493 8,999,913State and local grants and contracts 1,960,047 1,928,135Nongovernmental grants and contracts 970,055 684,653Sales and services of educational departments 844,240 798,166Auxiliary enterprises:
Residential facilities 3,216,805 3,209,071Less: scholarship allowances (46,618) 3,170,187 (128,288) 3,080,783Dining facilities 2,465,850 2,455,863Intercollegiate athletics 3,091,057 3,026,984Less: scholarship allowances (1,114,720) 1,976,337 (946,543) 2,080,441Parking facilities 1,848,018 1,929,445Other auxiliary enterprises revenues 1,917,743 2,024,538
Total operating revenues 25,777,731 25,093,786
OPERATING EXPENSES:Instruction 24,499,434 27,158,153Research 56,581 62,667Public service 149,236 468,543Academic support 7,388,534 8,650,610Student services 5,472,146 6,449,064Institutional support 18,278,352 19,658,274Operation and maintenance of plant 9,053,544 9,886,153Scholarships and fellowships 286,269 390,802Auxiliary enterprises:
Residential facilities 2,141,980 1,795,041Dining facilities 2,193,382 2,163,935Intercollegiate athletics 3,572,802 3,501,020Parking facilities 439,877 388,650Other auxiliary enterprises expenses 2,173,076 2,376,166
Total operating expenses 75,705,213 82,949,078
Operating income (loss) (49,927,482) (57,855,292)
NONOPERATING REVENUES (EXPENSES):State appropriations 38,067,908 37,943,492Pell grants 8,338,756 9,328,728Gifts $517,649 $1,459,181Investment income (loss) 52,476 592,479 (12,622) 87,666 Less: Investment expense (2,881) 49,595 (3,019) (15,641)Interest on indebtedness (1,159,965) (1,144,783)Other revenues (expenses), gains and (losses) (6,806) (6,674)Other affiliated foundation revenues 259,811 268,280Other affiliated foundation expenses (1,418,994) (2,098,764)Transfers (to) from other University System of Maryland institutions 542,212 222,084
Total nonoperating revenues (expenses) 45,831,700 (49,055) 46,327,206 (283,637)
Income (loss) before other revenue (4,095,782) (49,055) (11,528,086) (283,637)
OTHER REVENUE:Capital appropriations 9,512,346 12,093,572
Total other revenue 9,512,346 12,093,572
Increase (decrease) in net position 5,416,564 (49,055) 565,486 (283,637)
Net position - beginning of year 236,680,101 10,179,482 236,114,615 10,463,119
Net position - end of year $242,096,665 $10,130,427 $236,680,101 $10,179,482
Institution Institution
2013 2012

COPPIN STATE UNIVERSITYSTATEMENT OF CASH FLOWS
YEARS ENDED JUNE 30, 2013 AND 2012
64
Years ended June 30,2013 2012
CASH FLOWS FROM OPERATING ACTIVITIES:Tuition and fees $2,667,778 $4,858,797Research contracts and grants 10,084,403 11,165,170Payments to employees (49,483,433) (51,971,880)Payments to suppliers and contractors (17,158,295) (21,911,649)Loans issued to students (509,587) (672,491)Collections of loans to students 444,885 38,396Auxiliary enterprises:
Residential facilities 3,170,187 3,080,783Dining facilities 2,465,850 2,455,863Intercollegiate athletics 1,976,337 2,080,441Parking facilities 1,848,018 1,929,445Other 1,917,743 2,594,351
Other receipts 927,461 221,679
Net cash provided (used) by operating activities (41,648,653) (46,131,095)
CASH FLOWS FROM NONCAPITAL FINANCING ACTIVITIES:State appropriations 38,067,908 37,943,492 Pell grants 8,338,756 9,328,728
Net cash provided by noncapital financing activities 46,406,664 47,272,220
CASH FLOWS FROM CAPITAL AND RELATED FINANCING ACTIVITIES:Proceeds of capital debt 1,133,923 2,274,485Capital appropriations 9,512,346 12,093,572Purchases of capital assets (10,821,067) (14,261,887)Principal paid on debt and capital leases (2,295,311) (3,839,081)Interest paid on debt and capital leases (1,240,853) (1,224,884)Transfers (to) from other University System of Maryland institutions (1,284,148) 3,808,609
Net cash provided (used) by capital and related financing activities (4,995,110) (1,149,186)
CASH FLOWS FROM INVESTING ACTIVITIES:Proceeds from sales and maturities of investments 53,654 39,284Interest on investments (14,617)Investment expense (2,881) (3,019)
Net cash provided by investing activities 50,773 21,648
Net increase (decrease) in cash and cash equivalents (186,326) 13,587
Cash and cash equivalents - beginning of the year 247,873 234,286
Cash and cash equivalents - end of the year $61,547 $247,873

UNIVERSITY OF BALTIMOREBALANCE SHEET
JUNE 30, 2013 AND 2012
65
June 30,2013 2012
Component ComponentInstitution Units Institution Units
ASSETSCurrent assets:
Cash and cash equivalents $39,179,967 $11,784,329 $33,072,596 $20,727,745Accounts receivable, net 5,377,722 2,610,300 3,690,744 6,756,379Notes receivable, current portion 361,296 490,682Prepaid expenses, deferred charges and other assets 944,893 304,196 58,570Inter-institutional balances (7,707,171) (8,177,943)
Total current assets 38,156,707 14,394,629 29,380,275 27,542,694
Noncurrent assets:Restricted cash and cash equivalents 122,877 146,516Accounts receivable, net 5,292,974Endowment investments 38,750,242 39,508,346 Other investments 3,308,431Notes receivable, net 2,886,481 3,462,804Other assets 1,040,107Capital assets, net 189,177,176 865,696 145,822,908 1,371,285
Total noncurrent assets 192,186,534 49,257,450 149,432,228 40,879,631
Total assets $230,343,241 $63,652,079 $178,812,503 $68,422,325
LIABILITIESCurrent liabilities:
Accounts payable and accrued liabilities $13,411,700 $2,887,445 $6,772,604 $658,011Accrued workers' compensation, current portion 98,115 102,300Accrued vacation costs, current portion 2,725,010 2,666,369Revenue bonds and notes payable, current portion 1,863,328 2,445,823Deferred revenue 7,098,496 717,097 7,206,068 269,700
Total current liabilities 25,196,649 3,604,542 19,193,164 927,711
Noncurrent liabilities:Accrued workers' compensation 534,885 557,700Accrued vacation costs 1,198,045 929,754Revenue bonds and notes payable 22,967,971 23,998,027
Total noncurrent liabilities 24,700,901 25,485,481
Total liabilities 49,897,550 3,604,542 44,678,645 927,711
NET POSITIONUnrestricted 12,729,160 6,947,467 10,654,798 7,687,438Net investment in capital assets 164,345,877 119,379,058Restricted:
Nonexpendable:Scholarships and fellowships 23,702,328 27,880,961Other 11,719,402 6,777,389
Expendable:Scholarships and fellowships 7,217,490 2,768,755Loans 3,247,777 3,953,486Capital projects 122,877 146,516Other 10,460,850 22,380,071
Total net position 180,445,691 60,047,537 134,133,858 67,494,614
Total liabilities and net position $230,343,241 $63,652,079 $178,812,503 $68,422,325

UNIVERSITY OF BALTIMORESTATEMENT OF REVENUES, EXPENSES AND CHANGES IN NET POSITION
YEARS ENDED JUNE 30, 2013 AND 2012
66
Years ended June 30,
Component ComponentUnits Units
OPERATING REVENUES:Tuition and fees $64,717,567 $65,335,926Less: scholarship allowances (15,037,957) $49,679,610 (15,055,526) $50,280,400Federal grants and contracts 976,093 1,507,437State and local grants and contracts 6,652,782 6,689,743Nongovernmental grants and contracts 2,476,552 2,601,088Sales and services of educational departments 1,046,658 252,251Auxiliary enterprises:
Parking facilities 794,829 1,026,402Other auxiliary enterprises revenues 7,737,208 7,580,679
Other operating revenues 139,035 117,489
Total operating revenues 69,502,767 70,055,489
OPERATING EXPENSES:Instruction 37,119,854 35,895,226Research 6,366,802 6,004,608Academic support 12,837,020 11,149,650Student services 9,370,963 8,400,005Institutional support 21,742,736 20,135,327Operation and maintenance of plant 5,017,348 5,959,037Scholarships and fellowships 2,719,982 1,817,341Auxiliary enterprises:
Parking facilities 756,889 959,683Other auxiliary enterprises expenses 2,975,103 4,475,157
Total operating expenses 98,906,697 94,796,034
Operating income (loss) (29,403,930) (24,740,545)
NONOPERATING REVENUES (EXPENSES):State appropriations 30,462,629 30,321,428Pell grants 6,055,227 6,436,672Gifts $8,587,078 $4,081,668Investment income (loss) 200,017 4,060,894 367,959 (785,066)Interest on indebtedness (720,658) (805,806)Other affiliated foundation revenues 89,278 789,537Other affiliated foundation expenses (20,184,327) (2,757,177)Transfers (to) from other University System of Maryland institutions (3,210,300) (3,255,931)
Total nonoperating revenues (expenses) 32,786,915 (7,447,077) 33,064,322 1,328,962
Income (loss) before other revenue 3,382,985 (7,447,077) 8,323,777 1,328,962
OTHER REVENUE:Capital appropriations 26,310,415 41,749,262Capital gifts and grants 16,618,433
Total other revenue 42,928,848 41,749,262
Increase (decrease) in net position 46,311,833 (7,447,077) 50,073,039 1,328,962
Net position - beginning of year 134,133,858 67,494,614 84,060,819 66,165,652
Net position - end of year $180,445,691 $60,047,537 $134,133,858 $67,494,614
Institution Institution
2013 2012

UNIVERSITY OF BALTIMORESTATEMENT OF CASH FLOWS
YEARS ENDED JUNE 30, 2013 AND 2012
67
Years ended June 30,2013 2012
CASH FLOWS FROM OPERATING ACTIVITIES:Tuition and fees $51,507,800 $50,331,372Research contracts and grants 8,653,439 10,426,192Payments to employees (77,207,789) (68,669,528)Payments to suppliers and contractors (10,946,929) (20,651,240)Loans issued to students (346,430) (1,958,463)Collections of loans to students 456,054 552,077Auxiliary enterprises:
Parking facilities 794,829 1,026,402Other 7,737,208 7,580,679
Other receipts 1,708,202 88,339
Net cash provided (used) by operating activities (17,643,616) (21,274,170)
CASH FLOWS FROM NONCAPITAL FINANCING ACTIVITIES:State appropriations 30,462,629 30,321,428Pell grants 6,055,227 6,436,672
Net cash provided by noncapital financing activities 36,517,856 36,758,100
CASH FLOWS FROM CAPITAL AND RELATED FINANCING ACTIVITIES:Proceeds of capital debt 2,356,846 5,389,820Capital appropriations 26,310,415 41,749,262Capital grants and gifts received 14,251,783Purchases of capital assets (47,399,153) (43,241,070)Principal paid on debt and capital leases (3,674,518) (6,898,508)Interest paid on debt and capital leases (931,427) (1,168,064)Transfers (to) from other University System of Maryland institutions (3,781,528) (3,772,576)
Net cash provided (used) by capital and related financing activities (12,867,582) (7,941,136)
CASH FLOWS FROM INVESTING ACTIVITIES:Interest on investments 77,074 667,307
Net cash provided by investing activities 77,074 667,307
Net increase in cash and cash equivalents 6,083,732 8,210,101
Cash and cash equivalents - beginning of the year 33,219,112 25,009,011
Cash and cash equivalents - end of the year $39,302,844 $33,219,112

SALISBURY UNIVERSITYBALANCE SHEET
JUNE 30, 2013 AND 2012
68
June 30,2013
Component ComponentInstitution Units Institution Units
ASSETSCurrent assets:
Cash and cash equivalents $94,009,655 $446,745 $82,830,584 $412,916Accounts receivable, net 2,051,724 393,781 1,326,840 1,407,016Notes receivable, current portion 183,208 159,384Inventories 1,184,655Prepaid expenses, deferred charges and other assets 1,361,858 197,606 128,642Inter-institutional balances 4,854,729 257,124
Total current assets 102,461,174 1,038,132 85,758,587 1,948,574
Noncurrent assets:Restricted cash and cash equivalents 37 37Accounts receivable, net 5,963,394 6,105,924Endowment investments 45,733,024 37,792,948 Other investments 6,828,912 2,112,844Notes receivable, net 672,784 877,615Other assets 2,184,238 6,784,112Capital assets, net 346,187,983 1,372,742 340,707,447 1,399,253
Total noncurrent assets 346,860,804 62,082,310 341,585,099 54,195,081
Total assets $449,321,978 $63,120,442 $427,343,686 $56,143,655
LIABILITIESCurrent liabilities:
Accounts payable and accrued liabilities $11,421,358 $259,695 $10,538,084 $191,963Accrued workers' compensation, current portion 202,585 191,890Accrued vacation costs, current portion 1,964,141 1,772,314Revenue bonds and notes payable, current portion 6,040,031 1,875,757 7,017,455Deferred revenue 2,519,062 227,254 2,211,727 208,748
Total current liabilities 22,147,177 2,362,706 21,731,470 400,711
Noncurrent liabilities:Accrued workers' compensation 1,104,415 1,046,110Accrued vacation costs 1,874,958 1,655,062Other payables 3,215,557 2,730,149Revenue bonds and notes payable 103,480,261 93,360,652 1,893,070
Total noncurrent liabilities 106,459,634 3,215,557 96,061,824 4,623,219
Total liabilities 128,606,811 5,578,263 117,793,294 5,023,930
DEFERRED INFLOWS OF RESOURCESDeferred service concession arrangement receipts 30,245,050 32,005,938
NET POSITIONUnrestricted 82,821,207 5,093,776 67,983,642 4,422,404Net investment in capital assets 206,422,641 208,323,402Restricted:
Nonexpendable:Scholarships and fellowships 11,657,005 11,384,139Research 315,104 210,633Other 13,903,003 11,989,812
Expendable:Scholarships and fellowships 6,087,209 3,962,318Research 18,305 579,581 18,305 520,128Loans 1,207,927 1,219,068Capital projects 37 37Other 19,906,501 18,630,291
Total net position 290,470,117 57,542,179 277,544,454 51,119,725
Total liabilities, deferred inflows of resources, and net position $449,321,978 $63,120,442 $427,343,686 $56,143,655
2012
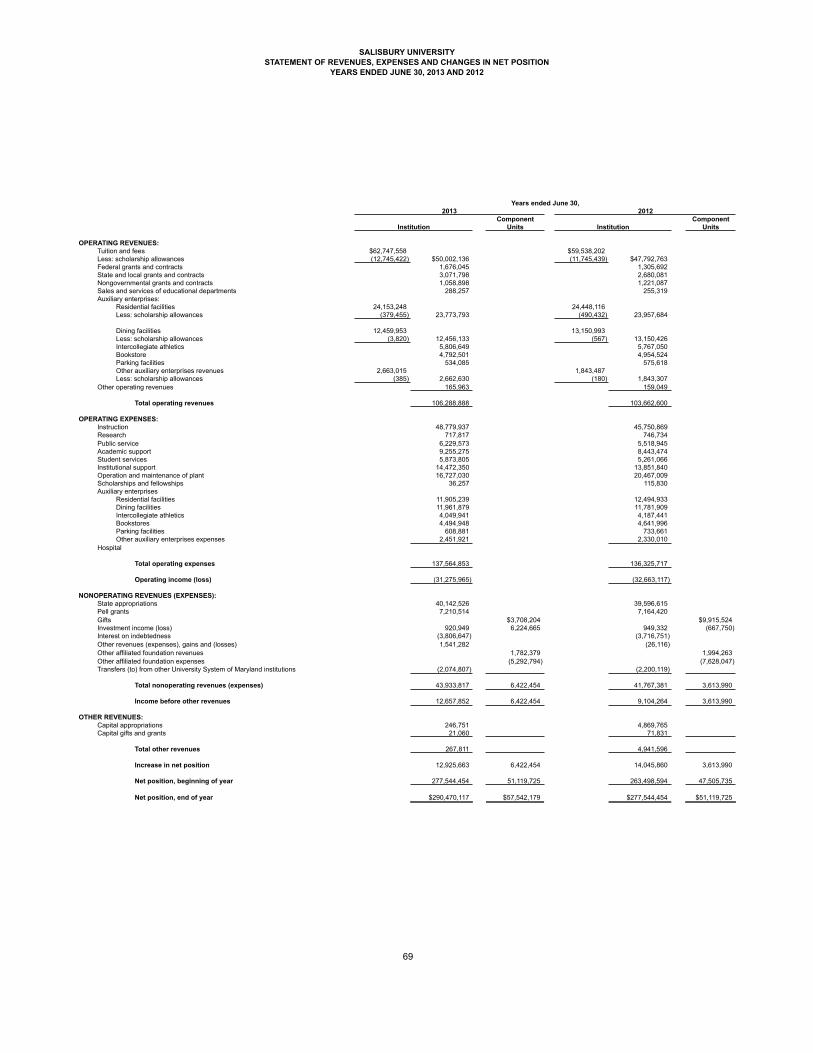
SALISBURY UNIVERSITYSTATEMENT OF REVENUES, EXPENSES AND CHANGES IN NET POSITION
YEARS ENDED JUNE 30, 2013 AND 2012
69
Years ended June 30,
Component ComponentUnits Units
OPERATING REVENUES:Tuition and fees $62,747,558 $59,538,202Less: scholarship allowances (12,745,422) $50,002,136 (11,745,439) $47,792,763Federal grants and contracts 1,676,045 1,305,692State and local grants and contracts 3,071,798 2,680,081Nongovernmental grants and contracts 1,058,898 1,221,087Sales and services of educational departments 288,257 255,319Auxiliary enterprises:
Residential facilities 24,153,248 24,448,116Less: scholarship allowances (379,455) 23,773,793 (490,432) 23,957,684
Dining facilities 12,459,953 13,150,993Less: scholarship allowances (3,820) 12,456,133 (567) 13,150,426Intercollegiate athletics 5,806,649 5,767,050Bookstore 4,792,501 4,954,524Parking facilities 534,085 575,618Other auxiliary enterprises revenues 2,663,015 1,843,487Less: scholarship allowances (385) 2,662,630 (180) 1,843,307
Other operating revenues 165,963 159,049
Total operating revenues 106,288,888 103,662,600
OPERATING EXPENSES:Instruction 48,779,937 45,750,869Research 717,817 746,734Public service 6,229,573 5,518,945Academic support 9,255,275 8,443,474Student services 5,873,805 5,261,066Institutional support 14,472,350 13,851,840Operation and maintenance of plant 16,727,030 20,467,009Scholarships and fellowships 36,257 115,830Auxiliary enterprises
Residential facilities 11,905,239 12,494,933Dining facilities 11,961,879 11,781,909Intercollegiate athletics 4,049,941 4,187,441Bookstores 4,494,948 4,641,996Parking facilities 608,881 733,661Other auxiliary enterprises expenses 2,451,921 2,330,010
Hospital
Total operating expenses 137,564,853 136,325,717
Operating income (loss) (31,275,965) (32,663,117)
NONOPERATING REVENUES (EXPENSES):State appropriations 40,142,526 39,596,615Pell grants 7,210,514 7,164,420Gifts $3,708,204 $9,915,524Investment income (loss) 920,949 6,224,665 949,332 (667,750)Interest on indebtedness (3,806,647) (3,716,751)Other revenues (expenses), gains and (losses) 1,541,282 (26,116)Other affiliated foundation revenues 1,782,379 1,994,263Other affiliated foundation expenses (5,292,794) (7,628,047)Transfers (to) from other University System of Maryland institutions (2,074,807) (2,200,119)
Total nonoperating revenues (expenses) 43,933,817 6,422,454 41,767,381 3,613,990
Income before other revenues 12,657,852 6,422,454 9,104,264 3,613,990
OTHER REVENUES:Capital appropriations 246,751 4,869,765Capital gifts and grants 21,060 71,831
Total other revenues 267,811 4,941,596
Increase in net position 12,925,663 6,422,454 14,045,860 3,613,990
Net position, beginning of year 277,544,454 51,119,725 263,498,594 47,505,735
Net position, end of year $290,470,117 $57,542,179 $277,544,454 $51,119,725
Institution Institution
2013 2012
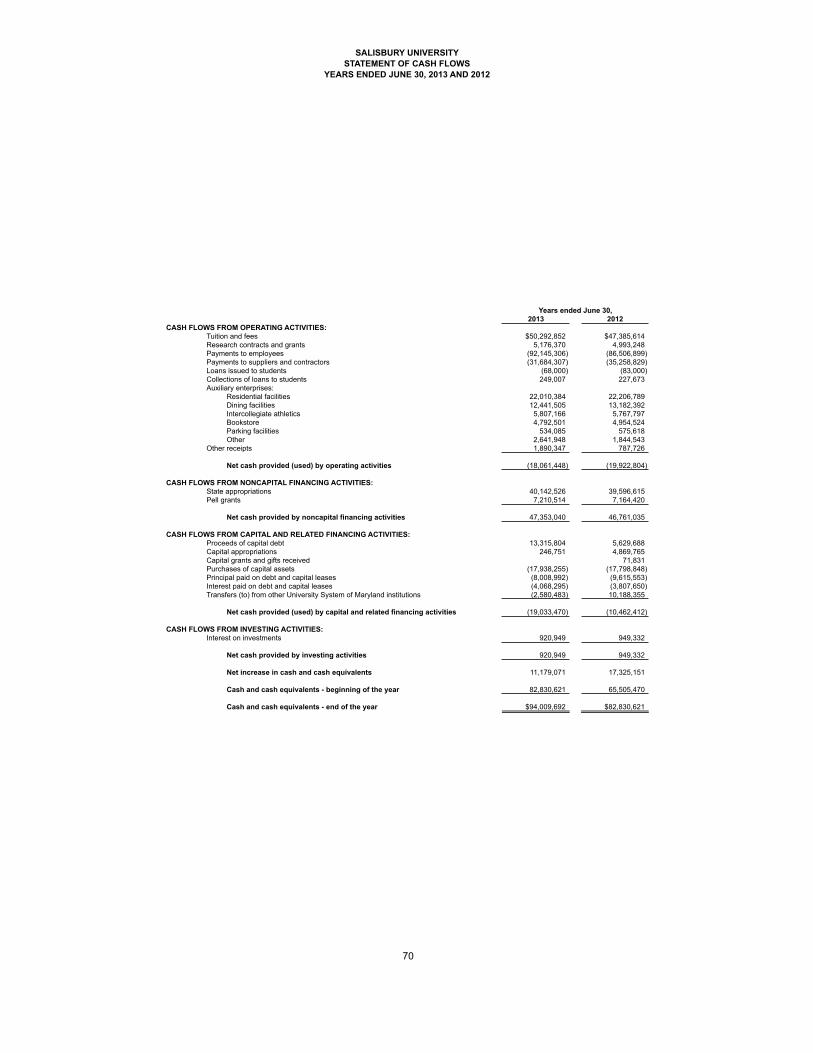
SALISBURY UNIVERSITYSTATEMENT OF CASH FLOWS
YEARS ENDED JUNE 30, 2013 AND 2012
70
Years ended June 30,2013 2012
CASH FLOWS FROM OPERATING ACTIVITIES:Tuition and fees $50,292,852 $47,385,614Research contracts and grants 5,176,370 4,993,248Payments to employees (92,145,306) (86,506,899)Payments to suppliers and contractors (31,684,307) (35,258,829)Loans issued to students (68,000) (83,000)Collections of loans to students 249,007 227,673Auxiliary enterprises:
Residential facilities 22,010,384 22,206,789Dining facilities 12,441,505 13,182,392Intercollegiate athletics 5,807,166 5,767,797Bookstore 4,792,501 4,954,524Parking facilities 534,085 575,618Other 2,641,948 1,844,543
Other receipts 1,890,347 787,726
Net cash provided (used) by operating activities (18,061,448) (19,922,804)
CASH FLOWS FROM NONCAPITAL FINANCING ACTIVITIES:State appropriations 40,142,526 39,596,615Pell grants 7,210,514 7,164,420
Net cash provided by noncapital financing activities 47,353,040 46,761,035
CASH FLOWS FROM CAPITAL AND RELATED FINANCING ACTIVITIES:Proceeds of capital debt 13,315,804 5,629,688Capital appropriations 246,751 4,869,765Capital grants and gifts received 71,831Purchases of capital assets (17,938,255) (17,798,848)Principal paid on debt and capital leases (8,008,992) (9,615,553)Interest paid on debt and capital leases (4,068,295) (3,807,650)Transfers (to) from other University System of Maryland institutions (2,580,483) 10,188,355
Net cash provided (used) by capital and related financing activities (19,033,470) (10,462,412)
CASH FLOWS FROM INVESTING ACTIVITIES:Interest on investments 920,949 949,332
Net cash provided by investing activities 920,949 949,332
Net increase in cash and cash equivalents 11,179,071 17,325,151
Cash and cash equivalents - beginning of the year 82,830,621 65,505,470
Cash and cash equivalents - end of the year $94,009,692 $82,830,621

UNIVERSITY OF MARYLAND UNIVERSITY COLLEGEBALANCE SHEET
JUNE 30, 2013 AND 2012
71
June 30,2013 2012
Component ComponentInstitution Units Institution Units
ASSETSCurrent assets:
Cash and cash equivalents $261,309,824 $241,930,759Accounts receivable, net 29,180,124 $4,901,719 34,099,295 $816,661Notes receivable, current portion 119,944 160,278Inventories 1,733,097 1,794,266Prepaid expenses, deferred charges and other assets 1,615,979 1,654,504 19,000Inter-institutional balances 685,592 596,620
Total current assets 294,644,560 4,901,719 280,235,722 835,661
Noncurrent assets:Accounts receivable, net 308,419 433,870Endowment investments 143,638 13,465,740 142,872 10,072,324 Other investments 5,664,160 6,689,063Notes receivable, net 1,069,698 1,179,480Capital assets, net 179,019,481 3,605,262 171,447,896 3,464,862
Total noncurrent assets 180,232,817 23,043,581 172,770,248 20,660,119
Total assets $474,877,377 $27,945,300 $453,005,970 $21,495,780
LIABILITIESCurrent liabilities:
Accounts payable and accrued liabilities $28,460,704 $4,150,740 $20,027,052Accrued workers' compensation, current portion 142,910 141,515Accrued vacation costs, current portion 6,870,772 6,167,003Deferred revenue 36,598,949 40,384,370
Total current liabilities 72,073,335 4,150,740 66,719,940
Noncurrent liabilities:Accrued workers' compensation 779,090 771,485Accrued vacation costs 4,928,863 4,709,685Endowments invested on behalf of primary government 143,638 $142,872
Total noncurrent liabilities 5,707,953 143,638 5,481,170 142,872
Total liabilities 77,781,288 4,294,378 72,201,110 142,872
NET POSITIONUnrestricted 216,482,273 5,156,775 207,658,094 5,417,233Net investment in capital assets 179,019,481 171,447,896Restricted:
Nonexpendable:Scholarships and fellowships 29,423 7,267,727 29,423 3,449,078Research 192,348 96,156Other 5,663,427 2,660,605
Expendable:Scholarships and fellowships 55,038 1,585,563 58,050 2,982,012Research 955,580 1,931,509Loans 1,509,874 1,611,397Other 2,829,502 4,816,315
Total net position 397,096,089 23,650,922 380,804,860 21,352,908
Total liabilities and net position $474,877,377 $27,945,300 $453,005,970 $21,495,780

UNIVERSITY OF MARYLAND UNIVERSITY COLLEGESTATEMENT OF REVENUES, EXPENSES AND CHANGES IN NET POSITION
YEARS ENDED JUNE 30, 2013 AND 2012
72
Years ended June 30,
Component ComponentUnits Units
OPERATING REVENUES:Tuition and fees $314,526,058 $324,646,104Less: scholarship allowances (27,423,523) $287,102,535 (21,841,765) $302,804,339Federal grants and contracts 1,426,336 1,748,164State and local grants and contracts 3,480,568 2,437,784Nongovernmental grants and contracts 1,140,931 3,016,079Sales and services of educational departments 1,991,642 2,047,019Auxiliary enterprises:
Residential facilities 74,120Bookstore 5,482,229 6,134,695Parking facilities 5,612 166,616Other auxiliary enterprises revenues 720
Other operating revenues 10,425,768 15,566,387
Total operating revenues 311,129,741 333,921,803
OPERATING EXPENSES:Instruction 100,344,811 95,128,643Research 84,216 340,489Public service 12,069,854 14,136,597Academic support 75,775,292 65,654,850Student services 75,702,709 73,390,080Institutional support 44,643,039 40,947,779Operation and maintenance of plant 21,455,227 20,489,398Scholarships and fellowships 26,285,877 22,308,119Auxiliary enterprises:
Residential facilities 79,783Bookstore 5,632,796 5,638,912Parking facilities 460,714 1,067,706
Total operating expenses 362,534,318 339,102,573
Operating income (loss) (51,404,577) (5,180,770)
NONOPERATING REVENUES (EXPENSES):State appropriations 33,982,373 32,759,494Pell grants 32,870,720 28,139,724Gifts $883,476 $1,145,367Investment income 2,132,193 3,270,728 2,183,380 102,309 Less: Investment expense (529) 2,131,664 (561) 2,182,819Other revenues (expenses), gains and (losses) (934,948) (740,079)Other affiliated foundation revenues 785 7,792Other affiliated foundation expenses (1,856,975) (1,138,782)Transfers (to) from other University System of Maryland institutions (354,003) (479,449)
Total nonoperating revenues (expenses) 67,695,806 2,298,014 61,862,509 116,686
Increase in net position 16,291,229 2,298,014 56,681,739 116,686
Net position - beginning of period 380,804,860 21,352,908 324,123,121 21,236,222
Net position - end of period $397,096,089 $23,650,922 $380,804,860 $21,352,908
Institution Institution
2013 2012

UNIVERSITY OF MARYLAND UNIVERSITY COLLEGESTATEMENT OF CASH FLOWS
YEARS ENDED JUNE 30, 2013 AND 2012
73
Years ended June 30,2013 2012
CASH FLOWS FROM OPERATING ACTIVITIES:Tuition and fees $284,601,596 $295,451,727Research contracts and grants 9,402,451 10,953,546Payments to employees (199,454,414) (195,209,197)Payments to suppliers and contractors (139,618,446) (128,586,851)Loans issued to students (74,000) (96,794)Collections of loans to students 224,116 193,452Auxiliary enterprises:
Residential facilities 74,120Bookstore 5,482,229 6,134,695Parking facilities 5,612 166,616Other 720
Other receipts 12,169,461 16,726,048
Net cash provided (used) by operating activities (27,187,275) 5,733,962
CASH FLOWS FROM NONCAPITAL FINANCING ACTIVITIES:State appropriations 33,982,373 32,759,494Pell grants 32,870,720 28,139,724
Net cash provided by noncapital financing activities 66,853,093 60,899,218
CASH FLOWS FROM CAPITAL AND RELATED FINANCING ACTIVITIES:Proceeds from sales of capital assets 1,228,857 808,612Purchases of capital assets (23,203,533) (27,501,939)Transfers (to) from other University System of Maryland institutions (442,975) (430,082)
Net cash provided (used) by capital and related financing activities (22,417,651) (27,123,409)
CASH FLOWS FROM INVESTING ACTIVITIES:Proceeds from sales and maturities of investments 9,327 9,057Interest on investments 2,122,100 2,183,058Investment expense (529) (561)
Net cash provided by investing activities 2,130,898 2,191,554
Net increase in cash and cash equivalents 19,379,065 41,701,325
Cash and cash equivalents - beginning of the year 241,930,759 200,229,434
Cash and cash equivalents - end of the year $261,309,824 $241,930,759

UNIVERSITY OF MARYLAND, BALTIMORE COUNTYBALANCE SHEET
JUNE 30, 2013 AND 2012
74
June 30,
Component ComponentInstitution Units Institution Units
ASSETSCurrent assets:
Cash and cash equivalents $103,149,867 $976,735 $81,285,485 $629,027Accounts receivable, net 15,798,195 23,713,215 14,517,391 2,878,706Notes receivable, current portion 428,618 417,696Inventories 909,100 930,803Prepaid expenses, deferred charges and other assets 316,466 8,926 379,954 52,122Inter-institutional balances 70,323 123,889
Total current assets 120,672,569 24,698,876 97,655,218 3,559,855
Noncurrent assets:Restricted cash and cash equivalents 1,506,177 1,426,894Accounts receivable, net 3,478,830 968,054Endowment investments 1,634,080 68,379,924 1,583,662 58,071,565 Other investments 22,319,752 18,796,002Notes receivable, net 1,501,835 1,557,164Other assets 40,233Capital assets, net 439,498,970 2,857,727 400,398,589 2,905,722
Total noncurrent assets 444,141,062 97,076,466 404,966,309 80,741,343
Total assets $564,813,631 $121,775,342 $502,621,527 $84,301,198
LIABILITIESCurrent liabilities:
Accounts payable and accrued liabilities $24,764,102 $21,144,821 $21,018,854 $391,707Accrued workers' compensation, current portion 195,920 186,310Accrued vacation costs, current portion 7,011,980 7,331,220Revenue bonds and notes payable, current portion 7,567,560 49,261 6,467,945 47,850Deferred revenue 13,668,360 6,418,421 12,739,894 6,172,558
Total current liabilities 53,207,922 27,612,503 47,744,223 6,612,115
Noncurrent liabilities:Accrued workers' compensation 1,068,080 1,015,690Accrued vacation costs 4,429,642 3,403,330Endowments invested on behalf of primary government 1,634,080 1,583,662Other payables 602,977 980,739Revenue bonds and notes payable 100,092,892 318,014 92,321,188 379,415
Total noncurrent liabilities 105,590,614 2,555,071 96,740,208 2,943,816
Total liabilities 158,798,536 30,167,574 144,484,431 9,555,931
DEFERRED INFLOWS OF RESOURCESDeferred service concession arrangement receipts 39,538,099 74,668,619
NET POSITIONUnrestricted 70,609,473 24,025,067 52,995,411 15,633,827Net investment in capital assets 292,300,419 226,940,838Restricted:
Nonexpendable:Scholarships and fellowships 130,474 26,558,325 130,474 25,488,803Research 702,895 710,598Other 20,695,758 19,661,959
Expendable:Scholarships and fellowships 5,794,058 4,060,900Research 3,491,934 2,630,327Loans 1,930,453 1,974,860Capital projects 1,506,177 1,426,894Other 10,339,731 6,558,853
Total net position 366,476,996 91,607,768 283,468,477 74,745,267
Total liabilities, deferred inflows of resources, and net position $564,813,631 $121,775,342 $502,621,527 $84,301,198
2013 2012

UNIVERSITY OF MARYLAND, BALTIMORE COUNTYSTATEMENT OF REVENUES, EXPENSES AND CHANGES IN NET POSITION
YEARS ENDED JUNE 30, 2013 AND 2012
75
Years ended June 30,
Component ComponentUnits Units
OPERATING REVENUES:Tuition and fees $111,991,576 $104,199,029Less: scholarship allowances (16,864,825) $95,126,751 (19,821,254) $84,377,775Federal grants and contracts 40,197,146 42,430,364State and local grants and contracts 27,766,379 22,587,743Nongovernmental grants and contracts 20,507,510 17,803,967Sales and services of educational departments 3,932,812 3,979,810Auxiliary enterprises:
Residential facilities 23,385,342 23,398,349Less: scholarship allowances (5,026,989) 18,358,353 (3,557,661) 19,840,688
Dining facilities 12,868,317 12,414,747Less: scholarship allowances (2,641,522) 10,226,795 (2,032,948) 10,381,799Intercollegiate athletics 9,819,301 9,245,264Bookstore 6,450,783 6,218,787Less: scholarship allowances (6,406) 6,444,377 (23,523) 6,195,264Parking facilities 1,524,483 3,242,069Other auxiliary enterprises revenues 17,555,497 14,530,855
Other operating revenues 13,270,254 5,044,755
Total operating revenues 264,729,658 239,660,353
OPERATING EXPENSES:Instruction 101,860,155 98,938,377Research 56,831,603 57,412,999Public service 20,393,150 17,008,157Academic support 23,474,255 22,823,149Student services 15,298,496 13,877,979Institutional support 31,515,116 26,485,060Operation and maintenance of plant 25,258,991 23,178,520Scholarships and fellowships 17,908,397 14,888,786Auxiliary enterprises:
Residential facilities 15,168,393 10,117,551Dining facilities 11,220,394 11,364,895Intercollegiate athletics 7,807,363 7,718,405Bookstore 6,327,929 5,914,370Parking facilities 452,460 386,573Other auxiliary enterprises expenses 12,487,540 10,678,700
Total operating expenses 346,004,242 320,793,521
Operating income (loss) (81,274,584) (81,133,168)
NONOPERATING REVENUES (EXPENSES):State appropriations 96,306,355 95,569,552Pell grants 13,005,945 12,988,526Gifts 11,125 $12,791,132 5,462 $5,309,721Investment income 1,236,400 10,498,301 759,214 720,440Less: Investment expense (5,860) 1,230,540 (5,961) 753,253Interest on indebtedness (3,990,600) (3,894,134)Other revenues (expenses), gains and (losses) 29,690,030 (430,268)Other affiliated foundation revenues 2,542,283 2,386,496Other affiliated foundation expenses (8,969,215) (11,606,922)Transfers (to) from other University System of Maryland institutions (4,150,018) (4,843,394)
Total nonoperating revenues (expenses) 132,103,377 16,862,501 100,148,997 (3,190,265)
Income (loss) before other revenues 50,828,793 16,862,501 19,015,829 (3,190,265)
OTHER REVENUES:Capital appropriations 31,692,596 36,076,439Capital gifts and grants 487,130 369,170
Total other revenues 32,179,726 36,445,609
Increase (decrease) in net position 83,008,519 16,862,501 55,461,438 (3,190,265)
Net position - beginning of year 283,468,477 74,745,267 228,007,039 77,935,532
Net position - end of year $366,476,996 $91,607,768 $283,468,477 $74,745,267
20122013
Institution Institution

UNIVERSITY OF MARYLAND, BALTIMORE COUNTYSTATEMENT OF CASH FLOWS
YEARS ENDED JUNE 30, 2013 AND 2012
76
Years ended June 30,2013 2012
CASH FLOWS FROM OPERATING ACTIVITIES:Tuition and fees $95,972,501 $84,784,817Research contracts and grants 87,075,490 95,307,980Payments to employees (205,107,982) (200,260,192)Payments to suppliers and contractors (116,537,165) (100,847,492)Loans issued to students (240,220) (180,806)Collections of loans to students 284,625 509,881Auxiliary enterprises:
Residential facilities 13,262,202 11,133,717Dining facilities 10,253,365 10,159,943Intercollegiate athletics 9,844,813 9,047,696Bookstore 6,461,120 6,062,873Parking facilities 1,528,444 3,172,787Other 17,601,108 14,220,335
Other receipts 17,300,894 8,881,948
Net cash provided (used) by operating activities (62,300,805) (58,006,513)
CASH FLOWS FROM NONCAPITAL FINANCING ACTIVITIES:State appropriations 96,306,355 95,569,552 Gifts and grants received for other than capital purposes:
Private gifts for endowment purposes 5,462 Pell grants 13,005,945 12,988,526
Net cash provided by noncapital financing activities 109,312,300 108,563,540
CASH FLOWS FROM CAPITAL AND RELATED FINANCING ACTIVITIES:Proceeds of capital debt 18,483,051 10,729,334Capital appropriations 31,692,596 36,076,439Purchases of capital assets (58,724,818) (49,367,685)Principal paid on debt and capital leases (14,255,025) (14,500,708)Interest paid on debt and capital leases (4,503,064) (4,354,656)Transfers (to) from other University System of Maryland institutions 1,059,307 (2,908,284)
Net cash provided (used) by capital and related financing activities (26,247,953) (24,325,560)
CASH FLOWS FROM INVESTING ACTIVITIES:Proceeds from sales and maturities of investments 60,958 32,029Interest on investments 1,125,025 754,497Investment expense (5,860) (5,961)
Net cash provided by investing activities 1,180,123 780,565
Net increase in cash and cash equivalents 21,943,665 27,012,032
Cash and cash equivalents - beginning of the year 82,712,379 55,700,347
Cash and cash equivalents - end of the year $104,656,044 $82,712,379

UNIVERSITY OF MARYLAND CENTER FOR ENVIRONMENTAL SCIENCEBALANCE SHEET
JUNE 30, 2013 AND 2012
77
June 30,2013 2012
Component ComponentInstitution Units Institution Units
ASSETSCurrent assets:
Cash and cash equivalents $10,578,530 $10,895,739Accounts receivable, net 5,258,939 $715,554 5,307,335 $733Prepaid expenses, deferred charges and other assets 295 294Inter-institutional balances 682 (736)
Total current assets 15,838,151 715,849 16,202,338 1,027
Noncurrent assets:Endowment investments 1,317,754 944,951 Other investments 1,505,482 1,198,097Notes receivable, net 7,003Capital assets, net 71,056,938 72,476,777
Total noncurrent assets 71,056,938 2,830,239 72,476,777 2,143,048
Total assets $86,895,089 $3,546,088 $88,679,115 $2,144,075
LIABILITIESCurrent liabilities:
Accounts payable and accrued liabilities $1,878,582 $415,074 $2,010,382 $58,517Accrued workers' compensation, current portion 10,540 7,595Accrued vacation costs, current portion 595,550 553,209Revenue bonds and notes payable, current portion 1,212,074 1,119,117Deferred revenue 660,064 270,718 331,073
Total current liabilities 4,356,810 685,792 4,021,376 58,517
Noncurrent liabilities:Accrued workers' compensation 57,460 41,405Accrued vacation costs 2,174,453 2,019,855Revenue bonds and notes payable 9,714,739 10,249,729
Total noncurrent liabilities 11,946,652 12,310,989
Total liabilities 16,303,462 685,792 16,332,365 58,517
NET POSITIONUnrestricted 10,245,739 623,614 11,238,819 324,930Net investment in capital assets 60,345,888 61,107,931Restricted:
Nonexpendable:Scholarships and fellowships 878,948 169,694Research 23,262 4,731Other 684,926 130,901
Expendable:Scholarships and fellowships 191,764 446,023Research 115,571 288,898Other 342,211 720,381
Total net position 70,591,627 2,860,296 72,346,750 2,085,558
Total liabilities and net position $86,895,089 $3,546,088 $88,679,115 $2,144,075

UNIVERSITY OF MARYLAND CENTER FOR ENVIRONMENTAL SCIENCESTATEMENT OF REVENUES, EXPENSES AND CHANGES IN NET POSITION
YEARS ENDED JUNE 30, 2013 AND 2012
78
Years ended June 30,2013 2012
Component ComponentInstitution Units Institution Units
OPERATING REVENUES:Federal grants and contracts $16,158,029 $18,071,855State and local grants and contracts 4,267,223 4,939,351Nongovernmental grants and contracts 2,323,330 2,063,775Sales and services of educational departments 2,728,607 2,542,609
Total operating revenues 25,477,189 27,617,590
OPERATING EXPENSES:Research 46,629,730 43,829,490Operation and maintenance of plant 665,110 375,230
Total operating expenses 47,294,840 44,204,720
Operating income (loss) (21,817,651) (16,587,130)
NONOPERATING REVENUE (EXPENSES):State appropriations 19,567,752 19,299,245Gifts $627,411 $381,252Investment income 105,552 455,353 104,690 5,955Interest on indebtedness (293,734) (285,693)Other affiliated foundation revenues 1,336 15,311Other affiliated foundation expenses (309,362) (520,180)Transfers (to) from other University System of Maryland institutions 441,118 538,809
Total nonoperating revenues (expenses) 19,820,688 774,738 19,657,051 (117,662)
Income (loss) before other revenues (1,996,963) 774,738 3,069,921 (117,662)
OTHER REVENUE:Capital appropriations 241,840 10,259,267
Total other revenue 241,840 10,259,267
Increase (decrease) in net position (1,755,123) 774,738 13,329,188 (117,662)
Net position - beginning of year 72,346,750 2,085,558 59,017,562 2,203,220
Net position - end of year $70,591,627 $2,860,296 $72,346,750 $2,085,558

UNIVERSITY OF MARYLAND CENTER FOR ENVIRONMENTAL SCIENCESTATEMENT OF CASH FLOWS
YEARS ENDED JUNE 30, 2013 AND 2012
79
Years ended June 30,2013 2012
CASH FLOWS FROM OPERATING ACTIVITIES:Tuition and feesResearch contracts and grants $23,125,969 $26,785,177Payments to employees (26,706,025) (26,686,543)Payments to suppliers and contractors (17,084,579) (15,435,095)Other receipts 2,779,697 2,542,609
Net cash provided (used) by operating activities (17,884,938) (12,793,852)
CASH FLOWS FROM NONCAPITAL FINANCING ACTIVITIES:State appropriations 19,567,752 19,299,245
Net cash provided by noncapital financing activities 19,567,752 19,299,245
CASH FLOWS FROM CAPITAL AND RELATED FINANCING ACTIVITIES:Proceeds of capital debt 481,669 2,763,347Capital appropriations 241,840 10,259,267Purchases of capital assets (1,834,957) (14,626,202)Principal paid on debt and capital leases (1,310,720) (2,135,646)Interest paid on debt and capital leases (327,980) (383,403)Transfers (to) from other University System of Maryland institutions 644,573 694,138
Net cash provided (used) by capital and related financing activities (2,105,575) (3,428,499)
CASH FLOWS FROM INVESTING ACTIVITIESInterest on investments 105,552 104,690
Net cash provided by investing activities 105,552 104,690
Net increase (decrease) in cash and cash equivalents (317,209) 3,181,584
Cash and cash equivalents - beginning of the year 10,895,739 7,714,155
Cash and cash equivalents - end of the year $10,578,530 $10,895,739

UNIVERSITY SYSTEM OF MARYLAND OFFICEBALANCE SHEET
JUNE 30, 2013 AND 2012
80
June 30,2013 2012
Component Component Institution Units Institution Units
ASSETSCurrent assets:
Cash and cash equivalents $148,665,828 $48,547 $124,950,163 $691,243Accounts receivable, net 503,097 4,454,306 1,483,451 761,802Prepaid expenses, deferred charges and other assets 272,779 132,018Inter-institutional balances 6,096,669 11,156,451
Total current assets 155,265,594 4,775,632 137,590,065 1,585,063
Noncurrent assets:Restricted cash and cash equivalents 37,782,594 60,428,852Accounts receivable, net 41,653Endowment investments 8,892,664 13,328,093 9,011,804 24,375,751Other investments 57,481,268 51,312,631Restricted investments 21,875,318Other assets 275,035 390,600Capital assets, net 83,881,529 3,281,756 86,491,159 3,148,395
Total noncurrent assets 130,556,787 74,366,152 177,807,133 79,269,030
Total assets $285,822,381 $79,141,784 $315,397,198 $80,854,093
LIABILITIESCurrent liabilities:
Accounts payable and accrued liabilities $4,138,628 $5,348,070 $10,043,738 $1,315,071Accrued workers' compensation, current portion 12,710 14,105Accrued vacation costs, current portion 544,408 582,972Revenue bonds and notes payable, current portion 2,649,491 4,409,410Deferred revenue 12,534 334
Total current liabilities 7,345,237 5,360,604 15,050,225 1,315,405
Noncurrent liabilities:Accrued workers' compensation 69,290 76,895Accrued vacation costs 1,032,415 947,399Endowments invested on behalf of primary government 8,852,501 9,011,252Other payables 46,728,768 43,439,690Revenue bonds and notes payable 62,201,691 101,404,537
Total noncurrent liabilities 63,303,396 55,581,269 102,428,831 52,450,942
Total liabilities 70,648,633 60,941,873 117,479,056 53,766,347
NET POSITIONUnrestricted $155,902,211 $3,968,114 $132,265,076 $4,897,192Net investment in capital assets 54,949,795 54,935,427Restricted:
Nonexpendable:Scholarships and fellowships 347,604 5,592,792 347,604 7,345,820Research 148,019 204,793Other 471,330 4,358,222 471,330 5,666,535
Expendable:Scholarships and fellowships 805,055 1,220,107 212,033 2,750,180Research 356,535 735,328 1,781,348Capital projects 1,863,245 8,856,046Other 477,973 2,177,330 830,626 4,441,878
Total net position 215,173,748 18,199,911 197,918,142 27,087,746
Total liabilities and net position $285,822,381 $79,141,784 $315,397,198 $80,854,093

UNIVERSITY SYSTEM OF MARYLAND OFFICESTATEMENT OF REVENUES, EXPENSES AND CHANGES IN NET POSITION
YEARS ENDED JUNE 30, 2013 AND 2012
81
Years ended June 30,
Component Component Units Units
OPERATING REVENUES:Federal grants and contracts $3,442,513 $3,155,530State and local grants and contracts 148,656 90,363Nongovernmental grants and contracts 330,093 107,159Other operating revenues 174,300 201,205
Total operating revenues 4,095,562 3,554,257
OPERATING EXPENSES:Academic support 6,334,077 6,030,370Institutional support 14,006,220 13,418,838
Total operating expenses 20,340,297 19,449,208
Operating income (loss) (16,244,735) (15,894,951)
NONOPERATING REVENUES (EXPENSES):State appropriations 19,262,886 15,417,326Gifts $1,178,823 $1,391,238Investment income (loss) $2,005,919 (8,373,680) $1,478,951 1,168,955Less: Investment expense (33,342) 1,972,577 (34,474) 1,444,477Interest on indebtedness (6,263,571) (7,170,624)Other revenues (expenses), gains and (losses) 2,256,464 2,618,819Other affiliated foundation revenues 2,333,915 3,216,560Other affiliated foundation expenses (4,026,893) (5,691,069)Transfers (to) from other University System of Maryland institutions 16,271,985 23,623,124
Total nonoperating revenue (expenses) 33,500,341 (8,887,835) 35,933,122 85,684
Income (loss) before other revenue 17,255,606 (8,887,835) 20,038,171 85,684
OTHER REVENUE:Capital appropriations 622,935
Total other revenue 622,935
Increase (decrease) in net position 17,255,606 (8,887,835) 20,661,106 85,684
Net position - beginning of year 197,918,142 27,087,746 177,257,036 27,002,062
Net position - end of year $215,173,748 $18,199,911 $197,918,142 $27,087,746
Institution Institution
2013 2012

UNIVERSITY SYSTEM OF MARYLAND OFFICESTATEMENT OF CASH FLOWS
YEARS ENDED JUNE 30, 2013 AND 2012
82
Years ended June 30,2013 2012
CASH FLOWS FROM OPERATING ACTIVITIES:Research contracts and grants $3,746,769 $3,460,612Payments to employees (13,761,506) (13,327,269)Payments to suppliers and contractors (8,929,299) (2,643,874)Other receipts 3,601,934 4,154,096
Net cash provided (used) by operating activities (15,342,102) (8,356,435)
CASH FLOWS FROM NONCAPITAL FINANCING ACTIVITIES:State appropriations 19,262,886 15,417,326
Net cash provided by noncapital financing activities 19,262,886 15,417,326
CASH FLOWS FROM CAPITAL AND RELATED FINANCING ACTIVITIES:Proceeds of capital debt 35,993,077 70,961,182Purchases of capital assets (432,163) (143,883)Principal paid on debt and capital leases (18,691,937) (13,291,324)Interest paid on debt and capital leases (7,053,436) (8,085,521)Transfers (to) from other University System of Maryland institutions (36,410,290) (47,697,158)
Net cash provided (used) by capital and related financing activities (26,594,749) 1,743,296
CASH FLOWS FROM INVESTING ACTIVITIES:Proceeds from sales and maturities of investments 22,616,919 37,620,025Interest on investments 1,383,456 1,453,108Investment expense (257,003) (34,474)Purchases of investments (21,875,318)
Net cash provided by investing activities 23,743,372 17,163,341
Net increase in cash and cash equivalents 1,069,407 25,967,528
Cash and cash equivalents - beginning of the year 185,379,015 159,411,487
Cash and cash equivalents - end of the year $186,448,422 $185,379,015

UNIVERSITY SYSTEM OF MARYLANDCOMBINING BALANCE SHEET, NONMAJOR COMPONENT UNITS
JUNE 30, 2013
Medical Alumni M Club The Robert H. Coppin State University The Maryland University of Association of Foundation Smith School Harry R. Hughes Bowie State Towson Frostburg University University of Salisbury Maryland Research Center at Maryland
the University of University of of Business Center for University University The Hawk State University Development Baltimore University The Ward 4-H Corporation Bowie State Baltimore County Total NonmajorMaryland, Inc. Maryland, Inc. Foundation, Inc. Argo-Ecology, Inc. Foundation, Inc. Foundation, Inc. Foundation, Inc. Foundation, Inc. Foundation, Inc. Foundation, Inc. Foundation, Inc. Foundation, Inc. Foundation, Inc. International University, Inc. Research Park Component Units
ASSETSCurrent assetsCash $1,151,741 $30,391 $1,613,600 $75,658 $429,480 $5,287,876 $89,520 $583,354 $1,804,975 $11,784,329 $367,727 $79,018 $614,884 $14,701 $976,735 $24,903,989Accounts receivable, net 6,899 406 456,724 13 305,265 164,930 264,344 105,785 367,280 2,610,300 367,114 26,667 46,718 82,097 133,187 4,937,729 Other assets 135,976 25,000 13,613 1,061 2,969 128,722 18,161 4,245 76,151 121,455 7,049 534,402
Total current assets 1,294,616 55,797 2,083,937 76,732 737,714 5,581,528 353,864 707,300 2,176,500 14,394,629 810,992 227,140 668,651 96,798 1,109,922 30,376,120
InvestmentsEndowment investments 6,488,822 2,140,422 6,193,061 54,516,247 15,385,773 8,084,447 38,750,242 45,712,416 20,608 2,825,234 180,117,272 Other investments 265,098 5,787,219 876,110 45,616 3,308,431 6,828,912 8,382,086 25,493,472
Total investments 6,488,822 2,405,520 5,787,219 6,193,061 54,516,247 16,261,883 8,130,063 42,058,673 52,541,328 20,608 2,825,234 8,382,086 205,610,744
Other assetsAccounts receivable, net 954,239 497,476 5,292,974 5,963,394 12,708,083 Capital assets, net 3,502 635,206 977 865,696 1,263,601 109,141 93,416 4,714 2,857,727 5,833,980 Other assets 532,068 257,845 1,040,107 2,159,854 24,384 4,014,258
Total other assets 957,741 1,167,274 756,298 7,198,777 9,386,849 133,525 93,416 4,714 2,857,727 22,556,321
Total assets $7,783,438 $2,461,317 $7,871,156 $76,732 $6,930,775 $61,055,516 $1,521,138 $17,725,481 $10,306,563 $63,652,079 $62,739,169 $381,273 $3,587,301 $101,512 $12,349,735 $258,543,185
LIABILITIESCurrent liabilitiesAccounts payable & accrued expenses $34,497 $1,639,641 $13,567 $482,591 $16,046 $16,126 $170,474 $2,887,445 $209,186 $50,509 $168,298 $21,608 $35,576 $5,745,564Long-term debt, current 1,875,757 23,000 49,261 1,948,018 Deferred income 2,500 75,310 32,866 717,097 188,141 39,113 55,034 6,161,964 7,272,025
Total current liabilities 36,997 1,639,641 13,567 482,591 91,356 48,992 170,474 3,604,542 2,273,084 89,622 168,298 99,642 6,246,801 14,965,607
Other liabilitiesOther payables 5,662 3,215,557 5,543 602,977 3,829,739 Long-term debt, noncurrent 318,014 318,014
Total other liabilities 5,662 3,215,557 5,543 920,991 4,147,753
Total liabilities 36,997 1,639,641 13,567 482,591 91,356 48,992 176,136 3,604,542 5,488,641 89,622 168,298 105,185 7,167,792 19,113,360
NET ASSETSUnrestricted 971,656 $2,461,317 6,231,515 $48,773 614,461 2,915,807 1,419,679 288,003 89,532 6,947,467 4,820,683 273,093 903,757 (3,673) 5,181,943 33,164,013 Temporarily restricted:
Scholarships & fellowships 7,799,569 100,766 676,366 7,217,490 6,087,209 21,881,400 Research 5,050 42,373 579,581 627,004 Other 6,524,785 27,959 1,825,690 12,785,860 10,103 1,776,908 2,652,192 10,460,850 19,896,585 9,916 569,353 56,540,201
Permanently restricted:Scholarships & fellowships 22,591,446 10,820,115 23,702,328 11,657,005 68,770,894 Research 10,203 31,171 315,104 356,478 Other 250,000 4,477,057 14,464,990 4,617,153 6,712,337 11,719,402 13,894,361 8,642 1,945,893 58,089,835
Total net assets 7,746,441 2,461,317 6,231,515 76,732 6,917,208 60,572,925 1,429,782 17,676,489 10,130,427 60,047,537 57,250,528 291,651 3,419,003 (3,673) 5,181,943 239,429,825
Total liabilities and net assets $7,783,438 $2,461,317 $7,871,156 $76,732 $6,930,775 $61,055,516 $1,521,138 $17,725,481 $10,306,563 $63,652,079 $62,739,169 $381,273 $3,587,301 $101,512 $12,349,735 $258,543,185
83

UNIVERSITY SYSTEM OF MARYLANDCOMBINING BALANCE SHEET, NONMAJOR COMPONENT UNITS
JUNE 30, 2012
Medical Alumni M Club The Robert H. Coppin State University The Maryland University of Association of Foundation Smith School Harry R. Hughes Bowie State Towson Frostburg University University of Salisbury Maryland Research Center at Maryland
the University of University of of Business Center for University University State University Development Baltimore University The Ward 4-H Corporation Bowie State Baltimore County Total NonmajorMaryland, Inc. Maryland, Inc. Foundation, Inc. Argo-Ecology, Inc. Foundation, Inc. Foundation, Inc. Foundation, Inc. Foundation, Inc. Foundation, Inc. Foundation, Inc. Foundation, Inc. Foundation, Inc. International University, Inc. Research Park Component Units
ASSETSCurrent assetsCash $593,253 $86,940 $595,684 $88,352 $775,313 $3,564,722 $536,425 $2,120,759 $20,727,745 $311,582 $101,334 $654,848 $462,154 $93,529 $608,227 $31,320,867Accounts receivable, net 8,649 406 167,678 26 572,991 179,794 141,111 322,050 6,756,379 1,373,600 33,416 34,895 30,394 48,452 106,458 9,776,299 Other assets 124,310 237,162 1,061 6,307 169,942 21,298 10,483 58,570 88,123 40,519 2,683 760,458
Total current assets 726,212 87,346 1,000,524 89,439 1,354,611 3,914,458 698,834 2,453,292 27,542,694 1,773,305 175,269 692,426 492,548 141,981 714,685 41,857,624
InvestmentsEndowment investments 5,664,564 2,432,237 5,526,357 48,666,519 14,464,881 7,648,921 39,508,346 37,792,948 2,472,236 164,177,009 Other investments 239,155 6,037,640 814,225 2,112,844 8,468,770 17,672,634
Total investments 5,664,564 2,671,392 6,037,640 5,526,357 48,666,519 15,279,106 7,648,921 39,508,346 39,905,792 2,472,236 8,468,770 181,849,643
Other assetsAccounts receivable, net 522,006 678,315 6,105,924 7,306,245 Capital assets, net 3,634 1,136 1,371,285 1,289,748 109,505 100,926 6,336 2,905,722 5,788,292 Other assets 1,200,000 161,200 222,107 6,684,888 99,224 8,367,419
Total other assets 1,725,640 840,651 222,107 1,371,285 14,080,560 208,729 100,926 6,336 2,905,722 21,461,956
Total assets $6,390,776 $2,758,738 $7,038,164 $89,439 $6,880,968 $54,306,617 $16,818,591 $10,324,320 $68,422,325 $55,759,657 $383,998 $3,265,588 $492,548 $148,317 $12,089,177 $245,169,223
LIABILITIESCurrent liabilitiesAccounts payable & accrued expenses $300,940 $1,525 $637,376 $60,149 $266,187 $28,031 $144,763 $658,011 $128,576 $63,387 $123,363 $322,553 $12,407 $85,542 $2,832,810Long-term debt, current 1,000,000 8,500 47,850 1,056,350 Deferred income 14,565 12,000 190,410 269,700 159,117 49,631 85,060 5,771,633 6,552,116
Total current liabilities 315,505 1,525 649,376 60,149 1,266,187 218,441 144,763 927,711 287,693 113,018 123,363 322,553 105,967 5,905,025 10,441,276
Other liabilitiesOther payables 75 2,730,149 5,818 980,739 3,716,781 Long-term debt, noncurrent 1,893,070 379,415 2,272,485
Total other liabilities 75 4,623,219 5,818 1,360,154 5,989,266
Total liabilities 315,505 1,525 649,376 60,149 1,266,187 218,441 144,838 927,711 4,910,912 113,018 123,363 322,553 111,785 7,265,179 16,430,542
NET ASSETSUnrestricted 724,854 2,757,213 6,388,788 $60,540 320,453 2,749,334 140,352 349,204 7,687,438 4,169,419 252,985 760,184 169,995 36,532 4,823,998 31,391,289 Temporarily restricted:
Scholarships & fellowships 5,448,293 130,568 2,768,755 3,962,318 12,309,934 Research 3,639 34,950 520,128 558,717 Other 5,350,417 28,899 2,036,201 10,457,193 1,827,179 3,215,252 22,380,071 18,620,938 9,353 424,112 64,349,615
Permanently restricted:Scholarships & fellowships 21,027,428 10,123,677 27,880,961 11,384,139 70,416,205 Research 10,003 30,687 210,633 251,323 Other 4,464,165 13,344,540 4,312,737 6,615,026 6,777,389 11,981,170 8,642 1,957,929 49,461,598
Total net assets 6,075,271 2,757,213 6,388,788 89,439 6,820,819 53,040,430 16,600,150 10,179,482 67,494,614 50,848,745 270,980 3,142,225 169,995 36,532 4,823,998 228,738,681
Total liabilities and net assets $6,390,776 $2,758,738 $7,038,164 $89,439 $6,880,968 $54,306,617 $16,818,591 $10,324,320 $68,422,325 $55,759,657 $383,998 $3,265,588 $492,548 $148,317 $12,089,177 $245,169,223
84

UNIVERSITY SYSTEM OF MARYLANDCOMBINING STATEMENT OF NET ACTIVITIES, NONMAJOR COMPONENT UNITS
YEAR ENDED JUNE 30, 2013
Medical Alumni M Club The Robert H. Coppin State University The Maryland University of Association of Foundation, Smith School Harry R. Hughes Bowie State Towson Frostburg University University of Salisbury Maryland Research Center at Maryland
the University of University of of Business Center for University University The Hawk State University Development Baltimore University The Ward 4-H Corporation Bowie State Baltimore County Total NonmajorMaryland, Inc. Maryland, Inc. Foundation, Inc. Argo-Ecology, Inc. Foundation, Inc. Foundation, Inc. Foundation, Inc. Foundation, Inc. Foundation, Inc. Foundation, Inc. Foundation, Inc. Foundation, Inc. Foundation, Inc. International University, Inc. Research Park Component Units
CHANGES IN UNRESTRICTED NET ASSETSRevenuesContributions & grants $1,057,273 $8,665 $5,000 $238 $481,168 $419,994 $363,033 $70,688 $266,145 $296,182 $520,676 $240,076 $268,255 $3,997,393
Investment income (loss) 53,785 183,355 662,707 $555 1,093 679,492 26,784 66,720 2,099 854,023 345,764 151,155 145,432 $268,569 3,441,533
Other income 427,761 (14,203) 2,009,771 99,546 17,253 1,447,310 231,750 72,064 33,276 1,402,997 291,304 295,644 10,621 1,543,300 7,868,394
Assets released from restrictions 4,000 941 1,212,157 5,158,328 5,777 1,681,225 1,014,471 18,290,912 2,950,149 5,939 379,790 30,703,689
Total revenues 1,542,819 177,817 2,677,478 1,496 1,313,034 6,336,241 1,899,865 2,342,728 1,159,322 19,444,356 4,995,092 969,074 1,060,942 278,876 1,811,869 46,011,009
ExpensesProgram 861,938 416,998 1,294,767 11,550 923,087 5,387,686 310,343 1,522,325 996,287 19,298,111 3,747,727 662,041 723,475 311,092 440,320 36,907,747
General & administrative 231,497 56,715 785,751 1,712 39,019 515,025 94,496 137,386 105,673 593,026 433,769 239,422 156,557 7,989 94,747 3,492,784
Fundraising 202,582 56,920 267,057 20,978 23,834 293,190 162,332 41,838 37,337 1,106,068
Other expense 754,233 75,347 343,237 293,200 5,665 $169,995 918,857 2,560,534
Total expenses 1,296,017 473,713 2,834,751 13,262 1,019,026 6,169,768 480,186 2,023,926 1,418,994 20,184,327 4,343,828 948,966 917,369 169,995 319,081 1,453,924 44,067,133
Change in unrestricted net assets 246,802 (295,896) (157,273) (11,766) 294,008 166,473 1,419,679 318,802 (259,672) (739,971) 651,264 20,108 143,573 (169,995) (40,205) 357,945 1,943,876
CHANGES IN TEMPORARILY RESTRICTED NET ASSETSContributions & grants 28,000 568,043 3,888,545 634,142 362,889 7,987,249 1,834,385 6,502 490,593 15,800,348
Investment income (loss) 1,150,368 353,745 5,192,400 2,208 590,380 3,206,871 5,452,477 34,438 15,982,887
Other income 92,750 791,150 15,880 257,874 187,747 55,392 88,078 1,488,871
Assets released from restrictions (4,000) (941) (1,225,049) (5,190,741) (5,777) (977,818) (1,014,471) (18,719,998) (3,914,949) (5,939) (379,790) (31,439,473)
Change in temporarily restricted net assets 1,174,368 (941) (210,511) 4,681,354 10,103 (83,594) 126,545 (7,470,486) 3,459,991 563 145,241 1,832,633
CHANGES IN PERMANENTLY RESTRICTED NET ASSETSContributions & grants 250,000 2,640,254 379,280 84,072 333,684 1,050,459 4,737,749
Investment income (loss) 1,162,426 275,269 (12,036) 1,425,659
Other income 12,001 2,832 610 15,443
Assets released from restrictions 12,892 32,413 (703,407) 429,086 964,800 735,784
Change in permanently restricted net assets 250,000 12,892 2,684,668 841,131 84,072 763,380 2,290,528 (12,036) 6,914,635
Total change in net assets 1,671,170 (295,896) (157,273) (12,707) 96,389 7,532,495 1,429,782 1,076,339 (49,055) (7,447,077) 6,401,783 20,671 276,778 (169,995) (40,205) 357,945 10,691,144
Net assets - beginning of year 6,075,271 2,757,213 6,388,788 89,439 6,820,819 53,040,430 16,600,150 10,179,482 67,494,614 50,848,745 270,980 3,142,225 169,995 36,532 4,823,998 228,738,681
Net assets - end of year $7,746,441 $2,461,317 $6,231,515 $76,732 $6,917,208 $60,572,925 $1,429,782 $17,676,489 $10,130,427 $60,047,537 $57,250,528 $291,651 $3,419,003 ($3,673) $5,181,943 $239,429,825
85
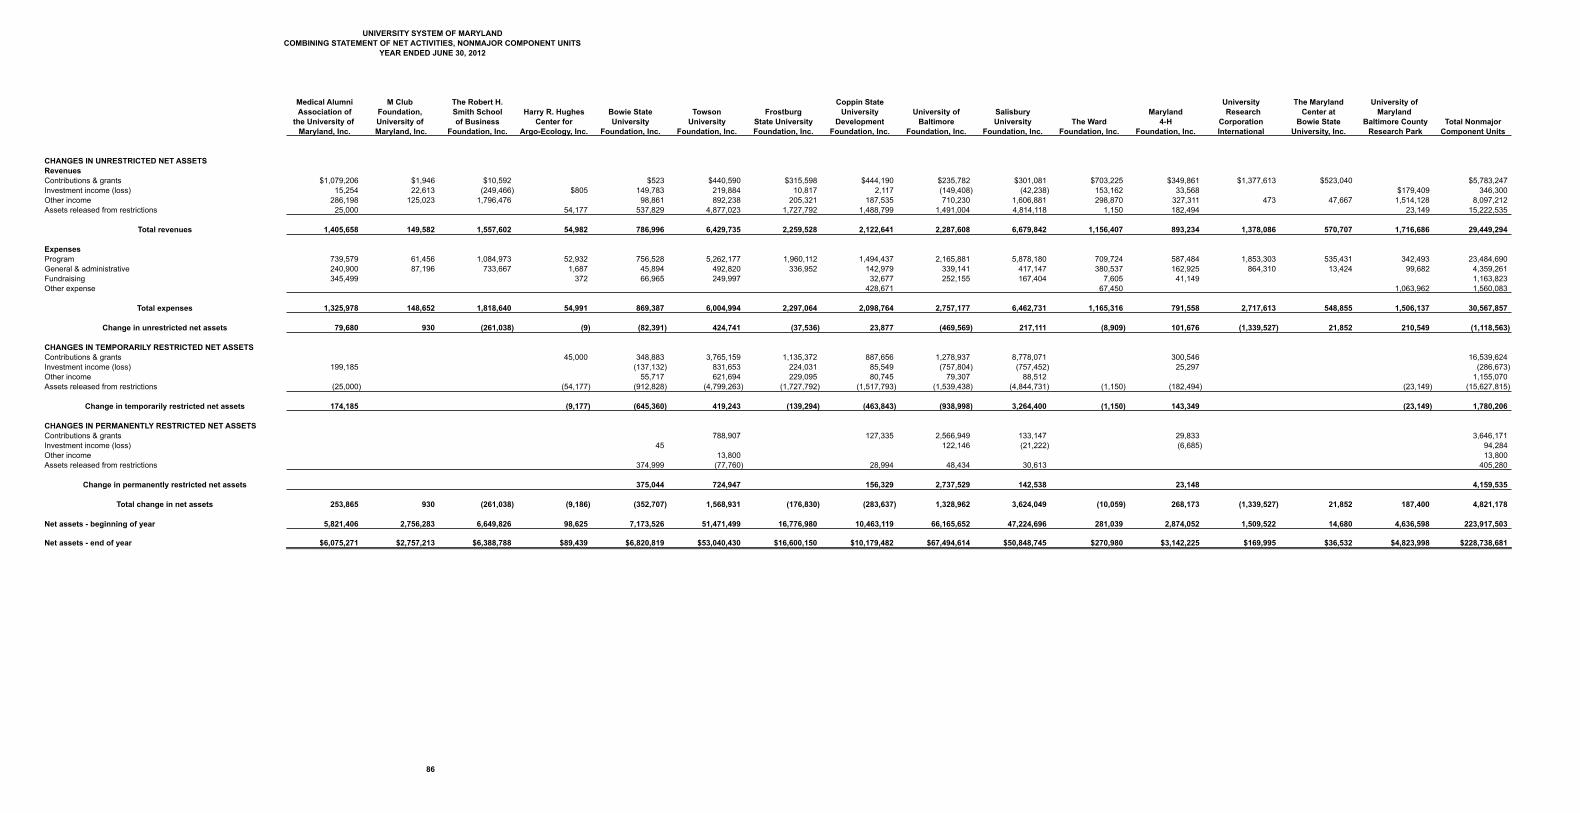
UNIVERSITY SYSTEM OF MARYLANDCOMBINING STATEMENT OF NET ACTIVITIES, NONMAJOR COMPONENT UNITS
YEAR ENDED JUNE 30, 2012
Medical Alumni M Club The Robert H. Coppin State University The Maryland University of Association of Foundation, Smith School Harry R. Hughes Bowie State Towson Frostburg University University of Salisbury Maryland Research Center at Maryland
the University of University of of Business Center for University University State University Development Baltimore University The Ward 4-H Corporation Bowie State Baltimore County Total NonmajorMaryland, Inc. Maryland, Inc. Foundation, Inc. Argo-Ecology, Inc. Foundation, Inc. Foundation, Inc. Foundation, Inc. Foundation, Inc. Foundation, Inc. Foundation, Inc. Foundation, Inc. Foundation, Inc. International University, Inc. Research Park Component Units
CHANGES IN UNRESTRICTED NET ASSETSRevenuesContributions & grants $1,079,206 $1,946 $10,592 $523 $440,590 $315,598 $444,190 $235,782 $301,081 $703,225 $349,861 $1,377,613 $523,040 $5,783,247Investment income (loss) 15,254 22,613 (249,466) $805 149,783 219,884 10,817 2,117 (149,408) (42,238) 153,162 33,568 $179,409 346,300 Other income 286,198 125,023 1,796,476 98,861 892,238 205,321 187,535 710,230 1,606,881 298,870 327,311 473 47,667 1,514,128 8,097,212 Assets released from restrictions 25,000 54,177 537,829 4,877,023 1,727,792 1,488,799 1,491,004 4,814,118 1,150 182,494 23,149 15,222,535
Total revenues 1,405,658 149,582 1,557,602 54,982 786,996 6,429,735 2,259,528 2,122,641 2,287,608 6,679,842 1,156,407 893,234 1,378,086 570,707 1,716,686 29,449,294
ExpensesProgram 739,579 61,456 1,084,973 52,932 756,528 5,262,177 1,960,112 1,494,437 2,165,881 5,878,180 709,724 587,484 1,853,303 535,431 342,493 23,484,690 General & administrative 240,900 87,196 733,667 1,687 45,894 492,820 336,952 142,979 339,141 417,147 380,537 162,925 864,310 13,424 99,682 4,359,261 Fundraising 345,499 372 66,965 249,997 32,677 252,155 167,404 7,605 41,149 1,163,823 Other expense 428,671 67,450 1,063,962 1,560,083
Total expenses 1,325,978 148,652 1,818,640 54,991 869,387 6,004,994 2,297,064 2,098,764 2,757,177 6,462,731 1,165,316 791,558 2,717,613 548,855 1,506,137 30,567,857
Change in unrestricted net assets 79,680 930 (261,038) (9) (82,391) 424,741 (37,536) 23,877 (469,569) 217,111 (8,909) 101,676 (1,339,527) 21,852 210,549 (1,118,563)
CHANGES IN TEMPORARILY RESTRICTED NET ASSETSContributions & grants 45,000 348,883 3,765,159 1,135,372 887,656 1,278,937 8,778,071 300,546 16,539,624 Investment income (loss) 199,185 (137,132) 831,653 224,031 85,549 (757,804) (757,452) 25,297 (286,673) Other income 55,717 621,694 229,095 80,745 79,307 88,512 1,155,070 Assets released from restrictions (25,000) (54,177) (912,828) (4,799,263) (1,727,792) (1,517,793) (1,539,438) (4,844,731) (1,150) (182,494) (23,149) (15,627,815)
Change in temporarily restricted net assets 174,185 (9,177) (645,360) 419,243 (139,294) (463,843) (938,998) 3,264,400 (1,150) 143,349 (23,149) 1,780,206
CHANGES IN PERMANENTLY RESTRICTED NET ASSETSContributions & grants 788,907 127,335 2,566,949 133,147 29,833 3,646,171 Investment income (loss) 45 122,146 (21,222) (6,685) 94,284 Other income 13,800 13,800 Assets released from restrictions 374,999 (77,760) 28,994 48,434 30,613 405,280
Change in permanently restricted net assets 375,044 724,947 156,329 2,737,529 142,538 23,148 4,159,535
Total change in net assets 253,865 930 (261,038) (9,186) (352,707) 1,568,931 (176,830) (283,637) 1,328,962 3,624,049 (10,059) 268,173 (1,339,527) 21,852 187,400 4,821,178
Net assets - beginning of year 5,821,406 2,756,283 6,649,826 98,625 7,173,526 51,471,499 16,776,980 10,463,119 66,165,652 47,224,696 281,039 2,874,052 1,509,522 14,680 4,636,598 223,917,503
Net assets - end of year $6,075,271 $2,757,213 $6,388,788 $89,439 $6,820,819 $53,040,430 $16,600,150 $10,179,482 $67,494,614 $50,848,745 $270,980 $3,142,225 $169,995 $36,532 $4,823,998 $228,738,681
86

87
UNIVERSITY SYSTEM OF MARYLAND NOTES TO SUPPLEMENTAL DATA YEARS ENDED JUNE 30, 2013 AND 2012 ACCOUNTING AND REPORTING PRACTICES Supplemental data reporting units University System of Maryland Office (System Office), composed of the offices of the Chancellor and Vice Chancellors and their respective staffs, provides central executive and administrative services and supports and coordinates the efforts of the entire System. The expenses incurred in connection with these activities have not been allocated to the other units of the System and accordingly have been included in the financial records of the System Office. Facilities maintenance expenses Certain expenses for facilities management for the System Office and the University of Maryland University College are included in the financial records of University of Maryland, College Park. System-wide financing arrangements The System constructs, acquires, and renovates plant facilities using the proceeds of Revenue Bonds and other financing arrangements. The proceeds of System-wide financing arrangements are used in accordance with Board authorizations, which specify the projects for which the funds are to be used. Unexpended proceeds and a proportionate share of the outstanding debt obligation are reported on the financial records of the System Office. Institutions are obligated to provide a proportionate share of the principal and interest payments attributable to auxiliary enterprises projects financed using the proceeds of System-wide financing arrangements. Currently, each instructional institution, with the exception of the University of Maryland University College, provides a portion of the debt service attributable to academic facilities. To the extent that an instructional institution provides (or receives) resources for debt service for academic facilities (and the proportionate share of the outstanding debt obligation) recorded on another System institution or unit, such amounts are reported as a Transfer To / (From) Other University System of Maryland Institutions on the Statement of Revenues, Expenses, and Changes in Net Position.