unmanned aerial vehicle systems - iceaaonline.com aerial vehicle systems database and parametric...
TRANSCRIPT

Naval Center for Cost Analysis (NCCA)
Unmanned Aerial Vehicle Systems Database and Parametric Model Research
Study Team: Bruce Parker, Praful Patel, Patrick Staley (NCCA)
Rachel Cosgray, Anna Irvine, Brian Welsh (Technomics)

• Objective • Data collection • UAV database • Cost Estimating Relationship
– Development
– Procurement
– O&S
• Summary • Next steps
Outline of Presentation
2

Objective
• Collect cost, technical and programmatic data for Army, Navy and Air Force UAS programs
• Develop Cost Estimating Relationships (CERs) for development, production and O&S cost elements
• Publish UAS data books and handbook w/ CERs
3
DoD Tri-service collaborative effort Sponsored by NCCA and ODASA-CE
Data support from AFCAA, NAVAIR, ASC, and AMCOM

UAS Programs in Scope
4
Global Hawk (RQ-4) Firescout (MQ-8)
Hunter (RQ-5)
Predator (M/RQ-1A) Reaper (MQ-9)
BAMS (MQ-4)
Grey Eagle (MQ-1C)
STUAS (RQ-21A) Shadow (RQ-7)
UCAS-D
JLENS HALE-D
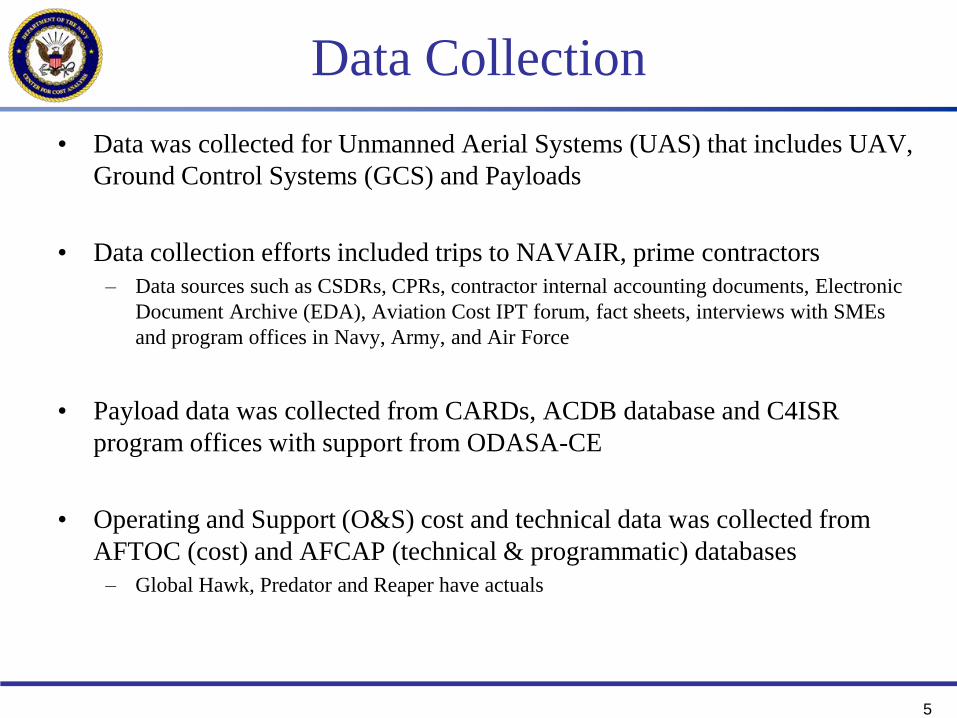
• Data was collected for Unmanned Aerial Systems (UAS) that includes UAV, Ground Control Systems (GCS) and Payloads
• Data collection efforts included trips to NAVAIR, prime contractors – Data sources such as CSDRs, CPRs, contractor internal accounting documents, Electronic
Document Archive (EDA), Aviation Cost IPT forum, fact sheets, interviews with SMEs and program offices in Navy, Army, and Air Force
• Payload data was collected from CARDs, ACDB database and C4ISR program offices with support from ODASA-CE
• Operating and Support (O&S) cost and technical data was collected from AFTOC (cost) and AFCAP (technical & programmatic) databases
– Global Hawk, Predator and Reaper have actuals
5
Data Collection

Data Collection • Acquisition cost data was collected and mapped using
MIL‐HDBK 881-A WBS – Many programs in the study were developed and produced before 2005
under 881-A
– Airframe and Propulsion cost data was available to the WBS third level, other data only supported at the second level
• O&S cost data mapped using 2007 CAIG O&S Guide structure: – 1.0 Unit Level Manpower
– 2.0 Unit Operations
– 3.0 Maintenance
– 4.0 Sustaining Support
– 5.0 Continuing System Improvements
– 6.0 Indirect Support
6

Data Collection • Technical and programmatic data sources included:
– CARDs
– Technical requirements Documents (TRDs)
– Test and Evaluation Master Plans (TEMPs)
– Integrated Master Schedules (IMSs)
– SARs
– Defense Acquisition Executive Summaries (DAESs)
– Program Office Briefings
– International Helicopter Society (IHS)
– JANE’S Defense & Security Intelligence & Analysis
– Payload data fact sheets from contractors
7
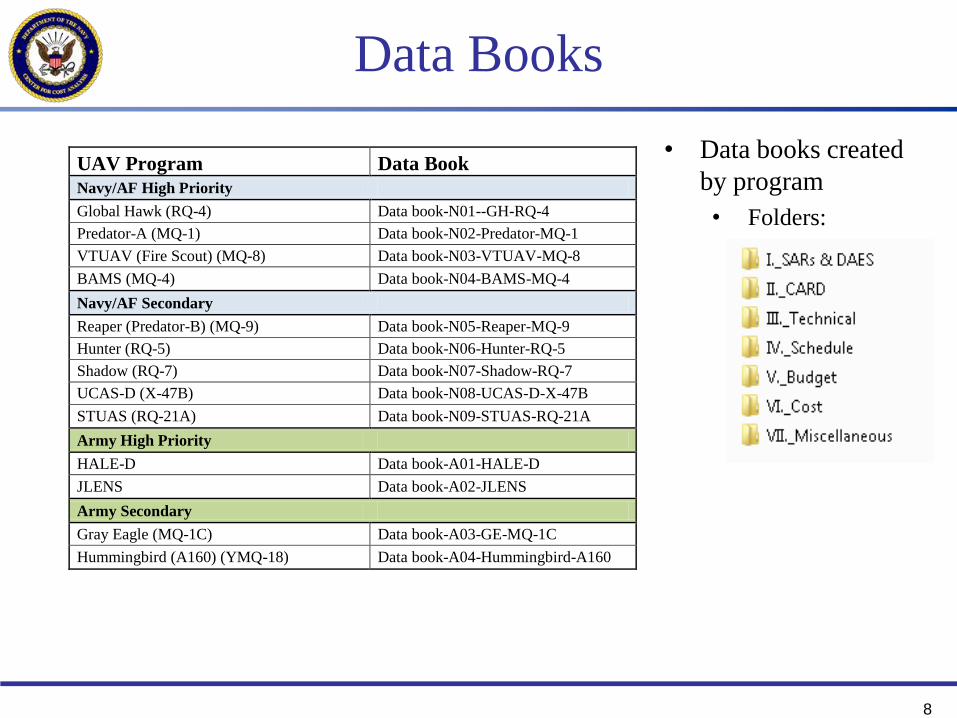
Data organized into summary spreadsheets and Data Books for each program
Data Books
8
• Data books created by program • Folders:
UAV Program Data Book Navy/AF High Priority
Global Hawk (RQ-4) Data book-N01--GH-RQ-4
Predator-A (MQ-1) Data book-N02-Predator-MQ-1
VTUAV (Fire Scout) (MQ-8) Data book-N03-VTUAV-MQ-8
BAMS (MQ-4) Data book-N04-BAMS-MQ-4
Navy/AF Secondary
Reaper (Predator-B) (MQ-9) Data book-N05-Reaper-MQ-9
Hunter (RQ-5) Data book-N06-Hunter-RQ-5
Shadow (RQ-7) Data book-N07-Shadow-RQ-7
UCAS-D (X-47B) Data book-N08-UCAS-D-X-47B
STUAS (RQ-21A) Data book-N09-STUAS-RQ-21A
Army High Priority
HALE-D Data book-A01-HALE-D
JLENS Data book-A02-JLENS
Army Secondary
Gray Eagle (MQ-1C) Data book-A03-GE-MQ-1C
Hummingbird (A160) (YMQ-18) Data book-A04-Hummingbird-A160
Data Collection
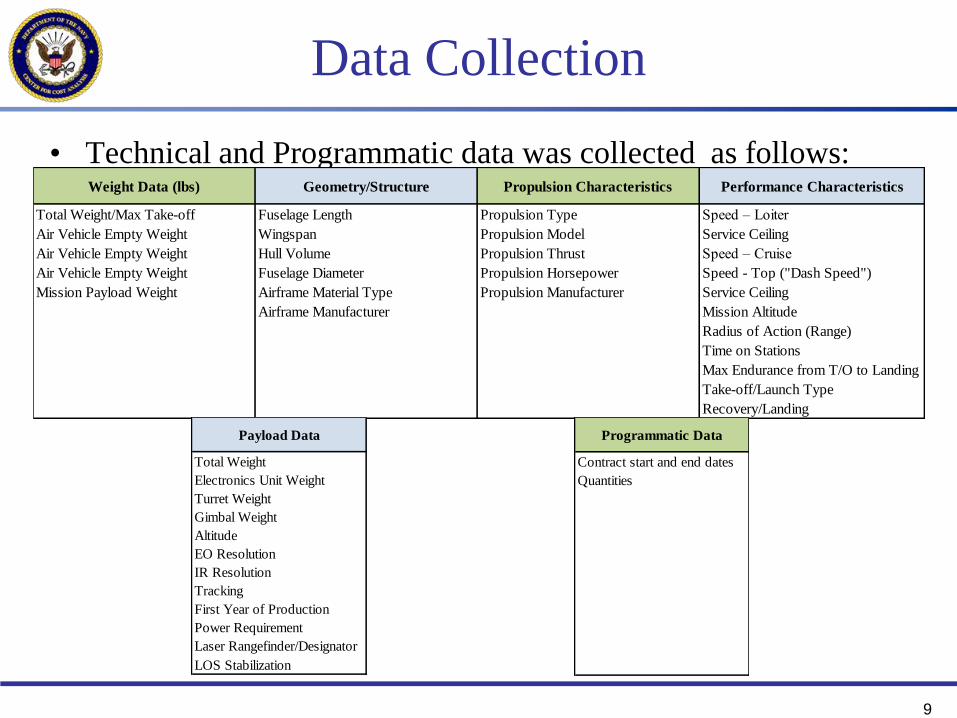
• Technical and Programmatic data was collected as follows:
9
Weight Data (lbs) Geometry/Structure Propulsion Characteristics Performance Characteristics
Total Weight/Max Take-off Fuselage Length Propulsion Type Speed – Loiter
Air Vehicle Empty Weight Wingspan Propulsion Model Service CeilingAir Vehicle Empty Weight Hull Volume Propulsion Thrust Speed – Cruise
Air Vehicle Empty Weight Fuselage Diameter Propulsion Horsepower Speed - Top ("Dash Speed")Mission Payload Weight Airframe Material Type Propulsion Manufacturer Service Ceiling
Airframe Manufacturer Mission AltitudeRadius of Action (Range)Time on StationsMax Endurance from T/O to LandingTake-off/Launch TypeRecovery/Landing
Payload Data
Total WeightElectronics Unit WeightTurret WeightGimbal WeightAltitudeEO ResolutionIR ResolutionTrackingFirst Year of ProductionPower RequirementLaser Rangefinder/DesignatorLOS Stabilization
Programmatic Data
Contract start and end datesQuantities

Summary of Cost Data Collection
10
• UAS Vehicle Data set includes: • 11 Development • 7 Production • 3 O&S Programs
• Payload Data set includes: • 2 Development • 7 Production programs

Data Analysis
• Cost data was mapped to 881-A WBS
• Service specific OSD inflation indices were utilized to normalize the cost data to FY13$
• Unit Theory Cost Improvement Curve analysis was performed on the development and production air vehicle lot data
• Rate Curves were evaluated, but were not statistically significant
• CERs were developed using regression statistics for development, production and O&S phases
11

Cost Improvement Curve Analysis Air Vehicle Production
12
Program Confidence Interval (CI) for cost improvement
UAS #1 75% CI for the exponent translates to a slope between 88.6% and 95.0%
UAS #2 75% CI for the exponent translates to a slope between 89.4% and 108.3%
UAS #3 75% CI for the exponent translates to a slope between 97.5% and 125.1%
UAS #4 N/A
UAS #5 75% CI for the exponent translates to a slope between 90.6% and 137.4%
UAS #6 75% CI for the exponent translates to a slope between 85.5% and 90.0%
UAV programs often receive continuous in-line improvements
Programs
Statistics UAS #1 UAS #2 UAS #3 UAS #4 UAS #5 UAS #6
Unit Curve Slope 91.7% 98.4% 110.4% 86.4% 111.6% 87.7%
R Square 88.6% 15.0% 44.9% 100% 61.8% 89.6%
Adjusted R Square 82.9% 17.4% 23.5% 87.5%
Standard Error 0.051 0.062 0.229 0.169 0.071
Observations 4 3 4 2 3 7
F 15.58 0.16 1.63 1.61 43.05
Significance F 0.059 0.755 0.330 0.424 0.001
O&S
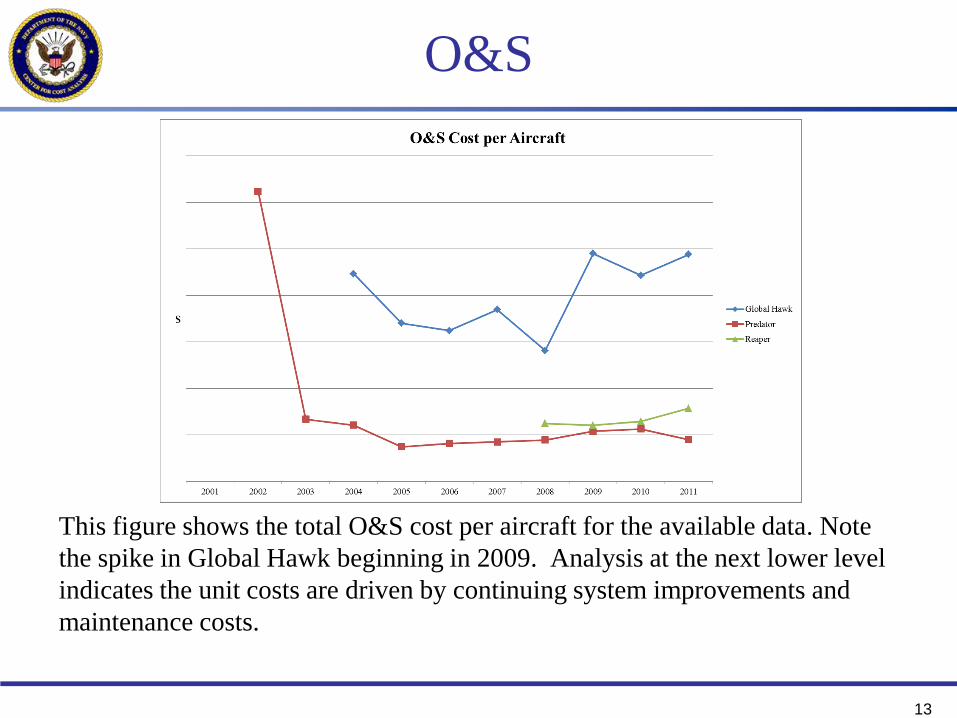
This figure shows the total O&S cost per aircraft for the available data. Note the spike in Global Hawk beginning in 2009. Analysis at the next lower level indicates the unit costs are driven by continuing system improvements and maintenance costs.
13

O&S
This figure shows O&S costs per flying hour for the available data.
14

CER Summary UAS System WBS Structure CER
Total Development No Recommendation
1.0 Air Vehicle First Lot Air Vehicle Recurring Unit Cost =
f( Maximum Take Off Weight)
First Lot Air Vehicle Recurring Unit Cost =
f(Service Ceiling)
1.1 Airframe First Lot Air Frame Recurring Unit Cost =
f(Payload)
1.2 Propulsion First Lot Propulsion Recurring Unit Cost =
f(Engine Weight)
2.0 Payload First Lot Payload Average Unit Cost =
f(Weight, whether Radar or not) 3.0 Ground/Host Segment
3.1 Ground Control Station No Recommendation
4.0 UAV System Integration, Assembly, Test and Checkout
Air Vehicle, Payload, and Ground/Host Segment CERs Include this element.
15
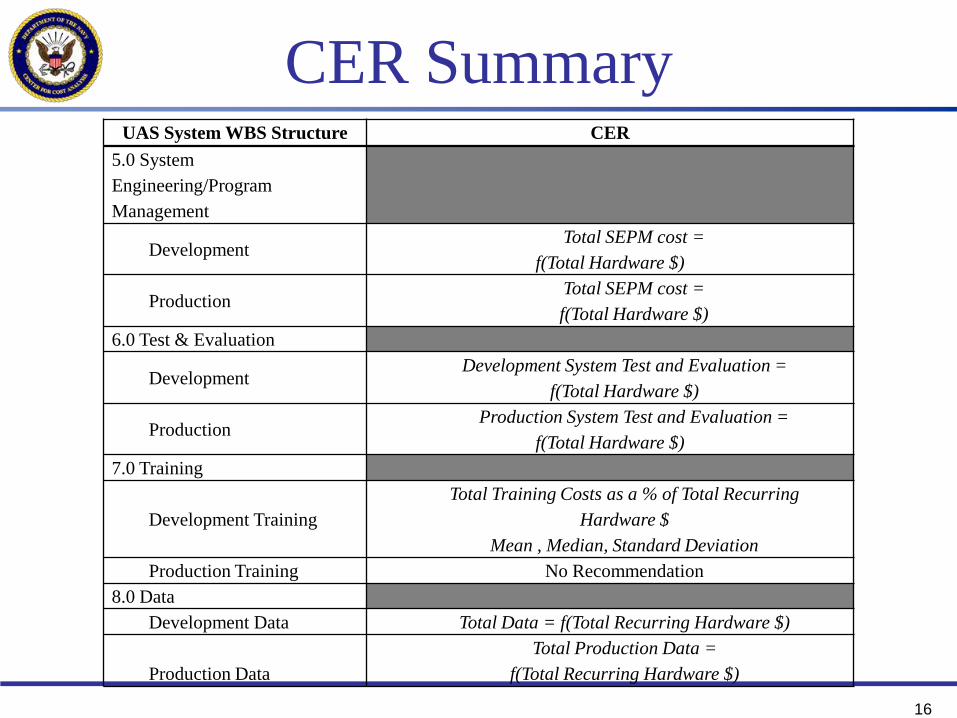
CER Summary 5.0 System Engineering/Program Management
Development Total SEPM cost =
f(Total Hardware $)
Production Total SEPM cost = f(Total Hardware $)
6.0 Test & Evaluation
Development Development System Test and Evaluation =
f(Total Hardware $)
Production Production System Test and Evaluation =
f(Total Hardware $) 7.0 Training
Development Training Total Training Costs as a % of Total Recurring
Hardware $ Mean , Median, Standard Deviation
Production Training No Recommendation 8.0 Data Development Data Total Data = f(Total Recurring Hardware $) Production Data
Total Production Data = f(Total Recurring Hardware $)
16
UAS System WBS Structure CER

CER Summary 9.0 Peculiar Support Equipment
Development Tooling Non-recurring Tooling Costs as a % of Total Recurring
Hardware $ Mean , Median, Standard Deviation also provided
Production Tooling Non-recurring Tooling Costs as a % of Total Recurring
Hardware $ Mean , Median, Standard Deviation also provided
10.0 Common Support Equipment
Total Common Support Equipment Costs as a % of Total
Recurring Hardware $ Mean , Median, Standard Deviation also provided
11.0 Operational/Site Activation Total Operational/Site Activation Costs as a % of Total
Recurring Hardware $ Mean , Median, Standard Deviation also provided
12.0 Industrial Facilities No Recommendation
13.0 Initial Spares and Repair Parts
Total Initial Spares and Repair Parts Cost as a % of Total
Recurring Hardware $ Mean , Median, Standard Deviation also provided
17
UAS System WBS Structure CER

O&S CERs
18
CAIG O&S CES Structure CER 1.0 Unit-Level Manpower Unit Level Manpower Cost =
f(Civilian, Officer, Enlisted Headcounts) Unit Level Manpower Cost =
f(Total Aircraft Inventory) 2.0 Unit Operations
Unit Operations Cost = f(Operating Hours)
Operating Hours = f(TAI)
3.0 Maintenance Maintenance Unit Cost in = f(MTOW , Age, TAI)
4.0 Sustaining Support Sustaining Support Cost =
f(Total Hours)
5.0 Continuing System Improvements No Recommendation
6.0 Indirect Support Indirect Support Costs =
f(Number of Systems)

CER Example Air Vehicle
19
12 data points Development = Dummy variable denoting manufacturing phase 0 = Production 1 = Development MTOW = Maximum Takeoff Weight in pounds Rotary = Dummy Variable denoting rotary wing aircraft 0 = Fixed Wing 1 = Rotary Wing Air Vehicle Recurring Unit Cost = Recurring cost for the applicable development or production contract as identified in the cost report.
Program Development MTOW (lbs) RotaryAir Vehicle
Recurring Unit Cost (FY13$K)
BAMS MQ-4C 1 32,250 0
Fire Scout MQ-8B 1 3,150 1Gray Eagle MQ-1C 1 3,283 0Predator RQ-1A 1 2,120 0Shadow RQ-7A 1 350 0Fire Scout MQ-8B 0 3,150 1Global Hawk RQ-4B (Block 20) 0 31,456 0Global Hawk RQ-4A (Block 10) 0 26,700 0Hunter RQ-5 0 1,620 0Pioneer RQ-2B 0 447 0Predator RQ-1A 0 2,120 0Reaper MQ-9A 0 10,500 0

CER Example Air Vehicle
• Equations 1 through 3 are log-linear and include dummy variables to adjust for a program in development and whether the platform is rotary or not. Good statistics were observed in Equation 1.
• With Equation 1, 10 of the 12 observations were predicted within 30% of the actual values. The remaining 2 data points were within 60%.
• Equations 2 and 3 remove the BAMS data point due to it being less than 50% complete. Equation 3 is the same function form as Equation 2 without the intercept.
• The limitations with models in Equations 1 through 3 may be in regard to rotary wing UAVs: the model only has one program in the dataset representing rotary wing, Fire Scout, and was removed
• Equations 4 through 7 analyzed a MTOW relationship only.
• Equations 4 and 5 are linear.
• Equations 5 through 7 removed BAMS.
• Equations 6 and 7 are log-log relationships.
• Equation 7 removes the intercept due to being insignificant.
20
# Equation R2 adj % nt-value >
90%
MAD (%)
(unit)
CV (%) (unit)
3 < 30% SE (unit) Comments
1 f (MTOW, Dev, Rotary) 97 12 Y 17 19 10 6087 All Data points
2 f (MTOW, Dev, Rotary) 96 11 N 18 25 9 6634 Less BAMS
3 f (MTOW, Dev, Rotary) 96 11 Y 18 25 9 6196 Less BAMS
4 f (MTOW) 92 12 N 41 24 6 4204 All Data points
5 f (MTOW) 89 11 N 50 30 5 4319 Less BAMS
6 f (MTOW) 94 11 N 28 30 7 5137 Less BAMS
7 f (MTOW) 99.8 11 Y 28 29 8 4464 Less BAMS

CER Example Air Vehicle (cont)
21
CER Summary:
Equation 7 Y = f(MTOW)
Variables: Y = First Lot Air Vehicle Recurring Unit Cost MTOW = Maximum Takeoff Weight in pounds Statistics: Adjusted R2 = 99.8 SE = 0.350 (4464 unit space) Df = 10 t(MTOW Coefficient) = 77.489 Data Ranges: 350 <= MTOW <= 31,456 80% Prediction Interval (2,500) = +65%, -39%
Complete data set, data plots, and CERs are now available
Below is the plot of the estimates using the CER versus the actuals.

Summary
• Data books with metadata for priority programs is complete
• UAS Database and Handbook have been published
• O&S historical actuals was limited to Air Force programs – Any use of the CERs for analysis should be limited to similar platforms
in terms of size, mission type, support concept
22
From Here…
• Combine UAS and manned aircraft into single data sets—many key subsystems are similar in higher end of MTOW scale
• Understand historical anomalies in certain programs
• UAS programs are growing and need to ensure the database and analysis is frequently updated to account for new data and technologies
23