unsaturated slope stability and seepage analysis of a dam · the control of seepage is extremely...
TRANSCRIPT

1876-6102 © 2016 The Authors. Published by Elsevier Ltd. This is an open access article under the CC BY-NC-ND license (http://creativecommons.org/licenses/by-nc-nd/4.0/).Peer-review under responsibility of the organizing committee EENVIRO 2015doi: 10.1016/j.egypro.2015.12.278
Energy Procedia 85 (2016) 93 – 98
ScienceDirect
Sustainable Solutions for Energy and Environment, EENVIRO - YRC 2015, 18-20 November 2015, Bucharest, Romania
Unsaturated Slope Stability and Seepage Analysis of a Dam
Carastoian Andreea*
Phd.student Technical University of Civil Engineering, Bucharest
Abstract
The paper presents stability and seepage analysis performed in unsaturated regime to take care of the infiltration through the dam. Seepage analysis is divided into two stages: steady state analysis and transient analysis. It will be determined the pore water pressure load, the ground water level, estimate the flow (path and quantity) and also, an advanced analysis considering rainfall and rapid drawdown. Van Genuchten model will be used for the unsaturated soil. © 2015 The Authors. Published by Elsevier Ltd. Peer-review under responsibility of the organizing committee EENVIRO 2015.
Keywords:seepage analysis, slope analysis, unsaturated soil, pressure load
1. Introduction
The paper presents stability and seepage analysis performed in unsaturated regime to take care of the infiltration through the dam.
Seepage is the water reservoir finding its way downstream through pervious material or through imperfections in the dam. The force or pressure behind the seeping water can create new or enlarge existing seepage pathways. So, the control of seepage is extremely important in the design, construction and safe operation of dams. Seepage causes stability problems when high water pressure and saturation in the embankment and foundation soils cause the earth materials to lose strength. All earth dams will have some seepage and it is unrealistic not to expect this. If seepage is
* Corresponding author. Tel.: +40 744 770 493 E-mail address: [email protected]
Available online at www.sciencedirect.com
© 2016 The Authors. Published by Elsevier Ltd. This is an open access article under the CC BY-NC-ND license (http://creativecommons.org/licenses/by-nc-nd/4.0/).Peer-review under responsibility of the organizing committee EENVIRO 2015
94 Carastoian Andreea / Energy Procedia 85 (2016) 93 – 98
considered as a potential problem, countermeasures – such as filters, drains, clay blankets and flatter side slopes – introduced at the design stage can reduce any risks to a minimum.[1]
Seepage analysis can be divided into two: the steady state analysis and transient analysis. Steady state flow analysis is where the boundary conditions inside and outside of the ground does not change with time. Therefore, the inflow is always equal to the outflow within the analysis range. Transient analysis on the other hand, can display different inflow and outflow with time, even when the same boundary conditions as the steady state analysis are applied.[2]
Seepage flow occurs along the waterway that connects through the empty pores between soil particles. This flow complies with Darcy’s law. According to this law, the seepage quantity through the soil volume is equal to the multiplication of permeability coefficient, hydraulic gradient and cross sectional area. Darcy’s law originally started from the saturated domain, but can also be applied to the unsaturated domain.[2] The unsaturated domain includes all non-saturated domains, from the fully dried condition to the almost saturated condition. As the degree of saturation falls below 100% , air bubbles will also exist in the pores and if the saturation is very low, the water particles will attached between soil particles in a concave form. Negative pore pressure is referred to as suction pressure. In most cases, suction pressure increases as the degree of saturation decreases. Transient analysis is used when the boundary conditions inside or outside of the ground changes according to time. The main differences between transient analysis and steady state analysis are that the boundary conditions change as time passes and the fact that the transient analysis requires volumetric water content. When the underground water level goes up or down, the influence factors such as the water content in the unsaturated domain and porosity are needed. [2]
2. Case Study
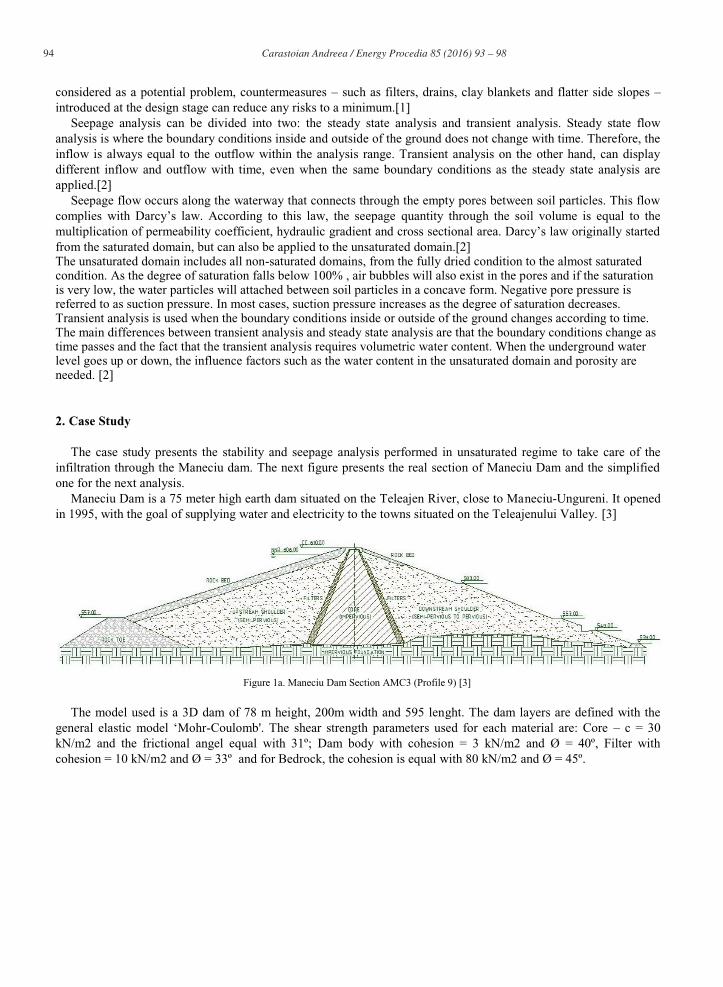
The case study presents the stability and seepage analysis performed in unsaturated regime to take care of the infiltration through the Maneciu dam. The next figure presents the real section of Maneciu Dam and the simplified one for the next analysis.
Maneciu Dam is a 75 meter high earth dam situated on the Teleajen River, close to Maneciu-Ungureni. It opened in 1995, with the goal of supplying water and electricity to the towns situated on the Teleajenului Valley. [3]
Figure 1a. Maneciu Dam Section AMC3 (Profile 9) [3]
The model used is a 3D dam of 78 m height, 200m width and 595 lenght. The dam layers are defined with the general elastic model ‘Mohr-Coulomb'. The shear strength parameters used for each material are: Core – c = 30 kN/m2 and the frictional angel equal with 31º; Dam body with cohesion = 3 kN/m2 and Ø = 40º, Filter with cohesion = 10 kN/m2 and Ø = 33º and for Bedrock, the cohesion is equal with 80 kN/m2 and Ø = 45º.

Carastoian Andreea / Energy Procedia 85 (2016) 93 – 98 95
Figure 1b. Layer configuration and model area
Core and Filter layers are defined with unsaturated characteristic according to the USDA classification (Soil Conservation Service, 1975) as estimated by Rawls et al. (1982) and Carsel and Parrish (1988). [4]
Figure 2. Unsaturated function for Core layer, according to Rawl et al. vs. Carsel and Parrish - [4]
Figure 3. Unsaturated function for Filter layer, according to Rawl et al. vs. Carsel and Parrish - [4]

96 Carastoian Andreea / Energy Procedia 85 (2016) 93 – 98
Average values according to Rawl et al. vs. Carsel and Parrish [4] used in analysis:
Table 1. Values for soil water content function data [4]
Method Texture θr θs α
(1/cm) n
Ks
(cm/d)
Rawl et al.
Clay (Core) 0.090 0.385 0.027 1.131 1.44
Sandy Clay Loam
(Filter) 0.068 0.330 0.036 1.25 10.32
Carsel and Parrish
Clay (Core) 0.068 0.38 0.008 1.09 4.80
Sandy Clay Loam
(Filter) 0.100 0.39 0.059 1.48 31.44
Average Clay 0.079 0.3825 0.0175 1.1105 3.12
Sandy Clay Loam 0.084 0.36 0.0475 1.365 20.88
The water level is on 74 m height. The study presents the stability of the dam, the seepage line in full water level and rapid drawdown conditions, simulating the condition of water level drop from 74 m to 50 m.
Figure 4. Seepage BoundaryFunction Figure 5. 3D Model area and discretization
Seepage-Stress coupled analysis was performed to analyse the seepage and the stability of the dam. Are defined three construction stages for seepage analysis. In the first stage "Steady State" assume that the ground is saturated with ground water level at 74 m height. "Transient" it is the second stage and analyze the change of pore pressure in dam body during water level decrease at 50 m in 100 h. The final stage presents the results after maintaining the water level for a long time.
3. Results and conclusions
Further the analysis results will be presented. The seepage line of initial full water level and flow after sudden drawdown are presented.
Seepage-Stress coupled analysis calculates the safety for the slope failure due to shear stress and shear force. Next the results from the strength reduction method after those three construction stages. After all three seepage stages were performed stress stages with slope stability analysis using strength reduction method.

Carastoian Andreea / Energy Procedia 85 (2016) 93 – 98 97
Figure 6. a) Steady flow of initial full water level; b) Flow after sudden drawdown
Next figure presents multi step ISO surfaces for pressure head. Blue surface means the pressure head in the dam in the first stage, with full water level. Green surface presents the pressure head right after drawdown. Magenta surface presents the pressure head in the dam after maintaining the water level for a long time. Different permeability means different porosity and for that the difference pressure head between Carsel and Rawl values.
(a) (b)
Figure 7. Pressure head: (a) Carsel and Parrish values; (b) Rawl et al. values.
(a) (b) (c)
Figure 8. Contour plot results using Carsel and Parrish: a) Slope stability after the first stage, Fs = 1.975; b) Slope stability after the second stage, Fs = 2.075; c) Slope stability after the third stage, Fs = 2.5375.

98 Carastoian Andreea / Energy Procedia 85 (2016) 93 – 98
(a) (b) (c)
Figure 9. Contour plot results using Rawl et al.: a) Slope stability after the first stage, Fs = 2.6625; b) Slope stability after the second stage, Fs = 2.7375; c) Slope stability after the third stage, Fs = 2.925.
Those results means that the dam is stable in all the stages, but Carsel and Parrish values are more severe than Rawl et al. values. The existence of the core and the filters ensure the stability of the dam, avoiding seepage and structural problems. I recommend the average values between Carsel and Rawl from technical - economical point of view.
References
[1] Tim Stephens - Manual on small earth dams. A guide to siting, design and construction, FAO Irrigation and dreainage paper, Rome, 2010 [2] *Midas GTS NX – manual and software [3] Colectiv UTCB, coordonat de prof.dr.ing.Stefan Ionescu - Date privind proiectarea, executia, functionarea si exploatarea lucrarii
hidrotehnice"Barajul si lacul de acumulare Maneciu" [4] M.Th. van Genunchten, F.J.Leij, S.R.Yates - The RETC Code for Quantifying the Htdraulic Functions of Unsaturated Soils, EPA/600/2-
91/065 December 1991