unsteady flow: its role in the low … flow: its role in the low pressure turbine 3 fig. 2 variation...
TRANSCRIPT

UNSTEADY FLOW: ITS ROLE IN THE LOW PRESSURE TURBINE
HP Hodson and RJ Howell Whittle Laboratory,
University of Cambridge, Department of Engineering, Madingley Road,
Cambridge, CB3 0DY, UK
1 Abstract
In aircraft engines, chord-based Reynolds numbers of the order of 0.5-5x10⁵ are found in the low pressure turbines. Given that many component efficiencies are above 90 percent, improving the efficiency has become progressively more difficult. Consequently, a reduction is component count is now a common goal. Reducing the number of airfoils in a turbine inevitably leads to an increase in the blade loading. This increases the possibility of laminar separation in these low Reynolds number flows. Conventional (steady flow) wisdom dictates that the efficiency decreases as the laminar separation bubble grows. This perception has limited the development of low pressure turbines for many years.
In practice, the flow in turbomachines is unsteady due to the relative motion of the rows of blades. The combined effects of random (wake turbulence) and periodic disturbances (wake velocity defect and pressure fields) will affect the transition processes in low Reynolds number turbomachines. Research has shown that patches of transitional/turbulent flow can be created during the interaction of the upstream wakes with laminar boundary layers. These patches will reduce the efficiency. Fortunately, the so-called calmed regions, where the flow relaxes back to the laminar state, that follow the transitional/turbulent flow can withstand the deceleration much better than steady flow laminar boundary layers. Consequently, in high lift applications, attached laminar-like flow can be made to persist downstream of the steady flow laminar separation line, possibly as far back as the trailing edge. Most importantly, the calmed region represents an increase in efficiency as it is essentially laminar in nature and it is attached. Thus, there are two opposing mechanisms at work in the interactions between wakes and the boundary layers. As the frequency of wake-passing changes, so does the balance between these mechanisms.
This paper will describe progress in understanding the details of the flow and the loss generation processes that arise in LP turbines. Particular emphasis will be placed on the unsteady separating flows, and how their effects may be exploited in controlling the laminar-turbulent transition processes that has allowed the successful development of ultra high lift low pressure turbines.
2 Introduction
This paper is concerned with the unsteady flows that arise in the LP turbines of civil aero-engines. Specifically, the paper deals with the understanding of these unsteady flows that have allowed ultra high lift LP turbine profiles to be successfully developed.
Fig. 1 shows the low-pressure turbine a modern aero-engine. The low-pressure turbine of a large, high by-pass ratio engine provides the power to drive the fan and often some

HP Hodson and RJ Howell
compressor stages as well. It is constrained to operate at a low rotational speed equal to that of the fan unless a gearbox is provided. The outer diameter of the turbine is also constrained by the presence of the bypass duct. The combination of low rotational speed and limited diameter means that the mean blade speeds are often equivalent to Mach numbers of about 0.4-0.7. For this reason, a significant part of the fundamental research discussed in this paper was conducted in low speed facilities.
Fig. 1 Rolls-Royce Trent 800 LP turbine.
The efficiency of the LP turbine strongly influences the specific fuel consumption. Typically, a 1 percent increase in LP polytropic efficiency improves the fuel consumption by 0.5 to 1.0 percent (Wisler, 1998). Furthermore, the LP turbine is heavy and expensive. Yet, despite the considerable research that has taken place, the efficiency of LP turbines has improved very little over the last 15 years whatever the stage loading (or flow) coefficient. With efficiency levels already much greater than 90 percent, there would appear to be little scope for improving this aspect of performance.
Fig. 1 also shows that the LP turbine has blades with large aspect ratios. These are typically in the range of 3-7:1. Thus, in LP turbines, the profile loss is by far the largest single contributor to the total loss of efficiency. Since the blades have relatively thin trailing edges, the magnitude of profile loss depends mainly upon the development of the airfoil boundary layers, particularly those on the suction surfaces.
3 The Importance of Unsteady Flows
To date, all existing LP turbines known to the authors have been designed using steady flow assumptions, except the BR715 LP turbine (see Cobley et al (1999), Harvey et al (1999) and Howell et al (2000)). This is despite the fact that it has been known for many years that bladerow or rotor-stator interactions affect the aerodynamic efficiency of a turbine. It is because unsteadiness caused by bladerow interactions can alter the profile loss that the problem of the interactions of wakes with boundary layers has received much attention in recent years. The profile loss is changed because the turbulence in the wakes promotes transition to turbulent flow in otherwise laminar boundary layers.
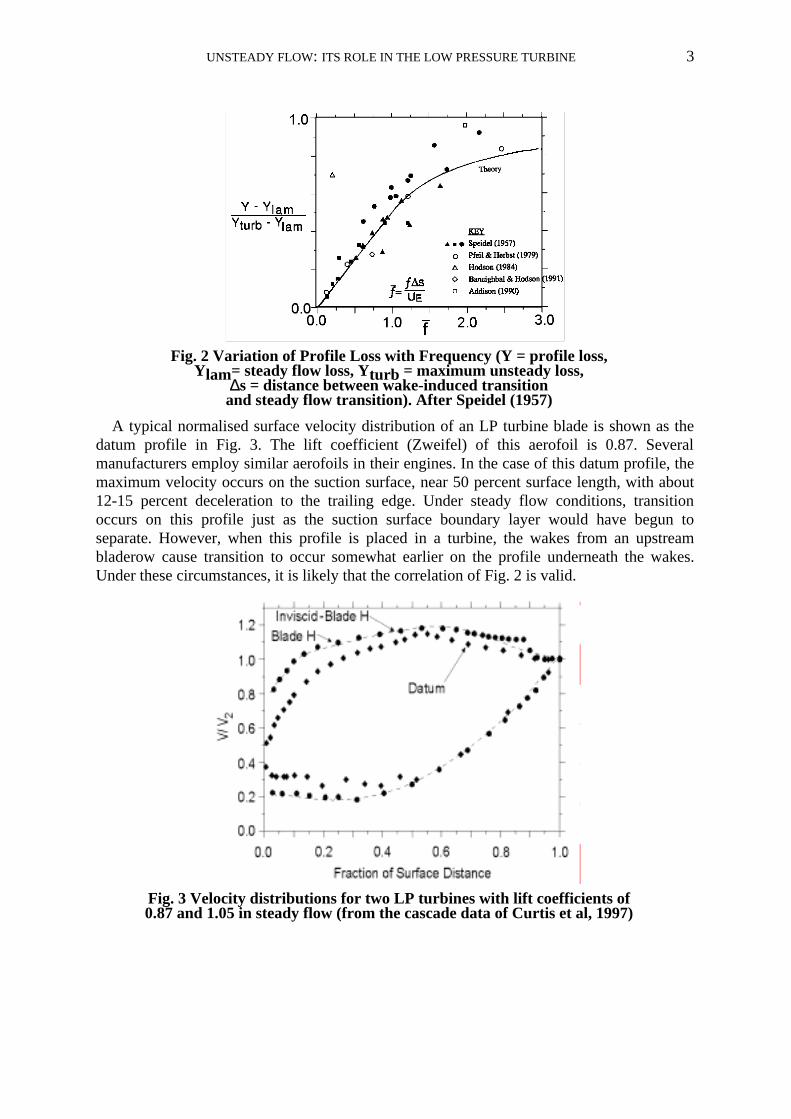
An example of the impact of wake-boundary layer interactions is shown in the correlation of Hodson (1990) presented in Fig. 2. This plot was generated using all of the data available at the time. This means that decreases in loss were not known. The correlation is valid for un-separated flows and it represents what might be called “conventional expectations ” as recently as this decade. Typically, a doubling of loss can occur over the range of frequencies shown. However, most LP turbines operate at the lower end of the frequency range shown ( 5.0<f ) so that the expected impact of the wakes is relatively small.
UNSTEADY FLOW: ITS ROLE IN THE LOW PRESSURE TURBINE 3
Fig. 2 Variation of Profile Loss with Frequency (Y = profile loss,
Ylam= steady flow loss, Yturb = maximum unsteady loss, ∆s = distance between wake-induced transition and steady flow transition). After Speidel (1957)
A typical normalised surface velocity distribution of an LP turbine blade is shown as the datum profile in Fig. 3. The lift coefficient (Zweifel) of this aerofoil is 0.87. Several manufacturers employ similar aerofoils in their engines. In the case of this datum profile, the maximum velocity occurs on the suction surface, near 50 percent surface length, with about 12-15 percent deceleration to the trailing edge. Under steady flow conditions, transition occurs on this profile just as the suction surface boundary layer would have begun to separate. However, when this profile is placed in a turbine, the wakes from an upstream bladerow cause transition to occur somewhat earlier on the profile underneath the wakes. Under these circumstances, it is likely that the correlation of Fig. 2 is valid.
Fig. 3 Velocity distributions for two LP turbines with lift coefficients of 0.87 and 1.05 in steady flow (from the cascade data of Curtis et al, 1997)

HP Hodson and RJ Howell
F low
C ascade
Fig. 4 The bar passing cascade rig used by Curtis et al (1996),
Schulte and Hodson (1997) and Howell et al (2000).
3 .0 4 .0
D atum - N o w akesLoss
Rel
ativ
e to
Dat
um
1 .0
1 .0
0 .0
2 .0
2 .0
D atum W ith w akes
C ost
Fig. 5 Effect of incoming wakes on the profile loss of the datum profile
of Fig. 3 (based on the steady and unsteady cascade data of Curtis et al 1997)
Fig. 4 shows the experimental rig used for the investigations summarised in Fig. 5. This consists of a cascade of seven blades and a moving bar mechanism that allows bars to be traversed upstream of the leading edge of the cascade. The bars are fitted to belts and carried on wheels that are driven by a variable speed motor. The wakes shed from the bars accurately simulate the presence of an upstream blade row (Banieghbal et al (1995). Fig. 5 shows that

UNSTEADY FLOW: ITS ROLE IN THE LOW PRESSURE TURBINE 5
for the datum profile of Fig. 3, the effect of incoming wakes is to increase the loss over a wide range of Reynolds numbers as expected.
Fig. 6 Generic pressure distributions for two LP turbine controlled
boundary layer design philosophies (Hourmouziadis)
3 .0 4 .0
D a tum C ascade
Loss
Rel
ativ
e to
Dat
um
1 .0
1 .0
0 .0
2 .0
2 .0
H igh L ift C ascade
Turb ine H igh L ift
Turb ine D a tum
Fig. 7 Effect of incoming wakes on profile loss of a datum and high lift
profile (H) of Fig. 3 in the cascade and as the second stator of a cold flow LP turbine (based on the data of Curtis et al, 1997)
The performance targets of modern LP turbine blading not only concern efficiency, but also weight and manufacturing costs. It is desirable (to save weight) to use less blades per blade row but then an individual blade has to carry a greater aerodynamic load. Increased lift coefficients can only be realised if the pressure distribution has regions of significant deceleration on the suction surface. This inevitably increases the risk of laminar separation.

HP Hodson and RJ Howell
Fig. 6 illustrates the different design approaches. In order to avoid significant deterioration in efficiency due to large separation bubbles (or even non-reattached separation), the concept of controlled diffusion boundary layer design was introduced in industry (Hourmouziadis, 1989). Fig. 6 shows a velocity distribution (roof-top) resulting from this (steady flow) approach to design. In this case, there is a substantial separation bubble. Under these circumstances, the correlation of Fig. 2 is not valid because of the presence of the separation bubble.
Fig. 7 shows the effect of incoming wakes on the profile loss of the datum and high lift profile (profile H) of Fig. 3. Profile H has a lift coefficient 20 percent higher than that of the datum. The results of cascade tests and turbine tests are presented. In the case of the higher lift profile, a large laminar separation bubble forms on the suction surface under steady flow conditions. Fig. 7 shows that when wakes are present, the loss of the high lift profile is significantly lower than that of the datum profile. This result was counter to steady flow expectations. That unsteadiness can be harnessed in the pursuit of high lift in LP turbines is the subject of this paper.
4 The Disturbance Environment
It has been demonstrated that wakes have a profound effect on the performance of turbines in both cascades and turbines. It is now appropriate to discuss the environment that causes these changes.
Whereas the potential influence of a blade extends both upstream and downstream and decays exponentially, a wake is only convected downstream. In addition, a wake’s rate of decay is much less than that of the potential influence. Indeed, many researchers carry out wake-traverses at about half an axial chord downstream of cascades in order to obtain a satisfactory definition of the wake profile before it mixes out. At this location, the wake velocity defect is typically 10-30 percent of the free-stream value, depending upon the exit flow angle of the cascade. Typically, the axial spacing between adjacent bladerow is of the order of 1/4 to 1/2 of the axial chord of the upstream bladerow.
Meyer (1958) argued that as wakes convected through the next bladerow, they were chopped into segments. The segments of the wakes behave as negative jet impinging on the aerofoil surface as they are transported with the free-stream fluid. Close to the surface, the velocity induced by the jet causes a progressive distortion of the lines of constant vorticity, an effect that commences as the wake impinges on the leading edge. The negative jet also causes a build up of wake fluid on the suction surface of a turbine rotor blade and a removal of fluid from the pressure surface. The behaviour of the negative jet gives rise to fluctuations in the surface velocity and pressure. Many researchers have observed fluctuations within boundary layers that they have attributed to this behaviour in the free-stream (e.g. Hodson (1983), Hodson and Addison (1988), Paxson and Mayle (1990)).
There are considerable differences between a cascade of flat plates and turbine blades. Fig. 8 presents an inviscid time-marching prediction of the unsteady flow in an LP turbine cascade that is subjected to incoming wakes. Contours of entropy are plotted because, unlike the stagnation quantities, entropy is convected in unsteady flow.

UNSTEADY FLOW: ITS ROLE IN THE LOW PRESSURE TURBINE 7
V2 rel
V2
U
U
52725
67$725
Fig. 8 Euler calculation of wake-blade interactions in an LP turbine
(based on Hodson and Dawes (1996))
The variations in transport velocity across the passage are responsible for the distortion of the wake centre-line shown in Fig. 8 as suggested by Smith (1966). The bowing arises because near to the leading edge plane, the mid-passage convection rates are much higher than in the vicinity of the blade surfaces. The reorientation or shearing occurs because a fluid particle will convect along the suction surface at a rate that is much higher than of a particle near to the pressure surface. The width of the wake also decreases as there is a need to conserve the circulation associated with the wake segment as it elongates during its reorientation. The shearing is very pronounced in this typical high lift LP turbine because the blade loading is relatively high. An additional modification occurs once the wake arrives in the vicinity of the leading edge. Here, the early part of the wake is accelerated along the suction surface away from the rear part which remains in the vicinity of the leading edge. By the time the trailing portion has reached the suction surface, the leading portion has moved further away and so the wake width becomes extended. Toward the rear of the suction surface, the reverse will tend to happen as the flow decelerates but this is a much smaller effect. On the pressure surface, the velocity gradients near the leading edge are less than on the suction surface so the stretching is much less pronounced. The net result of all of these modifications to the wake is that the wake segment appears to be concentrated on the suction side of the passage with a ‘tail’ that stretches back toward the pressure surface leading edge.
The predictions of Fig. 8 also indicate that there is only a small amount of cross passage transport due to the negative jet behaviour of the wake. Indeed, Addison and Hodson (1990) suggests that this is of secondary importance. It is also why Doorly and Oldfield (1985) and later LaGraff et al (1989) have been able to ignore the effect of the negative jet and have obtained excellent agreement between the predicted and measured locations of the wakes, the latter being visualised with the aid of a Schlieren system. These experimental results and the numerical predictions of Hodson (1985), Giles (1987), Rai (1987), Korakianitis (1991), Dawes (1993) and Hodson and Dawes (1996) all confirm that kinematic theory can be used to explain the movement of wakes through downstream bladerows. The small amount of cross passage transport means that the importance of this phenomenon must be questioned.

HP Hodson and RJ Howell
It is noted that Fig. 8 has been obtained using an inviscid solver. Nevertheless, comparisons of the predictions with measurements were favourable indicating that the unsteadiness cause by wakes persists through more than one bladerow and is relatively undiminished. Consequently, there is an increasing complexity in the unsteady flow field as one moves through subsequent stages.
4.1 MULTISTAGE WAKE-BLADE INTERACTIONS
So far, the discussion has been concerned with the interaction of the upstream wake with the downstream bladerow. Indeed, most of the published literature is concerned with this type of interaction. It should be recognised that there are often between 4 and 14 bladerows in LP turbines. Given that the maximum intensity of the disturbances caused by a wake is little changed from inlet to exit, there is clearly an opportunity for interactions to take place across several bladerows. Unfortunately, it is difficult to obtain data in multistage environments. Only the programmes at MTU (Binder et al (1989) through to Arndt (1991)), at GE (Halstead et al (1995), Halstead (1997)) and at the Whittle Laboratory (Banieghbal et al) are known by the authors to have examined the disturbance flow field.
Fig. 9 is taken from a paper by Arnone et al (1999). It shows a calculation of the unsteady flow in an LP turbine. One can clearly discern the wakes of the first stator row inside the passage of the second stator. Equally, the wakes from other bladerows persist through more than the next bladerow downstream. Fig. 10 is a schematic of the interaction of the wakes of the first rotor with those of the second stator (from Binder et al (1989)). The wakes shed by rotor 1 are cut and distorted by stator 2. They are formed into wake segments which convect through the stator 2 blade passages and appear at exit between the stator 2 wakes. The thick broken lines indicate the stator 2 wakes and therefore the direction of the flow in the absolute frame. Regardless of the frame of reference, the wake segments are arranged into “avenues”. It should be noted that the avenue contains discrete wake segments rather than a continuous wake. Because the rotor 1 and rotor 2 blade counts are different, the rotor 1 wake avenues will enter the rotor 2 blade passages at different circumferential locations. Under these circumstances, rotor-rotor interactions can sometimes manifest themselves in unsteady data at a frequency that represents the sum and difference frequencies (i.e. beating) of the two rotor passing frequencies.
Fig. 9 Predictions of unsteady effects in multistage LP turbine.(Arnone
et al, 1999)

UNSTEADY FLOW: ITS ROLE IN THE LOW PRESSURE TURBINE 9
Fig. 10 Schematic of wake avenues in a multistage LP turbine
presented by Binder et al (1989).
Fig. 11 Variation with time of the disturbance environment (turbulence intensity) at inlet to stage 3. Data from the LP turbine used by Schröder
(1991), Arndt (1991).
Binder at al (1989), Schröder (1991) and Arndt (1991) have performed a series of turbulence measurements in a multi-stage LP turbine. Fig. 11 shows that beating can occur in multistage turbines. These data were obtained during a single radial traverse of the flow so that the circumferential co-ordinate in the figure represents the angular position of the rotor shaft. Contours of turbulence intensity at the inlet to stage 3 of a multistage LP turbine are presented. The beating arises because of the differences in the number of rotor blades in stages 1 and 2. This can clearly be seen as the turbulence intensity varies around the circumference at about 40% passage height. As the rotor rotates, these different passages will be seen by the stationary probe and therefore the stator blade downstream of the probe. At different circumferential locations, the pattern will differ from that presented here as a result of the various bladerow interactions (see below).
In seven multistage LP turbines measured by the authors, beating has been observed in all but two. Many of these experiments included measurements within the suction surface boundary layer. It should again be recognised that the wakes also interact with the blade

HP Hodson and RJ Howell
surface boundary layers and that the varying strength of the rotor wakes could in part be due to the effect of the upstream wakes and wake segments on the blade surface boundary layers as well as the simple "addition” of the upstream wake segments as proposed in Fig. 10.
Fig. 12 Variation with time of the turbulence intensity at inlet to stage
3. (Halstead et al).
A similar schematic to that of Fig. 10 is presented in Fig. 12. This shows, in a little more detail, how the a sensor positioned in the opposite frame of reference to that of the blade shown will see different parts of the wake avenue as it is located at different circumferential positions. This schematic may be used to explain the measurements obtained downstream of the 1st stage of a 3 stage LP turbine. Fig. 12 shows that the peak turbulence intensities, as seen by the second stator are of the order of 5% in the rotor wakes and, at this circumferential location about 3.5% in the stator wakes.
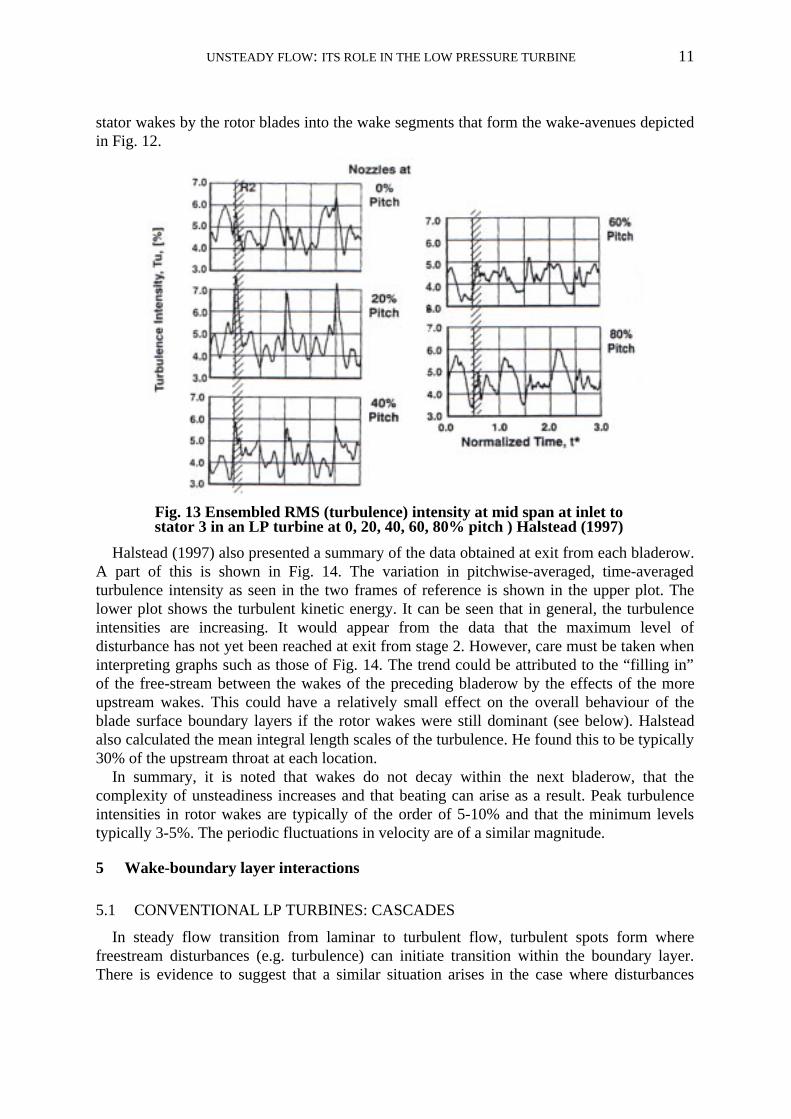
Fig. 13 is taken from Halstead (1997). It shows data obtained at inlet to stator 3 of the same LP turbine for which data was presented in Fig. 12 at inlet to stator 2. A comparison of the two figures confirms that the complexity has increased. For example, there are distinct variations at 4 times the blade passing frequency at 20 and 40% pitch in Fig. 13. There are 4 upstream blade rows, each shedding wakes. However, without further information, a coincidence cannot be ruled out. Nevertheless, it should be noted that although two of these blade rows are stationary, their wakes are not. This is because of the “processing” of the
UNSTEADY FLOW: ITS ROLE IN THE LOW PRESSURE TURBINE 11
stator wakes by the rotor blades into the wake segments that form the wake-avenues depicted in Fig. 12.
Fig. 13 Ensembled RMS (turbulence) intensity at mid span at inlet to stator 3 in an LP turbine at 0, 20, 40, 60, 80% pitch ) Halstead (1997)
Halstead (1997) also presented a summary of the data obtained at exit from each bladerow. A part of this is shown in Fig. 14. The variation in pitchwise-averaged, time-averaged turbulence intensity as seen in the two frames of reference is shown in the upper plot. The lower plot shows the turbulent kinetic energy. It can be seen that in general, the turbulence intensities are increasing. It would appear from the data that the maximum level of disturbance has not yet been reached at exit from stage 2. However, care must be taken when interpreting graphs such as those of Fig. 14. The trend could be attributed to the “filling in” of the free-stream between the wakes of the preceding bladerow by the effects of the more upstream wakes. This could have a relatively small effect on the overall behaviour of the blade surface boundary layers if the rotor wakes were still dominant (see below). Halstead also calculated the mean integral length scales of the turbulence. He found this to be typically 30% of the upstream throat at each location.
In summary, it is noted that wakes do not decay within the next bladerow, that the complexity of unsteadiness increases and that beating can arise as a result. Peak turbulence intensities in rotor wakes are typically of the order of 5-10% and that the minimum levels typically 3-5%. The periodic fluctuations in velocity are of a similar magnitude.
5 Wake-boundary layer interactions
5.1 CONVENTIONAL LP TURBINES: CASCADES
In steady flow transition from laminar to turbulent flow, turbulent spots form where freestream disturbances (e.g. turbulence) can initiate transition within the boundary layer. There is evidence to suggest that a similar situation arises in the case where disturbances

HP Hodson and RJ Howell
originate in an upstream wake (Hodson and Addison (1988)). In the case of incoming wakes, a strip of transitional flow, which extends across the entire span, begins to form beneath the footprint of the turbulent wake on the blade surface at this location. Because the inlet flow to the blade row in question is periodic, this process is also periodic. Some available data (see below) suggest that wake-induced transition does not begin until the momentum thickness-based Reynolds number Reθ exceeds a value of approximately 90-150, which is consistent with the known behaviour of steady flow laminar boundary layers undergoing bypass transition in the presence of high levels of free-stream turbulence (e.g. Mayle (1991)). On ultra high lift profiles however, the value can reach 225 (see Howell et al (2000)).
Fig. 14 Pitchwise averaged time mean (a) turbulence intensity and (b) turbulent kinetic energy variation through an LP turbine at mid span
(Halstead (1997)).
Recently, Zhong et al (1998) have provided the first real evidence that bypass transition due to wakes does indeed proceed via the formation of turbulent spots. Fig. 15 shows the results of a visualisation of wake induced transition carried out using thermochromic liquid crystals. These alter colour according to the temperature of the surface. The surface of a flat plate was heated so that the darkest regions correspond to laminar flow. As turbulent spots sweep across the surface, the surface heat transfer increases and the colours change (from blue toward red) as the temperature of the surface falls. Fig. 15 clearly shows the presence of three discrete events. Zhong et al also show that these events propagate and grow at the same rates as conventional spots. As the spots move downstream, they grow in length and width. This process is illustrated schematically in Fig. 16. As this spanwise band of spots progresses

UNSTEADY FLOW: ITS ROLE IN THE LOW PRESSURE TURBINE 13
downstream, it becomes more turbulent and a turbulent strip results. In LP turbines, the flow between these adjacent strips usually undergoes transition via a different mechanism, perhaps as a result of a laminar separation. This is illustrated in the distance-time diagram of Fig. 17.
8Z
6ORW
Fig. 15 Visualisation of wake induced transition on a heated plate using
liquid crystals. Flow is from left to right. Zhong et al (1998).
0.5 U e
0.88 U e
U e
δ
Fig. 16 Schematic of wake induced transition strip. Typical velocities of propagation of the wake, the leading and trailing edges of the turbulent
spots are shown.
5.2 CONVENTIONAL LP TURBINES: MULTISTAGE TURBINES
The above discussion has concentrated upon the effects of the wakes of a single upstream bladerow. Fig. 18 presents some of the results of Halstead et al (1995) that were obtained using surface mounted hot films on the suction surface of a 2-stage LP turbine. The suction side velocity distribution of this airfoil is similar to that of the Datum blade in Fig. 3. These results were obtained at increased loading and take-off Reynolds number but they illustrate many of the phenomena that arise over the range of operation of this LP turbine. The figure presents instantaneous time traces of quasi wall shear stress (a.c. coupled).

HP Hodson and RJ Howell
Fig. 18 shows that wake-induced transition is underway by 32 percent suction surface length. Turbulent spots originate in the vicinity of the W trajectories. The time period between successive spots does not correlate exactly with wake passing. The spots both lead and lag the equally spaced W trajectories. At 44 percent suction surface length, turbulent events of varying amplitude occur for each passing wake as seen by the various magnitudes of marker “3” in the figure. The above is indicative of transitional behaviour within the boundary layer.
Wake-InducedTransitiona l F low
Steady-F lowTransition
U
U
le
te
Surface D is tance
LE0
1
2
3
Wak
e P
assi
ng P
erio
ds (
t/ τ)
TE
∆s
S St l
Fig. 17 Schematic distance-time diagram of wake induced transition
So called “calmed regions” are identified in Fig. 18 as areas of elevated but decaying shear stress following turbulent spots. An example is seen as area 4. Locating where flow breakdown occurs and constructing a trajectory from the origin of the strip to the breakdown point determines the downstream boundary of the region. The onset of transition between the wake-induced strips takes place near 50 percent suction surface length. Single-spot events in area 5 and multiple-spot events in area 6 mark transition onset in Fig. 18. Halstead et al (1995) found that the locations of the origins of the spots that formed between wake events coincided with regions of elevated freestream turbulence associated with the wakes of the upstream stator row. The presence of numerous spots at 63 percent suction surface length makes it impossible, in general, to distinguish the wake from the non-wake-induced areas at this location. The turbulent events continue to engulf the remaining laminar flow. By 85 percent suction surface length, transition is nearly complete. Along trajectories Z2 and Z3 that begin at 70 percent suction surface length in Fig. 18, areas of calmed flow persist all the way back to the trailing edge, as illustrated by areas 7 and 8. Due to their elevated levels of shear stress, these areas of non-turbulent boundary layer do not separate even in the presence of the mild adverse pressure gradient in this region. The true significance of the calmed regions is discussed below in relation to high lift LP turbines.
This section has shown that in single stage and multistage LP turbines wake induced transition proceeds via the formation of turbulent spots. The wakes from the bladerow immediately upstream dominate the transition process. This explains why unsteady cascade experiments can be used to develop new profiles. It is also noted that the so called calmed

UNSTEADY FLOW: ITS ROLE IN THE LOW PRESSURE TURBINE 15
regions are formed behind turbulent spots, even in the highly disturbed multistage environment, and that these can persist as far as the trailing edge.
Fig. 18 Raw hot film traces for the baseline test case of Halstead at al
(1995)
5.3 HIGH LIFT LP TURBINES: CASCADES
The presence of unsteady flows in LP turbines has meant that it has been possible to increase the lift of the blades by 20% when compared to the datum profile shown in Fig. 3.
Fig. 19 shows hot film measurements obtained by Schulte and Hodson (1996) on blade H of Fig. 3. A schematic of the test section is shown in Fig. 4. The increased wall shear stress level in the hot-film signal indicates the turbulent spots. The turbulent patches are followed by a distinct region with virtually no turbulent activity (the calmed region). The wall shear stress falls from a turbulent level to a laminar level within this region. This region is then terminated by the arrival of a new turbulent patch induced by the next wake or occasionally by natural transition in the separating flow between the wakes. It can be seen, that the calmed region following the turbulent patch is even visible as far downstream as 98 percent suction surface length. The calmed region is also able to prevent the boundary layer from separating.

HP Hodson and RJ Howell
This is due to its partly elevated wall shear stress level and its fuller velocity profile (Cumpsty et al. (1995), Halstead et al. (1995), Schulte and Hodson, (1996 and 1997)).
S teady S tate M ean Leve l
Fig. 19 Hot film measurements from blade H in Fig. 5. (Schulte and
Hodson 1996)
0.8
0.9
1
1.1
1.2
1.3
1.2 1.4 1.6 1.8 2 2.2
Reynolds number x10 5
Rel
ativ
e tr
ailin
g ed
ge
mom
entu
m th
ickn
ess
No wakes
Wakes
Fig. 20 Suction side boundary layer loss vs. Reynolds number (Howell
at al 2000).
The lower graph on Fig. 19 concentrates on the temporal variation of the momentum thickness at the trailing edge as measured by a hot wire. This shows the variation of the momentum thickness during three wake-passing cycles. The momentum thickness that results with steady flow is also shown. This plot indicates that the wakes suppress the existence of the large separation (and the losses it produces) that existed in the case without wakes. It also suggests that after the wake has passed the calmed region and the process of the reappearing
UNSTEADY FLOW: ITS ROLE IN THE LOW PRESSURE TURBINE 17
separation bubble are associated with low momentum thickness at the trailing edge. Fig. 19 also implies that the loss in this unsteady case is significantly reduced compared to the steady flow case.
Fig. 20 presents a plot of the momentum thickness measured at the trailing edge of the high lift profile. The plot shows data for the cases with and without wakes present. Data for the cases with wakes present are obtained at the reduced frequency of f = 0 78. . The trailing edge momentum thickness is made non-dimensional by the momentum thickness measured with unsteady inflow at a Reynolds number of 130,000.
Fig. 20 shows that there is a large loss reduction at low Reynolds numbers due to the effects of the wakes. As the Reynolds number is increased, the loss reduction diminishes to the point where at a value of 2.1×10⁵ there is almost no loss reduction. The reduction in the difference in losses with increased Reynolds number is due to the reduction in the size of the separation bubble. If the size and loss generated by a separation bubble is smaller then so is the possible loss reduction due to the effects of wakes. This is the situation at the higher Reynolds numbers.
This section has shown that in high lift cascades, the boundary layers are transitional, that transition often occurs very close to the location where separation would occur in steady flow, that calmed regions exist and that the effects of calming are beneficial at the lower Reynolds numbers. In fact, the frequencies of the disturbances are almost optimal.
5.4 HIGH LIFT LP TURBINES: MULTISTAGE TURBINES
It is recalled that the inter-bladerow velocity data of Schröder (1991) and Arndt (1991) revealed a strong rotor-rotor interaction mechanism in a 5-stage LP turbine.
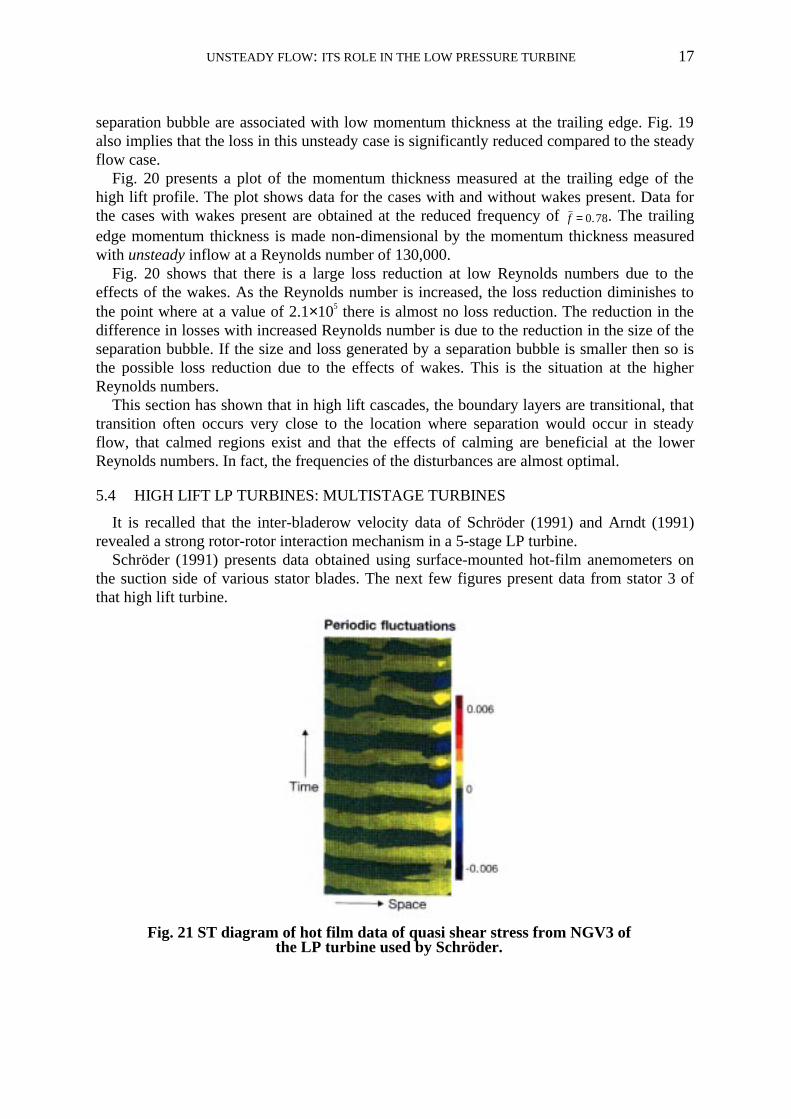
Schröder (1991) presents data obtained using surface-mounted hot-film anemometers on the suction side of various stator blades. The next few figures present data from stator 3 of that high lift turbine.
Fig. 21 ST diagram of hot film data of quasi shear stress from NGV3 of
the LP turbine used by Schröder.
HP Hodson and RJ Howell
Fig. 21 presents ensemble-mean quasi wall shear stress and shows a very clear rotor 2 periodicity over much of the surface. A distinct (apparent) phase shift occurs close to the trailing edge. Schulte and Hodson (1994) argue that this is not a phase shift but the appearance of transition. It probably corresponds to the velocity fluctuations associated with transition (profile switching). The wakes from the upstream rotor periodically suppress the transition bubble. In between, separation is believed to occur.
S urface D is tance
Fre
estr
eam
Tur
bule
nce
Req
uire
d fo
r T
rans
ition
A -G & Shaw
M ayle
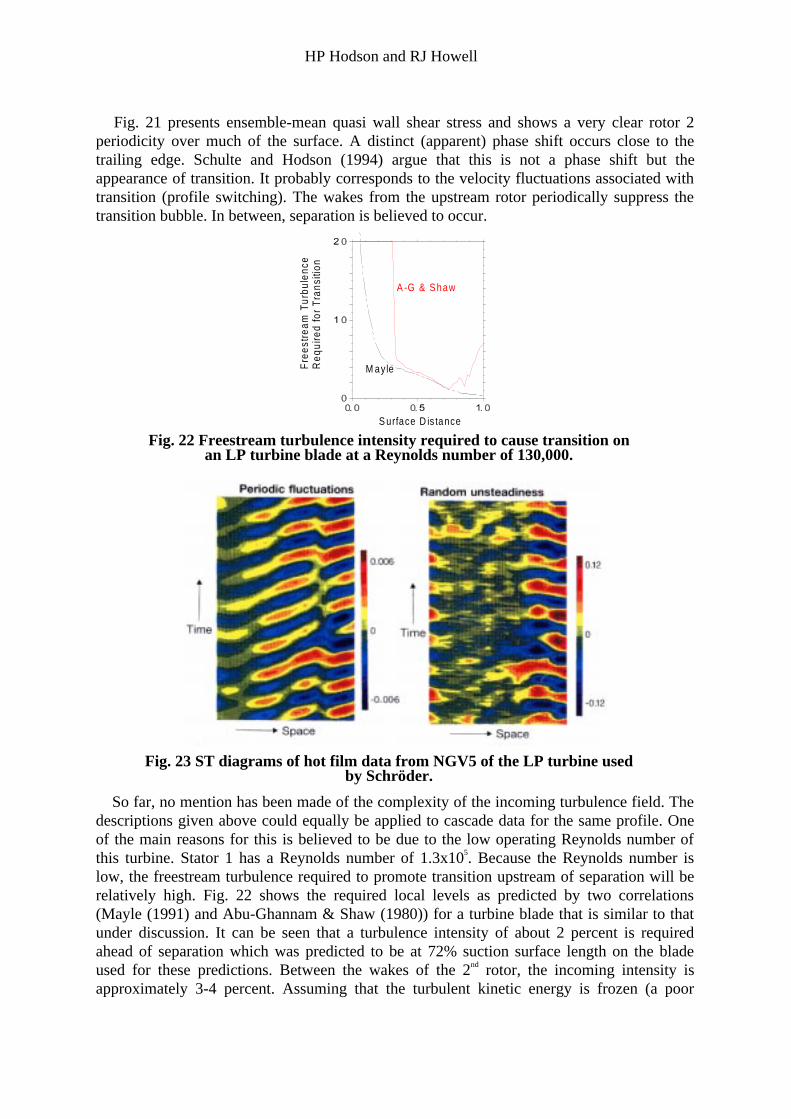
Fig. 22 Freestream turbulence intensity required to cause transition on
an LP turbine blade at a Reynolds number of 130,000.
Fig. 23 ST diagrams of hot film data from NGV5 of the LP turbine used
by Schröder.
So far, no mention has been made of the complexity of the incoming turbulence field. The descriptions given above could equally be applied to cascade data for the same profile. One of the main reasons for this is believed to be due to the low operating Reynolds number of this turbine. Stator 1 has a Reynolds number of 1.3x10⁵. Because the Reynolds number is low, the freestream turbulence required to promote transition upstream of separation will be relatively high. Fig. 22 shows the required local levels as predicted by two correlations (Mayle (1991) and Abu-Ghannam & Shaw (1980)) for a turbine blade that is similar to that under discussion. It can be seen that a turbulence intensity of about 2 percent is required ahead of separation which was predicted to be at 72% suction surface length on the blade used for these predictions. Between the wakes of the 2nd rotor, the incoming intensity is approximately 3-4 percent. Assuming that the turbulent kinetic energy is frozen (a poor
UNSTEADY FLOW: ITS ROLE IN THE LOW PRESSURE TURBINE 19
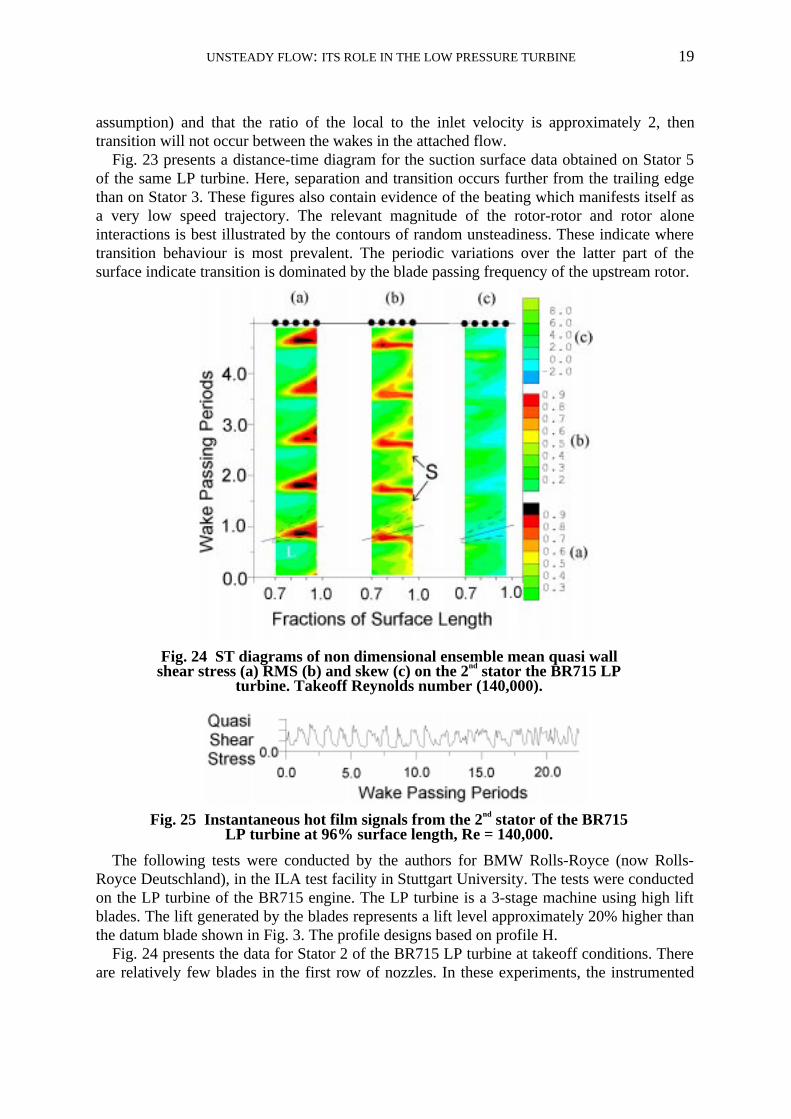
assumption) and that the ratio of the local to the inlet velocity is approximately 2, then transition will not occur between the wakes in the attached flow.
Fig. 23 presents a distance-time diagram for the suction surface data obtained on Stator 5 of the same LP turbine. Here, separation and transition occurs further from the trailing edge than on Stator 3. These figures also contain evidence of the beating which manifests itself as a very low speed trajectory. The relevant magnitude of the rotor-rotor and rotor alone interactions is best illustrated by the contours of random unsteadiness. These indicate where transition behaviour is most prevalent. The periodic variations over the latter part of the surface indicate transition is dominated by the blade passing frequency of the upstream rotor.
Fig. 24 ST diagrams of non dimensional ensemble mean quasi wall shear stress (a) RMS (b) and skew (c) on the 2nd stator the BR715 LP
turbine. Takeoff Reynolds number (140,000).
Fig. 25 Instantaneous hot film signals from the 2nd stator of the BR715
LP turbine at 96% surface length, Re = 140,000.
The following tests were conducted by the authors for BMW Rolls-Royce (now Rolls-Royce Deutschland), in the ILA test facility in Stuttgart University. The tests were conducted on the LP turbine of the BR715 engine. The LP turbine is a 3-stage machine using high lift blades. The lift generated by the blades represents a lift level approximately 20% higher than the datum blade shown in Fig. 3. The profile designs based on profile H.
Fig. 24 presents the data for Stator 2 of the BR715 LP turbine at takeoff conditions. There are relatively few blades in the first row of nozzles. In these experiments, the instrumented

HP Hodson and RJ Howell
blade was placed so that it would not experience the wake-avenues of Stator 1. The wall shear stress is made non-dimensional by the maximum value of wall shear stress measured by each sensor, i.e. )(~),(~
max sts ττ is plotted, where t is time and s is the surface distance. This serves to enhance the periodic fluctuations in wall shear stress, but at the expense of masking changes in the overall levels of wall shear stress. Fig. 24 shows that wake induced transition starts at about 70% suction surface length. This is again indicated by a wedge shaped region of relatively high shear. Analysis of the additional data shows that this wedge-shaped region contains initially intermittent flow, which becomes almost turbulent as the trailing edge of the profile is reached. The raw data trace of Fig. 25 also shows that the levels of shear stress remain much lower between the passing of the turbulent events. This is consistent with the existence of becalmed regions trailing the spots. Indeed, it is only over the very last part of the surface that transition between the turbulent events has really started. Again, these observations correspond to “classical behaviour”.
Fig. 26 ST diagrams of non dimensional ensemble mean quasi wall shear stress from the 3rd stator of the BR715 LP turbine, Re = 90,000
Fig. 26 shows the ST diagrams of wall shear stress for the 3rd stator of the BR715 LP turbine. Fig. 26a shows regions of high wall shear (marked ‘H2’) originating at 75%s. These are caused by (and occur at the wake passing frequency of) the wakes shed from rotor 2. The regions marked ‘H4’ are not in fact regions caused by the high wall shear in turbulent spots. They are simply the response of the laminar boundary layers to the passage of wakes in the freestream. Because of the method of making the data non-dimensional, the levels of the regions H4 and H2 are the same colour, however, they are very different levels. Although the RMS and skew data is not shown (for reasons of brevity) wake induced transition was confirmed to occur around the region of laminar separation.
Fig. 26b shows data for the same operating condition but at a different position of the upstream rotor. Again the regions marked ‘H2’ are seen, but there are also other regions marked ‘H1’. They are only slightly lower wall shear than those marked ‘H2’. These also occurred in Fig. 26a but were not so strong. Therefore there are two regions of transitional activity and they each occur at the value of rotor 2 blade passing frequency. A possible explanation for this is as follows. The first transition region seen in the s-t diagrams (‘H2’) is

UNSTEADY FLOW: ITS ROLE IN THE LOW PRESSURE TURBINE 21
caused by Rotor 2 and occurs at 75%s. The other transition region is caused by wakes from stator 2 that pass through Rotor 2 (region ‘H1’). Stator 2 wakes are in turn modulated by Rotor 1, see the schematic in Fig. 10. The difference in blade counts for Rotor 1 and Rotor 2 leads to the low frequency beating (modulation), whereby at some Rotor 2 positions the strength of the second transition region is diminished. The amplitude modulated wakes are distorted as they travel through stator 3 which makes interpreting the data more difficult. This beating in this data is similar to that measured by Arndt (1991). In that investigation Arndt showed that rotor 1 and rotor 2 interactions gave rise to amplitude modulations of the strength of the wakes that entered stator 3. Regions marked ‘H1’ reduce in strength as they reach the start of regions ‘H3’ because they are older turbulent boundary layer. New turbulent boundary layer is formed at ‘H2’, which has a higher wall shear stress.
Fig. 27 Ensemble mean data for one revolution of the 2nd rotor from the 3rd stator of the BR715 LP turbine at 71/5% surface length, Re = 90,000.
Fig. 27 shows the variation of wall shear stress at 71.5% suction surface length on stator 3 and a complete revolution of Rotor 2. The variation in the amplitude of wall shear stress from the strengths of two sets of wakes combining causes the boundary layer response shown in regions B. The reduction in strength results in regions marked A. The variation of wall shear stress is a consequence of the changes in turbulent spot production rates that occur because of the beating effect with wakes. Wakes with high turbulence intensity are likely to cause higher spot production rates and therefore higher wall shear stress regions circled in region ‘B’.
Fig. 28 Instantaneous hot film data from the 3rd stator of the BR715 LP
turbine at 94% surface length, Re = 90,000
The raw trace shown in Fig. 28 was obtained at 94% suction surface length on the 3rd stator of the BR715 LP turbine. At this location, the wake-induced turbulent flow is clearly isolated by regions of attached and laminar (i.e. calmed) flow. The effects of calming can also be seen in the distance-time diagrams. At this sensor, transition has progressed sufficiently that the ensemble-mean has risen during the time between the end of the calmed region and the beginning of the next wedge. This tends to reduce the effect of calming but some is still present at the trailing edge. Again, this behaviour is typical of wake-induced transition.
The low lift coefficient turbines are identified as those which have a relatively small amount (say <10 percent) of suction surface diffusion as opposed to a specific value of lift coefficient. In these turbines, the benefits of calming are very small. The data obtained in the low lift GE turbine suggests that the “classical” view of wake-induced transition does not entirely prevail in that design. The response of the boundary layers almost perfectly

HP Hodson and RJ Howell
correlates with the incoming turbulence. It is because of the complexity of the turbulence field described in the previous section that the classical behaviour does not exist.
In the high-lift turbine described above, as well as that of Arndt and of Schröder, there is no real evidence that perturbations from rows further upstream than the previous rotor have a significant impact on the transition process. Both turbines contain evidence of rotor-rotor interactions. They would, no doubt, also exhibit some evidence of stator clocking if those experiments were carried out. However, none of these interactions played a significant role in the transition process. The BR715 LP turbine appears to benefit from the effects of calming. Since these turbines operated at relatively low Reynolds numbers, it is reasonable that only the nearest upstream bladerow has any impact on the transition process. This is because the “freestream” between the rotor wakes would not be sufficiently turbulent to cause transition. In the cascade environment, it has already been noted that the benefits of calming are greatest at the lower Reynolds numbers and higher lift coefficients. Whether these benefits can be extended to the higher Reynolds numbers of the largest LP turbines at takeoff conditions remains to be seen.
5.5 ULTRA HIGH LIFT LP TURBINES: CASCADES
The following section will show how it was possible to further increase the lift of profiles and to keep their efficiency at the same level. The ultra high lift profiles developed for the BR715U LP turbine represent a 38% increase in lift over the datum profiles shown in Fig. 3.
Fig. 29 Pressure distributions (from Howell at al 2000) obtained using
the flap test technique of Curtis at al (1996)
Fig. 29 shows some velocity distributions generated by the flap test technique used by Curtis et al (1996) and Howell et al (2000). In these plots, the position of peak suction and laminar boundary layer separation remained constant at approximately 53% and 74% respectively. Fig. 30 is based on the data of Howell et al (2000). It shows how, that for a given style of loading, the profile loss of a cascade will vary as the lift coefficient is increased beyond a Zweifel lift coefficient of 1.05. As predicted by Schulte and Hodson (1997), the loss coefficient rises but it rises more slowly when wakes are present so that the benefits of calming are increased.

UNSTEADY FLOW: ITS ROLE IN THE LOW PRESSURE TURBINE 23
Profile H
Profile H
0.8
1
1.2
1.4
1.6
1.8
2
0.95 1.05 1.15 1.25
Lift relative to profile H
Suc
tion
side
bou
ndar
y la
yer
loss
rat
io
WakesNo wakes
Fig. 30 The effect of wakes on the potential for increasing lift at a
Reynolds number of 130,000 and a fixed position of boundary layer separation (Howell et al (2000) obtained using the flap test technique of
Curtis et al (1996).
Hot film measurements from the suction side of the velocity distributions shown in Fig. 29 indicated that there was a large amount of suction surface covered in transitional and turbulent flow after boundary layer reattachment. Reducing this area of turbulent flow was expected to result in a reduction in profile loss. The ST-diagrams in Fig. 31 illustrate this idea. Transitional flow caused by wakes is marked W, turbulent flow caused by separated flow transition is marked T and calmed flow is marked C. The diagram shows two cases of wake passings at different reduced frequencies.
(a) (b)
Fig. 31 Schematic ST-diagrams of wake induced transition at two different reduced frequencies.
Fig. 31a shows a reduced frequency similar to which occurs on the profiles used here
where separated flow transition occurs between wake passings. The region marked B, between wakes one and two, shows turbulent flow due to the separation bubble reattachment.

HP Hodson and RJ Howell
At this, lower reduced frequency, the flow at the trailing edge is turbulent because of the wakes, then calmed and then turbulent again due to the separation bubble transition. However, if the time between wake passings was sufficiently short (i.e. a higher reduced frequency), then the separation bubble may never have time to re-establish itself. This is the case in Fig. 31b. In this case, the flow at the trailing edge is fully turbulent because of the wakes alone. Removing some turbulent boundary layer (by pushing the position of peak suction/velocity (and therefore separation) towards the trailing edge would reduce the profile loss. It should be noted that in all of the experiments presented in this section, the reduced frequency was kept constant at a value of 0.78 unless otherwise stated.
Using the flap test technique of Curtis et al (1996), Howell et al (2000), moved the position of peak suction to 60, 65 and 68%s. For example, some profiles with peak suction at 65%s resulted in separation at 80%s, a rearwards shift of 6%s compared to the high lift profiles shown in Fig. 3 and Fig. 29. Steady flow hot wire and hot film measurements of the boundary layer at 96%s showed that on these velocity distributions sometimes the separation bubble did not reattach before the trailing edge of the blade. Open separations result in an unacceptably large profile loss. However, when the same pressure distribution was subjected to incoming wakes, Howell et al (2000) showed that the boundary layer at 96%s was always attached, no matter what the loading, or position of peak suction.
Fig. 32 Aft loaded and high lift pressure distributions. All
measurements carried out at Re = 130,000 with wakes present and normalised by velocity at 98% surface length. Profile C obtained using
the flap test technique of Curtis et al (1996).
Fig. 32 shows the pressure distribution of the ultra high lift and aft loaded profile ‘C’ and the high lift profile both measured with wakes present. The results show that the separation bubble, if is exists, has a small effect.
Fig. 33 shows how the suction side boundary layer loss varies with the position of peak suction for a range of lift coefficients. The losses are made non-dimensional by the loss of profile H with unsteady inflow. Unless otherwise stated all measurements were made with wakes present. Fig. 33 shows an obvious trend for the profile losses to reduce when the position of peak suction is moved aft. The reduction in loss can be attributed to a reduction in surface covered in turbulent boundary layer and also to the reduction in turbulent boundary layer due to the wakes, as illustrated in Fig. 31. The scatter of the data for each peak suction position is due to the different loadings that the pressure distributions produced. Profile C produced 15% more lift than the high lift profile and a similar level of loss. The value of Reθ

UNSTEADY FLOW: ITS ROLE IN THE LOW PRESSURE TURBINE 25
just before separation is around 225 which is similar to other profiles such as those in the BR700 series of LP turbines measured by Howell (1999).
Profile CBlade H -
with wakes
Blade H - no wakes
0.6
0.8
1
1.2
1.4
0.5 0.55 0.6 0.65 0.7
Position of peak suction (%s)
Suc
tion
side
b.l.
loss
re
lativ
e to
pro
file
H
Larg
e va
riatio
ns in
lift
Fig. 33 Variation of suction surface boundary layer losses with position
of peak suction, from Howell et al (2000) obtained using the flap technique of Curtis et al (1996).
Fig. 34 is an ST-diagram of the non-dimensional ensemble mean wall shear stress on profiles C and H. The locations of the hot film sensors are indicated by black dots at the top of the figure. Note that the levels of wall shear stress at 60%s are much less than those at 96%s as the data is made non dimensional in the same way as in Fig. 26.
Fig. 34 ST diagram of wall shear stress measurements for Profile H and Profile C. Profile C obtained using the flap test technique of Curtis et al
(1996).
The hot film data from profiles C and H exhibit the same basic structure. Wake induced transition starts in the regions marked and this coincides with the position of steady flow laminar separation, marked ‘S’. The regions of transitional flow have the classical wedge shape. The regions marked ‘L’ have a lower wall shear stress level than the wake induced transition regions downstream. These are caused by the wake’s velocity defect on the laminar boundary layer and are not caused by transitional flow.

HP Hodson and RJ Howell
Having established the boundary layer features that are present on ultra highly loaded LP turbine blades with unsteady inflow, it is now appropriate to show two new ultra high lift profiles. These have been tested in the cascade facility in Fig. 4 and are shown in Fig. 35.
0
0.2
0.4
0.6
0.8
1
1.2
1.4
0 0.2 0.4 0.6 0.8 1Fraction of Surface Length
V /
V2
U1 - Red Freq = 0.54
U2 -Red. Freq = 0.54
Profile H- Red Freq. = 0.78
Fig. 35 Velocity distributions for the ultra high lift profiles, U1 and U2 and profile H normalised by the cascade exit velocity. Unsteady inflow.
Re = 130,000.
Fig. 35 shows the new ultra high lift velocity distributions, U1 and U2 and the high lift profile (H) measured with unsteady inflow. These profiles have an increase in lift of approximately 15% compared to the high lift profile (profile H). This is 38% greater than the datum profile in Fig. 3. The inlet and exit angles were the same as the datum cascade and the design Reynolds number was chosen to be 130,000. The best lift-loss pressure distributions, presented earlier, seem to be those that produced peak suction at 65%s and separation at around 80%s. The position for laminar separation was therefore designed to occur at approximately 80%s, reducing the amount of turbulent boundary layer. The value of Reθ was designed to be approximately 225 at the separation position. This ensures that wake induced transition would be initiated in this region. The presence of the turbulent spots, calmed regions and wake turbulence then controls the separation bubble growth and loss generation.
The velocity distributions in Fig. 35 were made non-dimensional by the cascade exit velocity. This is the correct way of presenting cascade data, whereas for the tests using the attached flap (see Curtis et al (1996)), the isentropic velocity at 96%s was used. Unfortunately, Fig. 35 shows that increasing the lift tends to depress the trailing edge velocity. This occurs because as the lift increases the amount of uncovered turning on the rear of the suction surface also increases. For example, the geometric throat is at approximately 45%s for the profile U1 and there is approximately 10° of inviscid deviation. The uncovered turning is used to maintain the high suction side velocities, downstream of the geometric throat. This large amount of uncovered turning suppresses the velocity at the trailing edge of the aerofoil. This occurs because, for a given mean exit angle, the potential field of each profile increases in strength as the lift increases. Therefore, there is a greater re-distribution of the streamlines once the flow passes beyond the trailing edge plane. This means that the velocity at the trailing edge is lower than that at the cascade exit plane.
The deceleration between peak suction (or peak velocity) and the exit plane is that which would be expected on a profile without a convex rear suction surface. On these ultra-high lift profiles, the flow must decelerate to a much lower value at the trailing edge. An unfortunate

UNSTEADY FLOW: ITS ROLE IN THE LOW PRESSURE TURBINE 27
consequence of the above is that as the lift is increased, the amount of suction surface deceleration increases far more than would be expected if only the peak velocity and cascade exit velocity were considered. Ultimately, this will limit the amount of lift that is practicably possible.
The two ultra-high lift profiles (U1 and U2) both generate the same lift and so must have the same total circulation. Profile U1 has a rather flat-topped velocity distribution. Hot film measurements showed separation occurred at approximately 75%s and wake induced transition occurred at 80%. The flat top pressure distribution allowed the boundary layer to grow more quickly than it would if the flow was still accelerating. Unfortunately, this profile has a similar separation location to the datum profile and this, combined with the flat top pressure distribution and increased deceleration, is likely to lead to higher losses.
To avoid the flat top pressure distribution, profile U2 has an increased peak velocity to give the continual acceleration and allow proper aft loading of the velocity distribution. However, as discussed above, this lead to an even larger back surface deceleration than for profile U1 and resulted in higher than desired losses.
0.5
1.0
1.5
2.0
2.5
80000 120000 160000 200000 240000Reynolds Number
Rel
ativ
e T
otal
Pre
ssur
eLo
ss C
oeffi
cien
t
Profile U2 - Red. Freq = 1.1Profile U2 - Red. Freq = 0.54Profile U1 - Red. Freq = 1.1Profile U1 - Red. Freq = 0.54Profile U1 - SteadyProfile H - Red. Freq. = 0.78
Fig. 36 Variation of profile loss with Reynolds number for profiles H,
U1 and U2.
Fig. 36 shows the variation of relative total pressure losses from the ultra high lift profiles (and for the datum profile) for a number of reduced frequencies. All total pressure loss values are made non-dimensional by the loss for profile H at a Reynolds number of 130,000 with wakes present (reduced frequency of 0.78).
The losses produced with steady inflow by profile U2 reached seven times the losses of profile H with unsteady inflow at the lowest Reynolds number. The steady flow losses are not shown. These exceptionally high steady flow losses of profile U2 were due to the elevated level of deceleration on the suction surface that is caused by the suppressed trailing edge velocity. At a reduced frequency of 0.54, the losses generated by profile U2 are considerably lower than the steady flow losses but higher than those of the other profiles shown. In fact, this frequency is slightly lower that that which would be encountered on a stator blade, the value being determined here by the test rig. Doubling the reduced frequency, to a value more typical of a rotor blade, results in a further and significant reduction in the losses up to Reynolds numbers of around 170,000. In contrast, doubling the reduced frequency for profile H would result in an increase in the profile losses. These differences are a direct consequence of the different designs as discussed above in relation to Fig. 31

HP Hodson and RJ Howell
It has already been noted in relation to Fig. 26 that stator 3 of the BR715 LP turbine had wake induced turbulent regions on the suction surface appearing at twice the frequency of the wake passing of rotor 2. This effectively results in a doubling of the reduced frequency to which stator 3 is subjected. In the case of profile U2, were this to occur, it would be beneficial as shown by Fig. 36
Fig. 36 shows that profile U1 also produces relatively high losses under steady flow conditions. Unlike profile U2, the losses produced by profile U1 are almost independent of the reduced frequency in the range 0.54 to 1.1. Profile U1 also produces losses that are more comparable to the blade H when wakes are present. By a Reynolds number of 170,000, the losses of profile U1 at the higher reduced frequency are roughly the same as those of profile H. It should of course be remembered that both profiles U1 and U2 have 15% more lift than high lift profile H. As the Reynolds numbers are increased, the performance of the ultra-high lift profiles improves dramatically. This is because the losses associated with the separation bubble are less dominant.
The new ultra high-lift profiles produced greater losses than those for the high lift profile at the design Reynolds number, but resulted in a decrease in the number of blades by 15%. Laminar separation occurred on profile U1 at approximately the same surface position as for the high lift profile. Hot film measurements indicted the presence of turbulent boundary layer near the trailing edge. The separation location was moved further aft for profile U2, but required an increase in peak velocity to achieve this. The increased deceleration caused by this resulted in higher losses than those for the datum profile at low reduced frequencies.
5.6 ULTRA HIGH LIFT LP TURBINES: MULTISTAGE TURBINE
The concepts and understanding of the wake-boundary layer behaviour on ultra high lift and aft loaded LP profile developed by Howell et al (2000) were used in the design of a new ultra high lift BR715U LP turbine. This design was carried out by BMW Rolls-Royce, now Rolls-Royce Deutschland. Rig tests of this new turbine were carried out at the ILA at Stuttgart University. The experiments showed that it performs as well as the high lift LP turbine already developed for the BR715 over the same Reynolds number range. Hot film measurements were also carried out by the authors to verify our understanding of the interactions of the wakes and boundary layer behaviour. These data are described below.
Fig. 37 Time history of the raw data of NGV3 of the
BR715 LP turbine at cruise conditions.

UNSTEADY FLOW: ITS ROLE IN THE LOW PRESSURE TURBINE 29
The time history of the raw data can be seen in Fig. 37. On this profile, separation occurs after 65% surface length and reattachment/transition takes place by 75% surface length. There is no obvious evidence of calmed regions in any of the data. Other data (Ramesh, 2000) taken in low speed tests has also shown that the boundary layers on ultra high lift profiles do not seem to exhibit as much calmed flow as lower lift profiles. This does not necessarily mean that calmed flow does not exist in these flows, it just means that they are not obvious from raw data. In fact, at the very low Reynolds numbers found in this turbine, the transition mechanism is still controlled by the passing wakes. However, it may be that it now occurs in the separating shear layer of a laminar separation bubble rather than in attached flow. More periodicity can be seen, for example, in the ensemble mean skew of the data, shown in Fig. 38 where the positive and negative values indicated different stages of the transition process (see Halstead et al (1995), for an explanation).
Fig. 38 Ensemble mean skew for two sensors showing more periodicity in the data than the raw shear stress data of NGV3 of the BR715 LP
turbine at cruise conditions.
Fig. 39 ST diagrams of (a) non-dimensional ensemble mean wall shear stress, (b) RMS and (c) skew from NGV3 of the BR715U LP turbine at
cruise conditions.
Fig. 39 presents distance-time diagrams of the ensemble-mean, ensemble-rms and ensemble-skew for the 3rd stator of the BR715U LP turbine. The data reveal transition is occurring in a periodic manner, for example see regions ‘H1’ and ‘H2’. High shear regions, ‘H1’, are due to transition caused by the wakes of rotor 2 and produce the highest shear at that surface location. Regions ‘H2’ are due to the effects of the rotor 1 and stator 2 and produce lower levels of shear compared to regions ‘H1’. A similar effect was seen in the hot

HP Hodson and RJ Howell
film data from the BR715 LP turbine where transition also occurred at twice the frequency of the passing of rotor 2 wakes. Wake induced transition occurs here (for both sources of wakes) at before 75% surface length. Fig. 37 shows that the flow is reattaching by this location.
The data from the ultra high lift rig tests show that it is far more difficult to see distinct wake boundary layer interactions. The data is made more difficult to understand because the increased deceleration makes the separation bubble transition far more pronounced (see Howell (1999)).
Despite the fact that the periodic effects of wakes cannot so easily be seen in the BR715U data they do have beneficial effects on the efficiency of the profiles. The performance data of this turbine showed it to have similar levels of efficiency to the lower lift BR715 rig. The wake boundary layer interactions therefore continue to have positive effects in the losses generated by even these ultra high lift profiles.
6 Conclusions
In low Reynolds number flows (typically 130,000), the presence of wakes on the suction side boundary layer on a highly loaded LP turbine blade has a profound effect on the losses generated.
The incoming wakes create strips of bypass transition within the boundary layer where turbulent spots, grow and coalesce to form turbulent strips. So-called ‘calmed regions’ trail the turbulent spots/strips as they move over the blade surface. The calmed region is a laminar-like region with a very full velocity profile that follows after the turbulent flow. Initially it is associated with a high wall shear stress (similar to that of the turbulent flow) that then relaxes back to a laminar value. Whereas the transitional/turbulent strips tend to increase losses, the calmed regions tend to reduce losses compared to the undisturbed boundary layer as it is present in steady state cascade tests. It is the trade off between these two effects which is important in terms of loss creation. The trade off depends mainly upon the Reynolds-number, the wake-passing frequency, the wake strength, and the pressure distribution of the blades. For high lift blading at low Reynolds numbers, when a large suction side separation bubble exists, the loss in the turbine may be significantly lower than in a steady flow cascade test. Under these circumstances, the beneficial effect of the calmed region outweighs the detrimental effect of the transitional strips and it is possible to use high lift profiles without a loss of efficiency.
Two new ultra highly loaded LP turbine profiles have recently been designed. With steady inflow the profiles performed poorly. When subjected to unsteady inflow the profile loss reduced dramatically. The profiles generate 15% more lift than the high lift profiles and 38% more lift than the datum profiles. The amount of suction surface deceleration was greater than anticipated during the design of the ultra high lift profiles due to the large back surface curvature used to create the aft loaded pressure distributions. This curvature suppressed the trailing edge velocity, increasing the deceleration required by the flow. This effect limits the lift of such profiles because of the effect on the losses. It may well be that the limit has been reached with these profiles and even the effect of wakes cannot control the large losses generated by the separation bubble.
Rolls-Royce Deutschland have designed a new ultra high lift LP turbine based on much of the research described in this paper. This LP turbine generates approximately 38% more lift than the current blades in the Trent 700 aero engine.

UNSTEADY FLOW: ITS ROLE IN THE LOW PRESSURE TURBINE 31
7 Acknowledgements
The authors wishes to thank the many people who have contributed to their understanding of the problem of wake-induced transition in LP turbines. In particular, they wish to express their gratitude to R Banieghbal, NA Cumpsty, EM Curtis, JP Gostelow, DE Halstead, NW Harvey, ON Ramesh, V Schulte, OP Sharma, T Schröder, H.-P. Schiffer, W Solomon, RD Stieger, GJ Walker, and DC Wisler.
The data obtained in the BR715 and BR715U turbines is published with the kind permission of Rolls-Royce Deutschland and Rolls Royce plc.
8 References
Abu-Ghannam, B.J. and Shaw, R., "Natural transition of boundary layers - the effects of turbulence, pressure gradient and flow history" J. Mech. Eng. Sci., Vol. 22, No. 5, 1980, pp 213-228
Arnone, A., 1999, “Numerical prediction of wake-induced transition in a low pressure turbine”, 14th ISABE Symposium, 5-10th September 1999, Florence, Italy, paper number 99-7058.
Arndt, N, 1991, “Blade row interaction in a multistage low pressure turbine”, ASME paper 91-GT-283.
Banieghbal, MR, Curtis, EM, Denton, JD, Hodson, HP, Huntsman, I, Schulte, V, Harvey, NW, Steele, AB, 1995, "Wake Passing in LP Turbine Blades", presented at the AGARD conference, Derby, UK, 8.5.-12.5. 1995
Binder, A, Schröder, T, and Hourmouziadis, J, 1989, "Turbulence measurements in a multistage low-pressure turbine", ASME Jnl.. Turbomachinery, Vol. 111, pp 153-161
Cobley, K, Coleman, N, Siden, G, and Arndt, N, 1997, “Design of new three stage low pressure turbine for the BMW Rolls-Royce BR715 turbofan engine”, ASME paper 97-GT-419
Cumpsty, NA, Dong, Y, LI, YS, 1995, ” Compressor blade boundary layers in the presence of wakes”, presented at the IGTI conference in Houston, Texas, 1995
Curtis, EM, Hodson, HP, Banieghbal, MR, Howell, RJ, and Harvey, NW, 1996, “Development of blade profiles for low pressure turbine applications”, to be presented at 1996 ASME/IGTI Gas Turbine Congress and Exhibit
Dawes, W N, 1993, “Simulating unsteady turbomachinery flows on unstructured meshes which adapt both in time and space” ASME Paper 93-GT-104, Cincinnati, May
Dong, Y. and Cumpsty, N.A., 1989, "Compressor Blade Boundary Layers: Part I; Test Facility and Measurements with No Incident Wakes; Part II; Measurements with Incident Wakes" ASME Papers 89-GT-50 and 89-GT-51.
Doorly, D.J. and Oldfield, M.L.G., "Simulation of the effects of shock wave passing on a turbine rotor blade" ASME paper No. 85-GT-112, 1985
Emmons, H.W., 1951, "The Laminar-Turbulent Transition in a Boundary Layer - Part 1", Journal of Aerospace Science, Vol 18, No 7, pp 490-498.
Giles, M B, 1987, "Calculation of Unsteady Wake/Rotor Interactions" AIAA Paper 87-0006, presented at AIAA 25th Aerospace Sciences Meeting, Reno, Nevada, 1987
Halstead, DE, 1997, “Flowfield unsteadiness and turbulence in multistage low pressure turbines”, conf. “Boundary layer transition in turbomachines”, Minnowbrook, Syracuse Univ., Sep 7-10

HP Hodson and RJ Howell
Halstead, DE, Wisler, DC, Okiishi, TH, Walker, GJ, Hodson, HP, Shin, H, 1995, ”Boundary layer development in axial compressors and turbines” Part 1-4, presented at the IGTI conference in Houston, Texas
Harvey, NW, Schulte, V, Howell, RJ, and Hodson, HP, 1999, "The Role of Research in the Aerodynamic Design of an Advanced Low Pressure Turbine", 3rd European Conf. on Turbomachinery, IMechE, London, Mar, Accepted for publication by Jnl of Power and Energy
Hodson, H P, 1989, "Modelling Unsteady Transition and Its Effects on Profile Loss", Proceedings, AGARD Conf PEP 74a on Unsteady Flows in Turbomachines, AGARD CP 468
Hodson, H.P. and Addison, J.S., 1988, "Wake-Boundary Layer Interactions in an Axial-Flow Turbine at Off-Design Conditions" ASME Paper 88-GT-233.
Hodson, H.P., "The Development of Unsteady Boundary Layers on the Rotor of an Axial-Flow Turbine" AGARD Conf. on Viscous Effects in Turbomachines, AGARD CP-351, Copenhagen, June 1983.
Hodson, H.P., 1985, "A Blade-to-Blade Prediction of a Wake-Generated Unsteady Flow", ASME Jnl. of Engineering for Gas Turbines and Power, Vol. 107, April 1985.
Hodson, H.P., 1985, "Boundary Layer Transition and Separation near the Leading Edge of a High Speed Turbine Blade", ASME Jnl. Engineering for Gas Turbines and Power, Vol. 107, January 1985.
Hodson, H.P., 1985, "Measurements of Wake-Generated Unsteadiness in the Rotor Passages of Axial Flow Turbines", ASME Jnl. of Engineering for Gas Turbines and Power, Vol. 107, April 1985.
Hodson, H.P., Schulte, V.S., and Howell, R.J., 1997, “The calmed region and its significance in low pressure turbines”, conf. “Boundary layer transition in turbomachines”, Minnowbrook II, Syracuse Univ., Sep 7-10
Hodson, HP, 1984, "Boundary Layer and Loss Measurements on the Rotor of an Axial Flow Turbine", ASME Jnl. of Engineering for Gas Turbines and Power, Vol. 106, April
Hodson, HP, 1990, "Modelling Unsteady Transition and Its Effects on Profile Loss", Proceedings, 1989 AGARD conf. PEP 74a on Unsteady Flows in Turbomachines. Also in ASME Jnl. of Turbomachinery, Vol 112, No. 4, Oct., pp 691-701
Hodson, HP, Addison, JS and Shepherdson, CA, 1992, "Models for Unsteady Wake-Induced Transition in Axial Turbomachines", Journal Physique III, Vol. 2, No. 4, Apr.
Hodson, HP, and Dawes, WN, 1996, “On the interpretation of measured profile losses in unsteady wake-turbine blade interaction studies”, ASME Paper No. 96-GT-494, ASME Turbo Expo '96, Birmingham, Jun.
Hourmouziadis, J, 1989, "Aerodynamic Design of Low Pressure Turbines", AGARD Lecture Series, 167
Howell R.J., 1999, ‘Wake and Separation Bubble Interactions in Low Reynolds Number Turbomachinery’, Ph.D. thesis, Whittle Laboratory, Cambridge University Department of Engineering, Cambridge University.
Howell, RJ, Hodson, HP, Johann E, and Dressen, S, Schiffer, H-P, 2001, “Boundary layer development in the BR710 and BR715 LP turbines - the implementation of high lift concepts”, submitted to ASME 2001.
Howell, RJ , O. N. Ramesh, H.P. Hodson V. Schulte and N. W. Harvey, ‘High Lift and Aft Loaded Profiles for Low Pressure Turbines’, ASME 2000, 264-GT-2000, to be published in the Journal or Turbomachinery.

UNSTEADY FLOW: ITS ROLE IN THE LOW PRESSURE TURBINE 33
Howell, RJ and Hodson, HP, 1998, ‘Hot film measurements from NGV2 and NGV3 of the BR5-715 Low Pressure Turbine’, BMW Rolls-Royce report, reference: WhittleBRR-715.
Korakiantitis, T, 1991, "On the Propagation of Viscous Wakes and Potential Flow in Axial-Turbine Cascades" ASME Paper No 91-GT-373
LaGraff, J.E., Ashworth, D.A., and Schultz, D.L., 1989, "Measurement and Modelling of the Gas Turbine Blade Transition Process as Disturbed by Wakes", ASME Jnl of Turbomachinery, July 1989, vol 111, pp315-322.
Mayle, R.E., "The Role of Laminar-Turbulent Transition in Gas Turbine Engines", ASME paper 91-GT-261, 1991
Meyer, R X, 1958, "The Effect of Wakes on the Transient Pressure and Velocity Distributions in Turbomachines" ASME Journal of Basic Engineering, October, pp 1544-1552
Paxson, D.E. and Mayle, R.E. "Laminar Boundary Layer Interaction with an Unsteady Passing Wake", ASME Paper No.90-GT-120
Pfeil, H, Herbst, R, and Schröder, Th, 1982, "Investigation of Laminar-Turbulent transition of boundary layers disturbed by wakes", ASME paper 82-GT-124
Ramesh, ON, 1999, Private Communication. Rai, M M, 1987, "Navier-Stokes Simulations of Rotor-Stator Interactions using Patched
and Overlaid Grids", Jnl Prop Power, Vol 3 No 5, pp 387-396 Schröder, 1991, “Investigations of bladerow interaction and boundary layer transition
phenomena in a multistage aero engine low pressure turbine by measurements with hot-film probes and surface-mounted hot-film gauges”, in VKI Lecture Series No 9 Boundary Layers in Turbomachines, Von Karman Institute
Schulte, V, and Hodson, HP, 1994, "Wake-Separation Bubble Interaction in Low Pressure Turbines", AIAA-94-2931, AIAA/SAE/ASME/ASEE 30th Joint Propulsion Conference & Exhibit, June
Schulte, V, Hodson, HP, 1996,”Unsteady wake-induced boundary layer transition in high lift LP turbines”, ASME-paper 96-GT-486, 1996
Schulte, VS, and Hodson, HP, 1997, "Prediction Of The Becalmed Region for LP Turbine Profile Design ”, ASME Paper No. 97-GT-398, ASME Turbo Expo '97, Orlando, Jun.
Smith, L H, 1966, "Wake dissipation in turbomachines", ASME Jnl Basic Engineering, Vol 88D, Sept, pp 688-690
Speidel, L., "Beeinflussung der laminaren Grezschicht durch periodische Strörungen der Zuströmung," Z. Flugwiss. 5, Vol. 9, 1957.
Wisler, DC, ‘The Technical and Economic Relevance of Understanding Blade Row Interactions Effects in Turbomachinery’, von Karman Institute for Fluid Dynamics Lecture series 1998-02, February 9-12, 1998.
Zhong, S, Kittichaikarn, C, Hodson, HP, and Ireland, PT, 1998, “A study of unsteady wake-induced boundary layer transition with thermochromic liquid crystals”, IMECH conf. “Optical methods and data processing in heat and fluid flow”, London 16-17 Apr.