untapped power of food system by-products to increase
TRANSCRIPT

1
SUPPLEMENTARY INFORMATION
Untapped power of food system by-products to increase global
food supply
[Author names and affiliations removed for anonymization]
Contents:
1. Current uses and feed use potential of food system by-products and residues 2
2. Supplementary methods for aquafeeds calculations 3
3. Supplementary methods for calculating the replacement potential (Tables S1a-S1c) 5
4. Comparison with previous global assessments of feed use and by-product availability 8
Table S2. Food-competing feedstuff included in this study 9
Table S3. Non-food competing feedstuff included in this study 10
Table S6. Review of studies addressing the replacement of fishmeal (FM) /fish oil (FO) with
livestock by-products. 17
Table S7. Review of studies addressing the replacement of food-competing feedstuff in
livestock feeding with food system by-products and residues. 20
Supplementary references 38

2
1. Current uses and feed use potential of food system by-products and
residues
The food system by-products and residues include all the non-food parts produced in the
crop, livestock and fish production and processing stages. In crop production there are two
kinds of leftovers: crop residues and agro-industrial by-products. Crop residues refer to the
plant material remaining after harvesting, including parts such as straw, leaves, stalks, roots
and stover. Crop residues are typically high in fibre but with limited other important
nutritional components and can cause digestibility problems. They are often used as basic
caloric and fibre supplements, mostly in ruminant diets that add value to residues converting
them to useful food and non-food goods and services. The use of crop residues as feed is
most common in farming systems that produce both crops and livestock, especially in tropical
semiarid and subhumid environments where most of the world’s poor smallholders are
located. Their actual use varies greatly. They provide a buffer for periods with droughts and
other disturbances and contribute importantly to soil organic matter and therefore the
sustainable removal rates should be based on the quantities of crop residues that must be left
on field to maintain soil quality and reduce erosion (Scarlat et al., 2010; Monforti et al.,
2013). The removal of nutrients when harvesting the crop residues can be compensated by
conservation tillage, adequate crop rotation or adding manure (Scarlat et al., 2010). Despite
their local importance in smallholder agriculture, their use as feed has been decreasing
because of agricultural intensification mainly related to less residues being available and of
less nutritious quality due to genetic selection and intensive livestock production requiring
higher quality feed (Steinfeld et al. 2006).
Agro-industrial by-products refer to the side/co-products produced in food processing such as
cereal by-products, oilseed by-products, tuber peels, molasses and pulps that are not used
directly as human food. They are produced as by-products of food processing so their
collection and further processing to feed is common and they are widely used as livestock
and aquaculture feed ingredients.
Livestock by-products include all other parts of the animal when meat is extracted, such as
offal, fat, skin, feet, bones, feathers and blood. Up to one half of the livestock biomass
produced in meat, dairy and egg industries is not consumed by humans (Meeker & Hamilton,
2006). They can be converted to processed animal protein such as protein meals, blood meal,
hydrolyzed feather meal and to rendered animal fat and oil products. These livestock by-
products include high amounts of important nutrients that can be converted to human edible
food by circulating them through feed in livestock and aquaculture production. Their feed use
is controlled by food safety regulations to avoid spreading of diseases, such as bovine
spongiform encephalopathy (BSE) through feed. Currently, in the EU the high-risk by-
products (categories 1 and 2 in the EU legislation), including e.g., bovine spinal cord and
fallen stock, are mainly used as fuel or fertilizer (EFPRA, 2019; EC, 2009; EC, 2011). The
main markets for the low-risk protein products (category 3), such as materials from
slaughterhouse that have been passed fit for human consumption but are not intended to be

3
consumed directly, are used as fertilizers and pet food, while the fat products are commonly
used as feed and in oleochemistry (EFPRA, 2019).
Fish by-products refer to all other parts of fish and seafood when meat is extracted. Through
a reduction process to fish meal and fish oil, they can be converted to valuable by-products
that are widely used in aquaculture as well as in livestock (pig and poultry) feed.
Approximately 25-35% of current fishmeal and fish oil used in animal feed comes from fish
by-products (FAO 2020), with approximately two thirds derived from fishery by-products
and one third from aquaculture by-products (Jackson and Newton 2016; Ytrestøl et al. 2016).
Provided that a potential increase of raw materials from capture fisheries is very limited, any
increase in fishmeal and fish oil production will have to be derived from aquaculture by-
products or other protein alternatives (Hua et al. 2019; FAO 2020). Even though fish meal
produced from by-products has lower protein and higher ash content (Hua et al. 2019), it
nevertheless contains sufficient nutritional value to produce high quality feeds (Newton et al.
2014). The use of fish by-products is not limited to use in animal feeds. Certain by-products
such as heads, frames, offcuts or derivatives such as hydrolysates can be used for human
consumption either directly or as parts of products such as fish surimi and different sauces
(Jayathilakan et al. 2012; Newton et al. 2014; Olsen et al. 2014; Stevens et al. 2018; FAO
2020). Other uses include the pet food industry, nutraceuticals, cosmetics, fuels, fertilizers,
leather, natural pigments, and alternatives to plastic and constituents in other industrial
processes (Stevens et al. 2018; FAO 2020).
2. Supplementary methods for aquafeeds calculations
Diet composition in Tacon et al. (2011) survey data are provided in ranges of inclusion for
each ingredient (min, max, average) for specific species in the main fed aquaculture groups.
In order to estimate a diet composition that sums up to 100%, the proportion of each
ingredient for the average diet composition was used to scale the diet to it. If the maximum
reported inclusion rate was below 100%, no extrapolation was performed, and this lower
inclusion range was used instead. If the average or minimum was above 100% then it was
scaled to 100%.

4
After the diet for each fed aquaculture group was scaled to the 100% inclusion, for the
countries represented in the survey in Tacon et al. (2011), the scaled survey data were
assigned to them but for the rest countries, the inclusion rate was estimated based on the
weighted average global production for each aquaculture group. In order to compare our
estimates to published data on feed use, we used the production data of 2010, the above
procedure and group specific FCRs to estimate total feed and specific ingredients use. FCRs
for commercial feeds for 2010 were taken from Tacon & Metian. (2015) and FCRs for farm-
made feeds were calculated to be 50% higher than commercial ones based on Hasan et al.
(2013). For highly carnivorous high value groups (other marine fishes and shrimps), the share
of global production not fed on commercial feeds, was assumed to feed on whole fish
(“trash” fish) and their FCRs were estimated according to reported conversion factors for
these groups (Funge-Smith et al. 2005; De Silva & Turchini 2009; Hasan 2012; Cashion et al.
2016).
Our estimation for fishmeal use was at 4.25 mmt and for fish oil 0.79 mmt for commercial
feeds only. Tacon et al. (2011) estimated the fishmeal and fish oil use in commercial feeds at
3.67 mmt and 0.764 mmt respectively. Our estimate of fish meal use is higher than reported
for year 2010 and this is due to the fact that the countries represented in the survey data that
were used to extrapolate diet composition globally, included also countries in which the use
of fish meal is notably higher than the global average as reported in Tacon et al. (2015). To
overcome this issue, for the further estimation of feed for the years of interest (2016-2018),
we recalculated country specific diet inclusion rates for the years 2016-2018, by a) first
assigning in the diet composition the global average use of fishmeal and fish oil for each
aquaculture group for year 2015 for all countries and then b) rescaling the diet composition to
100% according to the proportions of the other protein rich and oil ingredients in the diet.
After that, we estimated the feed use with FCRs for 2015 as described above.
Examples for all three cases: a) average inclusion in the diet for five ingredients is A:20%, B:30%,
C:10%, D:20% and E:10%. This sums up to a total of 90%, which cannot be as the diet needs to sum up
to 100%. Each ingredient % is then divided by the 90% to get the proportion of the ingredient in the diet.
Then the estimated proportion is multiplied with 100% to get the new diet composition that sums up to
100% while retaining the same proportions of the ingredients. b) the maximum inclusion rate in the diet
for five hypothetical ingredients is A:10%, B:20%, C:20%, D:10% and E:5%. This sums up to a total
65% of the total diet. Given that we have no information on other ingredients in the diet we calculate the
ingredients used only for this 65% of the diet. c) average inclusion in the diet for five ingredients is
A:20%, B:40%, C:10%, D:20% and E:20%. This sums up to a total of 110%, which cannot be as the diet
needs to sum up to 100%. Each ingredient % is then divided by the 110% to get the proportion of the
ingredient in the diet. Then the estimated proportion is multiplied with 100% to get the new diet
composition that sums up to 100% while retaining the proportions of the ingredients.

5
3. Supplementary methods for calculating the replacement potential
The maximum and minimum replacement potential was calculated considering both the
availability of replacement materials as well as the replacement constraints (table S5). First,
the feed use of each of the food-competing feedstuff selected was multiplied with the
replacement constraints to estimate the maximum and minimum replacement potential for
each livestock group and replacement material individually (Eq 1).
(1) 𝑅𝑒𝑝𝑙𝑓,𝑎𝑝,𝑟,𝑟𝑒𝑔 = 𝐹𝑒𝑒𝑑𝑓,𝑎𝑝,𝑟𝑒𝑔 ∗ 𝐶𝑜𝑛𝑠𝑡𝑟𝑎𝑝,𝑟
where Repl is the replacement potential for each food-competing feedstuff (f,) animal
(livestock or aquaculture) production group (ap) (including cattle meat, dairy cattle, poultry
meat, poultry eggs, pork and aquaculture), the replacement material selected (r) and for each
region (reg) (table S4). Feed is the feed use for each feedstuff (f), animal production group
(ap) and region (reg) and Constr are the replacement constraints (table S5) for each animal
production group (ap) and replacement material (r).
Second, the maximum and minimum replacement potentials were corrected with the
availability of the selected replacement material in the region. If the sum of replacement
potentials of the different animal production groups of one replacement material exceeded its
regional availability, it was normalized to match the regional availability (Eq 2).
(2) 𝐼𝑓 ∑ 𝑅𝑒𝑝𝑙𝑓,𝑟,𝑟𝑒𝑔 > 𝐴𝑣𝑎𝑖𝑙𝑟,𝑟𝑒𝑔
𝑡ℎ𝑒𝑛 𝑅𝑒𝑝𝑙𝑓,𝑎𝑝,𝑟,𝑟𝑒𝑔 = (𝐹𝑒𝑒𝑑𝑓,𝑎𝑝,𝑟𝑒𝑔 ∗ 𝐶𝑜𝑛𝑠𝑡𝑟𝑎𝑝,𝑟 ) ∗𝐴𝑣𝑎𝑖𝑙𝑟,𝑟𝑒𝑔
∑ 𝑅𝑒𝑝𝑙𝑟,𝑟𝑒𝑔
Third, the combined replacement potential of the different replacement materials was
estimated by adjusting the maximum replacement potential for an animal production group to
not exceed the feed use of the food-competing feedstuff of the same animal production group.
If the sum of the replacement potential of the different replacement materials exceeded the
feed use of the animal group, the individual replacement potentials of the different
replacement materials were normalized to match the maximum feed use of the animal
production group (Eq 3).
(3) 𝐼𝑓 ∑ 𝑅𝑒𝑝𝑙𝑓,𝑎𝑝,𝑟𝑒𝑔 > 𝐹𝑒𝑒𝑑𝑓,𝑎𝑝,𝑟𝑒𝑔
𝑡ℎ𝑒𝑛 𝑅𝑒𝑝𝑙𝑓,𝑎𝑝,𝑟,𝑟𝑒𝑔 = (𝐹𝑒𝑒𝑑𝑓,𝑎𝑝,𝑟𝑒𝑔 ∗ 𝐶𝑜𝑛𝑠𝑡𝑟𝑎𝑝,𝑟 ) ∗𝐹𝑒𝑒𝑑𝑓,𝑎𝑝,𝑟𝑒𝑔
∑ 𝑅𝑒𝑝𝑙𝑟,𝑟𝑒𝑔
Finally, the combined potential of the different replacement materials and animal production
groups were summed to derive the total replacement potential (Eq 4).
(4) 𝑅𝑒𝑝𝑙𝑡𝑜𝑡𝑎𝑙,𝑓 = ∑ 𝑅𝑒𝑝𝑙𝑓,𝑎𝑝,𝑟,𝑟𝑒𝑔
The increased food supply was estimated by multiplying the replaced food-competing
feedstuff amounts with their energy (kcal), protein and fat contents (FAO, 2001).
6
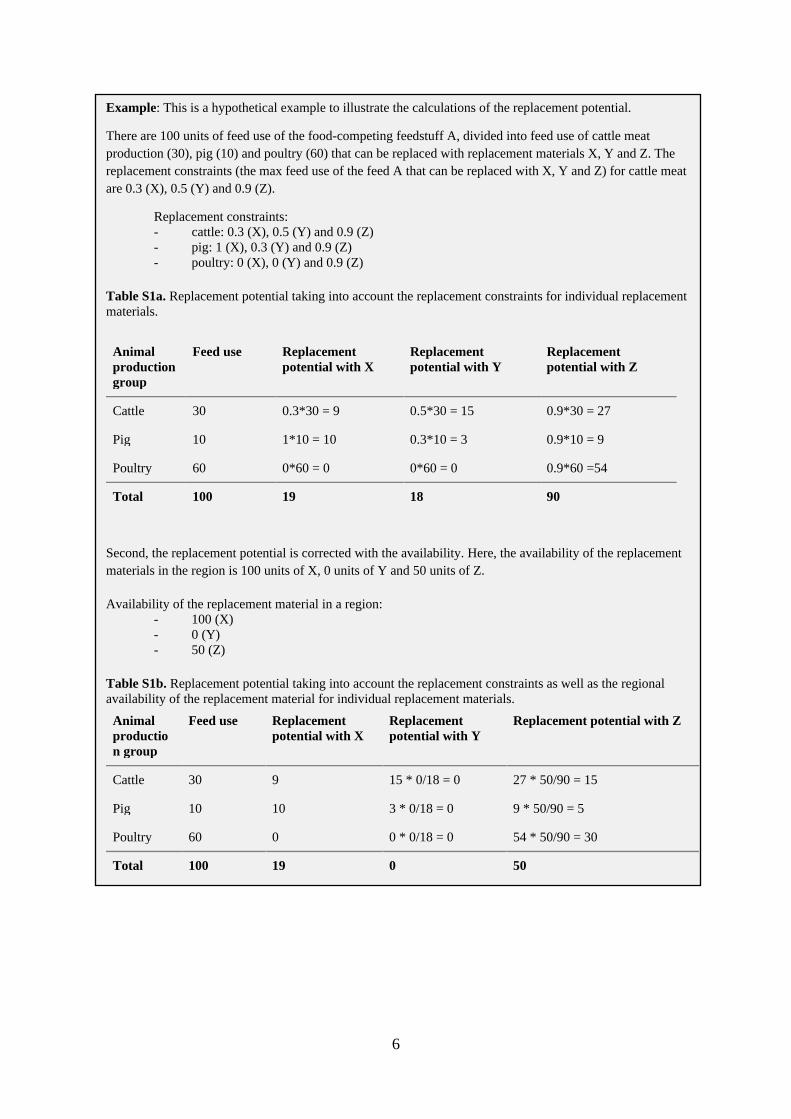
Example: This is a hypothetical example to illustrate the calculations of the replacement potential.
There are 100 units of feed use of the food-competing feedstuff A, divided into feed use of cattle meat
production (30), pig (10) and poultry (60) that can be replaced with replacement materials X, Y and Z. The
replacement constraints (the max feed use of the feed A that can be replaced with X, Y and Z) for cattle meat
are 0.3 (X), 0.5 (Y) and 0.9 (Z).
Replacement constraints: - cattle: 0.3 (X), 0.5 (Y) and 0.9 (Z) - pig: 1 (X), 0.3 (Y) and 0.9 (Z) - poultry: 0 (X), 0 (Y) and 0.9 (Z)
Table S1a. Replacement potential taking into account the replacement constraints for individual replacement
materials.
Animal
production
group
Feed use Replacement
potential with X
Replacement
potential with Y
Replacement
potential with Z
Cattle 30 0.3*30 = 9 0.5*30 = 15 0.9*30 = 27
Pig 10 1*10 = 10 0.3*10 = 3 0.9*10 = 9
Poultry 60 0*60 = 0 0*60 = 0 0.9*60 =54
Total 100 19 18 90
Second, the replacement potential is corrected with the availability. Here, the availability of the replacement
materials in the region is 100 units of X, 0 units of Y and 50 units of Z.
Availability of the replacement material in a region: - 100 (X) - 0 (Y) - 50 (Z)
Table S1b. Replacement potential taking into account the replacement constraints as well as the regional
availability of the replacement material for individual replacement materials.
Animal
productio
n group
Feed use Replacement
potential with X
Replacement
potential with Y
Replacement potential with Z
Cattle 30 9 15 * 0/18 = 0 27 * 50/90 = 15
Pig 10 10 3 * 0/18 = 0 9 * 50/90 = 5
Poultry 60 0 0 * 0/18 = 0 54 * 50/90 = 30
Total 100 19 0 50
19 < 100, so no
need to change
these
18 > 0, so we need
to adjust the
potential here
90 > 50, so we need to adjust the
potential here

7
Third, the combined replacement potential is estimated by not allowing the max replacement potential to exceed
the feed use of the animal production group.
Table S1c. Combined replacement potential of the different replacement materials for individual animal
production groups taking into account the replacement constraints as well as the regional availability of the
replacement material.
Animal
produc-
tion
group
Feed
use
Replacement
potential with
X
Replacement
potential with
Y
Replacement
potential with
Z
Combined
replacement
potential
Cattle 30 9 0 15 9 + 0 + 15 = 24
24/30 = 0.8
~80% of the
cattle feed A
use
24 < 30 (cattle
feed use of A) so
no need to adjust
here
Pig 10 10
10 * 10/15
=6.7
0
0 * 10/15 = 0
5
5 * 10/15 =3.3
10 + 0 + 5 = 15
6.7 + 0 + 3.3
=10
10/10 = 1
~100% of the
pig feed A use
15 > 10 (pig
feed use of A) so
the potential
needs to be
adjusted here
Poultry 60 0 0 54 * 50/90 =
30
0 + 0 + 30 = 30
30/60 = 0.5
~50% of the
cattle feed A
use
30 < 60 (poultry
feed use of A) so
no need to adjust
here
Total 100 15.7 0 48.3
The combined replacement potentials for feed A is then 15.7 + 0 + 48.3 =64 units, which is equivalent to 64/100
= 64% of the total A feed use in a region. These calculations would then be repeated with all the regions to come
up with the global replacement potential.

8
4. Comparison with previous global assessments of feed use and by-
product availability
The results of this study for livestock and aquaculture feed use as well as the availability of
by-products were compared to previous studies and they were found to be in line and in
accordance with their assessments. Our total estimate for livestock feed flows, 6969 mmt (dry
matter), for 2016-2018 was 16% and 48% higher compared to Mottet et al. (2017) and
Herrero et al. (2013) that estimated the total livestock feed use to be 5996 mmt (dm) for 2010
and 4693 mmt for 2000, respectively. The production of dairy and cattle, pork and poultry
meat has increased 44% from 2000-2017 and 16% from 2010-2017, which explains our
higher estimate. Mottet et al. (2017) showed that 14% of the feedstuff used consists of food-
competing feedstuff, compared to our estimate of 11%. The difference here can be a result of
the categorization of the food-competing feedstuff applied: Mottet et al. (2017) included also
unprocessed soybeans in their category of human edible feed use, while in this study all the
soybean use as feed was divided into soybean meals and oils and all the meals were assigned
to the non-food competing feed category.
In order to compare our estimates for aquaculture feed use to published data, we used the
production data of 2010. For year 2010, we estimated the total use of commercial feeds at
35.4 mmt tones and the total use of farm-made feeds at 32.65 mmt that is in accordance with
Tacon et al. (2011) and Tacon and Metian (2015). Furthermore, we estimated the use of
soymeal in commercial aquafeeds at 7.3 mmt and Tacon et al. (2011) estimated the use of
soymeal in commercial aquafeeds for 2008 at 6.8 mmt thus, this estimate is also in
accordance with the literature. We estimated the use of “trash” fish at 8.85 mmt and Tacon et
al. (2011) estimated trash fish use for 2006 at 5.6-8.8 mmt thus, our estimates are in
accordance with this earlier estimate as well.
For years 2016-2018 we estimated a total use of commercial aquafeeds of 53.8 mmt, while
Tacon (2019) estimated commercial feed use of 51.5 mmt for 2017 therefore, our estimate is
in accordance. In addition, we have estimated the use of fishmeal and fish oil in commercial
feeds at 3.56 mmt and 0.78 mmt respectively. According to a recent IFFO report (SEAFISH),
global production of fishmeal and fish oil since 2010 has stagnated at around 5 mmt and 1
mmt respectively. Tacon and Metian (2015) estimated that the aquaculture commercial feeds
used 68% and 74% of the global fishmeal and fish oil production in 2012. Based on the above
two sources, and assuming that the use of fishmeal and fish oil from the aquaculture sector
remains approximately the same, then our estimates are in agreement with the literature.
The comparison of our results of the potential by-product production is challenging since
global or even regional level estimates of the different by-product flows are scarce. Our
estimate of potential crop residue production at the global level without removing the crop
residues left on field, was 5411 mmt (uncertainty range 4517 – 6280 mmt). Wirsenius (2000)
estimated a production of cereal and sugar residues to be 2900 mmt in 1992-1994, hence
taking into account the increase in global production of cereals, sugar crops and pulses of
52% during 1992-2018 (FAO, 2021) and the fact that we accounted also the crop residues
from pulses in our estimate, they can be assumed to be within the same range. The amounts

9
of production of crop processing by-products were adopted from FAO Supply and Utilization
accounts (FAO, 2021) and therefore those were in line with the FAO statistics. Wirsenius
(2000) estimated the livestock by-products generated globally from other than ruminant
origin to be 78.2 mmt for 1992-1994, compared to the estimate from this study of 102 mmt
(84-118 mmt) for 2016-2018. The amounts of livestock by-products produced in Europe
estimated in this study was 18 mmt (uncertainty range 14-21 mmt), without by-products from
ruminant origin, compared to the amounts of livestock by-product processed in EU (17 mmt
in 2017 including also by-products from ruminant origin) reported by the European Fat
Processors and Renderers Association (EFPRA, 2019). Here, however, EFPRA reports the
actual amounts processed, while we estimate the potential in processing, which may explain
the difference in the numbers. More detailed numbers of the processing of the different
livestock by-products in the EU were not available. In this study the total potential for fish
by-products was estimated to be 23.6 mmt (uncertainty range 17.5-29.6 mmt), which is 36%
higher compared to the estimates from Jackson & Newton (2016) that had estimated the use
and potential of fish by-products to be 17.3 mmt for 2009-2013. However, the difference can
be at least partly explained by the increase in world fish production of more than 20%
between 2009-2013 and 2016-2018 (FAO, 2020).
Table S2. Food-competing feedstuff included in this study
Feedstuff Group
corn gluten meal Cereals
sorghum meal Cereals
wheat gluten meal Cereals
barley Cereals
cassava Cereals
maize Cereals
millet Cereals
rice Cereals
sorghum Cereals
wheat Cereals
fish oil made from whole fish Fish oil
fishmeal made from whole fish Fishmeal
groundnut oil Oilseed oils
oil from palmkernels Oilseed oils
sunflowerseed oil Oilseed oils

10
rapeseed oil Oilseed oils
soy lecithin Oilseed oils
soy protein concentrate Oilseed oils
soybean oil Oilseed oils
fababean meal Pulses
field pea protein Pulses
field pea meal Pulses
lupin meal Pulses
peas Pulses
pulses Pulses
Table S3. Non-food competing feedstuff included in this study
Feedstuff Group
blood meal Livestock by-product
hydrolyzed feather meal Livestock by-product
meat and bone meal Livestock by-product
meat meal hog ovine Livestock by-product
poultry oil Livestock by-product
poultry by-product meal Livestock by-product
fish oil from fish by-products Fish by-product
fishmeal from fish by-products Fish by-product
bran Cereal by-product
barley bran Cereal by-product
barley hulls Cereal by-product
maize bran Cereal by-product
millet bran Cereal by-product
oat bran Cereal by-product
rye bran Cereal by-product
bran sorghum Cereal by-product
wheat germ Cereal by-product

11
rice bran Cereal by-product
wheat bran Cereal by-product
corn by-products Cereal by-product
distillers grains Cereal by-product
dry by-products from grain
industries Cereal by-product
wet distilleries grain Cereal by-product
banana residues Crop residues
crop residues Crop residues
pulses straw Crop residues
sugarcane tops Crop residues
cottonseed meal Oilseed meal
groundnut meal Oilseed meal
oilseed meal Oilseed meal
rapeseed meal Oilseed meal
soybean meal Oilseed meal
sunflowerseed meal Oilseed meal
palmkernel cake Oilseed meal
Complements
(aminoacids,minerals) Other
limestone Other
swill Other
krill meal Other seafood
squid meal Other seafood
squid oil Other seafood
fodder beet Roughages
fresh grass Roughages
grass and leaves Roughages
hay Roughages
leaves Roughages
legumes and silage Roughages

12
molasses Sugar by-products
sugarbeet pulp Sugar by-products

13
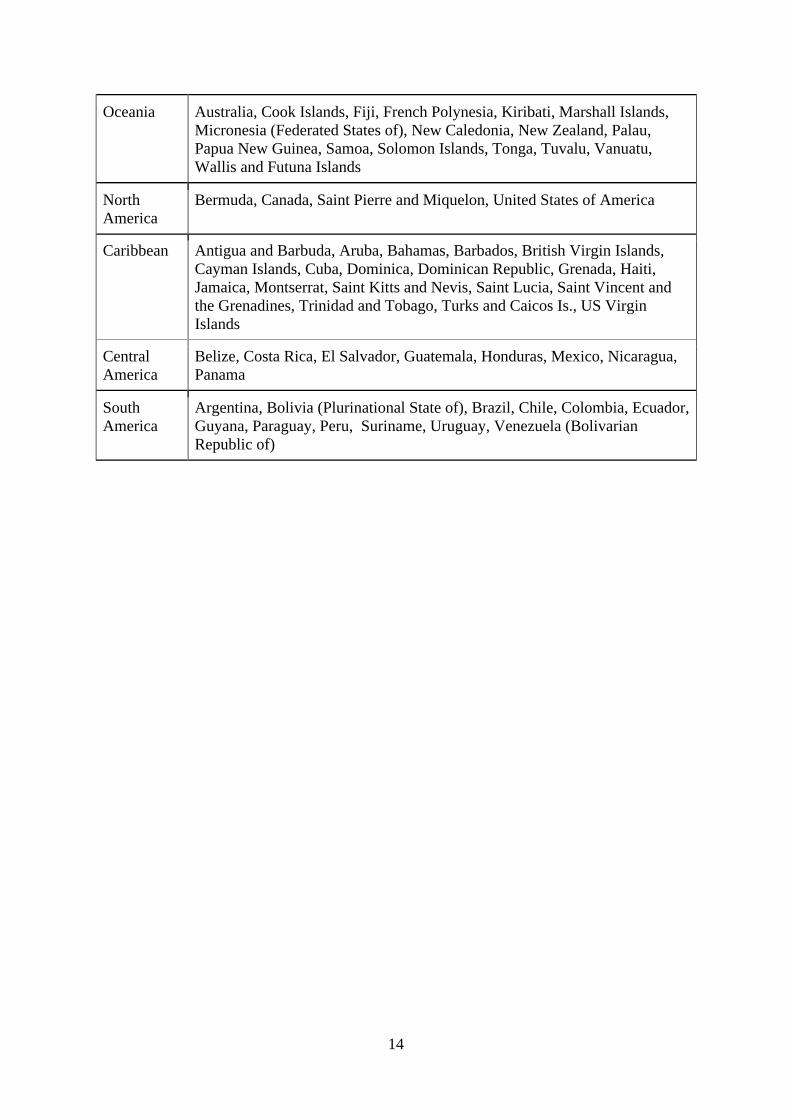
Table S4. Countries and administrative regions included in the analysis and the division
to subregions following the division in FAO (2021). The data coverage of the livestock and
aquaculture feed use and the availability of food systems’ by-products and residues varies
between countries.
Eastern
Africa
Burundi, Comoros, Djibouti, Eritrea, Ethiopia, Kenya, Madagascar, Malawi,
Mauritius, Mayotte, Mozambique, Rwanda, Seychelles, Somalia, Tanzania
United Rep. of, Uganda, Zambia, Zimbabwe
Middle
Africa
Angola, Cameroon, Central African Republic, Chad, Congo, Congo Dem.
Rep. of the, Equatorial Guinea, Gabon, Sao Tome and Principe
Southern
Africa
Botswana, Lesotho, Namibia, South Africa
Western
Africa
Benin, Burkina Faso, Côte d'Ivoire, Gambia, Ghana, Guinea, Guinea-Bissau,
Liberia, Mali, Niger, Nigeria, Senegal. Sierra Leone, Togo
Northern
Africa
Algeria, Egypt, Libya, Morocco, Sudan, Tunisia
Western
Asia
Armenia, Azerbaijan, Bahrain, Georgia, Iraq, Israel, Jordan, Kuwait,
Lebanon, Oman, Palestine, Qatar, Saudi Arabia, Syrian Arab
Republic, Turkey, United Arab Emirates, Yemen
Eastern
Asia
China, China, Hong Kong SAR, Japan, Korea, Dem. People's Rep, Korea,
Republic of, Mongolia
South-
Eastern
Asia
Brunei Darussalam, Cambodia, Indonesia, Lao People's Dem. Rep.,
Malaysia, Myanmar, Philippines, Singapore, Thailand, Timor-Leste, Viet
Nam
Southern
Asia
Afghanistan, Bangladesh, Bhutan, India, Iran (Islamic Republic of), Nepal,
Pakistan, Sri Lanka
Central
Asia
Kazakhstan, Kyrgyzstan, Tajikistan, Turkmenistan, Uzbekistan,
Eastern
Europe
Belarus, Bulgaria, Czech Republic, Hungary, Poland, Republic of Moldova,
Romania, Russian Federation, Slovakia, Ukraine
Northern
Europe
Denmark, Estonia, Faroe Islands, Finland, Iceland, Ireland, Latvia,
Lithuania, Norway, Sweden, United Kingdom
Southern
Europe
Albania, Croatia, Cyprus, Greece, Italy, Malta, Montenegro, Portugal,
Serbia, Slovenia, Spain
Western
Europe
Austria, Belgium, France, Germany, Luxembourg, Netherlands, Switzerland
14
Oceania Australia, Cook Islands, Fiji, French Polynesia, Kiribati, Marshall Islands,
Micronesia (Federated States of), New Caledonia, New Zealand, Palau,
Papua New Guinea, Samoa, Solomon Islands, Tonga, Tuvalu, Vanuatu,
Wallis and Futuna Islands
North
America
Bermuda, Canada, Saint Pierre and Miquelon, United States of America
Caribbean Antigua and Barbuda, Aruba, Bahamas, Barbados, British Virgin Islands,
Cayman Islands, Cuba, Dominica, Dominican Republic, Grenada, Haiti,
Jamaica, Montserrat, Saint Kitts and Nevis, Saint Lucia, Saint Vincent and
the Grenadines, Trinidad and Tobago, Turks and Caicos Is., US Virgin
Islands
Central
America
Belize, Costa Rica, El Salvador, Guatemala, Honduras, Mexico, Nicaragua,
Panama
South
America
Argentina, Bolivia (Plurinational State of), Brazil, Chile, Colombia, Ecuador,
Guyana, Paraguay, Peru, Suriname, Uruguay, Venezuela (Bolivarian
Republic of)

15
Table S5. Replacement constraints of fishmeal, fish oil, cereals, oilseed oils and pulses with food system by-products considering the
nutritional needs in livestock and aquaculture production
Feedstuff Replacement material Dairy cattle Beef cattle1 Pigs Poultry Aquaculture
Fishmeal Livestock by-products * - - 75 - 100% 75 - 100% 27-79%
Oilseed meals - - 75 - 100% 75-100% 30-80%
Fishmeal from fisheries
by-products - - 75 - 100% 31-40% 75 - 100%
Fish oil
Poultry oil - - - - 51-79%
Fish oil from fisheries
by-products - - - - 75-100%
Cereals
Crop residues
100% but
production
decreased 40-
80%
100% but
production
decreased 40-
80%
2% piglets 2 % 0 %
13% sows
Cereal processing by-
products
Wheat bran 45-55 % 45-55 % 16 % 15-39% 0%
Oat hulls 45-55 % 45-55 % 5-10% 5-37% 0%
Sugar beet pulp 70-100% 70-100%
10-25% (up
to 70% on
sows)
2-18% 0%

16
Molasses 17-30% 17-30% 5-10% 0%
Oilseed
oils
Poultry oil - - 100 % 100 % 75-100%
Fish oil from fisheries
by-products - - 100 % 100 % 75-100%
Pulses
Oilseed meals 75-100% 75-100% 75-100% 75-100% 75-100%
Livestock by-products2 * Meat and bone
meal, pig - - 0% 9-56% 75-100%
Poultry meal 75-100% 0% 75-100%
Feather meal - - 12-43% 0% 75-100%
Fishmeal from
fish by-products - - 100 % 24-75% 75-100%
Blood meal - - 50 % 10 % 75-100%
The rows without a number refer to not including the feed in their current diet.
* Only from non-ruminant origin and intra-species recycling not allowed. 1Assumed similar replacement potential as on dairy cows if scarce literature indicated lower substitution rates, as the nutrient and energy requirements of animals with
identical liveweight for growth are usually lower than for milk production (Luke, 2021). 2Due to lack of literature, it was assumed that the results of substituting soybean meal with processed animal protein are also applicable to other leguminous feed resources.

17
Table S6. Review of studies addressing the replacement of fishmeal (FM) /fish oil (FO) with livestock by-products.
Ingredient Species substitution
(%)
substitution details reference Limitations Benefits
Feather meal European
seabass
76 % In the diets explored, FM
decreased, feather meal
increased and so did corn
meal and very little FO.
Crude protein was kept at
approximately the same
levels.
Campos et al.
(2017)
palatability but
when mixed with
other proteins it’s
ok
decrease feed price,
environmental impact and carbon
footprint when local feather meal
is used
feather
meal/poultry
meal/meat
meal
malabar
grouper
25 % In the diets explored, FM
was replaced with the
alternative meals and the
wheat flour amount changed
in the different diets. As a
result, the protein content
fluctuated a bit between the
different diets.
Li et al. (2009)
feather
meal/meat
meal
rainbow
trout
30 % cited results from
another article in Li
et al. (2009)
feather meal Japanese
flounder
40 % cited results from
another article in
Campos et al.
(2017)
feather meal major
carp
50 % cited results from
another article in

18
Campos et al.
(2017)
feather meal Nile
tilapia
66 % cited results from
another article in
Campos et al.
(2017)
blood meal
and fish-offal
meal blend
rohu 21 % Fermented anima and fish
by-products for substituting
FM
Dawood & Koshio
(2019) fermented
products for
aquafeeds
Fermentation increases
digestibility and crude protein
content, and can be used for
producing unconventional
feedstuffs to replace FM and FO.
Animal by-products have high
digestibility and lack anti-
nutrients that crops do have.
fish-offal meal catfish 50 % table in Dawood &
Koshio (2019)
fish-offal meal Indian
major
carp, rohu
50 % while 30% is fermented table in Dawood &
Koshio (2019)
feather meal catla catla 75 % 30% feather meal and 10%
FM if feather meal
processed right with
fermentation
table in Dawood &
Koshio (2019)

19
poultry meal sea bream 50 % with supplementation of
lysine & methionine
(because these two miss
from poultry meal)
Karapanagiotidis et
al. (2018)
the use of non-ruminant by-
products could enhance
aquaculture’s sustainability and
eco-efficiency, as these feedstuffs
provide a valuable means of
animal by-products utilization
and have in general a more
favourable carbon footprint when
compared with fishmeal and plant
alternatives
pet-grade
poultry meal
or pork meat
meal
fingerling
Nile
tilapia
100 % diet was supplemented with
FO and wheat was
decreased in the different
diets
Hernandez et al.
(2014)
The 100%
substitution
might not be
possible in other
species that have
lower digestive
capacity
As efficient as FM based diets.
Protein digestibility and
nutritional composition depends
on the quality of the animal by-
products and the processing
technology. Nile tilapia is a
species with high digestive
capacity
average all
alternatives
53 %

20
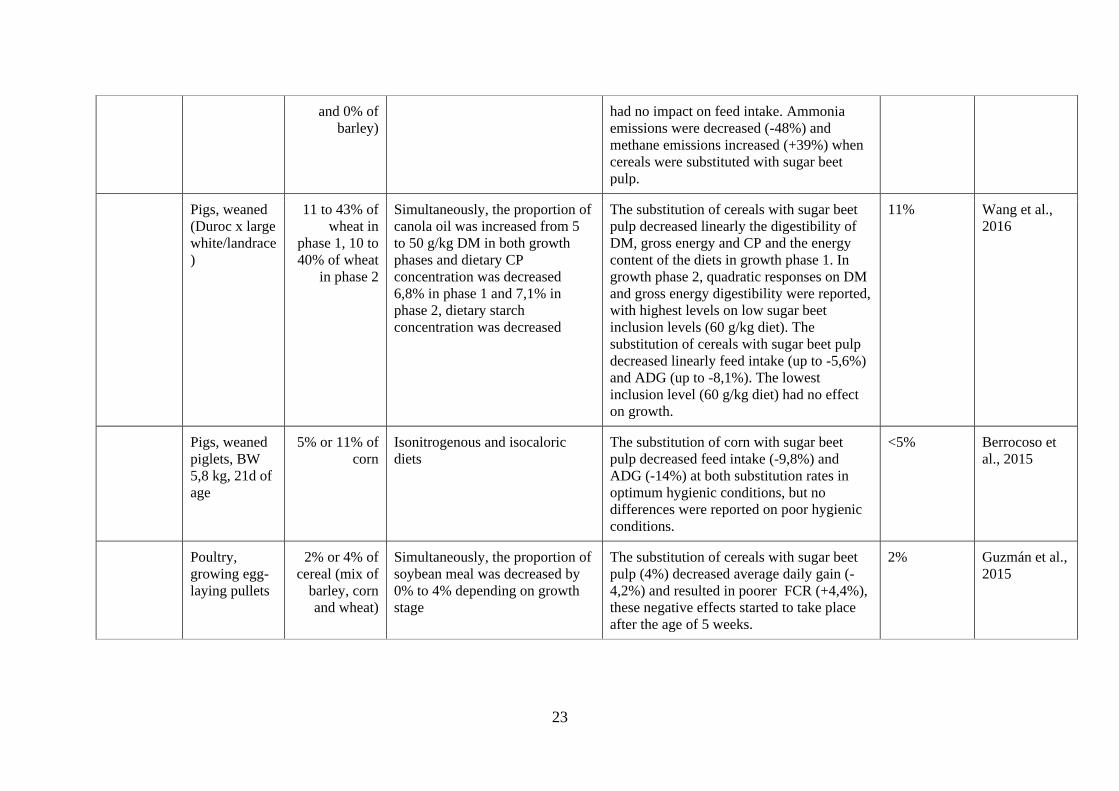
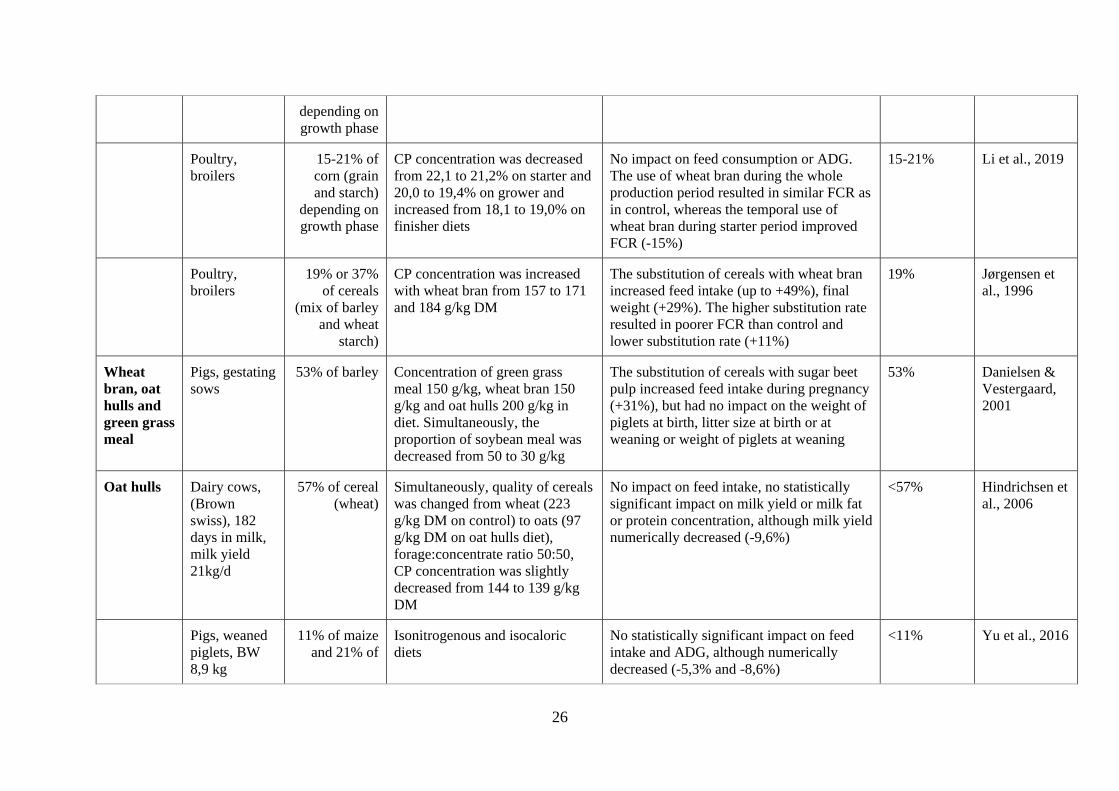
Table S7. Review of studies addressing the replacement of food-competing feedstuff in livestock feeding with food system by-products
and residues.
Ingredient Species substitution
(%)
substitution details Results Optimal
substitution
rate
reference
Sugar beet
pulp
Lactating
dairy cows,
early lactation
(simmental)
70% of corn
grain in dry
matter
Isonitrogenous diets, dietary
starch concentration was
decreased, milk yield 36-37 kg/d,
cows 37 days in milk
No impact on feed intake, milk yield, milk
fat or protein concentration, milk lactose
concentration was decreased 2,5%, no
impact on plasma energy metabolites
70% Münnich et
al., 2018
Lactating
dairy cows
(Holstein,
Swedish red)
100% of
small-grain
cereals (1:1:1
mixture of
wheat, barley
and oats)
Simultaneously, soybean meal
was substituted with rapeseed
meal and 72 g/kg DM of wheat
bran added to the diet, milk yield
38,6 kg/d, cows 85 days in milk
No impact on feed intake, no impact on milk
yield, ECM, milk fat or protein
concentration, milk lactose concentration
was decreased 1%, no effect on FCR
100% Karlsson et al.,
2018
Lactating
dairy cows
A meta-analysis, sugar beet pulp
intake 0-5,56 kg/d, milk yield
14,3-44,1 kg/d
Effect of sugar beet pulp on feed intake depends on the feed intake level
of the cow: at low intake levels
(≤3,5% BW) sugar beet pulp is
more likely to increase feed intake
but at high intake levels (>3,5% BW) sugar
beet pulp is more likely to decrease feed
intake. Thus, the effect of sugar beet pulp on
feed intake depends on the cows’ potential
to increase their feed intake. The effects did
not differ between the types of feeds (maize
or barley) that were substituted by sugar
beet pulp. Sugar beet pulp has no impact on
milk yield.
Münnich et
al., 2017

21
Steers
(Holstein)
100% of
barley
Isonitrogenous diets, forage-
concentrate ratio 35:65, dietary
starch concentration was
decreased and ADF concentration
increased, BW of steers 368 kg
and age 420d
Quadratic response on DM and NDF
digestibility with highest digestibility on
moderate substitution rates, substitution of
barley with sugar beet pulp may reduce the
risk of rumen abnormality when low-forage
diets are fed, ADG not reported.
Mojtahedi &
Mesgaran,
2011
Steers (British
x continental),
BW 314 kg
34% of corn Feedlot system, isonitrogenous
diets, forage:concentrate ratio
15:85
The substitution of corn with sugar beet
pulp decreased feed intake (-7,1%) , average
daily gain (-6,7%) and final body weight (-
3,2%)
Nichols et al.,
2014
Bulls
(crossbred),
322 kg, 195d
of age
30% of barley Substitution of barley with sugar beet pulp
increased silage intake (+10,3%), DMI
(+4,8%), final liveweight (+2,4%) and
carcass weight (+2,5%). The substitution
had no impact on FCR.
30% Pesonen et al.,
2014
Steers 100% of
barley
Separate feeding of forage and
concentrate, forage:concentrate
ratio varied from 42:58 to 51:49
The substitution of barley with sugar beet
pulp decreased silage intake (-19%) and
body condition score (-8,7%) but had no
effect on ADG or liveweight
≤100% Keane 2005
Steers, 38d
age
20% or 39%
of corn
Isonitrogenous diets, steers were
grown until reached the same BW
Quadratic response on feed intake with
highest levels on lower substitution rate, the
substitution of corn with sugar beet pulp
linearly increased days on feed (+5,7%) and
decreased ADG (-5,7%)
20% Chester-Jones
et al., 1991
Bulls, BW
140kg
25% or 50%
of barley
Separate feeding or forage and
concentrate, forage:concentrate
ratio varied from 57:43 to 59:41
No impact on silage, feed intake, final
liveweight, ADG, carcass weight or FCR
50% Jaakkola &
Huhtanen,
1990

22
Pigs, barrows
(landrace x
large white)
25% or 50%
of maize
All diets contained equal amounts
of barley
Live weight at slaughter (-4,1%) and carcass
weight (-9,2%) were decreased with the
substitution rate of 50% but not with 25%.
Both substitution rates decreased dressing
percentage (up to -5,0%).
25% Magistrelli et
al., 2009
Pigs, 2nd
parity sows
(Danish
landrace x
Yorkshire)
10% of small-
grain cereals
in fresh matter
(mix of wheat
and barley)
Simultaneously, the proportion of
soybean meal was decreased by
3,9%
The substitution of cereals with sugar beet
pulp had no impact on sow weight, weight
loss from gestation to weaning of litter, litter
size or piglet weight. Litter gain and sow
feed intake was decreased at peak lactation
when 10% of cereals were substituted with
sugar beet pulp.
10% Krogh et al.,
2017
Pigs, gestating
sows (Belgian
landrace)
70% of small-
grain cereals
(100% of
wheat and
4,5% of
barley)
Simultaneously, the proportion of
soybean meal was increased by
79%. Isonitrogenous diets.
The substitution of cereals with sugar beet
pulp had no impact on sow body weight or
body weight gain, backfat thickness, feed
intake, amount of piglets born at least in
short-term. Ammonia emissions were
decreased (-27%) and methane emissions
increased (+98%) when cereals were
substituted with sugar beet pulp.
70% Philippe et al.,
2015
Pigs, gestating
sows
64% of barley Simultaneously, the proportion of
soybean meal was increased from
50 to 120 g/kg
The substitution of cereals with sugar beet
pulp increased feed intake (+3,1% during
pregnancy and +5,4% during lactation) and
decreased the weight of piglets at birth (-
9,3%), but had no impact on litter size at
birth or at weaning or weight of piglets at
weaning
64% Danielsen &
Vestergaard,
2001
Pigs, fattening
(Piéttrain x
Belgian
landrace)
48% of small-
grain cereal
(71% of wheat
Isonitrogenous diets.
Simultaneously, the proportion of
soybean meal was increased by
32%.
The substitution of cereals with sugar beet
pulp decreased the final body weight (-
7,3%), carcass weight (-11%) and average
daily gain (-10%) of fattening pigs, but it
<48% Philippe et al.,
2015
23
and 0% of
barley)
had no impact on feed intake. Ammonia
emissions were decreased (-48%) and
methane emissions increased (+39%) when
cereals were substituted with sugar beet
pulp.
Pigs, weaned
(Duroc x large
white/landrace
)
11 to 43% of
wheat in
phase 1, 10 to
40% of wheat
in phase 2
Simultaneously, the proportion of
canola oil was increased from 5
to 50 g/kg DM in both growth
phases and dietary CP
concentration was decreased
6,8% in phase 1 and 7,1% in
phase 2, dietary starch
concentration was decreased
The substitution of cereals with sugar beet
pulp decreased linearly the digestibility of
DM, gross energy and CP and the energy
content of the diets in growth phase 1. In
growth phase 2, quadratic responses on DM
and gross energy digestibility were reported,
with highest levels on low sugar beet
inclusion levels (60 g/kg diet). The
substitution of cereals with sugar beet pulp
decreased linearly feed intake (up to -5,6%)
and ADG (up to -8,1%). The lowest
inclusion level (60 g/kg diet) had no effect
on growth.
11% Wang et al.,
2016
Pigs, weaned
piglets, BW
5,8 kg, 21d of
age
5% or 11% of
corn
Isonitrogenous and isocaloric
diets
The substitution of corn with sugar beet
pulp decreased feed intake (-9,8%) and
ADG (-14%) at both substitution rates in
optimum hygienic conditions, but no
differences were reported on poor hygienic
conditions.
<5% Berrocoso et
al., 2015
Poultry,
growing egg-
laying pullets
2% or 4% of
cereal (mix of
barley, corn
and wheat)
Simultaneously, the proportion of
soybean meal was decreased by
0% to 4% depending on growth
stage
The substitution of cereals with sugar beet
pulp (4%) decreased average daily gain (-
4,2%) and resulted in poorer FCR (+4,4%),
these negative effects started to take place
after the age of 5 weeks.
2% Guzmán et al.,
2015

24
Poultry,
broilers (Ross
308)
18 to 55% of
cereals (mix
of maize and
wheat)
Diets were formulated to have
energy as the first limiting
nutrient resource. Slightly
decreasing CP concentration with
increasing sugar beet pulp dose.
Quadratic response on feed intake and ADG
with highest levels on small doses of sugar
beet pulp (150 g/kg diet). FCR was linearly
impaired with sugar beet dose (up to +42%)
18% Taylor et al.,
2021
Poultry,
broilers (Ross
308)
18% of corn
in started diet,
13% of corn
in grower
diets
Isonitrogenous diets The substitution of corn with sugar beet
pulp decreased OM digestibility (-4,5%),
but this was prevented with enzyme
addition. ADG not reported.
13-18% with
enzyme
addition
Abdel-Daim et
al., 2020
Poultry,
broilers (Ross
308)
up to 7,5% of
rice
Slightly decreasing CP
concentration with increasing
sugar beet pulp dose.
No effect on feed intake or ADG from 1 to
18d of age. Quadratic response on FCR with
lowest levels on low-moderate doses of
sugar beet pulp (25-50 g/kg)
5% Jiménez-
Moreno et al.,
2013
Molasses Dairy cows,
(Brown
swiss), 182
days in milk,
milk yield
21kg/d
17% of cereal
(wheat)
Forage:concentrate ratio 50:50,
CP concentration was increased
from 144 to 151 g/kg DM
No impact on feed intake, milk yield or milk
fat or protein concentration
17% Hindrichsen et
al., 2006
Dairy cows,
milk yield 18-
19 kg/d
30% of barley Forage:concentrate ratio 50:50 No impact on OM intake, milk yield or milk
fat or protein concentration
30% Murphy et al.,
Dairy cows,
41 days in
milk, milk
yield 23-24
kg/d
33% of barley Forage:concentrate ratio 58:42 to
56:44
No impact on feed intake or milk fat or
protein concentration. The substitution of
barley with molasses decreased milk yield.
<33% Huhtanen,
1987

25
Beef cattle,
growing bulls,
BW 268 kg
11% or 23%
of barley and
molassed
sugar beet
pulp (1:1)
No impact on feed intake and final BW, the
substitution of barley and sugar beet pulp
decreased ADG (-9,6%) and impaired FCR
(+1%)
<11% Huhtanen &
Hissa, 1996
Pigs A review 5-10% Mordenti et
al., 2021
Wheat
bran
Lactating
dairy cows,
47-57 days in
milk
50% and
100% of
barley
Forage:concentrate ratio 58:42 to
60:40
No impact on feed intake, milk fat or protein
concentration or liveweight of cows. The
substitution of barley with wheat bran
linearly decreased milk yield (-6,0%).
50% Huhtanen,
1991
Beef cattle,
heifers
(Angus), BW
584 kg
22% to 84%
of barley
Isonitrogenous diets No impact on feed intake, the substitution of
barley with wheat bran decreased linearly
the digestibility of DM (up to -7,0%) and
OM (-6,9%). Quadratic responses on NDF,
ADF and gross energy digestibility with
lowest levels on moderate doses of wheat
bran. No impact on apparent N retention.
ADG not reported.
Friedt et al.,
2014
Beef cattle,
steers, BW
335 kg, 22
months of age
100% of corn CP concentration was increased
from 126,6 to 131 g/kg DM,
steers were grown until reached
the same BW
No impact on feed intake, the substitution of
corn decreased ADG (-18%) and impaired
FCR (+19%).
<100% Freitas et al.,
2013
Pigs, weaned
piglets, BW
8,9 kg
16% of maize
and 25% of
dehulled
soybean meal
Isonitrogenous and isocaloric
diets
No impact on feed intake and ADG. 16% Yu et al., 2016
Poultry,
broilers
35-39% of
corn
CP concentration was decreased
from 22 to 19%
No impact on ADG, FCR or carcass %. 35-39% Ali et al., 2008
26
depending on
growth phase
Poultry,
broilers
15-21% of
corn (grain
and starch)
depending on
growth phase
CP concentration was decreased
from 22,1 to 21,2% on starter and
20,0 to 19,4% on grower and
increased from 18,1 to 19,0% on
finisher diets
No impact on feed consumption or ADG.
The use of wheat bran during the whole
production period resulted in similar FCR as
in control, whereas the temporal use of
wheat bran during starter period improved
FCR (-15%)
15-21% Li et al., 2019
Poultry,
broilers
19% or 37%
of cereals
(mix of barley
and wheat
starch)
CP concentration was increased
with wheat bran from 157 to 171
and 184 g/kg DM
The substitution of cereals with wheat bran
increased feed intake (up to +49%), final
weight (+29%). The higher substitution rate
resulted in poorer FCR than control and
lower substitution rate (+11%)
19% Jørgensen et
al., 1996
Wheat
bran, oat
hulls and
green grass
meal
Pigs, gestating
sows
53% of barley Concentration of green grass
meal 150 g/kg, wheat bran 150
g/kg and oat hulls 200 g/kg in
diet. Simultaneously, the
proportion of soybean meal was
decreased from 50 to 30 g/kg
The substitution of cereals with sugar beet
pulp increased feed intake during pregnancy
(+31%), but had no impact on the weight of
piglets at birth, litter size at birth or at
weaning or weight of piglets at weaning
53% Danielsen &
Vestergaard,
2001
Oat hulls Dairy cows,
(Brown
swiss), 182
days in milk,
milk yield
21kg/d
57% of cereal
(wheat)
Simultaneously, quality of cereals
was changed from wheat (223
g/kg DM on control) to oats (97
g/kg DM on oat hulls diet),
forage:concentrate ratio 50:50,
CP concentration was slightly
decreased from 144 to 139 g/kg
DM
No impact on feed intake, no statistically
significant impact on milk yield or milk fat
or protein concentration, although milk yield
numerically decreased (-9,6%)
<57% Hindrichsen et
al., 2006
Pigs, weaned
piglets, BW
8,9 kg
11% of maize
and 21% of
Isonitrogenous and isocaloric
diets
No statistically significant impact on feed
intake and ADG, although numerically
decreased (-5,3% and -8,6%)
<11% Yu et al., 2016

27
dehulled
soybean meal
Pigs, weaned
piglets, BW
5,8 kg, 21d of
age
7% or 14% of
corn
Isonitrogenous and isocaloric
diets
The substitution of corn with oat hulls
decreased feed intake (-10%) and ADG (-
12%) at both substitution rates in optimum
hygienic conditions, but no differences were
reported on poor hygienic conditions
<7% Berrocoso et
al., 2015
Pigs, growing
barrows, BW
25kg
18% of corn Isonitrogenous and isoenergetic
diets
The substitution of corn with oat hulls
decreased feed intake (-0,5%), ADG (-8,8%)
and final BW (-5,0%)
<18% Ndou et al.,
2017
Poultry,
broilers (Ross
308)
18 to 55% of
cereals (mix
of maize and
wheat)
Diets were formulated to have
energy as the first limiting
nutrient resource. Slightly
decreasing CP concentration with
increasing oat hulls dose.
Quadratic response on feed intake and ADG
with highest levels on moderate doses of oat
hulls (300 g/kg diet). FCR was linearly
impaired with oat hulls dose (up to +30%).
37% Taylor et al.,
2021
Poultry,
broilers (Ross
308)
up to 7,5% of
rice
Slightly decreasing CP
concentration with increasing oat
hulls dose.
No effect on feed intake or ADG from 1 to
18d of age. Quadratic response on FCR with
best performance on moderate doses of oat
hulls (25-50 g/kg).
5% Jiménez-
Moreno et al.,
2013
Straw Pigs, weaned
piglets, BW
5,8 kg, 21d of
age
7% or 14% of
corn
Isonitrogenous and isocaloric
diets
The substitution of corn with straw
decreased feed intake (-9,5%) and ADG (-
13%) at both substitution rates in optimum
hygienic conditions, but no differences were
reported on poor hygienic conditions.
<7% Berroccoso et
al., 2015
Poultry,
growing egg-
laying pullets
2% or 4% of
cereal (mix of
barley, corn
and wheat)
Simultaneously, the proportion of
soybean meal was decreased by
0% to 4% depending on growth
stage
The substitution of cereals with straw (4%)
resulted in poorer FCR (2,7%), these
negative effects started to take place after
the age of 10 weeks.
2% Guzmán et al.,
2015
28
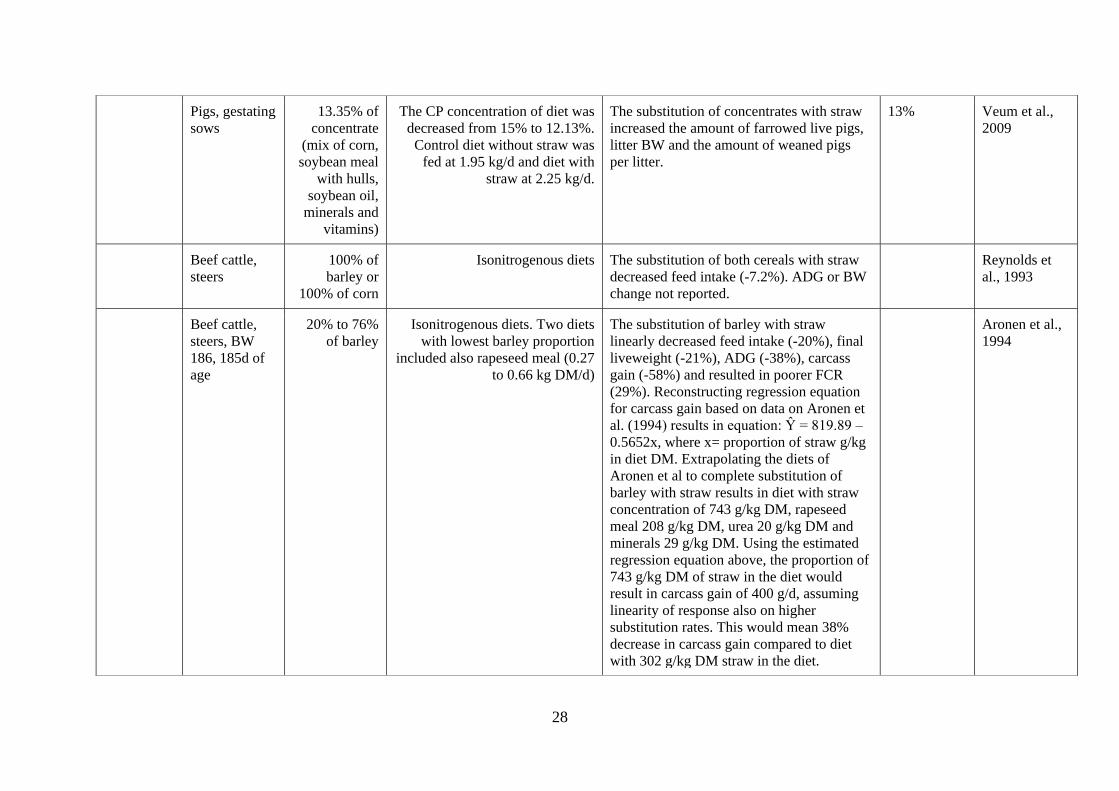
Pigs, gestating
sows
13.35% of
concentrate
(mix of corn,
soybean meal
with hulls,
soybean oil,
minerals and
vitamins)
The CP concentration of diet was
decreased from 15% to 12.13%.
Control diet without straw was
fed at 1.95 kg/d and diet with
straw at 2.25 kg/d.
The substitution of concentrates with straw
increased the amount of farrowed live pigs,
litter BW and the amount of weaned pigs
per litter.
13% Veum et al.,
2009
Beef cattle,
steers
100% of
barley or
100% of corn
Isonitrogenous diets The substitution of both cereals with straw
decreased feed intake (-7.2%). ADG or BW
change not reported.
Reynolds et
al., 1993
Beef cattle,
steers, BW
186, 185d of
age
20% to 76%
of barley
Isonitrogenous diets. Two diets
with lowest barley proportion
included also rapeseed meal (0.27
to 0.66 kg DM/d)
The substitution of barley with straw
linearly decreased feed intake (-20%), final
liveweight (-21%), ADG (-38%), carcass
gain (-58%) and resulted in poorer FCR
(29%). Reconstructing regression equation
for carcass gain based on data on Aronen et
al. (1994) results in equation: Ŷ = 819.89 –
0.5652x, where x= proportion of straw g/kg
in diet DM. Extrapolating the diets of
Aronen et al to complete substitution of
barley with straw results in diet with straw
concentration of 743 g/kg DM, rapeseed
meal 208 g/kg DM, urea 20 g/kg DM and
minerals 29 g/kg DM. Using the estimated
regression equation above, the proportion of
743 g/kg DM of straw in the diet would
result in carcass gain of 400 g/d, assuming
linearity of response also on higher
substitution rates. This would mean 38%
decrease in carcass gain compared to diet
with 302 g/kg DM straw in the diet.
Aronen et al.,
1994
29
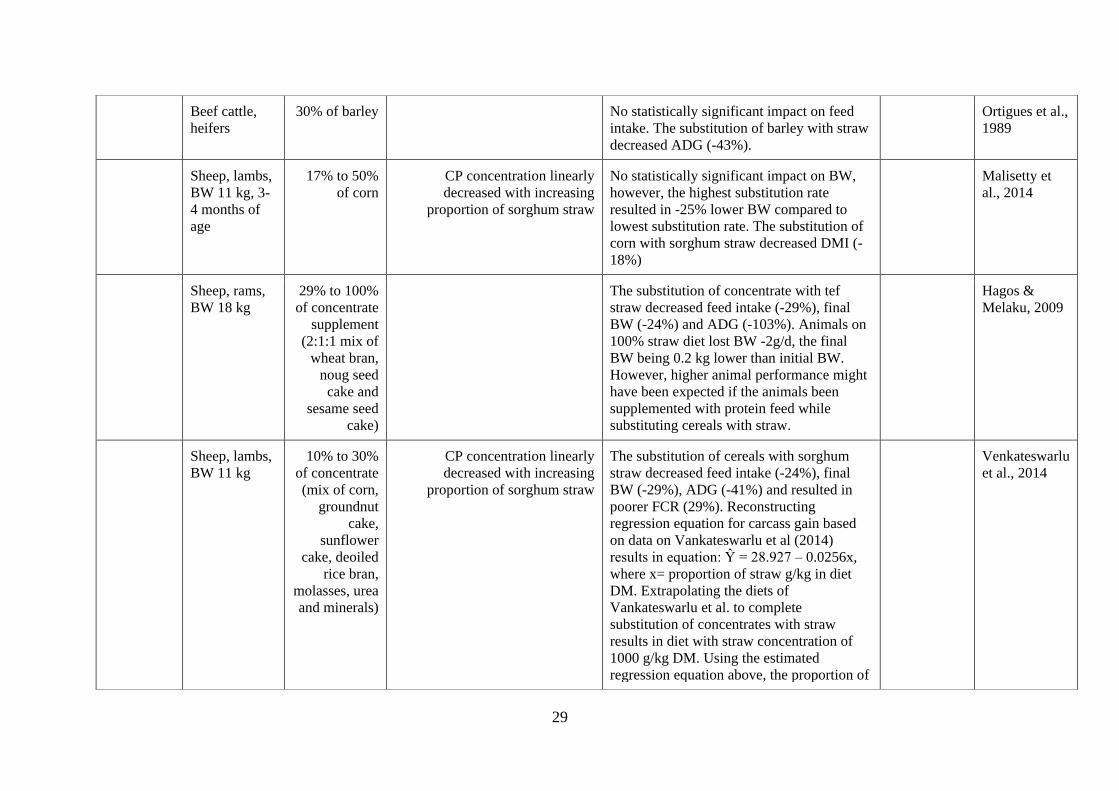
Beef cattle,
heifers
30% of barley No statistically significant impact on feed
intake. The substitution of barley with straw
decreased ADG (-43%).
Ortigues et al.,
1989
Sheep, lambs,
BW 11 kg, 3-
4 months of
age
17% to 50%
of corn
CP concentration linearly
decreased with increasing
proportion of sorghum straw
No statistically significant impact on BW,
however, the highest substitution rate
resulted in -25% lower BW compared to
lowest substitution rate. The substitution of
corn with sorghum straw decreased DMI (-
18%)
Malisetty et
al., 2014
Sheep, rams,
BW 18 kg
29% to 100%
of concentrate
supplement
(2:1:1 mix of
wheat bran,
noug seed
cake and
sesame seed
cake)
The substitution of concentrate with tef
straw decreased feed intake (-29%), final
BW (-24%) and ADG (-103%). Animals on
100% straw diet lost BW -2g/d, the final
BW being 0.2 kg lower than initial BW.
However, higher animal performance might
have been expected if the animals been
supplemented with protein feed while
substituting cereals with straw.
Hagos &
Melaku, 2009
Sheep, lambs,
BW 11 kg
10% to 30%
of concentrate
(mix of corn,
groundnut
cake,
sunflower
cake, deoiled
rice bran,
molasses, urea
and minerals)
CP concentration linearly
decreased with increasing
proportion of sorghum straw
The substitution of cereals with sorghum
straw decreased feed intake (-24%), final
BW (-29%), ADG (-41%) and resulted in
poorer FCR (29%). Reconstructing
regression equation for carcass gain based
on data on Vankateswarlu et al (2014)
results in equation: Ŷ = 28.927 – 0.0256x,
where x= proportion of straw g/kg in diet
DM. Extrapolating the diets of
Vankateswarlu et al. to complete
substitution of concentrates with straw
results in diet with straw concentration of
1000 g/kg DM. Using the estimated
regression equation above, the proportion of
Venkateswarlu
et al., 2014
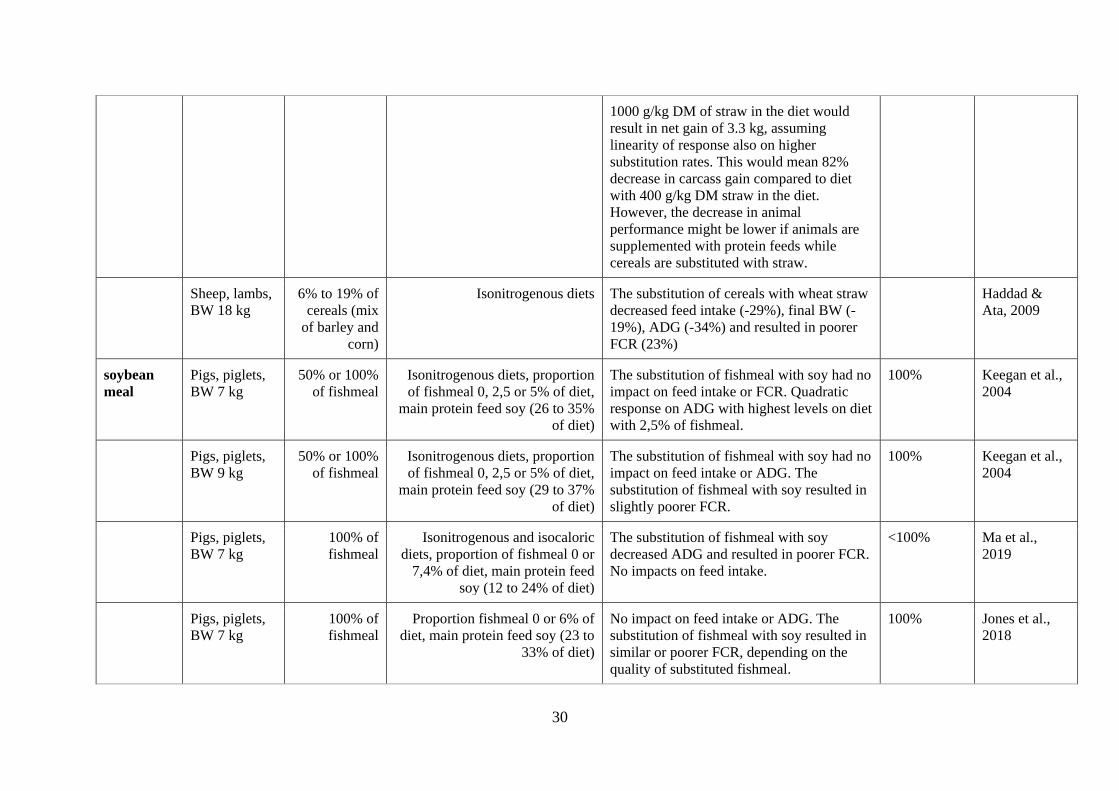
30
1000 g/kg DM of straw in the diet would
result in net gain of 3.3 kg, assuming
linearity of response also on higher
substitution rates. This would mean 82%
decrease in carcass gain compared to diet
with 400 g/kg DM straw in the diet.
However, the decrease in animal
performance might be lower if animals are
supplemented with protein feeds while
cereals are substituted with straw.
Sheep, lambs,
BW 18 kg
6% to 19% of
cereals (mix
of barley and
corn)
Isonitrogenous diets The substitution of cereals with wheat straw
decreased feed intake (-29%), final BW (-
19%), ADG (-34%) and resulted in poorer
FCR (23%)
Haddad &
Ata, 2009
soybean
meal
Pigs, piglets,
BW 7 kg
50% or 100%
of fishmeal
Isonitrogenous diets, proportion
of fishmeal 0, 2,5 or 5% of diet,
main protein feed soy (26 to 35%
of diet)
The substitution of fishmeal with soy had no
impact on feed intake or FCR. Quadratic
response on ADG with highest levels on diet
with 2,5% of fishmeal.
100% Keegan et al.,
2004
Pigs, piglets,
BW 9 kg
50% or 100%
of fishmeal
Isonitrogenous diets, proportion
of fishmeal 0, 2,5 or 5% of diet,
main protein feed soy (29 to 37%
of diet)
The substitution of fishmeal with soy had no
impact on feed intake or ADG. The
substitution of fishmeal with soy resulted in
slightly poorer FCR.
100% Keegan et al.,
2004
Pigs, piglets,
BW 7 kg
100% of
fishmeal
Isonitrogenous and isocaloric
diets, proportion of fishmeal 0 or
7,4% of diet, main protein feed
soy (12 to 24% of diet)
The substitution of fishmeal with soy
decreased ADG and resulted in poorer FCR.
No impacts on feed intake.
<100% Ma et al.,
2019
Pigs, piglets,
BW 7 kg
100% of
fishmeal
Proportion fishmeal 0 or 6% of
diet, main protein feed soy (23 to
33% of diet)
No impact on feed intake or ADG. The
substitution of fishmeal with soy resulted in
similar or poorer FCR, depending on the
quality of substituted fishmeal.
100% Jones et al.,
2018
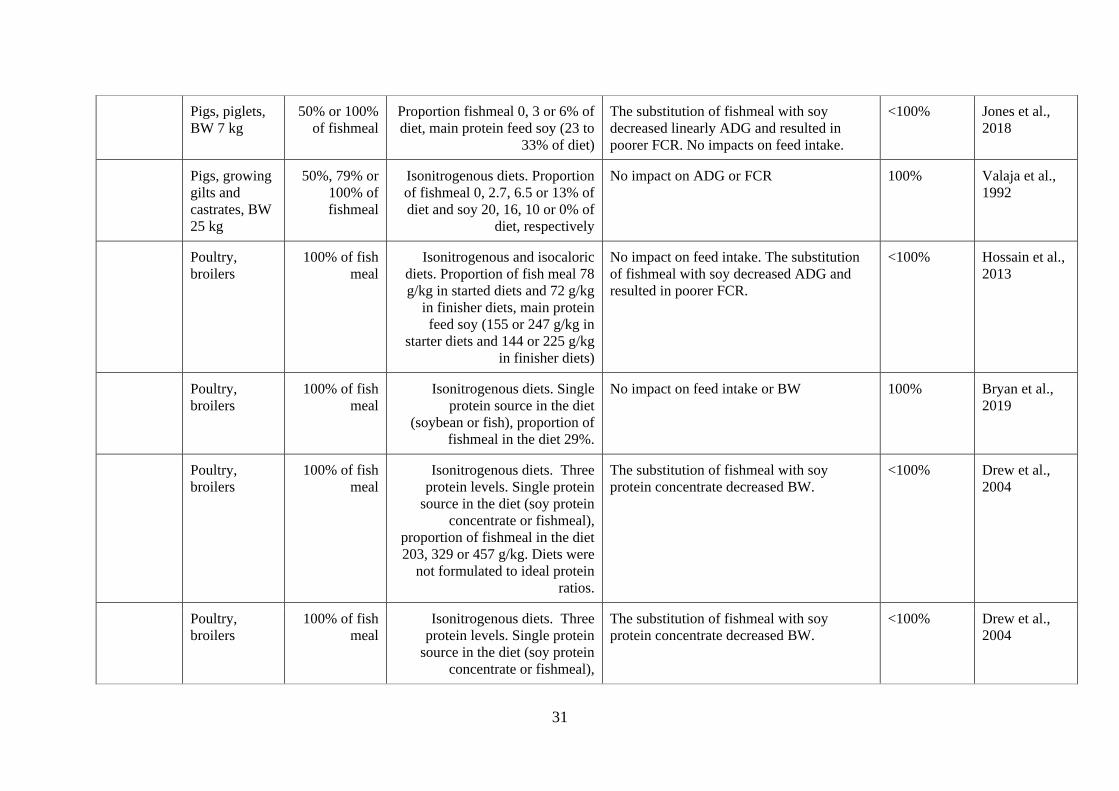
31
Pigs, piglets,
BW 7 kg
50% or 100%
of fishmeal
Proportion fishmeal 0, 3 or 6% of
diet, main protein feed soy (23 to
33% of diet)
The substitution of fishmeal with soy
decreased linearly ADG and resulted in
poorer FCR. No impacts on feed intake.
<100% Jones et al.,
2018
Pigs, growing
gilts and
castrates, BW
25 kg
50%, 79% or
100% of
fishmeal
Isonitrogenous diets. Proportion
of fishmeal 0, 2.7, 6.5 or 13% of
diet and soy 20, 16, 10 or 0% of
diet, respectively
No impact on ADG or FCR 100% Valaja et al.,
1992
Poultry,
broilers
100% of fish
meal
Isonitrogenous and isocaloric
diets. Proportion of fish meal 78
g/kg in started diets and 72 g/kg
in finisher diets, main protein
feed soy (155 or 247 g/kg in
starter diets and 144 or 225 g/kg
in finisher diets)
No impact on feed intake. The substitution
of fishmeal with soy decreased ADG and
resulted in poorer FCR.
<100% Hossain et al.,
2013
Poultry,
broilers
100% of fish
meal
Isonitrogenous diets. Single
protein source in the diet
(soybean or fish), proportion of
fishmeal in the diet 29%.
No impact on feed intake or BW 100% Bryan et al.,
2019
Poultry,
broilers
100% of fish
meal
Isonitrogenous diets. Three
protein levels. Single protein
source in the diet (soy protein
concentrate or fishmeal),
proportion of fishmeal in the diet
203, 329 or 457 g/kg. Diets were
not formulated to ideal protein
ratios.
The substitution of fishmeal with soy
protein concentrate decreased BW.
<100% Drew et al.,
2004
Poultry,
broilers
100% of fish
meal
Isonitrogenous diets. Three
protein levels. Single protein
source in the diet (soy protein
concentrate or fishmeal),
The substitution of fishmeal with soy
protein concentrate decreased BW.
<100% Drew et al.,
2004

32
proportion of fishmeal in the diet
203 or 457 g/kg. Diets were not
formulated to ideal protein ratios.
Poultry,
broilers
100% of fish
meal
Isonitrogenous and isocaloric
diets. Main protein feed soy (35%
or 31% in starter diets, 32 or 28%
in grower diets and 26 or 22% in
finisher diets)
No impact on finishing BW, ADG or FCR 100% Hess et al.,
2009
Poultry,
broilers
25, 50, 75 or
100% of fish
meal
Isonitrogenous and isocaloric
diets. Maximum fishmeal
proportion in the diet 25%.
The impacts on ADG and FCR depend on
the quality of fishmeal. The replacement of
50% to 100% of fishmeal with soybean
meal resulted in highest ADG and most
efficient FCR.
50-100% Waldroup et
al., 1965
Canola
meal,
rapeseed
meal
Poultry,
broilers
100% of fish
meal
Isonitrogenous and isocaloric
diets. Proportion of fish meal 84
g/kg in started diets and 70 g/kg
in finisher, main protein feed
canola meal (168 or 281 g/kg in
starter diets and 140 or 243 g/kg
in finisher diets)
No impact on feed intake. The substitution
of fishmeal with canola decreased ADG and
resulted in poorer FCR.
<100% Hossain et al.,
2013
Poultry,
broilers
100% of fish
meal
Isonitrogenous diets. Single
protein source in the diet (canola
or fish), proportion of fishmeal in
the diet 29%.
No impact on BW, the substitution of
fishmeal with soy increased feed intake.
100% Bryan et al.,
2019
Fish waste
silage,
ensiled fish
by-
products
Poultry,
broilers
12% to 47%
of soybean
meal in starter
phase,
Isonitrogenous and isoenergetic
diets. Simultaneously, the
proportion of corn was increased
from 501 g/kg to 629 g/kg in
starter phase, from 571 to 697
The substitution of soybean meal with fish
waste silage increased BW (+7,5%), weight
gain (+7,7%) and decreased feed conversion
ratio (-3,9%)
47-62% Shabani et al.,
2021

33
14% to 56%
in grower
phase,
16% to 62%
in finisher
phase
g/kg in grower phase and 609 to
735 g/kg in finisher phase
Poultry,
broilers
25% to 75%
of soybean
meal
Isonitrogenous diets. No impact on feed intake or FCR. Fish
waste silage did not decrease average daily
gain compared to control, and diets with 10
and 20% fish waste silage in DM resulted in
highest ADG.
75% Al-Marzooqi
et al., 2010
Poultry,
broilers
8% to 24% of
soybean meal
Isonitrogenous diets, only 14d
long experiment
No statistically significant impact on feed
intake, ADG or FCR, but highest
substitution rate resulted in numerically
poorest FCR (+8,9% compared to control)
24% Vizcarra-
Magaña et al.,
1999
Poultry,
broilers
15% or 31%
of fishmeal
Isonitrogenous and isocaloric
diets
The substitution of fishmeal with fish silage
resulted in similar or higher feed intake,
ADG and FCR as fishmeal
31% Espe et al.,
1992
Poultry,
broilers
20% or 40%
of fishmeal
Isonitrogenous and isocaloric
diets. In addition, the
supplementation of crystalline
amino acids was studied
The substitution of fishmeal with fish silage
resulted in similar or higher feed intake,
ADG and FCR as fishmeal. The
performance was not further improved by
amino acid supplementation.
40% Espe et al.,
1992
Poultry,
broilers
6% to 39% of
fishmeal
Isonitrogenous and isocaloric
diets
No impacts on feed intake, average daily
gain or feed conversion ratio
39% Espe et al.,
1992
Pigs, BW 45
kg
25% to 100%
of fish meal
Isonitrogenous and isocaloric
diets.
The substitution of fish meal with ensiled
fish by-products linearly increased feed
intake (up to +4,9%), final liveweight (up to
100% Thi Thuy et
al., 2011
34
+5,2%), ADG (up to +11%) and improved
feed conversion ratio (up to -13%)
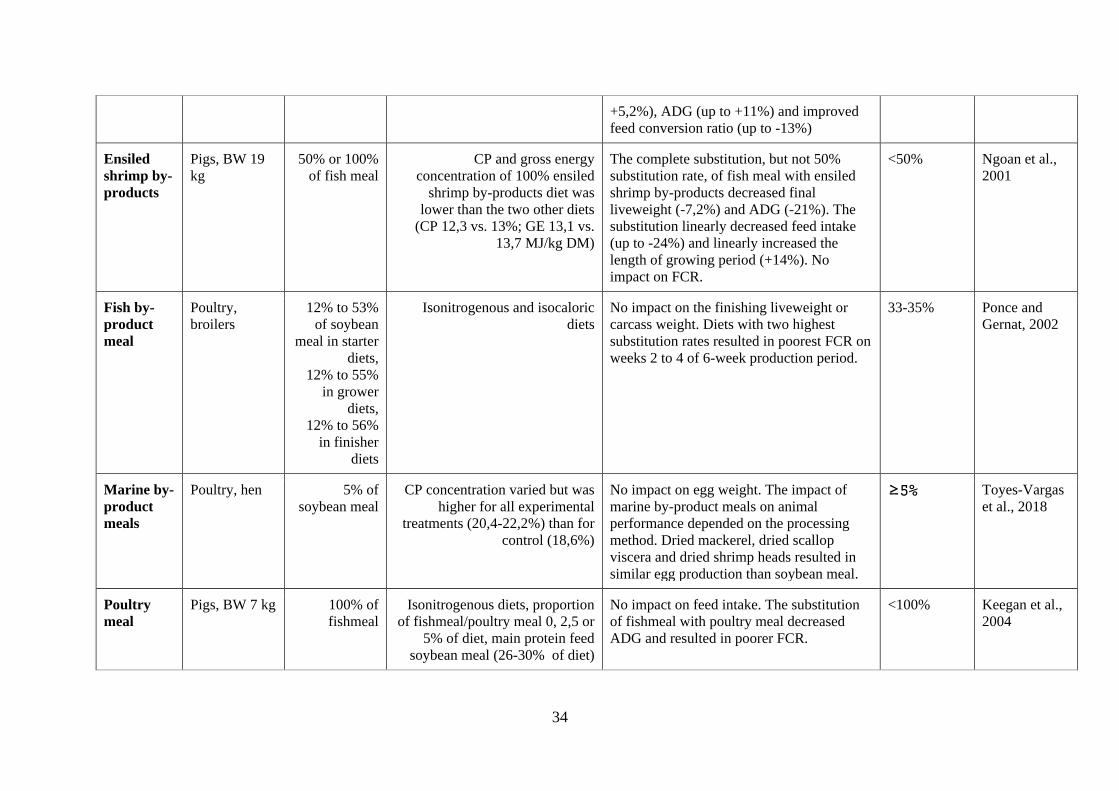
Ensiled
shrimp by-
products
Pigs, BW 19
kg
50% or 100%
of fish meal
CP and gross energy
concentration of 100% ensiled
shrimp by-products diet was
lower than the two other diets
(CP 12,3 vs. 13%; GE 13,1 vs.
13,7 MJ/kg DM)
The complete substitution, but not 50%
substitution rate, of fish meal with ensiled
shrimp by-products decreased final
liveweight (-7,2%) and ADG (-21%). The
substitution linearly decreased feed intake
(up to -24%) and linearly increased the
length of growing period (+14%). No
impact on FCR.
<50% Ngoan et al.,
2001
Fish by-
product
meal
Poultry,
broilers
12% to 53%
of soybean
meal in starter
diets,
12% to 55%
in grower
diets,
12% to 56%
in finisher
diets
Isonitrogenous and isocaloric
diets
No impact on the finishing liveweight or
carcass weight. Diets with two highest
substitution rates resulted in poorest FCR on
weeks 2 to 4 of 6-week production period.
33-35% Ponce and
Gernat, 2002
Marine by-
product
meals
Poultry, hen 5% of
soybean meal
CP concentration varied but was
higher for all experimental
treatments (20,4-22,2%) than for
control (18,6%)
No impact on egg weight. The impact of
marine by-product meals on animal
performance depended on the processing
method. Dried mackerel, dried scallop
viscera and dried shrimp heads resulted in
similar egg production than soybean meal.
≥5% Toyes-Vargas
et al., 2018
Poultry
meal
Pigs, BW 7 kg 100% of
fishmeal
Isonitrogenous diets, proportion
of fishmeal/poultry meal 0, 2,5 or
5% of diet, main protein feed
soybean meal (26-30% of diet)
No impact on feed intake. The substitution
of fishmeal with poultry meal decreased
ADG and resulted in poorer FCR.
<100% Keegan et al.,
2004

35
Pigs, BW 9 kg 100% of
fishmeal
Isonitrogenous diets, proportion
of fishmeal/poultry meal 0, 2,5 or
5% of diet, main protein feed
soybean meal (29-33% of diet)
No impact on feed intake, ADG or FCR. 100% Keegan et al.,
2004
Meat and
bone meal
Poultry,
broilers
6% to 15% of
soybean meal
Isonitrogenous diets.
Simultaneously, the proportion of
corn was increased from 59% to
62%.
No impact on BW, weight gain or FCR. 15% Bozkurt et al.,
2004
Poultry,
broilers
9 to 17% of
soybean meal,
depending on
growth phase
Isonitrogenous and isoenergetic
diets. Simultaneously, the
proportion of corn was increased
from 61/63/59 to 65/67/61%
No impact on DMI, liveweight or FCR. 9-17% Caires et al.,
2010
Poultry,
broiler
27% to 53%
of soybean
meal in starter
diet, 44% to
82% in
finisher diet
Isonitrogenous and isocaloric
diets. Simultaneously, the
proportion of corn was increased
from 638/742 to 679/771 g/kg
The substitution of soybean meal decreased
weight gain (-13%) and impaired FCR
(+16%)
<27-82% Liu et al.,
2016
Poultry,
broiler
High-ash
MBM
14% to 23%
of soybean
meal in starter
diets,
15% to 24%
in grower
diets,
20% to 32%
in grower
diets
Simultaneously, the proportion of
corn was changed and CP
concentration slightly increased
No impact on BW or FCR. 14-32% for
high-ash
MBM
11-56% for
low-ash
MBM
Drewyor &
Waldroup,
2000

36
Low-ash
MBM
22% to 39%
of soybean
meal in starter
diets, 23% to
43% in
grower diets,
31% to 56%
in grower
diets
Blood meal Poultry,
broilers
19% to 36%
of soybean
meal,
depending on
growth phase
Isonitrogenous and isocaloric
diets. Simultaneously, the
proportion of corn was increased
from 61/63/59 to 62/68/67%
No impact on feed intake or FCR, the
substitution of soybean meal with blood
meal decreased final weight (-8,3%)
<19-36% Caires et al.,
2010
Poultry,
broilers
5% or 10% of
soybean meal
CP concentration was increased
and energy concentration
decreased with increasing
proportion of blood meal
No impact on feed intake or weight gain.
The substitution of soybean meal with blood
meal improved FCR (-4,6%).
10% Auh et al.,
2010
Poultry,
broilers
5% or 10% of
commercial
feed
supplement
(composition
not
mentioned)
Isonitrogenous and isocaloric
diets
The substitution of commercial feed
supplement decreased feed intake (-21%)
and weight gain (-43%) and resulted in
poorer FCR (+84%).
<5% Auh et al.,
2010
Pigs, piglets,
age 17d
17% to 49%
of soybean
meal
No impact on feed intake. The substitution
of soybean meal increased SDG, final
weight and improved FCR.
49% DeRouchey et
al., 2002

37
Blood meal
and bone
flour
Pigs, BW 18
kg
25% to 100%
of soybean
meal
Isonitrogenous and isocaloric
diets. In addition, the
supplementation with crystalline
amino acids (Ile) was studied.
Moderate substitution rate (5,9% DM)
resulted in best FCR. Complete replacement
of soybean meal resulted in decreased feed
intake and ADG compared to soy.
Supplementation of Ile improved animal
performance with 100% substitution rate,
but did not perform as well as soy.
50% King &
Campbell,
1978
Feather
meal
Pigs, BW 23
kg
13% to 41%
of soybean
meal in
grower phase,
17% to 48%
in finisher
phase
CP concentration was increased
with increasing proportion of
feather meal
Highest inclusion rate resulted in lower feed
intake, finishing BW and ADG than diet
with inclusion rate of 0 or 4% DM. No
impact on FCR.
34-43% van Heugten
& van
Kempen, 2002
Pigs, piglets,
age 28d
12% of
soybean meal
Isonitrogenous and isocaloric
diets
The substitution of soybean meal with
feather meal increased feed intake (+6,7%),
ADG (+15%) and final BW (+8,1%). No
impact on FCR.
12% Pan et al.,
2016
Pigs, BW
50kg
100% of
soybean meal
Isonitrogenous and isocaloric
diets. In addition, the
supplementation of feather meal
diets with crystalline amino acids
(Lys+Trp) was tested.
The substitution of soybean meal with
feather meal decreased feed intake (-7,7%),
ADG (-28%) and resulted in poorer FCR
(+23%)
<100% Brotzge et al.,
2014
DM dry matter, OM organic matter, NDF neutral detergent fibre, ADF acid detergent fibre, CP crude protein, ECM energy corrected
milk yield, BW body weight, ADG average daily gain, FCR feed conversion ratio
38
Supplementary references
Abdel-Daim, A. S. A., Tawfeek, S. S., El-Nahass, E. S., Hassan, A. H. A., & Youssef, I. M. I.
(2020). Effect of feeding potato peels and sugar beet pulp with or without enzyme on nutrient
digestibility, intestinal morphology, and meat quality of broiler chickens. Poultry Science
Journal, 8(2), 189-199.
Al-Marzooqi, W., Al-Farsi, M. A., Kadim, I. T., Mahgoub, O., & Goddard, J. S. (2010). The
effect of feeding different levels of sardine fish silage on broiler performance, meat quality
and sensory characteristics under closed and open-sided housing systems. Asian-Australasian
Journal of Animal Sciences, 23(12), 1614-1625.
Ali, M. N., Abou, M. S., & El-kloub, M. (2008). Incorporation of wheat bran in broiler diets.
International Journal of Poultry Science, 7(1), 6-13.
Aronen, I., Lampila, M., & Hepola, H. (1994). Comparison of diets based on grass silage, hay
or oat straw supplemented with four levels of concentrates in the feeding of growing Ayrshire
bulls. Agricultural and Food Science, 3(1), 15-26.
Auh, J., Namgung, N., Shin, K., Park, S., & Paik, I. (2010). Effects of supplementary blood
meal on the content of carnosine and anserine in broiler meat. The journal of poultry science,
47(4), 302-309.
Berrocoso, J. D., Menoyo, D., Guzmán, P., Saldaña, B., Cámara, L., & Mateos, G. G. (2015).
Effects of fiber inclusion on growth performance and nutrient digestibility of piglets reared
under optimal or poor hygienic conditions. Journal of animal science, 93(8), 3919-3931.
Bozkurt, M., Basmacioglu, H., & Ergül, M. (2004). Effect of dietary concentration meat and
bone meal on broiler chickens performance. International Journal of Poultry Science, 3(11),
719-723.
Brotzge, S. D., Chiba, L. I., Adhikari, C. K., Stein, H. H., Rodning, S. P., & Welles, E. G.
(2014). Complete replacement of soybean meal in pig diets with hydrolyzed feather meal
with blood by amino acid supplementation based on standardized lleal amino acid
digestibility. Livestock Science, 163, 85-93.
Bryan, D. D. S. L., Abbott, D. A., Van Kessel, A. G., & Classen, H. L. (2019). In vivo
digestion characteristics of protein sources fed to broilers. Poultry science, 98(8), 3313-3325.
Caires, C. M. I., Fernandes, E. A., Fagundes, N. S., Carvalho, A. P., Maciel, M. P., &
Oliveira, B. R. (2010). The use of animal byproducts in broiler feeds: use of animal co-
products in broilers diets. Brazilian Journal of Poultry Science, 12, 41-46.
Campos, I., Matos, E., Marques, A., Valente, L.M.P., 2017. Hydrolyzed feather meal as a
partial fishmeal replacement in diets for European seabass ( Dicentrarchus labrax ) juveniles.
Aquaculture 476, 152–159. https://doi.org/10.1016/j.aquaculture.2017.04.024

39
Cashion, T., Le Manach, F., Zeller, D., Pauly, D., 2017. Most fish destined for fishmeal
production are food-grade fish. Fish Fish 18, 837–844. https://doi.org/10.1111/faf.12209
Chester-Jones, H., Stern, M. D., Metwally, H. M., Linn, J. G., & Ziegler, D. M. (1991).
Effects of dietary protein-energy interrelationships on Holstein steer performance and
ruminal bacterial fermentation in continuous culture. Journal of animal science, 69(12),
4956-4966.
Danielsen, V., & Vestergaard, E. M. (2001). Dietary fibre for pregnant sows: effect on
performance and behaviour. Animal Feed Science and Technology, 90(1-2), 71-80.
Dawood, M.A.O., Koshio, S., 2019. Application of fermentation strategy in aquafeed for
sustainable aquaculture. Reviews in Aquaculture 16.
De Silva, S.S., Turchini, G.M. (2009). Use of wild fish and other aquatic organisms as feed in
aquaculture – a review of practices and implications in the Asia-Pacific.In M.R. Hasan and
M. Halwart (eds). Fish as feed inputs for aquaculture: practices, sustainability and
implications. FAO Fisheries and Aquaculture Technical Paper. No. 518. Rome, FAO. pp. 63–
127.
DeRouchey, J. M., Tokach, M. D., Nelssen, J. L., Goodband, R. D., Dritz, S. S., Woodworth,
J. C., & James, B. W. (2002). Comparison of spray-dried blood meal and blood cells in diets
for nursery pigs. Journal of animal science, 80(11), 2879-2886.
Drew, M. D., Syed, N. A., Goldade, B. G., Laarveld, B., & Van Kessel, A. G. (2004). Effects
of dietary protein source and level on intestinal populations of Clostridium perfringens in
broiler chickens. Poultry Science, 83(3), 414-420.
Drewyor, M. A., & Waldroup, P. W. (2000). Utilization of high levels of meat and bone meal
in broiler diets. Journal of Applied Poultry Research, 9(2), 131-141.
EC 1069/2009 health rules as regards animal by-products and derived products not intended
for human consumption, (2009). Regulation (EC) No 1069/2009 of the European Parliament
and of the Council laying down health rules as regards animal by-products and derived
products not intended for human consumption and repealing Regulation (EC) No 1774/2002
(Animal by-products Regulation). http://data.europa.eu/eli/reg/2009/1069/2014-01-01
EC 142/2011 Commission regulation (EU) No 142/2011implementing Regulation (EC) No
1069/2009 of the European Parliament and of the Council laying down health rules as regards
animal by-products and derived products not intended for human consumption and
implementing Council Directive 97/78/EC as regards certain samples and items exempt from
veterinary checks at the border under that Directive.
http://data.europa.eu/eli/reg/2011/142/2015-02-23
EFPRA, (2019) Statistical overview of the Animal By-Products Industry in the EU in 2018
(Oral Presentation EFPRA Congress, La Baule, 14.6.2019).
Espe, M., Haaland, H., & Njaa, L. R. (1992). Substitution of fish silage protein and a free
amino acid mixture for fish meal protein in a chicken diet. Journal of the Science of Food and
Agriculture, 58(3), 315-319.

40
FAO. (2020). The state of world fisheries and aquaculture. Sustainability in action. Rome
FAO. (2021). Food and Agriculture Organization of the United Nations (FAO). Food and
agriculture data statistics FAOSTAT. http://www.fao.org/faostat/en/#home Accessed:
24.9.2021Freitas, L. D. S., Brondani, I. L., Segabinazzi, L. R., Restle, J., Alves Filho, D. C.,
Pizzuti, L. A. D., da Silva, V.S. & Rodrigues, L. D. S. (2013). Performance of finishing steers
fed different sources of carbohydrates. Revista Brasileira de Zootecnia, 42(5), 354-362.
Friedt, A. D., McAllister, T. A., He, M. L., Penner, G. B., & McKinnon, J. J. (2014). Effects
of replacing barley grain with graded levels of wheat bran on rumen fermentation, voluntary
intake and nutrient digestion in beef cattle. Canadian Journal of Animal Science, 94(1), 129-
137.
Funge-Smith, S., Lindebo, E., Stables, D. (2005). Asian fisheries today:The production and
use of low value/trash fish from marine fisheries in the Asia-Pacific region. Asian-Pacific
fishery commission, FAO, RAP publication 2005/16
Guzmán, P., Saldaña, B., Kimiaeitalab, M. V., García, J., & Mateos, G. G. (2015). Inclusion
of fiber in diets for brown-egg laying pullets: Effects on growth performance and digestive
tract traits from hatching to 17 weeks of age. Poultry Science, 94(11), 2722-2733.
Haddad, S. G., & Ata, M. A. (2009). Growth performance of lambs fed on diets varying in
concentrate and wheat straw. Small Ruminant Research, 81(2-3), 96-99.
Keegan, T. P., DeRouchey, J. M., Nelssen, J. L., Tokach, M. D., Goodband, R. D., & Dritz,
S. S. (2004). The effects of poultry meal source and ash level on nursery pig performance.
Journal of animal science, 82(9), 2750-2756.
King, R. H., & Campbell, R. G. (1978). Blood meal as a source of protein for grower/finisher
pigs. Animal Feed Science and Technology, 3(2), 191-200.
Hagos, T., & Melaku, S. (2009). Feed intake, digestibility, body weight and carcass
parameters of Afar rams fed tef (Eragrostis tef) straw supplemented with graded levels of
concentrate mix. Tropical Animal Health and Production, 41(4), 599-606.
Hasan, M.R. (2012). Transition from low-value fish to compound feeds in marine cage
farming in Asia. FAO Fisheries and Aquaculture Technical Paper No. 573
Hasan, M.R., New, M.B., Food and Agriculture Organization of the United Nations (Eds.),
2013. On-farm feeding and feed management in aquaculture, FAO fisheries and aquaculture
technical paper. Food and Agriculture Organization of the United Nations, Rome.
Hernández, C., Sanchez-Gutierrez, Y., Hardy, R.W., Benitez-Hernández, A., Domínguez-
Jimenez, P., González-Rodríguez, B., Osuna-Osuna, L., Tortoledo, O., 2014. The potential of
pet-grade poultry by-product meal to replace fish meal in the diet of the juvenile spotted rose
snapper Lutjanus guttatus (Steindachner, 1869). Aquacult Nutr 20, 623–631.
https://doi.org/10.1111/anu.12122
Herrero, M., Havlík, P., Valin, H., Notenbaert, A., Rufino, M. C., Thornton, P. K., ... &
Obersteiner, M. (2013). Biomass use, production, feed efficiencies, and greenhouse gas
emissions from global livestock systems. Proceedings of the National Academy of Sciences,
110(52), 20888-20893.

41
Hess, J. B., Blake, J. P., Garner, D. H., & Chappell, J. A. (2009). Effects of catfish meal
blend inclusion in broiler feeds on live performance and carcass yield attributes. Journal of
Applied Poultry Research, 18(2), 232-236.
Hindrichsen, I. K., Wettstein, H. R., Machmüller, A., Knudsen, K. B., Madsen, J., & Kreuzer,
M. (2006). Digestive and metabolic utilisation of dairy cows supplemented with concentrates
characterised by different carbohydrates. Animal feed science and technology, 126(1-2), 43-
61.
Hossain, M. A., Islam, A. F., & Iji, P. A. (2013). Growth responses, excreta quality, nutrient
digestibility, bone development and meat yield traits of broiler chickens fed vegetable or
animal protein diets. South African Journal of Animal Science, 43(2), 208-218.
Hua, K., Cobcroft, J.M., Cole, A., Condon, K., Jerry, D.R., Mangott, A., Praeger, C., Vucko,
M.J., Zeng, C., Zenger, K., Strugnell, J.M. (2019). The Future of Aquatic Protein:
Implications for Protein Sources in Aquaculture Diets. One Earth 1, 316–329.
Huhtanen, P. (1987). The effect of dietary inclusion of barley, unmolassed sugar beet pulp
and molasses on milk production, digestibility and digesta passage in dairy cows given silage
based diet. Agricultural and Food Science, 59(2), 101-120.
Huhtanen, P. (1991). The response to replacement of barley with wheat bran and treatment of
rapeseed meal in the diets of dairy cows given grass silage ad libitum. Acta Agriculturae
Scandinavica, 41(4), 415-426.
Huhtanen, P., & Hissa, K. (1996). The influence of molasses and yeast culture on the
performance of growing bulls on grass silage-based diet. J. Anim. Feed Sci, 5(3), 201-214.
Jaakkola, S., & Huhtanen, P. (1990). Response to cellulase treatment of silage and
replacement of barley by unmolassed sugar beet pulp in the diets of growing cattle. Acta
Agriculturae Scandinavica, 40(4), 415-426.
Jackson, A., and Newton, R.W. (2016). Project to Model the Use of Fisheries By-product in
the Production of Marine Ingredients with Special Reference to Omega-3 Fatty Acids (EPA
and DHA, Institute of Aquaculture, University of Stirling & IFFO, the Marine Ingredients
Organisation).
Jayathilakan, K., Sultana, K., Radhakrishna, K., Bawa, A.S., 2012. Utilization of
byproductsand waste materials from meat, poultry and fish processing industries: a review. J
Food Sci Technol 49, 278–293. https://doi.org/10.1007/s13197-011-0290-71.
Jiménez-Moreno, E., Frikha, M., de Coca-Sinova, A., García, J., & Mateos, G. G. (2013). Oat
hulls and sugar beet pulp in diets for broilers 1. Effects on growth performance and nutrient
digestibility. Animal Feed Science and Technology, 182(1-4), 33-43.
Jones, A. M., Wu, F., Woodworth, J. C., Tokach, M. D., Goodband, R. D., DeRouchey, J. M.,
& Dritz, S. S. (2018). Evaluating the effects of fish meal source and level on growth
performance of nursery pigs. Translational Animal Science, 2(2), 144-155.
Jørgensen, H., Zhao, X. Q., Knudsen, K. E. B., & Eggum, B. O. (1996). The influence of
dietary fibre source and level on the development of the gastrointestinal tract, digestibility
and energy metabolism in broiler chickens. British Journal of Nutrition, 75(3), 379-395.

42
Karapanagiotidis, I.T., Psofakis, P., Mente, E., Malandrakis, E., Golomazou, E., 2019. Effect
of fishmeal replacement by poultry by-product meal on growth performance, proximate
composition, digestive enzyme activity, haematological parameters and gene expression of
gilthead seabream ( Sparus aurata ). Aquacult Nutr 25, 3–14.
https://doi.org/10.1111/anu.12824
Karlsson, J., Spörndly, R., Lindberg, M., & Holtenius, K. (2018). Replacing human-edible
feed ingredients with by-products increases net food production efficiency in dairy cows.
Journal of dairy science, 101(8), 7146-7155.
Keane, M. G. (2005). Comparison of sugar-beet pulp and barley with and without soya bean
meal as supplements to silage for growing steers. Irish journal of agricultural and food
research, 15-26.
Keegan, T. P., DeRouchey, J. M., Nelssen, J. L., Tokach, M. D., Goodband, R. D., & Dritz,
S. S. (2004). The effects of poultry meal source and ash level on nursery pig performance.
Journal of animal science, 82(9), 2750-2756.
Krogh, U., Bruun, T. S., Poulsen, J., & Theil, P. K. (2017). Impact of fat source and dietary
fibers on feed intake, plasma metabolites, litter gain and the yield and composition of milk in
sows. Animal, 11(6), 975-983.
Li, K., Wang, Y., Zheng, Z.-X., Jiang, R.-L., Xie, N.-X., Bureau, D.P., 2009. Replacing Fish
Meal with Rendered Animal Protein Ingredients in Diets for Malabar Grouper, Epinephelus
malabaricus , Reared in Net Pens. Journal of the World Aquaculture Society 40, 67–75.
https://doi.org/10.1111/j.1749-7345.2008.00227.x
Li, B., Schroyen, M., Leblois, J., Beckers, Y., Bindelle, J., & Everaert, N. (2019). The use of
inulin and wheat bran only during the starter period or during the entire rearing life of
broilers: effects on growth performance, small intestinal maturation, and cecal microbial
colonization until slaughter age. Poultry science, 98(9), 4058-4065.
Liu, S. Y., Cowieson, A. J., & Selle, P. H. (2016). The influence of meat-and-bone meal and
exogenous phytase on growth performance, bone mineralisation and digestibility coefficients
of protein (N), amino acids and starch in broiler chickens. Animal Nutrition, 2(2), 86-92.
Luke, 2021. Finnish feed tables and nutrient requirements of farm animals. Accessed:
15.9.2021 https://portal.mtt.fi/portal/page/portal/Rehutaulukot/feed_tables_english
Ma, X., Shang, Q., Hu, J., Liu, H., Brøkner, C., & Piao, X. (2019). Effects of replacing
soybean meal, soy protein concentrate, fermented soybean meal or fish meal with enzyme-
treated soybean meal on growth performance, nutrient digestibility, antioxidant capacity,
immunity and intestinal morphology in weaned pigs. Livestock Science, 225, 39-46.
Magistrelli, D., Galassi, G., Matteo Crovetto, G., & Rosi, F. (2009). Influence of high levels
of beet pulp in the diet on endocrine/metabolic traits, slaughter dressing percentage, and ham
quality in Italian heavy pigs. Italian Journal of Animal Science, 8(1), 37-49.
Malisetty, V., Yerradoddi, R. R., Devanaboina, N., Mallam, M., & Mitta, P. (2014). Effect of
feeding sorghum straw based complete rations with different roughage to concentrate ratio on
dry matter intake, nutrient utilization, and nitrogen balance in Nellore ram lambs. Tropical
animal health and production, 46(5), 759-764.
43
Meeker, D. L., & Hamilton, C. R. (2006). Essential rendering. All about the animal by-
products industry.
Mojtahedi, M., & Mesgaran, M. D. (2011). Effects of the inclusion of dried molassed sugar
beet pulp in a low-forage diet on the digestive process and blood biochemical parameters of
Holstein steers. Livestock Science, 141(2-3), 95-103.
Monforti, F., Bódis, K., Scarlat, N., & Dallemand, J. F. (2013). The possible contribution of
agricultural crop residues to renewable energy targets in Europe: A spatially explicit study.
Renewable and Sustainable Energy Reviews, 19, 666-677.
Mordenti, A. L., Giaretta, E., Campidonico, L., Parazza, P., & Formigoni, A. (2021). A
review regarding the use of molasses in animal nutrition. Animals, 11(1), 115.
Mottet, A., de Haan, C., Falcucci, A., Tempio, G., Opio, C., & Gerber, P. (2017). Livestock:
On our plates or eating at our table? A new analysis of the feed/food debate. Global Food
Security, 14, 1-8.
Murphy, M., Khalili, H., & Huhtanen, P. (1993). The substitution of barley by other
carbohydrates in grass silage based diets to dairy cows. Animal feed science and technology,
41(4), 279-296.
Münnich, M., Khiaosa-Ard, R., Klevenhusen, F., Hilpold, A., Khol-Parisini, A., & Zebeli, Q.
(2017). A meta-analysis of feeding sugar beet pulp in dairy cows: Effects on feed intake,
ruminal fermentation, performance, and net food production. Animal Feed Science and
Technology, 224, 78-89.
Münnich, M., Klevenhusen, F., & Zebeli, Q. (2018). Feeding of molassed sugar beet pulp
instead of maize enhances net food production of high-producing Simmental cows without
impairing metabolic health. Animal Feed Science and Technology, 241, 75-83.
Ndou, S. P., Kiarie, E., Thandapilly, S. J., Walsh, M. C., Ames, N., & Nyachoti, C. M.
(2017). Flaxseed meal and oat hulls supplementation modulates growth performance, blood
lipids, intestinal fermentation, bile acids, and neutral sterols in growing pigs fed corn–
soybean meal–based diets. Journal of animal science, 95(7), 3068-3078.
Ngoan, L. D., Ogle, B., & Lindberg, J. E. (2001). Effects of replacing fish meal with ensiled
shrimp by-product on the performance and carcass characteristics of growing pigs. Asian-
Australasian Journal of Animal Sciences, 14(1), 82-87.
Newton, R., Telfer, T., Little, D. (2014). Perspectives on the Utilization of Aquaculture
Nichols, C. A., Schneider, C. J., Jenkins, K. H., Erickson, G. E., Furman, S. A., & Luebbe,
M. K. (2014). Effect of sugar beet–pulp concentration during grain adaptation and in
finishing diets with different corn processing methods on performance and carcass
characteristics. The Professional Animal Scientist, 30(3), 318-326.
Olsen, R.L., Toppe, J., and Karunasagar, I. (2014). Challenges and realistic opportunities in
the use of by-products from processing of fish and shellfish. Trends Food Sci. Technol. 36,
144–151.
44
Ortigues, I., Smith, T., Oldham, J. D., McAllan, A. B., & Siviter, J. W. (1989). Nutrient
supply and growth of cattle offered straw-based diets. British journal of nutrition, 62(3), 601-
619.
Pan, L., Ma, X. K., Wang, H. L., Xu, X., Zeng, Z. K., Tian, Q. Y., Zhao, P.F., Zhang, S.,
Yang, Z.Y. & Piao, X. S. (2016). Enzymatic feather meal as an alternative animal protein
source in diets for nursery pigs. Animal Feed Science and Technology, 212, 112-121.
Pesonen, M., Joki-Tokola, E., & Huuskonen, A. (2014). The effect of silage plant species,
concentrate proportion and sugar beet pulp supplementation on the performance of growing
and finishing crossbred bulls. Animal Production Science, 54(10), 1703-1708.
Philippe, F. X., Laitat, M., Wavreille, J., Nicks, B., & Cabaraux, J. F. (2015). Effects of a
high-fibre diet on ammonia and greenhouse gas emissions from gestating sows and fattening
pigs. Atmospheric Environment, 109, 197-204.
Ponce, L. E., & Gernat, A. G. (2002). The effect of using different levels of tilapia by-product
meal in broiler diets. Poultry science, 81(7), 1045-1049.
Reynolds, W. K., Hunt, C. W., Moen, T., & Loesche, J. A. (1993). Comparison of corn and
barley with and without ruminal buffer in supplements fed in wheat straw-based diets to beef
steers. Journal of animal science, 71(5), 1326-1334.
Scarlat, N., Martinov, M., & Dallemand, J. F. (2010). Assessment of the availability of
agricultural crop residues in the European Union: potential and limitations for bioenergy use.
Waste management, 30(10), 1889-1897.
Shabani, A., Boldaji, F., Dastar, B., Ghoorchi, T., Zerehdaran, S., & Ashayerizadeh, A.
(2021). Evaluation of increasing concentrations of fish waste silage in diets on growth
performance, gastrointestinal microbial population, and intestinal morphology of broiler
chickens. Animal Feed Science and Technology, 275, 114874.
Steinfeld, H., Gerber, P., Wassenaar, T. D., Castel, V., Rosales, M., Rosales, M., & de Haan,
C. (2006). Livestock's long shadow: environmental issues and options. Food & Agriculture
Org..
Stevens, J.R., Newton, R.W., Tlusty, M., and Little, D.C. (2018). The rise of aquaculture by-
products: increasing food production, value, and sustainability through strategic utilisation.
Marine Policy 90, 115–124.
Tacon, A.G.J.; Hasan, M.R.; Metian, M.(2011). Demand and supply of feed ingredients for
farmed fish and crustaceans: trends and prospects. FAO Fisheries and Aquaculture Technical
Paper No. 564. FAO, 2011. 87 pp.
Tacon, A. G., & Metian, M. (2015). Feed matters: satisfying the feed demand of aquaculture.
Reviews in Fisheries Science & Aquaculture, 23(1), 1-10.
Tacon, A. G. (2020). Trends in global aquaculture and aquafeed production: 2000–2017.
Reviews in Fisheries Science & Aquaculture, 28(1), 43-56.

45
Taylor, J., Sakkas, P., & Kyriazakis, I. (2021). What are the limits to feed intake of broilers
on bulky feeds?. Poultry science, 100(3), 100825.
Thi Thuy, N., Lindberg, J. E., & Ogle, B. (2011). Effects of replacing fish meal with ensiled
catfish (Pangasius hypophthalmus) by-products on the performance and carcass quality of
finishing pigs. Journal of Animal and Feed Sciences, 20(1), 47-59.
Toyes‐Vargas, E., Ortega‐Pérez, R., Espinoza‐Villavicencio, J. L., Arellano‐Pérez, M.,
Civera, R., & Palacios, E. (2018). Effect of marine by‐product meals on hen egg production
parameters, yolk lipid composition and sensory quality. Journal of animal physiology and
animal nutrition, 102(2), 462-473.
Valaja, J., Suomi, K., Alaviuhkola, T., & Immonen, I. (1992). Effect of dietary fish meal on
the palatability and fatty acid composition of pork. Agricultural and Food Science, 1(1), 21-
26.
Van Heugten, E., & Van Kempen, T. A. T. G. (2002). Growth performance, carcass
characteristics, nutrient digestibility and fecal odorous compounds in growing-finishing pigs
fed diets containing hydrolyzed feather meal. Journal of Animal Science, 80(1), 171-178.
Venkateswarlu, M., Reddy, Y. R., Nagalakshmi, D., & Mahender, M. (2014). Effect of
feeding sorghum straw based complete rations with different roughage to concentrate ratio on
growth and carcass characteristics in Nellore ram lambs. Animal Nutrition and Feed
Technology, 14(3), 563-572.
Veum, T.L., Crenshaw, J.D., Crenshaw, T.D., Cromwell, G.L., Easter, R.A., Ewan, R.C.,
Nelssen, J.L., Miller, E.R., Pettigrew, J.E. & Ellersieck, M.R. (2009). The addition of ground
wheat straw as a fiber source in the gestation diet of sows and the effect on sow and litter
performance for three successive parities. Journal of animal science, 87(3), 1003-1012.
Vizcarra‐Magaña, L. A., Avila, E., & Sotelo, A. (1999). Silage preparation from tuna fish
wastes and its nutritional evaluation in broilers. Journal of the Science of Food and
Agriculture, 79(13), 1915-1922.
Waldroup, P. W., Van Walleghem, P., Fry, J. L., Chicco, C., & Harms, R. H. (1965). Fish
Meal Studies: 1. Effects of Levels and Sources on Broiler Growth Rate and Feed Efficiency.
Poultry science, 44(4), 1012-1016.
Wang, L. F., Beltranena, E., & Zijlstra, R. T. (2016). Diet nutrient digestibility and growth
performance of weaned pigs fed sugar beet pulp. Animal Feed Science and Technology, 211,
145-152.
Wirsenius, S. (2000). Human use of land and organic materials: modeling the turnover of
biomass in the global food system. Chalmers University of Technology.
Ytrestøyl, T., Aas, T.S., and ÅsgÅrd, T. (2015). Utilisation of feed resources in production of
Atlantic salmon (Salmo salar) in Norway. Aquaculture 448, 365–374.
Yu, C., Zhang, S., Yang, Q., Peng, Q., Zhu, J., Zeng, X., & Qiao, S. (2016). Effect of high
fibre diets formulated with different fibrous ingredients on performance, nutrient digestibility
and faecal microbiota of weaned piglets. Archives of animal nutrition, 70(4), 263-277.