unusual behavior of the kuroshio current system from winter
TRANSCRIPT

Journal of Oceanography, Vol. 54, pp. 465 to 478. 1998
465Copyright The Oceanographic Society of Japan.
Unusual Behavior of the Kuroshio Current System fromWinter 1996 to Summer 1997 Revealed by ADEOS-OCTSand Other Data—Suggestion of Topographically ForcedAlternating-Jet Instability
YOSHIAKI TOBA1,2 and HIROSHI MURAKAMI1
1Earth Observation Research Center, National Space Development Agency of Japan (EORC, NASDA), 1-9-9 Roppongi, Minato-ku, Tokyo 106-0032, Japan2Japan Marine Science and Technology Center (JAMSTEC), Natsushima-cho, Yokosuka 237-0061, Japan
(Received 31 March 1998; in revised form 18 June 1998; accepted 19 June 1998)
While the Advanced Earth Observing Satellite (ADEOS) was operating, the Kuroshio andthe Kuroshio Extension, or the Kuroshio Current System, exhibited unusual behaviorfrom the winter of 1996 to the summer of 1997. This behavior of the Kuroshio CurrentSystem has been closely studied using a time series of satellite observation images of SSTand ocean color obtained by ADEOS-OCTS, reinforced by SST images obtained byNOAA-AVHRR. Our findings include (i) a long lasting, very southerly path of theKuroshio Extension; (ii) a Kuroshio path very distant from Japan with the followingalternating-jet-like north-south flow pattern of the Kuroshio Extension, which occurredtwice, once in February and once in April 1997, as independent events and which wasobserved to be affected by the bottom topography of the Izu-Ogasawara Ridge andTrench, and of the Japan Trench; (iii) cutting off of a cold water mass after the Februaryevent; and (iv) the formation of a vortex pair after the April event. A new mechanism issuggested for the formation of the alternating-jet flow pattern: a topographically forcedalternating-jet instability (AJI). An SST-Chlorophyll Diagram (T-Chl Diagram) gener-ated using simultaneous data from a single satellite is useful for analyzing the water massstructure of this region, including biological processes.
1. IntroductionIn the long history of research (e.g., Nitani, 1969;
Shoji, 1972; Taft, 1972), it is generally recognized that theKuroshio, the western boundary current of the North PacificOcean, has two preferred paths: those with and those withouta large meander. The current switches between these twopaths with time scales of a few years. When there is no largemeander, the Kuroshio flows along Honshu. When there isa large meander, the Kuroshio flows off Honshu, usuallysouth of the Kii Peninsula to the southeast then turns to thenorth, usually along the west slope of the Izu-OgasawaraRidge, to flow over the Ridge around 34°N–32°N to the east.In either case the Kuroshio flows east usually very close tothe Boso Peninsula (e.g., Mizuno and White, 1983; Kawabe,1996). For the large meander, there is a cold water mass offthe Kii Peninsula or in Enshunada, surrounded by the largemeander of the Kuroshio (e.g., Ishii et al., 1983).
During the operational period of the Advanced EarthObserving Satellite (ADEOS), unusual behavior of theKuroshio Current System (the Kuroshio and the Kuroshio
Extension) was discovered by observing a combination ofsea surface temperature (SST) and chlorophyll-a imagesacquired by the Ocean Color and Temperature Scanner(OCTS) of ADEOS. Figure 1(a) is the SST image, and (b)the chlorophyll-a image of April 26, 1997. These imagesshow a very southerly path of the Kuroshio after its crossingof the Izu-Ogasawara Ridge to 31°N, and an alternating-jet-like north-south straight flow pattern of the Kuroshio Ex-tension. Such a flow pattern does not seem to have beenexplicitly reported before. What was the cause of thisunusual phenomenon? This question was the beginning ofthe present research paper.
The method of the research is to first combine simul-taneous images of SST and chlorophyll-a from ADEOS-OCTS. The SST pattern, as observed by satellites, is thetemperature at the very surface of the oceans of the order of10 µm thickness. This is affected by the short time-scalevariability of the SST due to air-sea boundary processes,including solar radiation and evaporation, so the tempera-ture pattern does not necessarily correspond to the current
Keywords:⋅The Kuroshio,⋅The KuroshioExtension,
⋅ADEOS-OCTS,⋅Topographicallyforced alternating-jet instability (AJI),
⋅NOAA-AVHRR,⋅Bottom topography,⋅ Izu-OgasawaraRidge,
⋅Vortex-pair,⋅SST-ChlorophyllDiagram (T-ChlDiagram).

466 Y. Toba and H. Murakami
Fig
. 1.
AD
EO
S-O
CT
S i
mag
es o
f A
pri l
26,
199
7: (
a) S
ST
im
age,
(b)
chl
orop
hyl l
-a i
mag
e (V
ersi
on 3
).
Unusual Behavior of the Kuroshio Current System from Winter 1996 to Summer 1997 467
pattern. The ocean color data, however, represent the aver-age phytoplankton concentration of the upper ocean of theorder of a few tens of meters in thickness (e.g., Matsumura,1991). Consequently, the combination of the SST and oceancolor images is very useful for studying the oceanic condi-tions, though the phytoplankton concentration is not a con-servative quantity since it includes chemical and biologicalprocesses of various time scales. The combined use ofimages of SST and chlorophyll-a can thus reveal oceanicconditions more clearly than the use of SST images alone.
The second tool for this research is a time series studyof oceanic conditions using remote sensing data of ADEOS-OCTS and the Advanced Very High Resolution Radiometer(AVHRR) of NOAA. Also, we have referred to otheroceanographic observation data, where available.
The time series studies revealed that the KuroshioExtension took a very southerly path for a long period, fromwinter 1996 to summer 1997, and we will describe this inSection 2. As a matter of fact, the special flow pattern of theKuroshio Current System as shown in Fig. 1 occurred twice,in February and April 1997, as independent events. This willbe described in Section 3, and a new mechanism for theformation of this particular flow pattern will be suggested.In Section 4 we describe a cutting off of a cold water massafter the February event and the formation of a vortex pairafter the April event. In Section 5, an SST-Chlorophylldiagram (T-Chl Diagram) will be used to more effectivelyanalyze water masses including biological processes.
In 1997, an El Niño event was observed, and thisevolved to be the strongest in the 20th century. The task ofdetermining whether the unusual behavior of the KuroshioCurrent System in 1997 is related to the 1997 El Niño eventwill be left for future studies.
2. Time Series Study of the Variation of the KuroshioCurrent System from Fall 1996 to Summer 1997—A Very Southerly Path of the Kuroshio ExtensionFigure 2 shows a time series of composite images,
excluding cloud areas, of NOAA-AVHRR SST from Sep-tember 1996 to May 1997. This was processed from dataarchived by Kawamura et al. (1997). It can be seen first thatthe Kuroshio Extension took a very southerly path, evendown to 32°N, during December 1996 and May 1997. Usualpaths are known to be along about 35°-36°N. It is very rarein the history of observation for such very southerly paths toexist for many months (Inagake and Saito, 1998).
Yamagata et al. (1985) reported that the intensity of theKuroshio Extension had a positive correlation with that ofthe North Equatorial Current with a time lag of 1.5 years, andthe latter had intensification in ENSO events. Qiu et al. (1991)showed that after the 1986-1987 ENSO event, with a similartime lag, the latitude of the Kuroshio Extension changedfrom southerly to northerly, from lower to higher surfaceheight differences across the Kuroshio Extension. Since
SST of the eastern equatorial region had a tendency of anti-El Niño during 1995 to 1996, the above-described southerlyposition of the Kuroshio Extension during December 1996and May 1997 might be related to a similar phenomenon.
From September to October 1996, a large streamerfrom the Kuroshio water is seen to the east of the JobanCoast. In December 1996, a vortex pair is formed to thesoutheast of the Boso Peninsula. This vortex pair is similarto the one that will be described in Section 4. From Januaryto February 1997, the southern part of the vortex pair (33°N,146°E), the cold water mass, intruded sharply south (alongabout 142°E), and in March a cold water mass was seen tobe cut off to the south of the Kuroshio (32°N).
In the middle of April, the Kuroshio Current Systemsouth to southeast of Honshu tended to be in the east-westdirection (cf. Fig. 2). However, in the latter part of April, theflow pattern changed to the north-south direction as seen inFig. 1. The variability was thus very rapid. The north-southflow pattern evolved to form a vortex pair in the latter partof May 1997.
3. North-South Flow Pattern of the Kuroshio CurrentSystem in February and April 1997—Suggestion ofTopographically Forced Alternating-Jet Instability(AJI)The unusual flow pattern of the Kuroshio Current
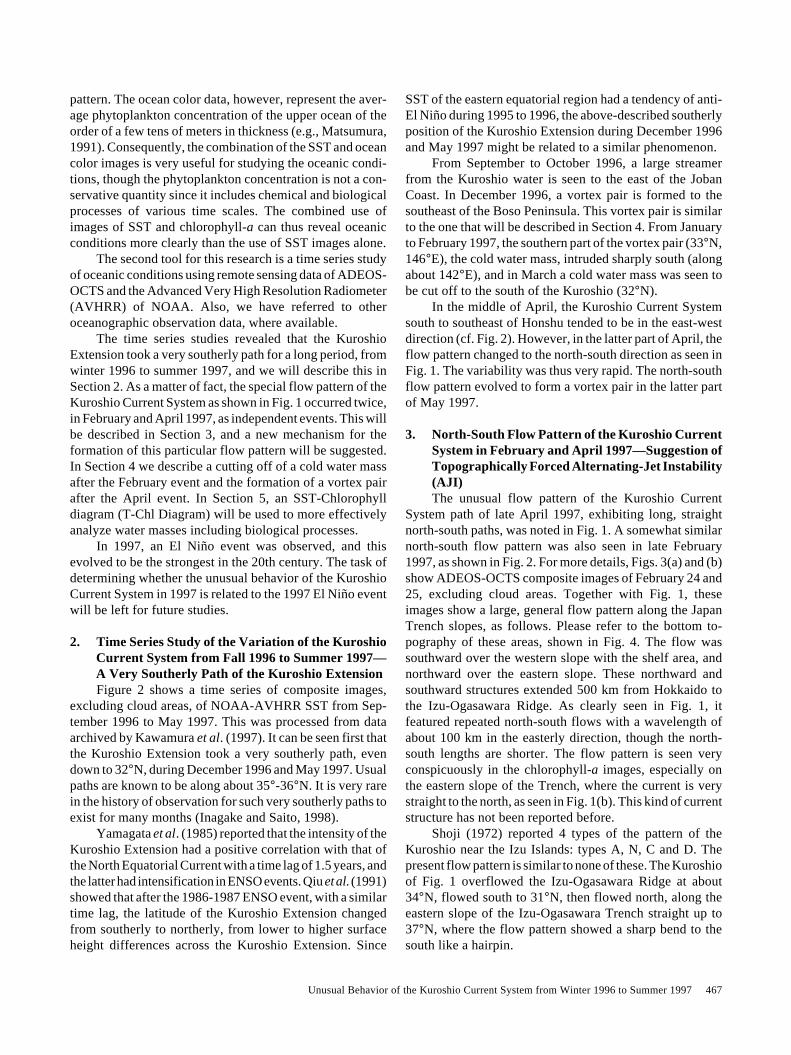
System path of late April 1997, exhibiting long, straightnorth-south paths, was noted in Fig. 1. A somewhat similarnorth-south flow pattern was also seen in late February1997, as shown in Fig. 2. For more details, Figs. 3(a) and (b)show ADEOS-OCTS composite images of February 24 and25, excluding cloud areas. Together with Fig. 1, theseimages show a large, general flow pattern along the JapanTrench slopes, as follows. Please refer to the bottom to-pography of these areas, shown in Fig. 4. The flow wassouthward over the western slope with the shelf area, andnorthward over the eastern slope. These northward andsouthward structures extended 500 km from Hokkaido tothe Izu-Ogasawara Ridge. As clearly seen in Fig. 1, itfeatured repeated north-south flows with a wavelength ofabout 100 km in the easterly direction, though the north-south lengths are shorter. The flow pattern is seen veryconspicuously in the chlorophyll-a images, especially onthe eastern slope of the Trench, where the current is verystraight to the north, as seen in Fig. 1(b). This kind of currentstructure has not been reported before.
Shoji (1972) reported 4 types of the pattern of theKuroshio near the Izu Islands: types A, N, C and D. Thepresent flow pattern is similar to none of these. The Kuroshioof Fig. 1 overflowed the Izu-Ogasawara Ridge at about34°N, flowed south to 31°N, then flowed north, along theeastern slope of the Izu-Ogasawara Trench straight up to37°N, where the flow pattern showed a sharp bend to thesouth like a hairpin.

468 Y. Toba and H. Murakami
Fig. 2. Time series of composite images, excluding cloud areas, of NOAA-AVHRR SST from September 1996 to May 1997.

Unusual Behavior of the Kuroshio Current System from Winter 1996 to Summer 1997 469
Fig. 2. (continued).
470 Y. Toba and H. Murakami
Fig
. 3.
A
DE
OS
-OC
TS
com
posi
te i
mag
e s,
e xc l
udin
g c l
oud
a re a
s, o
f F
e bru
a ry
24 a
nd 2
5, 1
997
(Ve r
sion
2):
(a )
SS
T i
mag
e ,(b
) c h
loro
phyl
l-a
imag
e .

Unusual Behavior of the Kuroshio Current System from Winter 1996 to Summer 1997 471
lee-wave meanders of the eastward jet-like current leavingHonshu by White and McCreary (1976). However, thepresent flow pattern is apparently different from the inducedlee-wave meanders.
There are various events in the Kuroshio Extensionnear 144°E; e.g., Kawamura et al. (1986) reported an abruptnorthward movement of the Kuroshio Extension front form-ing a bulge of Kuroshio water, with an eventual detachmentof a warm core ring. Yasuda et al. (1992) studied evolutionof a warm core ring in this area, including interactions witha warm tongue or streamers extending from the KuroshioExtension. Kubokawa (1989) presented a theoretical studyof a solitary disturbance growing in a baroclinic boundarycurrent. Stern and Frierl (1987), and Bell and Pratt (1992),reported the possibility of large amplitude variation of thefront by an interaction between potential vorticity frontswith a nearby eddy as a point vortex. Meacham (1991)discussed the meander evolution of a jet along a baroclinicvorticity front. However, in the present paper, we propose anidea of forcing of the bottom topography, from the above-described conspicuous correspondence between the bottomtopography and the observed flow pattern.
Furthermore, separating the Izu-Ogasawara Trenchand the Japan Trench, there is a characteristic bottom to-pography including the Dai-ichi (No. 1) Kashima Seamount,of which the depth is 3,600 m, at 35°50′ N, 142°40′ E, to theeast of Inubozaki (see Fig. 4). The narrow current along theeastern slope of the Izu-Ogasawara Trench, as seen by bluecolor in Fig. 1(b), seems to show characteristic bends alongthese bottom configurations. This strongly indicates that thecurrent is greatly affected by the bottom topography all theway through to the sea surface. We consider that this kind ofnew current structure would not have been found without the
Kawai (1972) reported quasi-stationary existence ofmeanders of the Kuroshio Extension near 144°E and 150°E.Mizuno and White (1983) examined in detail the variabilityin the Kuroshio Extension during 1976 and 1980, andsupported the idea of the topographically induced stationary
Fig. 5. Concept of topographically forced Alternating-Jet Instability (AJI).
Fig. 4. Topographic features of oceans near the east Japan. Dottedand solid lines indicate 2,000 and 4,000 m depth contours, andhatched belts trenches deeper then 7,000 m. Small numeralsindicate the depths in meters at the top of seamounts (citedpartly from Kawai, 1972).

472 Y. Toba and H. Murakami
chlorophyll-a images.Two weeks prior to the April event, the flow pattern
was east-to-west, as seen in Fig. 2. Thus the flow patternvaried very rapidly, and the events in February and in Aprilcan be assumed to be independent. We can infer the follow-ing concerning the generation of this particular flow pattern.This alternating-jet-like flow pattern was caused by thetopographically forced instability on a rotating Earth. Priorto these events, it is assumed that the Kuroshio becamedeeper for some reason, i.e., that a deeper current arrived atthe western side of the Izu-Ogasawara Ridge. Or alternatively,we might be able to assume that the surface component ofthe Kuroshio became weak and the effect of the deepercomponent became dominant relatively. Consequently, thecurrent went north along the western slope of the Ridge dueto topographic steering and the column water that overflowedthe ridge was stretched as it flowed down the eastern slope.The potential vorticity stretching induced a flow south witha deep current, which was affected further by the topogra-phy. After the current turned north and reached the easternslope of the Izu-Ogasawara Trench, the current flowedstraight northward along the slope.
Since the current is still baroclinic in the upper layer,the large slope of the pycnocline, which has a slope higherin the eastern direction, will induce the inverse slope on theeastern side of the northward current, causing the southwardflow pattern there (from 38°N, 147°E to 35°N, 145°E). This
Fig. 6. A sectional observation down to 2,000 db depth made by Kofu-Maru of the Hakodate Marine Observatory, JMA, in November1996 (a), and during May 10–14, 1997 (b) along 144°E line south to 34°N. The values are sigma-t in kg m–3 (cited from theOceanographic Observation Report of the Hakodate Marine Observatory, 1997).
will in turn cause the northward flow on the eastern side.This concept is shown in Fig. 5.
We infer that the width of the Trench slopes and theRossby radius of deformation that determines the spacescale of oceanic phenomena like the current jet width of thisregion might lead to a spatial resonance. We will thus callthis suggested mechanism a topographically forced Alter-nating-Jet Instability (AJI). Though a further theoreticaland/or numerical verification of this mechanism has yet tobe made, the above inference is based on the conspicuousflow pattern observed twice in the satellite images.
There are little data on oceanographic conditions in thedeeper ocean. However, a sectional observation down to2,000 db depth was made by Kofu-Maru of the HakodateMarine Observatory, JMA, during May 10–14, 1997 along144°E line south to 34°N. This was a section crossing themiddle of the northern warm water mass of the vortex pairformed in late May. Figure 6 shows, cited from theOceanographic Observation Report of the Hakodate MarineObservatory (1997), that the currents were much deeper inMay 1997 than in November 1996. In May, an oceanicstructure at 2,000 db similar to that at 1,000 db is seen fromthe figure. Note that the vertical scale is not uniform in thefigure. In November 1996, however, the oceanic structurealmost disappeared at depths below 1,000 db.
A ship borne Acoustic Doppler Current Profiler (ADCP)data set during April 7–20, 1997, compiled by the Hydro-

Unusual Behavior of the Kuroshio Current System from Winter 1996 to Summer 1997 473
Fig. 7. Composite data set of current vectors observed by using shipbone Acoustic Doppler Current Profilers (ADCP) at the 9.4 m depthduring April 7–8 and 19–20, 1997, compiled by the Hydrographic Department of the Maritime Safety Agency of Japan.
graphic Department of the Maritime Safety Agency ofJapan, is shown in Fig. 7. It indicates that there were strongsouthward flows reaching five knots along the eastern slopeof the Izu-Ogasawara Ridge on April 19–20, 1997, inaccordance with the inference from Fig. 1.
Regarding the current flow along the contour of thebottom topography looking at the shallower part to the right,an important observation was made in the Arctic Sea byShimada et al. (1997), whose observations supported for thefirst time the Neptune effect proposed by Holloway (1992).Also, Fujio et al. (1997) reported current meter observationsof deep layer flows along the Izu-Ogasawara Trench, thesouthward flow being along the western slope and thenorthward flow along the eastern slope. They reported thatthere was a general northward flow of several centimetersper second within the Trench at the 2,000 db level, a 6 Svsoutherly flow at the western slope, and a 23 Sv northwardflow at the eastern slope below 2,000 db level. These flows
in the deep layer may have their own variation. We infer thatthe interaction between these flows and the flow of theKuroshio Current System itself, which was deeper thanusual, or had surface components weaker than usual, mightbe related to the occurrence of the above reported AJIprocesses.
Hurlburt et al. (1996) studied the dynamics of theKuroshio/Oyashio Current System by using an eddy resolvingnumerical model for a variety of experimental conditions.They report that the bottom topography regulates the loca-tion and the strength of the baroclinic instability, and that thebaroclinic instability gives eddy driven deep mean flowsthat follow the f/h contours of the bottom topography, wheref is the Coriolis parameter and h is the depth of the watercolumn. In fact, some of the results of their model experi-ments show flow patterns of the Kuroshio Current Systemwhich are somewhat similar to those reported in the presentpaper.

474 Y. Toba and H. Murakami
Fig
. 8.
AD
EO
S-O
CT
S c
ompo
site
im
age s
, exc
ludi
ng c
loud
are
a s, o
f M
ay 2
5-27
, 199
7 (V
e rsi
on 2
): (
a ) S
ST
im
age ,
(b)
chl
orop
hyll
-aim
age .

Unusual Behavior of the Kuroshio Current System from Winter 1996 to Summer 1997 475
It should also be noted that the route of the warm waterfrom the Kuroshio Extension to the warm-core ring studiedby Yasuda et al. (1992) seems to be close along the easternslope of the Japan Trench (cf. their Fig. 2).
4. Formation of Vortex PairsAs seen in Fig. 2, after the February event reported in
the last section, the Kuroshio took a short cut and detacheda cold water mass at the trench; in the April event, the pathevolved to form a vortex-pair. To explain this difference, wemay assume that after the February event, a shallowercurrent of the Kuroshio arrived to the west of the Izu-Ogasawara Ridge, but in April it was not the case.
In May 1997, a conspicuous vortex-pair appeared alongthe Kuroshio Extension southeast of Japan (34°N, 144°E).Figures 8(a) and (b) are ADEOS-OCTS images for the caseof May 1997. The location and the formation process of thevortex-pair were very similar to the vortex pair of December1996, as observed in Fig. 2 and described in Section 2.
We note in Fig. 8 that the SSTs of the cold and warmwater masses of the vortex pair are similar, but the chloro-phyll-a values are totally different. It is inferred that thenorthward warm water mass was from the Kuroshio water,and the southward cold water mass was from Oyashio water(cf. Toba and Murakami, 1998).
A vortex pair, similar in location and size, was formed
in a numerical model by Mitsudera et al. (1997; personalcommunication), as cited in Fig. 9. In this numerical modelcase, the existence of the No. 2 (1,384 m) and the No. 3(1,449 m) Takuyo Seamounts at about 34°N and 134°Eseemed related to the formation of the vortex pairs. In thiscase, too, the bottom topography should be important for theflow paths. However, in this numerical model case, the maincurrent of the Kuroshio System was located on the north sideof the vortex pair, whereas in the case in Fig. 8, it also flowssouth of the vortex pair (see also the bottom right panel ofFig. 2).
5. Use of the SST-Chlorophyll DiagramAn SST-Chlorophyll diagram (T-Chl Diagram) can
successfully be used to study the water mass structure of thisregion. By using data of different satellites of the CoastalZone Color Scanner (CZCS) and NOAA-AVHRR, Abbottand Zion (1985) and Ishizaka et al. (1992) used an SST-phytoplankton pigment diagram to discuss phytoplanktondistribution and variability in upwelling regions. In thepresent study we use simultaneous SST and chlorophyll-avalues of OCTS. Figures 10(a) and (b) show two examplesof the present data. Figure 10(a) corresponds to Fig. 3, andFig. 10(b), to Fig. 5.
This diagram makes possible an effective interpretation,coupling physics and biological processes. Before the spring
Fig. 9. A vortex pair formed in a numerical model by Mitsudera et al. (1997; personal communication).

476 Y. Toba and H. Murakami
Fig. 10. SST-Chlorophyll Diagrams (T-Chl Diagram) based on ADEOS-OCTS data (Version 2): (a) corresponds to the data of Fig. 3,and (b), to the data of Fig. 7. Colored crosses in the diagram correspond to the crosses in the images in the left columns.

Unusual Behavior of the Kuroshio Current System from Winter 1996 to Summer 1997 477
bloom of phytoplankton, chlorophyll-a concentration wasconserved in the T-Chl Diagram in the same water masseswhile the SST changed as shown in Fig. 10(a) for February1997. However the spring bloom significantly raised thelevel of chlorophyll-a, as shown in Fig. 10(b) for the May1997 case. When there are surface salinity values, the use ofthe conventional T-S diagrams together with the presenttype T-Chl Diagrams would make discussions of the watermass variations including biological processes more effec-tive. Some further examples and discussion of the use of theT-Chl Diagrams will be reported elsewhere by Toba andMurakami (1998).
AcknowledgementsThis study was performed with the help of many
people. The excellent work of the ADEOS Science Teamheaded by Prof. H. Shimoda and the OCTS Team lead byProf. H. Kawamura made this study possible. Prof. H.Kawamura also provided NOAA-AVHRR data that werearchived in Tohoku University. Mr. T. Andow of JMA, andMessrs. H. Yoritaka and H. Kinoshita of the HydrographicDept., MSA, provided us with information of oceanographicobservation data. Dr. K. Okuda of the Tohoku RegionalFisheries Research Institute; Dr. H. Tameishi of the Fisher-ies Information Service Center; Drs. F. Mitsudera, Y.Yoshikawa, and K. Shimada of JAMSTEC; Prof. A.Kubokawa of Hokkaido University; and I. F. S. Jones ofSydney University provided valuable discussions with theauthors. Two anonymous reviewers gave valuable commentsfor the revision of the manuscript. The authors express theirsincere thanks to all of them.
ReferencesAbbott, M. R. and P. M. Zion (1985): Satellite observations of
phytoplankton variability during an upwelling event. Cont.Shelf Res., 4, 661–680.
Bell, G. I. and L. J. Pratt (1992): The interaction of an eddy withan unstable jet. J. Phys. Oceanogr., 22, 1229–1244.
Fujio, S., D. Yanagimoto and K. Taira (1997): Flow and charac-teristics of sea water in the Izu-Ogasawara Trench (II). Bookof Abstracts, 1997 Spring Meeting of the OceanographicSociety of Japan, 21 (in Japanese).
Hakodate Marine Observatory (1997): Oceanographic Observa-tion Report of the Hakodate Marine Observatory, Vol. 34, No.4; and Vol. 35, No. 2.
Holloway, G. (1992): Representing topographic stress for large-scale ocean models. J. Phys. Oceanogr., 22, 1033–1046.
Hurlburt, H. E., A. J. Wallcraft, W. J. Schmitz, Jr., P. J. Hogan andE. J. Metzger (1996): Dynamics of the Kuroshio/Oyashiocurrent system using eddy-resolving models of the NorthPacific Ocean. J. Geophys. Res., 101, C1, 941–976.
Inagake, D. and S. Saito (1998): Description of the oceanographiccondition off Sanriku, northwestern Pacific, and its relation tospring bloom detected by the Ocean Color and TemperatureScanner (OCTS) images. J. Oceanogr., 54, this volume, 479–494.
Ishii, H., Y. Sekine and Y. Toba (1983): Hydrographic structureof the Kuroshio large meander cold water mass region downto the deepest layer of the ocean. J. Oceanogr. Soc. Japan, 39,240–250.
Ishizaka, J., H. Fukushima, M. Kashino, T. Saino and M. Takahashi(1992): Phytoplankton pigment distributions in regional up-welling around the Izu Peninsula detected by Coastal ZoneColor Scanner on May 1982. J. Oceanogr., 48, 305–327.
Kawabe, M. (1996): Model study of flow conditions causing thelarge meander of the Kuroshio south of Japan. J. Phys.Oceanogr., 26, 2449–2461.
Kawai, H. (1972): Hydrography of the Kuroshio Extension. p.235–254. In Kuroshio, Its Physical Aspects, ed. by H. Stommeland K. Yoshida, Univ. Tokyo Press.
Kawamura, H., K. Mizuno and Y. Toba (1986): Formation pro-cess of a warm-core rings in the Kuroshio-Oyashio frontalzone—December 1981–October 1982. Deep-Sea Res., 33,1617–1640.
Kawamura, H., F. Sakaida and J. Kudo (1997): Super computingof 10-years HRPT data set for analyses of AVHRR-derivedSSTs, IGARSS’98, 1499–1501.
Kubokawa, A. (1989): Growing solitary disturbance in a baroclinicboundary current. J. Phys. Oceanogr., 19, 182–192.
Matsumura, S. (1991): Vertical weight of optical information forthe visible band remote sensing. Fisheries Engineering, 27, 65–68 (in Japanese with English abstract, figures and tables).
Meacham, S. P. (1991): Meander evolution on piecewise-uniform,quasi-geostrophic jets. J. Phys. Oceanogr., 21, 1139–1170.
Mitsudera, M., Y. Yoshikawa, B. Taguchi and H. Nakamura(1997): High-resolution Kuroshio/Oyashio System Model.Preliminary Results. JAMSTECR, 36, 147–155 (in Japanesewith English abstract).
Mizuno, K. and W. White (1983): Annual and interannual vari-ability in the Kuroshio Current System. J. Phys. Oceanogr., 13,1847–1867.
Nitani, H. (1969): On the variation of the Kuroshio in recentseveral years. Bull. Jpn. Soc. Fish. Oceanogr., 14, 13–18 (inJapanese).
Qiu, B., K. A. Kelly and T. M. Joyce (1991): Mean flow andvariability in the Kuroshio Extension from Geosat altimetrydata. J. Geophys. Res., 96, C10, 18,491–18,507.
Shimada, K., T. Takizawa, K. Hatakeyama, S. Honjo, R. Krishfieldand N. Koyama (1997): Current structure around the NorthwindRidge and Chukchi Plateau. Proceedings, Conference on PolarProcesses and Global Climate, Orcas Island, Washington,1997, 249–251.
Shoji, D. (1972): Time variation of the Kuroshio south of Japan.p. 217–234. In Kuroshio, Its Physical Aspects, ed. by H.Stommel and K. Yoshida, Univ. Tokyo Press.
Stern, M. E. and G. F. Frierl (1987): On the interaction of a vortexwith a shear flow. J. Geophys. Res., 92, C10, 10,733–10,744.
Taft, B. (1972): Characteristics of the flow of the Kuroshio southof Japan. p. 165–216. In Kuroshio, Its Physical Aspects, ed. byH. Stommel and K. Yoshida, Univ. Tokyo Press.
Toba, Y. and H. Murakami (1998): Use of SST-ChlorophyllDiagrams for water mass analyses of the Kuroshio-Oyashioarea in spring (to be published in TGARS, IEEE).
White, W. B. and J. P. McCreary (1976): On the formation of theKuroshio Meander and its relationship to the large-scale
478 Y. Toba and H. Murakami
ocean circulation. Deep-Sea Res., 23, 33–47.Yamagata, T., Y. Shibao and S. Umatani (1985): Interannual
variability of the Kuroshio Extension and its relation to theSouthern Oscillation/El Niño. J. Oceanogr. Soc. Japan, 41,
274–281.Yasuda, I., K. Okuda and M. Hirai (1992): Formation of a
Kuroshio warm-core ring—variability of the hydrographicstructure. Deep-Sea Res., 39, Suppl. 1, S131–S161.