update euromicron ag buy · roe 11.70% 7.20% -0.74% 6.14% 8.56% 11.27% ebit margin 7.91 % 5.18 %...
TRANSCRIPT

∎ For H1/2014 Frankfurt-based euromicron AG reported semiannual revenues
of €162.19m (+6.0% y-o-y) and an unexpected 8.4% higher revenue figure
for Q2/2014 (€82.1m vs. €75.74m in Q2/2013). With an impressive 14.0%
y-o-y change, the segment euromiron WAN services remained the main
source of revenue growth contributing €48.28m (vs. €42.36m in H1/2013) in
sales volume.
∎ Sales of euromicron Nord were up by 1.4% to €56.85m and the division
euromicron Sued decreased slightly by 0.4% to sales of €62.84m. In the first
half of fiscal-year 2014 euromicron Nord has been the most profitable
business segment with an EBIT margin of 11.3%. euromicron’s EBIT went
down from €9.22m to €5.51m (-40.2% y-o-y) and EBIT margin declined
from 6.0% to 3.4% y-o-y. This is mainly due to costs relating to integration
measures introduced with AGENDA500. Corrected for one-off expenses
EBIT would have been €2.6m higher for H1/2014.
∎ Between January and June 2014, euromicron’s operating cash flow
amounted to €-36.3m (H1/13: €6.0m). Operating cash flow of period
H1/2013 had been positively influenced by one-time effects stemming from
the use of factoring (+€22.46m). Adjusted OCF would be -€11.71m for
H1/2014 (vs. -€16.42m H1/2013). Traditionally and due to the business
model (project pre-financing) the cash flow of euromicron is negative for the
first half of the year. Compared to 1H/2013, euromicron’s cash position
increased by 92.7% to €14.43m. The company had an equity ratio of 39.0%
recently.
∎ euromicron’s management reiterated their 2014 guidance of €340-360m for
sales and 6-8% for the EBITDA margin. Consequently, we have left both
our estimates and the 12-months DCF-based price target of €24.40
unchanged. As this equals an upside of 85.4% at present, we recommend
BUYING the stock. Apart from its Agenda 500 program, euromicron is
focusing on the implementation and integration of the recent acquisitions.
This should allow the company to reduce costs associated with double
structures by introducing centralized decision making.
Key Figures
in EURm 2011 2012 2013 2014E 2015E 2016E
Net sales 305.31 330.03 329.37 349.13 380.55 397.68EBITDA 30.73 25.03 14.41 25.65 32.17 39.62EBIT 24.16 17.08 5.51 16.22 21.89 28.88Net income 12.19 8.57 -0.89 7.63 11.03 15.25
EPS 2.32 1.29 -0.12 1.06 1.54 2.13BVPS 22.75 17.79 17.03 17.56 18.33 19.39
RoE 11.70% 7.20% -0.74% 6.14% 8.56% 11.27%EBIT margin 7.91 % 5.18 % 1.67 % 4.65 % 5.75 % 7.26 %P/E 5.80x 10.46x neg 12.66x 8.75x 6.33xP/BVPS 0.59x 0.76x 0.79x 0.77x 0.73x 0.69x
Integration measures to be concluded/improving EBITDA margins
August 25, 2014 Europe | Germany | Technology
Update
BUY
Target price: €24.40 Overview Industry: Technology
Country: GermanyReuters: EUCAn.DEWKN A0Z1JHWebsite: euromicron.net
Current Price: 13,16
High Low
Price 52W.: 17,90 11,90Market Cap. (Mill. EUR) 93.98No. Of Shares (in Mill.) 7,2
Shareholders
Free Float 82,76%Universal-Investment Gesellschaft mbH 4,57%Union Investment Privatfonds 2,82%Allianz Global Investors 2,74%FPM Funds Luxembourg 2,72%
Performance
4 Weeks -2,82%13 Weeks -6,39%26 Weeks -8,29%52 Weeks -21,93%
YTD -8,61%
DividendEUR/Share in %
2011 1.15 5.28%2012 0.30 2.23%2013E 0.00 0.00%
2014E 0.53 3.95%
52-Week Chart
0.0
5.0
10.0
15.0
20.0
25.0
Mrz. 13 Jun. 13 Sep. 13 Dez. 13 Mrz. 14
EUReuromicron, RIC: EUCAn.DE
Analyst Dr. Norbert Kalliwoda Email: [email protected] Phone: +49 69 97 20 58 53 www.kalliwoda.com
euromicron AG

2 euromicron AG communication and control technology | Update | August 2014
Dr. Kalliwoda Research GmbH | Primary Research
Content
1 Company profile ........................................................................................................................3
2 Valuation ....................................................................................................................................4
3 H1/14 results ..............................................................................................................................5
4 Outlook .......................................................................................................................................7
5 Stock and shareholder structure ..............................................................................................8
6 Profit and loss statements .........................................................................................................9
7 Balance sheets ..........................................................................................................................10
8 Cash flow statements ...............................................................................................................11
9 Financial ratios ........................................................................................................................11

3 euromicron AG communication and control technology | Update | August 2014
Dr. Kalliwoda Research GmbH | Primary Research
1 Company profile
euromicron AG is a manufacturer and provider of network solutions and optical fibre technology. Moreover, the company is a full-service provider of communication and security solutions for different industries and requirements. euromicron covers the entire value chain. Along with planning, implementation and maintenance of communication and security solutions, which are usually based on IP networks, the company also offers development, production and distribution of network components as well as consulting and purchasing. The organization is divided into three segments and four marketing areas.
euromicron AG – Company structure
euromicron systems GmbH (D) ELABO GmbH (D) telent GmbH (D)
EUROMICRON Werkzeuge GmbH (D) euromicron austria GmbH (A) RSR Datacom
LWL-Sachsenkabel GmbH (D) euromicron solutions GmbH (D) GmbH & Co. KG (D)
MICROSENS GmbH & Co. KG (D) Qubix S.p.A (I) ProCom Professional & Services
MICROSENS Sp.z.o.o. (PL) SKM Skyline GmbH (D) GmbH (D)
Stark- und Schwachstrommontage euromicron NGB Fiber Optics GmbH (Ö)
GmbH (D) Avalan GmbH (D)
WCS Fiber Optics B.V. (N)
euromicron benelux S.A. (L)
ATECS AG (S)
Secure Information Management
GmbH (D)
euromicron networks GmbH (D)
Test and Working Station Systems Optical, Wireless and Wired Active/Passive Optical Network
TDM-, IP- and MPLS-Systems Networks Components
Intelligent Networks Analysis, Planning, Maintance and Wiring Systems
Switches and Cable Systems Implementation Spare Parts Service
Monitoring Stations Source: Company data, Dr. Kalliwoda Research GmbH

4 euromicron AG communication and control technology | Update | August 2014
Dr. Kalliwoda Research GmbH | Primary Research
2 Valuation
In order to value euromicron, we have used our DCF model, which derives a 12-months price target for the stock of €24.40. Compared to the current market level, this corresponds to an upside of 85.41%.
DCF model
Discounted Cash Flow Model (Basis 8/2014)
in EURm 2014E 2015E 2016E 2017E 2018E 2019E 2020E 2021E 2022E
Net sales 349,13 380,55 397,68 413,59 426,82 438,35 449,30 459,19 468,37
(y-o-y change) 6,0% 9,0% 4,5% 4,0% 3,2% 2,7% 2,5% 2,2% 2,0%
EBIT 16,22 21,89 28,88 33,35 38,86 39,89 40,41 40,83 41,17
(EBIT margin) 4,6% 5,7% 7,2% 8,0% 9,0% 9,0% 8,9% 8,8% 8,7%
NOPLAT 11,35 15,32 20,21 23,34 27,20 27,92 28,28 28,58 28,82
+ Depreciation 9,44 10,28 10,75 11,18 11,53 11,85 12,14 12,41 12,66
= Net operating cash f low 20,79 25,61 30,96 34,52 38,74 39,77 40,43 40,99 41,48
- Total investments (Capex and WC) -19,17 -22,05 -20,41 -20,74 -20,75 -20,85 -21,12 -21,24 -21,43
Capital expenditure -15,22 -16,07 -16,53 -16,96 -17,32 -17,63 -17,93 -18,19 -18,44 Working capital -3,95 -5,98 -3,88 -3,78 -3,43 -3,22 -3,19 -3,05 -2,98
= Free cash flow (FCF) 1,62 3,55 10,55 13,78 17,98 18,92 19,31 19,74 20,05
PV of FCF's 1,57 3,18 8,71 10,50 12,64 12,27 11,55 10,89 10,20
PV of FCFs in explicit period 81,51
PV of FCFs in terminal period 180,30
Enterprise value (EV) 261,80
+ Net cash / - net debt (31 March 2013) -94,32
+ Investments / - Minorities -0,34
Shareholder value 167,15
Number of shares outstanding (m) 7,18
Sensitivity analysis
WACC 8,4%Equity costs 9,9% 5,7% 6,7% 7,7% 8,7% 9,7% 10,7% 11,7%
Debt costs before tax 7,0% 5,4% 36,11 45,66 55,20 64,74 74,28 83,82 93,37
Tax rate 30,0% 6,4% 25,09 31,91 38,73 45,54 52,36 59,18 65,99
Debt costs after tax 4,9% 7,4% 18,08 23,22 28,36 33,50 38,63 43,77 48,91
Equity share 70,0% 8,4% 13,21 17,23 21,24 25,25 29,26 33,27 37,29Debt share 30,0% 9,4% 9,62 12,83 16,05 19,26 22,47 25,69 28,90
Fair value per share in € (today) 23,29 10,4% 6,85 9,48 12,10 14,72 17,35 19,97 22,59Fair value per share in € (in 12 months) 25,25
Phase 1
Terminal EBIT margin
WA
CC
Source: Dr. Kalliwoda Research GmbH

5 euromicron AG communication and control technology | Update | August 2014
Dr. Kalliwoda Research GmbH | Primary Research
3 H1/14 results
Revenues In H1/2014, euromicron generated revenues of €162.19m, which were 6.0% above last year. While sales in Germany accounted for €139.43m, 86.0% of total sales, those from other European markets grew by 14.23% to €15.11m (9.3% of total sales) and international revenues amounted to €7.65m (180.0% y-o-y). Additionally future revenues are backed by a good order intake of €164.1m vs. €154.8m in H1/13 and a strong order backlog of €128.4m vs. €127.0 in last year’s period. In H1/14, the fastest growing segment on the top-line was euromicron WAN services with revenues being up 14.4% to €48.28m. The segment was in addition also able to increase its profitability to 5.9% EBIT margin. We believe that this business segment will continue to be the primary source of the company’s growth, while offering a decent profitability. euromicron Süd showed a weaker development both on the revenues and EBIT level due to ongoing transformation costs of the integration program AGENDA500. euromicron’s segment euromicron Nord was able to enhance revenues by 1.4% (€56.85m) and EBIT margin was at still reasonable 11.3%.
H1/14 results vs. previous year
H1/14 vs. previous year
in EURm H1/14 H1/13
Q1/14 vs.
Q1/13
Net sales 162,19 153,09 6,0%
EBITDA 10,50 13,42 -21,7%
EBITDA margin 6,5% 8,8%
EBIT 5,51 9,22 -40,2%
EBIT margin 3,4% 6,0%
Net income 2,46 5,04 -51,3%
Net margin 1,5% 3,3%
Source: Company data, Dr. Kalliwoda Research GmbH

6 euromicron AG communication and control technology | Update | August 2014
Dr. Kalliwoda Research GmbH | Primary Research
Sales and EBIT margins according to segments
H1/14 H1/13 H1/14 H1/13
euromicron Nord euromicron WAN services
Sales €m 56,85 56,05 Sales €m 48,28 42,36
share in total sales 35,1% 36,6% share in total sales 29,8% 27,7%
EBIT margin 11,3% 13,8% EBIT margin 5,9% 5,6%
euromicron Süd Group (after consolidation)
Sales €m 62,84 63,08 Total sales 162,19 153,09
share in total sales 38,7% 41,2% change y-o-y 6,0%
EBIT margin -0,4% 3,1%
Germany Rest of the World
Sales €m 139,43 137,13 Sales €m 7,65 2,73
share in total sales 86,0% 89,6% share in total sales 4,7% 1,8%
Euro zone
Sales €m 15,11 13,23
share in total sales 9,3% 8,6%
Sales and EBIT margins according to segments H1/14 vs. H1/13
Source: Company data, Dr. Kalliwoda Research GmbH
Profitability
Share in total revenues H1/14 vs. H1/13
52,37%
31,16%
3,08%
13,31%
50,66%
30,21%
2,75%
13,26%
0,00%
10,00%
20,00%
30,00%
40,00%
50,00%
60,00%
Cost of sales Personnel
expenses
Depreciation &
amortisation
Other operating
expenses
H1/14 H1/13
Source: Company information, Dr. Kalliwoda Research GmbH

7 euromicron AG communication and control technology | Update | August 2014
Dr. Kalliwoda Research GmbH | Primary Research
Despite an increase of sales (+6.0%), euromicron reported both a lower operating income (EBIT) and net income y-o-y. Key reasons were (1) one-off integration and restructuring expenses for recently acquired companies (2) higher share of personnel expenses due to an increasing headcount (+2.5% vs. 31th of December 2013) (3) seasonal patterns.
Balance Sheet and Cash Flow At the end of 30 June 2014, the most important positions on euromicron’s balance sheet were (1) equity of €125.1m (2) goodwill of €113.53m and (3) gross amount due from customers for contract work of €76.881m. As of 30 June 2014, the company had interest-bearing debt of €119.789m (short- and long-term financial debt as well as pension provisions) and liquid funds (cash plus short-term financial assets) of €14.43m. Due to mainly smaller acquisitions, which the company has conducted in the past, goodwill amounted to €113.5m. euromicron’s net debt equalled €103.0m and the net gearing was 82.4% as of 30 June 2014. In the period January – June 2014, euromicron generated an operating cash flow of €-36.3m, which was as stated above significantly below last year (€6.0m), though one should mention that operating cash flow of period H1/2013 had been positively influenced by one-time effects stemming from the use of factoring (+€22.46m). Cash flow from investing in H1/2014 was €-11.48m vs. €-5.52m in last year’s period. As euromicron raised more additional debt again, the cash flow from financing increased from €1.55m in H1/13 to €23.36m. In total the company’s cash position increased by €6.94m since the beginning 30 June of 2013.
4 Outlook
As communicated by the management, euromicron will bring one of the most cost-intensive restructuring and integration phases of its Agenda 500 program to an end this year, which was a key factor for weak earnings in the last quarters. euromicron’s stock price had been under pressure recently, what could partly be explained by disappointing earnings vs. market consensus. Nevertheless we would like to point out some chinks of light: (1) improving EBITDA margin of 6.8% for Q2/2014 (vs. 6.1% Q1/2014), which is in line with the company’s guidance of an EBITDA margin corridor of 6-8% (2) stable order intake of €164.1m. In this respect we are confident that the management will meet their 2014 guidance of €340-360m for sales and an EBITDA margin of 6-8%. This is realistic given the strong order situation and cost reductions resulting from the restructuring and integration measures in our perspective. Following the recent news flow, we have kept both our estimates and the 12-months DCF-based price target of €24.40 for euromicron unchanged. As this equals an upside of 81.4% at present, we reiterate our BUY rating for the stock.

8 euromicron AG communication and control technology | Update | August 2014
Dr. Kalliwoda Research GmbH | Primary Research
5 Stock and shareholder structure
Share performace
0%
30%
60%
90%
120%
150%
180%
euromicron TecDax DAX
Source: Thomson Reuters, Dr. Kalliwoda Research GmbH
Shareholder structure
Streubesitz;
82,76%
Universal-
Investment
Gesellschaft
mbH; 4,57%
FPM Funds
Luxembourg;
2,72%
Kreissparkasse
Biberach; 1,41%Allianz Global
Investors; 2,74%
Union
Investment
Privatfonds
GmbH; 2,98%
ERSTE-
SPARINVEST
Kapitalanlagege
sellschaft
m.b.H.; 2,82%
Source: Company information, Dr.Kalliwoda Research GmbH

9 euromicron AG communication and control technology | Update | August 2014
Dr. Kalliwoda Research GmbH | Primary Research
6 Profit and loss statements
in EURm 2011 2012 2013 2014E 2015E 2016ESales split
euromicron Nord 116.79 108.29 112.86 119.28 129.64 135.08
euromicron Süd 137.63 119.16 114.65 121.18 131.71 137.24
WAN Services 66.85 102.58 101.86 108.67 119.21 125.37
Consolidation -15.96 0.00 0.00 0.00 0.00 0.00
Net sales 305.31 330.03 329.37 349.13 380.55 397.68
Internally produced and capitalised assets 1.95 5.61 3.13 1.90 1.90 1.90
Change in inventories -7.44 -5.85 -0.70 1.53 1.58 1.49
Total Output 299.81 329.79 331.81 352.56 384.03 401.07
Cost of goods sold -159.62 -171.00 -176.44 -187.48 -204.21 -213.27
Gross profit 140.19 158.79 155.37 165.09 179.82 187.80
Other operating income 2.72 2.80 1.90 1.94 1.98 2.02
Personnel costs -76.93 -93.59 -99.18 -104.68 -113.26 -117.48
Depreciation & Amortization -6.56 -7.94 -8.90 -9.44 -10.28 -10.75
Other operating expenses -35.26 -42.97 -43.68 -36.69 -36.37 -32.71
EBIT 24.16 17.08 5.51 16.22 21.89 28.88
Net financial results -6.36 -4.86 -3.81 -4.06 -4.31 -4.56
EBT 17.80 12.23 1.70 12.16 17.58 24.32
Income taxes -4.94 -3.40 -2.47 -3.65 -5.27 -7.30
Minority interests -0.67 -0.26 -0.12 -0.89 -1.28 -1.77
Net income / loss 12.19 8.57 -0.89 7.63 11.03 15.25
EPS 2.32 1.29 -0.12 1.06 1.54 2.13
DPS 1.15 0.30 0.00 0.53 0.77 1.06
Change y-o-y
Net sales n.a 8.10% -0.20% 6.00% 9.00% 4.50%
Total Output n.a 10.00% 0.61% 6.26% 8.93% 4.44%
Cost of goods sold n.a 7.13% 3.18% 6.26% 8.93% 4.44%
Gross profit n.a 13.26% -2.15% 6.26% 8.93% 4.44%
Other operating income n.a 2.68% -32.03% 2.00% 2.00% 2.00%
Personnel costs n.a 21.65% 5.98% 5.55% 8.19% 3.73%
Depreciation & Amortization n.a 21.03% 12.06% 6.00% 9.00% 4.50%
Other operating expenses n.a 21.86% 1.65% -15.99% -0.88% -10.05%
EBIT n.a -29.30% -67.75% 194.39% 34.97% 31.92%
Net financial results n.a -23.70% -21.58% 6.57% 6.16% 5.80%
EBT n.a -31.31% -86.09% 614.87% 44.59% 38.32%
Income taxes n.a -31.19% -27.46% 47.99% 44.59% 38.32%
Minority interests n.a -61.19% -52.31% 614.87% 44.59% 38.32%
Net income / loss n.a -29.71% -110.36% -958.73% 44.59% 38.32%
EPS n.a -44.58% -109.62% -958.73% 44.59% 38.32%
DPS n.a -73.91% -100.00% n.a n.a 38.32%
Share in total sales
Net sales 100.00 % 100.00 % 100.00 % 100.00 % 100.00 % 100.00 %
Total Output 98.20 % 99.93 % 100.74 % 100.98 % 100.91 % 100.85 %
Cost of goods sold -52.28 % -51.81 % -53.57 % -53.70 % -53.66 % -53.63 %
Gross profit 45.92 % 48.11 % 47.17 % 47.28 % 47.25 % 47.22 %
Other operating income 0.89 % 0.85 % 0.58 % 0.56 % 0.52 % 0.51 %
Personnel costs -25.20 % -28.36 % -30.11 % -29.98 % -29.76 % -29.54 %
Depreciation & Amortization -2.15 % -2.41 % -2.70 % -2.70 % -2.70 % -2.70 %
Other operating expenses -11.55 % -13.02 % -13.26 % -10.51 % -9.56 % -8.23 %
EBIT 7.91 % 5.18 % 1.67 % 4.65 % 5.75 % 7.26 %
Net financial results -2.08 % -1.47 % -1.16 % -1.16 % -1.13 % -1.15 %
EBT 5.83 % 3.70 % 0.52 % 3.48 % 4.62 % 6.12 %
Income taxes -1.62 % -1.03 % -0.75 % -1.04 % -1.39 % -1.83 %
Minority interests -0.22 % -0.08 % -0.04 % -0.25 % -0.34 % -0.45 %
Net income / loss 3.99 % 2.60 % -0.27 % 2.18 % 2.90 % 3.83 %
Dr. Kalliwoda | Research © 2014
Profit and loss statement - euromicron AG
Fiscal year

10 euromicron AG communication and control technology | Update | August 2014
Dr. Kalliwoda Research GmbH | Primary Research
7 Balance sheets
in EURm 2011 2012 2013 2014E 2015E 2016E Assets
Cash and cash equivalents 7.30 5.41 38.83 45.83 41.98 42.94Inventories 25.08 27.50 27.96 29.71 32.36 33.80Trade accounts and notes receivables 88.07 96.77 98.35 104.26 113.64 118.75Other current assets 5.17 7.47 6.43 6.81 7.42 7.76Other financial assets 1.16 0.23 2.22 2.35 2.56 2.68
Current assets 126.78 137.38 173.79 188.96 197.97 205.93 Property, plant and equipment 15.13 16.26 14.47 15.76 17.04 18.33Other intangible assets 18.26 21.03 23.71 28.21 32.71 37.21Goodwill 103.63 106.37 113.53 113.53 113.53 113.53Financial assets 0.73 0.72 0.96 1.02 1.11 1.16Other assets 0.18 0.20 0.11 0.11 0.12 0.13Deferred tax assets 0.47 1.93 2.30 0.00 0.00 0.00
Non-current assets 138.39 146.50 155.07 158.62 164.51 170.35
Total assets 265.16 283.88 328.86 347.58 362.48 376.28
Liabilities
Trade payables 31.62 42.87 54.64 57.03 61.00 62.54Tax liabilities 9.70 7.98 11.17 11.84 12.90 13.48Personnel liabilities 9.67 9.83 11.47 12.16 13.25 13.85Other short-term liabilities 13.88 6.07 5.59 5.92 6.45 6.74Short-term bank debt 29.76 31.00 30.39 29.39 28.39 27.39Finance lease 0.30 0.60 0.51 0.55 0.59 0.63Other financial liabilities 2.97 6.78 36.81 36.61 36.41 36.21Provisions 1.22 2.06 2.31 2.45 2.67 2.79
Current liabilities 99.12 107.19 152.88 155.94 161.66 163.63
Long-term bank debt 24.67 37.59 32.81 45.81 54.01 56.01Leasing debt 1.46 2.16 1.67 1.92 2.17 2.42Other financial debt 10.79 8.03 7.32 7.36 7.40 7.44Pension provisions 0.73 0.98 0.95 1.00 1.09 1.14Provisions 0.48 1.16 1.78 1.88 2.05 2.14Other liabilities 0.00 0.00 0.21 0.00 0.00 0.00Deferred tax liabilities 7.87 7.74 8.66 6.37 0.00 0.00
Long-term liabilities 46.00 57.65 53.39 64.35 66.72 69.16
Total liabilities 145.12 164.83 206.26 220.29 228.39 232.78
Shareholders equity 119.56 118.52 122.21 126.02 131.53 139.16Minority interests 0.48 0.53 0.39 1.28 2.56 4.33
Total equity and liabilities 265.16 283.88 328.86 347.58 362.48 376.28
Dr. Kalliwoda | Research © 2014
Balance sheet - euromicron AG
Fiscal year

11 euromicron AG communication and control technology | Update | August 2014
Dr. Kalliwoda Research GmbH | Primary Research
8 Cash flow statements
in EURm 2011 2012 2013 2014E 2015E 2016E Net income / loss 12.19 8.57 -0.89 7.63 11.03 15.25
Depreciation & Amortization 6.56 7.94 8.90 9.44 10.28 10.75
Change of working capital -25.36 -11.82 9.12 -3.95 15.10 -3.95
Others 7.08 2.27 22.30 0.26 1.42 0.26
Net operating cash flow 0.47 6.96 39.43 13.37 37.84 22.30
Cash flow from investment -20.40 -13.29 -5.13 -15.22 -16 .96 -15.22
Free cash flow -19.92 -6.33 34.31 -1.85 20.88 7.08
Cash flow from financing 18.65 4.45 -0.89 8.86 -24.73 -6. 13
Change of cash -1.27 -1.89 33.42 7.00 -3.85 0.96
Cash at the beginning of the period 8.57 7.30 5.41 38.83 45.83 41.98
Cash at the end of the period 7.30 5.41 38.83 45.83 41.98 42.94
Dr. Kalliwoda | Research © 2014
Cash flow statement - euromicron AG
Fiscal year
9 Financial ratios
Fiscal year 2011 2012 2013E 2014E 2015E 2016E 2017E 2018E
Gross margin 46.76% 48.15% 46.82% 46.82% 46.82% 46.82% 46.82% 46.82%
EBITDA margin 10.06% 7.58% 4.38% 7.35% 8.45% 9.96% 10.77% 11.81%
EBIT margin 8.06% 5.18% 1.66% 4.60% 5.70% 7.20% 8.00% 9.04%
Net margin 4.07% 2.60% -0.27% 2.16% 2.87% 3.80% 4.35% 5.03%
Return on equity (ROE) 11.70% 7.20% -0.74% 6.14% 8.56% 11.27% 12.61% 14.08%
Return on assets (ROA) 8.04% 4.89% 0.95% 3.45% 4.32% 5.36% 5.89% 6.54%
Return on capital employed (ROCE) 10.51% 6.98% -1.41% 5.92% 7.63% 9.51% 10.34% 11.43%
Net debt (in EURm) 62.22 81.49 69.41 74.46 85.51 85.62 83.87 79.64
Net gearing 52.04% 68.75% 56.79% 59.08% 65.01% 61.53% 56.59% 50.08%
Equity ratio 45.09% 41.75% 37.16% 36.26% 36.29% 36.98% 37.91% 39.37%
Current ratio 1.28 1.28 1.14 1.21 1.22 1.26 1.30 1.34
Quick ratio 0.97 0.96 0.91 0.98 0.98 1.00 1.04 1.07
Net interest cover 3.80 3.52 1.45 4.00 5.08 6.34 7.48 8.92
Net debt/EBITDA 2.02 3.26 4.82 2.90 2.66 2.16 1.88 1.58
Tangible BVPS 3.03 1.82 1.21 1.74 2.51 3.57 4.83 6.34
Capex/Sales -11.57% -4.42% -5.15% -4.36% -4.22% -4.16% -4.10% -4.06%
Working capital/Sales 17.51% 19.69% 15.14% 15.42% 15.72% 16.02% 16.31% 16.61%
EV/Sales 0.63 0.58 0.58 0.55 0.50 0.48 0.46 0.45
EV/EBITDA 6.21 7.63 13.24 7.44 5.93 4.82 4.29 3.79
EV/EBIT 7.90 11.17 34.64 11.77 8.72 6.61 5.72 4.91
P/Tangible BVPS 4.44 7.38 11.12 7.73 5.36 3.77 2.78 2.12
P/E 5.80 10.46 -108.70 12.66 8.75 6.33 5.33 4.46
P/FCF -4.84 -15.25 2.81 -52.04 4.62 13.63 76.61 7.44
Source: Company information, Dr. Kalliwoda Research GmbH

12 euromicron AG communication and control technology | Update | August 2014
Dr. Kalliwoda Research GmbH | Primary Research
-10.00
-2.50
5.00
12.50
20.00
27.50
35.00
42.50
50.00
0.00
80.00
160.00
240.00
320.00
400.00
480.00
2012 2013 2014E 2015E 2016E 2017E 2018E
%EURm Revenue growth
euromicron Nord34.3%
euromicron Süd 34.8%
euromicron WAN services
30.9%
Sales split 2013
-3.00
0.00
3.00
6.00
9.00
12.00
15.00
2011 2012 2013 2014E 2015E 2016E 2017E
Profitability (%)
Return on Assets Return on Common Equity
-2.00
0.00
2.00
4.00
6.00
8.00
10.00
2011 2012 2013 2014E 2015E 2016E 2017E
Margin developmentEBIT margin
Net margin
Return on Assets
0.00
8.00
16.00
24.00
32.00
40.00
48.00
2011 2012 2013 2014E 2015E 2016E 2017E
Liquid funds (EURm)
0.00
8.00
16.00
24.00
32.00
40.00
48.00
2011 2012 2013 2014E 2015E 2016E 2017E
CAPEX (EURm)
0.00
0.40
0.80
1.20
1.60
2.00
2011 2012 2013 2014E 2015E 2016E 2017E
Current ratio
0.00
3.00
6.00
9.00
12.00
15.00
18.00
2011 2012 2013 2014E 2015E 2016E 2017E
P/Tangible BVPS
Source: Company information, Dr. Kalliwoda Research GmbH

13 euromicron AG communication and control technology | Update | August 2014
Dr. Kalliwoda Research GmbH | Primary Research
Primary Research │Fair Value Analysis │International Roadshows
Arndtstr. 47 60325 Frankfurt Tel.: 069-97 20 58 53 Fax: 069-13 81 92 15 www.kalliwoda.com
Head/CEO: Dr. Norbert Kalliwoda E-Mail: [email protected]
CEFA-Analyst; University of Frankfurt/Main; PhD in Economics; Dipl.-Kfm.
Sectors: IT, Software, Electricals & Electronics, Mechanical Engineering, Logistics, Laser, Technology, Raw Materials
Dr. Peter Arendarski E-Mail: [email protected]
Senior-Analyst, Msc & Ph.D in Finance (Poznan Univers. of Economics),CFA Level 3 Candidate
Sectors: Technology,Raw Materials, Banks & Insurances, Financial-Modelling (Quant., Buyside)
Patrick Bellmann E-Mail: [email protected]
Junior-Analyst; WHU - Otto Beisheim School of Management, Vallendar
Sectors: Support Research and Quantitative Approach
Michael John E-Mail: [email protected]
Dipl.-Ing. (Aachen) Sectors: Chemicals, Chemical Engineering, Basic Metals, Renewable Energies, Laser/Physics
Rainer Koch E-Mail: [email protected]
Computer-Science/Dipl.-Betriebw, (Frankfurt); seasoned international Executive IT-Industry
Sectors: IT, IT-Services, Internet, Media, Internet, Emerging Markets
Olaf Köster E-Mail: [email protected]
Dipl.-Betriebswirt, EBS Sectors: Renewable Energy/Technology
Adrian Kowollik E-Mail: [email protected]
Dipl.-Kfm.; Humboldt-Universität zu Berlin, CFA Candidate
Sectors: Media, Internet, Gaming, Technology, Eastern European stocks
Maximilian F. Kaessens E-Mail: [email protected]
Bachelor of Science in Business Administration (Babson College, Babson Park, MA (US))
Sectors: Financials, Real Estate
Dr. Christoph Piechaczek E-Mail: [email protected]
Dipl.-Biologist; Technical University Darmstadt; Univ. Witten-Herdecke.
Sectors: Biotech & Healthcare; Medical Technology Pharmaceutical
Dario Maugeri E-Mail: [email protected]
Master of Science in Corporate Finance; Rotterdam School of Management norb
Sectors: Automotive, Technology
Nele Rave E-Mail: [email protected]
Lawyer; Native Speaker, German School London,
Legal adviser
Hellmut Schaarschmidt; E-Mail: [email protected]
Dipl.-Geophysicists; University of Frankfurt/Main.
Sectors: Oil, Regenerative Energies, Specialities Chemicals, Utilities
Dr. Erik Schneider E-Mail: [email protected]
Dipl.-Biologist; Technical University Darmstadt; Univ. Hamburg.
Sectors: Biotech & Healthcare; Medical Technology Pharmaceutical
Hans-Georg Sutter E-Mail: [email protected]
Dipl.-Wirtschaftsingenieur University Kaiserslautern
Sectors: IT/e-commerce
Rainer Wochele E-Mail: [email protected]
Bachelor of Science in Economics and Business Administration (Goethe University Frankfurt M. / Graduation Fall 2013)
Junior-Analyst
Also view Sales and Earnings Estimates: DR. KALLIWODA │ RESEARCH on Terminals of Bloomberg, Thomson Reuters, vwd group, Capital IQ and Factset
Analyst of this research: Dr. Norbert Kalliwoda, CEFA

14 euromicron AG communication and control technology | Update | August 2014
Dr. Kalliwoda Research GmbH | Primary Research
Essential information, disclosures and disclaimer A. Essential information Investments in financial instruments and securities (e.g. equities, bonds) generally involve high risks. It is possible that investors lose some or all of their invested money. Potential investors should be aware of the fact that prices of securities could fall and rise. Thus, the income from such investments might be subject to considerable fluctuations. Investment strategies are not appropriate at all times and past results are not a guarantee of the future performance. Investors should make their own and independent decisions as to whether undertake a risky investment. B. Disclosures according to Section 34b of the German Securities Trading Act (WpHG) and the German Regulation governing the Analysis of Financial Instruments (FinAnV). I. Information about the company held accountable and regulatory authority:
Company responsible for the content of this document: DR. KALLIWODA | RESEARCH GmbH, Frankfurt am Main, Germany. Regulatory authority for DR. KALLIWODA | RESEARCH GmbH is the Federal Financial Supervisory Authority (BaFin), Graurheindorfer Straße 108, 53117 Bonn, Germany and Lurgiallee 12, 60439 Frankfurt am Main, Germany. II. Additional Information: 1. Sources of information: Essential sources of information for the compilation of this document are publications from domestic and international information services and media (e.g. Bloomberg, dpa-AFX, Reuters, VWD, among others), financial press (e.g. Allgemeine Zeitung Frankfurter, Börsenzeitung, Financial Times Handelsblatt and others), specialized trade press, published statistics, rating agencies as well as publications by peer group companies and the company itself. This document was made available to the company before publishing to ensure the correctness of the information provided. 2. Summary of the basis of valuation principles and methods used to prepare this document: Within the scope of the evaluation of companies, the following valuation methods are applied: Multiple-based models (Price/Earnings, Price/Cash-flow, Price/Book value, EV/Sales, EV/EBIT, EV/EBITDA), peer group comparisons, historic valuation methods, discounting models, sum-of-the-parts-approaches, substance-valuation methods and SWOT-analyses. The valuation principles and models are dependent on macroeconomic factors, such as interest rates, exchange rates, raw materials and on basic assumptions about the economy. Moreover, the value of enterprises is affected by market moods and market sentiment. The approaches are based on expectations that could change rapidly and in advance warning according to developments specific to the individual branch. The valuation results and fair values derived from the models might therefore change accordingly. The ratings are the evaluation results and refer to a fair value pricing reflecting a time-horizon of twelve-months. Nevertheless, evaluation results are subject to changing market conditions and constitute merely a snapshot. The evaluation results and fair values may be reached faster or slower than expected by the analysts. The results and fair values may be scaled upwards or downwards.
15 euromicron AG communication and control technology | Update | August 2014
Dr. Kalliwoda Research GmbH | Primary Research
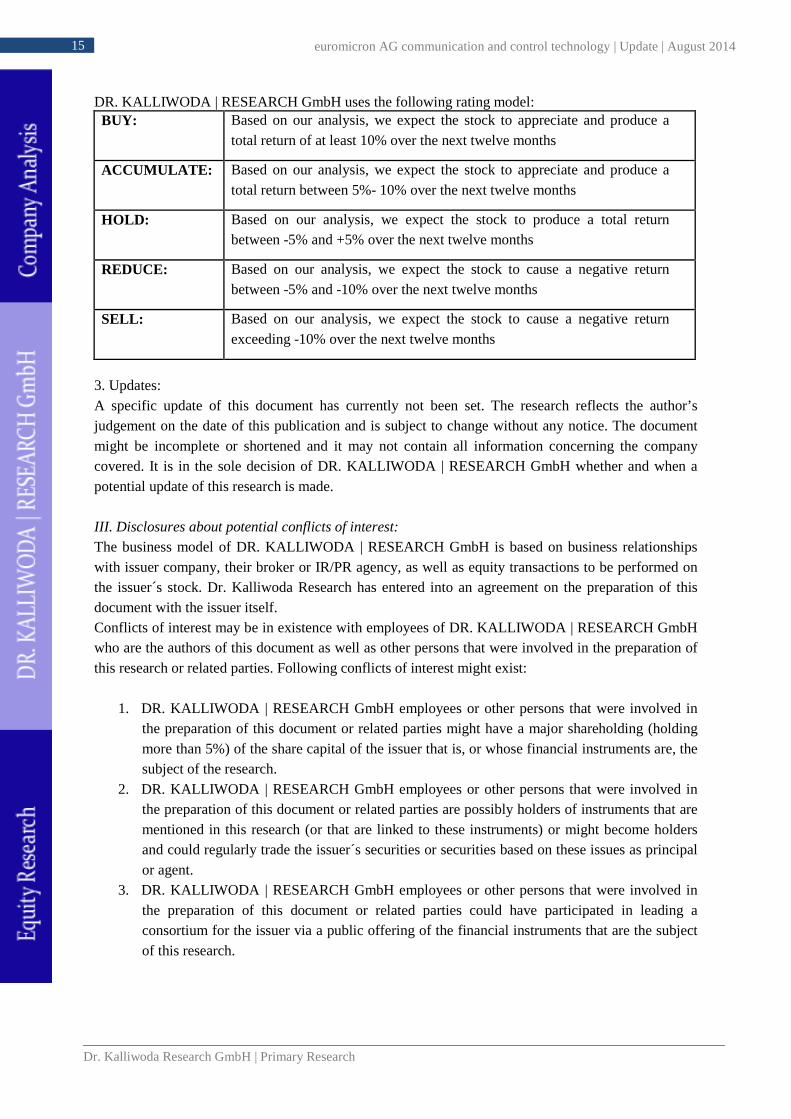
DR. KALLIWODA | RESEARCH GmbH uses the following rating model: BUY: Based on our analysis, we expect the stock to appreciate and produce a
total return of at least 10% over the next twelve months
ACCUMULATE: Based on our analysis, we expect the stock to appreciate and produce a total return between 5%- 10% over the next twelve months
HOLD: Based on our analysis, we expect the stock to produce a total return between -5% and +5% over the next twelve months
REDUCE: Based on our analysis, we expect the stock to cause a negative return between -5% and -10% over the next twelve months
SELL: Based on our analysis, we expect the stock to cause a negative return exceeding -10% over the next twelve months
3. Updates: A specific update of this document has currently not been set. The research reflects the author’s judgement on the date of this publication and is subject to change without any notice. The document might be incomplete or shortened and it may not contain all information concerning the company covered. It is in the sole decision of DR. KALLIWODA | RESEARCH GmbH whether and when a potential update of this research is made.
III. Disclosures about potential conflicts of interest: The business model of DR. KALLIWODA | RESEARCH GmbH is based on business relationships with issuer company, their broker or IR/PR agency, as well as equity transactions to be performed on the issuer´s stock. Dr. Kalliwoda Research has entered into an agreement on the preparation of this document with the issuer itself. Conflicts of interest may be in existence with employees of DR. KALLIWODA | RESEARCH GmbH who are the authors of this document as well as other persons that were involved in the preparation of this research or related parties. Following conflicts of interest might exist:
1. DR. KALLIWODA | RESEARCH GmbH employees or other persons that were involved in the preparation of this document or related parties might have a major shareholding (holding more than 5%) of the share capital of the issuer that is, or whose financial instruments are, the subject of the research.
2. DR. KALLIWODA | RESEARCH GmbH employees or other persons that were involved in the preparation of this document or related parties are possibly holders of instruments that are mentioned in this research (or that are linked to these instruments) or might become holders and could regularly trade the issuer´s securities or securities based on these issues as principal or agent.
3. DR. KALLIWODA | RESEARCH GmbH employees or other persons that were involved in the preparation of this document or related parties could have participated in leading a consortium for the issuer via a public offering of the financial instruments that are the subject of this research.

16 euromicron AG communication and control technology | Update | August 2014
Dr. Kalliwoda Research GmbH | Primary Research
4. DR. KALLIWODA | RESEARCH GmbH employees or other persons that were involved in the preparation of this document or related parties might have been party to an agreement on the provision of investment banking services with the issuer which is the subject of this research, or have received services or a pledge to perform under the terms of such an arrangement during the same period.
5. DR. KALLIWODA | RESEARCH GmbH employees or other persons that were involved in the preparation of this document or related parties may have other substantial economic interests concerning to the issuer, who is the subject of this research.
The analysts have limited access to information that possibly could constitute a conflict of interest for the institution. DR. KALLIWODA | RESEARCH GmbH keeps insider registers appropriate to sec. 15 WpHG for assignees that normally have approach to inside information. Insiders´ dealings appropriate to sec. 14 WpHG are categorically prohibited. The analysts that composed this research did not receive or acquire shares in the issuer that is the subject of this document at any time. The analysts herby certify that all of the views expressed accurately reflect the individual views about the issuer. No part of the remuneration was, is or will be, directly or indirectly, linked to the evaluation result or views expressed by the analyst in this research.
C. Disclaimer: This document is published and being distributed by DR. KALLIWODA | RESEARCH GmbH solely for informational purposes and for the personal use by persons in Continental Europe. This research is not intended to be in any form an offer or advice to buy or sell the securities referred to herein. This research is intended to provide information to assist investors in making their own investment decisions. Any decision to purchase any securities of the issuer must be made solely on the basis of the information contained in the offering documents from the issuer relating to such securities and not on the contents hereof. Potential investors should seek professional and individual information and advice before making their investment decisions. This document neither constitutes a contract nor any kind of obligation. Neither this document nor any copy, in whole or in part, thereof may be distributed in any other jurisdiction where its distribution might be restricted by law. The information within this document has been obtained from sources believed by DR. KALLIWODA | RESEARCH GmbH to be reliable. DR. KALLIWODA | RESEARCH GmbH does not examine if the information is verified and complete, nor guarantees its correctness and completeness. Although due attention has been taken during the compilation of this document, it cannot be excluded that the information given is not complete or the document contains mistakes. The liability of DR. KALLIWODA | RESEARCH GmbH shall be restricted to gross negligence and willful misconduct. Possible faults or incompleteness of this document may be corrected by DR. KALLIWODA | RESEARCH GmbH and do not constitute reasons for liability, neither with regard to indirect nor to direct or consequential losses. Moreover, DR. KALLIWODA | RESEARCH GmbH does not accept any responsibility and liability for any damage arising from using this research or its contents or otherwise arising in relation herewith. In each case, the liability and responsibility of DR. KALLIWODA | RESEARCH GmbH is limited to typical, predictable damages and the liability for any direct or indirect losses is excluded.
17 euromicron AG communication and control technology | Update | August 2014
Dr. Kalliwoda Research GmbH | Primary Research
This document is subject to the laws of the Federal Republic of Germany. Place of jurisdiction is Frankfurt am Main, Germany. In the United Kingdom this document is to be distributed only to persons who are described in Section 11 (3) of the Financial Services Act 1986 (Investment Advertisements) (Exemptions) Order 1996 (as amended). This research may not be distributed and forwarded directly or indirectly to any other group of individuals. The distribution of this document in other international jurisdictions may be restricted by law and individuals who possess this study should inform themselves of any existing restrictions and comply with them.
Neither this document nor any copy of it may be taken or transmitted into the United States of America, Canada, Japan or Australia or distributed, directly or indirectly, in the United States of America, Canada, Japan or Australia or to any resident thereof. Any Failure to comply with these restrictions may constitute a violation of United States, Canadian, Japanese or Australian securities laws or the law of any other jurisdiction. By accepting this document the reader or user agrees and accepts to be bound by all of the foregoing provisions and this disclaimer. Moreover, the user accepts not to distribute this document to unauthorized persons. The user of this document has to compensate DR. KALLIWODA | RESEARCH GmbH for any disadvantages, damages, claims and losses resulting from or in relation with the unauthorized use of this document. © 2014 DR. KALLIWODA | RESEARCH GmbH, Arndtstraße 47, D-60325 Frankfurt am Main. All rights reserved.