update on a niosh engineering control for respirable ... to prevent workplace ... production testing...
TRANSCRIPT
Update on a NIOSH Engineering Control for Respirable Crystalline Silica at Hydraulic Fracturing Operations
Bradley King, PhD, MPH, CIH NIOSH Western States Office
Acknowledgements • Eric Esswein, MSPH, CIH • Barbara Alexander, PhD, PE • Michael G. Gressel, PhD, PE • Jerry L. Kratzer • H. Amy Feng, MS • Arthur L. Miller, PhD • Emanuele Cauda, PhD • John Snawder, PhD • Michael Breitenstein
December 2-3, 2014
NIOSH thanks our industry partners (esp. their employees) for their leadership, commitment, and vision to OS&H and for their participation in NIOSH Safety & Health Research in Upstream Oil and Gas Extraction.
December 2-3, 2014
Acknowledgements
The findings and conclusions in this presentation have not been formally disseminated by NIOSH and should not be construed to represent any agency determination or policy.
December 2-3, 2014
Disclaimer
• U.S. Department of Health and Human Services
• Centers for Disease Control and Prevention
• A Research Agency • Non-regulatory • “Assure safe and healthful
working conditions for all workers”
• Not OSHA (Dept. of Labor)
• Providing National and World Leadership to Prevent Workplace Illnesses and Injuries
• Locations – Office of the Director: Washington, DC – DART, DSHEFS: Cincinnati, OH – WSO: Denver, CO – HELD: Morgantown, WV – OMSHR: Spokane, WA – OMSHR: Pittsburgh, PA – APO: Anchorage, AK
December 2-3, 2014
December 2-3, 2014
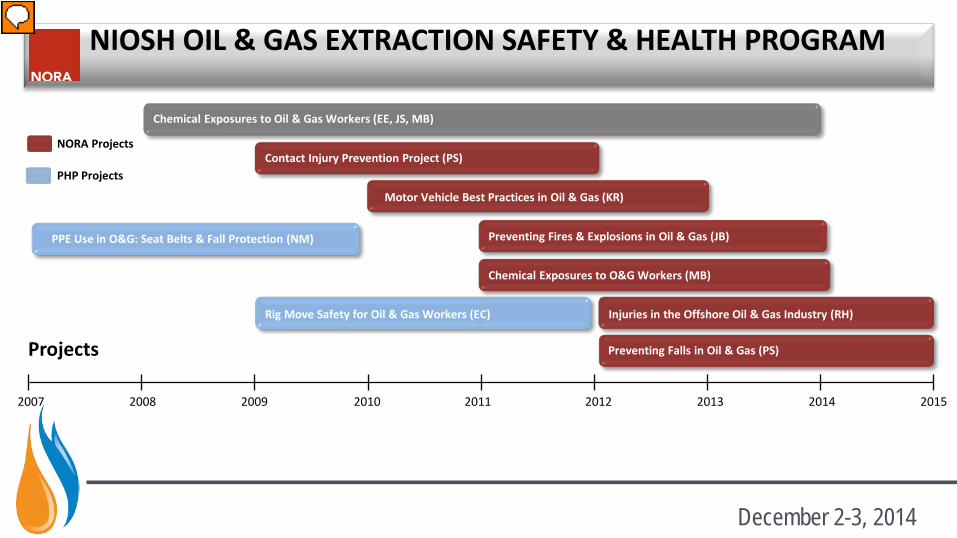
NIOSH OIL & GAS EXTRACTION SAFETY & HEALTH PROGRAM
2007 2008 2009 2010 2011 2012 2013 2014 2015
Chemical Exposures to Oil & Gas Workers (EE, JS, MB)
Contact Injury Prevention Project (PS)
Motor Vehicle Best Practices in Oil & Gas (KR)
Preventing Fires & Explosions in Oil & Gas (JB)
Injuries in the Offshore Oil & Gas Industry (RH)
Preventing Falls in Oil & Gas (PS)
PPE Use in O&G: Seat Belts & Fall Protection (NM)
Rig Move Safety for Oil & Gas Workers (EC)
Projects
NORA Projects
PHP Projects
Chemical Exposures to O&G Workers (MB)
December 2-3, 2014
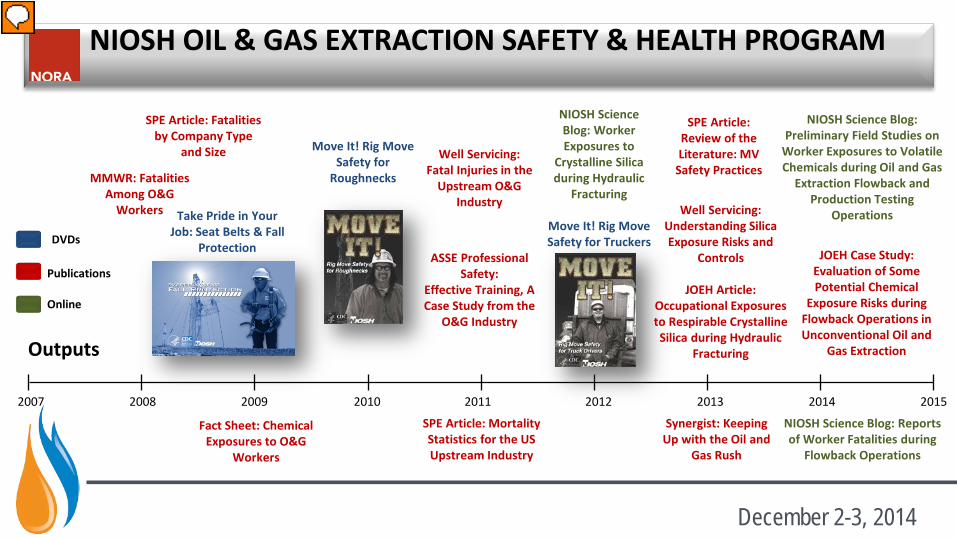
NIOSH OIL & GAS EXTRACTION SAFETY & HEALTH PROGRAM
2007 2008 2009 2010 2011 2012 2013 2014 2015
SPE Article: Fatalities by Company Type
and Size
MMWR: Fatalities Among O&G
Workers Take Pride in Your Job: Seat Belts & Fall
Protection
Fact Sheet: Chemical Exposures to O&G
Workers
Move It! Rig Move Safety for
Roughnecks
SPE Article: Mortality Statistics for the US Upstream Industry
Well Servicing: Fatal Injuries in the
Upstream O&G Industry
ASSE Professional Safety:
Effective Training, A Case Study from the
O&G Industry
Move It! Rig Move Safety for Truckers
Publications
DVDs
JOEH Article: Occupational Exposures to Respirable Crystalline Silica during Hydraulic
Fracturing
SPE Article: Review of the Literature: MV
Safety Practices
Well Servicing: Understanding Silica Exposure Risks and
Controls
Synergist: Keeping Up with the Oil and
Gas Rush
NIOSH Science Blog: Reports of Worker Fatalities during
Flowback Operations
Online
NIOSH Science Blog: Preliminary Field Studies on
Worker Exposures to Volatile Chemicals during Oil and Gas
Extraction Flowback and Production Testing
Operations
JOEH Case Study: Evaluation of Some Potential Chemical
Exposure Risks during Flowback Operations in Unconventional Oil and
Gas Extraction
NIOSH Science Blog: Worker Exposures to
Crystalline Silica during Hydraulic
Fracturing
Outputs
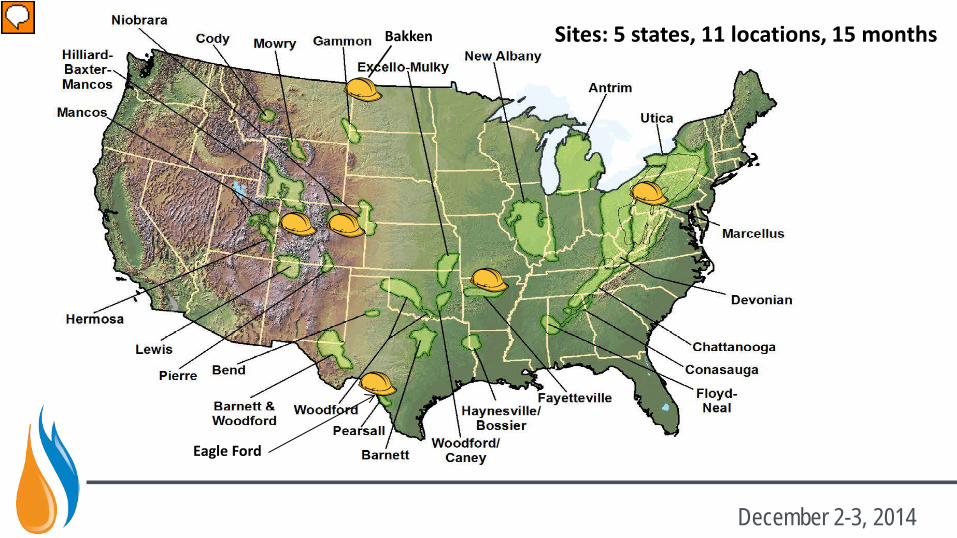
Bakken
Eagle Ford
Sites: 5 states, 11 locations, 15 months
Eagle Ford
Bakken
December 2-3, 2014
December 2-3, 2014

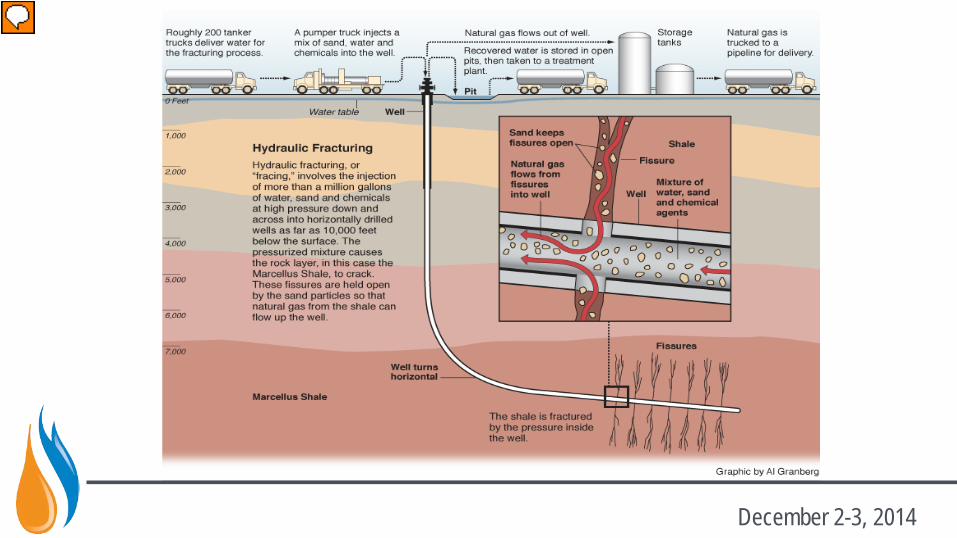
Sand Use in Hydraulic Fracturing • Silica sand = proppant • Hundreds of thousands lbs. per stage • > 90% of all oil and gas wells HF • Virtually 100% quartz • Workers in close
proximity to dust generation
December 2-3, 2014
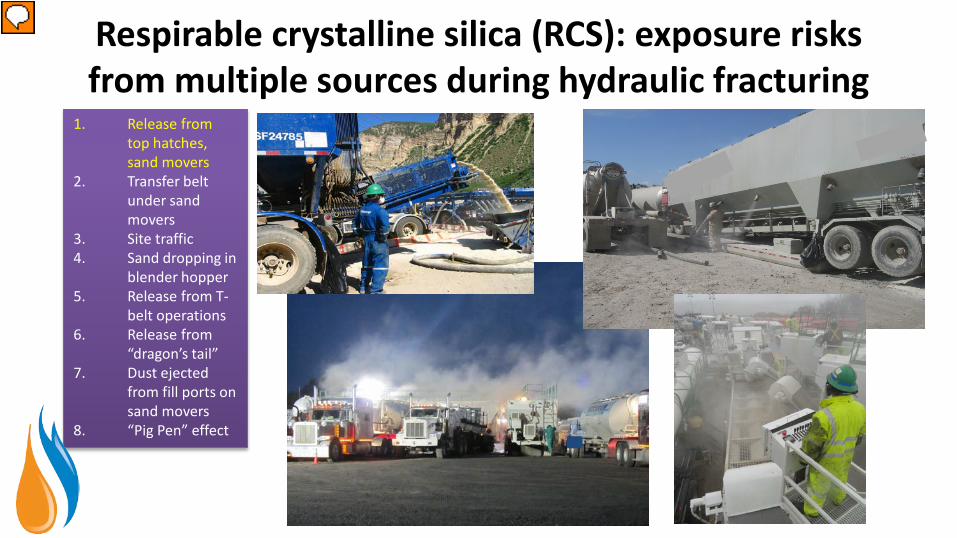
Respirable crystalline silica (RCS): exposure risks from multiple sources during hydraulic fracturing
1. Release from top hatches, sand movers
2. Transfer belt under sand movers
3. Site traffic 4. Sand dropping in
blender hopper 5. Release from T-
belt operations 6. Release from
“dragon’s tail” 7. Dust ejected
from fill ports on sand movers
8. “Pig Pen” effect
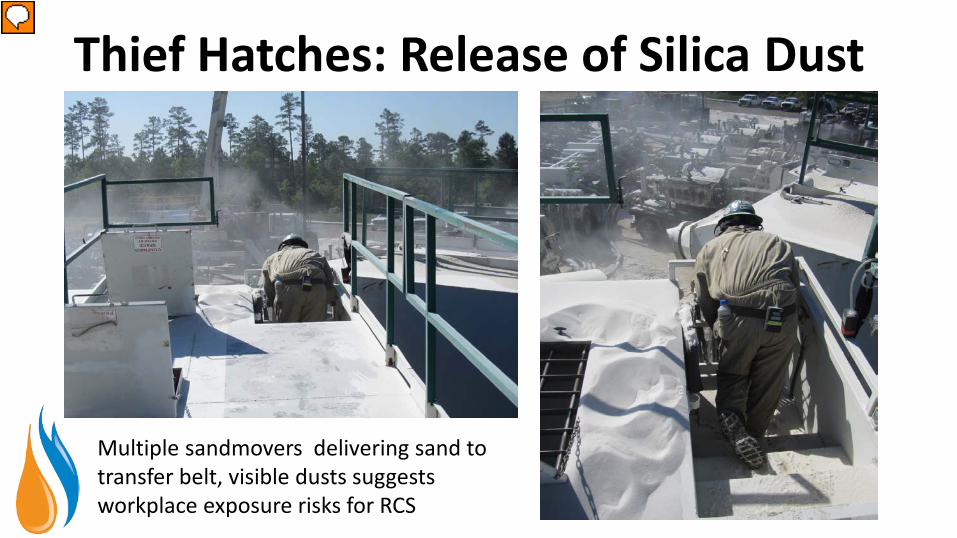
Thief Hatches: Release of Silica Dust
Sand mover
Multiple sandmovers delivering sand to transfer belt, visible dusts suggests workplace exposure risks for RCS
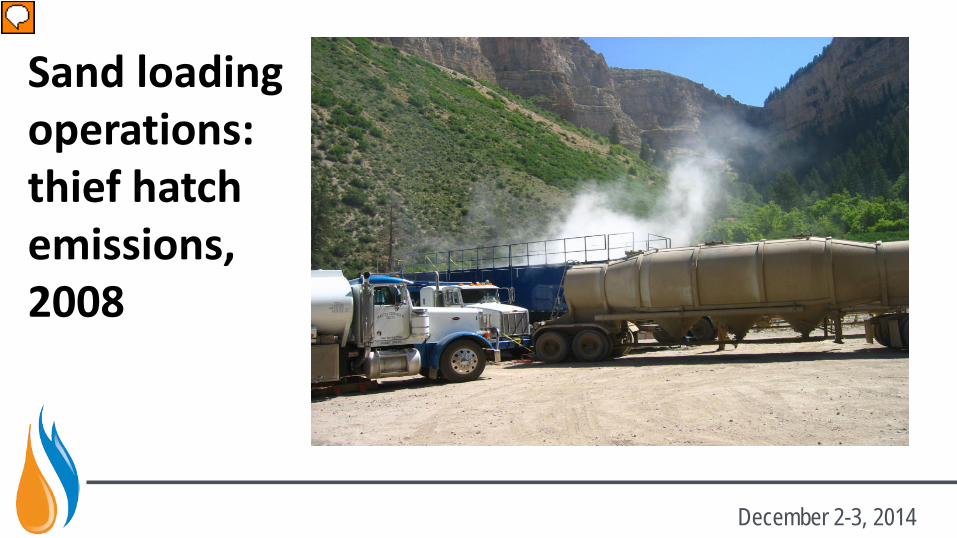
Sand loading operations: thief hatch emissions, 2008
December 2-3, 2014
December 2-3, 2014
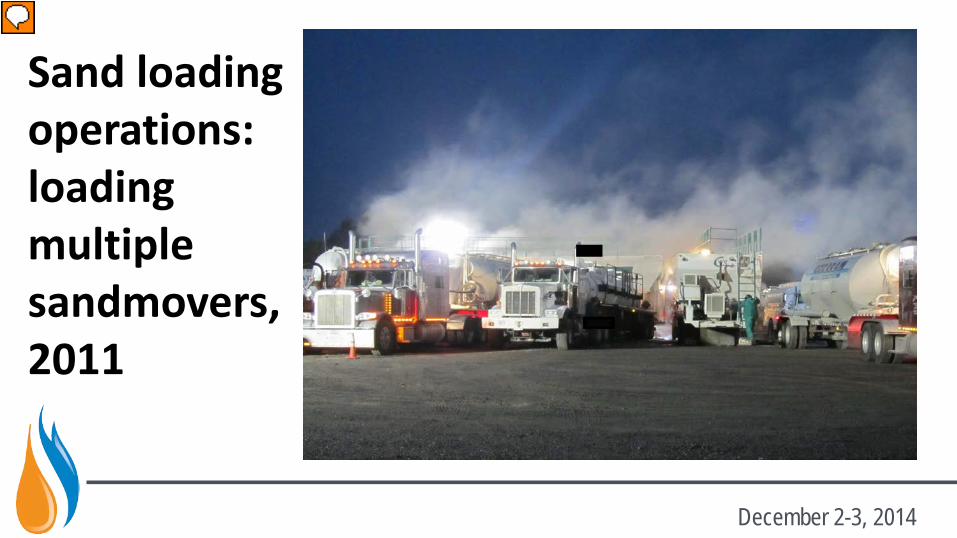
Sand loading operations: loading multiple sandmovers, 2011
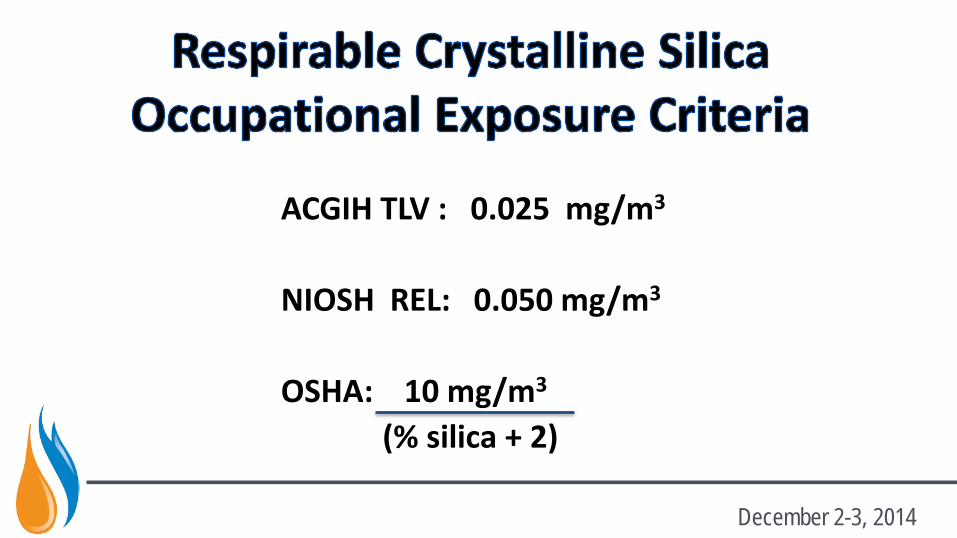
ACGIH TLV : 0.025 mg/m3
NIOSH REL: 0.050 mg/m3
OSHA: 10 mg/m3
(% silica + 2)
December 2-3, 2014

Silica exposures at hydraulic fracturing sites can exceed OEL’s 1
Site > ACGIH TLV > NIOSH REL > OSHA PEL Total # samples
A 24 (92.3%) 19 (73.1%) 14 (53.9%) 26 B 16 (84.2%) 14 (73.7%) 12 (63.2%) 19 C 5 (62.5%) 5 (62.5%) 4 (50.0%) 8 D 19 (90.5%) 14 (66.7%) 9 (42.9%) 21 E 25 (92.6%) 23 (85.2%) 18 (66.7%) 27 F 4 (40%) 1 (10%) 0 10
Total 93 (83.8%) 76 (68.5%) 57 (51.4%) 111 1 Esswein, Breitenstein, Snawder, et.al,. Occupational Exposures to Respirable Crystalline Silica in Hydraulic Fracturing Jour. Occ. Env. Hyg. Vol. 10, Issue 7, May, 2013
December 2-3, 2014
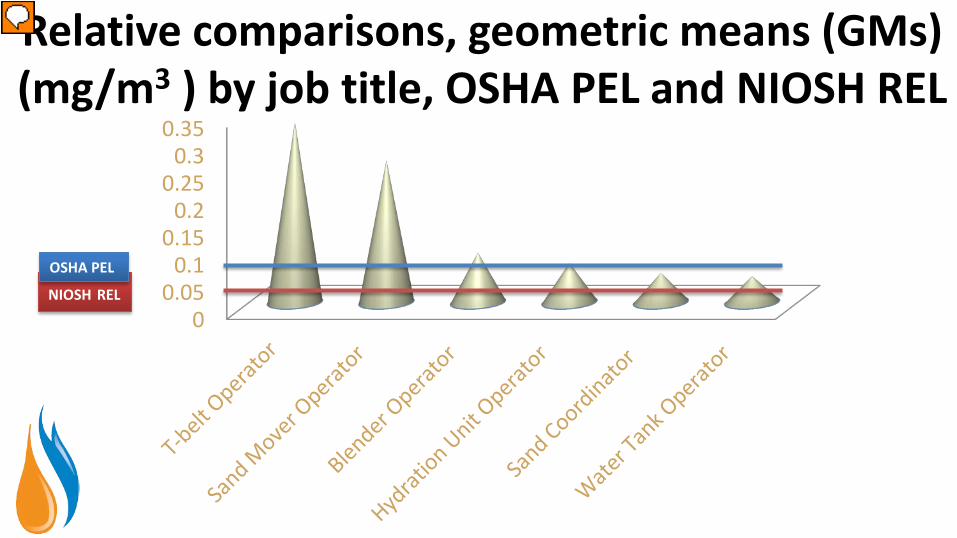
Relative comparisons, geometric means (GMs) (mg/m3 ) by job title, OSHA PEL and NIOSH REL
00.05
0.10.15
0.20.25
0.30.35
NIOSH REL
OSHA PEL
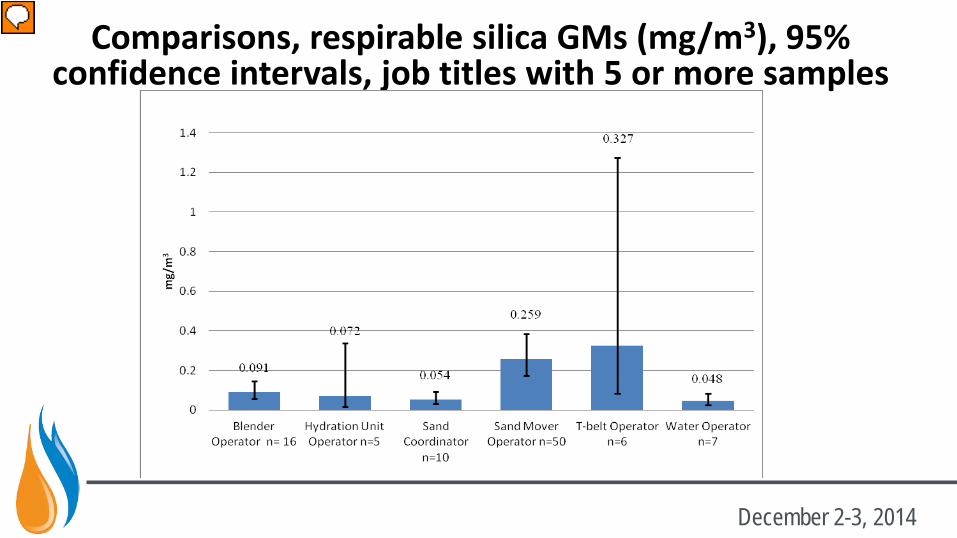
Comparisons, respirable silica GMs (mg/m3), 95% confidence intervals, job titles with 5 or more samples
December 2-3, 2014
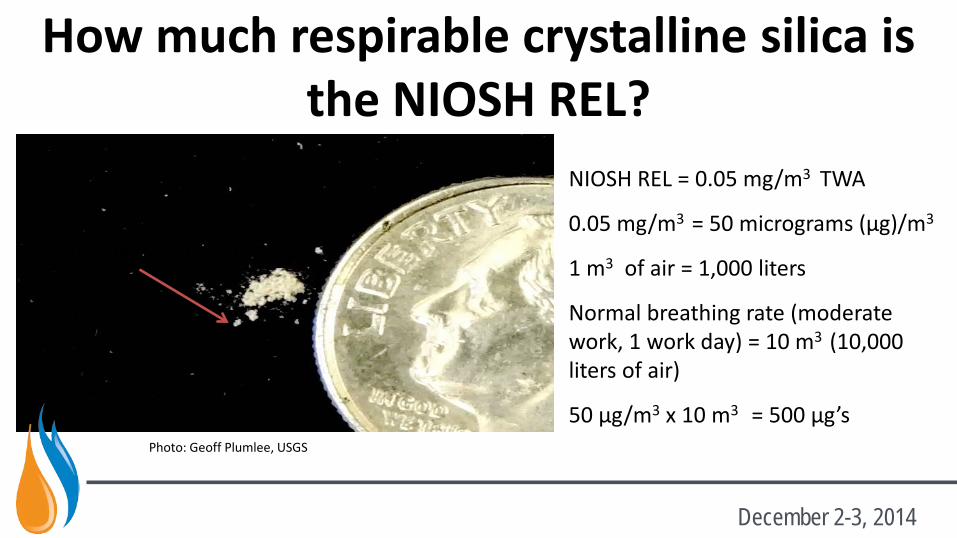
How much respirable crystalline silica is the NIOSH REL?
500 micrograms (µg’s)
Photo: Geoff Plumlee, USGS
NIOSH REL = 0.05 mg/m3 TWA
0.05 mg/m3 = 50 micrograms (µg)/m3
1 m3 of air = 1,000 liters
Normal breathing rate (moderate work, 1 work day) = 10 m3 (10,000 liters of air)
50 µg/m3 x 10 m3 = 500 µg’s
December 2-3, 2014
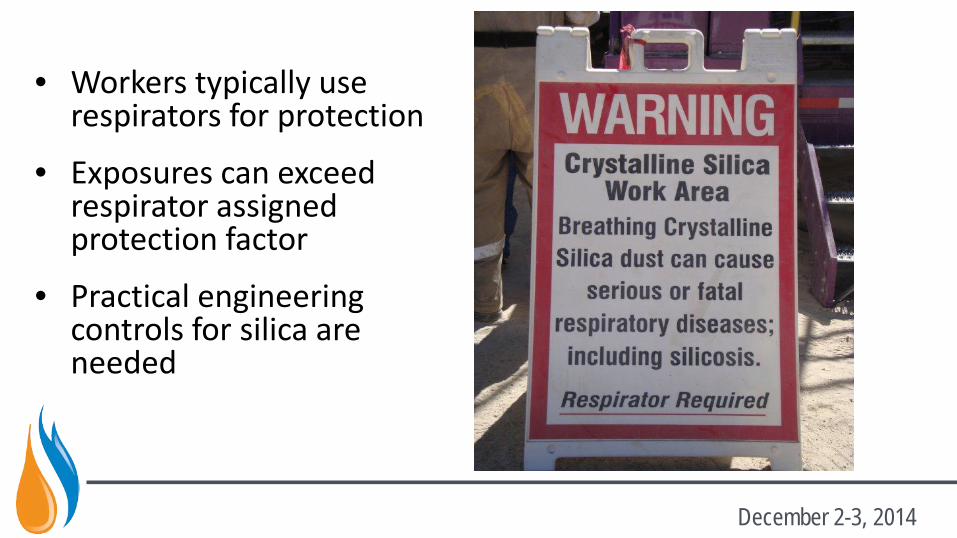
• Workers typically use respirators for protection
• Exposures can exceed respirator assigned protection factor
• Practical engineering controls for silica are needed
December 2-3, 2014

Job Title
Total # of samples
Arithmetic Mean
NIOSH REL
Arithmetic Std.
Deviation
Min
Max
Median
Blender Operator 16 2.58 0.59 0.14 9.70 2.03
Chemical Truck Operator 3 3.32 1.63 0.80 6.38 2.78
Fueler 2 0.85 0.17 0.68 1.02 0.85
Hydration Unit Operator 5 4.28 2.79 0.18 14.92 0.88
Mechanic 3 1.20 0.39 0.46 1.76 1.38
Operator, Data Van 1 0.86 ---2 0.86 0.86 0.86
Pump Truck Operator 1 0.42 --- 0.42 0.42 0.42
Q.C. Tech 1 0.26 --- 0.26 0.26 0.26
Roving Operator 4 0.52 0.24 0.12 1.18 0.39
Sand Coordinator 10 1.60 0.57 0.34 6.52 1.22
Sand Truck Driver 1 0.82 --- 0.82 0.82 0.82
Sandmover Operator 50 10.44 1.59 0.14 55.10 7.62
T-belt Operator 6 14.55 7.57 0.30 51.40 9.06
Water Tank Operator 7 1.23 0.34 0.38 2.72 1.12
Wireline Operator 1 0.14 --- 0.14 0.14 0.14
Total 111 6.45 0.93 0.12 55.10 2.18
Why respirators are not the answer: severities > 10, 50 X REL
December 2-3, 2014
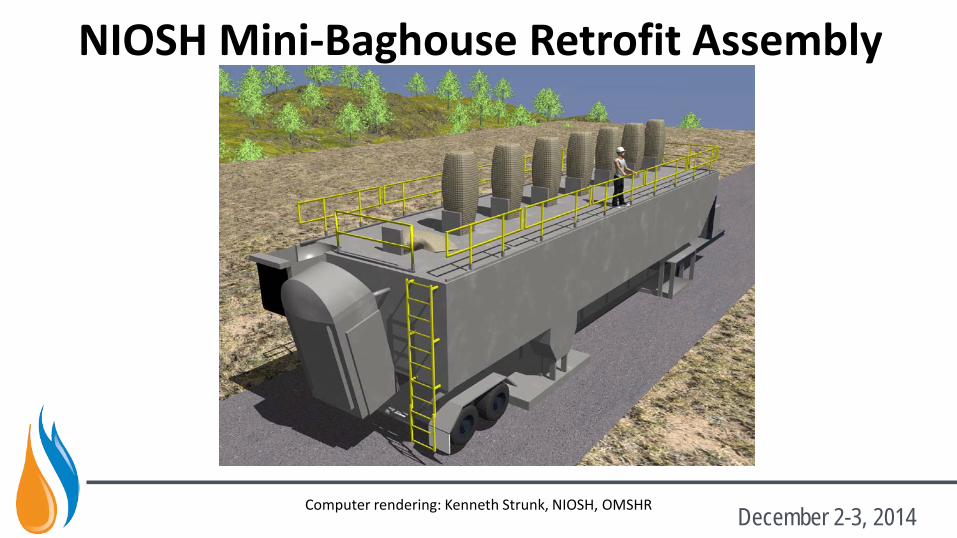
NIOSH Mini-Baghouse Retrofit Assembly
Computer rendering: Kenneth Strunk, NIOSH, OMSHR December 2-3, 2014
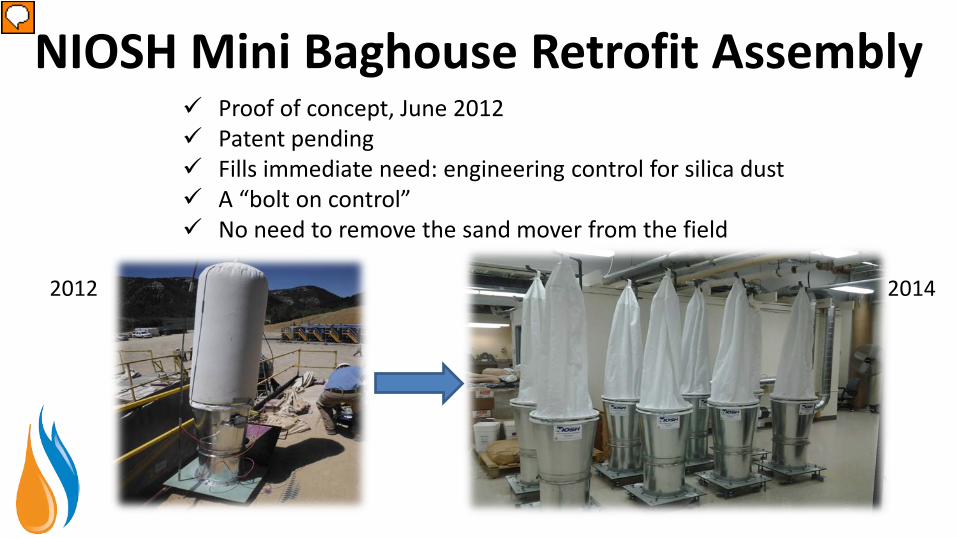
NIOSH Mini Baghouse Retrofit Assembly Proof of concept, June 2012 Patent pending Fills immediate need: engineering control for silica dust A “bolt on control” No need to remove the sand mover from the field
2012 2014
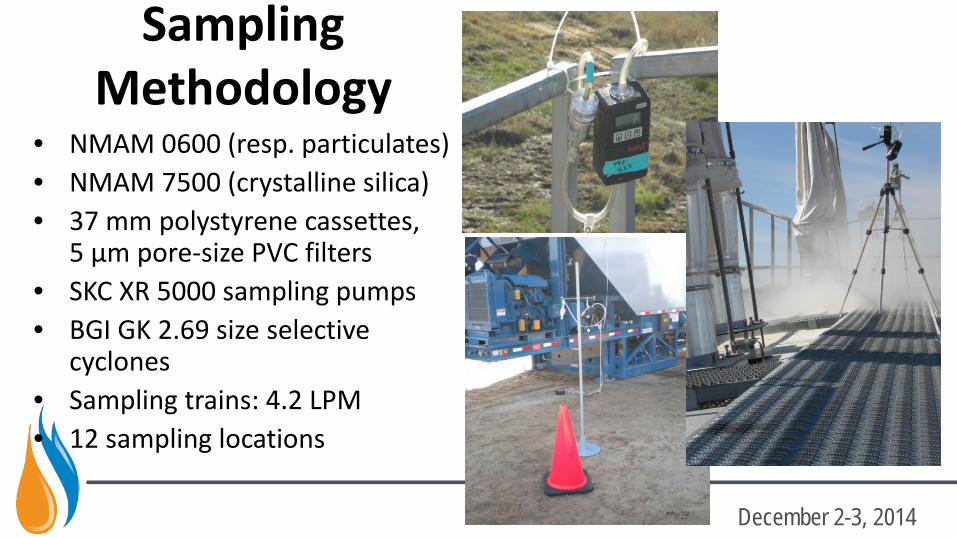
Sampling Methodology
• NMAM 0600 (resp. particulates) • NMAM 7500 (crystalline silica) • 37 mm polystyrene cassettes,
5 µm pore-size PVC filters • SKC XR 5000 sampling pumps • BGI GK 2.69 size selective
cyclones • Sampling trains: 4.2 LPM • 12 sampling locations
December 2-3, 2014
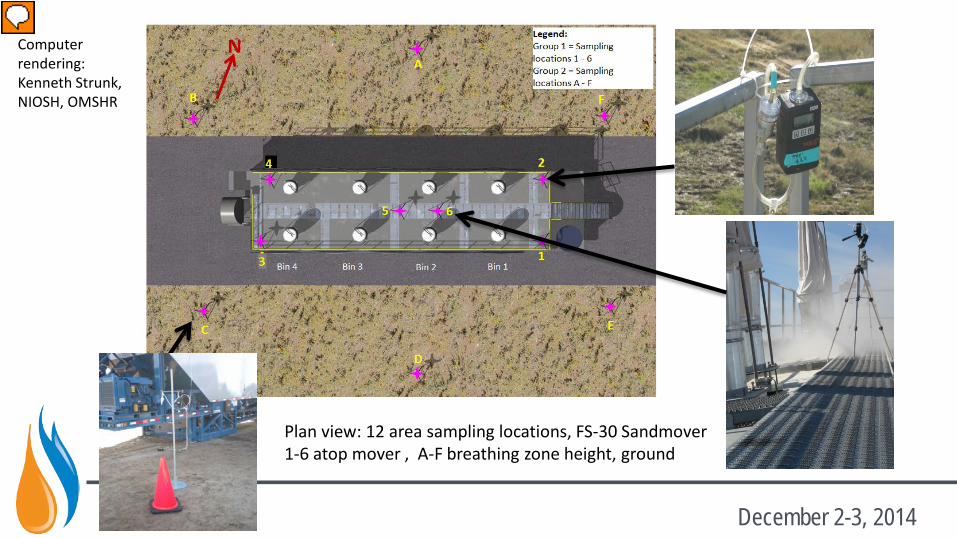
Plan view: 12 area sampling locations, FS-30 Sandmover 1-6 atop mover , A-F breathing zone height, ground
Computer rendering: Kenneth Strunk, NIOSH, OMSHR
December 2-3, 2014
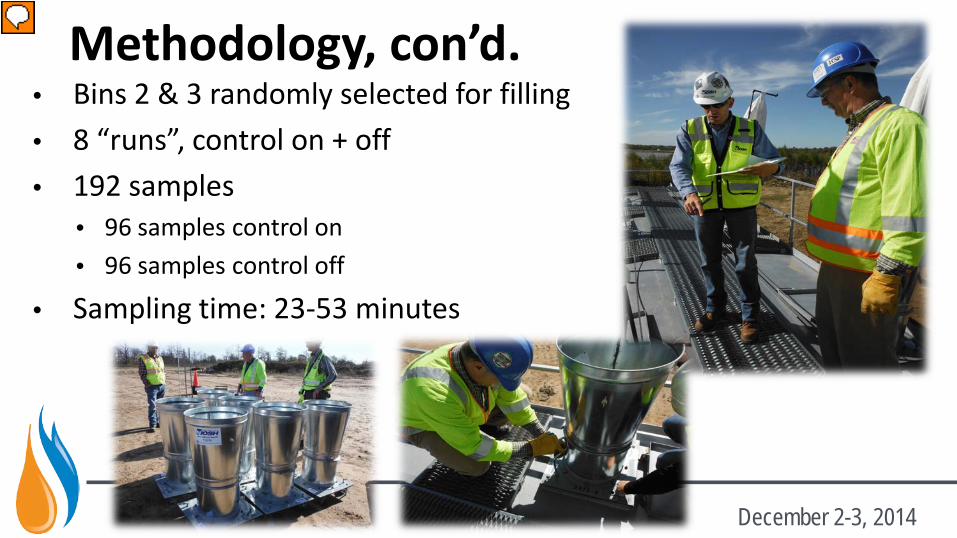
Methodology, con’d. • Bins 2 & 3 randomly selected for filling
• 8 “runs”, control on + off • 192 samples
• 96 samples control on • 96 samples control off
• Sampling time: 23-53 minutes
December 2-3, 2014
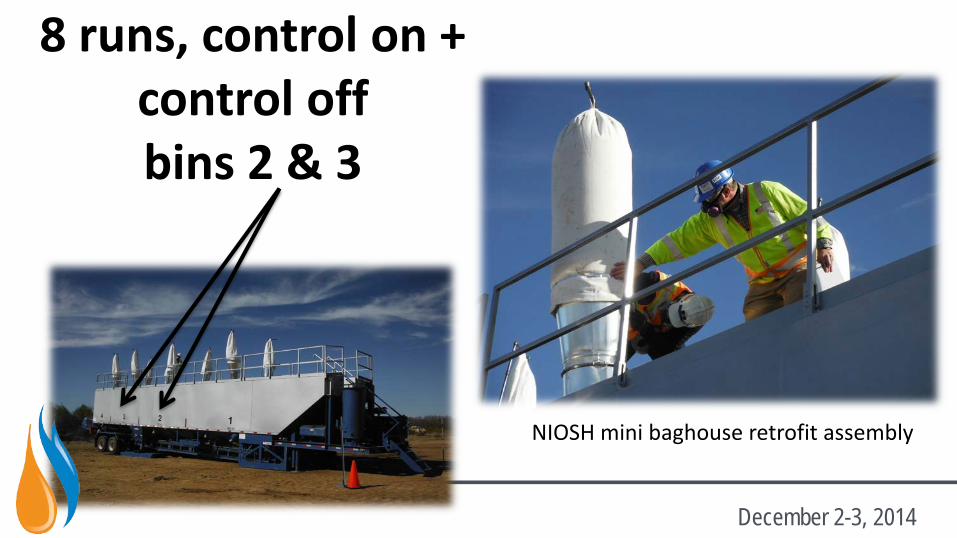
8 runs, control on + control off bins 2 & 3
NIOSH mini baghouse retrofit assembly
December 2-3, 2014
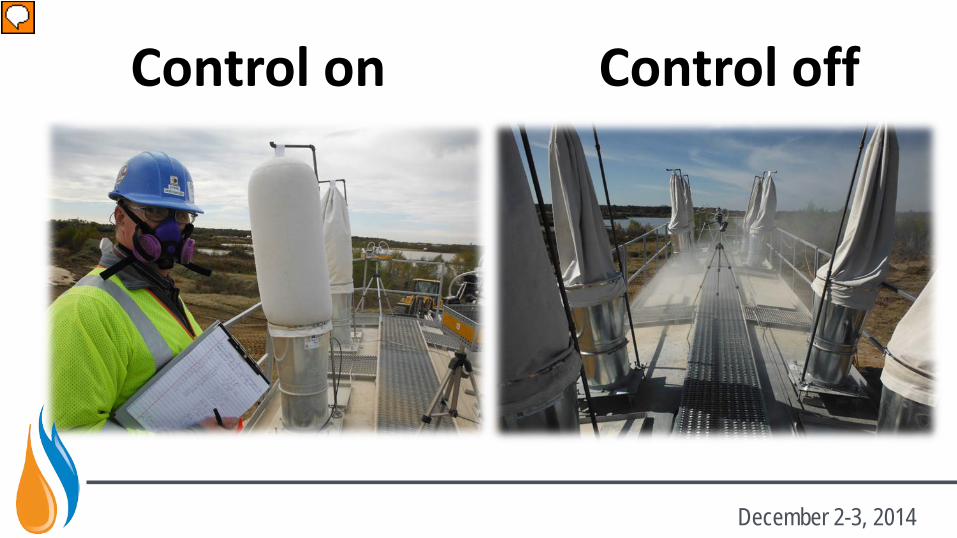
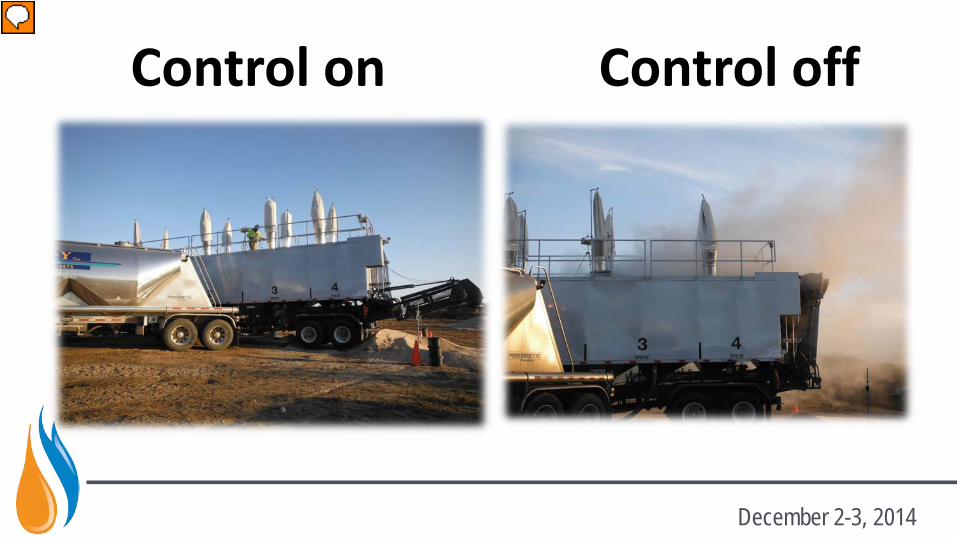
Control on Control off
December 2-3, 2014
December 2-3, 2014
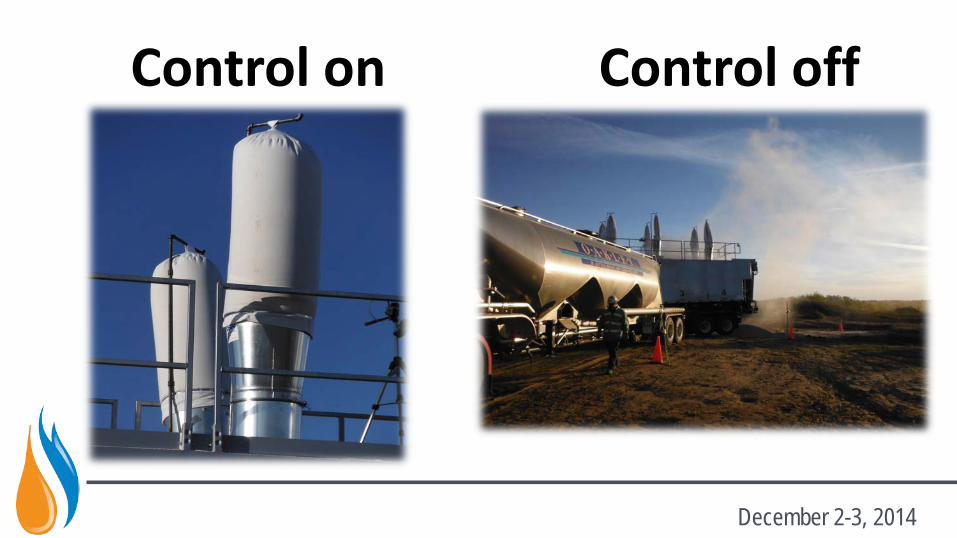
Control on Control off
December 2-3, 2014
Control on Control off
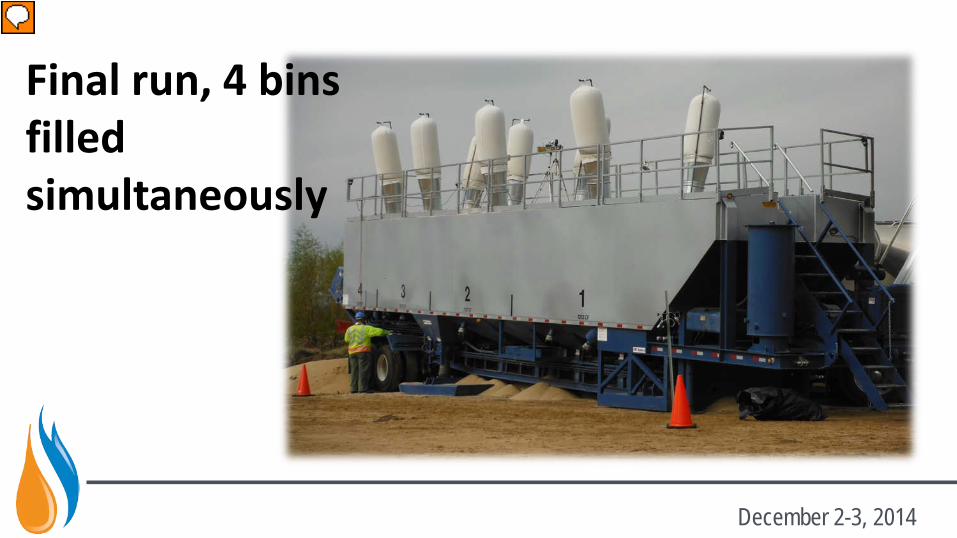
Final run, 4 bins filled simultaneously
December 2-3, 2014
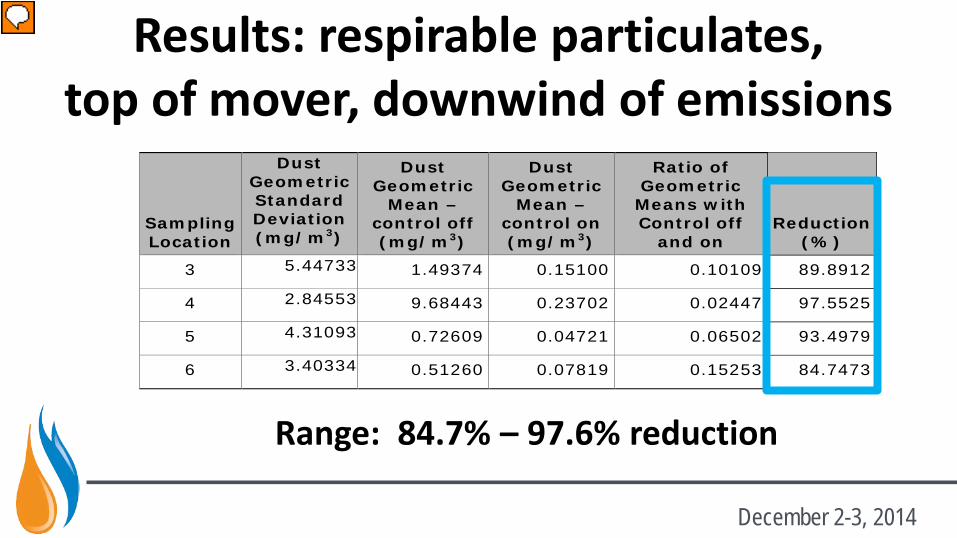
Results: respirable particulates, top of mover, downwind of emissions
Sampling Location
Dust Geometric Standard Deviation (mg/m3)
Dust Geometric
Mean – control off (mg/m3)
Dust Geometric
Mean – control on (mg/m3)
Ratio of Geometric Means with Control off
and on Reduction
(%)
3 5.44733 1.49374 0.15100 0.10109 89.8912
4 2.84553 9.68443 0.23702 0.02447 97.5525
5 4.31093 0.72609 0.04721 0.06502 93.4979
6 3.40334 0.51260 0.07819 0.15253 84.7473
Range: 84.7% – 97.6% reduction
December 2-3, 2014
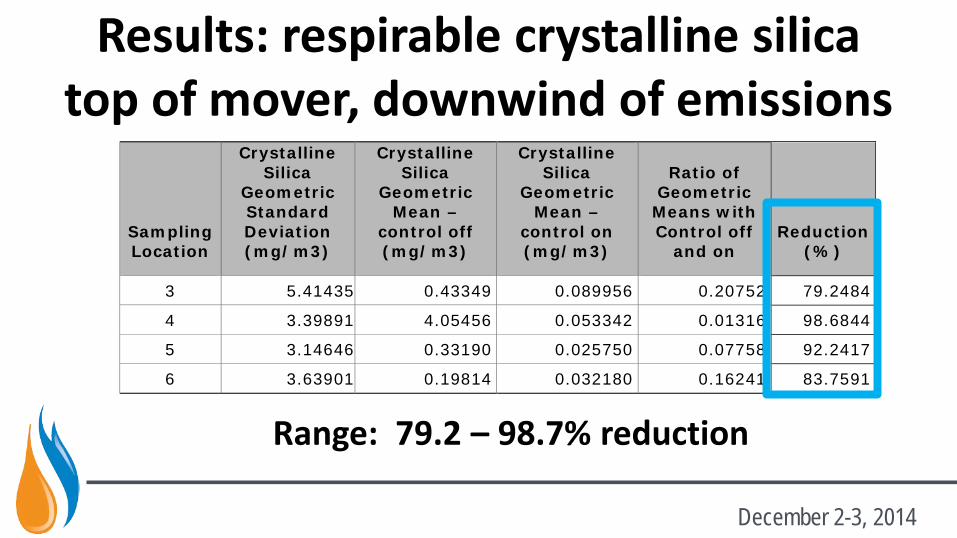
Results: respirable crystalline silica top of mover, downwind of emissions
Sampling Location
Crystalline Silica
Geometric Standard Deviation (mg/m3)
Crystalline Silica
Geometric Mean –
control off (mg/m3)
Crystalline Silica
Geometric Mean –
control on (mg/m3)
Ratio of Geometric Means with Control off
and on Reduction
(%)
3 5.41435 0.43349 0.089956 0.20752 79.2484
4 3.39891 4.05456 0.053342 0.01316 98.6844
5 3.14646 0.33190 0.025750 0.07758 92.2417
6 3.63901 0.19814 0.032180 0.16241 83.7591
Range: 79.2 – 98.7% reduction
December 2-3, 2014
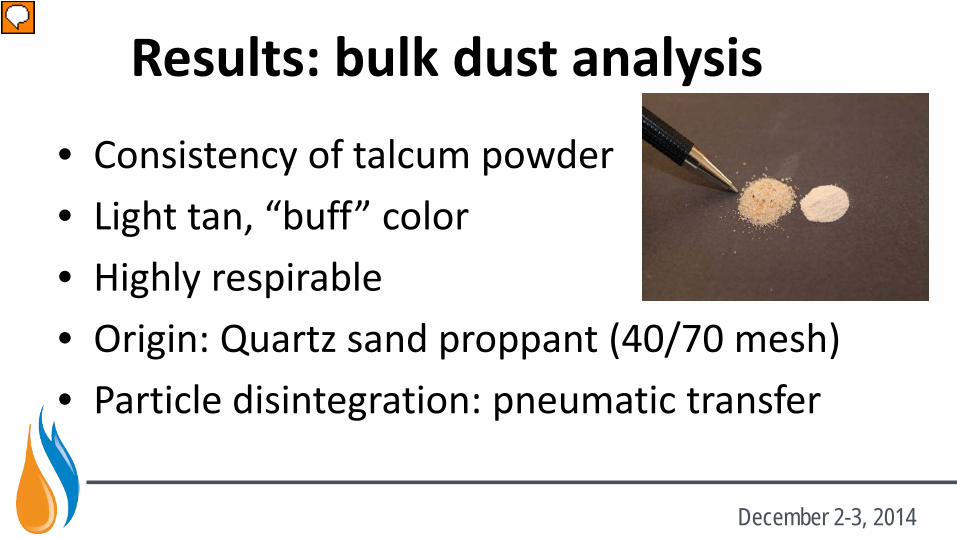
Results: bulk dust analysis
• Consistency of talcum powder • Light tan, “buff” color • Highly respirable • Origin: Quartz sand proppant (40/70 mesh) • Particle disintegration: pneumatic transfer
December 2-3, 2014
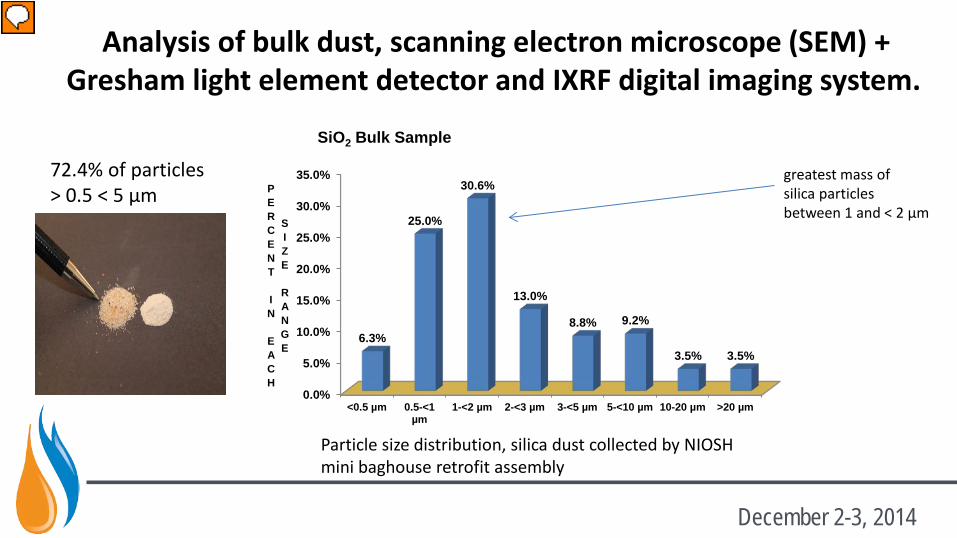
Analysis of bulk dust, scanning electron microscope (SEM) + Gresham light element detector and IXRF digital imaging system.
72.4% of particles > 0.5 < 5 µm
Particle size distribution, silica dust collected by NIOSH mini baghouse retrofit assembly
greatest mass of silica particles between 1 and < 2 µm
0.0%
5.0%
10.0%
15.0%
20.0%
25.0%
30.0%
35.0%
<0.5 µm 0.5-<1µm
1-<2 µm 2-<3 µm 3-<5 µm 5-<10 µm 10-20 µm >20 µm
6.3%
25.0%
30.6%
13.0%
8.8% 9.2%
3.5% 3.5%
PERCENT IN EACH
SIZE RANGE
SiO2 Bulk Sample
December 2-3, 2014
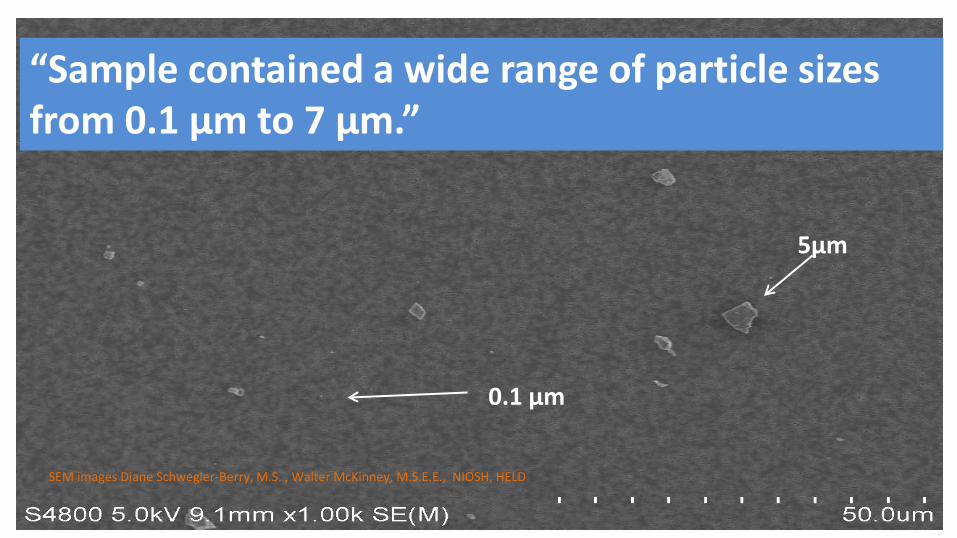
“Sample contained a wide range of particle sizes from 0.1 µm to 7 µm.”
5µm
0.1 µm
SEM images Diane Schwegler-Berry, M.S. , Walter McKinney, M.S.E.E., NIOSH, HELD
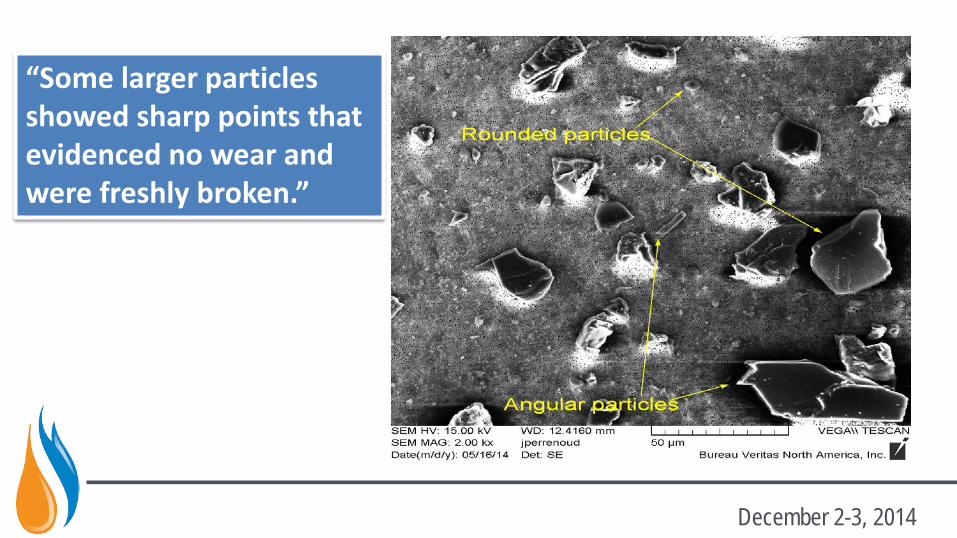
“Some larger particles showed sharp points that evidenced no wear and were freshly broken.”
December 2-3, 2014
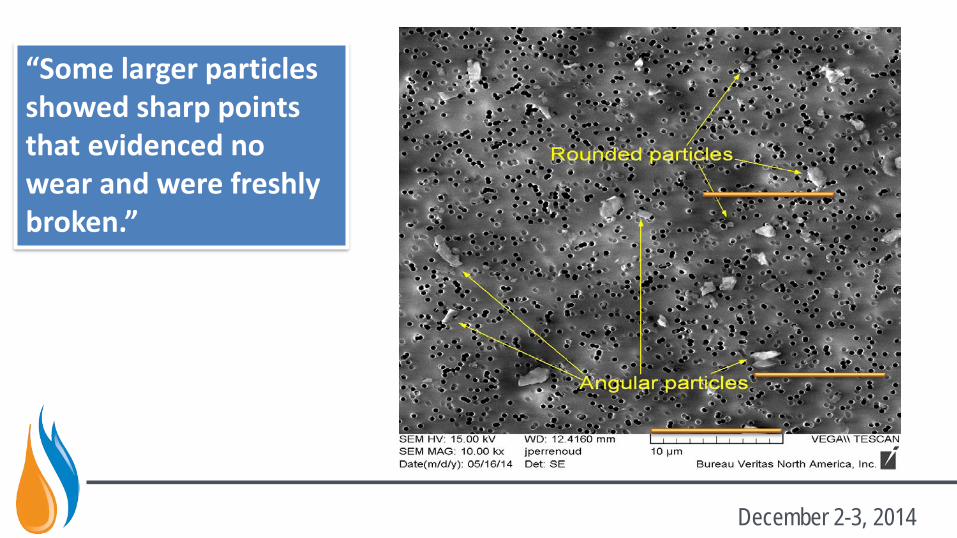
“Some larger particles showed sharp points that evidenced no wear and were freshly broken.”
December 2-3, 2014
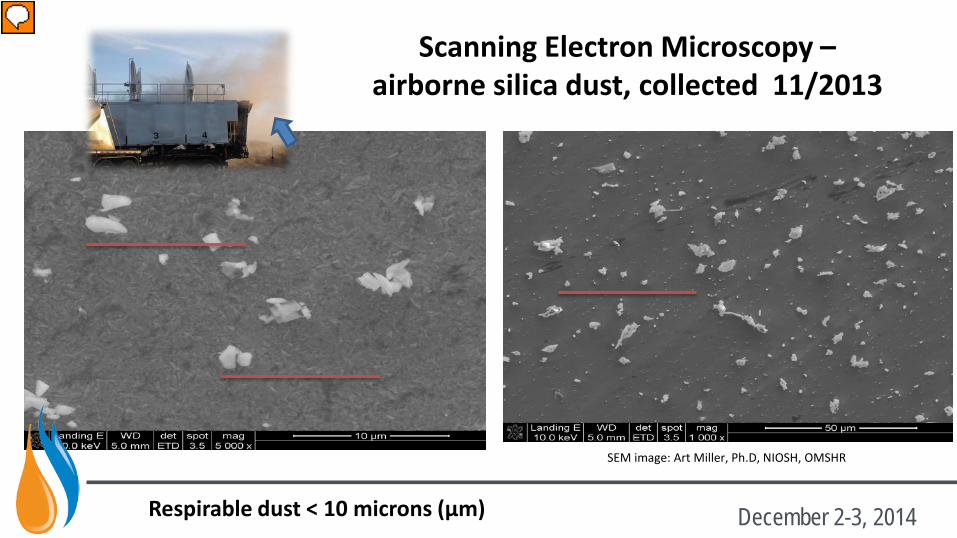
Scanning Electron Microscopy – airborne silica dust, collected 11/2013
Respirable dust < 10 microns (µm) SEM images: Art Miller, Ph.D, NIOSH
SEM image: Art Miller, Ph.D, NIOSH, OMSHR
December 2-3, 2014
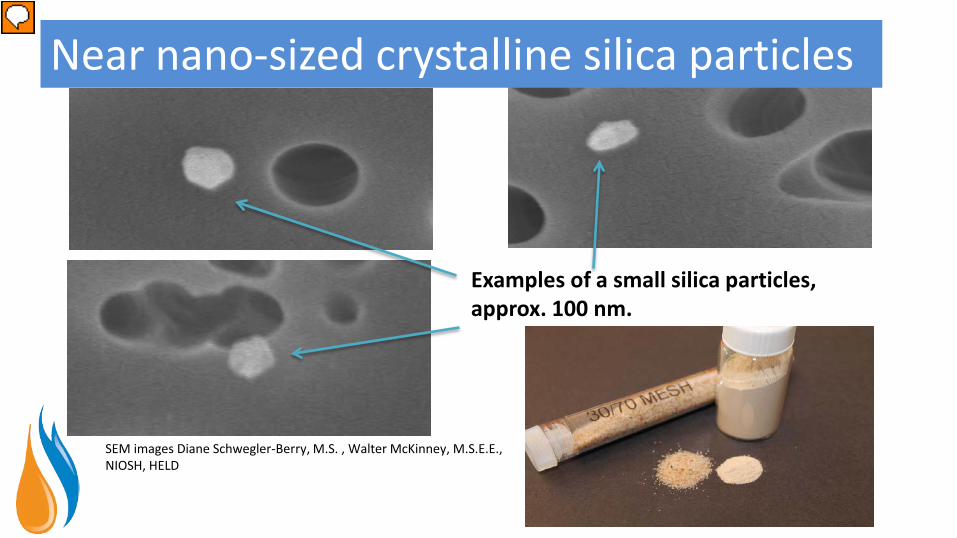
Examples of a small silica particles, approx. 100 nm.
Near nano-sized crystalline silica particles
SEM images Diane Schwegler-Berry, M.S. , Walter McKinney, M.S.E.E., NIOSH, HELD
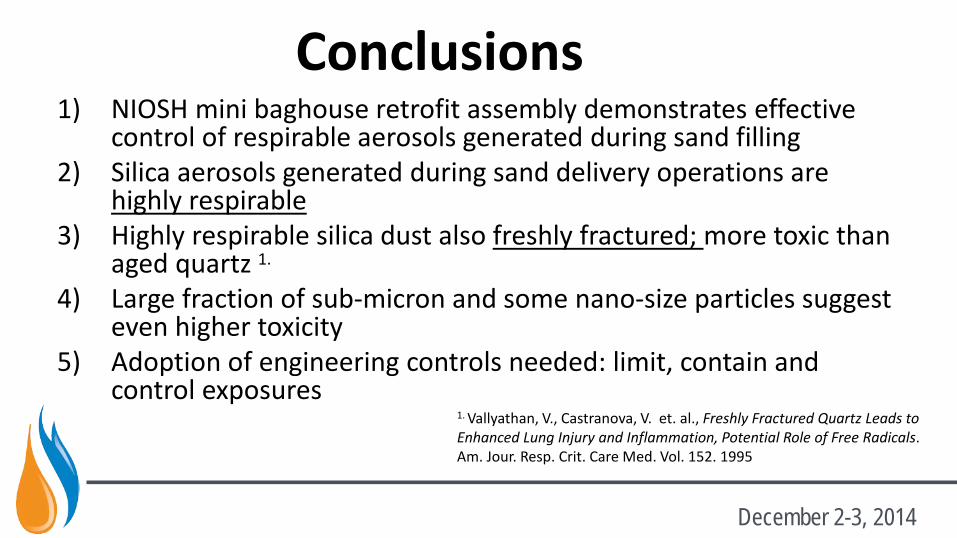
Conclusions 1) NIOSH mini baghouse retrofit assembly demonstrates effective
control of respirable aerosols generated during sand filling 2) Silica aerosols generated during sand delivery operations are
highly respirable 3) Highly respirable silica dust also freshly fractured; more toxic than
aged quartz 1.
4) Large fraction of sub-micron and some nano-size particles suggest even higher toxicity
5) Adoption of engineering controls needed: limit, contain and control exposures
1. Vallyathan, V., Castranova, V. et. al., Freshly Fractured Quartz Leads to Enhanced Lung Injury and Inflammation, Potential Role of Free Radicals. Am. Jour. Resp. Crit. Care Med. Vol. 152. 1995
December 2-3, 2014

QUESTIONS?
December 2-3, 2014