updated transportation impact fees analysis · zions public finance, inc. | december 2017...
TRANSCRIPT
Springville City
Updated Transportation
Impact Fees Analysis December 2017
Zions Public Finance, Inc. | December 2017
Springville City | Updated Transportation Impact Fee Analysis
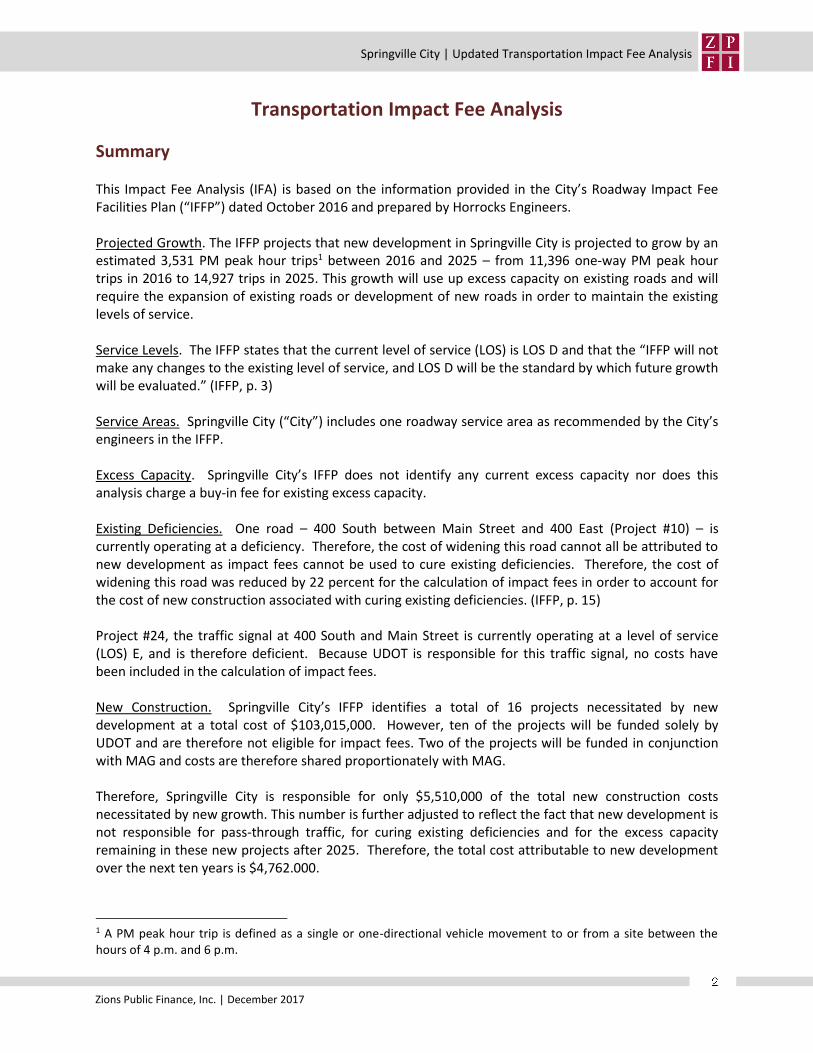
Transportation Impact Fee Analysis
Summary This Impact Fee Analysis (IFA) is based on the information provided in the City’s Roadway Impact Fee Facilities Plan (“IFFP”) dated October 2016 and prepared by Horrocks Engineers. Projected Growth. The IFFP projects that new development in Springville City is projected to grow by an estimated 3,531 PM peak hour trips1 between 2016 and 2025 – from 11,396 one-way PM peak hour trips in 2016 to 14,927 trips in 2025. This growth will use up excess capacity on existing roads and will require the expansion of existing roads or development of new roads in order to maintain the existing levels of service.
Service Levels. The IFFP states that the current level of service (LOS) is LOS D and that the “IFFP will not make any changes to the existing level of service, and LOS D will be the standard by which future growth will be evaluated.” (IFFP, p. 3) Service Areas. Springville City (“City”) includes one roadway service area as recommended by the City’s engineers in the IFFP. Excess Capacity. Springville City’s IFFP does not identify any current excess capacity nor does this analysis charge a buy-in fee for existing excess capacity. Existing Deficiencies. One road – 400 South between Main Street and 400 East (Project #10) – is currently operating at a deficiency. Therefore, the cost of widening this road cannot all be attributed to new development as impact fees cannot be used to cure existing deficiencies. Therefore, the cost of widening this road was reduced by 22 percent for the calculation of impact fees in order to account for the cost of new construction associated with curing existing deficiencies. (IFFP, p. 15) Project #24, the traffic signal at 400 South and Main Street is currently operating at a level of service (LOS) E, and is therefore deficient. Because UDOT is responsible for this traffic signal, no costs have been included in the calculation of impact fees. New Construction. Springville City’s IFFP identifies a total of 16 projects necessitated by new development at a total cost of $103,015,000. However, ten of the projects will be funded solely by UDOT and are therefore not eligible for impact fees. Two of the projects will be funded in conjunction with MAG and costs are therefore shared proportionately with MAG. Therefore, Springville City is responsible for only $5,510,000 of the total new construction costs necessitated by new growth. This number is further adjusted to reflect the fact that new development is not responsible for pass-through traffic, for curing existing deficiencies and for the excess capacity remaining in these new projects after 2025. Therefore, the total cost attributable to new development over the next ten years is $4,762.000.
1 A PM peak hour trip is defined as a single or one-directional vehicle movement to or from a site between the hours of 4 p.m. and 6 p.m.
Zions Public Finance, Inc. | December 2017
Springville City | Updated Transportation Impact Fee Analysis
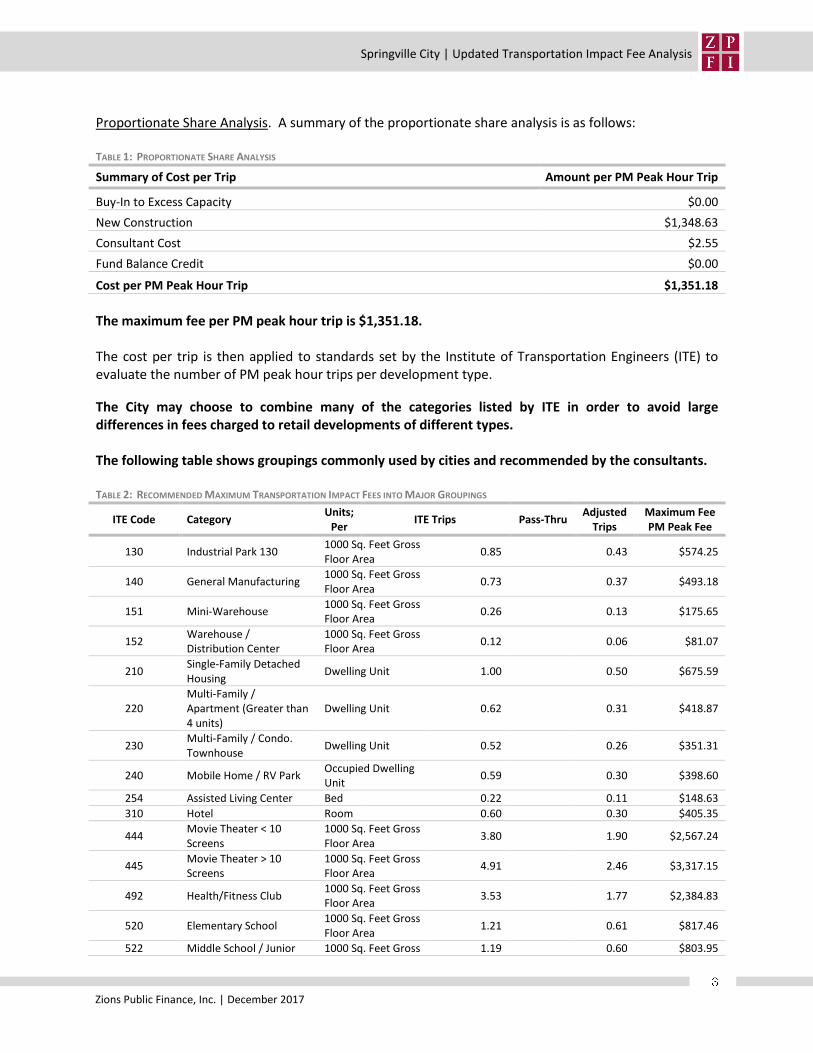
Proportionate Share Analysis. A summary of the proportionate share analysis is as follows: TABLE 1: PROPORTIONATE SHARE ANALYSIS
Summary of Cost per Trip Amount per PM Peak Hour Trip
Buy-In to Excess Capacity $0.00
New Construction $1,348.63
Consultant Cost $2.55
Fund Balance Credit $0.00
Cost per PM Peak Hour Trip $1,351.18
The maximum fee per PM peak hour trip is $1,351.18. The cost per trip is then applied to standards set by the Institute of Transportation Engineers (ITE) to evaluate the number of PM peak hour trips per development type.
The City may choose to combine many of the categories listed by ITE in order to avoid large differences in fees charged to retail developments of different types. The following table shows groupings commonly used by cities and recommended by the consultants. TABLE 2: RECOMMENDED MAXIMUM TRANSPORTATION IMPACT FEES INTO MAJOR GROUPINGS
ITE Code Category Units;
Per ITE Trips Pass-Thru
Adjusted Trips
Maximum Fee PM Peak Fee
130 Industrial Park 130 1000 Sq. Feet Gross Floor Area
0.85 0.43 $574.25
140 General Manufacturing 1000 Sq. Feet Gross Floor Area
0.73 0.37 $493.18
151 Mini-Warehouse 1000 Sq. Feet Gross Floor Area
0.26 0.13 $175.65
152 Warehouse / Distribution Center
1000 Sq. Feet Gross Floor Area
0.12 0.06 $81.07
210 Single-Family Detached Housing
Dwelling Unit 1.00 0.50 $675.59
220 Multi-Family / Apartment (Greater than 4 units)
Dwelling Unit 0.62 0.31 $418.87
230 Multi-Family / Condo. Townhouse
Dwelling Unit 0.52 0.26 $351.31
240 Mobile Home / RV Park Occupied Dwelling Unit
0.59 0.30 $398.60
254 Assisted Living Center Bed 0.22 0.11 $148.63
310 Hotel Room 0.60 0.30 $405.35
444 Movie Theater < 10 Screens
1000 Sq. Feet Gross Floor Area
3.80 1.90 $2,567.24
445 Movie Theater > 10 Screens
1000 Sq. Feet Gross Floor Area
4.91 2.46 $3,317.15
492 Health/Fitness Club 1000 Sq. Feet Gross Floor Area
3.53 1.77 $2,384.83
520 Elementary School 1000 Sq. Feet Gross Floor Area
1.21 0.61 $817.46
522 Middle School / Junior 1000 Sq. Feet Gross 1.19 0.60 $803.95
Zions Public Finance, Inc. | December 2017
Springville City | Updated Transportation Impact Fee Analysis
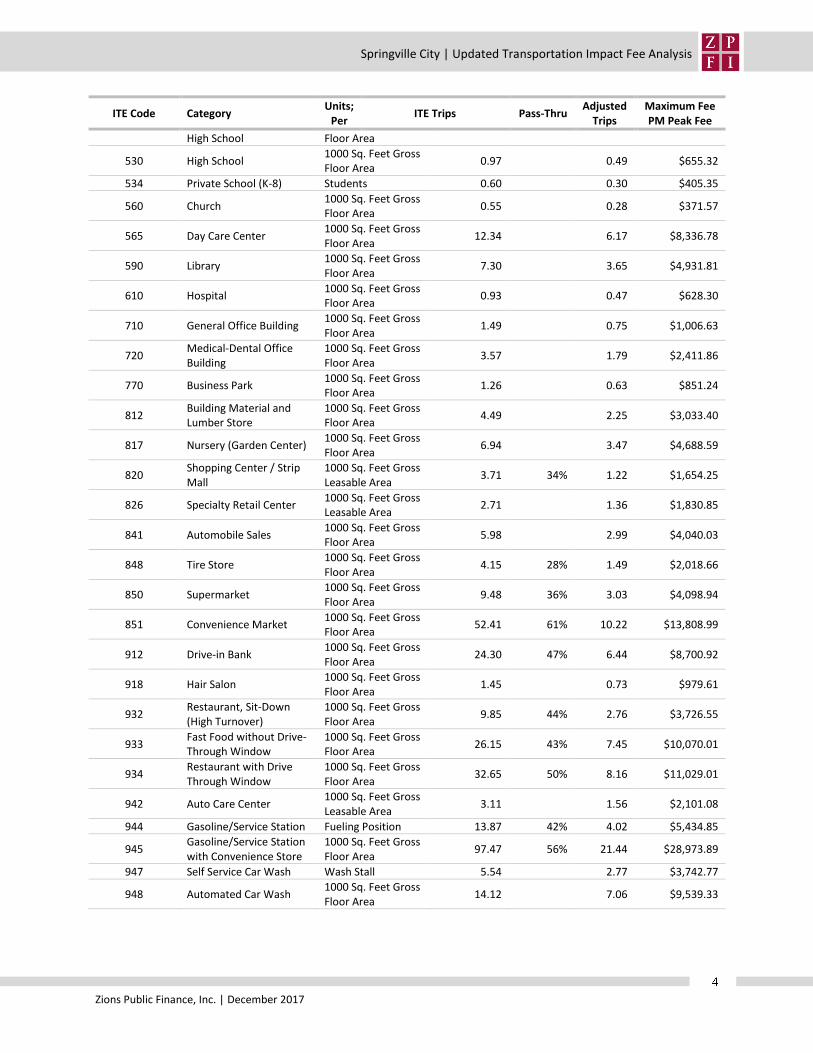
ITE Code Category Units;
Per ITE Trips Pass-Thru
Adjusted Trips
Maximum Fee PM Peak Fee
High School Floor Area
530 High School 1000 Sq. Feet Gross Floor Area
0.97 0.49 $655.32
534 Private School (K-8) Students 0.60 0.30 $405.35
560 Church 1000 Sq. Feet Gross Floor Area
0.55 0.28 $371.57
565 Day Care Center 1000 Sq. Feet Gross Floor Area
12.34 6.17 $8,336.78
590 Library 1000 Sq. Feet Gross Floor Area
7.30 3.65 $4,931.81
610 Hospital 1000 Sq. Feet Gross Floor Area
0.93 0.47 $628.30
710 General Office Building 1000 Sq. Feet Gross Floor Area
1.49 0.75 $1,006.63
720 Medical-Dental Office Building
1000 Sq. Feet Gross Floor Area
3.57 1.79 $2,411.86
770 Business Park 1000 Sq. Feet Gross Floor Area
1.26 0.63 $851.24
812 Building Material and Lumber Store
1000 Sq. Feet Gross Floor Area
4.49 2.25 $3,033.40
817 Nursery (Garden Center) 1000 Sq. Feet Gross Floor Area
6.94 3.47 $4,688.59
820 Shopping Center / Strip Mall
1000 Sq. Feet Gross Leasable Area
3.71 34% 1.22 $1,654.25
826 Specialty Retail Center 1000 Sq. Feet Gross Leasable Area
2.71 1.36 $1,830.85
841 Automobile Sales 1000 Sq. Feet Gross Floor Area
5.98 2.99 $4,040.03
848 Tire Store 1000 Sq. Feet Gross Floor Area
4.15 28% 1.49 $2,018.66
850 Supermarket 1000 Sq. Feet Gross Floor Area
9.48 36% 3.03 $4,098.94
851 Convenience Market 1000 Sq. Feet Gross Floor Area
52.41 61% 10.22 $13,808.99
912 Drive-in Bank 1000 Sq. Feet Gross Floor Area
24.30 47% 6.44 $8,700.92
918 Hair Salon 1000 Sq. Feet Gross Floor Area
1.45 0.73 $979.61
932 Restaurant, Sit-Down (High Turnover)
1000 Sq. Feet Gross Floor Area
9.85 44% 2.76 $3,726.55
933 Fast Food without Drive-Through Window
1000 Sq. Feet Gross Floor Area
26.15 43% 7.45 $10,070.01
934 Restaurant with Drive Through Window
1000 Sq. Feet Gross Floor Area
32.65 50% 8.16 $11,029.01
942 Auto Care Center 1000 Sq. Feet Gross Leasable Area
3.11 1.56 $2,101.08
944 Gasoline/Service Station Fueling Position 13.87 42% 4.02 $5,434.85
945 Gasoline/Service Station with Convenience Store
1000 Sq. Feet Gross Floor Area
97.47 56% 21.44 $28,973.89
947 Self Service Car Wash Wash Stall 5.54 2.77 $3,742.77
948 Automated Car Wash 1000 Sq. Feet Gross Floor Area
14.12 7.06 $9,539.33
Zions Public Finance, Inc. | December 2017
Springville City | Updated Transportation Impact Fee Analysis
Utah Code Legal Requirements
Utah law requires that communities prepare an Impact Fee Analysis (IFA) before enacting an impact fee. Utah law also requires that communities give notice of their intent to prepare and adopt an IFA. This IFA follows all legal requirements as outlined below. The City has retained Zions Public Finance Inc., a wholly-owned subsidiary of ZB, N.A. to prepare this Impact Fee Analysis in accordance with legal requirements.
Notice of Intent to Prepare Impact Fee Analysis A local political subdivision must provide written notice of its intent to prepare an IFA before preparing the Plan (Utah Code §11-36a-503). This notice must be posted on the Utah Public Notice website. The City has complied with this noticing requirement for the IFA.
Preparation of Impact Fee Analysis Utah Code requires that each local political subdivision, before imposing an impact fee, prepare an impact fee analysis. (Utah Code 11-36a-304). Section 11-36a-304 of the Utah Code outlines the requirements of an impact fee analysis as follows: (1) An impact fee analysis shall:
(a) identify the anticipated impact on or consumption of any existing capacity of a public facility by the anticipated development activity;
(b) identify the anticipated impact on system improvements required by the anticipated
development activity to maintain the established level of service for each public facility; (c) demonstrate how the anticipated impacts described in Subsections (1)(a) and (b) are
reasonably related to the anticipated development activity; (d) estimate the proportionate share of: (i) the costs for existing capacity that will be recouped; and
(ii) the costs of impacts on system improvements that are reasonably related to the new development activity; and
(e) identify how the impact fee was calculated.
(2) In analyzing whether or not the proportionate share of the costs of public facilities are reasonably related to the new development activity, the local political subdivision or private entity, as the case may be, shall identify, if applicable:
(a) the cost of each existing public facility that has excess capacity to serve the anticipated
development resulting from the new development activity; (b) the cost of system improvements for each public facility;
Zions Public Finance, Inc. | December 2017
Springville City | Updated Transportation Impact Fee Analysis
(c) other than impact fees, the manner of financing for each public facility, such as user charges, special assessments, bonded indebtedness, general taxes, or federal grants;
(d) the relative extent to which development activity will contribute to financing the excess
capacity of and system improvements for each existing public facility, by such means as user charges, special assessments, or payment from the proceeds of general taxes;
(e) the relative extent to which development activity will contribute to the cost of existing
public facilities and system improvements in the future; (f) the extent to which the development activity is entitled to a credit against impact fees
because the development activity will dedicate system improvements or public facilities that will offset the demand for system improvements, inside or outside the proposed development;
(g) extraordinary costs, if any, in servicing the newly-developed properties; and (h) the time-price differential inherent in fair comparisons of amounts paid at different
times.
Certification of Impact Fee Analysis Utah Code states that an Impact Fee Analysis shall include a written certification from the person or entity that prepares the Impact Fee Analysis. This certification is included at the conclusion of this analysis.
Zions Public Finance, Inc. | December 2017
Springville City | Updated Transportation Impact Fee Analysis
Anticipated Impact on or Consumption of Any Existing Capacity of a Public Facility by the Anticipated Development Activity Utah Code 11-36a-304(1)(a)
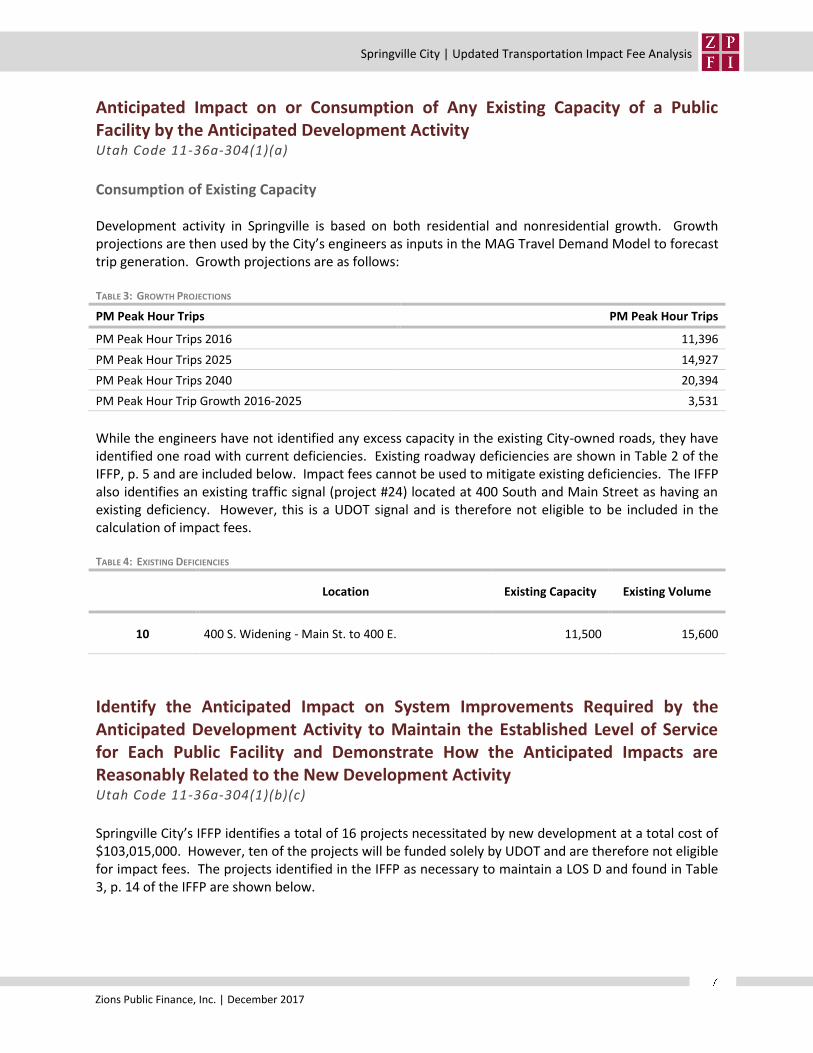
Consumption of Existing Capacity Development activity in Springville is based on both residential and nonresidential growth. Growth projections are then used by the City’s engineers as inputs in the MAG Travel Demand Model to forecast trip generation. Growth projections are as follows: TABLE 3: GROWTH PROJECTIONS
PM Peak Hour Trips PM Peak Hour Trips
PM Peak Hour Trips 2016 11,396
PM Peak Hour Trips 2025 14,927
PM Peak Hour Trips 2040 20,394
PM Peak Hour Trip Growth 2016-2025 3,531
While the engineers have not identified any excess capacity in the existing City-owned roads, they have identified one road with current deficiencies. Existing roadway deficiencies are shown in Table 2 of the IFFP, p. 5 and are included below. Impact fees cannot be used to mitigate existing deficiencies. The IFFP also identifies an existing traffic signal (project #24) located at 400 South and Main Street as having an existing deficiency. However, this is a UDOT signal and is therefore not eligible to be included in the calculation of impact fees. TABLE 4: EXISTING DEFICIENCIES
Location Existing Capacity Existing Volume
10 400 S. Widening - Main St. to 400 E. 11,500 15,600
Identify the Anticipated Impact on System Improvements Required by the Anticipated Development Activity to Maintain the Established Level of Service for Each Public Facility and Demonstrate How the Anticipated Impacts are Reasonably Related to the New Development Activity Utah Code 11-36a-304(1)(b)(c)
Springville City’s IFFP identifies a total of 16 projects necessitated by new development at a total cost of $103,015,000. However, ten of the projects will be funded solely by UDOT and are therefore not eligible for impact fees. The projects identified in the IFFP as necessary to maintain a LOS D and found in Table 3, p. 14 of the IFFP are shown below.
Zions Public Finance, Inc. | December 2017
Springville City | Updated Transportation Impact Fee Analysis
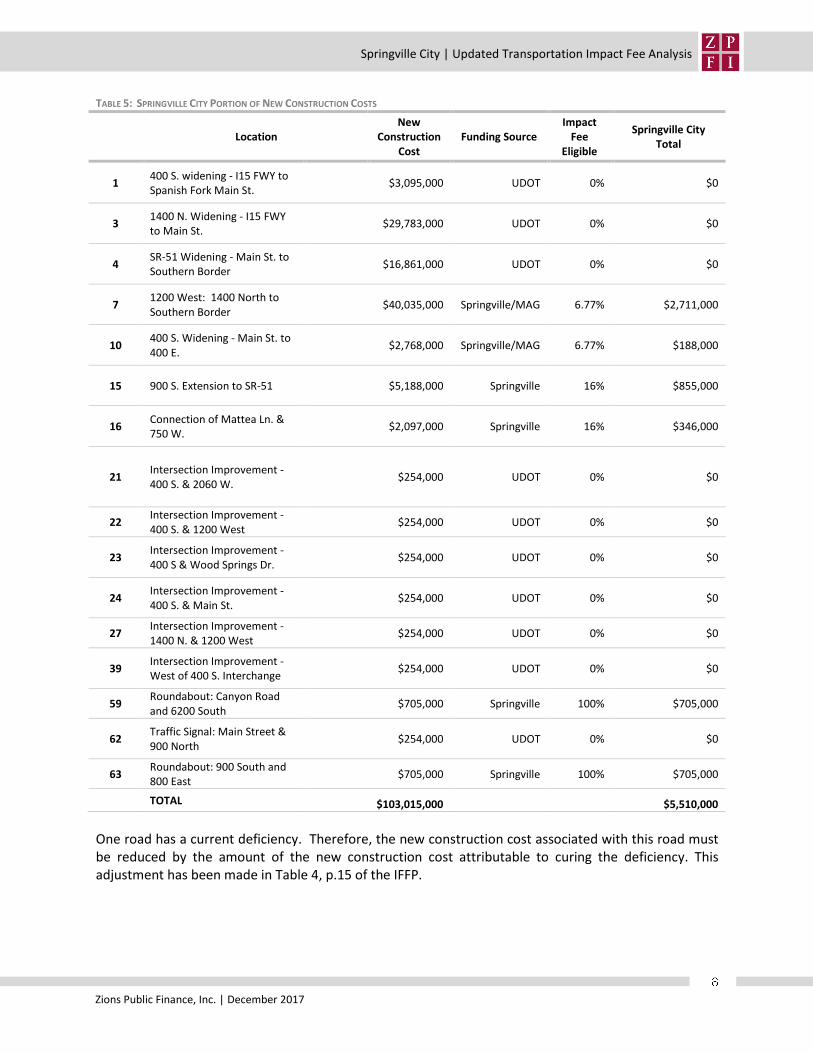
TABLE 5: SPRINGVILLE CITY PORTION OF NEW CONSTRUCTION COSTS
Location New
Construction Cost
Funding Source Impact
Fee Eligible
Springville City Total
1 400 S. widening - I15 FWY to Spanish Fork Main St.
$3,095,000 UDOT 0% $0
3 1400 N. Widening - I15 FWY to Main St.
$29,783,000 UDOT 0% $0
4 SR-51 Widening - Main St. to Southern Border
$16,861,000 UDOT 0% $0
7 1200 West: 1400 North to Southern Border
$40,035,000 Springville/MAG 6.77% $2,711,000
10 400 S. Widening - Main St. to 400 E.
$2,768,000 Springville/MAG 6.77% $188,000
15 900 S. Extension to SR-51 $5,188,000 Springville 16% $855,000
16 Connection of Mattea Ln. & 750 W.
$2,097,000 Springville 16% $346,000
21 Intersection Improvement - 400 S. & 2060 W.
$254,000 UDOT 0% $0
22 Intersection Improvement - 400 S. & 1200 West
$254,000 UDOT 0% $0
23 Intersection Improvement - 400 S & Wood Springs Dr.
$254,000 UDOT 0% $0
24 Intersection Improvement - 400 S. & Main St.
$254,000 UDOT 0% $0
27 Intersection Improvement - 1400 N. & 1200 West
$254,000 UDOT 0% $0
39 Intersection Improvement - West of 400 S. Interchange
$254,000 UDOT 0% $0
59 Roundabout: Canyon Road and 6200 South
$705,000 Springville 100% $705,000
62 Traffic Signal: Main Street & 900 North
$254,000 UDOT 0% $0
63 Roundabout: 900 South and 800 East
$705,000 Springville 100% $705,000
TOTAL $103,015,000
$5,510,000
One road has a current deficiency. Therefore, the new construction cost associated with this road must be reduced by the amount of the new construction cost attributable to curing the deficiency. This adjustment has been made in Table 4, p.15 of the IFFP.
Zions Public Finance, Inc. | December 2017
Springville City | Updated Transportation Impact Fee Analysis
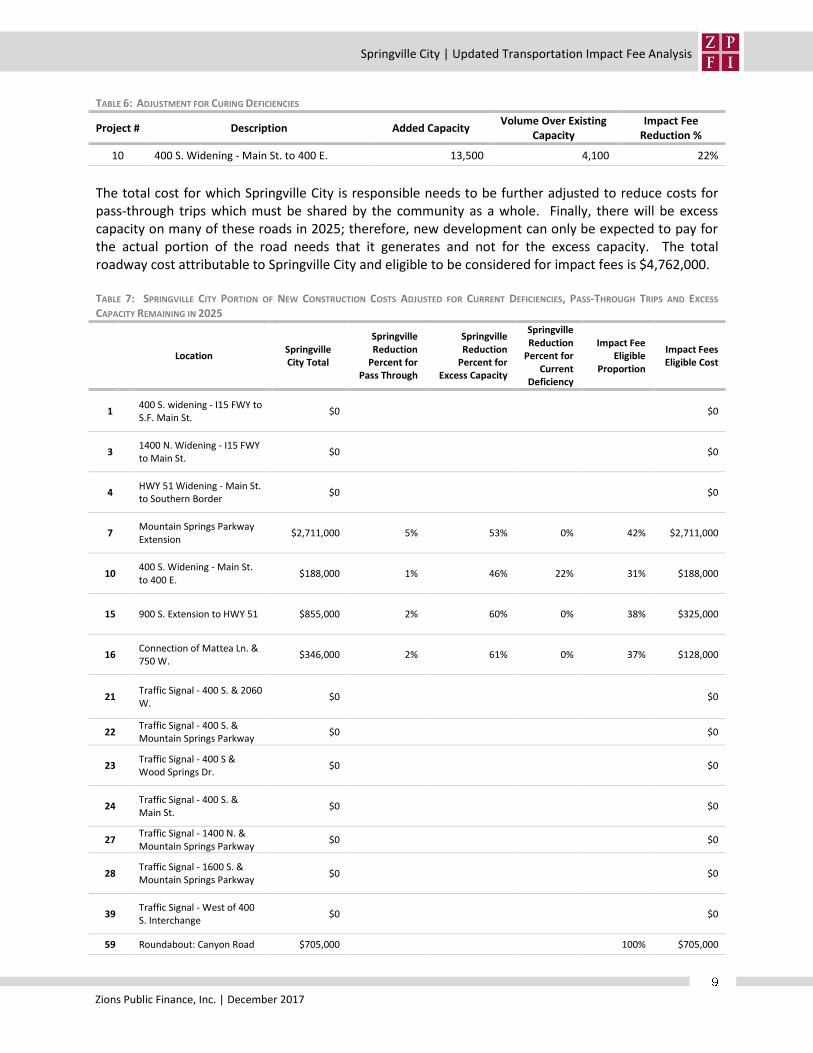
TABLE 6: ADJUSTMENT FOR CURING DEFICIENCIES
Project # Description Added Capacity Volume Over Existing
Capacity Impact Fee
Reduction %
10 400 S. Widening - Main St. to 400 E. 13,500 4,100 22%
The total cost for which Springville City is responsible needs to be further adjusted to reduce costs for pass-through trips which must be shared by the community as a whole. Finally, there will be excess capacity on many of these roads in 2025; therefore, new development can only be expected to pay for the actual portion of the road needs that it generates and not for the excess capacity. The total roadway cost attributable to Springville City and eligible to be considered for impact fees is $4,762,000. TABLE 7: SPRINGVILLE CITY PORTION OF NEW CONSTRUCTION COSTS ADJUSTED FOR CURRENT DEFICIENCIES, PASS-THROUGH TRIPS AND EXCESS
CAPACITY REMAINING IN 2025
Location Springville City Total
Springville Reduction
Percent for Pass Through
Springville Reduction
Percent for Excess Capacity
Springville Reduction
Percent for Current
Deficiency
Impact Fee Eligible
Proportion
Impact Fees Eligible Cost
1 400 S. widening - I15 FWY to S.F. Main St.
$0 $0
3 1400 N. Widening - I15 FWY to Main St.
$0 $0
4 HWY 51 Widening - Main St. to Southern Border
$0 $0
7 Mountain Springs Parkway Extension
$2,711,000 5% 53% 0% 42% $2,711,000
10 400 S. Widening - Main St. to 400 E.
$188,000 1% 46% 22% 31% $188,000
15 900 S. Extension to HWY 51 $855,000 2% 60% 0% 38% $325,000
16 Connection of Mattea Ln. & 750 W.
$346,000 2% 61% 0% 37% $128,000
21 Traffic Signal - 400 S. & 2060 W.
$0 $0
22 Traffic Signal - 400 S. & Mountain Springs Parkway
$0 $0
23 Traffic Signal - 400 S & Wood Springs Dr.
$0 $0
24 Traffic Signal - 400 S. & Main St.
$0 $0
27 Traffic Signal - 1400 N. & Mountain Springs Parkway
$0 $0
28 Traffic Signal - 1600 S. & Mountain Springs Parkway
$0 $0
39 Traffic Signal - West of 400 S. Interchange
$0 $0
59 Roundabout: Canyon Road $705,000 100% $705,000
Zions Public Finance, Inc. | December 2017
Springville City | Updated Transportation Impact Fee Analysis
Location Springville City Total
Springville Reduction
Percent for Pass Through
Springville Reduction
Percent for Excess Capacity
Springville Reduction
Percent for Current
Deficiency
Impact Fee Eligible
Proportion
Impact Fees Eligible Cost
and 6200 South
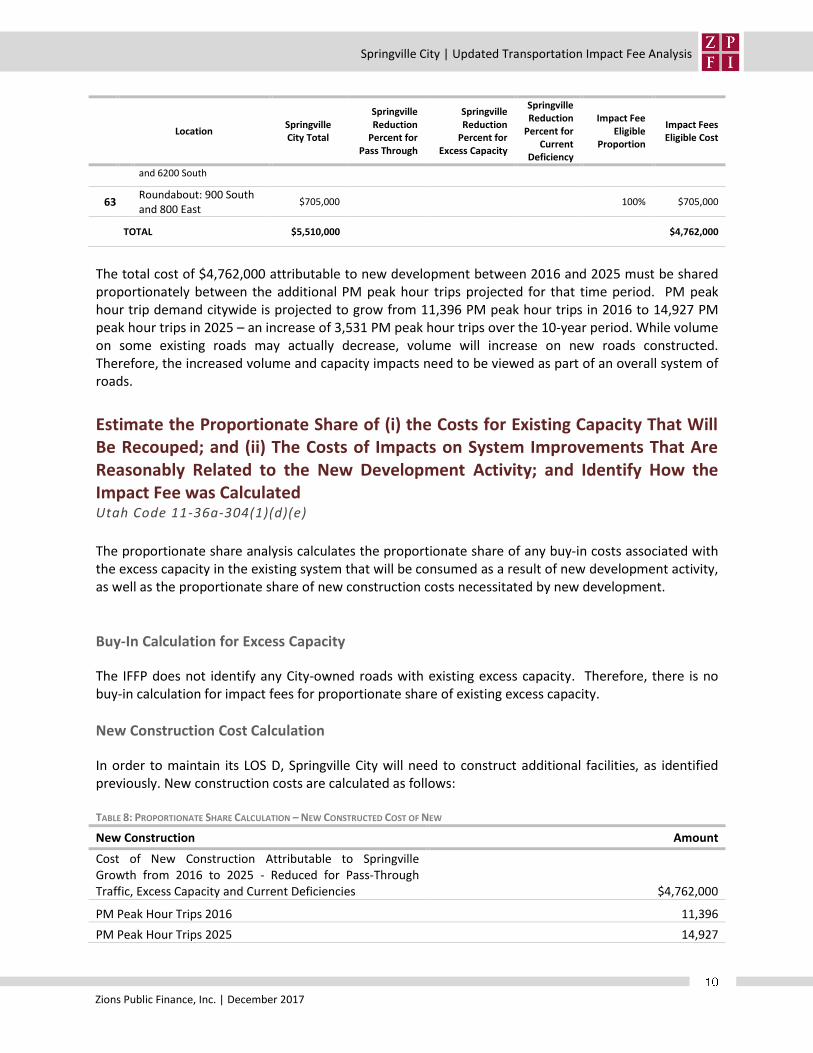
63 Roundabout: 900 South and 800 East
$705,000 100% $705,000
TOTAL $5,510,000 $4,762,000
The total cost of $4,762,000 attributable to new development between 2016 and 2025 must be shared proportionately between the additional PM peak hour trips projected for that time period. PM peak hour trip demand citywide is projected to grow from 11,396 PM peak hour trips in 2016 to 14,927 PM peak hour trips in 2025 – an increase of 3,531 PM peak hour trips over the 10-year period. While volume on some existing roads may actually decrease, volume will increase on new roads constructed. Therefore, the increased volume and capacity impacts need to be viewed as part of an overall system of roads.
Estimate the Proportionate Share of (i) the Costs for Existing Capacity That Will Be Recouped; and (ii) The Costs of Impacts on System Improvements That Are Reasonably Related to the New Development Activity; and Identify How the Impact Fee was Calculated Utah Code 11-36a-304(1)(d)(e)
The proportionate share analysis calculates the proportionate share of any buy-in costs associated with the excess capacity in the existing system that will be consumed as a result of new development activity, as well as the proportionate share of new construction costs necessitated by new development.
Buy-In Calculation for Excess Capacity
The IFFP does not identify any City-owned roads with existing excess capacity. Therefore, there is no buy-in calculation for impact fees for proportionate share of existing excess capacity.
New Construction Cost Calculation
In order to maintain its LOS D, Springville City will need to construct additional facilities, as identified previously. New construction costs are calculated as follows: TABLE 8: PROPORTIONATE SHARE CALCULATION – NEW CONSTRUCTED COST OF NEW
New Construction Amount
Cost of New Construction Attributable to Springville Growth from 2016 to 2025 - Reduced for Pass-Through Traffic, Excess Capacity and Current Deficiencies $4,762,000
PM Peak Hour Trips 2016 11,396
PM Peak Hour Trips 2025 14,927
Zions Public Finance, Inc. | December 2017
Springville City | Updated Transportation Impact Fee Analysis
New Construction Amount
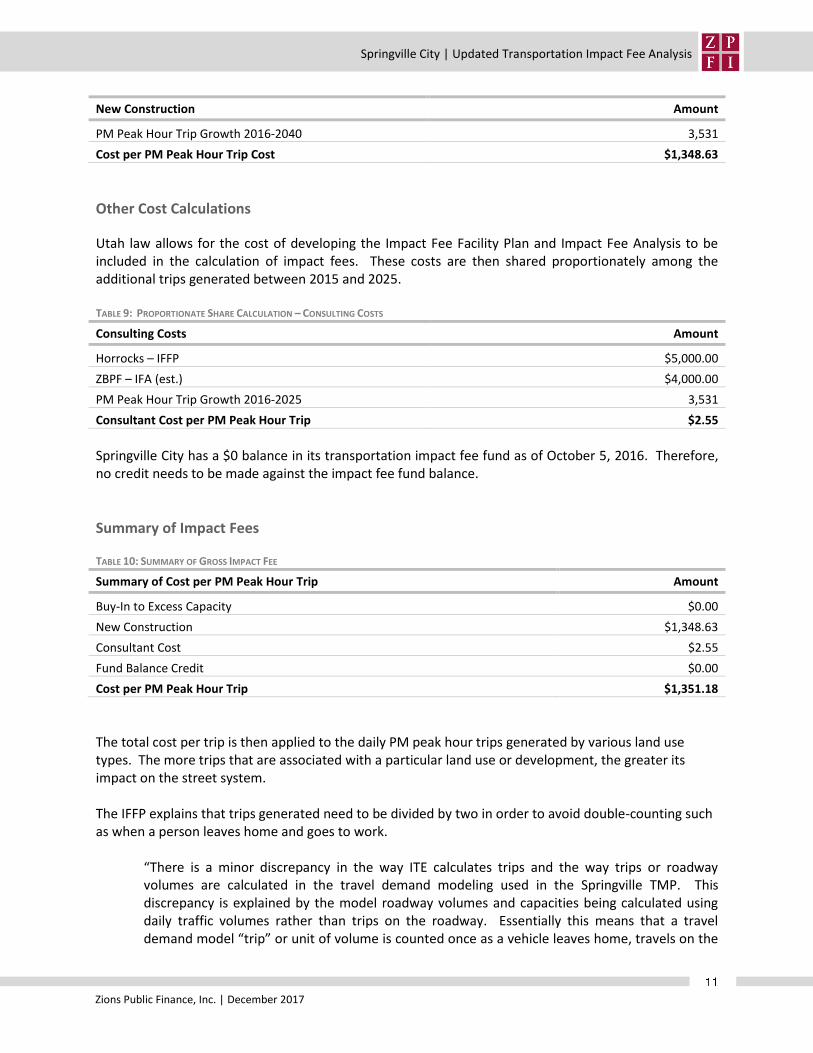
PM Peak Hour Trip Growth 2016-2040 3,531
Cost per PM Peak Hour Trip Cost $1,348.63
Other Cost Calculations
Utah law allows for the cost of developing the Impact Fee Facility Plan and Impact Fee Analysis to be included in the calculation of impact fees. These costs are then shared proportionately among the additional trips generated between 2015 and 2025. TABLE 9: PROPORTIONATE SHARE CALCULATION – CONSULTING COSTS
Consulting Costs Amount
Horrocks – IFFP $5,000.00
ZBPF – IFA (est.) $4,000.00
PM Peak Hour Trip Growth 2016-2025 3,531
Consultant Cost per PM Peak Hour Trip $2.55
Springville City has a $0 balance in its transportation impact fee fund as of October 5, 2016. Therefore, no credit needs to be made against the impact fee fund balance.
Summary of Impact Fees
TABLE 10: SUMMARY OF GROSS IMPACT FEE
Summary of Cost per PM Peak Hour Trip Amount
Buy-In to Excess Capacity $0.00
New Construction $1,348.63
Consultant Cost $2.55
Fund Balance Credit $0.00
Cost per PM Peak Hour Trip $1,351.18
The total cost per trip is then applied to the daily PM peak hour trips generated by various land use types. The more trips that are associated with a particular land use or development, the greater its impact on the street system. The IFFP explains that trips generated need to be divided by two in order to avoid double-counting such as when a person leaves home and goes to work.
“There is a minor discrepancy in the way ITE calculates trips and the way trips or roadway volumes are calculated in the travel demand modeling used in the Springville TMP. This discrepancy is explained by the model roadway volumes and capacities being calculated using daily traffic volumes rather than trips on the roadway. Essentially this means that a travel demand model “trip” or unit of volume is counted once as a vehicle leaves home, travels on the
Zions Public Finance, Inc. | December 2017
Springville City | Updated Transportation Impact Fee Analysis
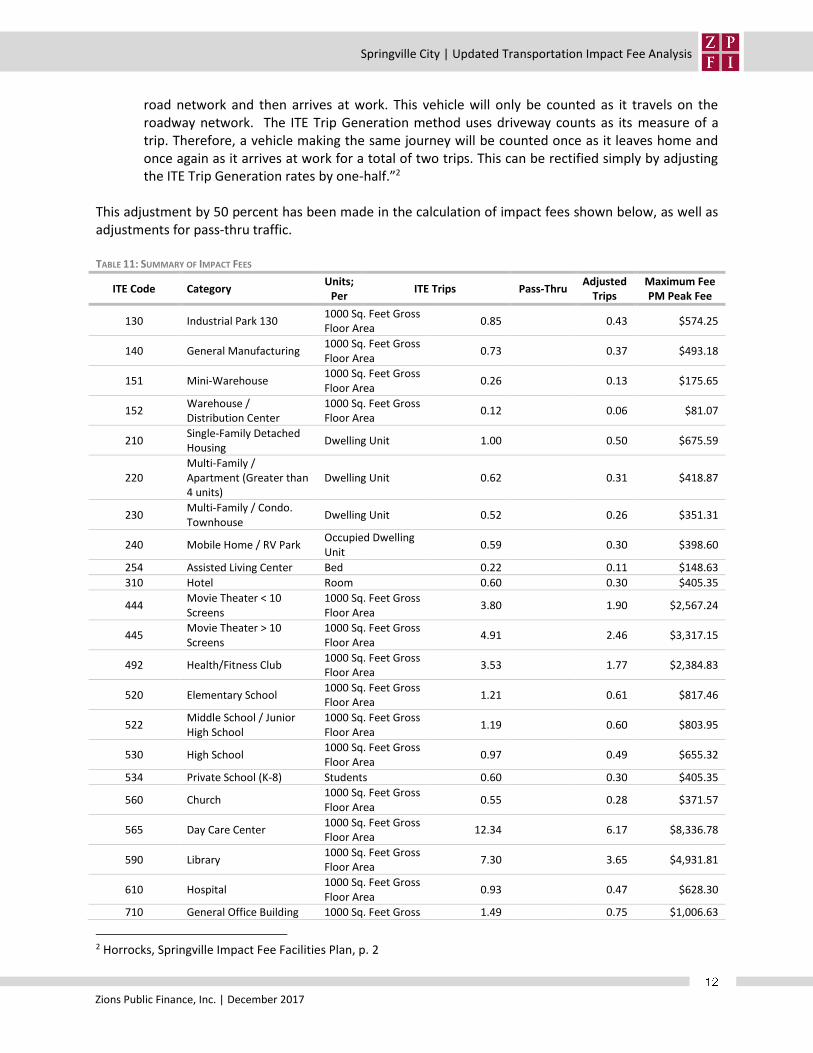
road network and then arrives at work. This vehicle will only be counted as it travels on the roadway network. The ITE Trip Generation method uses driveway counts as its measure of a trip. Therefore, a vehicle making the same journey will be counted once as it leaves home and once again as it arrives at work for a total of two trips. This can be rectified simply by adjusting the ITE Trip Generation rates by one-half.”2
This adjustment by 50 percent has been made in the calculation of impact fees shown below, as well as adjustments for pass-thru traffic. TABLE 11: SUMMARY OF IMPACT FEES
ITE Code Category Units;
Per ITE Trips Pass-Thru
Adjusted Trips
Maximum Fee PM Peak Fee
130 Industrial Park 130 1000 Sq. Feet Gross Floor Area
0.85 0.43 $574.25
140 General Manufacturing 1000 Sq. Feet Gross Floor Area
0.73 0.37 $493.18
151 Mini-Warehouse 1000 Sq. Feet Gross Floor Area
0.26 0.13 $175.65
152 Warehouse / Distribution Center
1000 Sq. Feet Gross Floor Area
0.12 0.06 $81.07
210 Single-Family Detached Housing
Dwelling Unit 1.00 0.50 $675.59
220 Multi-Family / Apartment (Greater than 4 units)
Dwelling Unit 0.62 0.31 $418.87
230 Multi-Family / Condo. Townhouse
Dwelling Unit 0.52 0.26 $351.31
240 Mobile Home / RV Park Occupied Dwelling Unit
0.59 0.30 $398.60
254 Assisted Living Center Bed 0.22 0.11 $148.63
310 Hotel Room 0.60 0.30 $405.35
444 Movie Theater < 10 Screens
1000 Sq. Feet Gross Floor Area
3.80 1.90 $2,567.24
445 Movie Theater > 10 Screens
1000 Sq. Feet Gross Floor Area
4.91 2.46 $3,317.15
492 Health/Fitness Club 1000 Sq. Feet Gross Floor Area
3.53 1.77 $2,384.83
520 Elementary School 1000 Sq. Feet Gross Floor Area
1.21 0.61 $817.46
522 Middle School / Junior High School
1000 Sq. Feet Gross Floor Area
1.19 0.60 $803.95
530 High School 1000 Sq. Feet Gross Floor Area
0.97 0.49 $655.32
534 Private School (K-8) Students 0.60 0.30 $405.35
560 Church 1000 Sq. Feet Gross Floor Area
0.55 0.28 $371.57
565 Day Care Center 1000 Sq. Feet Gross Floor Area
12.34 6.17 $8,336.78
590 Library 1000 Sq. Feet Gross Floor Area
7.30 3.65 $4,931.81
610 Hospital 1000 Sq. Feet Gross Floor Area
0.93 0.47 $628.30
710 General Office Building 1000 Sq. Feet Gross 1.49 0.75 $1,006.63
2 Horrocks, Springville Impact Fee Facilities Plan, p. 2

Zions Public Finance, Inc. | December 2017
Springville City | Updated Transportation Impact Fee Analysis
ITE Code Category Units;
Per ITE Trips Pass-Thru
Adjusted Trips
Maximum Fee PM Peak Fee
Floor Area
720 Medical-Dental Office Building
1000 Sq. Feet Gross Floor Area
3.57 1.79 $2,411.86
770 Business Park 1000 Sq. Feet Gross Floor Area
1.26 0.63 $851.24
812 Building Material and Lumber Store
1000 Sq. Feet Gross Floor Area
4.49 2.25 $3,033.40
817 Nursery (Garden Center) 1000 Sq. Feet Gross Floor Area
6.94 3.47 $4,688.59
820 Shopping Center / Strip Mall
1000 Sq. Feet Gross Leasable Area
3.71 34% 1.22 $1,654.25
826 Specialty Retail Center 1000 Sq. Feet Gross Leasable Area
2.71 1.36 $1,830.85
841 Automobile Sales 1000 Sq. Feet Gross Floor Area
5.98 2.99 $4,040.03
848 Tire Store 1000 Sq. Feet Gross Floor Area
4.15 28% 1.49 $2,018.66
850 Supermarket 1000 Sq. Feet Gross Floor Area
9.48 36% 3.03 $4,098.94
851 Convenience Market 1000 Sq. Feet Gross Floor Area
52.41 61% 10.22 $13,808.99
912 Drive-in Bank 1000 Sq. Feet Gross Floor Area
24.30 47% 6.44 $8,700.92
918 Hair Salon 1000 Sq. Feet Gross Floor Area
1.45 0.73 $979.61
932 Restaurant, Sit-Down (High Turnover)
1000 Sq. Feet Gross Floor Area
9.85 44% 2.76 $3,726.55
933 Fast Food without Drive-Through Window
1000 Sq. Feet Gross Floor Area
26.15 43% 7.45 $10,070.01
934 Restaurant with Drive Through Window
1000 Sq. Feet Gross Floor Area
32.65 50% 8.16 $11,029.01
942 Auto Care Center 1000 Sq. Feet Gross Leasable Area
3.11 1.56 $2,101.08
944 Gasoline/Service Station Fueling Position 13.87 42% 4.02 $5,434.85
945 Gasoline/Service Station with Convenience Store
1000 Sq. Feet Gross Floor Area
97.47 56% 21.44 $28,973.89
947 Self Service Car Wash Wash Stall 5.54 2.77 $3,742.77
948 Automated Car Wash 1000 Sq. Feet Gross Floor Area
14.12 7.06 $9,539.33
Calculation of Credits The City has only one bond issue outstanding that was used for roadway construction. The proceeds of the 2005 special assessment bonds were used to make water, sewer, road, curb and gutter improvements in the west fields. The City pledges income derived from special assessment collections from landowners in the improved areas to repay them. Annual principal and interest payments are expected to approximate the special assessment collections each year;3 therefore no credits need to be made against the transportation impact fees due to outstanding debt obligations.
3 Source: Springville City Annual Financial Statement 2015, p. 44.
Zions Public Finance, Inc. | December 2017
Springville City | Updated Transportation Impact Fee Analysis
The City may choose to credit certain development types, including affordable housing, but these credits are at the discretion of the City. Further, a City may choose to allow a developer to put in a transportation facility listed in the IFFP and reduce impact fees accordingly. Again, this is at the discretion of the City.
Certification
Zions Public Finance, Inc. certifies that the attached impact fee analysis:
1. Includes only the costs of public facilities that are:
a. allowed under the Impact Fees Act; and
b. actually incurred; or
c. projected to be incurred or encumbered within six years after the day on which each
impact fee is paid;
2. Does not include:
a. costs of operation and maintenance of public facilities;
b. costs for qualifying public facilities that will raise the level of service for the facilities,
through impact fees, above the level of service that is supported by existing residents;
or
c. an expense for overhead, unless the expense is calculated pursuant to a methodology
that is consistent with generally accepted cost accounting practices and the
methodological standards set forth by the federal Office of Management and Budget for
federal grant reimbursement;
3. Offsets costs with grants or other alternate sources of payment; and
4. Complies in each and every relevant respect with the Impact Fees Act.