urban climate newsurban-climate.org/newsletters/iauc039.pdf · 2011-04-06 · urban climate news...
TRANSCRIPT

ISSUE NO. 39 MARCH 2011 • INTERNATIONAL ASSOCIATION FOR URBAN CLIMATE
Urban Climate NewsQuarterly Newsletter of the IAUC
Inside the Spring issue...
2
5
13
22
26
31
and is reviewed here. It is distinguished by its focus on the management of climate at urban scales, and address-es many of the place-specific considerations that must underpin an approach to climate change that is based on the notion of resilience.
This edition of Urban Climate News also includes notice of the 8th International Conference on Urban Climate (ICUC-8), which will take place in Dublin (Ireland) from 6th to 10th August 2012. From this point onwards, regu-lar updates will appear in Urban Climate News and on the conference website (www.icuc8.org).
In 2009, ICUC-7 was held in Yokohama (Japan), and many of us attended that marvellous event. More general-ly, the urban climate community has a special affinity with our Japanese colleagues whose work has been at the fore-front of urban climate science. On behalf of the IAUC and its members, I would like to express our deep concern over the tragic events occurring in Japan, and offer our support to colleagues during this trying time.
Colleagues,The amount of material that is appearing in the broad
area of urban climates is growing at a surprising rate. This month UN Habitat published the Global Report on Human Settlements 2011 - Cities and Climate Change. In his intro-duction to the volume, Dr. Joan Clos (Under-Secretary-General and Executive Director) outlines the scope of the publication – highlighting the fact that, as global carbon emissions substantially arise from urban areas, they rep-resent an obvious scale at which to act. He states that Cities and Climate Change “seeks to improve knowledge among governments and all those interested in urban development and in climate change, on the contribution of cities to climate change, the impacts of climate change on cities, and how cities are mitigating and adapting to climate change. More importantly, the Report identifies promising mitigation and adaptation measures that are supportive of more sustainable and resilient urban devel-opment paths.”
The need for place-specific responses is implicit in one of the report’s principles: no single mitigation or adapta-tion policy is equally well-suited to all cities. However, it is not clear to me that we have a multi-scale approach to the science of climate change yet. I think that Lowry’s classic paper on the urban climate problem is of some relevance
From the IAUC President
News: Sensors track Japan radiation • BP oil spill & UAQ • Cities & hurricanes
Feature: Meso-urban modeling in support of heat island mitigation
Projects: Explaining Moscow’s 2010 heat wave • Thermal analysis in Caracas
Special Reports: Special ICUC-7 journal issue showcases research
Bibliography: Articles • Book reviewConferences: EGU • AAG • IALE • more
IAUC Board: ICUC-8 announced for August 6-10 in Dublin, Ireland
in this regard. In essence, his work distinguished between a background climate and the urban climate effect. While the mitigation issue is linked to the latter, the adapta-tion issue is connected to addressing the changing back-ground climate. However, both will have to be addressed simultaneously at city scales, including those of buildings and ‘neighbourhoods’ – the scales at which people live.
Moreover, climate-based policies will have to be more precisely tuned to take account of the scales of urban ef-fect and the relationship of cities to their background cli-mates. This is where urban climate knowledge can be of most benefit, I believe. In this regard I would draw your attention to Urban Microclimate: Designing the Spaces Be-tween Buildings, which has also been published recently
Gerald [email protected]
ICUC-8 in Dublin6-10 August 2012

In the News 2
ISSUE NO. 39 MARCH 2011 INTERNATIONAL ASSOCIATION FOR URBAN CLIMATE
March 2011 — As radioactive contamination from the Fukushima Dai-ichi nuclear power plant spreads, a global network of sensors is tracking it across oceans and conti-nents. The network was originally set up to detect nuclear weapons testing, but scientists now hope it can tell them more about the accident.
The Comprehensive Test Ban Treaty Organization be-gan setting up its monitoring stations about a decade ago, with the eventual goal of enforcing a worldwide ban on nuclear weapons tests.
“We have currently over 280 sensors worldwide, moni-toring underground, the atmosphere, the oceans for any sign of a nuclear explosion, and we’re also sniffing the air for any sign of radioactivity,” says spokesperson Annika Thunborg.
That now includes radioactivity from the Japanese plant. Explosions at three reactors and a fire at a spent fuel pool have released radiation into the atmosphere.
Gerhard Wotawa, with the Austrian meteorological institute, has been studying data coming in from the monitoring stations and says there’s no doubt that what they’re picking up comes from Japan.
“Data like that I have never seen in my career,” he says, “so it is pretty much clear where it comes from.”
The sensors are registering radioactive elements in-cluding iodine-131 and cesium-137 — byproducts from nuclear fission inside the core of a reactor. Wotawa has been feeding the data into computer models that can forecast where the radiation will go. He also uses the models to work backward and calculate the amount of material first released. Based on those calculations he says the accident, in some ways, is roughly the size of Chernobyl.
“The daily release is comparable to what was released in Chernobyl,” he says. “However, the effect of the power plant accident in Japan is not comparable to the effect of Chernobyl on the former Soviet Union.”
That’s partially because Chernobyl was inland, and ra-diation contaminated land in all directions. Fukushima is on the coast, and winds are blowing much of the material out over the Pacific.
Is The Worst Behind Us?
Wotawa’s calculations are an estimate, though, and not everyone agrees that the accident is comparable to Chernobyl.
“If I had to guess, I would say the release levels or more like Three Mile Island and less like Chernobyl, but we’ll see as time goes forward,” says Harry Miley, a nuclear physi-
cist at Pacific Northwest National Laboratory in Washing-ton state. He says analyzing the types and amounts of radioactive material picked up by the sensor network will tell researchers around the world more about what hap-pened inside the reactors at Fukushima.
“We might determine things like what was the temper-ature of the material when the radioactivity was emitted, and which material it was,” he says. “There are three reac-tors, and there are spent fuel pools and so forth — they’re all potential sources, and we should be able to nail down which source is which.”
For now this system may be the only way to measure what’s happened — radiation levels on the site are far too high to take a direct look. The sensors should also provide people with a sense of reassurance. Even though radia-tion from the plant has been picked up across the United States, Miley says that the levels aren’t dangerous.
“The highest detection that we’ve gotten here in the U.S. has been far lower than the natural radioactivity that’s already there, so I don’t think there’s any increased risk to the U.S. public,” he says.
And there’s more good news — the latest readings in America seem to indicate that radiation from the plant is decreasing. Miley is hopeful that the worst of the ac-cident may be behind us. — Geoff Brumfiel for NPR
Source: http://www.npr.org/2011/03/25/134833909/built-for-bombs-sensors-now-track-japan-radiation
Global sensor network tracks spread of Japan radiation, helping to assess release levels and gauge exposure over populated areas
A computer model shows how a plume of radioactive io-dine-131 could spread in the atmosphere. Source: ZAMG
Viewanimation
In the News 3
ISSUE NO. 39 MARCH 2011 INTERNATIONAL ASSOCIATION FOR URBAN CLIMATE
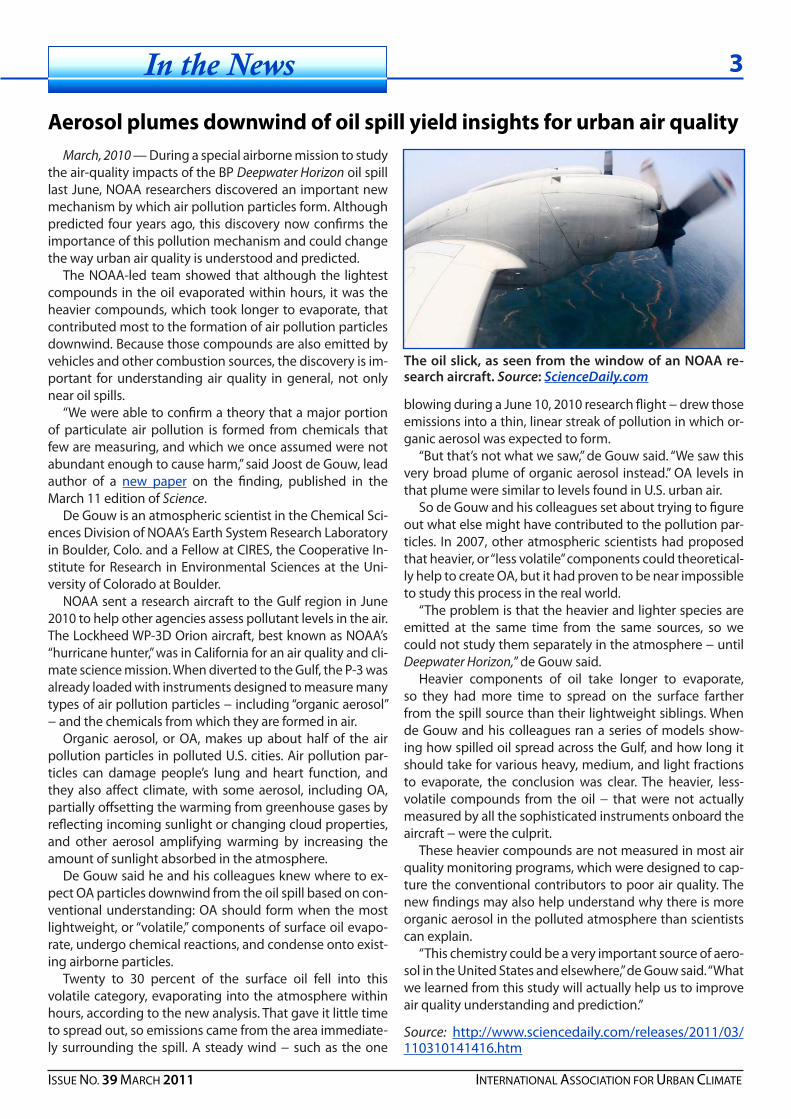
March, 2010 — During a special airborne mission to study the air-quality impacts of the BP Deepwater Horizon oil spill last June, NOAA researchers discovered an important new mechanism by which air pollution particles form. Although predicted four years ago, this discovery now confirms the importance of this pollution mechanism and could change the way urban air quality is understood and predicted.
The NOAA-led team showed that although the lightest compounds in the oil evaporated within hours, it was the heavier compounds, which took longer to evaporate, that contributed most to the formation of air pollution particles downwind. Because those compounds are also emitted by vehicles and other combustion sources, the discovery is im-portant for understanding air quality in general, not only near oil spills.
“We were able to confirm a theory that a major portion of particulate air pollution is formed from chemicals that few are measuring, and which we once assumed were not abundant enough to cause harm,” said Joost de Gouw, lead author of a new paper on the finding, published in the March 11 edition of Science.
De Gouw is an atmospheric scientist in the Chemical Sci-ences Division of NOAA’s Earth System Research Laboratory in Boulder, Colo. and a Fellow at CIRES, the Cooperative In-stitute for Research in Environmental Sciences at the Uni-versity of Colorado at Boulder.
NOAA sent a research aircraft to the Gulf region in June 2010 to help other agencies assess pollutant levels in the air. The Lockheed WP-3D Orion aircraft, best known as NOAA’s “hurricane hunter,” was in California for an air quality and cli-mate science mission. When diverted to the Gulf, the P-3 was already loaded with instruments designed to measure many types of air pollution particles − including “organic aerosol” − and the chemicals from which they are formed in air.
Organic aerosol, or OA, makes up about half of the air pollution particles in polluted U.S. cities. Air pollution par-ticles can damage people’s lung and heart function, and they also affect climate, with some aerosol, including OA, partially offsetting the warming from greenhouse gases by reflecting incoming sunlight or changing cloud properties, and other aerosol amplifying warming by increasing the amount of sunlight absorbed in the atmosphere.
De Gouw said he and his colleagues knew where to ex-pect OA particles downwind from the oil spill based on con-ventional understanding: OA should form when the most lightweight, or “volatile,” components of surface oil evapo-rate, undergo chemical reactions, and condense onto exist-ing airborne particles.
Twenty to 30 percent of the surface oil fell into this volatile category, evaporating into the atmosphere within hours, according to the new analysis. That gave it little time to spread out, so emissions came from the area immediate-ly surrounding the spill. A steady wind − such as the one
Aerosol plumes downwind of oil spill yield insights for urban air quality
blowing during a June 10, 2010 research flight − drew those emissions into a thin, linear streak of pollution in which or-ganic aerosol was expected to form.
“But that’s not what we saw,” de Gouw said. “We saw this very broad plume of organic aerosol instead.” OA levels in that plume were similar to levels found in U.S. urban air.
So de Gouw and his colleagues set about trying to figure out what else might have contributed to the pollution par-ticles. In 2007, other atmospheric scientists had proposed that heavier, or “less volatile” components could theoretical-ly help to create OA, but it had proven to be near impossible to study this process in the real world.
“The problem is that the heavier and lighter species are emitted at the same time from the same sources, so we could not study them separately in the atmosphere − until Deepwater Horizon,” de Gouw said.
Heavier components of oil take longer to evaporate, so they had more time to spread on the surface farther from the spill source than their lightweight siblings. When de Gouw and his colleagues ran a series of models show-ing how spilled oil spread across the Gulf, and how long it should take for various heavy, medium, and light fractions to evaporate, the conclusion was clear. The heavier, less-volatile compounds from the oil − that were not actually measured by all the sophisticated instruments onboard the aircraft − were the culprit.
These heavier compounds are not measured in most air quality monitoring programs, which were designed to cap-ture the conventional contributors to poor air quality. The new findings may also help understand why there is more organic aerosol in the polluted atmosphere than scientists can explain.
“This chemistry could be a very important source of aero-sol in the United States and elsewhere,” de Gouw said. “What we learned from this study will actually help us to improve air quality understanding and prediction.”
Source: http://www.sciencedaily.com/releases/2011/03/ 110310141416.htm
The oil slick, as seen from the window of an NOAA re-search aircraft. Source: ScienceDaily.com

In the News �
ISSUE NO. 39 MARCH 2011 INTERNATIONAL ASSOCIATION FOR URBAN CLIMATE
Powerful hurricanes can wreak havoc when they strike heavily populated coastal areas. New research shows that the cities themselves might be partly re-sponsible for attracting these storms, with the ex-tra friction created by “rough” landscapes such as tall buildings significantly diverting the path of a storm.
A hurricane, or tropical cyclone, is a system of winds rotating inwards to an area of low pressure. Stretching hundreds of kilometres across, they feed on the heat given off by moist air as it rises and condenses. As such, they form over large expanses of warm water – normally tropical seas – and lose strength if they reach land.
In May the National Oceanic and Atmospheric Ad-ministration (NOAA) in the US said that this season the Atlantic would probably see more hurricanes than normal, giving a 70% probability of between three and seven really big storms in 2010. Currently, the NOAA is able to provide a 24-hour forecast of the position of a hurricane’s centre with a margin of error of about 100 km − but it becomes especially difficult to predict the path of hurricanes once they reach land.
Scientists know that wind speeds drop signifi-cantly due to the extra friction that a hurricane ex-periences once it makes “landfall,” and they have also observed how the reduction in moisture inland causes a hurricane to peter out. Now Johnny Chan and Andie Au-Yeung of the City University of Hong Kong in China have extended these analyses to find out the effects of variations in roughness and mois-ture levels over land.
They did this by using the Weather Research and Forecasting model to simulate a hurricane ap-proaching a north-south coastline from the east and then passing over rough land. Roughness could be generated by tall buildings, hilly terrain or forests; marshland or agricultural land, for example would be smoother.
Rougher land
In one simulation the researchers studied what happened when they made some of the coast rough and some smooth. With the northerly por-tion rough they found that the hurricane drifted
Cities may be attracting hurricanes
several tens of kilometres northwards and likewise when the southerly section was rough the hurricane shifted southwards. They say that over rougher land, greater friction causes the air to become more com-pressed, which forces it to rise up and release more of its latent heat. This heating in turn then causes the air to spin faster, which pulls the hurricane in that direction.
Chan and Au-Yeung say that their research shows the importance of including land-surface variation in hurricane forecasting in the future. But they ad-mit that more needs to be done to confirm the re-sults of their study. They say they will now improve their simulations so that they include the very slight variation in rotation that the Earth experiences at different latitudes, which, they say, causes a larger drift in a hurricane’s position than surface rough-ness. They say they will also put in more detailed features, such as mountains or jagged coastlines.
Harold Brooks of the NOAA’s National Severe Storms Laboratory in Oklahoma says he doesn’t think the research will make much of a difference to forecasting a hurricane’s position but believes it might help us better understand how the inten-sity of a hurricane changes. “It has been observed that frequently hurricanes lose intensity just before landfall,” he says. “The reason for this is not clear. It is possible that a better understanding of coastal pro-cesses could address that question.”
Source: http://physicsworld.com/cws/article/news/ 43381
On 28 August 2005, Hurricane Katrina was in the Gulf of Mexico where it powered up to a category 5 storm on the Saffir-Simpson hurricane scale, packing winds estimated at 175 mph (Courtesy: NOAA). Source: PhysicsWorld.com

Feature 5
ISSUE NO. 39 MARCH 2011 INTERNATIONAL ASSOCIATION FOR URBAN CLIMATE
1. Heat island mitigationUHI mitigation measures
include increased albedo on various urban and built-up surfaces, increased vegeta-tive cover, decreased runoff, i.e., control of impervious sur-face area, decreased anthro-pogenic heating, increased structural and natural shading, and green roofs. However, be-cause of their effectiveness, two such measures, namely, increased urban albedo and vegetative cover, have been evaluated more extensively than others, e.g., via modeling and / or observational field studies. In the U.S., many energy, environmental, and regulatory agencies, e.g., US EPA, California Energy Commission, California Air Resources Board, and several Air Quality Management Districts, have shown interest in one aspect or the other of the UHI mitigation portfolio as a potential strategy to reduce energy use, reduce emis-sions of ozone precursors and carbon dioxide, improve air quality, provide a cooling effect on climate via nega-tive radiative forcing, and local ambient cooling.
This article briefly touches upon some on-going modeling projects at Altostratus Inc. that quantify the
By Haider Taha ([email protected])
Altostratus Inc., Martinez, California, USA
It has been recognized, especially over the last two decades, that mitigation of urban heat islands (UHI) can impart several beneficial effects, both direct and indirect. For example, reductions in energy use (Taha et al. 1999, Rosenfeld et al. 1995), emissions of ozone precursors and carbon dioxide (Taha et al. 1998, Taha 1996,1997), heat stress (Taha et al. 2004), and improvements in air quality (Taha 2005,2007) are some such benefits that can be anticipated. Taha (2001) also showed that UHI control can have a potential to locally offset the effects of climate change (e.g., IPCC scenarios for years 2050 and 2090) on ozone air quality. Clearly, the magnitude of UHI mitigation benefits will vary depending on weather, lo-cation, pollutant emissions and transport, level or urbanization, energy use, and so on, but the benefits appear to persist across a range of conditions. In addition, the existence of a UHI is not a prerequisite for achieving those benefits. In other words, if a certain region does not have a UHI to begin with, and many regions don’t, the implementation of these measures can still create more comfortable summer environmental conditions, reduce cooling energy use, and improve air quality.
Meso-urban modeling in support of heat-island mitigation
Figure 1. Main models and linkages in simulating UHI mitigation; more information in Taha (2007)
• Fine-resolution morphology• Resolved surface properties• Detailed canopy representation:
LAI, vegetative cover, PAD, FAD, TAD, etc.
Land use / Land coverSurface Properties
Morphology perturbations• Surface properties / albedo and canopy perturbations
• Met ic / bc / analyses• LULC characterization
Perturbations in albedo,LULC and canopy cover
mesoscale modelingMM5 / WRF
urbanized modelinguMM5 / DA-SM2-U
WRF-urban
Radiative transfer modelStreamer
P1
P3
P2
Energy
Meteorology
Emissions
A
B
Radiativeforcing Photochemical modeling
CAMx / CMAQ
Fine resolution photochemical modelingCAMx / CMAQ
P9P7
P6 P5
Emission inventories
Future-year controlled emissions• Species changes / replanting
Air quality
P10
P8
P6
P4
Emissions correctionsBEIS3 / MEGAN
EMS-95
A: Power plant emissions – utility modelB: Building energy simulation models
P5
meteorological, emissions, and air quality impacts of UHI mitigation measures. As these studies are on-go-ing, no publishable results are provided here – the fo-cus of the following discussion is on a description of the goals and approaches of these studies along with some initial, work-in-progress examples of products and findings.

Feature 6
ISSUE NO. 39 MARCH 2011 INTERNATIONAL ASSOCIATION FOR URBAN CLIMATE
2. Evaluation of UHI mitigation under seasonal and multi-episodic conditions
Several past modeling studies, e.g., Taha (2005,2007) addressed the meteorological, emissions, and air-qual-ity benefits of UHI mitigation on episodic time scales. While this type of modeling is useful in capturing the effectiveness of UHI control under some of the more ex-treme conditions (e.g., high ozone and large precursor-emission rates), such conditions are not always preva-lent during the ozone season, especially in more recent years where improved emission controls have reduced the occurrence of high-ozone episodes. It is thus desir-able to evaluate the effectiveness of UHI mitigation un-der average and frequently-occurring conditions in ad-dition to those worst-case scenarios. Such evaluations are important for cities and communities if and when they decide to adopt selected UHI-mitigation mea-sures and thus need, for planning purposes, more spe-cific estimates of their long-term potential benefits as well as possible inadvertent negative impacts. Thus the main goal of this study is to perform extensive, multi-episodic and seasonal modeling, spanning a period of ten years (1995 – 2005), to examine the effectiveness of UHI mitigation under varied meteorological conditions and emission scenarios.
UHI mitigation is evaluated using state-of-science models that have been further modified and updated to suit the particulars of this application (Fig. 1). In this study, the meteorological modeling is done with the mesoscale MM5 (Dudhia 1993) and the urbanized ver-sion, uMM5 (Taha 2008a,b) which is a modified ver-sion of the DA-SM2-U model of DuPont et al. (2004) that incorporates the drag-force approach of Martilli et al. (2002). These meteorological models are linked with emission models (SMOKE / BEIS3 or MEGAN), photochemical models (CAMx or CMAQ), and radia-tive transfer models (Streamer) as discussed in Taha (2008a-c) and Taha and Sailor (2010).
The fine-resolution modeling requires detailed characterizations of the physical, geometrical, land-use, land-cover, and morphological properties of urban areas. This can be based on urban data, e.g., NUDAPT (Ching et al. 2009), local surveys and region-specific data generated for areas of interest (Taha 2005,2007), and other sources of general information such as Google Earth Pro (Taha 2008a). Improvements are also made on biogenic volatile organic compound (BVOC) emissions calculation methodologies relative to approaches typically used in conventional, regula-tory modeling.
A large number of modeling episodes (ranging from 8 to 30 days each) were selected based on observed daily peak ozone (at each of 134 air quality monitors in several counties in California) and on meteorol-ogy. For this purpose, an analysis was carried out to characterize the meteorological regimes conducive to various levels of ozone (marginal, moderate, high, extreme), via classification and regression tree (CART) approach, an example of which is shown in Figure 2. Because the relationships between ozone formation and meteorology differ significantly from one region to another, CART analysis can be useful in capturing some of the non-linear effects involved (Thompson et al. 2000).
Selection of the predictor meteorological variables for CART analysis depends on a region’s synoptic me-teorological characteristics, location and topographi-cal features, and spatial patterns of emissions, but certain variables are almost always present. From a large number of meteorological variables, Cox and Chu (1996) found that the most relevant ones for ur-ban areas are maximum surface temperature, wind speed, relative humidity, mixing height, and cloud cover. Other researchers used pressure and geopo-tential height, assuming that they are surrogates for other meteorological variables (Pryor et al. 1995). Up-per-air observations are included in CART analysis and are useful in predicting peak ozone regimes because upper-air conditions are indicative of large-scale / syn-optic weather patterns (Davis et al. 1998).
For CART analysis in this study, hourly and daily-peak ozone concentrations at each of 134 monitors are binned (into 30-ppb bins) and correlated with air temperature, dewpoint temperature, pressure height, wind speed, and wind direction from several surface and upper-air stations, and at various levels, including 1000, 850, and 700 hPa. The purpose of this analysis is to determine the representativeness of each set of meteorological conditions leading to certain ozone concentration bins, e.g., extreme, high, moderate, and marginal. Thus a large number of trees (one for each of the 134 monitors) are generated to capture the various conditions examined in this study for the 10-year period. In this CART analysis, weekdays and weekends are evaluated separately (separate trees) to avoid masking the weekend effect on emissions and air quality.
Of interest to the particular goals of this study is that similar ozone bins (concentration ranges) can be reached via different pathways, i.e., different combi-

Feature
O3 bin Frequency Of which Tair1000 Tair700 WSP700 Tdew700 HT700110-140 2.5% 100% occurs −> >288 K <0.5 m/s
80-110 19.2% 14% occurs −> <288 K >284 K >314611% >288 K <2.83 m/s >257 K37% >288 K <4.00 m/s16% >288 K <4.90 m/s21% >288 K <7.93 m/s
50-80 78.3% 66% occurs −> <288 K
�
ISSUE NO. 39 MARCH 2011 INTERNATIONAL ASSOCIATION FOR URBAN CLIMATE
nations of meteorological variable ranges (see, for ex-ample, Figure 2 and as summarized in the table). This is useful in evaluating the representativeness of each set of meteorological conditions and the effectiveness of UHI mitigation for each set.
3. Modeling the potential impacts of urban solar systems
A task related to the project discussed above is to assess the heat-island formation potential of large-scale deployment of urban solar systems, e.g., photo-
voltaics and passive / active solar technologies. Since these systems absorb solar energy and their surfaces become hot, ambient air temperature can increase, too, thus resulting in a heat island effect. In theory this could offset, to a certain extent, the benefits from deploying solar systems, which include generating electricity and space heating / cooling to conserve energy. This study evaluates, via detailed modeling, the magnitude of this heat island effect and deter-mines 1) whether that effect is significant enough to be accounted for, and 2) if compensating technolo-gies, at community scale, need to be implemented simultaneously, such as cool roofs or other UHI-miti-gation measures.
To quantify any UHI-formation po-tential and the possible needed miti-
gation, CFD and meso-urban mod-eling is done in this study
based on detailed sur-face and urban
Figure 2. An example CART analysis showing Alameda County ozone peaks (in 30-ppb bins) vs. Oakland air-port surface and upper-air meteorology variables at 1200 UTC over a period of 5 years (weekdays) at three levels (1000, 850, and 700 hPa). Here, HT is geopotential height (m), TAIR is air temperature (K), TDEW is dew-point temperature (K), and WDR (º) and WSP (m/s) are wind direction and speed, respectively. Thus for example, WSP850 indicates wind speed at the 850 hPa pressure level. The splitting variable and its value are shown to the left of the nodes; the node number is inside the circle, and the number of nodes to the left of it. Below each circle is the ozone bin (ppb range) and a misclassification cost.
Feature 8
ISSUE NO. 39 MARCH 2011 INTERNATIONAL ASSOCIATION FOR URBAN CLIMATE
morphological characterization, assessment of poten-tial solar-system penetration, and solar deployment potential (e.g., Taha 2007, Chaves and Bahill 2010). If the impact is found to be significant, then the analysis will also evaluate the associated effects on emissions of ozone precursors and on ozone formation. This study also lays the groundwork for potential future modeling of large solar power plants, such as those being currently approved and licensed by the Califor-nia Energy Commission.
�. UHI modeling in support of a voluntary con-trol measure
In Sacramento, California, the Sacramento Metro-politan Air Quality Management District (SMAQMD), in collaboration with the Sacramento Tree Foundation (STF) and the UC Davis Center for Urban Forest Re-search (CUFR), is currently developing a voluntary con-trol measure for ozone, based on reducing the BVOC emissions from urban forests to help the region attain and maintain the Federal 8-hour ozone standard. Our role in this project is to perform detailed atmospheric modeling in support of the control measure.
The measure’s strategies are to shift the current tree-
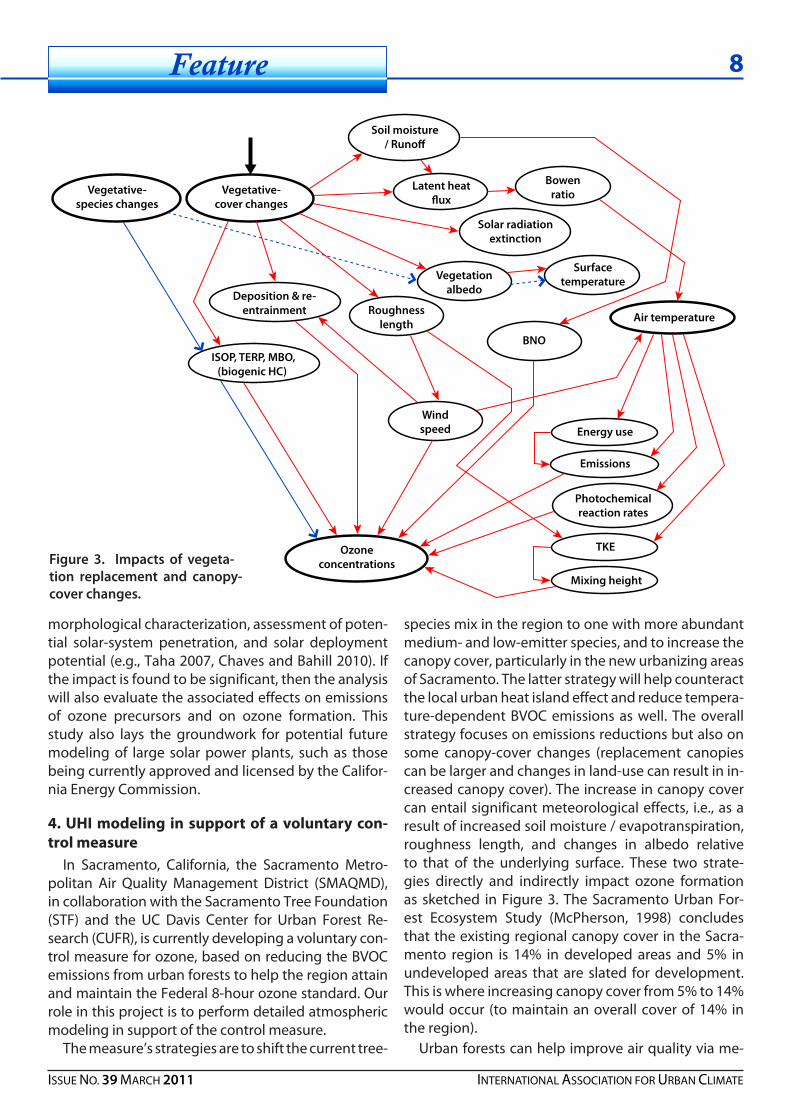
species mix in the region to one with more abundant medium- and low-emitter species, and to increase the canopy cover, particularly in the new urbanizing areas of Sacramento. The latter strategy will help counteract the local urban heat island effect and reduce tempera-ture-dependent BVOC emissions as well. The overall strategy focuses on emissions reductions but also on some canopy-cover changes (replacement canopies can be larger and changes in land-use can result in in-creased canopy cover). The increase in canopy cover can entail significant meteorological effects, i.e., as a result of increased soil moisture / evapotranspiration, roughness length, and changes in albedo relative to that of the underlying surface. These two strate-gies directly and indirectly impact ozone formation as sketched in Figure 3. The Sacramento Urban For-est Ecosystem Study (McPherson, 1998) concludes that the existing regional canopy cover in the Sacra-mento region is 14% in developed areas and 5% in undeveloped areas that are slated for development. This is where increasing canopy cover from 5% to 14% would occur (to maintain an overall cover of 14% in the region).
Urban forests can help improve air quality via me-
Figure 3. Impacts of vegeta-tion replacement and canopy-cover changes.
Vegetative-species changes
Vegetative-cover changes
Soil moisture/ Runo�
Ozoneconcentrations
Air temperature
Solar radiationextinction
Latent heat�ux
Bowenratio
SurfacetemperatureVegetation
albedo
Roughnesslength
Deposition & re-entrainment
BNOISOP, TERP, MBO,
(biogenic HC)
Windspeed Energy use
Emissions
Photochemicalreaction rates
TKE
Mixing height

Feature �
ISSUE NO. 39 MARCH 2011 INTERNATIONAL ASSOCIATION FOR URBAN CLIMATE
teorological, deposition, and emissions / photochemi-cal mechanisms. As with most control strategies, the implementation of increased canopy cover can im-part both positive (beneficial) and negative (inadver-tent) effects on air quality, as a large number of factors and non-linear, competing effects are present. Previ-ous studies have shown that the relative benefits and disbenefits of urban forests differ significantly from region to region (Taha 1996) and that it is possible to maximize the potential benefits on a region-spe-cific basis by finding the optimal mix of strategies for each location. In addition, the potential effectiveness of urban reforestation, unlike conventional air-pollu-tion control strategies, also depends on meteorologi-cal conditions, thus adding another dimension to the complexity of evaluating potential ozone air-quality benefits of this control measure.
As shown in Figure 3, the modeling captures sev-eral interrelated processes resulting from changes in vegetation cover, canopy structure, and species. Spe-cies replacement and increasing vegetative cover can result in modification to the soil-vegetation system’s albedo. Thus it is important to evaluate vegetation-canopy albedo relative to that of the underlying sur-face and how, in turn, it affects energy balance. While vegetation albedo can sometimes be higher than that of urban surfaces, the main effect arises from the in-troduction of new vegetation canopy not the replace-
ment of species. Vegetation also impacts roughness length, soil moisture and evapotranspiration. At the mesoscale simulations level (4-km resolution in this study), roughness length is unchanged in response to replacement trees or canopies that are immedi-ately adjacent to buildings, since the assumption is that there is either no change in canopy structure (re-placement) or that the increase in canopy is uniform with buildings. However, at the finer meso-urban scale (e.g., sub-kilometer in the horizontal and a few meters in the vertical, in this study) impacts of can-opy roughness are accounted for via the drag-force approach of the urbanized MM5 (Dupont et al. 2004, Taha 2008a,b). Another aspect of vegetation that is related to roughness is deposition velocity. In the air-quality model, as modified in this study, the calcu-lation of deposition velocity is improved upon with more accurate land-use, land-cover, and morphol-ogy characterizations that are then used in more re-solved roughness-length calculations, e.g., using the approach of MacDonald et al. (1998). Figure 4 shows an example of roughness length computed following this approach for Sacramento, California.
Changes in BVOC emission rates as a result of spe-cies replacement and varying meteorology (effects of changing photosynthetically-active radiation (PAR) and temperature) are modeled using the relations of Guenther and Wiedinmyer (2004) and Guenther et al.
Figure 4. 1-km resolu-tion roughness length (m) in the Sacramento uMM5 modeling domain.
Feature 10
ISSUE NO. 39 MARCH 2011 INTERNATIONAL ASSOCIATION FOR URBAN CLIMATE
(1993). The BVOC emissions of in-terest include those of isoprene, monoterpenes, oxygenated VOC, and methyl butenol. Because the simulations in this study are done at fine resolutions, a few meters in the vertical, the tem-perature and PAR fields are well resolved spatially thus increas-ing the accuracy and specificity of emission-inventories input to photochemical models.
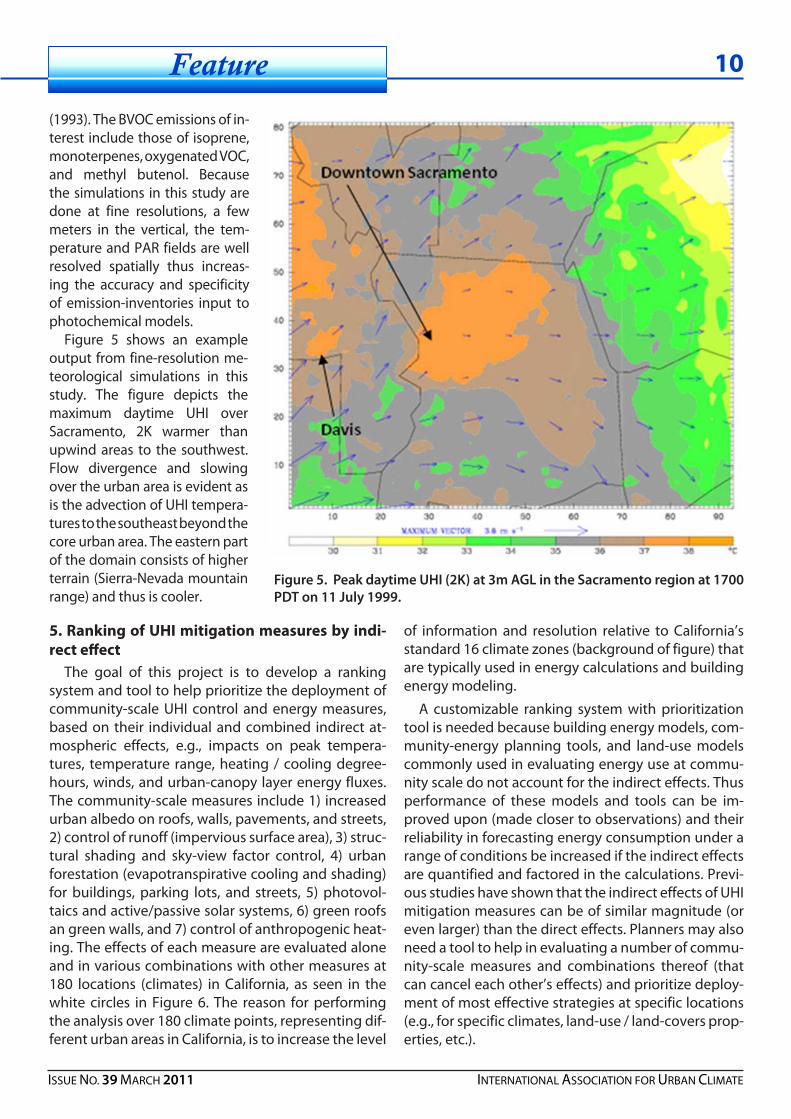
Figure 5 shows an example output from fine-resolution me-teorological simulations in this study. The figure depicts the maximum daytime UHI over Sacramento, 2K warmer than upwind areas to the southwest. Flow divergence and slowing over the urban area is evident as is the advection of UHI tempera-tures to the southeast beyond the core urban area. The eastern part of the domain consists of higher terrain (Sierra-Nevada mountain range) and thus is cooler.
5. Ranking of UHI mitigation measures by indi-rect effect
The goal of this project is to develop a ranking system and tool to help prioritize the deployment of community-scale UHI control and energy measures, based on their individual and combined indirect at-mospheric effects, e.g., impacts on peak tempera-tures, temperature range, heating / cooling degree-hours, winds, and urban-canopy layer energy fluxes. The community-scale measures include 1) increased urban albedo on roofs, walls, pavements, and streets, 2) control of runoff (impervious surface area), 3) struc-tural shading and sky-view factor control, 4) urban forestation (evapotranspirative cooling and shading) for buildings, parking lots, and streets, 5) photovol-taics and active/passive solar systems, 6) green roofs an green walls, and 7) control of anthropogenic heat-ing. The effects of each measure are evaluated alone and in various combinations with other measures at 180 locations (climates) in California, as seen in the white circles in Figure 6. The reason for performing the analysis over 180 climate points, representing dif-ferent urban areas in California, is to increase the level
of information and resolution relative to California’s standard 16 climate zones (background of figure) that are typically used in energy calculations and building energy modeling.
A customizable ranking system with prioritization tool is needed because building energy models, com-munity-energy planning tools, and land-use models commonly used in evaluating energy use at commu-nity scale do not account for the indirect effects. Thus performance of these models and tools can be im-proved upon (made closer to observations) and their reliability in forecasting energy consumption under a range of conditions be increased if the indirect effects are quantified and factored in the calculations. Previ-ous studies have shown that the indirect effects of UHI mitigation measures can be of similar magnitude (or even larger) than the direct effects. Planners may also need a tool to help in evaluating a number of commu-nity-scale measures and combinations thereof (that can cancel each other’s effects) and prioritize deploy-ment of most effective strategies at specific locations (e.g., for specific climates, land-use / land-covers prop-erties, etc.).
Figure 5. Peak daytime UHI (2K) at 3m AGL in the Sacramento region at 1700 PDT on 11 July 1999.
Feature
(a)
(b)
(c)
11
ISSUE NO. 39 MARCH 2011 INTERNATIONAL ASSOCIATION FOR URBAN CLIMATE
As in the studies discussed earlier, this project’s tasks also include performing detailed characterizations of urban surfaces, land-use, climate (for each zone/city), detailed calculations of deployment potentials for each measure and each region (gridded domains), nu-merical modeling (using the models discussed above), and developing the ranking system. Calculation of de-ployment potentials for each UHI mitigation measure listed above is based on surface and land-use charac-terizations. For example, the deployment potential for high-albedo materials for each 200-m computational grid cell (∆α200m) in the modeling domain is calculated as follows:
∆α200m = froof × frflat × ∆αrflat + froof × frpitch × ∆αrpitch + fstreet × fsasph × ∆αsasph + fstreet × fsconc × ∆αsconc + fpaved × fpasph × ∆αpasph + fpaved × fpconc × ∆αpconc + w2p × fwwood×∆αwwood + w2p × fwmason × ∆αwmason + w2p × fwconc × ∆αwconc + w2p × fwcurt × ∆αwcurt
based on the characterizations (in each 200-m cell) of roof, street, and pavement areas (froof, fstreet, fpaved), flat-roof and pitched-roof fractions (frflat, frpitch), asphalt- and cement-street fractions (fsasph, fsconc), asphalt- and cement-pavement fractions (fpasph, fpconc), levels of in-crease in flat-and pitched-roof albedo (∆αrflat, (∆αrpitch), asphalt- and cement-street albedo (∆αsasph, (∆αsconc), and asphalt- and cement-pavements albedo (∆αpasph,
Figure 6. The project’s 180 climate zones / idealized communities (white circles), superimposed on Califor-nia’s 16 climates zones in the background. Figure back-ground credit: CEC.
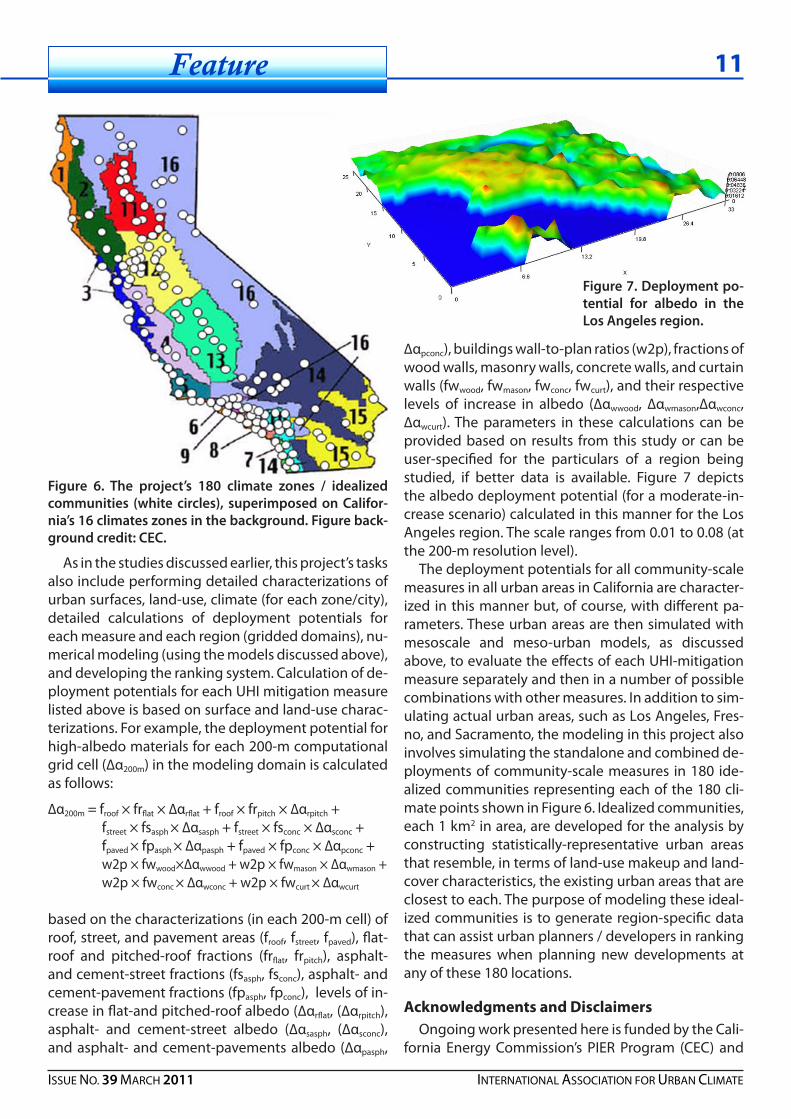
∆αpconc), buildings wall-to-plan ratios (w2p), fractions of wood walls, masonry walls, concrete walls, and curtain walls (fwwood, fwmason, fwconc, fwcurt), and their respective levels of increase in albedo (∆αwwood, ∆αwmason,∆αwconc, ∆αwcurt). The parameters in these calculations can be provided based on results from this study or can be user-specified for the particulars of a region being studied, if better data is available. Figure 7 depicts the albedo deployment potential (for a moderate-in-crease scenario) calculated in this manner for the Los Angeles region. The scale ranges from 0.01 to 0.08 (at the 200-m resolution level).
The deployment potentials for all community-scale measures in all urban areas in California are character-ized in this manner but, of course, with different pa-rameters. These urban areas are then simulated with mesoscale and meso-urban models, as discussed above, to evaluate the effects of each UHI-mitigation measure separately and then in a number of possible combinations with other measures. In addition to sim-ulating actual urban areas, such as Los Angeles, Fres-no, and Sacramento, the modeling in this project also involves simulating the standalone and combined de-ployments of community-scale measures in 180 ide-alized communities representing each of the 180 cli-mate points shown in Figure 6. Idealized communities, each 1 km2 in area, are developed for the analysis by constructing statistically-representative urban areas that resemble, in terms of land-use makeup and land-cover characteristics, the existing urban areas that are closest to each. The purpose of modeling these ideal-ized communities is to generate region-specific data that can assist urban planners / developers in ranking the measures when planning new developments at any of these 180 locations.
Acknowledgments and DisclaimersOngoing work presented here is funded by the Cali-
fornia Energy Commission’s PIER Program (CEC) and
Figure 7. Deployment po-tential for albedo in the Los Angeles region.

Feature 12
ISSUE NO. 39 MARCH 2011 INTERNATIONAL ASSOCIATION FOR URBAN CLIMATE
the Sacramento Metropolitan Air Quality Manage-ment District (SMAQMD). The findings and opinions expressed in this article are solely those of the author and do not necessarily reflect the views of the CEC or the SMAQMD nor their employees and contractors, nor shall they assume any responsibility for use of the data and findings presented. Drs. James Wilkinson (Al-pine Geophysics, LLC) and Robert Bornstein (San Jose State University) are acknowledged for their collabo-rations in the SMAQMD control-measure modeling project.
ReferencesChaves, A. and Bahill, A.T., 2010. “Locating sites for photovol-
taic solar panels”. ArcUser, ESRI, Redlands, California, pp.24-27 (Fall 2010)
Ching, J., Brown, M., Burian, S., Chen, F., Cionco, R., Hanna, A., Hultgren, T., McPherson, T., Sailor, D., Taha, H., and Williams, D., 2009. “National urban database and access portal tool, NU-DAPT“. Bulletin of the American Meteorological Society (BAMS) doi:10.1175/2009BAMS2675.1
Cox, W. and Chu, S., 1996. “Assessment of interannual ozone variation in urban areas from a climatological perspective”. At-mospheric Environment, 30, 2615-2625
Davis, J.M., Eder, B.K., Bloomfield, P., 1998. “Regional and temporal models for ozone along the Gulf Coast”. In: Nychka, D., Piegorsch, W.W., Cox, L.H. (eds.), Case Studies in Environmen-tal Statistics, Lecture Notes in Statistics, Vol. 132, Springer, New York, pp. 27-50
Dudhia J., 1993. “A non-hydrostatic version of the Penn State/NCAR mesoscale model: Validation tests and simulation of an Atlantic cyclone and cold front”. Monthly Weather Review 121, 1493-1513
Dupont S., Otte T., Ching J., 2004. “Simulation of meteoro-logical fields within and above urban and rural canopies with a mesoscale model (MM5)”. Boundary-Layer Meteorology 113, 111-158.
Guenther, A. and Wiedinmyer, C., 2004. “User’s guide to the Model of Emissions of Gases and Aerosols from Nature (ME-GAN).“ http://acd.ucar.edu/~christin/megan1.0_userguide.pdf
Guenther, A. B., P. R. Zimmerman, P. C. Harley, R. K. Monson and R. Fall., 1993. “Isoprene and monoterpene emission rate variability – model evaluations and sensitivity analyses”. Jour-nal of Geophysical Research, 98(D7): 12609-12617
McPherson, E. G., 1998. “Structure and sustainability of Sacra-mento’s urban forest”. Journal of Arboriculture, 24 (4): 174-190
Martilli A., Clappier A., Rotach M., 2002. “An urban surface exchange parameterization for mesoscale models”. Boundary-Layer Meteorology 104, 261-304
Pryor, S.C., McKendry, I.G., and Steyn, D.G., 1995. “Synoptic-scale meteorological variability and surface ozone concentra-tions in Vancouver, British Columbia”. Journal of Applied Meteo-rology, 34, 1824-1833
Rosenfeld, A., Akbari, H., Bretz, S., Fishman, B., Kurn, D., Sailor, D., Taha, H., 1995. “Mitigation of Urban Heat Islands: Materials,
Utility programs, Updates“, Energy and Buildings, 22, 255-265Taha, H. and Sailor, D., 2010. “Evaluating the effects of ra-
diative forcing feedback in modeling urban ozone air quality in Portland, Oregon: Two-way coupled MM5 - CMAQ simula-tions“. Boundary-Layer Meteorology, 137,. 291-305. doi:10.1007/s10546-010-9533-9
Taha, H., 2008a. “Meso-urban meteorological and photo-chemical modeling of heat island mitigation“. Atmospheric Envi-ronment, 42, 8795-8809. doi:10.1016/j.atmosenv.2008.06.036
Taha, H., 2008b. “Episodic performance and sensitivity of the urbanized MM5 (uMM5) to perturbations in surface prop-erties in Houston TX“. Boundary-Layer Meteorology, 127, 193-218. doi:10.1007/s10546-007-9258-6
Taha, H., 2008c. “Urban surface modification as a potential ozone air-quality improvement strategy in California: A meso-scale modeling study“. Boundary-Layer Meteorology, 127, 219-239. doi:10.1007/s10546-007-9259-5
Taha, H., 2001 “Potential impacts of climate change on tro-pospheric ozone in California: A preliminary modeling assess-ment of the Los Angeles Basin and the Sacramento Valley”. Lawrence Berkeley National Laboratory Report NO. 46695, Berkeley, California.
Taha, H., 2007. “Urban surface modification as a potential ozone air-quality improvement strategy in California -- Phase 2: Fine-resolution meteorological and photochemical model-ing of urban heat islands“, Final report prepared by Altostratus Inc. for the California Energy Commission, Sacramento, Califor-nia, PIER Environmental Research
Taha, H., 2005. “Urban surface modification as a potential ozone air-quality improvement strategy in California -- Phase 1: Initial Mesoscale Modeling“, Final report prepared by Alto-stratus Inc. for the California Energy Commission, Sacramento, California, PIER Environmental Research
Taha, H., Konopacki, S., and Gabersek, S., 1999. “Impacts of large-scale surface modifications on meteorological condi-tions and energy use: A 10-region modeling study“, Theoretical and Applied Climatology, 62, 175-185
Taha, H., 1997. “Modeling the Impacts of Large-Scale Albe-do Changes on Ozone Air Quality in the South Coast Air Basin“, Atmospheric Environment, 31, 1667-1676
Taha, H., 1996. “Modeling the Impacts of Increased Urban Vegetation on the Ozone Air Quality in the South Coast Air Ba-sin“, Atmospheric Environment, 30, 3423-3430
Taha, H., Konopacki, S., and Akbari, H., 1998. “Impacts of low-ered urban air temperatures on precursor emission and ozone air quality”. Journal of the Air & Waste Management Association, 48, 860-865
Taha, H., Kalkstein, L., Sheridan, S., and Wong, E., 2004. “The potential of urban environmental control in alleviating heat-wave health effects in five U.S. regions“. 16th Symposium on Biometeorology and Aerobiology, American Meteorological Society, Vancouver BC, August 2004
Thompson, M.L., Reynolds, J., Cox, L.H., Guttorp, P., and Sampson, P.D., 2000. “A review of statistical methods for the meteorological adjustment of tropospheric ozone”. Atmo-spheric Environment, 35, 617-630

Urban Projects 13
ISSUE NO. 39 MARCH 2011 INTERNATIONAL ASSOCIATION FOR URBAN CLIMATE
Heat wave in Moscow city in summer of 2010: Results of meteorological measurements and possible explanations
In the summer of 2010, anomalous hot weather took place in the Central part of European Russia – in Mos-cow city and in some other regions around the Rus-sian capital. As was shown by Professor B.A. Revich, an additional mortality in the area of European Russia − where a temperature anomaly of +5 ºC or more was observed during this heat wave − consisted of 58,000 people (including nearly of 11,000 inhabitants of Mos-cow city) in comparison with the same summer time in the previous year (2009). Thus, the mortality evidently connected with hot weather in European Russia seems to be even higher than in Western Europe in 2003.
The reason for this catastrophic event was an ex-tremely steady, high (up to 100 hPa isobaric level) and long-lived blocking anticyclone with a center above the East of European Russia from the second half of June until the middle of August. As a result, an extremely hot tropical air mass from Africa or from Central Asia was invading into central Russia by steady southern and southeastern winds during a long time period.
On July the 29th, as seen in Figure 1, the maximal air temperature Tmax in Moscow consisted of 38.1 ºC (at Moscow University), whereas the previous maximum-maximorum value of T for Moscow city, in 1920, was equal to only 36.8 ºC. It should be noted that just in the center of Moscow city at Balchug station (near the Kremlin), the maximal air temperature on the same day was equal to 39.0 ºC – probably due to the addi-tional local effect of the urban ‘heat island’. The reason for this conclusion is the high density of buildings in the center of Moscow city. In contrast, there are a lot of green park zones on the southwestern periphery where the University is situated. That is why the value of Tmax at the University as well as at three other sta-tions around the center was a bit less – from 0.4 to 1.0 ºC (Fig.1). Thus the structure of the urban ‘heat island’ sometimes may be seen not only in the pattern of av-erage or minimal air temperatures, but in the pattern of daily maximal temperatures as well. It should also be noted that the air temperature in Moscow for the first time exceeded 100 ºF, and the body temperature of a healthy person.
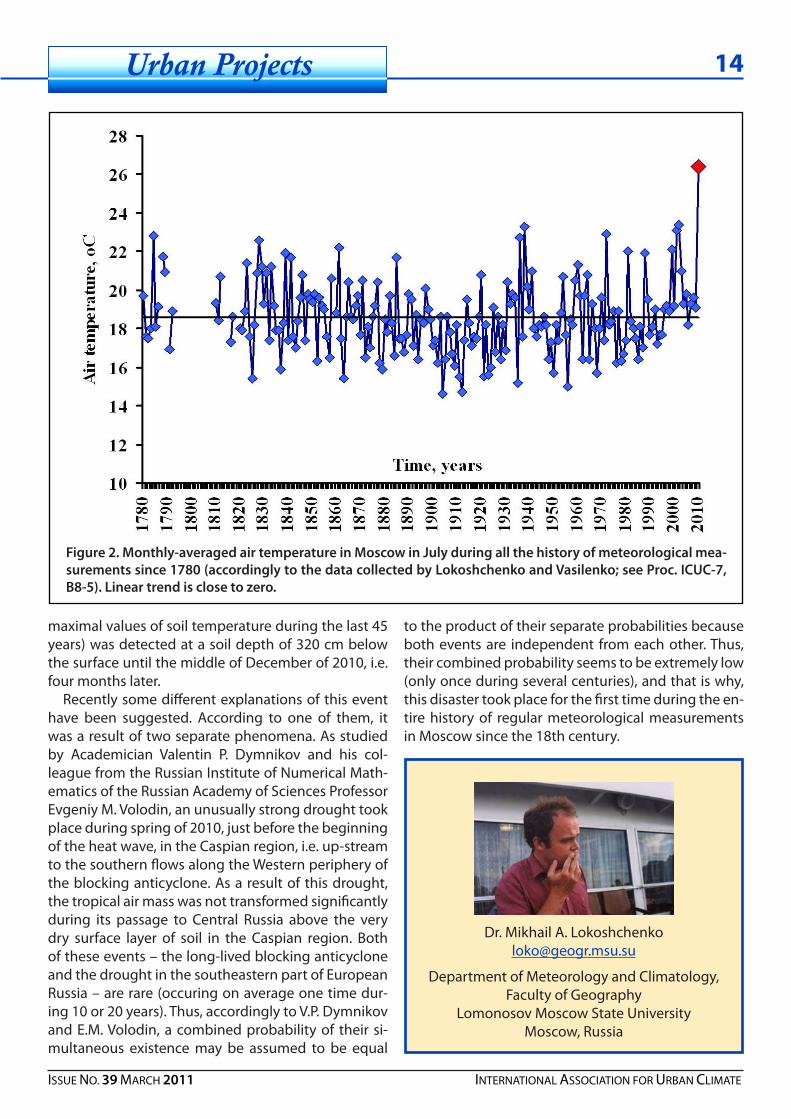
The monthly-averaged air temperature in July of 2010 in Moscow consisted of 26.4 ºC (red rhombus in Figure 2), which is the highest value during last 230 years (since 1780). This value is 3 ºC more than the previous maximal monthly-averaged value for July. The monthly-averaged air temperature for August of 2010 (22.2 ºC) became the highest value as well during
the whole history of meteorological measurements in Moscow for August. The daily maximal air temperature exceeded 23 times (during 4 separate days in June, 10 days in July and 9 days in August) the maximal values for these days since 1879. For the first time, the daily average air temperature (31.4 ºC) was seen as more than 30 ºC. The surface temperature in Moscow (62.3 ºC) for the first time exceeded 60 ºC.
The minimal relative humidity was equal to 16%; the maximal humidity deficit for the first exceeded 50 hPa (56 hPa). As a result, the amount of precipitation was extremely low – only 7.4 mm during July. Such a low monthly value of precipitation was never before observed in July according to all known data since the 19th century (the average precipitation in July in Moscow is 91 mm). As a result, a lot of forest fires broke out in the Moscow region and a strong haze ex-isted above Russian capital during a long period. The thermal wave connected with the disastrous heat (i.e.
Figure 1. The daily maximal air temperatures during July 29th, 2010 – the warmest day in Moscow city dur-ing the last 130 years. Double lines are margins of the city; asterisks are meteorological stations.
Urban Projects 1�
ISSUE NO. 39 MARCH 2011 INTERNATIONAL ASSOCIATION FOR URBAN CLIMATE
maximal values of soil temperature during the last 45 years) was detected at a soil depth of 320 cm below the surface until the middle of December of 2010, i.e. four months later.
Recently some different explanations of this event have been suggested. According to one of them, it was a result of two separate phenomena. As studied by Academician Valentin P. Dymnikov and his col-league from the Russian Institute of Numerical Math-ematics of the Russian Academy of Sciences Professor Evgeniy M. Volodin, an unusually strong drought took place during spring of 2010, just before the beginning of the heat wave, in the Caspian region, i.e. up-stream to the southern flows along the Western periphery of the blocking anticyclone. As a result of this drought, the tropical air mass was not transformed significantly during its passage to Central Russia above the very dry surface layer of soil in the Caspian region. Both of these events – the long-lived blocking anticyclone and the drought in the southeastern part of European Russia – are rare (occuring on average one time dur-ing 10 or 20 years). Thus, accordingly to V.P. Dymnikov and E.M. Volodin, a combined probability of their si-multaneous existence may be assumed to be equal
to the product of their separate probabilities because both events are independent from each other. Thus, their combined probability seems to be extremely low (only once during several centuries), and that is why, this disaster took place for the first time during the en-tire history of regular meteorological measurements in Moscow since the 18th century.
Figure 2. Monthly-averaged air temperature in Moscow in July during all the history of meteorological mea-surements since 1780 (accordingly to the data collected by Lokoshchenko and Vasilenko; see Proc. ICUC-7, B8-5). Linear trend is close to zero.
Dr. Mikhail A. [email protected]
Department of Meteorology and Climatology, Faculty of Geography
Lomonosov Moscow State UniversityMoscow, Russia
Urban Projects
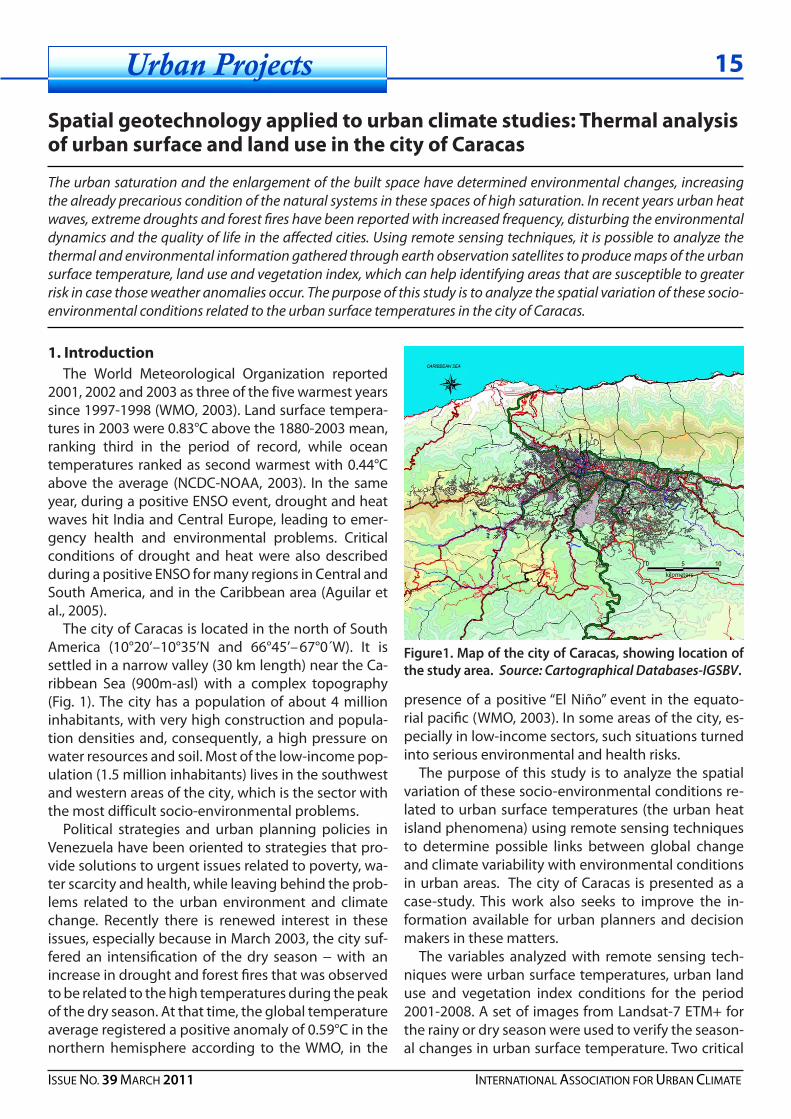
Figure1. Map of the city of Caracas, showing location of the study area. Source: Cartographical Databases-IGSBV.
15
ISSUE NO. 39 MARCH 2011 INTERNATIONAL ASSOCIATION FOR URBAN CLIMATE
Spatial geotechnology applied to urban climate studies: Thermal analysis of urban surface and land use in the city of Caracas
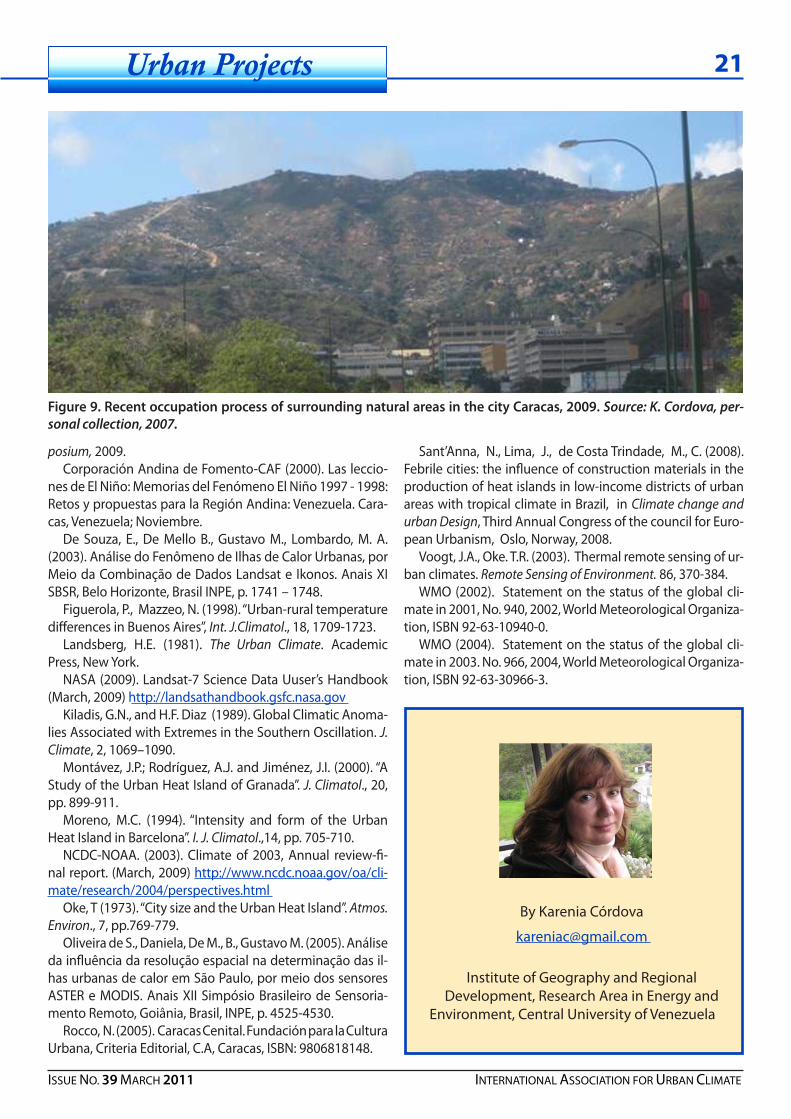
The urban saturation and the enlargement of the built space have determined environmental changes, increasing the already precarious condition of the natural systems in these spaces of high saturation. In recent years urban heat waves, extreme droughts and forest fires have been reported with increased frequency, disturbing the environmental dynamics and the quality of life in the affected cities. Using remote sensing techniques, it is possible to analyze the thermal and environmental information gathered through earth observation satellites to produce maps of the urban surface temperature, land use and vegetation index, which can help identifying areas that are susceptible to greater risk in case those weather anomalies occur. The purpose of this study is to analyze the spatial variation of these socio-environmental conditions related to the urban surface temperatures in the city of Caracas.
1. Introduction The World Meteorological Organization reported
2001, 2002 and 2003 as three of the five warmest years since 1997-1998 (WMO, 2003). Land surface tempera-tures in 2003 were 0.83°C above the 1880-2003 mean, ranking third in the period of record, while ocean temperatures ranked as second warmest with 0.44°C above the average (NCDC-NOAA, 2003). In the same year, during a positive ENSO event, drought and heat waves hit India and Central Europe, leading to emer-gency health and environmental problems. Critical conditions of drought and heat were also described during a positive ENSO for many regions in Central and South America, and in the Caribbean area (Aguilar et al., 2005).
The city of Caracas is located in the north of South America (10°20’–10°35’N and 66°45’–67°0´W). It is settled in a narrow valley (30 km length) near the Ca-ribbean Sea (900m-asl) with a complex topography (Fig. 1). The city has a population of about 4 million inhabitants, with very high construction and popula-tion densities and, consequently, a high pressure on water resources and soil. Most of the low-income pop-ulation (1.5 million inhabitants) lives in the southwest and western areas of the city, which is the sector with the most difficult socio-environmental problems.
Political strategies and urban planning policies in Venezuela have been oriented to strategies that pro-vide solutions to urgent issues related to poverty, wa-ter scarcity and health, while leaving behind the prob-lems related to the urban environment and climate change. Recently there is renewed interest in these issues, especially because in March 2003, the city suf-fered an intensification of the dry season − with an increase in drought and forest fires that was observed to be related to the high temperatures during the peak of the dry season. At that time, the global temperature average registered a positive anomaly of 0.59°C in the northern hemisphere according to the WMO, in the
presence of a positive “El Niño” event in the equato-rial pacific (WMO, 2003). In some areas of the city, es-pecially in low-income sectors, such situations turned into serious environmental and health risks.
The purpose of this study is to analyze the spatial variation of these socio-environmental conditions re-lated to urban surface temperatures (the urban heat island phenomena) using remote sensing techniques to determine possible links between global change and climate variability with environmental conditions in urban areas. The city of Caracas is presented as a case-study. This work also seeks to improve the in-formation available for urban planners and decision makers in these matters.
The variables analyzed with remote sensing tech-niques were urban surface temperatures, urban land use and vegetation index conditions for the period 2001-2008. A set of images from Landsat-7 ETM+ for the rainy or dry season were used to verify the season-al changes in urban surface temperature. Two critical

Urban Projects
Figure 2. Superface temperature patterns for the city of Caracas, March 2001. Source: USGS Landsat 7 collection, Car-tographic data bases - IGSBV.
16
ISSUE NO. 39 MARCH 2011 INTERNATIONAL ASSOCIATION FOR URBAN CLIMATE
years were selected for this study: 2001 with a global anomaly in surface temperature reported around 0.42 °C, and 2003 with a global increase in temperature around 0.46°C (WMO 2001; 2003).
2. Methodology A set of images from Landsat-7 ETM+ were selected
considering the pixel resolution in the thermal band (60 meters) for medium size cities, i.e. Caracas (30 km length). Other satellites like MODIS, ASTER (90mts), and AVHRR (1 km) have thermal bands but with a low reso-lution. Cloud coverage, seasonal period (dry or rainy season) and information gaps were other selection cri-teria. The period of analysis was 2001-2008, considering that during this decade climate anomalies had been frequently reported, and in some cases, with serious impact on urban communities. This analysis, however, focuses on the two critical years of 2001 and 2003.
Thermal analysis, land use and vegetation index (NDVI), were carried out using image analysis (image algebra) techniques, and image classification tech-niques with ERDAS 9.1 and Arc-Gis 9.2 , ArcView 3.2 licensed programs available at the Central University of Venezuela. Seasonal analyses were also developed when possible, according to the image available, in order to understand the dynamics of the urban heat island (UHI) phenomena. Urban surface temperature was calculated by converting thermal band (high gain
mode) radiant temperature in K (Kelvin) to brightness temperature in °C (Celsius). Radiometric correction was done by converting the digital number values in the Landsat thermal bands to radiance values, and then changing them into an effective temperature values (as detailed in Córdova, 2009).
Vector layers of roads and street directions in the city were integrated with the raster models of surface temperatures and NDVI index into GIS, allowing us to identify and locate the areas with thermal anomalies or under major risk of forest fire occurrence, for urban and environmental planning purposes. Raster models and vector layers were reprojected with ERDAS 9.1 and ArcGis 9.2 from UTM/WGS84 to Lat/Long WGS84.
NDVI analysis (complementary to the thermal sur-face analysis) was carried out due to the high inci-dence of forest fires in the critical years selected. Land use was analyzed by sectors, comparing the thermal response between the west and southwest areas of the city, which show high urban density and where the majority of the low- income sectors are located, and the east and southeast areas, with lower urban density and greater natural vegetation areas.
3. Results and discussionUrban surface temperature patterns show signifi-
cant differences between the east and southeast sec-tors characterized by lower urban density and greater

Urban Projects
Figure 3. Aerial views of “Barrios” (low-income sec-tors) in Caracas.
Source: Caracas Cenital aerial views (2005).
Figure 4. Views of southeast Caracas. Source: K. Cor-dova, personal collection, 2007.
1�
ISSUE NO. 39 MARCH 2011 INTERNATIONAL ASSOCIATION FOR URBAN CLIMATE
vegetation areas, and the low-income and crowded sectors, located in the west and southwest areas of the city. Temperatures between 28°C and 34°C were observed in most of these low-income sectors in the southwest and west areas (Fig. 2). These areas are char-acterized by informal construction, using brick, wood panels, and metallic roofs (zinc, galvanized, aluminum), with improvised infrastructure services for electricity, potable water and sewage (Fig. 3). The effect of large urban surfaces covered by such metal roof construc-tion has been described in Brazilian cities as “febrile cities.” High surface temperatures have been reported for galvanized metal (57.9°C) and aluminum (69.4 °C), commonly used as roof materials in the houses of the low income areas (Sant’ Anna et al., 2008).
In contrast, comfortable temperatures between 24°C and 27°C degrees were observed in most of the east and southeast sectors (Fig. 4), with only a few critical areas between 28°C and 31°C related to areas where the soils are exposed due to the urbanization process. Residential areas, close to the El Ávila Nation-al Park in the north and central-north part of the city, also show temperatures between 24°C and 27°C (Fig. 2). This sector benefits from the proximity to El Ávila National Park, which provides moisture and fresh air to the northern area of the valley. La Carlota airport (central-east), an open space covered by asphalt with little vegetation, is one of the hottest places in the city. Wide avenues, highways, and burned areas also show high values of surface temperature (28-34°C or more).
Data recorded in the thermal band of the sensor (Landsat-7 ETM+) is collected at 10:15 in the morning (the revisit time of the remote sensor). Climatologi-cal information registered for the city of Caracas has shown a maximum soil temperature (in the first 2 cm of depth) of 63°C degrees at noon in March (Table 1). Surface temperatures observed with the remote sen-sor can therefore register an increase depending on the physical properties of the surface during the day.
Temperatures recorded in climatological stations for the city of Caracas also show a relationship between
Table 1. Maximum temperatures of air and soil (top 2 cm) in Caracas, 1973-2003. Source: UCV Climatological Sta-tion, Central University of Venezuela.
Jan Feb Mar Apr May Jun Jul Aug Sep Oct Nov Dec
Max. Abs. Air Temp. (°C)
32.0 33.7 35.2 34.0 32.8 32.5 30.2 33.2 33.0 32.5 31.7 30.5
Max. Abs. Soil Temp. (°C)
42 60 63 59 56 45 46.5 46.5 46 45 40 41.8
Urban Projects
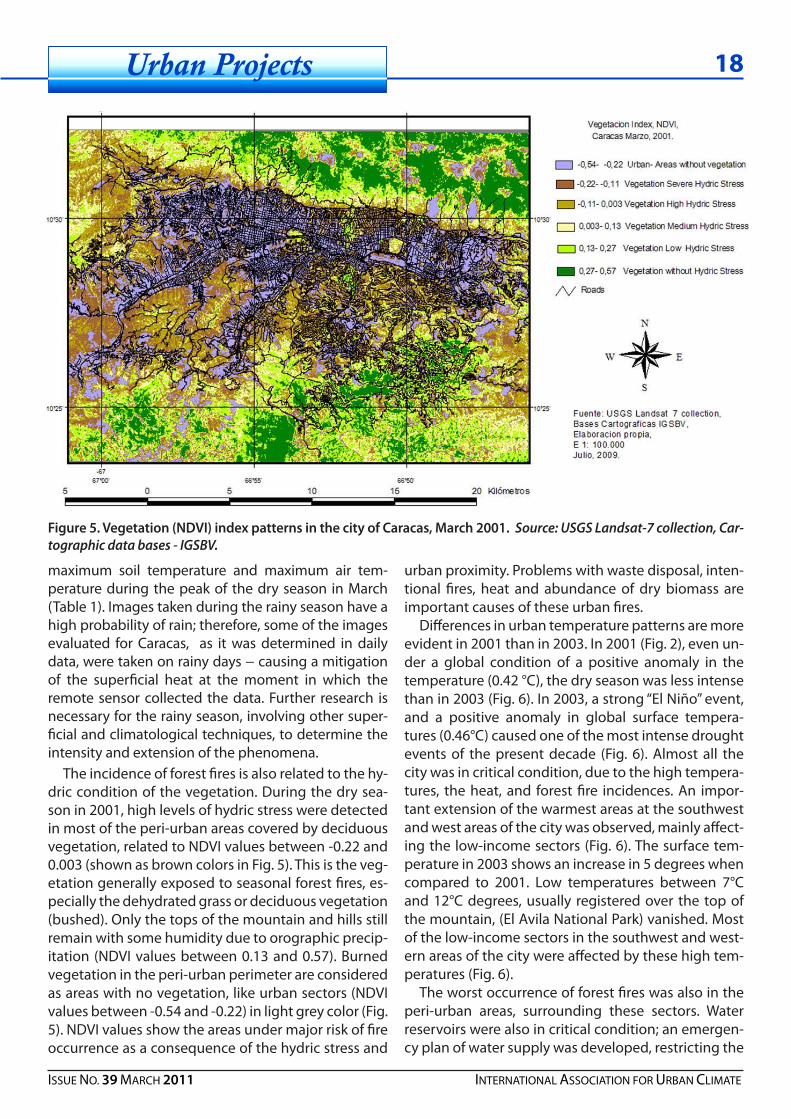
Figure 5. Vegetation (NDVI) index patterns in the city of Caracas, March 2001. Source: USGS Landsat-7 collection, Car-tographic data bases - IGSBV.
18
ISSUE NO. 39 MARCH 2011 INTERNATIONAL ASSOCIATION FOR URBAN CLIMATE
maximum soil temperature and maximum air tem-perature during the peak of the dry season in March (Table 1). Images taken during the rainy season have a high probability of rain; therefore, some of the images evaluated for Caracas, as it was determined in daily data, were taken on rainy days − causing a mitigation of the superficial heat at the moment in which the remote sensor collected the data. Further research is necessary for the rainy season, involving other super-ficial and climatological techniques, to determine the intensity and extension of the phenomena.
The incidence of forest fires is also related to the hy-dric condition of the vegetation. During the dry sea-son in 2001, high levels of hydric stress were detected in most of the peri-urban areas covered by deciduous vegetation, related to NDVI values between -0.22 and 0.003 (shown as brown colors in Fig. 5). This is the veg-etation generally exposed to seasonal forest fires, es-pecially the dehydrated grass or deciduous vegetation (bushed). Only the tops of the mountain and hills still remain with some humidity due to orographic precip-itation (NDVI values between 0.13 and 0.57). Burned vegetation in the peri-urban perimeter are considered as areas with no vegetation, like urban sectors (NDVI values between -0.54 and -0.22) in light grey color (Fig. 5). NDVI values show the areas under major risk of fire occurrence as a consequence of the hydric stress and
urban proximity. Problems with waste disposal, inten-tional fires, heat and abundance of dry biomass are important causes of these urban fires.
Differences in urban temperature patterns are more evident in 2001 than in 2003. In 2001 (Fig. 2), even un-der a global condition of a positive anomaly in the temperature (0.42 °C), the dry season was less intense than in 2003 (Fig. 6). In 2003, a strong “El Niño” event, and a positive anomaly in global surface tempera-tures (0.46°C) caused one of the most intense drought events of the present decade (Fig. 6). Almost all the city was in critical condition, due to the high tempera-tures, the heat, and forest fire incidences. An impor-tant extension of the warmest areas at the southwest and west areas of the city was observed, mainly affect-ing the low-income sectors (Fig. 6). The surface tem-perature in 2003 shows an increase in 5 degrees when compared to 2001. Low temperatures between 7°C and 12°C degrees, usually registered over the top of the mountain, (El Avila National Park) vanished. Most of the low-income sectors in the southwest and west-ern areas of the city were affected by these high tem-peratures (Fig. 6).
The worst occurrence of forest fires was also in the peri-urban areas, surrounding these sectors. Water reservoirs were also in critical condition; an emergen-cy plan of water supply was developed, restricting the

Urban Projects
Figure 6. Superface temperature patterns for the city of Caracas, March 2003. Source: USGS Landsat 7 collection, Car-tographic data bases - IGSBV.
1�
ISSUE NO. 39 MARCH 2011 INTERNATIONAL ASSOCIATION FOR URBAN CLIMATE
water supply service by sectors to one day per week. Levels in Camatagua dam, one of the most important water reservoirs for the city of Caracas, experienced a continuous fall since 2001 (Fig. 7).
The vegetation conditions during the dry season in 2003 were critical, due to an extension of the ar-
Figure 7. Camatagua Reservoir levels, 1986-2003. Source: http://www.hidrocapital.com.ve/
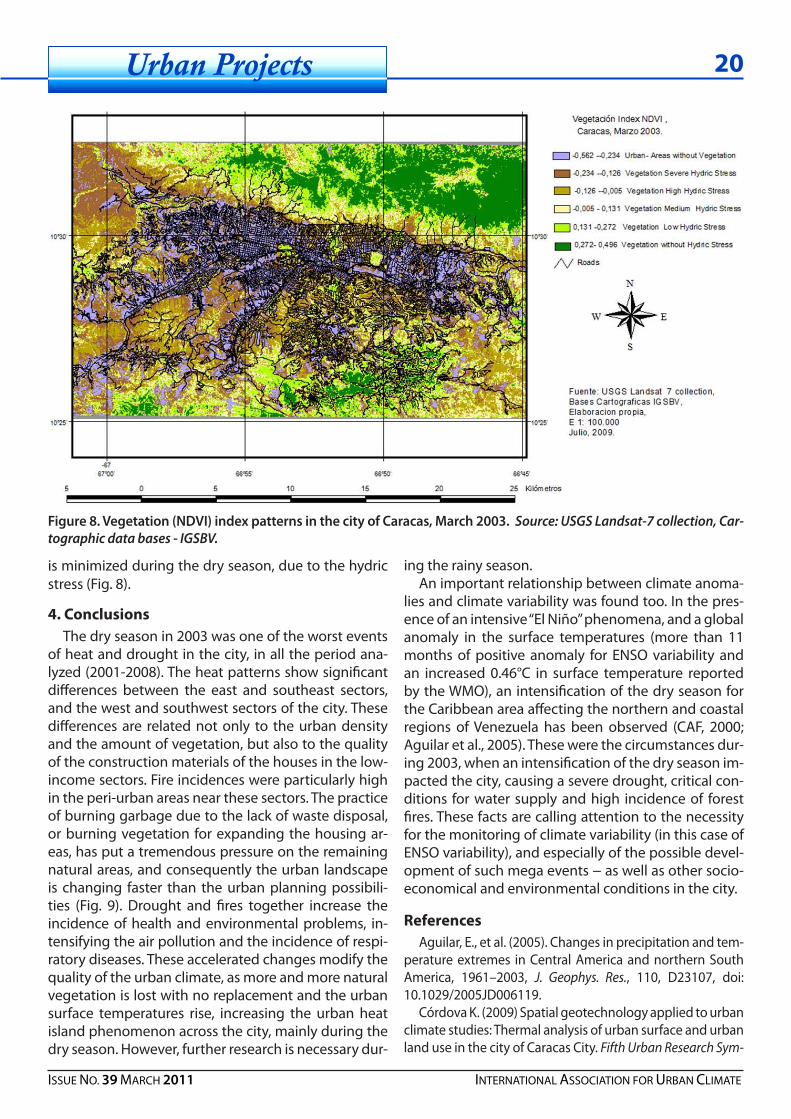
eas under high hydric stress that was observed in the southwest and west sectors of the city, as well as the incidence of forest fires in these sectors. NDVI values were below 0.5, even at the top of the mountains and hills where there is usually more humidity. The role of vegetation in the mitigation of high temperatures
Urban Projects
Figure 8. Vegetation (NDVI) index patterns in the city of Caracas, March 2003. Source: USGS Landsat-7 collection, Car-tographic data bases - IGSBV.
20
ISSUE NO. 39 MARCH 2011 INTERNATIONAL ASSOCIATION FOR URBAN CLIMATE
is minimized during the dry season, due to the hydric stress (Fig. 8).
�. ConclusionsThe dry season in 2003 was one of the worst events
of heat and drought in the city, in all the period ana-lyzed (2001-2008). The heat patterns show significant differences between the east and southeast sectors, and the west and southwest sectors of the city. These differences are related not only to the urban density and the amount of vegetation, but also to the quality of the construction materials of the houses in the low- income sectors. Fire incidences were particularly high in the peri-urban areas near these sectors. The practice of burning garbage due to the lack of waste disposal, or burning vegetation for expanding the housing ar-eas, has put a tremendous pressure on the remaining natural areas, and consequently the urban landscape is changing faster than the urban planning possibili-ties (Fig. 9). Drought and fires together increase the incidence of health and environmental problems, in-tensifying the air pollution and the incidence of respi-ratory diseases. These accelerated changes modify the quality of the urban climate, as more and more natural vegetation is lost with no replacement and the urban surface temperatures rise, increasing the urban heat island phenomenon across the city, mainly during the dry season. However, further research is necessary dur-
ing the rainy season.An important relationship between climate anoma-
lies and climate variability was found too. In the pres-ence of an intensive “El Niño” phenomena, and a global anomaly in the surface temperatures (more than 11 months of positive anomaly for ENSO variability and an increased 0.46°C in surface temperature reported by the WMO), an intensification of the dry season for the Caribbean area affecting the northern and coastal regions of Venezuela has been observed (CAF, 2000; Aguilar et al., 2005). These were the circumstances dur-ing 2003, when an intensification of the dry season im-pacted the city, causing a severe drought, critical con-ditions for water supply and high incidence of forest fires. These facts are calling attention to the necessity for the monitoring of climate variability (in this case of ENSO variability), and especially of the possible devel-opment of such mega events − as well as other socio-economical and environmental conditions in the city.
ReferencesAguilar, E., et al. (2005). Changes in precipitation and tem-
perature extremes in Central America and northern South America, 1961–2003, J. Geophys. Res., 110, D23107, doi: 10.1029/2005JD006119.
Córdova K. (2009) Spatial geotechnology applied to urban climate studies: Thermal analysis of urban surface and urban land use in the city of Caracas City. Fifth Urban Research Sym-
Urban Projects 21
ISSUE NO. 39 MARCH 2011 INTERNATIONAL ASSOCIATION FOR URBAN CLIMATE
By Karenia Córdova
Institute of Geography and RegionalDevelopment, Research Area in Energy and
Environment, Central University of Venezuela
posium, 2009.Corporación Andina de Fomento-CAF (2000). Las leccio-
nes de El Niño: Memorias del Fenómeno El Niño 1997 - 1998: Retos y propuestas para la Región Andina: Venezuela. Cara-cas, Venezuela; Noviembre.
De Souza, E., De Mello B., Gustavo M., Lombardo, M. A. (2003). Análise do Fenômeno de Ilhas de Calor Urbanas, por Meio da Combinação de Dados Landsat e Ikonos. Anais XI SBSR, Belo Horizonte, Brasil INPE, p. 1741 – 1748.
Figuerola, P., Mazzeo, N. (1998). “Urban-rural temperature differences in Buenos Aires”, Int. J.Climatol., 18, 1709-1723.
Landsberg, H.E. (1981). The Urban Climate. Academic Press, New York.
NASA (2009). Landsat-7 Science Data Uuser’s Handbook (March, 2009) http://landsathandbook.gsfc.nasa.gov
Kiladis, G.N., and H.F. Diaz (1989). Global Climatic Anoma-lies Associated with Extremes in the Southern Oscillation. J. Climate, 2, 1069–1090.
Montávez, J.P.; Rodríguez, A.J. and Jiménez, J.I. (2000). “A Study of the Urban Heat Island of Granada”. J. Climatol., 20, pp. 899-911.
Moreno, M.C. (1994). “Intensity and form of the Urban Heat Island in Barcelona”. I. J. Climatol.,14, pp. 705-710.
NCDC-NOAA. (2003). Climate of 2003, Annual review-fi-nal report. (March, 2009) http://www.ncdc.noaa.gov/oa/cli-mate/research/2004/perspectives.html
Oke, T (1973). “City size and the Urban Heat Island”. Atmos. Environ., 7, pp.769-779.
Oliveira de S., Daniela, De M., B., Gustavo M. (2005). Análise da influência da resolução espacial na determinação das il-has urbanas de calor em São Paulo, por meio dos sensores ASTER e MODIS. Anais XII Simpósio Brasileiro de Sensoria-mento Remoto, Goiânia, Brasil, INPE, p. 4525-4530.
Rocco, N. (2005). Caracas Cenital. Fundación para la Cultura Urbana, Criteria Editorial, C.A, Caracas, ISBN: 9806818148.
Sant’Anna, N., Lima, J., de Costa Trindade, M., C. (2008). Febrile cities: the influence of construction materials in the production of heat islands in low-income districts of urban areas with tropical climate in Brazil, in Climate change and urban Design, Third Annual Congress of the council for Euro-pean Urbanism, Oslo, Norway, 2008.
Voogt, J.A., Oke. T.R. (2003). Thermal remote sensing of ur-ban climates. Remote Sensing of Environment. 86, 370-384.
WMO (2002). Statement on the status of the global cli-mate in 2001, No. 940, 2002, World Meteorological Organiza-tion, ISBN 92-63-10940-0.
WMO (2004). Statement on the status of the global cli-mate in 2003. No. 966, 2004, World Meteorological Organiza-tion, ISBN 92-63-30966-3.
Figure 9. Recent occupation process of surrounding natural areas in the city Caracas, 2009. Source: K. Cordova, per-sonal collection, 2007.

22
ISSUE NO. 39 MARCH 2011 INTERNATIONAL ASSOCIATION FOR URBAN CLIMATE
Special Report
By Matthias Roth, Rohinton Emmanuel, Toshiaki Ichinose and Jennifer Salmond
(Originally published in the February 2011 issue ofInternational Journal of Climatology)
Special ICUC-� journal issue showcases urban climate research
The world’s population lives in an increasingly urban-ized world. The current generation is the first where more people live in cities than in rural areas (United Nations, 2010). Much of the urban growth is taking place in Asia where the urban transition now underway involves a vol-ume of population much larger than in any other region in the world and is taking place on a scale unprecedented in human history. Demographic projections show that by 2025, 16 of the world’s 29 megacities (cities with more than 10 million people) will be located in Asia, many of which have very basic problems in terms of environmen-tal quality (Asian Development Bank, 2008). Cities have a direct impact on the local climate and also impact and are affected by climate change in many ways and at many scales. The continued growth of urban populations means that most people experience weather and climate that is significantly different from that of undeveloped, natural areas. Cities also affect the regional and global climates through the emission of air pollutants and the consumption of about three-quarters of the world’s energy, releas-ing vast quantities of the greenhouse gases (GHGs) that are thought to warm the planet. Cities further have an im-portant role to play in mitigating cli-mate change but at present, climate action often dismisses effective local (city-scale) actions in favor of interna-tional announcements and prospec-tive efforts (e.g. in terms of cutting GHG emissions).
Our scientific understanding of ur-ban climates has advanced substan-tially over the past two decades including improved con-ceptualization, field observations, analysis of processes and model building. A Special issue of the International Journal of Climatology has been put together to highlight some of the research currently being undertaken in ur-ban climatology. The papers were selected from the wide range of cutting edge research in urban climate present-ed at the Seventh International Conference on Urban Cli-mate (ICUC-7), held in Yokohama, Japan, from 29 June to 3 July 2009. This conference, organized by the International
Association for Urban Climate (IAUC), is part of a series of similar urban climate conferences which first started in Kyoto, Japan, in 1989 and take place about every 3 years. ICUC conferences provide an international forum where the world’s urban climatologists can meet to showcase their research and discuss modern developments in the application of climatic knowledge to the design of bet-ter cities. About 330 people from 36 countries attended ICUC-7. Two hundred and sixteen oral presentations were delivered and 222 posters exhibited, covering a spectrum of urban climate issues ranging from pollutant transport to human thermal perception as part of two streams of parallel sessions on physical processes in urban areas and applied urban climatology, respectively. Extended ab-stracts of the presentations can be found at http://www.ide.titech.ac.jp/~icuc7/extended_abstracts/index-web.html. The 12 papers included in this Special issue illustrate the diversity in research. Three of the papers were pre-
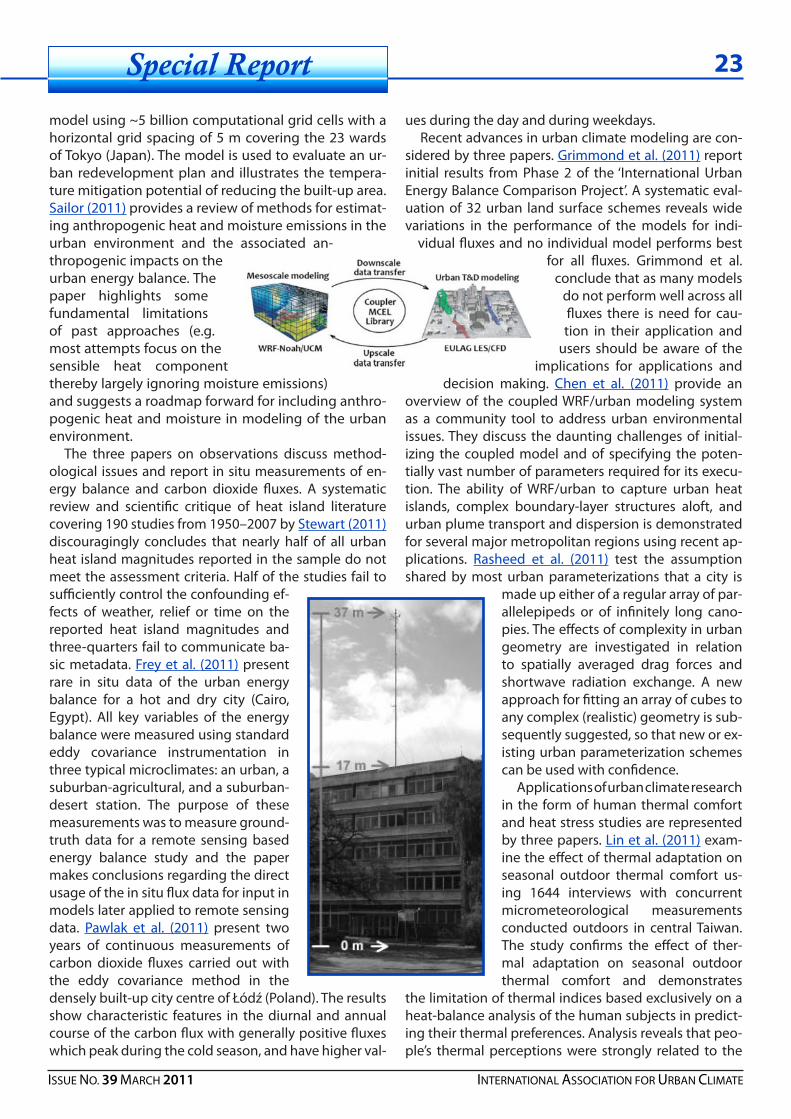
sented as invited plenary lectures by leading researchers (Fujibe, Ashie and Kono, and Sailor). The other nine pa-pers were selected from the oral pre-sentations as examples of contempo-rary urban climate research on urban measurements (Stewart, Frey et al., Pawlak et al.), modeling (Grimmond et al., Chen et al., Rasheed et al.) and ap-plication of urban climate data (Lin et al., Dousset et al., Thorsson et al.).
The first paper in this issue reviews urban warming studies in Japan (Fu-jibe, 2011). Analysis of data from a dense nation-wide monitoring net-
work shows that recorded temperatures increase a few degrees per century. An urban bias is present in recent temperature trends which is not limited to large cities but can also be detected at less urbanized sites. The paper stresses the need for a careful assessment of tempera-ture records used for the evaluation of warming trends and climate change. Ashie and Kono (2011) demonstrate the increasing capability of numerical models to pre-dict small-scale urban processes covering entire cities. Wind and temperature fields are simulated with a CFD
23
ISSUE NO. 39 MARCH 2011 INTERNATIONAL ASSOCIATION FOR URBAN CLIMATE
Special Report
model using ~5 billion computational grid cells with a horizontal grid spacing of 5 m covering the 23 wards of Tokyo (Japan). The model is used to evaluate an ur-ban redevelopment plan and illustrates the tempera-ture mitigation potential of reducing the built-up area. Sailor (2011) provides a review of methods for estimat-ing anthropogenic heat and moisture emissions in the urban environment and the associated an-thropogenic impacts on the urban energy balance. The paper highlights some fundamental limitations of past approaches (e.g. most attempts focus on the sensible heat component thereby largely ignoring moisture emissions) and suggests a roadmap forward for including anthro-pogenic heat and moisture in modeling of the urban environment.
The three papers on observations discuss method-ological issues and report in situ measurements of en-ergy balance and carbon dioxide fluxes. A systematic review and scientific critique of heat island literature covering 190 studies from 1950–2007 by Stewart (2011) discouragingly concludes that nearly half of all urban heat island magnitudes reported in the sample do not meet the assessment criteria. Half of the studies fail to sufficiently control the confounding ef-fects of weather, relief or time on the reported heat island magnitudes and three-quarters fail to communicate ba-sic metadata. Frey et al. (2011) present rare in situ data of the urban energy balance for a hot and dry city (Cairo, Egypt). All key variables of the energy balance were measured using standard eddy covariance instrumentation in three typical microclimates: an urban, a suburban-agricultural, and a suburban-desert station. The purpose of these measurements was to measure ground-truth data for a remote sensing based energy balance study and the paper makes conclusions regarding the direct usage of the in situ flux data for input in models later applied to remote sensing data. Pawlak et al. (2011) present two years of continuous measurements of carbon dioxide fluxes carried out with the eddy covariance method in the densely built-up city centre of Łódź (Poland). The results show characteristic features in the diurnal and annual course of the carbon flux with generally positive fluxes which peak during the cold season, and have higher val-
ues during the day and during weekdays.Recent advances in urban climate modeling are con-
sidered by three papers. Grimmond et al. (2011) report initial results from Phase 2 of the ‘International Urban Energy Balance Comparison Project’. A systematic eval-uation of 32 urban land surface schemes reveals wide variations in the performance of the models for indi-
vidual fluxes and no individual model performs best for all fluxes. Grimmond et al.
conclude that as many models do not perform well across all fluxes there is need for cau-tion in their application and
users should be aware of the implications for applications and
decision making. Chen et al. (2011) provide an overview of the coupled WRF/urban modeling system as a community tool to address urban environmental issues. They discuss the daunting challenges of initial-izing the coupled model and of specifying the poten-tially vast number of parameters required for its execu-tion. The ability of WRF/urban to capture urban heat islands, complex boundary-layer structures aloft, and urban plume transport and dispersion is demonstrated for several major metropolitan regions using recent ap-plications. Rasheed et al. (2011) test the assumption shared by most urban parameterizations that a city is
made up either of a regular array of par-allelepipeds or of infinitely long cano-pies. The effects of complexity in urban geometry are investigated in relation to spatially averaged drag forces and shortwave radiation exchange. A new approach for fitting an array of cubes to any complex (realistic) geometry is sub-sequently suggested, so that new or ex-isting urban parameterization schemes can be used with confidence.
Applications of urban climate research in the form of human thermal comfort and heat stress studies are represented by three papers. Lin et al. (2011) exam-ine the effect of thermal adaptation on seasonal outdoor thermal comfort us-ing 1644 interviews with concurrent micrometeorological measurements conducted outdoors in central Taiwan. The study confirms the effect of ther-mal adaptation on seasonal outdoor thermal comfort and demonstrates
the limitation of thermal indices based exclusively on a heat-balance analysis of the human subjects in predict-ing their thermal preferences. Analysis reveals that peo-ple’s thermal perceptions were strongly related to the

2�
ISSUE NO. 39 MARCH 2011 INTERNATIONAL ASSOCIATION FOR URBAN CLIMATE
Special Report
air temperature and mean radiant temperature, but not significantly to wind speed and humidity. Dousset et al. (2011) present a study which documents the satellite monitoring of the August 2003 nine-day heat wave over the Paris metropolitan area. The thermal images show contrasting nighttime and daytime heat island patterns which are related to surface characteris-tics and land uses. The results confirm the influence of nocturnal tempera-tures on heat wave intensity, heat stress and excess mortal-ity, and show the contribution of urban heat islands in intensifying the heat wave by absorbing heat during the day and pro-gressively raising minimum nocturnal temperatures. The study reported by Thorsson et al. (2011) explores the influence of urban geometry on potential changes in outdoor thermal comfort due to climate change in a compact mid-rise high-latitude city (Gothenburg, Swe-den). The results show that large intra-urban tempo-ral variations exists for mean radiant temperature (Tmrt) as a result of urban geometry. Densely built structures are shown to mitigate extreme swings in Tmrt, improving outdoor comfort con-ditions both in summer and in winter. The relationship between the increase in daytime Tmrt and air temperature is found to be non-linear for their se-lected climate change scenario. The authors highlight the importance of including information on either Tmrt or thermal comfort in climate change scenarios to describe the combined ef-fects of changes in multiple climate variables and to more realistically measure the impact on humans.
There is little doubt that urban cli-mate issues will grow in significance in the coming decades. High quality, innovative research in urban climate is necessary to help mitigate against many of the most potent current en-vironmental issues occurring in urban areas resulting from degradation of urban air quality and climate change. The papers included in this Special issue address some of the gaps in existing knowledge as identified below (from Grimmond et al., 2010):
(i) Implications of global climate change for cities have not been adequately assessed to date. Potential impacts of global climate change on cities are not well known. More research on the interactions between global and urban climate change and the incorporation of urban land surface schemes into global climate models are
needed (see Chen et al., 2011; Fujibe, 2011; Grimmond et al., 2010).(ii) In terms of air pollution and health, there is a need to improve short-range, high-resolution numeri-
cal prediction of weather, air quality and chemical dis-persion in the urban zone. There is also a need for model studies of wind and pollutant transport in complex ur-ban geometries and those which include the combined effects of wind and buoyancy (see Ashie and Kono, 2011; Rasheed et al., 2011).(iii) Urban climate information is not being translated effectively into the design and construction of more
sustainable cities. Issues here concern communication between researchers with different backgrounds and be-tween researchers and planners or ar-chitects. There is also a lack of tools to assist in climate-sensitive design (see Dousset et al., 2011; Lin et al., 2011; Thorssonet al., 2011).(iv) The lack of appropriate data is a major obstacle in providing suitable urban climate information to address the various knowledge gaps. Opera-tional urban measurement station and networks, especially in rapidly de-veloping cities in hot climates and in their surroundings are needed. Verti-cal profiles of physical and chemical variables should be sampled and long term measurement stations should be preserved or established in cities with different urban morphologies to de-termine universal flow and flux charac-teristics (see Frey et al., 2011; Pawlak et al., 2011, Sailor, 2011; Stewart, 2011).
Despite the progress made so far more research is still needed to im-
prove understanding to match that acquired for oth-er environments. Many of these new findings will be presented at the next IAUC conference (ICUC-8) which
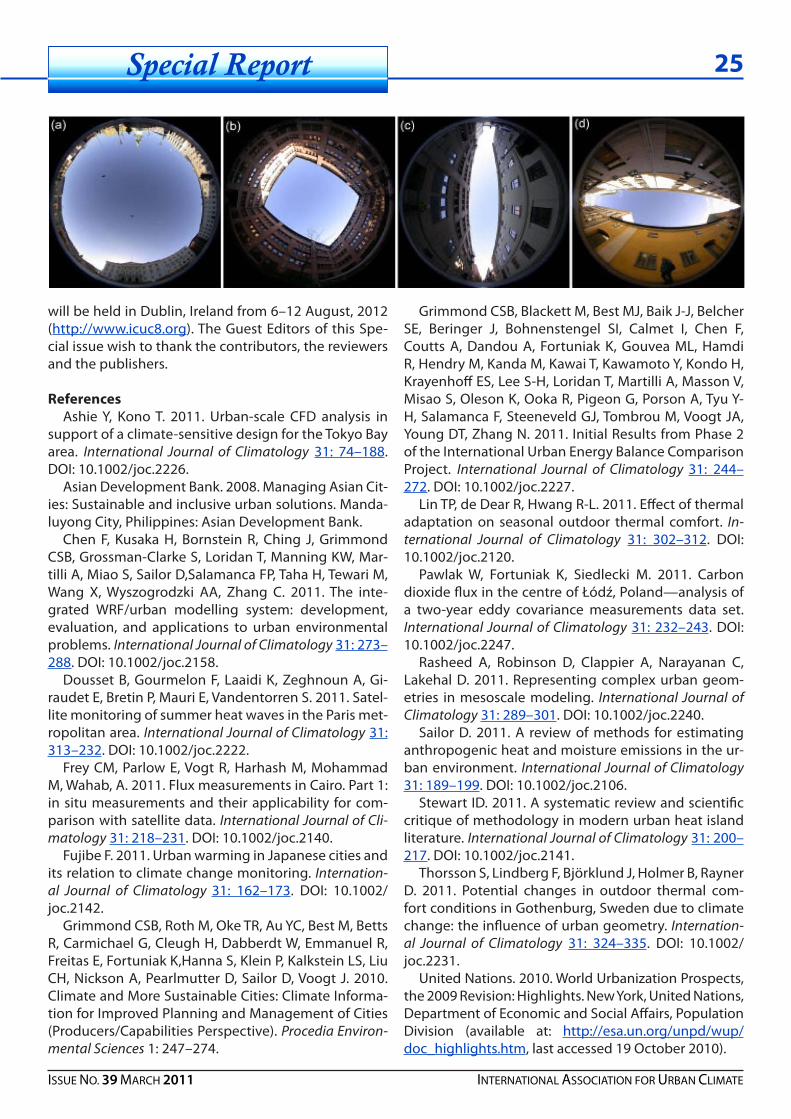
25
ISSUE NO. 39 MARCH 2011 INTERNATIONAL ASSOCIATION FOR URBAN CLIMATE
Special Report
will be held in Dublin, Ireland from 6–12 August, 2012 (http://www.icuc8.org). The Guest Editors of this Spe-cial issue wish to thank the contributors, the reviewers and the publishers.
References
Ashie Y, Kono T. 2011. Urban-scale CFD analysis in support of a climate-sensitive design for the Tokyo Bay area. International Journal of Climatology 31: 74–188. DOI: 10.1002/joc.2226.
Asian Development Bank. 2008. Managing Asian Cit-ies: Sustainable and inclusive urban solutions. Manda-luyong City, Philippines: Asian Development Bank.
Chen F, Kusaka H, Bornstein R, Ching J, Grimmond CSB, Grossman-Clarke S, Loridan T, Manning KW, Mar-tilli A, Miao S, Sailor D,Salamanca FP, Taha H, Tewari M, Wang X, Wyszogrodzki AA, Zhang C. 2011. The inte-grated WRF/urban modelling system: development, evaluation, and applications to urban environmental problems. International Journal of Climatology 31: 273–288. DOI: 10.1002/joc.2158.
Dousset B, Gourmelon F, Laaidi K, Zeghnoun A, Gi-raudet E, Bretin P, Mauri E, Vandentorren S. 2011. Satel-lite monitoring of summer heat waves in the Paris met-ropolitan area. International Journal of Climatology 31: 313–232. DOI: 10.1002/joc.2222.
Frey CM, Parlow E, Vogt R, Harhash M, Mohammad M, Wahab, A. 2011. Flux measurements in Cairo. Part 1: in situ measurements and their applicability for com-parison with satellite data. International Journal of Cli-matology 31: 218–231. DOI: 10.1002/joc.2140.
Fujibe F. 2011. Urban warming in Japanese cities and its relation to climate change monitoring. Internation-al Journal of Climatology 31: 162–173. DOI: 10.1002/joc.2142.
Grimmond CSB, Roth M, Oke TR, Au YC, Best M, Betts R, Carmichael G, Cleugh H, Dabberdt W, Emmanuel R, Freitas E, Fortuniak K,Hanna S, Klein P, Kalkstein LS, Liu CH, Nickson A, Pearlmutter D, Sailor D, Voogt J. 2010. Climate and More Sustainable Cities: Climate Informa-tion for Improved Planning and Management of Cities (Producers/Capabilities Perspective). Procedia Environ-mental Sciences 1: 247–274.
Grimmond CSB, Blackett M, Best MJ, Baik J-J, Belcher SE, Beringer J, Bohnenstengel SI, Calmet I, Chen F, Coutts A, Dandou A, Fortuniak K, Gouvea ML, Hamdi R, Hendry M, Kanda M, Kawai T, Kawamoto Y, Kondo H, Krayenhoff ES, Lee S-H, Loridan T, Martilli A, Masson V, Misao S, Oleson K, Ooka R, Pigeon G, Porson A, Tyu Y-H, Salamanca F, Steeneveld GJ, Tombrou M, Voogt JA, Young DT, Zhang N. 2011. Initial Results from Phase 2 of the International Urban Energy Balance Comparison Project. International Journal of Climatology 31: 244–272. DOI: 10.1002/joc.2227.
Lin TP, de Dear R, Hwang R-L. 2011. Effect of thermal adaptation on seasonal outdoor thermal comfort. In-ternational Journal of Climatology 31: 302–312. DOI: 10.1002/joc.2120.
Pawlak W, Fortuniak K, Siedlecki M. 2011. Carbon dioxide flux in the centre of Łódź, Poland—analysis of a two-year eddy covariance measurements data set. International Journal of Climatology 31: 232–243. DOI: 10.1002/joc.2247.
Rasheed A, Robinson D, Clappier A, Narayanan C, Lakehal D. 2011. Representing complex urban geom-etries in mesoscale modeling. International Journal of Climatology 31: 289–301. DOI: 10.1002/joc.2240.
Sailor D. 2011. A review of methods for estimating anthropogenic heat and moisture emissions in the ur-ban environment. International Journal of Climatology 31: 189–199. DOI: 10.1002/joc.2106.
Stewart ID. 2011. A systematic review and scientific critique of methodology in modern urban heat island literature. International Journal of Climatology 31: 200–217. DOI: 10.1002/joc.2141.
Thorsson S, Lindberg F, Björklund J, Holmer B, Rayner D. 2011. Potential changes in outdoor thermal com-fort conditions in Gothenburg, Sweden due to climate change: the influence of urban geometry. Internation-al Journal of Climatology 31: 324–335. DOI: 10.1002/joc.2231.
United Nations. 2010. World Urbanization Prospects, the 2009 Revision: Highlights. New York, United Nations, Department of Economic and Social Affairs, Population Division (available at: http://esa.un.org/unpd/wup/doc_highlights.htm, last accessed 19 October 2010).
Bibliography 26
ISSUE NO. 39 MARCH 2011 INTERNATIONAL ASSOCIATION FOR URBAN CLIMATE
Recent publications in UrbanClimatologyAsfour, O. S. (2010), Prediction of wind environment in dif-ferent grouping patterns of housing blocks, Energy and Buildings �2(11), 2061-2069.Bergeron, O. & Strachan, I. B. (2011), CO2 sources and sinks in urban and suburban areas of a northern mid-latitude city, Atmospheric Environment �5(8), 1564-1573.Bergeron, O. & Strachan, I. B. (2010), Wintertime radiation and energy budget along an urbanization gradient in Montreal, Canada, International Journal of Climatology.Boogaard, H.; Kos, G. P.; Weijers, E. P.; Janssen, N. A.; Fischer, P. H.; van der Zee, S. C.; de Hartog, J. J. & Hoek, G. (2011), Contrast in air pollution components between major streets and background locations: Particulate matter mass, black carbon, elemental composition, nitrogen oxide and ultrafine particle number, Atmospheric Environment �5(3), 650-658.Brano, V. L.; Orioli, A.; Ciulla, G. & Culotta, S. (2011), Quality of wind speed fitting distributions for the urban area of Pal-ermo, Italy, Renewable Energy 36(3), 1026 - 1039.Buccolieri, R.; Salim, S. M.; Leo, L. S.; Di Sabatino, S.; Chan, A.; Ielpo, P.; de Gennaro, G. & Gromke, C. (2011), Analysis of lo-cal scale tree-atmosphere interaction on pollutant concen-tration in idealized street canyons and application to a real urban junction, Atmospheric Environment �5(9), 1702-1713.Buonanno, G.; Fuoco, F. & Stabile, L. (2011), Influential param-eters on particle exposure of pedestrians in urban microen-vironments, Atmospheric Environment �5(7), 1434-1443.Can, A.; Rademaker, M.; Renterghem, T. V.; Mishra, V.; Pop-pel, M. V.; Touhafi, A.; Theunis, J.; Baets, B. D. & Botteldoo-ren, D. (2011), Correlation analysis of noise and ultrafine particle counts in a street canyon, Science of The Total Envi-ronment �0�(3), 564-572.Changa, K. & Chou, P. (2010), Measuring the influence of the greening design of the building environment on the urban real estate market in Taiwan, Building and Environ-ment �5(10), 2057-2067.Chen, L.; Ng, E.; An, X.; Ren, C.; Lee, M.; Wang, U. & He, Z. (2010), Sky view factor analysis of street canyons and its implications for daytime intra-urban air temperature dif-ferentials in high-rise, high-density urban areas of Hong Kong: a GIS-based simulation approach., International Journal of Climatology.Crawford, B.; Grimmond, C. & Christen, A. (2011), Five years of carbon dioxide fluxes measurements in a highly vegetated suburban area, Atmospheric Environment �5(4), 896--905.Cândido, C.; d Dear, R. & Lamberts, R. (2011), Combined ther-mal acceptability and air movement assessments in a hot humid climate, Building and Environment �6(1), 379-385.
After the departure of Corinne Frey, in the last edition we called for new volunteers motivated to join the Bibliographic Committee. We are fortunate to have three new members: Anurag Kandya from the Department of Civil Engineer-ing of Nirma University (India), Bruno Bueno from the Department of architecture of the Mas-sachusetts Institute of Technology (USA) and Matthias Demuzere from the Department of Earth & Environmental Sciences at the Catholic Iniversity of Leuven (Belgium).
In this edition you will find the compilation of papers published until February 2011. Thanks to everyone for their contribution. All readers are invited to send any peer-reviewed references published since April 1st 2011 for inclusion in the next newsletter and the online database. Please send your references to [email protected] with a header “IAUC publications” and the follow-ing format: Author, Title, Journal, Volume, Pages, Dates, Keywords, Language, Url, and Abstract.
* * *It is our great pleasure to announce that the
complete compilation done from 1��6-200� is now available in the bibliographic online database. We have gone from 700 to 1800 pub-lications and more than 4000 authors. I would like to thank the existing and new members of the Committee for the help in this task!
This first version still has some formatting de-ficiencies, some keywords or authors’ names are duplicated but this will be improved little by little. Please, write us if you notice a mistake or an absence/lack in your references.
Happy reading,
Julia Hidalgo
Dou, H. & Zhao, X. (2011), Climate change and its human di-mensions based on GIS and meteorological statistics in Pearl River Delta, Southern China, Met. Apps 18(1), 111--122.D’Orazio, M.; Pernab, C. D. & Giuseppe, E. D. (2010), The effects of roof covering on the thermal performance of highly insulated roofs in Mediterranean climates, Energy and Buildings �2(10), 1619-1627.El-Metwally, M.; Alfaro, S. C.; Abdel Wahab, M. M.; Favez, O.; Mohamed, Z. & Chatenet, B. (2011), Aerosol properties and

Bibliography 2�
ISSUE NO. 39 MARCH 2011 INTERNATIONAL ASSOCIATION FOR URBAN CLIMATE
associated radiative effects over Cairo (Egypt), Atmospheric Research ��, 263-276.Gallagher, J.; Gill, L. & McNabola, A. (2011), Optimizing the use of on-street car parking system as a passive control of air pollution exposure in street canyons by large eddy simulation, Atmospheric Environment �5(9), 1684--1694.Gómez, I. & Estrela, M. J. (2010), Design and development of a Java-based graphical user interface to monitor/control a meteorological real-time forecasting system, Computers & Geosciences 36(10), 1345-1354.Hang, J. & Li, Y. (2010), Ventilation strategy and air change rates in idealized high-rise compact urban areas, Building and Environment �5(12), 2754-2767.Hiller, R. V.; McFadden, J. P. & Kljun, N. (2011), Interpreting CO2 Fluxes Over a Suburban Lawn: The Influence of Traffic Emissions, Boundary-Layer Meteorology 138(2), 215-230.Hongbing, W.; Jun, Q.; Yonghong, H. & Li, D. (2010), Optimal tree design for daylighting in residential buildings, Build-ing and Environment �5(12), 2594-2606.Indraganti, M. (2010), Understanding the climate sensi-tive architecture of Marikal, a village in Telangana region in Andhra Pradesh, India, Building and Environment �5(12), 2709-2722.Jiru, T. E. & Bitsuamlak, G. T. (2010), Application of CFD in Modelling Wind-Induced Natural Ventilation of Buildings - A Review, The International Journal of Ventilation �(2).Kahinda., J. M.; Taigbenu, A. & Boroto, R. (2010), Domestic rainwater harvesting as an adaptation measure to climate change in South Africa, Physics and Chemistry of the Earth, Parts A/B/C 35(13-14), 742-751.Kim, K. H.; Sekiguchi, K.; Furuuchi, M. & Sakamoto, K. (2011), Seasonal variation of carbonaceous and ionic components in ultrafine and fine particles in an urban area of Japan, At-mospheric Environment �5(8), 1581--1590.Kuhn, T. E.; Herkel, S.; Frontini, F.; Strachan, P. & Kokogianna-kis, G. (2011), Solar control: A general method for model-ling of solar gains through complex facades in building simulation programs, Energy and Buildings �3(1), 19-27.Kurazumi, Y.; Fukagawa, K.; Yamato, Y.; K.Tobita; Kondo, E.; Tsuchikawa, T.; Horikosh, T. & Matsubara, N. (2011), En-hanced conduction-corrected modified effective tem-perature as the outdoor thermal environment evaluation index upon the human body, Building and Environment �6(1), 12-21.Li, J.; Wai, O. W.; Li, Y.; Zhan, J.; Ho, Y. A.; Li, J. & Lam, E. (2010), Effect of green roof on ambient CO2 concentration, Build-ing and Environment �5(12), 2644-2651.Lin, J. T. & Chuah, Y. K. (2011), A study on the potential of natural ventilation and cooling for large spaces in subtropi-cal climatic regions, Building and Environment �6(1), 89-97.Lin, Y. J. & Lin, H. T. (2011), Thermal performance of differ-
ent planting substrates and irrigation frequencies in ex-tensive tropical rooftop greeneries, Building and Environ-ment �6(1), 345-355.Liu, W.; Lian, Z.; Deng, Q. & Liu, Y. (2011), Evaluation of cal-culation methods of mean skin temperature for use in thermal comfort study, Building and Environment �6(1), 478-488.Maa, J.; Songa, W.; Fanga, Z.; S.Lob & G.Liao (2010), Experi-mental study on microscopic moving characteristics of pe-destrians in built corridor based on digital image process-ing, Building and Environment �5(10), 2160-2169.Mamtimin, B. & Meixner, F. X. (2011), Air pollution and meteorological processes in the growing dryland city of Urumqi (Xinjiang, China), Science of The Total Environment �0�(7), 1277-1290.Marciotto, E. R.; Oliveira, A. P. & Hanna, S. R. (2010), Model-ing study of the aspect ratio influence on urban canopy energy fluxes with a modified wall-canyon energy budget scheme, Building and Environment �5(11), 2497-2505.McIntyre, J. H.; Lubitz, W. D. & Stiver, W. H. (2011), Local wind-energy potential for the city of Guelph, Ontario (Can-ada), Renewable Energy 36(5), 1437 - 1446.Michioka, T.; Sato, A.; Takimoto, H. & Kanda, M. (2011), Large-Eddy Simulation for the Mechanism of Pollutant Re-moval from a Two-Dimensional Street Canyon, Boundary-Layer Meteorology 138(2), 195-213.Mirzaeia, P. & Haghighat, F. (2010), Approaches to study Urban Heat Island – Abilities and limitations, Building and Environment �5(10), 2192-2201.Moreno, T.; Pandolfi, M.; Querol, X.; Lavín, J.; Alastuey, A.; Viana, M. & Gibbons, W. (2011), Manganese in the urban atmosphere: identifying anomalous concentrations and sources, Environmental Science and Pollution Research 1�(2), 173-183.Ng, E. (2010), Towards Planning and Practical Understand-ing of the Need for Meteorological and Climatic Informa-tion in the Design of High-density Cities: A Case-based study of Hong Kong, International Journal of Climatology.Niu, S.; Zhang, X.; Zhao, C.; Ding, Y.; Niu, Y. & Christensen, T. H. (2011), Household energy use and emission reduc-tion effects of energy conversion in Lanzhou city, China, Renewable Energy 36(5), 1431 - 1436.Ooka, R.; Sato, T.; Harayama, K.; Murakami, S. & Kawamoto, Y. (2011), Thermal Energy Balance Analysis of the Tokyo Metropolitan Area Using a Mesoscale Meteorological Model Incorporating an Urban Canopy Model, Boundary-Layer Meteorology 138(1), 77-97.Panayioto, G. P.; Kalogirou, S.; Florides, G.; Maxoulis, C.; Pa-padopoulos, A.; Neophytou, M.; Fokaides, P.; Georgiou, G.; Symeou, A. & Georgakis, G. (2010), The characteristics and the energy behaviour of the residential building stock of Cyprus in view of Directive 2002/91/EC, Energy and Build-

Bibliography 28
ISSUE NO. 39 MARCH 2011 INTERNATIONAL ASSOCIATION FOR URBAN CLIMATE
ings �2(11), 2083-2089.Pandian, S.; Gokhale, S. & Ghoshal, A. K. (2011), An open-terrain line source model coupled with street-canyon ef-fects to forecast carbon monoxide at traffic roundabout, Science of The Total Environment �0�(6), 1145-1153.Pantavou, K.; Theoharatos, G.; Mavrakis, A. & Santamouris, M. (2011), Evaluating thermal comfort conditions and health responses during an extremely hot summer in Ath-ens, Building and Environment �6(1), 339-344.Peters, E. B.; Hiller, R. V. & McFadden, J. P. (2011), Seasonal contributions of vegetation types to suburban evapo-transpiration, Journal of Geophysical Research-Biogeosci-ences 116.Pistochini, T. & Modera, M. (2011), Water-use efficiency for alternative cooling technologies in arid climates, Energy and Buildings �3(2-3), 631-638.Rampazzi, L.; Giussani, B.; Rizzo, B.; Corti, C.; Pozzi, A. & Dossi, C. (2011), Monuments as sampling surfaces of re-cent traffic pollution, Environmental Science and Pollution Research 18(2), 184-191.Rizka, A. A. & Henze, G. P. (2010), Improved airflow around multiple rows of buildings in hot arid climates, Energy and Buildings �2(10), 1711-1718.Roels, S. & Deurinck, M. (2011), The effect of a reflective un-derlay on the global thermal behaviour of pitched roofs, Building and Environment �6(1), 134-143.Rucandio, M. I.; Petit-Domínguez, M. D.; Fidalgo-Hijano, C. & García-Giménez, R. (2011), Biomonitoring of chemical el-ements in an urban environment using arboreal and bush plant species, Environmental Science and Pollution Research 18(1), 51-63.Sarkar, A. & Ridder, K. D. (2011), The Urban Heat Island In-tensity of Paris: A Case Study Based on a Simple Urban Sur-face Parametrization, Boundary-Layer Meteorology 138(3), 511-520.Seong, Y. B.; Kim, Y. Y.; Seok, H. T.; Choi, J. M.; Yeo, M. S. & Kim, K. W. (2011), Automatic computation for optimum height planning of apartment buildings to improve solar access, Solar Energy 85(1), 154 - 173.Shashua-Bar, L.; Tsiros, I. X. & Hoffman, M. E. (2010), A mod-eling study for evaluating passive cooling scenarios in ur-ban streets with trees. Case study: Athens, Greece, Building and Environment �5(12), 2798-2807.Shi, Y.; Shi, C.; Xu, S. Y.; Sun, A. L. & Wang, J. (2010), Exposure assessment of rainstorm waterlogging on old-style resi-dences in Shanghai based on scenario simulation, Natural Hazards 53, 259-272.Shi, Z. & Zhang, X. (2011), Analyzing the effect of the long-wave emissivity and solar reflectance of building enve-lopes on energy-saving in buildings in various climates, Solar Energy 85(1), 28 - 37.
Simone, A.; Kolarik, J.; Iwamatsu, T.; Asada, H.; Dovjak, M.; Schellen, L.; Shukuya, M. & Olesen, B. W. (2011), A relation between calculated human body exergy consumption rate and subjectively assessed thermal sensation, Energy and Buildings �3(1), 1-9.Smith, S.; Hanby, V. & Harpham, C. (2011), A probabilistic analysis of the future potential of evaporative cooling sys-tems in a temperate climate, Energy and Buildings �3(2-3), 507-516.Sookchaiyaa, T.; Monyakula, V. & Thepa, S. (2010), Assess-ment of the thermal environment effects on human com-fort and health for the development of novel air condition-ing system in tropical regions, Energy and Buildings �2(10), 1692-1702.Sousa, S.; Alvim-Ferraz, M. & Martins, F. (2011), Identifica-tion and origin of nocturnal ozone maxima at urban and rural areas of Northern Portugal - Influence of horizontal transport, Atmospheric Environment �5(4), 942--956.Stewart, I. (2011), A systematic review and scientific cri-tique of methodology in modern urban heat island litera-ture, International Journal of Climatology 31, 200-217.Sunder-Raman, R. & Ramachandran, S. (2011), Source ap-portionment of the ionic components in precipitation over an urban region in Western India, Environmental Sci-ence and Pollution Research 18(2), 212-225.Swan, A. (2010), How increased urbanisation has induced flooding problems in the UK: A lesson for African cities?, Physics and Chemistry of the Earth, Parts A/B/C 35(13-14), 643-647.Synnefa, A.; Karlessi, T.; Gaitani, N.; Santamouris, M.; As-simakopoulos, D. & Papakatsikas, C. (2011), Experimental testing of cool colored thin layer asphalt and estimation of its potential to improve the urban microclimate, Building and Environment �6(1), 38-44.Tejeda-Martinez, A.; Luyando, B. & Jáuregui, E. (2011), Av-erage conditions of thermal stress in Mexican cities with more than one million inhabitants in the face of climatic change, Atmósfera 2�, 15-30.Toy, S. & Yilmaz, S. (2011), Evaluation of urban-rural bio-climatic comfort differences over a ten-year period in the sample of Erzincan city reconstructed after a heavy earth-quake, Atmósfera 23, 387-402.Twardosz, R. (2010), An analysis of diurnal variations of heavy hourly precipitation in Kraków using a classifica-tion of circulation types over southern Poland, Physics and Chemistry of the Earth, Parts A/B/C 35(9-12), 456-461.Unger, J.; Gal, T.; Rakonczai, J.; Mucsi, L.; Szatmari, J.; Tobak, Z.; van Leeuwen, B. & Fiala, K. (2010), Modeling of the ur-ban heat island pattern based on the relationship between surface and air temperatures, Idojaras (Quart. J. of Hungar-ian Meteorolohical Service) 11�, 287-302.Vianna, N. A.; Gonçalves, D.; Brandão, F.; de Barros, R. P.;
Bibliography
Book ReviewUrban Microclimate: Designing the Spaces Between Buildings. By Evyatar Erell, David Pearlmutter and Terry Williamson, Earthscan 266 p.
A number of years ago, a reporter asked me to ex-plain to her the importance of green architecture. When I started talking about it from the meso-scale downwards, she started to get impatient. A few weeks ago, I was asked to assist in the design of Hong Kong’s first zero energy building. I tried to enlighten the ar-chitect that we must start working on the problem from beyond the site boundary. He was puzzled and told me the client does not own the land outside the site. I have been thinking that if only I can hand them, and many others, a volume on urban microclimate, my job of explaining to them would be made easier.
Urban Microclimate by Evyatar Erell, David Pearlmut-ter and Terry Williamson may have provided an answer to my prayer. All architects should start reading Chap-ter 1 on Scales of Climate Study and start realizing that our buildings in the city are located amidst many oth-ers that provide the climatic context upon which we have to design.
The scientific basis of this understanding is explained in detail in the following three chapters. For architects in dense urban spaces in the tropics like Hong Kong, Chapter 4 on urban air flow is particularly important. I only hope that it can extend the understanding to include conditions of higher building height-to-street width and higher frontal area density. With the rapid densification of many large cities on earth, this will be-come more important.
We design our cities for human activities. Human thermal comfort is something that is very important to get right when one needs to function among all the man-made materials, surfaces and structures. Chap-ter 5 and 6 of the book have nicely introduce the un-derstanding of how to do this.
For an architect like me, Chapter 7 onwards gets more relevant. However, it appears that the study is focused largely on the climatic type of Israel. Readers wishing for information on other climatic zones may
need to refer to Baruch Givnoi’s book Climate Considerations in Build-ing and Urban Design, or David Lloyd Jones’ volume Architecture and the Environment.
The chapter on vegetation nicely introduces to the designers that the building is not the end of a design. Trees and greeneries can significantly improve our liv-ing environment. It is after all very difficult to “design” an ugly tree.
Two case studies nicely conclude the book. I am particularly interested in reading the study on Clarke Quay. I was in Clark Quay a couple of times and can say that the canopy can make a difference. I am, how-ever, not that sure about the water spray and water features due to the already high humidity of the envi-ronment. It is of interest to point out that the place is normally quite empty; most of the people still hide in their AC spaces. It only gets lively in the evening; as such, the Christmas tree effect of the canopy provides a bit of entertainment.
All good thing comes to an end. Just as I am be-ginning to enjoy it – the case studies in particular – I come to the back cover. I am sure while I am mum-bling about it, the authors are busy writing their se-quel with more case studies. I am looking forward to reading them – more than the next episode of Harry Potter.
Gerald Mills et. al. recently published a position pa-per in WMO’s WCC3. The needs have been meticu-lously deliberated. I can see that with Urban Microcli-mate we are making progress.
Edward NgProfessor , School of Architecture, ChineseUniversity of Hong Kong
2�
ISSUE NO. 39 MARCH 2011 INTERNATIONAL ASSOCIATION FOR URBAN CLIMATE
Filho, G. M. A.; Meire, R. O.; Torres, J. P. M.; Malm, O.; Júnior, A. D. & Andrade, L. R. (2011), Assessment of heavy metals in the particulate matter of two Brazilian metropolitan areas by using Tillandsia usneoides as atmospheric biomonitor, Environmental Science and Pollution Research 18(3), 416-427.Wan, K. K.; Li, D. H.; Liu, D. & Lam, J. C. (2011), Future trends of building heating and cooling loads and energy con-
sumption in different climates, Building and Environment �6(1), 223-234.Wan, K. K.; Lia, D.; L.Yang & Lam, J. C. (2010), Climate clas-sifications and building energy use implications in China, Energy and Buildings �2(9), 1463-1471.Wang, H. & Han, G. (2011), Chemical composition of rain-water and anthropogenic influences in Chengdu, South-west China, Atmospheric Research ��, 190-196.
Conferences 30
ISSUE NO. 39 MARCH 2011 INTERNATIONAL ASSOCIATION FOR URBAN CLIMATE
Upcoming Conferences...“URBAN CLIMATE, URBAN HEAT ISLAND & URBAN BIOMETEOROLOGy” at EGU General AssemblyVienna, Austria • April 3-8, 2011http://meetings.copernicus.org/egu2011/
“WEATHER, GEOGRAPHICAL CONTExTS ANDSPATIAL BEHAVIOUR” at Association of American Geographers (AAG) Annual MeetingSeattle, WA, USA • April 12-16, 2011http://www.aag.org/cs/annualmeeting
CITy WEATHERS: METEOROLOGy AND URBAN DESIGN 1950-2010Manchester, UK • June 23-24, 2011http://www.chstm.manchester.ac.uk/newsandevents/conferences/cityweathers/CFP-cityweathers.pdf
INTERNATIONAL WORKSHOP ON URBAN WEATHER AND CLIMATE: OBSERVATION AND MODELINGBeijing China • July 12-15, [email protected]
COHERENT FLOW STRUCTURES IN GEOPHySICAL FLOWS AT EARTH’S SURFACEBurnaby, British Columbia • August 3-5, 2011http://www.sfu.ca/CoherentFlowStructures/
“URBANIzATION AND ITS IMPACTS ON TERRESTRIAL ECOSySTEM” and “URBAN GREEN SPACES, HUMAN HEALTH AND ECO-ENVIRONMENT qUALITy,” special symposia at the 8th International Association of Land-scape Ecology (IALE) World CongressBeijing China • August 18-23, 2011http://www.iale2011.org
URBAN MORPHOLOGy AND THE POST-CARBON CITy: 18th International Seminar on Urban Form Montréal, Canada • August 26- 29, 2011http://www.isuf2011.com/
14TH INTERNATIONAL CONFERENCE ON HAR-MONISATION WITHIN ATMOSPHERIC DISPERSION MODELLING FOR REGULATORy PURPOSESKos Island, Greece • October 2-6, 2011http://www.harmo.org/
WORLD RENEWABLE ENERGy ASIA REGIONAL CONGRESS AND ExHIBITION Chongqing, China • October 28-31, 2011http://www.wrenuk.co.uk/index.html
19TH INTERNATIONAL CONGRESS OF BIOMETEO-ROLOGy (ICB2011) December 5-9, 2011, Auckland, New Zealandhttp://www.icb2011.com
Wang, Z.; Bou-Zeid, E. & Smith, J. A. (2011), A Spatially-Ana-lytical Scheme for Surface Temperatures and Conductive Heat Fluxes in Urban Canopy Models, Boundary-Layer Me-teorology 138(2), 171-193.Wang, Z.; Zhang, L.; Zhao, J. & He, Y. (2010), Thermal com-fort for naturally ventilated residential buildings in Harbin, Energy and Buildings �2(12), 2406-2415.Wilby, R. L.; Jones, P. D. & Lister, D. H. (2011), Decadal varia-tions in the nocturnal heat island of London, Weather 66(3), 59--64.Wong, M. S.; Nichol, J. B. & Lee, K. H. (2011), An operational MODIS aerosol retrieval algorithm at high spatial resolu-tion, and its application over a complex urban region, At-mospheric Research ��, 579-589.Wong, N. & Chong, A. Z. (2010), Performance evaluation of misting fans in hot and humid climate, Building and Envi-ronment 45(12), 2666-2678.Wong, N. H.; Jusuf, S. K.; Syafii, N. I.; Chen, Y.; Hajadi, N.; Sathyanarayanan, H. & Manickavasagam, Y. V. (2011), Eval-uation of the impact of the surrounding urban morphol-ogy on building energy consumption, Solar Energy 85(1), 57 - 71.Wong, S.; Wan, K. K.; Li, D. H. & Lam, J. (2010), Impact of climate change on residential building envelope cooling loads in subtropical climates, Energy and Buildings �2(11), 2098-2103.Yang, L. & Li, Y. (2010), Simple Correction Methods of In-frared Thermography for Building Exterior Surfaces, The International Journal of Ventilation �(3).Yao, R.; Luo, Q. & Li, B. (2011), A simplified mathematical model for urban microclimate simulation, Building and En-vironment �6(1), 253-265.Yoon, C.; Lee, K. & Park, D. (2011), Indoor air quality differ-ences between urban and rural preschools in Korea, Envi-ronmental Science and Pollution Research 18(3), 333-345.Yu, X.; Zhu, B.; Yin, Y.; Yang, J.; Li, Y. & Bu, X. (2011), A com-parative analysis of aerosol properties in dust and haze-fog days in a Chinese urban region, Atmospheric Research ��, 241-247.Zaki, S. A.; Hagishima, A.; Tanimoto, J. & Ikegaya, N. (2011), Aerodynamic Parameters of Urban Building Arrays with Random Geometries, Boundary-Layer Meteorology 138(1), 99-120.Zolfagharia, A. & Maerefat, M. (2010), A new simplified thermoregulatory bioheat model for evaluating thermal response of the human body to transient environments, Building and Environment �5(10), 2068-2076.Zvyagintsev, A. M.; Belikov, I. B.; Elanskii, N. F.; Kuznetsova, I. N.; Romanyuk, Y. O.; Sosonkin, M. G. & Tarasova, O. A. (2010), Surface ozone concentration variability in Moscow and Kiev, Russian Meteorology and Hydrology 35(12), 806-812.

IAUC Board
Presentation of 200�Luke Howard AwardJennifer Salmond, IAUC Secretary
Board Members & Terms• Toshiaki Ichinose (National Institute for Environmental
Studies, Japan): 2007-2011• Rohinton Emmanuel (Glasgow Caledonian University,
UK): 2006-2010; Secretary, 2009-2011• Petra Klein (University of Oklahoma, USA): 2007-2011• Sue Grimmond (King’s College London, UK): 2000-2003;
President, 2003-2007; Past President, 2007-2009*• Manabu Kanda (Tokyo Institute of Technology, Japan):
2005-2009, ICUC-7 Local Organizer, 2007-2009.*• Sofia Thorsson (University of Gothenburg, Sweden):
2008-2012• Gerald Mills (UCD, Dublin, Ireland): 2007-2011; President,
2009-2011• Tim Oke (University of British Columbia, Canada): Presi-
dent, 2000-2003; Past President, 2003-2006; Emeritus President 2007-2009*
• Matthias Roth (National University of Singapore, Singa-pore): 2000-2003; Secretary, 2003-2007; Acting-Treasurer 2006; President, 2007-2009; Past-President 2009-2011*
• Jennifer Salmond (University of Birmingham, UK): 2005-2009; Secretary, 2007-2009
• James Voogt (University of Western Ontario, Canada), 2000-2006; Webmaster 2007-*; 2009-2013
• Jason Ching (EPA Atmospheric Modelling & Analysis Divi-sion, USA): 2009-2013
• Alberto Martilli (CIEMAT, Spain), 2010-2014• Aude Lemonsu (CNRS/Meteo France), 2010-2014• Silvana di Sabatino (Univ. of Salento, Italy), 2010-2014• David Pearlmutter (Ben-Gurion University of the Negev,
Israel): Newsletter Editor, 2009-* * appointed members
IAUC Committee ChairsEditor IAUC Newsletter: David PearlmutterBibliography Committee: Julia HidalgoMembership Committee: TBANominating Committee: Tim OkeInt. Representative Committee: TBAChair Teaching Resources: Gerald MillsInterim-Chair Awards Committee: Jennifer SalmondWebMaster: James Voogt
Newsletter ContributionsThe next edition of Urban Climate News will appear in late June. Items to be considered for the upcoming issue should be received by May 31, 2011 and may be sent to editor David Pearlmutter ([email protected]) or to the rel-evant section editor:News: Winston Chow ([email protected])Conferences: Jamie Voogt ([email protected])Bibliography: Julia Hidalgo ([email protected])Projects: Sue Grimmond ([email protected])
General submissions should be short (1-2 A4 pages of text), written in a manner that is accessible to a wide audience, and incorporate figures and photographs. Images you think would be of interest to the IAUC community are welcome.
31
ISSUE NO. 39 MARCH 2011 INTERNATIONAL ASSOCIATION FOR URBAN CLIMATE
ICUC-8 in Dublin6-10 August 2012
Dublin, August 2012
First call for papers July 31
Second call for papers October 31
Closing date for submission of abstracts January 31
Abstract review by Scientific Committee February 31
Extended abstract deadline May 31
Early online registration March 31 - May 1
Late registration June 1 - July 15
Conference Website: www.icuc8.org
The 8th International Conference on Urban Climate will take place in Dublin (Ireland) in 16 months’ time. An initial schedule is presented below and it is expected that the first call for papers will be issued at the end of July. The event is planned to accommodate 350-400 participants, of which perhaps a third will be graduate students. Based on previous ICUC events, we hope that the participants will be drawn from diverse academic and professional back-grounds and represent the international nature of urban climate research. The main sponsoring body is of course the IAUC but, on this occasion, the event is co-sponsored by the Board of the Urban Environment, a specialty group within the American Meteorological Society (AMS).
At this stage the basic framework for the event is in place. The meeting will take place on a university cam-pus, which is three miles south of the city centre and is well served by public transport (including regular buses to Dublin Airport). Some accommodation on campus has been set aside and a special rate secured at nearby hotels. The facilities on campus that we will use are modern and consist of both large lecture theatres and small meeting rooms. In addition to the meeting itself, there will be a full programme of events for the evenings and a schedule of daytime events for partners.
At this stage the local organisers are beginning the process of obtaining sponsorship. In the coming months, more details will be presented through the pages of Ur-ban Climate News and via the IAUC website. The confer-ence website is www.icuc8.org and this will be regularly updated in the coming months. − Gerald Mills