urban search and rescue training for …€¦ · (from ema usar capability guidelines, ......
TRANSCRIPT
URBAN SEARCH AND RESCUE TRAINING FOR ENGINEERS
AUTHOR:
M.C. GRIFFITH ASSOCIATE PROFESSOR
SCHOOL OF CIVIL AND ENVIRONMENTAL ENGINEERING
THE UNIVERSITY OF ADELAIDE
ADELAIDE, SA, AUSTRALIA
Dr Mike Griffith is Associate Professor at The University of Adelaide. Prior to his arrival at Adelaide in 1988, he obtained his PhD in Engineering from the University of California at Berkeley and Bachelor and Master degrees in Civil Engineering from Washington State University. He has been President of the Australian Earthquake Engineering Society since 2002 and of relevance to this paper, he has recently returned from New Zealand where he completed the NZ USAR Engineer Level 1 training course.
ABSTRACT:
Emergency management officials and urban search and rescue (USAR) technicians ( eg, fire and ambulance personnel, dogs and their handlers, etc.) have recognised the benefit of having qualified engineers working with them as part of their team. In particular, overseas experience has highlighted the illlportance of having engineering capability in USAR teams. There are a couple of levels of involvement that engineers are typically trained for and training courses for Level 1 and Level 2 involvement have been running in New Zealand for the last 12 months. It has been proposed to run a similar training scheme in Australia. This paper outlines the structure of these Level 1 and 2 Engineering USAR courses and the likely modifications required for their use in Australia.
Paper No. 24

1. BACKGROUND Urban Search and Rescue (USAR) is defined in the Australian Emergency Manual Series (2004) as "a specialised technical rescue capability for the location and rescue of entrapped people following a structural collapse". The nature of the collapse is often a building collapse although landslides (such as in the 1997 Thredbo disaster) and caveins on construction sites are other examples of "collapse" where USAR teams may be called in to search for the injured and trapped victims. It should be recognised that those conducting USAR activities can themselves become victims, as a high level of risk is associated with these activities. This risk is primarily to do with secondary collapses in the partially collapsed structures.
A USAR capability has been developed over the past decade in Victoria, NSW and Queensland by the Fire Services, with over 500 technicians trained. In addition, South Australia, Western Australia and Tasmania are in the process of developing a USAR capability. Each State is responsible for their own training, although there is some
. collaboration with shared exercises and exchange of personnel between States. Overall co-ordination of USAR activities is undertaken by Emergency Management Australia (EMA). USAR training for technicians includes a half day seminar on the principles of structural collapse, which to date has been provided by John Wilson from the University of Melbourne. Any USAR team should also have an engineer and hazchem specialist to assess structural and chemical hazards, to minimise risk to the USAR personnel. Engineers can provide valuable assistance to USAR technicians by advising the USAR team as to whether it is safe to enter a building, if not how can it be stabilised to make it safe, what is the best access route and what are the most likely locations in the rubble pile for victims (see Figure 1). However to date, no formal training of Engineers for USAR activities has been undertaken.
4.20 STRUCTURAL ENGINEER
Tt1e Structural Engineer is an integral part of the Task Force wt1o:
a. is responsible for acquiring builcling plans of the collapsed structure;
b. provides advice as requested by t11e Operations Officer as to t11e most appropriate means of approaching and securing tt1e collapse site: and
c. advises on any other aspects of the incident t11at may fall within the realms of their expertise.
Figure 1. Need for Engineer in Task Force (from EMA USAR Capability Guidelines, 2004)
The need for more widespread USAR capabilities has been highlighted in recent times by disasters such as the building collapses caused by landslide at Thredbo in NSW. The recent focus on potential terrorist attacks has caught the attention of the public and our political masters, but the reality is that while the result of such attacks are terrible, they are nevertheless relatively small in scale to what nature can cause. For example, a moderate earthquake occurring near any of our capital cities could cause widespread damage to buildings with multiple collapses placing an enormous strain on our disaster management and response systems and USAR teams in particular.
In order to develop more widespread USAR capabilities for Australia and in particular, to increase the number of engineers with USAR training, it has been proposed by the
Page 24-1
Australian Earthquake Engineering Society to run a set of specialist courses that engineers could take to prepare them to work effectively with USAR teams. The follow sections of this paper outline the overall USAR training framework and the framework for two levels of specialist training of USAR Engineers that has been developed in New Zealand by David Brunsdon and Des Bull and which is expected to form the basis for a similar set of courses for USAR Engineers in Australia.
2. USAR Training and Framework
The typical USAR technician training framework consists of three levels:
• Category 1 - Surface Search and Rescue
• Category 2 - Surface and Below Debris Search and Rescue
• Category 3 - USAR Management
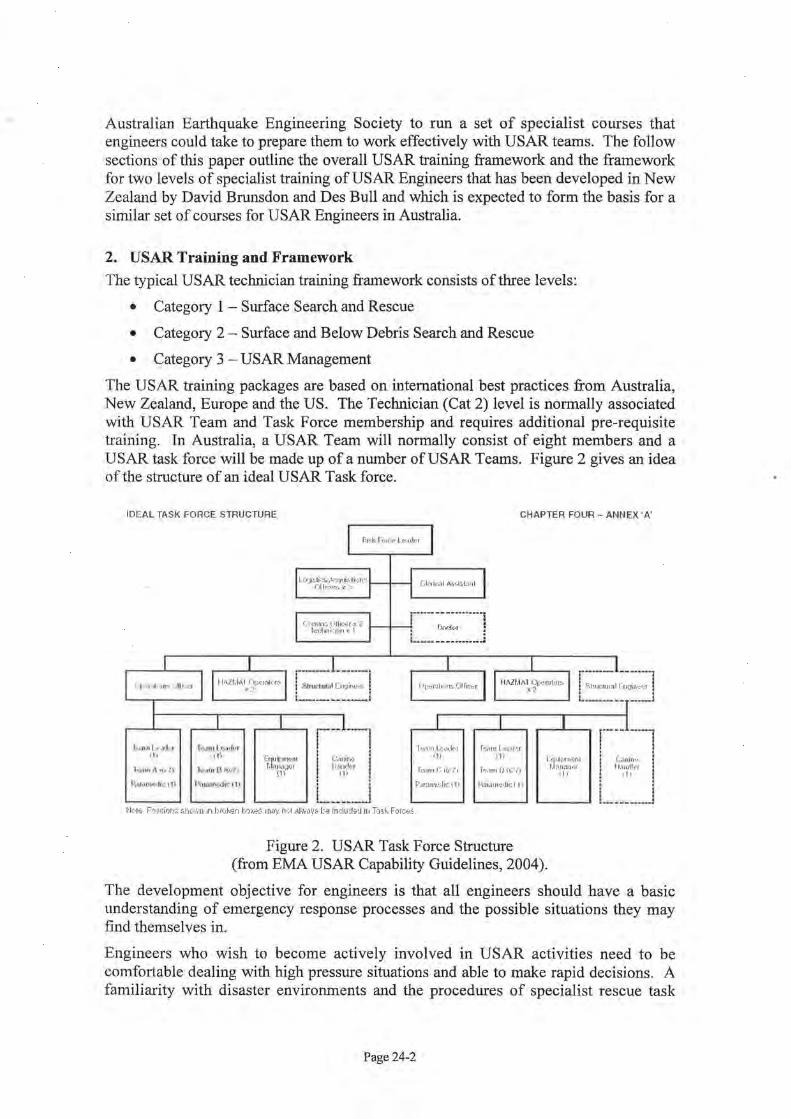
The USAR training packages are based on international best practices from Australia, New Zealand, Europe and the US. The Technician (Cat 2) level is normally associated with USAR Team and Task Force membership and requires additional pre-requisite training. In Australia, a USAR Team will normally consist of eight members and a USAR task force will be made up of a number ofUSAR Teams. Figure 2 gives an idea of the structure of an ideal USAR Task force.
IDEAL TASK FORCE STRUCTURE CHAPTER FOUR- ANNEX 'A"
lo., unL,.·•d<tt ,n
lc.un U •\.. '7)
1\ur..tJ h·~ 11 ~
r--------------1 c''f~L~1~i~·i~~·;{ r?. f--1---l, D<..r.tN !
' .
r---'--. r-- -·-·1
[quipmc nt r.tu ...-•!JO:: r
(11
i I ! C..:111mo j I l~<rrt' I i__ ______ .i
, __ __ ------------~
T·~o.liTII O~lrlo r r,..-.:.un Lf:<Jdr;r (li (1)
T• .. wn c tl:. .,. Tt:;liTI 0 \G n P~~r.lnVH.Iic i1 1 P'.:udm·.dic' 1r
Figure 2. USAR Task Force Structure
E.quirAn ... ml u~lt;\!)f;r
!l.i
(from EMA USAR Capability Guidelines, 2004).
The development objective for engineers is that all engineers should have a basic understanding of emergency response processes and the possible situations they may find themselves in.
Engineers who wish to become actively involved in USAR activities need to be comfortable dealing with high pressure situations and able to make rapid decisions. A familiarity with disaster environments and the procedures of specialist rescue task
Page 24-2

forces also needs to be developed. This familiarity requires specific prior training and engagement with emergency service agencies. Ideally, we would like to have:
• At regional/local level
o A group of engineers familiar with USAR processes (Cat 1 - surface search and rescue) and able to assist the initial disaster response.
• At USAR Team and Task Force level
o At least one engineer trained to Cat 2 level (confined space rescue) and assigned to each USAR Team.
The USAR Engineer training framework supports the development of a regional and national capability of engineers to deal with minor and major building collapses. The training is intended to help participants go beyond their normal office-based experiences and gain familiarity with the demanding nature of rescue operations.
The key features and target outcomes of the USAR Engineer courses are summarised as follows. ·
Levell USAR Engineer
• Focus- operating on the outer perimeter of a structural collapse site • Outcomes - professional engineers aware of the issues associated with working
alongside emergency services personnel and a regional resource capable of assisting local volunteer rescue teams carrying out surface search and rescue
• Course Status- Engineers Australia endorsed with 12 hours ofCPD credit • Targets- Graduate engineers and above (from any technical discipline)
Level 2 USAR Ellgineer
• Focus- operating within a structural collapse site (overall structure and element stability
• Outcomes- capable of operating with USAR Task Force teams • Course Status - Engineers Australia endorsed with 12 hours of CPD credit • Targets- Chartered Professional engineers (structural and geotechnical) who
have completed USAR Level 1 Engineer training
There is a significant step in capability between Levels 1 and 2. Level 1 simply provides an understanding of how the emergency services operate; it does not fully equip engineers for providing engineering advice to the emergency services in operational situations.
Any engineer who participates in Task Force activities needs to have achieved Chartered Professional Engineer status, and will need to possess a number of personal attributes so that they are suitable for actual events. This includes a reasonable level of fitness due to the demanding nature of the exercise and the potential long hours that can be worked. The engineer wi!J need to be adaptable and able to fit in to the structured nature of the Task Force operation. A good understanding of practical construction methods and some experience in construction and demolition related work would also be expected.
Engineers who wish to become formally involved with a Task Force will also need to attend part of a three week Category Two Technician course for four days. This
Page 24-3

includes participation in a three-day rescue simulation exercise. Engineers attending this exercise gain first-hand exposure to the multi-agency nature of the Task Force and develop working relationships with the technicians that do the search and rescue work.
3. CONCLUDING REMARKS
This paper gives a brief discussion and outline of a formal training program for engineers so that they can work effectively with USAR Teams, either at a Level 1 role by providing advice to early response emergency personnel and from the perimeter to USAR teams or in the higher Level 2 role by being part of a USAR Team and advising/working with them on the "rubble pile".
4. REFERENCES
Engineering Management Australia, 2004. "Manual 6- Urban Search and Rescue: Capability Guidelines for Structural Collapse Response," from the Australian Emergency Manual Series, Part III Emergency Management Practice, Volume 2-Specific Issues, Australian Government, Attorney-General's Department, Canberra.
D. Brunsdon and D. Bull, "Level 1 USAR Engineer: operating on the perimeter of the site - 2004 Student Manual," New Zealand Urban Search and Rescue.
Page 24-4

SEISMIC DESIGN OF BURIED ARCH STRUCTURES TO AS 5100
DOUG JENKINS_BSCENG, MENGSC, MIEAUST, MICE INTERACTIVE DESIGN SERVICES PTY LTD
AUTHOR:
Doug Jenkins has extensive experience in bridge design and analysis. For the last ten years he
has specialised in the design of buried structures and retaining walls, and he has prepared
recommendations for the seismic design of buried arch structures for Groupe TAI.
ABSTRACT:
In this paper existing research on the analysis of buried arch structures is reviewed, and
alternative analysis methods are discussed for use on designs to AS 5100. A typical
arch as used for highway and rail projects is analysed using the following methods:
• Pseudo-static analysis
• Response spectrum analysis
• Push-over analysis
The results of these analyses are discussed and compared with earlier papers on this
subject, and recommendations are presented for the design of buried structures to
AS5100, including:
• Methods of analysis
• Estimation of structural period
• Materials stiffness properties • Structural response factors
PaperNo.25
INTRODUCTION
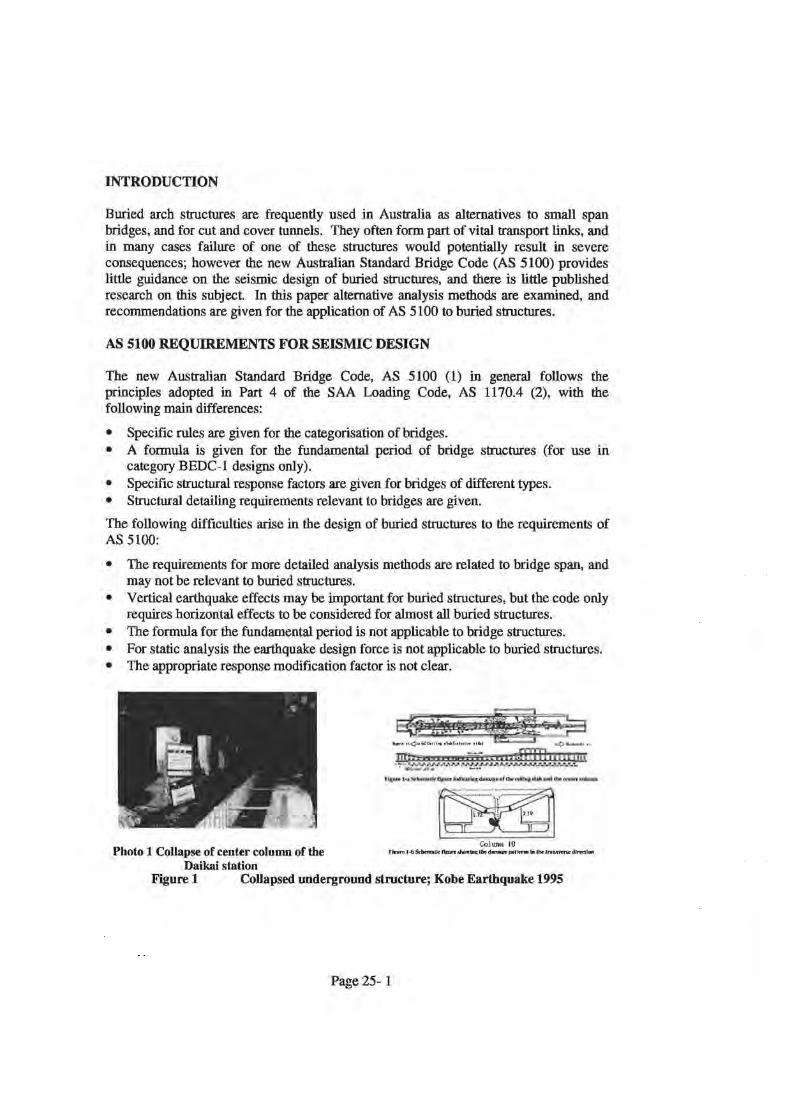
Buried arch structures are frequently used in Australia as alternatives to small span bridges, and for cut and cover tunnels. They often form part of vital transport links, and in many cases failure of one of these structures would potentially result in severe consequences; however the new Australian Standard Bridge Code (AS 5100) provides little guidance on the seismic design of buried structures, and there is little published research on this subject. In this paper alternative analysis methods are examined, and recommendations are given for the application of AS 5100 to buried structures.
AS 5100 REQUIREMENTS FOR SEISMIC DESIGN
The new Australian Standard Bridge Code, AS 5100 (1) in general follows the principles adopted in Part 4 of the SAA Loading Code, AS 1170.4 (2), with the following main differences:
• Specific rules are given for the categorisation of bridges. • A formula is given for the fundamental period of bridge structures (for use in
category BEDC-1 designs only). • Specific structural response factors are given for bridges of different types. • Structural detailing requirements relevant to bridges are given.
The following difficulties arise in the design of buried structures to the requirements of AS 5100:
• The requirements for more detailed analysis methods are related to bridge span, and may not be relevant to buried structures.
• Vertical earthquake effects may be important for buried structures, but the code only requires horizontal effects to be considered for almost all buried structures.
• The formula for the fundamental period is not applicable to bridge structures. • For static analysis the earthquake design force is not applicable to buried structures. • The appropriate response modification factor is not clear.
Photo 1 Collapse of center column of the r~urui ... S< ..... lkllm~ ..................... n .. M .. ,.Ino•"'""'""''•
Daikai station Figure 1 Collapsed underground structure; Kobe Earthquake 1995
Page 25- 1

EARTHQUAKE PERFORMANCE OF BURIED STRUCTURES
It is widely accepted that flexible buried structures have good performance under earthquake loading and that such structures are able to accommodate the deflections imposed by the ground vibrations without failure. There are cases of structural failure and total collapse of buried structures however (see Figure 1). Potential causes of failure of a buried structure include:
• Liquefaction of the foundations or the surrounding soil. • Compression failure of concrete and/or compression reinforcement. • Buckling of compression members due to excessive deflections.
PREVIOUS RESEARCH
A precast concrete buried arch of approximately 10 m span and 5 m height was analysed by Byrne et al (3) under a range of fill heights and seismic loadings. This work was reviewed and extended by Wood and Jenkins (4), concluding:
"Results show that the bending moments in the arch from horizontal earthquake loading can be significant in relation to the gravity load actions. These moments are also very sensitive to the backfill and surrounding soil stiffness properties and rather less sensitive to the foundation soils beneath the arch."
STRUCTURE AND ANALYSIS ME mODS
A typical arch as used highway and rail projects was analysed using a pseudo-static analysis, and a response spectrum analysis. A push over analysis was also carried out up to the maximum deflection found in the previous analyses.
The arch dimensions were: Internal span,13 metres; internal height, 8 metres; thickness, 300 mm. The analyses were carried out with 3 metres and 15 metres of fill over the crown of the arch. The main features of the model were:
• The model was extended so that the boundary of the fill was a distance of more than 5 times the arch span from the outer face of the arch.
• The arch was modelled with beam elements, and the fill with 8 noded plain strain plate elements.
• Frictional interface elements were placed between the arch and soil to allow slip to take place at the interface.
• For the static analyses, the soil was placed in layers, to model the construction sequence of the arch.
• The static analyses used Mohr-Coulomb properties for the soil. • The arch was modelled with either linear elastic properties, or a moment-curvature
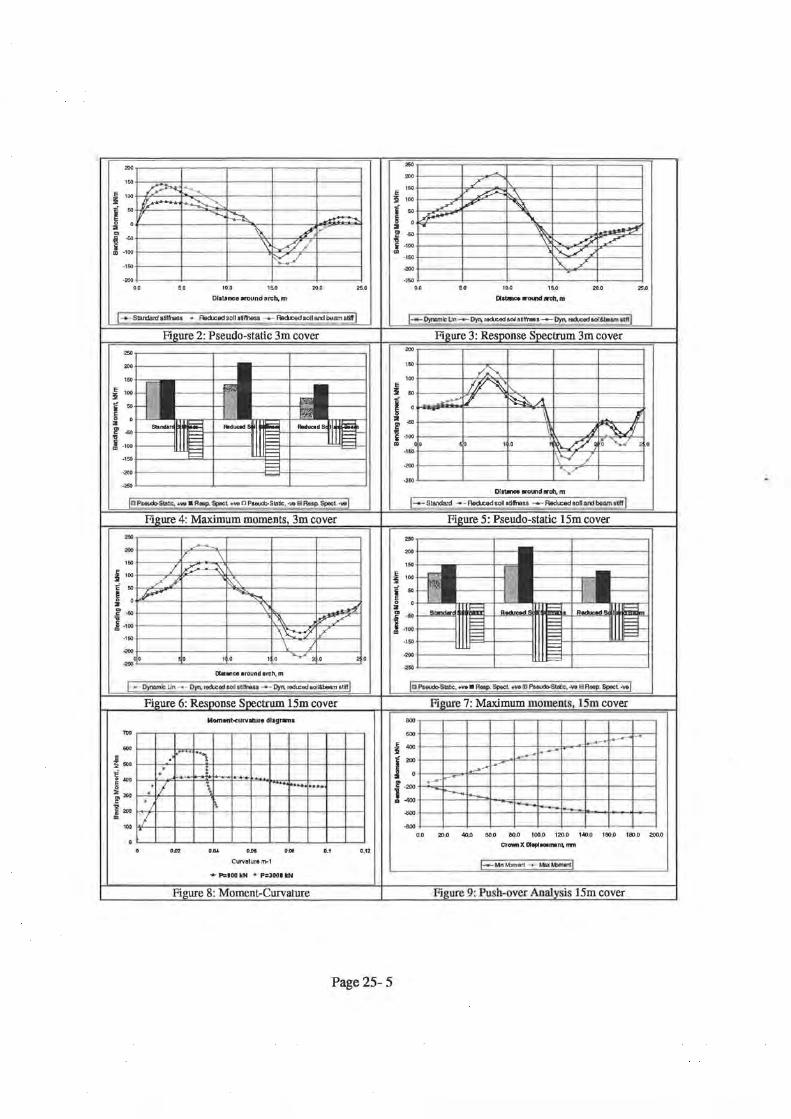
relationship taking account of the concrete and reinforcement properties and the estimated axial load in the arch (Figure 8)
For each fill height the following analyses were carried out:
1. Natural frequency analysis 2. Deflection under unit horizontal acceleration
Page25- 2

3. Pseudo-static analysis 4. Response Spectrum analysis 5. Push-over analysis
For each of the analyses the following material stiffness properties were used:
1. Typical soil and uncracked concrete. 2. Soil stiffness reduced by half and uncracked concrete. 3. Soil stiffness reduced by half, and concrete moment-curvature relationship (static
analyses), or cracked stiffness (response spectrum analyses)
A total of 26 separate analyses were carried out.
SEISMIC PARAMETERS
The following seismic parameters were assumed for the purposes of this paper: Acceleration coefficient, a: 0.10 Site factor, S 1.5 Bridge type: II (Bridges that are designed to carry large volumes of traffic or bridges over other roadways, railways or buildings)
From Table 14.3.1 of AS 5100 Part 2, the bridge classification was BEDC-2. The code only requires vertical earthquake loads to be considered for spans greater than 35 metres for this category.
ANALYSIS RESULTS
The fundamental period for each structure, and the horizontal deflection at the ground surface above the arch crown under 1.0g horizontal acceleration, o, are shown in Table 1. Regression analysis showed that the fundamental period may be estimated using the relationship: T = 0.055 o0
·5
•
This relationship was found to give results within 2 percent of those found from the dynamic fundamental period analysis in this case, and has been found by the author to give reliable results for a range of other buried structures.
The results of the analyses for bending moments are summarised in Figures 2 to 7. The response spectrum maximum moments were higher in general, by up to about 50%. Maximum horizontal deflections at the crown were 90 mm for 3 metres cover and 103 mm for 15 metres cover.
Elastic Reduced soil Reduced both
Elastic Reduced soil Reduced both
3 metres cover Period, T ~ 0.055 ~0·5 Stat T /Dyn T
0.605 119 0.600 99.1% 0.850 231 0.836 98.4% 0.853 233 0.840 98.4%
15 metres cover 0.999 341 1.016 101.7% 1.405 679 1.433 102.0% 1.408 680 1.434 1 01.8%
Table 1, Fundamental Period, T
Page 25-3
c 0.261 0.209 0.208
0.188 0.149 0.149

The greater axial load in the arch under 15 metres of cover resulted in a greatly reduced ductility (Figure 8). The maximum horizontal displacement of this structure in the push-over analysis was approximately 190 mm, with a maximum bending moment of 590 kNm (Figure 9). The ductility ratio (curvature capacity I maximum curvature) was 23 for 3 metres cover and 3.4 for 15 metres cover under horizontal earthquake loading.
The seismic increment in axial load under vertical earthquake loading was about 350 kN for 3 metres cover, and 1100 kN for 15 metres cover. The results of the pseudo-static analysis were within about 10% of the response spectrum analysis. The ductility ratio reduced to 17 for 3 metres cover and 2.8 for 15 metres cover under combined horizontal and vertical loading.
CONCLUSIONS AND RECOMMENDATIONS
Buried arch structures with low to moderate axial load are unlikely to fail under earthquake loading, because of the large reserve ductility available in the concrete section. However where axial loads are sufficiently high for the failure mode to be concrete compression failure there is little reserve ductility, and failure under earthquake loading is a possibility. It is therefore recommended that the structure classification be related to fill height, rather than span, and that the Structural Response Factor, Rr, be reduced for structures with high axial load. For concrete structures it is suggested that Rc be related to the capacity reduction factor, cjl, such that Rc = 5 where cjl = 0.8, reducing to Rr = 1.5 where cjl = 0.6. The Rr factor for vertical loads should be 1 for all buried structures.
It is suggested that structures in BEDC-1 and BEDC-2 be designed for vertical earthquake loads only, using either a pseudo-static or dynamic analysis, and that those in BEDC-3 and BEDC-4 be designed for combined vertical and horizontal earthquake loads using a dynamic analysis.
The fundamental period of buried structures should be determined either from a recognised theoretical approach, or for structures in BEDC-1 or BEDC-2 by application of the formula: T = 0.055 o0
·5 where o is the horizontal deflection in millimetres of the
ground surface above the arch ground when subject to a horizontal acceleration of 1g.
REFERENCES
(1) Australian Standard Bridge Code, AS 5100, Standards Australia, 2004 (2) Australian Standard Loading Code, Part 4, AS 1170.4, Standards Australia 1993 (3) BYRNE, PETER M., D. L. ANDERSON, and HENDRA JITNO Seismic Analysis of Large Buried Culvert Structures, Transportation Research Record 1541, TRB, National Research Council, Washington, D.C., 1996, pp. 133-139. (4) WOOD, J and JENKINS D, Seismic Analysis of Buried Arch Structures, World Congress on Earthquake Engineering, Auckland, 2000
Page25- 4
tro +-~~-4-------+------4-------~-----4 E ,:;-~ ·-"-~ 1001 tff~==~~~~~~;'~;-----~------~----~ .z w +~'' ! 'Y ....... ~ ~ ~ o~---+----~~~~---~~H~~~~ t ~~--+---~--~.~~~~~~~~-----4 ,. -100 ~-----1-------+--------'l~So<"-.-'-4:--------1
~./ -160+-------l-------t-------+:=.----1------1
-m+-----~-------+------~------~----~ 0.0 50 100 20.0 25.0
DlaUnce .-ound om:h. m
Figure 2: Pseudo-static 3m cover
~-------------.----------~------------,
ooo t-----------+--~
160
r] ~ E 100 i i .. ~ 0 :I ............ ~ I!'~
lli I1Il@1 ~ "' = E ! -100 - lL t--
-ISO
t:::: -3>0
_...,
Figure 4: Maximum moments, 3m cover 250,------,-------.------.-------.------,
200 -150 \
i 100 / / ...--. ... ,
i " /.L ~"\. ~0~ ~ ~ . ., \ ~--t.
-.; '" P""/ ! - too1---t----l----lf'.:-\~1 ~,.---,.;t"--;r'/ "---1 _,., ~-----1-------+------1-"'-"'..,..YL------J
-r-----+-----+-----1-~\ ~11-----~ ·~-""''-------"o.:...._ ____ .;_,>;;o ______ ~, .;_0 ____ ~_· .:>;;. 2 .0 ____ ___::] • • 0
____._ DyrDmlc. Un • 0 }'1\' t«l.eo::l aoil Ill~ - Oot1\ redLCed soll&beam &tiff l
600
e ll!ooo i ~~
~300 ,; ~200 ,.
100
Figure 6: Response Spectrum 15m cover
. . :1 '
.I
.
.
om
... , !
\ \
.... O.DS
Curvature rn-1
. ·-0.00
...,. P=IOG kN + P::JOOI kN
......
Figure 8: Moment-Curvature
0.1
Page 25-5
-~ -~------l------~------4-----~~----~ o.o 50 10.0 1~0 20.0
Figure 3: Response Speclrum 3m cover m
160 ,-;__, 100
E Ill~ i ..
f ~ [7 ~ 0
\\ I :I ..., I!' ,, A ~ i ·1 00 ,. 00 ~ 1 .0 ·~2 ~ ]" "-:../ 2 • _,.,
I\.....,/ ·200
'-,.?" -250 J._ ____ _l ______ __L ______ .J_ ______ L_ ____ _j
1-+-S!andatd - -Fiodl;edsoUstlhss ~RedLCGdocllardboonulltl l
Figure 5: Pseudo-static 15m cover
250
200
160
~ ~ 100
~ I f .. l :I 0 - R__, !;;;;;;:
f""' = I=:: ~ ,. ::::: ~ ·150 - ~
=
Pigure 7: Maximum momems, 15m cover
J ~ t---1::,.,...-f"""__.~---+--+---t---1--+--1-~ f : .J-,...-r'-ll-......_---f~.::-~ ........... c-,---J---1---+-+--+---I «0+--+-+--+-~~-~~----=F~~~--·~~ «0 +---~--~~~~~--l----l---4---+---+--~
0.0 20,0 40,0 600 80.0 1000 120.0 1<40.0 100.0 11300 200.0
CtownX Dlllpl.a.ment.. rnn
1---MnMxnant --Lb:ll:~~
Fjgure 9: Push-over Analysjs 15m cover

RELATIVE DISPLACEMENT RESPONSE OF BRIDGE GIRDERS DURING STRONG SEISMIC EXCITATION
HONG HA01 AND NA WA WI CHOUW
2
1 SCHOOL OF CIVIL AND RESOURCE ENGINEERING, THE UNIVERSITY OF WESTERN AUSTRALIA,
35 STIRLING HIGHWAY, CRAWLEY, WA 6009, AUSTRALIA 2FACULTY OF ENVIRONMENTAL SCIENCE AND TECHNOLOGY, 0KA Y AMA UNIVERSITY, JAPAN
AUTHORS:
Hong Hao is a professor of structural dynamics in the School of Civil and Resource Engineering, the University of Western Australia. He received his PhD degree in Department of Civil Engineering, University of California at Berkeley. Before joining UWA in 2002, he worked as a post-doc researcher in Seismographic Station in UC Berkeley and was an associate professor in Nanyang Technological University in Singapore. His research interests are structural dynamics, earthquake and blast engineering.
Nawawi Chouw is an associate professor in the Faculty of Environmental Science, Okayama
University in Japan. He received all his academic education in the Ruhr University Bochum in
Germany, and received the Dr-Ing Degree in 1993. He joined Okayama University in 1994 as a
Research Associate, and was re-appointed as an Assistant Professor in 1997, and promoted to
Associate Professor in 1999. His research interests include structural dynamics, earthquake
engineering, wave propagation and vibration reduction.
ABSTRACT:
The significance of the ground motion spatial variation, soil-structure interaction (SSI)
and pounding in relative displacement response between bridge girders is presented.
The ground motions are simulated stochastically according to the Japanese design
regulation. The bridge and subsoil are modeled using a combined finite element and
boundary element method. The study shows that the non-uniform ground movements;
SSI and poundings can strongly amplify the relative displacement responses.
PaperNo. 26

Relative Displacement Response of Bridge Girders During Strong Seismic
Excitation
Hong Hao1 and Nawawi Chouw2
1School of Civil and Resource Engineering, The University ofWestem Australia, 35 Stirling Highway, Crawley, WA 6009, Australia
2Faculty of Environmental Science and Technology, Okayama University, Japan
ABSTRACT
The significance of the ground motion spatial variation, soil-structure interaction (SSI) and pounding in relative displacement response between bridge girders is presented. The ground motions are simulated stochastically according to the Japanese design regulation. The bridge and subsoil are modeled using a combined finite element and boundary element method. The study shows that the non-uniform ground movements; SSI and poundings can strongly amplify the relative displacement responses.
1. INTRODUCTION
Damages of bridge structures have been observed in many major earthquakes, e.g. the 1994 Northridge earthquake and 1995 Kobe earthquake. Large relative displacements between adjacent bridge girders can cause severe pounding damage at bridge decks or unseating of bridge girders due to an insufficient seat length. Relative displacements occur because 1) the bridge girders have different dynamic properties, 2) the foundations of the bridge pier experience asynchronous ground excitations, and 3) the supporting ground can have unequal influence on each bridge piers. So far there is no specific and effective method to mitigate bridge girder pounding damage or unseating in the design guidelines, asides from some artificial measures such as limiting the difference between the vibration frequencies of the adjacent spans [e.g. Caltrans regulations 1999]. None of those measures were derived from rigorous analysis of relative responses of bridge girders. Our investigation showed that limiting the natural frequency ratio of the adjacent bridge structures alone is not sufficient to prevent pounding or unseating damage since the effects of ground motion spatial variation and soil-structure interaction (SSI) also play an important role and depend on their relationship with the natural frequency of each participating structures rather than the structural vibration frequency ratio [Chouw and Hao, 2004]. So far only a few researchers have studied the relative displacement responses between bridge decks [e.g. Ruangrassamee and Kawawshima 2001 and Zhu et al. 2004], however, in their study the ground motion spatial variation and SSI were not considered. This paper presents some preliminary results of relative displacement response spectra derived with a consideration of differences between adjacent bridge girder vibration properties, ground motion spatial variation, poundings and SSI.
Page 26-1
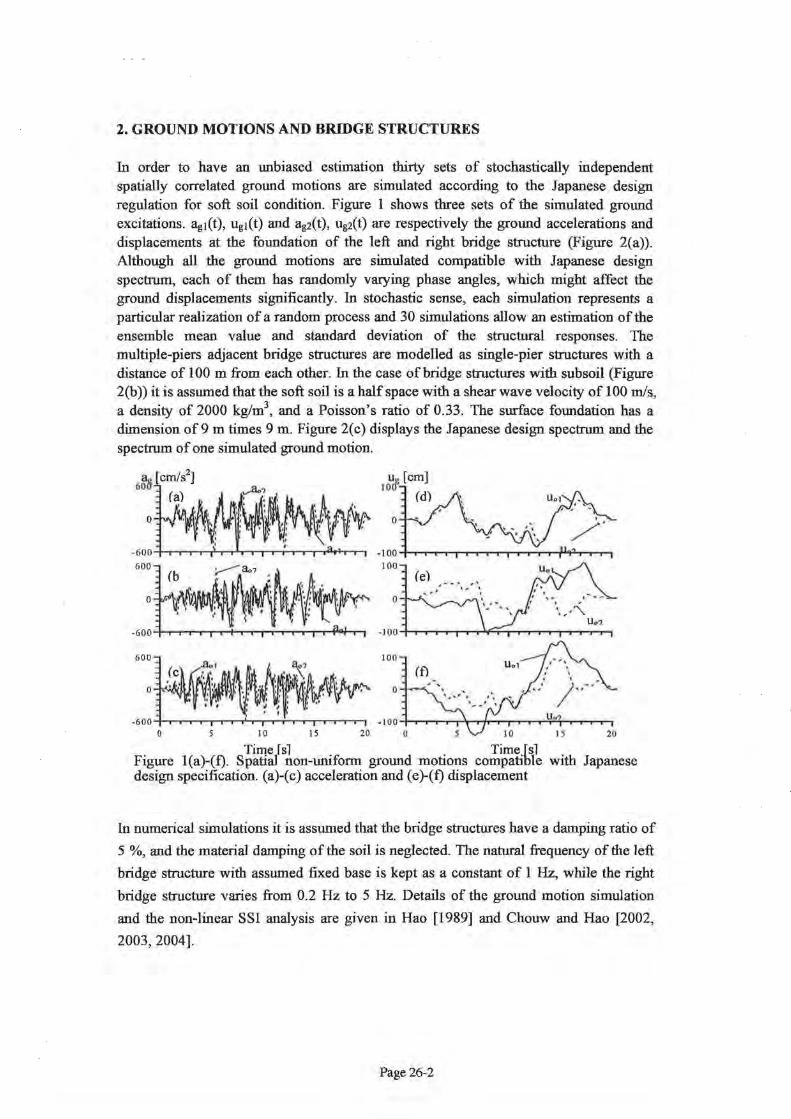
2. GROUND MOTIONS AND BRIDGE STRUCTURES
In order to have an unbiased estimation thirty sets of stochastically independent spatially correlated ground motions are simulated according to the Japanese design regulation for soft soil condition. Figure 1 shows three sets of the simulated ground excitations. ag1(t), UgJ(t) and ag2(t), ug2(t) are respectively the ground accelerations and displacements at the foundation of the left and right bridge structure (Figure 2(a)). Although all the ground motions are simulated compatible with Japanese design spectrum, each of them has randomly varying phase angles, which might affect the ground displacements significantly. In stochastic sense, each simulation represents a particular realization of a random process and 30 simulations allow an estimation of the ensemble mean value and standard deviation of the structural responses. The multiple-piers adjacent bridge structures are modelled as single-pier structures with a distance of 100m from each other. In the case ofbridge structures with subsoil (Figure 2(b)) it is assumed that the soft soil is a half space with a shear wave velocity of 100 m/s, a density of 2000 kg/m3
, and a Poisson's ratio of 0.33. The surface foundation has a dimension of9 m times 9 m. Figure 2(c) displays the Japanese design spectrum and the spectrum of one simulated ground motion.
0 0
-60 0 -h.--.--.-.-T-.-r ......... .--.-..-.--.-...-r~rl-r-T-, -I 00 -t-~-r-r-.-.-r~r-r..-.--.-..-1-"t''-or-r.,...., 100 600
600
0
0 I 0 15 20 0 1 0 20
Time fsl Time fsl Figure 1(a)-(f). Spatial non-uniform ground motions compatible with Japanese design specification. (a)-( c) acceleration and (e)-( f) displacement
In numerical simulations it is assumed that the bridge structures have a damping ratio of
5 %, and the material damping of the soil is neglected. The natural frequency of the left
bridge structure with assumed fixed base is kept as a constant of 1 Hz, while the right
bridge structure varies from 0.2 Hz to 5 Hz. Details of the ground motion simulation
and the non-linear SSI analysis are given in Hao [1989] and Chouw and Hao [2002,
2003,2004].
Page 26-2

(a)
X I I X 12
0.4 0.8 1.2 1.6 Frequency [Hz]
._. u,(t) o' "T <I : --(t) " --(t) llg1(l), UgJ(t) ... ""~~" ' -s-<
~ u1(t ) oru, (t)
(b) Fixed base Subsoi
8 Design specification
4 D=S%
o~~~~~~~~~~~~~~
(c) 0 2 2.4
Figure 2(a)-(c). Bridge system and design spectrum. (a) Bridge model, (b) SDOF model with fixed base and subsoil, and (c) Design spectrum
3. RELATIVE DISPLACEMENT RESPONSES
Figure 3(a) shows the ensemble mean maximum relative displacement Urel,max obtained from thirty analyses when the bridge structures are fixed at base and only ground accelerations, or dynamic responses, are considered. The relative displacement is defined as l(u2 -uJ)I.
Urel max [m] 1.6.
1.2
0.8
0.4
Fixed base
Non-uniform excitation ligl (t), llg2(t)
excitation 0~~rT~TO,~FrrrTT~~~~
(a)
1.6
1.2
0.8
0.4
Non-uniform excitation llg! (t), llg2(t)
Ufll! , max [m] 1.6.
1.2
0.8
0.4
Uniform excitation
..,./'" SSI
O~rrrr~~~~~~~~~rr~
(b)
4 Non-uniform excitation with 3 quasi -static response
2
0~~~~~~~~~ 0
(c) 4 5 0 4 5
(d)
Figure 3(a)-(d). Effect of spatial non-uniform ground accelerations, ground displacements, soil-structure interaction, and poundings (Gap= 20 em)
The grey bold line is the result obtained from the current common practice with uniform ground acceleration as excitation. As expected, at the frequency ratio of 1.0 no relative displacement exists since both bridge structures have the same natural frequency, the girders respond in phase. In contrast, a consideration of spatial ground motion variation causes a non-zero relative displacement. This result shows the significance of the non-uniform ground excitation. The current design practice recommends that for mitigating the relative displacement effect both neighbouring spans should have natural frequencies as close as possible. This recommendation can clearly leads to wrong safety
Page 26-3
presumption. Figure 3(b) shows that the SSI has especially strong influence on stiffer bridge structures. Similar simulation is performed using non-uniform ground accelerations as ground excitation (Figure 3(c)). Figure 3(d) shows the strong contribution of the quasi-static response due to the non-uniform ground displacements. The result demonstrates the importance of considering ground motion spatial variation and SSI effect in estimating the relative displacements for predicting the bridge unseating and pounding potentials.
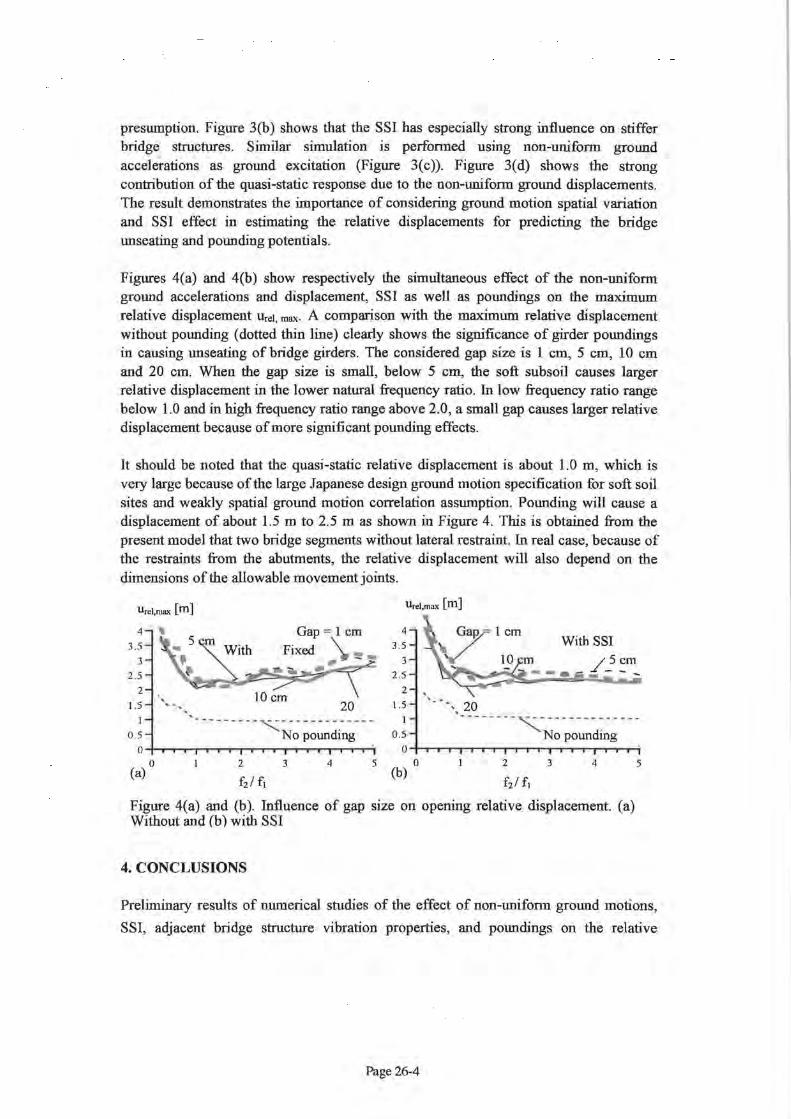
Figures 4(a) and 4(b) show respectively the simultaneous effect of the non-uniform ground accelerations and displacement, SSI as well as poundings on the maximum relative displacement Urel, max· A comparison with the maximum relative displacement without pounding (dotted thin line) clearly shows the significance of girder poundings in causing unseating of bridge girders. The considered gap size is 1 em, 5 em, 10 em and 20 em. When the gap size is small, below 5 em, the soft subsoil causes larger relative displacement in the lower natural frequency ratio. In low frequency ratio range below 1.0 and in high frequency ratio range above 2.0, a small gap causes larger relative displacement because of more significant pounding effects.
It should be noted that the quasi-static relative displacement is about 1.0 m, which is very large because of the large Japanese design ground motion specification for soft soil sites and weakly spatial ground motion correlation assumption. Pounding will cause a displacement of about 1.5 m to 2.5 m as shown in Figure 4. This is obtained from the present model that two bridge segments without lateral restraint. In real case, because of the restraints from the abutments, the relative displacement will also depend on the dimensions of the allowable movement joints.
Urel,max [ ffi) Urel,max [ m)
4 4
3.5 Fixed 3.5 With SSI
3 3
2.5 2 .5
2 2
1.5 1.5 ' ' 20
' I ---------~-------------0.5 No pounding 0 .5
-- ----- -~- -- ----- -- ----No pounding
0 0 0 2 3 4 50 2 3 4 5
(a) f2/f1 (b) f2/f,
Figure 4(a) and (b). Influence of gap size on opening relative displacement. (a) Without and (b) with SSI
4. CONCLUSIONS
Preliminary results of numerical studies of the effect of non-uniform ground motions,
SSI, adjacent bridge structure vibration properties, and poundings on the relative
Page 26-4

displacement response of a bridge structure are presented. It is found that the common
analysis procedure by assuming uniform ground acceleration and neglecting the
soil-structure interaction will underestimate the relative displacement responses between
adjacent bridge girders, especially when the ground is soft and the ground motions have
low dominant frequencies. The spatial variation of the ground accelerations and also of
the ground displacements together with the soft subsoil and pounding can strongly
amplify the relative displacement responses. A development of relative displacement
response spectrum for design purpose should include all these parameters.
REFERENCES
Caltrans Seismic Design Criteria, Design manual - version 1.1 (1999) California Department of Transportation, Sacramento, California.
Chouw, N. (2002) Influence of soil-structure interaction on pounding response of adjacent buildings due to near-source earthquakes, J. of Applied Mechanics, Vol. 5, pp. 545-553.
Chouw, N., Hao, H. (2003) Effect of simultaneous spatial near-source ground excitation and soil on the pounding response ofbridge girders, J. of Applied Mechanics, Vol. 6, pp. 779-788.
Chouw, N., Hao, H. (2004a) Influence of SSI and frequency content of non-uniform ground motions on bridge girder poundings, J. of Applied Mech., Vol. 7, pp841-851.
Chouw, N., Hao, H. (2004b) The role of soil, structural and non-uniform ground motion characteristics in causing poundings between bridge girders, Al-Azhar University Engineering Journal (in review).
Hao, H. (1989) Effects of spatial variation of ground motions on large multiply-supported structures, Report No. UCB-EERC 89/06, UC Berkeley.
Japan Society of Civil Engineering, (2000) Earthquake resistant design codes in Japan, Maruzen Co., Ltd., Tokyo, ISBN 4-8106-0266-4.
Ruangrassamee, A., Kawawshima, K. (2001) Relative displacement response spectra with pounding effects, Earthquake Engineering and Structural Dynamics, Vol. 30, pp. 1511-1538.
Zhu P, Abe M, Fujino Y. (2004) Evaluation of pounding countermeasures and serviceability of elevated bridges during seismic excitation using 3D modeling. Earthquake Engineering and Structural Dynamics, Vol. 33: 591-609.
Page 26-5
SEISMIC RESPONSE OF BUILDING STRUCTURES USING EMBEDDED DAMPERS
JULIUS MARK0 1, DAVID THAMBIRATNAM1 AND NIMAL PERERA 2
SCHOOL OF CIVIL ENGINEERING, QUEENSLAND UNIVERSITY OF TECHNOLOGY1 AND
ROBERT BIRD & PARTNERS, INTERNATIONAL CONSULTING ENGINEERS2
AUTHORS:
David Thambiratnam is Professor of Structural Engineering in the School of Civil
Engineering at QUT. His research interests are in the areas of structural dynamics, seismic
engineering, bridge dynamics and dis~ster mitigation. He has more than 150 papers in this area
published in Journals and refereed conference proceedings.
Nimal Perera is a Director of Robert Bird & Partners, International Consulting Engineers and
an Adjunct Professor in the School of Civil Engineering at QUT. During the past 10 years he
has been involved in several research projects at QUT.
Julius Marko has Bachelors degree in 1992 from the Slovak Technical University and has 15
years industrial experience. At present he is a full time postgraduate research student in the
School of Civil Engineering at QUT.
ABSTRACT:
The paper investigates the response of high rise frame-shear wall structures under simulated earthquake loads with dampers embedded within cut-outs ofthe shear walls. Friction dampers, viscoelastic dampers and hybrid dampers with combined frictionviscoelastic properties are considered. The stiffness of the cut out section within the shear wall is replaced by the stiffness and damping of the device. Finite element techniques are used to model the dampers and the structures and to obtain the dynamic response under the earthquake excitations Influence of damper properties such as stiffuess, damping coefficient, location, configuration and size are evaluated using time history responses obtained under five different earthquake records. Results for reductions in tip accelerations and deflections were obtained. The study has demonstrated the feasibility of using embedded dampers to mitigate the adverse seismic response of building structures. As the natural frequencies of these structural models were within the frequency range of the dominant modes of the earthquakes, this study treated resonant vibration. It has been demonstrated that it is possible to mitigate the adverse seismic effects of structures, even under resonant conditions.
PaperNo. 27

1. INTRODUCTION
In order to control the vibration response of high rise buildings during seismic events, passive damping devices are most commonly used for energy absorption. Today there are several types of manufactured dampers available in the market, which use a variety of materials and designs to obtain various levels of stiffness and damping. Some of these include viscoelastic (VE), viscous fluid, friction and metallic yield dampers. They have different dynamic characteristics and hence influence the structural response differently. This paper investigates the seismic response of building structures with dampers embedded within shear walls. Three types of dampers, VE, friction and hybrid (which is a combination of the friction and VE types) are considered in different configurations and at different locations in the structure. Structural response in terms of tip deflections and accelerations are obtained under five different earthquake records.
2. MODEL DESCRIPTION
2.1 DAMPER PROPERTIES
Finite Element (FE) methods have been used to model and analyse the effects of these three types of damping devices on the seismic response of the structures. To study the effectiveness of the various damping systems, tip accelerations and displacements of the damped structure are obtained from the time history analyses and compared with those of the undamped structure. The displacement dependant friction dampers were modeled with frictional contact between two tubes which slide one inside the other. The extended version of the classical isotropic Coulomb friction model is provided in the FE computer program ABAQUS used in this analysis. The velocity dependant VE dampers were modeled as a linear spring and dash-pot in parallel (known as the Kelvin model) where the spring represents stiffness and the dashpot represents damping. Hybrid damping systems were modeled as a combination of VE and a friction damper in series.
2.2 DESCRIPTION OF THE MODELS
The structural models, treated in this paper have been represented by shear walls and frame shear walls. These shear walls were modelled using two-dimensional shell elements, while the frames were modelled with beam elements. The dimensions of the shear wall were representative of typical multistorey buildings being 96 m high, 15 m wide and 0.5 m thick. Concrete material properties were chosen with a compressive strength,.fc of32 MPa, Young's modulus, Ecof30,000 MPa, Poisson's ratio, v of 0.2, and density, pof 2500 kg/m3
• Structural steel was used to model friction dampers with density, p of 7700 kg/m3
• A total of five different damping systems were considered. Seismic analyses of the shear walls were carried out with one type of damping system at a time. Three different configurations of the VE and friction dampers were considered- diagonal, chevron brace and a hybrid configuration consisting of the friction damper oriented horizontally and the VE damper mounted diagonally. Furthermore, four different damper placements were used to study the influence of location on the seismic response of these models. These are designated by xoo, oxo, oox and xxx in which the damper is placed in the
Page 27-1

lower, middle, upper and in all three parts of the structure respectively, as shown in the Fig.l.
I\5,Um: I\5.Um; t 15.0m j I l>.om I i'Th,Wb)
'~....-0~t•~C...UE1~ c. • . . ., : ~ .
~ Jj • Fridioa Oamp:::z- VE 0.-npa-
Figure 1: Placement of dampers within shear walls.
2.3 DESCRIPTION OF THE DAMPING SYSTEMS
Details of the diagonal friction damper located within the shear wall can be seen in Fig.2, where a 12.00x12.46m wall section has been cut out and replaced by a diagonal friction damper.
15.00 ~~ -~~----=12=,00-----~~
Figure 2: Structural details offriction dampers- diagonal configuration
This damper was modelled as a pair of diagonal pipes each with a thickness of 50mm, and with one pipe placed within the other. Both pipes were modelled using shell elements. The outer tube has an inner diameter of 200mm and length 14.5m, while the inner tube has an outer diameter of 198 mm and length 15m. The contact area in the unloaded state was 16.4 m2 and the coefficient of friction between the pipes was 0.25. The connection between each pipe and the shear wall was modelled using a MPC (Multi-Point Constraint) PIN type connecting element, which provides a pinned joint between two nodes. A MPC SLIDER type connecting element was chosen to ensure frictional sliding between the pipes in a determined direction. Using the equations of Abbas and Kelly (1993) and the average fundamental frequency of the various damped models, the VE damper properties to be used in all the damped models were determined as kd= 100 x 106 N/m and Cd= 100 x 106 Ns/m. This was for a double layer damper in parallel with dimensions of 1 ,540mm by 300mm by 10 mm and values G' = 0.865,917 MPa and G" = 1.230,517 MPa.
Page 27-2
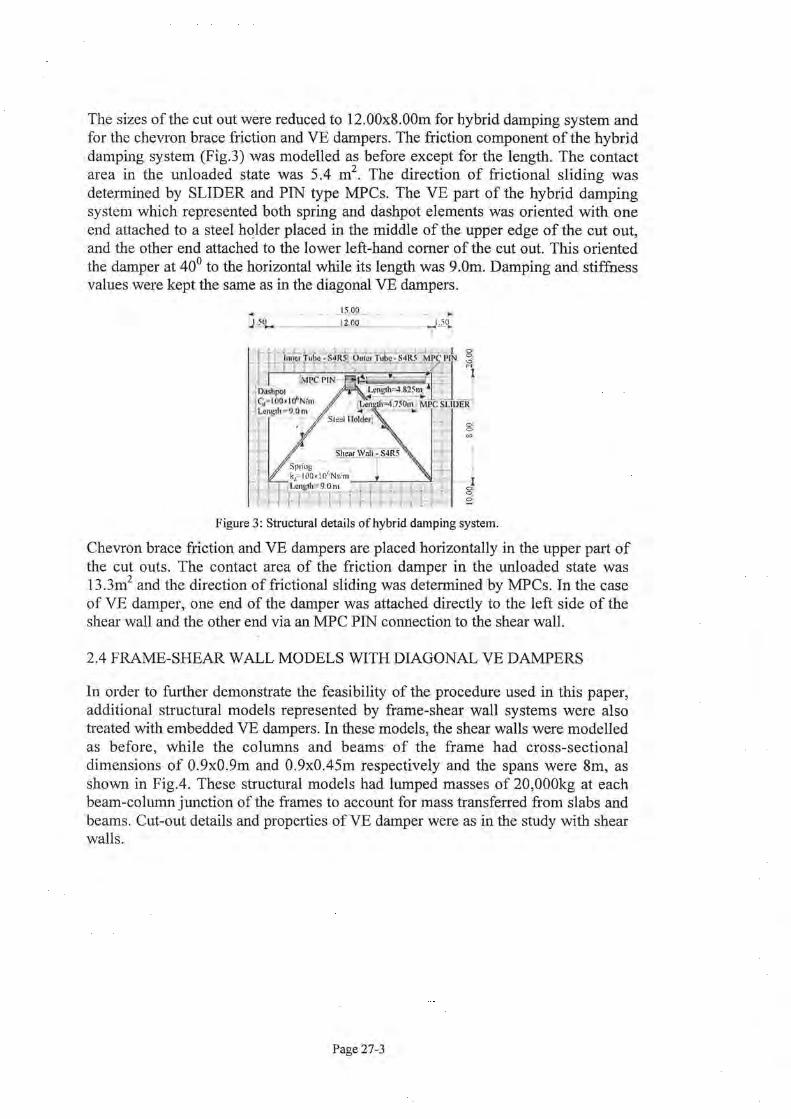
The sizes of the cut out were reduced to 12.00x8.00m for hybrid damping system and for the chevron brace friction and VE dampers. The friction component of the hybrid damping system (Fig.3) was modelled as before except for the length. The contact area in the unloaded state was 5 .4 m2
. The direction of frictional sliding was determined by SLIDER and PIN type MPCs. The VE part of the hybrid damping system which represented both spring and dashpot elements was oriented with one end attached to a steel holder placed in the middle of the upper edge of the cut out, and the other end attached to the lower left-hand comer ofthe cut out. This oriented the damper at 40° to the horizontal while its length was 9.0m. Damping and stiffness values were kept the same as in the diagonal VE dampers.
4 15 00
J.10- ----'-"120_0 _
Figure 3: Structural details of hybrid damping system.
Chevron brace friction and VE dampers are placed horizontally in the upper part of the cut outs. The contact area of the friction damper in the unloaded state was 13.3m2 and the direction of frictional sliding was determined by MPCs. In the case of VE damper, one end of the damper was attached directly to the left side of the shear wall and the other end via an MPC PIN connection to the shear wall.
2.4 FRAME-SHEAR WALL MODELS WITH DIAGONAL VE DAMPERS
In order to further demonstrate the feasibility of the procedure used in this paper, additional structural models represented by frame-shear wall systems were also treated with embedded VE dampers. In these models, the shear walls were modelled as before, while the columns and beams of the frame had cross-sectional dimensions of 0.9x0.9m and 0.9x0.45m respectively and the spans were 8m, as shown in Fig.4. These structural models had lumped masses of 20,000kg at each beam-column junction of the frames to account for mass transferred from slabs and beams. Cut-out details and properties ofVE damper were as in the study with shear walls.
Page 27-3
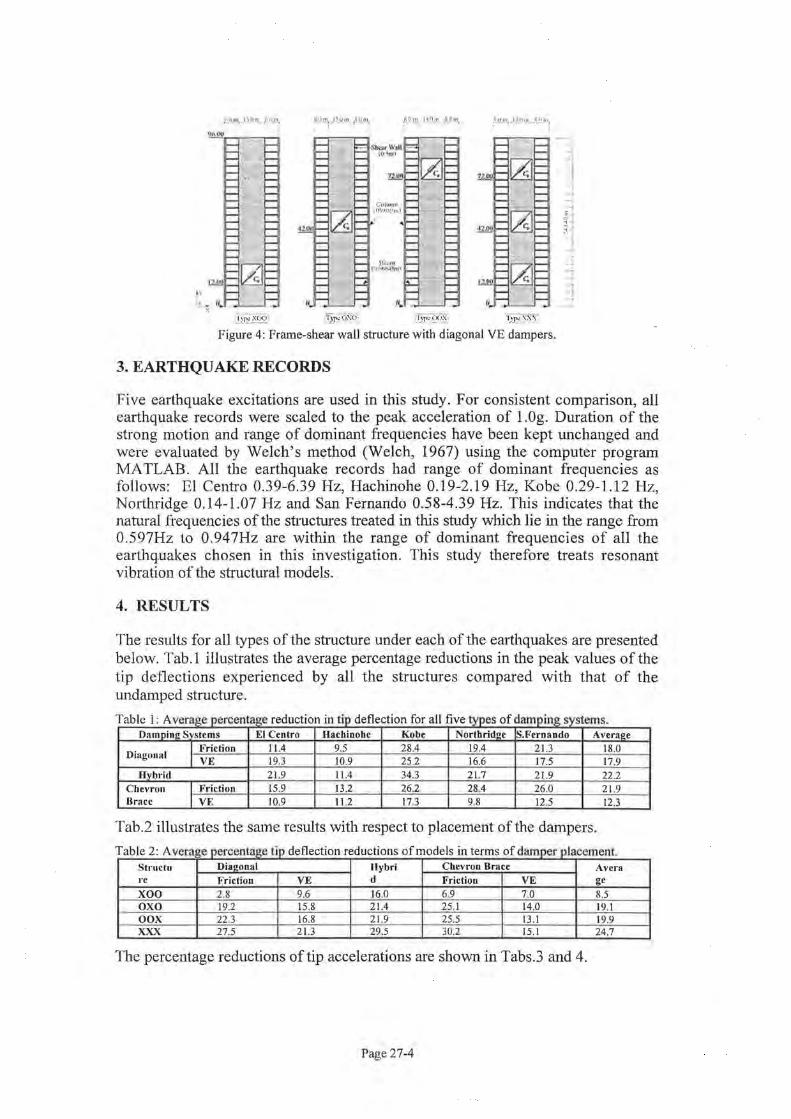
Figure 4: Frame-shear wall structure with diagonal VE dampers.
3. EARTHQUAKE RECORDS
Five earthquake excitations are used in this study. For consistent comparison, all earthquake records were scaled to the peak acceleration of l.Og. Duration of the strong motion and range of dominant frequencies have been kept unchanged and were evaluated by Welch's method (Welch, 1967) using the computer program MA TLAB. All the earthquake records had range of dominant frequencies as follows: El Centro 0.39-6.39 Hz, Hachinohe 0.19-2.19 Hz, Kobe 0.29-1.12 Hz, Northridge 0.14-1.07 Hz and San Fernando 0.58-4.39 Hz. This indicates that the natural frequencies of the structures treated in this study which lie in the range from 0.597Hz to 0.947Hz are within the range of dominant frequencies of all the earthquakes chosen in this investigation. This study therefore treats resonant vibration of the structural models.
4. RESULTS
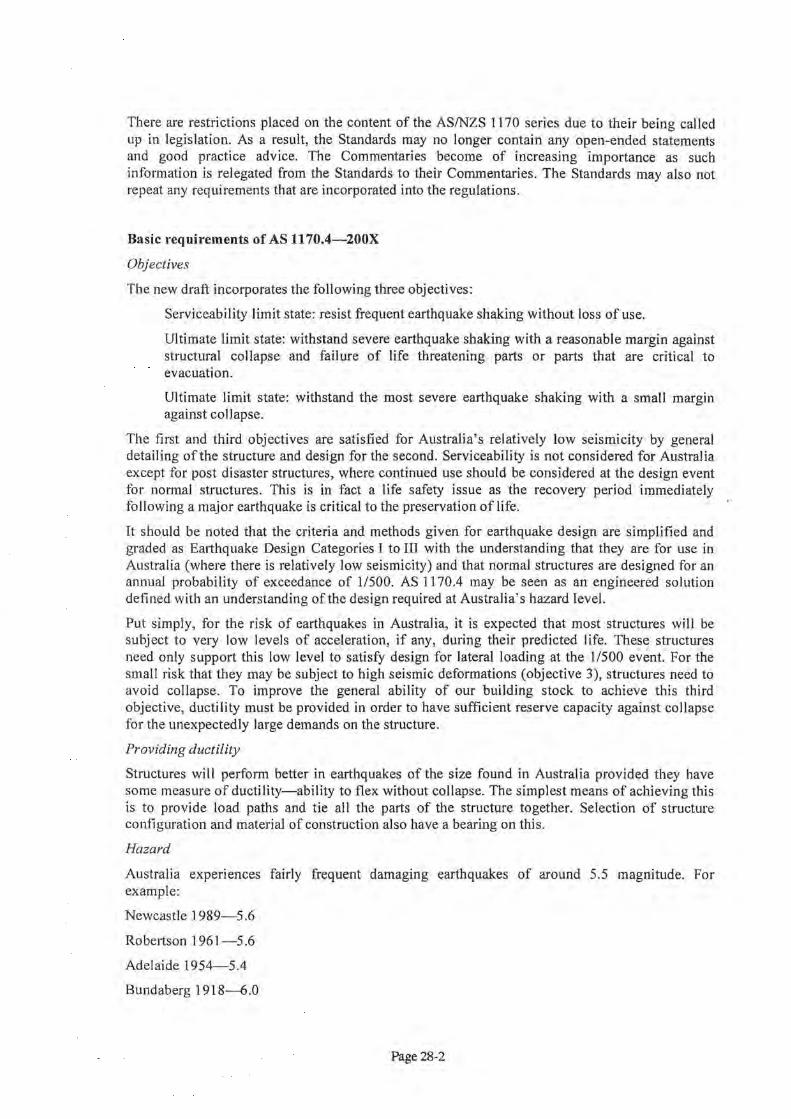
The results for all types of the structure under each of the earthquakes are presented below. Tab.1 illustrates the average percentage reductions in the peak values of the tip deflections experienced by all the structures compared with that of the undamped structure.
Table 1: Average percentage reduction in tip deflection for all five types of damping systems. Dam pine Systems El Centro Hachinobe Kobe Northridee ls.Fernando Averaee
Diagonal I Friction I 1.4 9.5 28.4 19.4 21.3 18.0 I VE 19.3 10.9 25.2 16.6 17.5 17.9
Hybrid 21.9 11.4 34.3 21.7 21.9 22.2 Chevron I Friction 15.9 13.2 26.2 28.4 26.0 21.9 Brace I VE 10.9 11.2 17.3 9.8 12.5 12.3
Tab.2 illustrates the same results with respect to placement of the dampers.
T bl . d fl d f d I . f d I a e 2: Avera e percentage t1p e ect10n re uct10ns o mo e s m terms o am per pJ acernent. st.·uctu Diaeonal Hybri Chevron Brace Avera re Friction VE d Friction VE ge
XOO 2.8 9.6 16.0 6.9 7.0 8.5 oxo 19.2 15.8 21.4 25.1 14.0 19.1 oox 22.3 16.8 21.9 25.5 13 .1 19.9 XXX 27.5 21.3 29.5 30.2 15.1 24.7
The percentage reductions oftip accelerations are shown in Tabs.3 and 4.
Page 27-4

Table 3: Average percentage reductions in tip acceleration for all five types of damping systems. Dam pine: Systems El Centro Hacbinohe Kobe Northride:e S.Fernando Averae:e
I Friction 35.2 44.7 40.3 45.4 48.6 42.8 Diagonal I VE 31.1 44.7 27.4 34.8 43.6 36.3
Hybrid 17.4 41.4 33J 34.4 37.6 32.8
Chevron I Friction 5.9 24.3 9.8 30.0 20.6 18.1 Brace I VE 24.7 33.3 23.3 24.5 25.0 26.2
T bl 4 A a e d verage percentage t1p acce eratton re uct10ns o f d I . mo e s m terms o fd amper placement. Diae:onal
Hybrid Chevron Brace
Average Structure Friction VE Friction VE
xoo 54.1 51.5 41.8 27.6 37.7 42.5 oxo 40.5 32.1 27.8 u.s 21.3 27.1 oox 29.1 9.4 13 .6 16.0 14.0 16.4 XXX 53.1 44.4 36,3 15.1 31.6 36.1
The additional frame-shear wall structural models discussed in section 2.4 were analysed with VE dampers embedded at locations similar to that in the study with shear walls and subjected to the same earthquake records. The natural frequencies of these models (0.434-0.727Hz) were also within the frequency range of dominant modes of the all treated earthquakes. Results are presented in Tabs.5 and 6.
. . d fl fti h II d I Table 5: ·Percentage reduct1ons m t1p e echon o rame-s ear wa moe s Damper Location El Centro Hachinohe Kobe Northridge S. Fernando Averae:e
xoo 22.6 4.8 20.0 16.2 23.1 17.3 oxo 13.2 15.4 24.1 16.2 20.1 17.8 oox 23.3 13.3 8.5 9.9 15.3 14.1 XXX 31.2 7.2 45.4 23.9 45.7 30.7
T bl 6 P a e d ercentage re uct10ns m t1p acce eratton o ffr h ame-s earwa ll d I mo e s Damper Location El Centro Hachinohe Kobe Northridge S. Fernando Averae:e
xoo 39.7 30.3 47.8 45.9 72.8 47.3 oxo 7.8 5.1 45.4 20.5 53.3 26.4 oox -I 1.3 21.1 15.9 9.0 29.1 12.8 XXX 37.7 46.9 51.4 61.0 76.4 54.7
4. CONCLUSION
In this conceptual study a number of analyses of two different structure types fitted with different damping systems and under different earthquake records have been carried out to gain a better understanding of the effectiveness of the dampers and their placement. The first modes of vibration of all structural models had frequencies within the range of dominant frequencies of the treated earthquakes. Hence this study investigated the effectiveness of dampers in resonant vibration under seismic loads. It has been demonstrated that it is possible to improve the structural performance under these conditions, by using embedded dampers. Work is still in progress and important and interesting results will be presented later on.
REFERENCES
Abbas, H. and Kelly, J.M., A Methodology for Design of Viscoelastic Dampers in Earthquake-Resistant Structures. Technical Report UCB/EERC-93/09, Earthquake Engineering Research Center, University of California, Berkeley (1993). Welch, P.D, 'the use of fast Fourier transform for the estimation of power spectra: a method based on time averaging over short, modified periodograms' IEEE Trans. Audio Electroacoust. Vol.AU-15 (June1967) pp 70-73.
Page 27-5

Figures: Figure 1: Placement of dampers within shear walls. Figure 2: Structural details of friction dampers - diagonal configuration. Figure 3: Structural details of hybrid damping system. Figure 4: Frame-shear wall structure with diagonal VE dampers.
Tables: Table 1: Average percentage reduction in tip deflection for all five types of damping systems. Table 2: Average percentage tip deflection reductions of models in terms of damper placement. Table 3: Average percentage reductions in tip acceleration for all five types of damping systems. Table 4: Average percentage tip acceleration reductions of models in terms of damper placement. Table 5: Percentage reductions in tip deflection of frame-shear wall models Table 6: Percentage reductions in tip acceleration of frame-shear wall models

INTRODUCTION TO THE REVISION OF AS 1170.4
AUTHOR:
RICHARD WELLER CARDNO CENTRAL COAST (GoSFORD)
Richard Weller has recently joined Cardno at Gosford as Senior Structural Engineer. Before this, Richard spent 9 years as Projects Manager at Standards Australia. He worked on the current revisions of the AS/NZS 1170 series from inception through to publication in 2002. He represents the Australian Steel Institute on the Standards Committee, BD-006 and also on the sub-committee that is currently revising AS 1170.4 Earthquake actions.
ABSTRACT:
This paper provides an introduction to the use of the proposed AS 1170.4 Structural design actions Part 4: Earthquake actions in Australia (as it was issued as DR 04303) and a comparison of the draft to the 1993 edition of the Standard.
It describes the background to the project, the relationship to AS/NZS 1170.0 and the BCA, the basic principles of design for earthquake, the design procedures in the Standard and gives examples of determining for typical sites the hazard level and the design effort required. The list of changes given in the Preface to DR 04303 is attached as Annex A.
The key to understanding AS 1170.4 is that the performance of our building stock needs to take into account the unpredictable nature of earthquake activity in our low seismic environment. This approach arrises from the small knowledge we have of earthquake risk in Australia coupled with the very low levels of earthquake risk we do currently expect (see objectives below under Basic requirements of AS 1170.4-200X). Therefore, the detailing requirements of the Standard are intended to provide some measure of resistance to earthquakes for all structures while the design levels for 1/500 annual probability of exceedance are nominal only, intended to cover the more sophisticated design needs of complex structures.
PaperNo.28

Background
This latest revision of the Earthquake loading Standard was begun in 1993 along with the other parts of the AS 11 70 series. The original aim was to have all parts of the series joint. This has been achieved with Parts 0, 1, 2 and 3:
AS/NZS 1170 Structural design actions
Part 0: General principles
Part 1: Permanent, imposed and other actions
Part 2: Wind actions
Part 3: Snow and ice actions
Originally to be a joint Part 4, the Earthquake actions Standard has been split into two parts: Part 4 Earthquake actions in Australia and Part 5 Earthquake actions in New Zealand. Part 4 has been issued to Public Comment as DR 04303 (closing 12 August 2004).
The new draft Standard follows the format set up for the other parts of the AS/NZS 1170 series in that it operates from an annual probability of exceedance provided through Part 0 and the Building Code of Australia (BCA). This format has already been put in place through Appendix D of AS/NZS 1170.0. That Appendix provides for the use of the annual probabilities of 1:500 and 1:800 that are specified in the BCA. These probabilities reflect similar loads to those given in the 1993 edition as it was originally published (i.e., the 1.0 and 1.25 importance factors).
The New Zealand Part (5) remains a full earthquake design Standard and should be used with the NZ materials design Standards when designing in high hazard regions such as near active plate boundaries.
Function of AS/NZS 1170.0
AS/NZS 1170.0 Structural design actions Part 0: General principles provides the link between the limit states actions imposed on the structure and the design of materials for resistance. As background it should be noted that the format embodied in the new Standards and set out most comprehensively in Appendix F of P{ art 0 and it's Commentary is founded on work done in the APEC TG 1 Informal network. This was a group of loading experts from across the APEC region that met to create a means of establishing inter-changeability between the loading codes of different nations. The motivation for this move is the GATT agreement and the reduction of technical barriers to trade.
The basic aim is to state the design event in terms of the annual probability of the action being exceeded. The load is then defined for any annual probability of exceedance so that the design event is independent of the technical definition of the loads. This can be clearly seen in the wind Standard where AS/NZS 1170.2 is simply the technical solution that gives the loads independently ofthe annual probability ofexceedance (design event) which is set elsewhere.
One of the fundamental principles of this approach is the removal of hidden factors through the provision of an umbrella document that defines the loading and resistance levels for design using the design event approach. This led to the development of Part 0.
This APEC work has been taken through to the ISO arena and will be embodied into the next generation of Standards from ISO TC98 Basis for design of structures.
AS/NZS 1170.0 is of relevance to AS 1170.4 as it provides the combinations and design events (via the BCA) for use with AS 1170.4. Another point of interest is the robustness requirement of 2.5% lateral resistance. This is under review and may be changed once AS 1170.4 has been finalised.
Page 28-1
There are restrictions placed on the content of the AS/NZS 1170 series due to their being called up in legislation. As a result, the Standards may no longer contain any open-ended statements and good practice advice. The Commentaries become of increasing importance as such information is relegated from the Standards to their Commentaries. The Standards may also not repeat any requirements that are incorporated into the regulations.
Basic requirements of AS 1170.4-200X
Objectives
The new draft incorporates the following three objectives:
Serviceability limit state: resist frequent earthquake shaking without loss of use.
Ultimate limit state: withstand severe earthquake shaking with a reasonable margin against structural collapse and failure of life threatening parts or parts that are critical to evacuation.
Ultimate limit state: withstand the most severe earthquake shaking with a small margin against collapse.
The first and third objectives are satisfied for Australia's relatively low seismicity by general detailing of the structure and design for the second. Serviceability is not considered for Australia except for post disaster structures, where continued use should be considered at the design event for normal structures. This is in fact a life safety issue as the recovery period immediately following a major earthquake is critical to the preservation of life.
It should be noted that the criteria and methods given for earthquake design are simplified and graded as Earthquake Design Categories I to III with the understanding that they are for use in Australia (where there is relatively low seismicity) and that normal structures are designed for an annual probability of exceedance of 11500. AS 1170.4 may be seen as an engineered solution defined with an understanding of the design required at Australia's hazard level.
Put simply, for the risk of earthquakes in Australia, it is expected that most structures will be subject to very low levels of acceleration, if any, during their predicted life. These structures need only support this low level to satisfy design for lateral loading at the 1/500 event. For the small risk that they may be subject to high seismic deformations (objective 3), structures need to avoid collapse. To improve the general ability of our building stock to achieve this third objective, ductility must be provided in order to have sufficient reserve capacity against collapse for the unexpectedly large demands on the structure.
Providing ductility
Structures will perform better in earthquakes of the size found in Australia provided they have some measure of ductility-ability to flex without collapse. The simplest means of achieving this is to provide load paths and tie all the parts of the structure together. Selection of structure configuration and material of construction also have a bearing on this.
Hazard
Australia experiences fairly frequent damaging earthquakes of around 5.5 magnitude. For example:
Newcastle 1989-5.6
Robertson 1961-5.6
Adelaide 1954-5.4
B und aberg 1 918---6.0
Page 28-2
Seismologists indicate that an earthquake of magnitude 6 is overdue for the south-east of Australia (including the Melbourne/Canberra/Sydney area). The expected maximum credible earthquake load for normal structures has been compared with the load expected from a magnitude 6 plus one standard deviation at 40 km from the site. A revision of the mapped hazard values is being considered but may not be ready for publication in the Standard. Significant change to the values may require the issue of an amendment.
It should be noted that although the higher magnitude earthquakes may be characterised as having higher peak ground acceleration, these larger magnitude earthquakes also continue for a much longer period of time, say 30s or as much as 60 seconds. To design for these events would mean surviving many repetitions of gross cyclic motion where cumulative damage would have a critical influence on collapse avoidance. Such design is not required in Australia for most structures.
A new format has been adopted for defining the hazard level for a site (elastic site hazard spectrum) and it is used as the basis for determining the design effort required (see Table 2.1 ):
kpZCh(T1)
kp relates the hazard to the annual probability of exceedance,
Z is the mapped earthquake hazard factor (equivalent to 'a'-this has not changed for the 1993 maps, only the notation) and
Ch(T1) is the spectral shape factor for the fundamental natural period of the structure (T1)
related to the site sub-soil class (A, B, C, D or E).
Incorporated into the spectral shape factor is both the old site factor S and the adjustment for structure period that was part of the earthquake design coefficient. This more rationally combines in one factor the influence of the soil conditions and the effect of frequency of vibration. This hazard format reflects the acceleration at the ground surface for the most vulnerable frequency.
Structure configuration
The draft assumes that structures are irregular as the vast majority of structures in Australia fail to achieve regularity. The ductility (Mu) and structural performance factors (Sp) have been made more explicit than before (where a single factor represented both). Some configurations will be encouraged due to the lower Sp/Mu values and thus the reduced loads attracted.
Stiff elements should not impose themselves on the behaviour of the seismic force resisting system. If they do the structure will not exhibit the ductility required of it and will therefore attract a much higher load than it is designed for.
Drift
A limit of 1.5% is put on inter-storey drift to restrict ductility demand at joints and reduce eccentricity of vertical loads on columns.
Pounding
Pounding is to be avoided at the ultimate limit state. A deemed-to-satisfy clearance of 1% of the building height is given.
Existing structures
The draft no longer includes any requirements for existing structures. This will be dealt with in the Commentary as the BCA only covers new buildings.
Page 28-3
Related earthquake phenomena-gross ground movements
Gross settlement, slides, subsidence, liquefaction and faulting near a structure are not covered by the draft. On sub-soil class E, design should include consideration of subsidence or differential settlement.
Structures not covered
Tanks, dams, offshore structures, soil-retaining, bridges and structures with period greater than 5 seconds are not covered.
Basic approach to design
AS 1170.4 is based on the same fundamental earthquake design methods used in many other national Standards. Earthquakes produce waves in the earths crust. These are amplified by the soil conditions at the site of the structure depending on the sub-soil class. The situation is complicated by the different transmission by different ground types of different frequencies of vibration and by the natural resonances ofthe structure.
The structure type and configuration also has a large bearing on the collapse resistance of the structure. These are quantified in the structural ductility and the structural performance factors. The latter is an adjustment factor that relates the known ductility of a structure to the performance of structures in real earthquakes. There is still debate on the values of the performance factors that should be assigned to the various structure types.
The final piece of information to be determined is the fundamental natural period of vibration of the structure. It reflects the dynamic properties of the structure and is critical to the loads expected to be taken up in the structure from the ground vibration.
Once the horizontal design action is calculated from the above information and the seismic weight of the structure, the structure is analysed according to the method required for the hazard level (kpZ). The materials design Standards are then used to design the members for the required resistance (including achieving the ductility required). Finally, the parts of the structure must be tied together and individually designed to perform. Inter-storey drifts should be checked to ensure that parts such as stiff walls do not interfere with the seismic force resisting system.
The analysis and materials design is where AS 1170.4 differs most from NZS 1170.5. The Australian Standard provides for simplified analysis methods based on the low level of hazard. Also, as a result of the lower earthquake loads expected, the detailing required is minimal compared to that for New Zealand. Therefore, the materials design Standards are much simpler than those required for New Zealand.
Capacity design approach
The Part 5: Earthquake actions in New Zealand remains a full earthquake design Standard and should be used with the NZ materials design Standards. These materials Standards provide for the achievement of the ductility capacity and plastic design methods to enable structures and joints to support the ductility demands required under extreme actions expected in areas of high seismic activity.
The additional data required to use this method includes the ductility capacity of reinforcement.
Design data-Section by Section
Section I
Additional information and figures have been provided in Section 1 to help define the number of floors, the top seismic mass and the base of the building. For example:
Page 28-4

-
Building Height, h
//-'/~
/
Ston,yll ,..,
Building Height, h 1---------1
Base v// ~
Selection of procedure (Section 2)
j
-
Base
The design procedure required depends on the importance level of the structure, the earthquake hazard (kpZ), the site sub-soil classification and the height of the structure. One of three Earthquake Design Categories is selected using Table 2.1: EDCI, EDCII or EDCIII. The exceptions to these are housing which is covered by Appendix A and importance level 1 structures that do not require design for earthquake.
Hazard data (Section 3)
Section 3 includes the probability factor, kp (which links the Standard to Part 0 and the BCA) and the mapped hazard factor, Z, which is the peak ground acceleration for an annual probability of exceedance of 1/500. The probability factor differs slightly from the values given in Appendix D of Part 0.
Site sub-soil classes (Section 4)
The sub-soil class descriptions (A to E) have been aligned with those given for New Zealand. The associated spectra are given in Section 6 where they are first used in the static design method. In the 1993 edition the spectral shape was part of the equation for base shear (1.25Sf'fl·67
). The curves given reflect the considerable research over the past decade and give increased loads on low period structures but reduced loads on high period structures.
Page 28-5

TABLE 2.1
SELECTION OF EARTHQUAKE DESIGN CATEGORIES
Importance Mapped hazard (kpZ} level, type of for site sub-soil class
structure (see
I Foreword) E D c 8
I -
Domestic <0.12
housing as defined in
Appendix A ~0.12
2 :::;o.o5 :::;o.o8 :o:;O.ll
Importance Importance Importance level 2: >0.05 to level 2: >0.08 to level 2: >0.11 to
:::;o.o8 :::;0.12 :::;0.17
2 and 3 Importance Importance Importance level 3: :::;0.08 level 3: :::;0.12 level 3: :::;o. 17
>0.08 >0.12 >0.17
4 -
Design procedure (Section 5)
General requirements
Structure height, hn
A (m)
-
-
-
:::;12
:::;0.14 >12,<50
~50
Importance <50 level 2: >0.14 to
:::;0.21
Importance :2:50
level 3: :::;0 .21
<25 >0.21
~25
< 12
~12
Earthquake design category
Not required to be designed to this
Standard
Appendix A procedure
II
I
II
III
II
III
II
III
II
III
Besides the requirements defined in Section 2, Section 5 lists a number of basic design principles that apply to all earthquake designed structures (except houses covered in Appendix A):
• Seismic force resisting system-a seismic force resisting system must be provided to resist the effects of an earthquake. It must incorporate appropriate load paths.
• Parts and components-all parts and components require attention regardless of the EDC applied.
• Tying structure together-all parts of the structure need to be tied together to enable all masses in the structure to move with the earthquake in a controlled manner.
• Performance under earthquake deformations-stiff elements (eg. brick walls) must not interfere with the seismic force resisting systems capacity to respond to the earthquake.
• Load-bearing unreinforced masonry-a specific limit of no higher than 12m is given.
• Walls-these must be connected to floors and roofs and designed for in-plane and out-ofplane forces.
Page 28-6

• Diaphragms-deflections should be able to be supported by the elements connected to and supporting the diaphragm.
• Openings-are to be strengthened to resist local stresses.
EDCJ
Earthquake design category I is a simple lateral resistance of 2.5% of the seismic weight at each level. This is applied for all structures of 12m height or less on low hazard sites (except for housing and importance level 1 structures).
EDCJJ
Earthquake design category II requires a static analysis (dynamic can be used if desired). Section 6 sets out the method including the spectral shape factor, the structural ductility and performance factors, etc. This method differs from that in the 1993 edition mainly in the values of the spectral shape factor.
The base shear equation is
V = [kpZCh(T1)Spl,u]Wt
A new equation is provided for the first mode of vibration, T1• The 100% plus 30% rule for forces in two directions has been kept. Connections are required to support 5% of the vertical action arising from the seismic weight. Torsion effects are modelled by a 10% offset in the application of the earthquake forces.
There are some simplified rules for structures up to 15m.
EDCIII
Earthquake design category III requires a full design with dynamic analysis. This applies for the highest hazard levels and tallest structures.
Due to the increasing availability of analysis software, modal analysis is becoming the preferred method of analysis of earthquake actions on structures. It is no longer necessary to scale the results up to those for the static method.
Examples
As an illustration of the selection of design effort required, following are some examples of the design required for various site conditions. This may be compared with the Table attached at the end of the paper that sets out roughly the design effort required by the 1993 edition.
Importance Level 2 structures
For Sydney/Canberra/Melbourne (kpZ = 0.08):
On soil class A-EDCI for up to 12m, EDCII 12m to SOm, EDCIII above
On soil class B-EDCI for up to 12m, EDCII 12m to SOm, EDCIII above
On soil class C-EDCI for up to 12m, EDCII 12m to SOm, EDCIII above
On soil class D-EDCII for up to 25m, EDCIII above
For Adelaide/Maitland/Wyong/North-West coast Aust (kpZ= 0.10):
On soil class A-EDCI for up to 12m, EDCII 12m to SOm, EDCIII above
On soil class B-EDCI for up to 12m, EDCII 12m to SOm, EDCIII above
On soil class C-EDCII for up to SOm, EDCIII above
Page 28-7

On soil class D-EDCII for up to 25m, EDCIII above
Importance Level 3 structures
For Sydney/Canberra/Melbourne (kpZ= 0.104):
On soil class A-EDCI for up to 12m, EDCII 12m to 50m, EDCIII above
On soil class B-EDCI for up to 12m, EDCII 12m to 50m, EDCIII above
On soil class C-EDCI for up to 12m, EDCII 12m to 50m, EDCIII above
On soil class D-EDCII for up to 25m, EDCIII above
For Adelaide/Maitland/Wyong/North-West coast Aust (kpZ= 0.13):
On soil class A-EDCII for up to 50m, EDCIII above
On soil class B-EDCII for up to 50m, EDCIII above
On soil class C-EDCII for up to 25m, EDCIII above
On soil class D-EDCII for up to 25m, EDCIII above
Selection of configuration, design of materials
Once a design analysis is required, the structural configuration must be selected with resulting Sp/Mu values. As the Sp/Mu value reduces, the structure will absorb increasing energy and therefore is designed for Jess direct load and more plastic capacity. For the lowest values, dynamic analysis should be used and sophisticated methods are employed to establish the plastic capacity and ductility available at joints and designated hinges. For the highest values (Sp/Mu = 1.0) the structure is designed to remain elastic under the full loads.
For moderately ductile structures such as shear walls, ordinary moment resisting frames, braced frames, and similar, there is no explicit design of plastic hinges. The ductility is achieved by applying the detailing provided in the materials design Standards currently in use.
It should be noted that there will be a need to revise AS 3600, AS 4100 and AS 3 700 as these refer directly to the Earthquake design categories in the 1993 edition.
Annex A: List of changes
The following list is a copy of the list in the Preface of DR04303. It includes the main changes from AS 1170.4-1993 at that time:
(a) Importance factors have been replaced with variable annual probability of exceedance, to enable design to be set by the use of a single performance parameter. Values of earthquake hazard are determined using the return period factor determined from the annual probability of exceedance (see AS/NZS 1170.0).
(b) Combinations of actions are now given in AS/NZS 1170.0.
(c) Clauses on domestic structures have been simplified and moved to an Appendix.
(d) Soil profile descriptors have been replaced with 5 new site sub-soil classes.
(e) Site factors and the effect of sub-soil conditions have been replaced with spectral shape factor in the form of response spectra that vary depending on the fundamental natural period ofthe structure.
Page 28-8
(f) The 5 earthquake design categories have been simplified to 3 new categories simply described as: 1-a minimum static check; 11-static analysis; and III-dynamic analysis.
(g) The option to allow no analysis or detailing for some structures has been removed (except for importance level 1 structures).
(h) All requirements for each of the earthquake design categories are collected together in a single clause (in Section 5) with reference to the Sections on static and dynamic analysis.
(i) The 50 m height limitation on ordinary moment resisting frames has been removed but dynamic analysis is required above 50 m.
(j) Due to new site sub-soil spectra, adjustments were needed to simple design rules throughout the Standard. The basic static and dynamic methods have not changed in this respect.
(k) The equation for base shear has been aligned with international methods.
(I) Structural response factor has been replaced by the combination of structural performance factor and structural ductility factor (1/Rr to Sp/}1) and values modified for some structure types.
(m) A new method has been introduced for the calculation of the fundamental natural period of the structure.
(n) The Clause on torsion effects has been simplified.
(o) The Clause on stability effects has been removed.
(p) The requirement to design some structures for vertical components of earthquake action has been removed.
( q) Scaling of results has been removed from the dynamic analysis.
(r) The Section on structural alterations has been removed.
(s) The clauses on parts and components have been simplified.
(t) The informative Appendices have been removed.
Page 28-9

AS 1170.4- . --- . ···- . -·- -- .. - --· ·· ·- ---·w~· -· ·-v_-··-- -··- -··-· .. ·--.- .. -- --·· ~ :J ···- ·--- --· .. ·-·· · • ., __ ,.,_.., .................... ""''"'"""" ._. - ·· - • ···-·- , --··--··- .... - ·--
Importance Site hazard (a) ..... by site sub soil type (S) Earthquake Desig
level or type Ductility of Regularity Restrictions on un-
0.67 1 1.25 1.5 2 design Design effort required n of the structure of structure reinforced masonry
of structure (A or B) (B or C) (C) (D) (E) category Parts
Ductile no design or detailing of
Yes I (normal up to a<O.l /S. .. -<.(U <0.08 <0.067 <0.05 DCA structure
4 stories) < 0.15 Non-ductile .. detail Clause 4.3 only Yes none
Regular no design or detailing of
Yes I
<::0.15, <::0.1, 20.08. <::0.067. 20.05 Ductile structure Regular 5 stories or more,
<0.3 <0.2 <0.16 <0.13 <0.1 use reinforced, etc DCB Irregular do static, detail to Cl 4.3 Yes
Regular do static, detail to Cl 4.3 Yes Irregular 4 stories or more,
II use reinforced , etc < 0.15 <.(U <0.08 <0.067 <0.05 Non-ductile (not I or Ill) Irregular do static, detail to Cl4.3 Yes
J <::0.3 <::0.2 <::0.16 20.13 20.1
II <::0.15 , 20.1, ?.0.08, ;::o.o67, ?.0.05,
DCC do static , detail to Clause
Yes 4 stories or more, use
<0.1 -- ..
reinforced, etc <0.3 <0.2 <0. 16 <0 . 13 4.4
Ill < 0. 15 <0.1 <0.08 <0.067 <0 .05
do static , + vertical for
II 20.3 20 .2 20.16 20.13 20 .1 Regular critical members, detail Yes
DCD to Cl 4.4 3 stories or more, use -- reinforced, etc
III <::0.15, 20.1, ?.0.08, ?.0.067, ?.0.05,
Irregular do dynamic, +vertical
Yes <0.3 <0.2 <O.lli <0.13 <0.1 critical mbrs, det Cl 4.4
DCE, Regular do static , + vertical for
Yes III (post critical mbrs, det Cl 4.4
20.3 20.2 20.16 20.13 20.1 height limits -- None allowed disaster) do dynamic, +vertical
apply Irregular critical mbrs, det Cl 4.4
Yes ---- -- -
Clause 4.3 requires connections for seismic-force-resisting members of 5% of the member's gravity load acting along the member; and wall anchorage of for DCB-1 , per metre run of wall, DCA-5aS bu~O.BkN/m; walls to resist bending between connections spaced further than 1.2m.
Clause 4.4 requires 4.3 + portions tied with 0.33aSW but '?.5%W; diaphragms; bearing walls; openings; footing ties.
ANOMALOUS TECTONISM IN SOUTHEAST SOUTH AUSTRALIA
DAVID LOVE, GARY GIBSON AND KEVIN MCCUE
POSTER
AUTHORS:
David Love is senior seismologist with PIRSA, and has been managing the network in SA since 1986.
Gwy Gibson established the Seismology Research Centre in 1976 and is an Honorary Research Associate
at Monash University. His interests lie in observational seismology and its practical applications.
Kevin McCue Kevin is Director of the Australian Seismological Centre, a small Canberra-based
engineering seismology consulting firm, and Adjunct Professor at CQU. He was co-founder of AEES
with Charles Bubb and David Rossiter and has been on the committee as secretary, national delegate to
IAEE and Newsletter editor since its inception.
ABSTRACT:
The Southeast of South Australia lies at the western and youngest end of a chain of volcanoes that
stretches from Melbourne. Mounts Gambier and Schank erupted less than about 5000 years ago, well
within the time of occupation of aborigines whose artefacts have been discovered under ash deposits.
The region was strongly shaken by a large magnitude 6.5 (approx) earthquake on 10 May 1897 which did
considerable damage and caused remarkable ground deformation including sand volcanoes typical of
liquefaction. These effects are consistent with a shallow depth.
The seismicity of the southeast does not appear to be an extension of that associated with the Adelaide
Geosyncline in central South Australia.
Since digital triaxial recording, with millisecond-accurate timing, began operating in the southeast about 5
years ago a number of small earthquakes have been assigned a focal depth near the base of the crust or
upper mantle at a depth of about 35 km. Normal earthquakes with a shallow foci in the upper crust were
also observed. The seismograph distribution is not optimal with a large gap in azimuth because of the
Southern Ocean to the west and south.
We have tried forcing the foci to shallow depths in the interactive computer program but the match
between computed and observed arrival times becomes unacceptable, the program when unrestrained and
with a range of crustal models , always pushing the events back down to the Moho where the time
residuals is least. Clock adjustments of up to 2 seconds on the closest station would need to be made to
satisfy a shallow focal depth.
We speculate that there is a correlation between the volcanoes, large earthquake and the deep
earthquakes, that they are effects of the same underlying tectonic stress in the lower crust. We
recommend that a major long-lasting research effort including 3-D tomography, be focussed on the area
to image the deep crust and upper mantle structure and to search for any magma inclusions that could
contribute to the next volcanic eruption.
Figures
1 Seismicity of Australia
2 Seismicity of South Australia and Victoria
3 Epicentres in the southeast distinguishing shallow and deep events.
4 E-W cross section through the seismicity, 145 to 138E at 37 ±IS.
PaperNo. 29

DETAILED RECORDING OF SWARM ACTIVITY: YEELANNA, EYRE PENINSULA, SOUTH AUSTRALIA
DAVID LOVE PRIMARY INDUSTRIES AND RESOURCES, SOUTH AUSTRALIA
AUTHOR
David Love received a Bachelor of Science with Honours in Geophysics at Adelaide University in 1976. He began work at the SA Department of Mines in 1980, involved in exploration, particularly gravity surveys. In 1986 he was asked to manage the seismograph network for a short time. Since 1989 he has been involved in two earthquake loading code committees.
Email: Love.David@saugov .sa.gov.au
ABSTRACT
A swarm of events near Y eelanna on Eyre Peninsula, South Australia, has been recorded in
considerable detail. The events are shallow ( 2.8 ± 0.6 km ), with a maximum magnitude of3.3
and occur in a very small source area of less than 1 sq km. Many have been heard and felt by
locals in the surrounding few kilometres. They have occurred over the last 12 months.
Nakamura ratios, drop tests and multi-sensor recording were used during recording at Yeelanna
with varying degrees of success. The events indicate horizontal compression, and appear to have
quite similar focal mechanisms. A review of the complete catalogue of events for Eyre
Peninsula shows that the general area of this swarm, which has relatively flat topography, has a
history of similar swarms over the last 45 years. Much, if not most, of the activity in the
Y eelanna area occurs in swarms, not isolated events, but the location of each swarm appears to
be different. Evidence from intensity reports of previous swarms suggests that the swarms are
shallow.
PaperNo.30

1. MONITORING OF THE SWARM
The author first became aware of the swarm in late October 2003 following a phone call from Y eelanna. The person reported feeling and hearing a number of events over the previous month. Calls to neighbouring properties outlined the general area where the events were being felt and pointed to the probable source. In late November three seismographs were sent to the area, and installed in a rough triangle about 4 km apart (YEl, YE2, YE3 in figure 1). These immediately recorded several events. Two weeks later more instruments were sent, and a total of 6 recorders with 11 sensors were installed within 5 km of the epicentre (YE1,2,4,5,6,7). A third visit was made in January 2004, and YES was moved to YE8. In April all except one recorder (YE6) were removed. Visits are marked by A 1 etc in figure 2. The remaining recorder indicates that the activity is still continuing although at a lower rate. Since visit number 4 none of the events recorded on YE6 has been visible on any stations of the permanent network. Residents are no longer feeling events. A few events have been recorded at other locations (different S-P times) in the near vicinity. The author is not aware of this rate of activity ever being recorded on any station of the permanent network in South Australia.
- ., . '"";.._
- -- ...... _ ~
. • \ . ...... VE7
·~.;- 4,A. 1IJTBY . ;- • "~' •• .., . -A e ~ .. - .'it,
"· I
- 0 ' I -YE3 J
..1 ' I
....
FIGURE 1 Yeelanna showing sensor sites (triangles) and best epicentres (dots).
4 4 • YEU!
3 • YE6 3 >. .,
Gl -number >M 0 smoothed 'tl 'tl • -number >M1 smoothed ... .a 2
f Gl • Q. 'i: • 2 ... C) 1 • • • • • Gl ., ..1:1
:::!: • E 0 :I
z -1 0
"" .... .... "' "' "' "' "' .... '7 ~ ~ ~
~ ~
~ :;; :h 0 ~ N ~ "' ;:;; '7 '7 ~
.,. ~ ~ ~ "' "' ....
0 0 0 0 0 0 0 0 0 0 0 A1 AZil A~ 0 0 A4~ 0 0
"' "' "' "' "' "'
FIGURE 2 Event magnitude, smoothed activity rate and visits
Page 30-1

2. INSTRUMENTATION AND METHODS
Installed sensors were a mixture of seismometers and accelerometers, mostly 3 axis. Recorders were run in triggered mode, at 100 to 400 samples per second with GPS timing. Accelerometers YEl and YE4 recorded the fewest earthquakes. Sites YEl and YE6 were on hard rock, others were on soil, with YE4 interpreted to be on very shallow soil.
2.1 CALCULATING HYPOCENTRES
Locations ofthe 12 most accurate solutions are shown in figure 1. These solutions were all from the period between visits 2 and 3 which had the largest number of working recorders. The locations occupy a very small area, with depth estimates ranging between 2.5 to 3.0 km, depending on the velocity model used. The velocity model was a single layer with Vp of s.gkmfs and Vs of 3.35. Time residuals are usually less than 0.04 sees, and the variation of residuals was rarely more than 0.01 sec from the mean for a given station and'wave. The location program being used, Eqlocl, only presents output to two decimal places which is clearly inadequate for these situations. The locations suggest a lineation of about 600m in a NW - SE direction, with a shallowing to the NE, however this should only be considered tentative, as the uncertainties in the location process as calculated by Eqlocl are about 350m horizontally and 600m vertically. Horizontal accuracy and the ability to calculate Vp and V s were compromised by having all recorders close to the epicentres. A better layout would have used extra recorders at greater distances. The addition or removal of arrivals from any one site ( eg removing YE3 during visit 2, moving YES to YEg during visit 3) had a significant systematic effect on the calculated locations. It is clear that more recorders (at least g well placed and working) are required. Double difference or joint hypocentre determinations may improve results from this survey.
2.2 MULTIPLE SENSORS - SMALL ARRAY RECORDING AND ANALYSIS
YE3 was one of the first sites installed. It was a 6 channel Kelunji, running at 400 samples per second, with a three axis L4C-3D seismometer at low gain, and three vertical SS-1 seismometers at high gain set up in an L shape array, with sides of 90m and 65m. The recorder was connected to the phone and regularly interrogated. From the varying arrival times it was estimated that the source was at an azimuth of 75° to goo. The best locations (figure l)were at goo to 90°. Distance was estimated from S-P, but the S arrivals were not similar, possibly due to unmatched sensors. These initial azimuths and distances improved planning for visit number 2.
0 .. ch 2 +38m
200m
& ch 6
.. ch 1 -Bm
ch 5 -2m &
ref .. ch 3 -4m
.. ch 4 -8m
FIGURE 3 Site YE7 array and bedrock depth
Page30-2
YE7 was an array of six vertical seismometers, three L4C (well matched) and three SS-1 (not matched), covering an area roughly 400 by 200m (figure 3). The area had a gentle slope with about 7 m variation in elevation across the array (10m contours in figure 1). Due to problems with cable breaks, only a small number of events were recorded with all six channels. It was hoped that variations in arrival times would indicate different
directions to each event but the

recorded P arrival times were not in the expected order. The channel nearest to the activity (2) had a considerable delay. The discrepancy in arrival times was assumed to be due to differing depth to bedrock. A large concrete block was dropped from about 3 m height at each seismometer site in an attempt to measure surface velocity. Unfortunately this was not very successful. Using a P wave velocity at surface of about 1500m/s and using channel 6 as a reference produces bedrock depth variations of 38m deeper for channel2 and 8m shallower for channel 3. Other channels did not vary much from expectations, becoming slightly deeper to the south and east. Channel 2 is closest to the bedrock outcrop at the nearby hill and GPS site, and so would be expected to have the thinnest soil cover. This is at odds with the conclusion that the bedrock beneath channel 2 is 38 metres deeper than that beneath the reference channel. The variation of bedrock, coupled with the unmatched sensors meant that useful azimuths and emergence angles could not be calculated.
An attempt was made to estimate difference in azimuth and emergence angle between events from variations in P arrival times. Without purpose-built software this has not yet been successful. It is possible to estimate P arrival time differentials (between separate events) to better than 1 sample (0.025 sec) in some cases. As the array is very close to the source, the azimuth and emergence are not equal across the array. In one case, a nodal plane has been very close to channel4. This makes it very difficult to pick P differentials reliably because the waveform changes.
20 -YE7-1 2.3 NAKAMURA RATIOS -YE7-2
15
10
5
0
0 0.5
--YE7-3
- •• -YE7-4
- .. · YE7-5
-YE7-6
1.5 2
Nakamura ratios were calculated for each channel of site YE7 using an L4C-3D seismometer, and these are shown in figure 4. It was hoped that there would be differing frequency peaks to indicate depth to bedrock, but the results were not easy to interpret. Channel 2 gave the greatest ratio and channel 3 the lowest. Channel 2 peak was a somewhat lower frequency than most of the others, but peaks were not clear.
Frequency (Hz)
FIGURE 4 Nakamura ratios for site YE7
2.4 JOINT FOCAL MECHANISM
First motion polarities at each station (Table 1) were consistent between events, indicating a consistent stress direction, with stress only partially relieved. The consistency also indicated that polarity results could be combined to produce a joint focal mechanism. As only 6 recorders were available, not all sites in Fig 1 were occupied at once. The focal mechanism (figure 5) which is of the upper hemisphere, was formed from the portable stations which were all within 5 km and had impulsive arrivals (big symbols), and a few permanent network stations, which were all distant and had emergent or doubtful arrivals (small symbols). This consistency of polarity
Site YEl YE2 YE3 YE4 YES YE6 YE7 YE8
u ? D 12 102 2 24 4 12 40 2 28 86 1 24 1
which has been noted in other cases (eg Moralana 1992 sequence, TABLE 1 Site polarity
Page30-3

I
, .. ,"
g/ YE1 1"1 •
I
}'EB YE4 e YE7 ,' . . .
YE:fa YES
• 0 i-
0 e-
• YE2
' 0 YE6
FIGURE 5 Joint focal mechanism
100 r-----------------r=====~ +S/PYE6
•SIP YES
•: 10 r-~-------------------------1
s~ . ••••
• • 0
LO "<t (") "<t ...... ...... ....... ....... I I I I
N ....... N (") ....... 0 0 0
I I I ...;. (") "<t "<t 0 0 0 0 0 0 0 0 N N N N
FIGURE 6 Sv/P amplitude ratios
Greenhalgh et al 1994) suggests that stations could have been moved to obtain polarities at other points. While this is essentially true, the variation of station layout would have upset accurate hypocentre location.
The mechanism is clearly due to horizontal compression, but the nodal planes are poorly constrained. One possible solution is shown, but others are possible. These nodal planes have a similar strike to the topography and geology (a NNE striking fault is implied along the west side of the hill) and as indicated by gravity and magnetic surveys.
To investigate the stability of the focal mechanism over time, amplitude ratios (Sv/P) have been measured for events at sites YE6 and YE8 (figure 6). There is a general pattern, with YE8 beginning at less than one and increasing over time, and YE6 being nearly always greater than 1 and possibly decreasing with time. There is also a considerable degree of scatter.
2.5 VELOCITY SPECTRA
Instruments were operated at varying rates from 100 to 400 samples per second. YE6 (on rock) ran at 250 samples per second with a 50Hz anti-alias filter. The YE7 array (on soil) ran at 400 samples with a 125 Hz filter. Figure 7 shows the velocity spectra from vertical channels at these 2 sites. The sample rate is inadequate to define the high frequency roll-off in YE6. This and the very small residuals of the locations demonstrate that sample rates of at least 400 and preferably higher should be used for recording at close proximity, particularly on rock.
"C cu -IV ._ :e iii u -0 c:
100000
1000
100
10
Page 30-4
1
-Ch1
-Ch3
-Ch4
-Ch5
-Ch6
10 100 1000
Frequency (Hz)
FIGURE 7 Velocity spectra

3. REVIEW OF PAST ACTIVITY ON EYRE PENINSULA
3.1 DATA BASE REVIEW
Malpas (1993) lists only a few events in this area before 1959. Post 1959 there are a significant number of events in the region. Review of these events showed that the locations recorded in the data-base did not accord with all information. Prior to 1988 it was normal practice to list the name of any place that felt the event. There are 3 events within one month (August 1960) with place name Ungarra, however the coordinates listed are spread across more than 1 OOlan. It is presumed that this is the result of a one station (3 axis) location from station ADE at Adelaide. A review of the data-base revealed a number of events that may have been members of swarms. A cursory editing process was carried out, moving some swarms to a single position.
3.2 STYLE OF SEISMICITY
Epicentres on the peninsula were briefly classified according to the following scheme: Where there was a clear mainshock, with aftershocks (and some foreshocks ), these were labelled as foreshock, mainshock and aftershock. A group of events were labelled as a swarm if they occurred over a limited time span, close to one another (within the expected accuracy of location) and with less than about half a magnitude unit between the three largest events of the group. There were a number of occasions where there were two events of similar magnitude. These were each called members of a pair. Some events were also labelled as uncertain pairs. These could be indicators of other swarms.
No Events Name Date
I 3 Ungarra 1960 2 9 Cockaleechie 1973 3 4 Edillillie 1979 4 15 Brooker 1982 5 9 W ofBrooker 1983 6 5 Arno Bay 1986 7 3 Cockaleechie 1987 8 12 Arno Bay 1989 9 6 Wharminda 1991 10 7 Kielpa 1991 11 24 Spencer Gulf 2001 12 Yeelanna 2003
TABLE 2 Identified swarms
Ml-M3 0.1 0.4 0.3 0.2 0.3 0.6 0.3 0.3 0.6 0.3 0.3
Mmax
4.4 2.9 2.5 3.4 2.6 2.1 2.5 2.6 2.8 2.1 3.1 3.3
3.3 RESULTS OF RELOCATION AND CLASSIFICATION
Table 2 lists 12 swarms that were identified. Following the relocation of swarm points the seismicity on Eyre Peninsula (figure 8) had a much clearer pattern. The bulk of the activity occurred in the hilly area in the north-east of the peninsula. Another cluster of activity occurred in the south-central part of the peninsula. There were a few other centres of activity. There was a smaller amount of residual activity elsewhere across the peninsula.
The cluster in the south-central part of the peninsula was predominantly associated with swarm activity. While it is close to a hilly area, it is considered that most of the activity is in flat or gently undulating areas. Felt report forms were examined in detail, and a few forms listed many events being felt. It was assumed that these reports were close to the source of the swarm. In one case, however, a site about 20kms away was clearly experiencing amplification and feeling even small tremors. Considering all information it appears that the swarms in the south-central area occurred at various scattered places in a zone about 20 km NS by 10 km EW. All except one swarm on the peninsula appear to be in flat or gently undulating areas, including the long term one in Spencer Gulf. Most of the mainshock sequences occurred in the hilly area of the peninsula.
Page 30-5

~ .. 20 0 20 40 Ki.lometers ~
• X
II
X
A. Seismograph Event type
isolated aftershock foreshock
X mains hock .. D pair
• 0 swarm
. .
..
·~. 0
FIGURE 8 ACTIVITY ON EYRE PENINSULA AND IDENTIFIED SWARMS
4. CONCLUSIONS
Swarm activity has probably been occurring in a small area of south-central Eyre Peninsula since european settlement in 1840. This may be long term adjustments following an earlier large earthquake. Few events over magnitude 4 have occurred, resulting in little or no reporting until 1959. Many small events are not being recorded on the nearest permanent seismograph, indicating that sequences may be much longer than recognised in the catalogue, and may sometimes be missed entirely. The swarms are shallow and occur at various locations throughout the small area. The latest swarm clearly indicates horizontal compression, with repeated events of similar focal mechanism indicating that stress is only partially relieved. The dip and strike of nodal planes are poorly constrained. More detailed monitoring, by at least 8 instruments at 400 samples per second or better, will produce good quality results in similar swarms.
REFERENCES
Greenhalgh, S.A., D Love, K Malpas and R McDougall (1994) South Australian Earthquakes 1980-92, Australian Journal of Earth Sciences vol41, pp 483-495
Malpas, K (1993) South Australian earthquakes 1837 - 1964, Flinders University of South Australia, School of Earth Sciences, 5 volumes, unpublished.
Page 30-6
AUSTRALIAN EARTHQUAKE CLUSTERS
GARY GIBSON
POSTER
AUTHOR:
Gmy Gibson established the Seismology Research Centre in 1976 and is an Honorary Research Associate at Monash University. He is Honorary Secretary of the International Seismological Centre. His interests are in observational seismology and its practical applications.
ABSTRACT:
It has long been recognised that earthquakes cluster in time and space. Earthquake
clusters have traditionally been studied as foreshocks, main shocks and aftershocks. This has been complicated by earthquake swarms, when a long sequence of events
occurs without a significant main event.
Recent studies of earthquake clusters use the earthquake cycle. A long period of
quiescence may be followed by precursory events, then possibly foreshocks, the main
shock, usually aftershocks, and then possibly a long period of adjustment activity which
tapers off into the next quiescence period.
In Australia, the period of quiescence may last tens or hundreds of thousands of years as
stress builds. Precursory activity occurs months to years before the main event, but
considering the duration of the preceding quiescence period it is probably associated
with the onset of the failure process rather than simply an indication of high stress.
Foreshocks, if they occur, happen minutes to hours before the main shock, and probably
result in irreversible changes in the stress field that lead to the main shock. Most large
or shallow main shocks are followed by an intense sequence of aftershocks that rapidly
decay over a period of days to weeks, and are probably associated with additional
activity about the main rupture. These in turn may be followed by a slowly decaying
sequence of events that may last for tens of years or more, possibly associated with
changes in the stress field in the surrounding region.
Fifteen large earthquakes in and surrounding Australia have been examined for clustering activity. Many of these were either offshore, occurred well before
seismograph coverage was available, or both. Of the remaining events, almost all
showed every stage of the earthquake cycle, including precursory activity and adjustment activity.
A discussion on how to distinguish precursory activity from the small swarms that occur in Australia every year or so concentrates on the shallow depths .of most swarms.
PaperNo.Jl

MPDM, THE STORY OF A JUMP SITE
GARY GIBSON
POSTER
AUTHOR:
Gary Gibson established the Seismology Research Centre in 1976 and is an Honorary Research Associate at Monash University. He is Honorary Secretary of the International Seismological Centre. His interests are in observational seismology and its practical applications.
ABSTRACT:
Following the Newcastle earthq~ake in 1989, the Joint Urban Monitoring Project
(JUMP) was established. Its purpose was to install strong motion earthquake recorders
in all major urban areas.
It was decided to install two accelerographs in each city, one on bedrock and the other
on a typical soft surface sediment site. Initially it was planned that most recorders would
have only three-component accelerometer transducers, with some being six-channel
instruments with an additional three-component seismometer. The six-channel
instruments triggered more often than most accelerographs, and other instruments were
upgraded when funds could be found. Initially it was planned to install instruments
without communications, and to service them manually, but later many of the JUMP sites had telephone communications installed. It was planned that all ruMP sites would
have timing that would be correctable to high precision using either portable standard
clocks or short-wave time signals. As these methods became obsolete, most of the
ruMP sites were fitted with GPS timing systems, either to measure the clock drift or to
regularly correct it.
The Moonee Ponds accelerograph (MPDM) was installed on a thin layer of alluvium
sediment in the Maribyrnong Valley. The transducer is a three-component AC-3
accelerometer, and the recorder a Kelunji Classic with wide-dynamic range analogue-to
digital converter. Being a soft-sediment site, it is quite noisy, so it remained a three
component strong motion site. The recorder did not have a telephone connected, and has
been serviced manually. A permanent GPS was added a few years after initial
installation for regular time checks.
The recorder has triggered on more than twenty earthquakes over the past 12 years,
including small local events of magnitude 1.5, magnitude 4 to 5 events in central
Victoria, to several of the largest teleseisms on the Australian plate boundary.
Paper No. 32

SITE RESPONSE IN THE BOTANY AREA, SYDNEY, USING MICROTREMOR ARRAY METHODS AND EQUIVALENT LINEAR SITE
RESPONSE MODELLING
Michael W. Asten (CEGAS, Monash University) and Trevor Dhu (Geoscience Australia)
AUTHORS:
Michael Asten is a part-time Professorial Fellow at Monash University and founding member of the Centre for Environmental and Geotechnical Applications of Surface Waves (CEGAS). He is also a consulting geophysicist and Partner with Flagstaff Geo-Consultants, Melbourne. He is collaborating with Geoscience Australia, University of Melbourne, the US Geological Survey, Nanyang University Singapore, and the University of Hong Kong in the development of passive seismic methods for geotechnical and site classification tasks. He received the Australian Society of Exploration Geophysicists Laric Hawkins Award 2004, for "the most innovative use of a geophysical technique" for a paper reviewing the status of passive seismic microtremor techniques. e-mail: [email protected]
Trevor Dhu is a geophysicist with the Geohazards Division of Geoscience Australia His research is focused on national scale earthquake risk maps as well as developing site response and strong motion models for Australia. He is also interested in the use of microtremor data for the delineation of regolith site classes in regions with limited geotechnical and geological data. e-mail: [email protected] .au
ABSTRACT:
Shear-wave velocity profiles (SWVPs) for soil and sand cover have been acquired for five sites in the Botany Bay area, Sydney, using microtremor array observations together with spatial autocorrelation (SPAC) processing methods. Single-site horizontaVvertical particle motion spectral ratios (HVSR) at the sites show a range of natural-resonance peak frequencies from 7 to 1.3 Hz and SWVPs developed by inversion of the SP AC coherency spectra indicate three classes of unconsolidated Quaternary material in the upper 100 m, these being very soft (presumed) silts (Vs 90 to 130 m/s), sands (Vs 180 to 260 m/s), and (presumed in-situ) weathered sandstone/siltstone (Vs 40 to 720 m/s).
Three sites having similar HVSR frequency maxima in the range 1 to 2 Hz were selected for further study using equivalent linear site response modelling with a peak ground acceleration on rock basement of 0.2 g. Results demonstrate that amplitudes of observed HVSR spectra lack quantitative value for the assessment of site response. This is particularly the case in regions with more complex regolith such as soft silts overlying sands. This style of regolith requires quantitative site response modelling based on SWVPs from array microtremor data in order to identify ground resonances relevant to both single and multi-storey buildings.
Paper 33

1. INTRODUCTION
The Coalition of Australian Governments (CoAG) recently completed a review of natural disaster relief arrangements in Australia (CoAG, 2002). One key recommendation of the CoAG review is to 'develop and implement a five-year national program of systematic and rigorous disaster risk assessments'. In response to these recommendations, Geoscience Australia (GA) is currently undertaking a series ofnational scale multi-hazard risk assessments. One component of this work will be a national scale site-response model that will contribute to the calculation of earthquake risk across Australia. The scale of this work precludes extensive use of common but relatively expensive geotechnical tools such as seismic cone penetrometer tests (SCPTs). Hence, there will be an increasing reliance on rapid, cheap methods for obtaining geotechnical data such as microtremor techniques.
The Sydney area has a high population and infrastructure density making it particularly vulnerable to earthquake. However, this region has relatively little shear-wave velocity information available for site response modelling. This is a particularly important issue in the Botany Bay area with its cover of Quaternary sediments. The Botany study area lies within the northern Botany Basin, which comprises a sequence of Quaternary sediments from a variety of geological environments, including beach deposits, sand dunes, tidal deltas, mud flats and swamps (Jeffrey, 1985). In addition, man-made fills have been placed over portions of the study area. These unconsolidated deposits constitute the majority of the regolith in the region and are typically in the order of 30-35 m thick, 'but may be up to 70-80 m thick. The region also has one of the largest concentrations of major lifeline elements in Sydney, a high population density, and major chemical and petrochemical industries. This density of lifelines and population combined with the relatively thick regolith suggests that a moderate sized earthquake located near the Botany study area could have a severe impact. Consequently, it is imperative that the risk posed by earthquakes be clearly and accurately understood.
A previous microtremor array study at five sites in the Perth area (Asten, 2003; Asten et al, 2003) demonstrated that microtremor arrays are capable of providing shear-wave velocity profiles consistent with those from SCPT tests, and with the additional advantage of having minimal environmental impact, and capable of providing data to bedrock at depths in the order of 100 m. This experience supported the decision to acquire passive seismic microtremor array data at five sites and thus derive representative samples of shear-wave velocity profiles for the Botany regolith. Data from the centre geophone of each array was processed to yield a spectrum of horizontal to vertical particle motion (HVSR).
Three of the sites (Site 3, Site 4, Site 5) have similar HVSR maxima, but as shown in this paper they have quite different shear-wave velocity profiles (SWVP) with depth. Asten et al (2002) demonstrated that sites having the same HVSR maximum may have significantly different site response. This paper expands upon this work by comparing the modelled site response from MMSPAC derived SWVPs with the implied site response characteristics from HVSR data for three sites in Botany Bay. This comparison demonstrates the quantitative advantage of acquiring array microtremor data and interpreted SWVPs as opposed to only single-station HVSR data.
2. STUDY AREA AND HVSR SPECTRA
Figure 1 shows the study area and five sites where HVSR and array microtremor data were acquired. Table 1 summarises the observed HVSR peaks for all of these sites. Two sites (Booralee Park and Gamet Jackson Reserve) show "classical" HVSR plots having a clear single peak and a strong minimum; this combination is characteristic of sediments overlying a basement where the shear-velocity ratio of basement to sediments exceeds 2.5:1 (Stephenson, 2003; Asten, 2004a). A third site (Waterloo Park) may also reflect this style of regolith.
Page 33-1
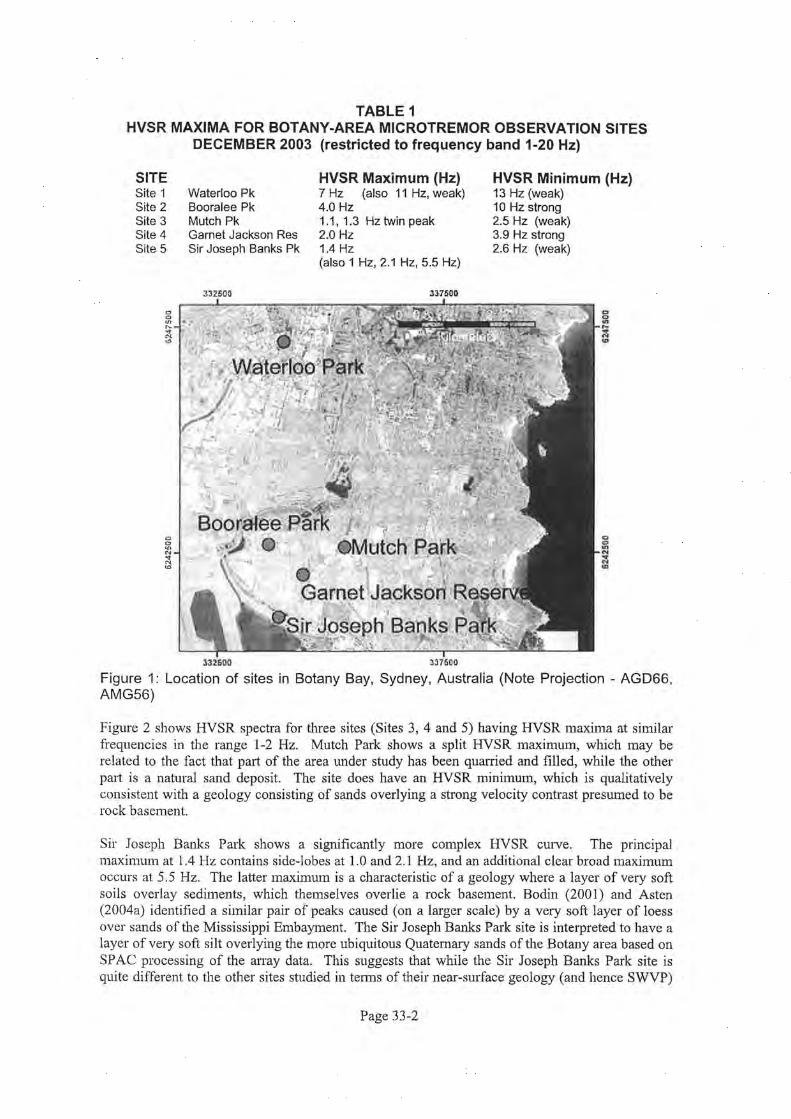
TABLE 1 HVSR MAXIMA FOR BOTANY-AREA MICROTREMOR OBSERVATION SITES
DECEMBER 2003 (restricted to frequency band 1-20 Hz)
SITE Site 1 Site 2 Site 3 Site 4 Site 5
Waterloo Pk Booralee Pk Mutch Pk Garnet Jackson Res Sir Joseph Banks Pk
33Z50G
HVSR Maximum (Hz) 7 Hz (also 11 Hz, weak) 4.0 Hz 1.1, 1.3 Hz twin peak 2.0 Hz 1.4 Hz (also 1 Hz, 2.1 Hz, 5.5 Hz)
337500
332600 3375Cll
HVSR Minimum (Hz) 13Hz (weak) 10Hz strong 2.5 Hz (weak) 3.9 Hz strong 2.6 Hz (weak)
Figure 1: Location of sites in Botany Bay, Sydney, Australia (Note Projection - AGD66, AMG56)
Figure 2 shows HVSR spectra for three sites (Sites 3, 4 and 5) having HVSR maxima at similar frequencies in the range 1-2 Hz. Mutch Park shows a split HVSR maximum, which may be related to the fact that part of the area under study has been quarried and filled, while the other part is a natural sand deposit. The site does have an HVSR minimum, which is qualitatively consistent with a geology consisting of sands overlying a strong velocity contrast presumed to be rock basement.
Sir Joseph Banks Park shows a significantly more complex HVSR curve. The principal maximum at 1.4 Hz contains side-lobes at 1.0 and 2.1 Hz, and an additional clear broad maximum occurs at 5.5 Hz. The latter maximum is a characteristic of a geology where a layer of very soft soils overlay sediments, which themselves overlie a rock basement. Bodin (2001) and Asten (2004a) identified a similar pair of peaks caused (on a larger scale) by a very soft layer of loess over sands of the Mississippi Embayment. The Sir Joseph Banks Park site is interpreted to have a layer of very soft silt overlying the more ubiquitous Quaternary sands of the Botany area based on SP AC processing of the alTay data. This suggests that while the Sir Joseph Banks Park site is quite different to the other sites studied in terms of their near-surface geology (and hence SWVP)
Page 33-2
it may be possible to map the areal extent of that difference qualitatively, by reviewing existing single-site HVSR data acquired by GA in the Botany area.
3. SHEAR-WAVE VELOCITY PROFILES FROM MICROTREMORS
We use the multimode spatially averaged coherency method (MMSPAC) based on the principle given by Aki (1957) as implemented by Asten et al (2003) and Asten et al (2004). Array data was acquired at each site with hexagonal, triangular and semi-circular arrays of radius 14 to 48 m. Geophones were three-component Mark L4C-3D instruments with a resonant frequency of 1 Hz. Three-component data and vertical-only data were recorded from the array centre and outlying stations respectively.
Table 2 shows the seismic parameters for each layered-earth model resulting from the fitting of observed and modelled coherency spectra for arrays at Sites 3, 4 and 5, reported in Asten (2004b).
4. RESULTS
Using the interpreted SWVP models from Table 2 we conducted equivalent-linear site response modelling using RASCALS software provided by Pacific Engineering and Analysis, El Cerrito, California. This software uses random vibration theory to relate Fourier amplitude spectra ( eg. Bnme Spectra) to response spectral accelerations (Boore, 2003). The high-strain properties of the regolith materials have been modelled using the depth dependant sand properties defined in EPRI (1993). Figure 3 shows site response spectra (i.e. frequency dependant amplification of response spectral accelerations) for the three models. It is important to recognize that the rock spectrum used here was derived using average central and eastern North American parameters with a PGA on rock of 0.2 g and a PGV of 8.2 cm/s. Moreover, the results are influenced by both the regolith and crustal models used and in particular the assumed velocity at the top of the crustal model.
These site-response spectra demonstrate that regolith thickness and shear wave velocity play a dominant role in the region's site response. In particular, there is a clear correlation between regolith thickness and the frequency at which peak amplifications occur. For example, the deepest site, Mutch Park has a maximum amplification of approximately 4.2 at a frequency of around 0.9 Hz. Garnet Jackson Reserve has thinner regolith and a peak amplification of 4 at a frequency of around 1.4 Hz. The frequency of peak amplification at these sites compares closely with both observed HVSR and theoretical ellipticity spectra shown in Figure 2b. The response spectrum for Sir Joseph Banks Park has a different character (as was also noted for the shape of the HVSR plot). The strongest site amplification of 3.8 occurs at frequency 1.1 Hz and is a resonance associated with the full regolith thickness above sandstone basement. A peak of similar amplitude centred on 6Hz appears to be associated with a resonance in the thin (4.8 m) surficial layer of slow silts.
These results imply that HVSR data do not provide enough information to realistically describe the site response in this region. Whilst the spectral ratio data does imply significant amplification at around 1 Hz for all of the sites, there is no clear indication of amplification at higher frequencies. This is a significant issue for damage and risk assessments, since the higher frequency amplifications tend to occur near frequencies associated with damage to low~ and medium-rise residential dwellings.
Page 33-3

~ATID: MP4BI~F1 : 17DEC2003
0, 1,___~~~......_._1-~~~~ ............ -~~~~~ 0 ,01 I 0.00 I 00.00
Points 1 0 40K Frequency (Hz) Eltlptic it C"' rve for Model File: much1 Q_jnv
,' ·. ·,~\ .. ; a· t \ l 1 ~
, :t \ ,i \ __ li \_\ .
, " \ i \
(b)
of 1.0-- ----....... \ : .
i \._\ J .. - -\~_1_,. ... -- .~--~. :~.-:::. :.::. i i y. l .. ~ · ·
/ '\1 \l \./ 0 .1 ,___~.......,_.~.;::-----""~-U.........-::10:--~~----'
Freg (Hz)
I RATIO: GJ4.8F2 : 18DEC2003
(c)
0~.0':-:-1~~~~1 ..... 00:--1--'-~~~~1"':'-0.00:-:--~~~~~
Frequency (Hz)
Freq (Hz}
RATIO: SJN40F15 : 1 BDEC2003
(d)
0. 1 ..__._~~ .......... -+~--'-......_,1 ......... --~~..._._~, 1.00 10.00
F quency (Hz)
100~~E~IIi~pl~io~il~~~~~~~~~~~
f\·i \ /\ (fj \\// \'Y - -~\---
~ l ~l \. } I , t
o., .__ _ __....._.,_..__~''""'J~-~_,_U,...\_f _ _ ,.:..., ..:..-J.,. 10
Fraq (Hz)
100.00
TABLE 2
FINAL VELOCITY MODELS FOR BOTANYAREA MICROTREMOR OBSERVATION
SITES DECEMBER 2003
Site 3: Mutch Park File Mutch 11.dat (full diameter of array) H VP VS RHO 2 500 210 1.8 4 1700 210 2.0 8 1700 270 2.0 15 1700 260 2.0 20 1700 260 2.0 40 1700 720 2.0
1000. 3880 1800. 4630
6040
2230 2.4 2680 2.4 3490 2.8
Vs resolution+- 5% Vs resolution +- 5% Vs resolution+- 5% Vs resolution +- 5% Vs resolution +- 5% Vs resolution poor; say+- 50%
Assumed params for a sandst 0. basement
Site 4: Garnet Jackson Reserve File GJR4.dat H VP VS 2 500 200 4 1700 200 8 1700 260 15 1700 280 4 1700 280 40. 1700 720
1000. 3880 2230 1800. 4630 2680 0. 6040 3490
RHO 1.8 2.0 2.0 2.0 2.0 2.0
2.4 2.4 2.8
Vs resolution +- 5% Vs resolution +- 5% Vs resolution +- 5% )Vs resolution +- 5% ) Layer required, but poorly resolved Assumed params for a sandst basement
Site 5: Sir Joseph Banks Park File SJBpk4a.dat H VP VS 2 500 98 2.8 1700 125 8 1700 400 16 1700 400 45 1700 400
40. 1000. 1800. 0.
3880 3880 4630 6040
2230 2230 2680 3490
RHO 1.8 Vs resolution <+- 5% 2.0 Vs resolution <+- 5% 2.0 Vs resolution +- 5% 2.0 Vs resolution +- 5% 2.0 Vs range 400-550m/s. Thickness range 40-62 m. 2.4 2.4 2.4 2.8
Assumed params for an a sandst basement
AT LEFT: Figure 2. HVSR plots for observed three-component microtremor data from Sites 3, 4 and 5, together with ellipticity ratios for fundamental and 1st higher Rayleigh modes computed for 1-D earth models shown in Table 2. (a), (c), (e): HVSR for Sites 3, 4, 5. (b), (d), (f): Modelled ellipticity for Rayleigh modes RO (dashed line) and R1 (dotted line) for Site 3, 4. 5.
Page 33-4

§ 4 .5r---~~~--~~~~~--~~~--~~~~~==~~==========~~ ~ :.~····Site3-MulchP·ark · · ~ 4 ·..;._.;Site4-GarnetJacksonReserve ~ :_;Site 5- sirJoseph Banks Park u q 3.5 ro '-u 3 ll) Q.
(f) ll) 2.5 (/)
c g_ 2 (/) ll)
0:: 1.5 ....._ 0
c 0
·.p ro u
:-E 0.5 D.. E q
~ . 1
. .
10 Frequency (Hz)
1 0(
Fig.3. Site response, in terms of amplification of response spectral acceleration, for the three sites considered in this paper.
5. CONCLUSIONS
Significant benefits are gained from detai~ed site response modelling based on MMSP AC processing of microtremor array data when compared to single-site HVSR spectral ratio data. Whilst there are similarities between the observed spectral ratio data and modelled site response, there are disparities that could have a significant influence on estimates of damage and risk. This emphasises the need for more sophisticated MMSP AC analyses when trying to understand and model the site response of regolith. This is especially true in regions where little or no detailed geotechnical data is available.
6. REFERENCES
Aki, K. (1957) Space and time spectra of stationary stochastic waves, with special reference to microtremors. Bull, Earthq. Res. Inst, Vol 35, pp 415-456.
Asten, M.W., Lam, N., Gibson, G. and Wilson, J. (2002) Microtremor survey design optimised for application to site amplification and resonance modelling, in Total Risk Management in the Privatised Era, editted by M Griffith, D. Love, P McBean, A McDougall, B. Butler, Proceedings of Conference, Australian Earthquake Engineering Soc. , Adelaide, Paper 7.
Asten, M.W. (2003) Research into microtremor phase velocity techniques for earthquake hazard assessment- Velocity models, spectra, and comparison with SCPT data for the Perth (W.A.) northern suburbs. Report to Geoscience Australia. Monash University, August 2003.
Asten, M.W., Dhu, T., Jones, A., and Jones, T. (2003) Comparison of shear-velocities measured fi-om rnicrotremor array studies and SCPT data acquired for earthquake site hazard classification in the northern suburbs of Perth W.A., in "Earthquake Risk Mitigation", (Eds) J.L. Wilson, N.K. Lam, G. Gibson, B. Butler, Proceedings of a Conference of the Australian Earthquake Engineering Soc., Melbourne, Paper 12.
Asten, M.W. (2004a) Comment on "Microtremor observations of deep sediment resonance in metropolitan Memphis, Tennessee" by Paul Bodin, Kevin Smith, Steve Hm1on and Howard Hwang. Engineering Geology, v. 72 (3/4) 343-349.
Page 33-5

Asten, M.W. (2004b) Microtremor Array Survey of the Botany Bay Area, Sydney N.S.W. Report to Geoscience Australia. Monash University, August 2003.
Asten,M.W., Dhu, T., and Lam,N. (2004) Optimised array design for microtremor array studies applied to site classification; observations, results and future use: Paper 2903, Conference Proceedings of the 13th World Conference of Earthquake Engineering, Vancouver, Aug 1-6.
Bodin, P., Smith, K., Horton, S., and Hwang, H. (2001) Microtremor observations of deep sediment resonance in metropolitan Memphis, Tennessee. Engineering Geology 62, 159-168.
Boore D. (2003) Simulation of ground motion using the stochastic method. Pure and Applied Geophysics 160, 635-676.
CoAG (2002) Natural disasters in Australia: Reforming mitigation, relief and recovery arrangements. Commonwealth Department of Transport and Regional Services, Canberra, Australia.
Dhu, T., Robinson, D., Sinadinovski, C., Jones, T., Corby, N., Jones, A. and Schneider, J. (2002). Earthquake Hazard. In: Dhu, T. and Jones, T. (.eds). Earthquake risk in Newcastle and Lake Macquarie. Geoscience Australia, ACT, Australia.
EPRI (1993). Vol 2: Appendicies for ground motion estimation. In: Guidelines for determining design basis ground motions- EPRI TR-102293, Palo Alto, California, U.S.A.
Jeffrey, R.P. (1985) Botany Basin deposits. In: Pells, P.J.N (ed) Engineering Geology of the Sydney Region. Balkema, Rotterdam.
Stephenson, W. (2003) Factors bounding prograde Rayleigh-wave particle motion in a soft-soil layer. Proceedings of the 2003 Pacific Conference on Earthquake Engineering, Christchurch, February 2003, Paper 56, New Zealand Soc. ofEarthqu. Eng.
Page 33-6